synthesis and characterization of gas hydrate
TRANSCRIPT

SYNTHESIS AND
CHARACTERIZATION OF
GAS HYDRATE
Hailong Lu
Steacie Institute for Molecular Sciences
National Research Council Canada

A
Because gas hydrate is only stable at relatively high
pressure and low temperature and it will dissociate
into gas and water once it is located outside of its
stable regime, most of its properties can be studied
only by experiments.
A
• To synthesize gas hydrate to obtain hydrate sample
for studying its chemical or physical properties
• To synthesize gas hydrate for studying its
thermodynamic, or kinetic, or physical properties
• To synthesize gas hydrate for studying the formation
or dissociation mechanism of gas hydrate in sediments
• etc
Synthesis of gas hydrate

AStarting materials Method Purpose
Gas, solution Gas + solution → gas
hydrate
hydrate stability, nucleation,
reaction kinetics, gas
composition fractionation,
…
Gas, ice Gas + ice → gas hydrate hydrate sample, structure,
further studies of chemical
and physical properties, …
Gas, solution-saturated
porous media
Gas + porous media →
gas hydrate
Hydrate stability, reaction
kinetics, physical properties,
…
Gas + sediments → gas
hydrate
Hydrate stability, reaction
kinetics, hydrate saturation,
…

ATo synthesize gas hydrate for obtaining gas hydrate sample

A
A
A
2600 2800 3000 3200
10000
12000
14000
16000
18000
20000
22000
24000
26000
Raman shift (cm-1)
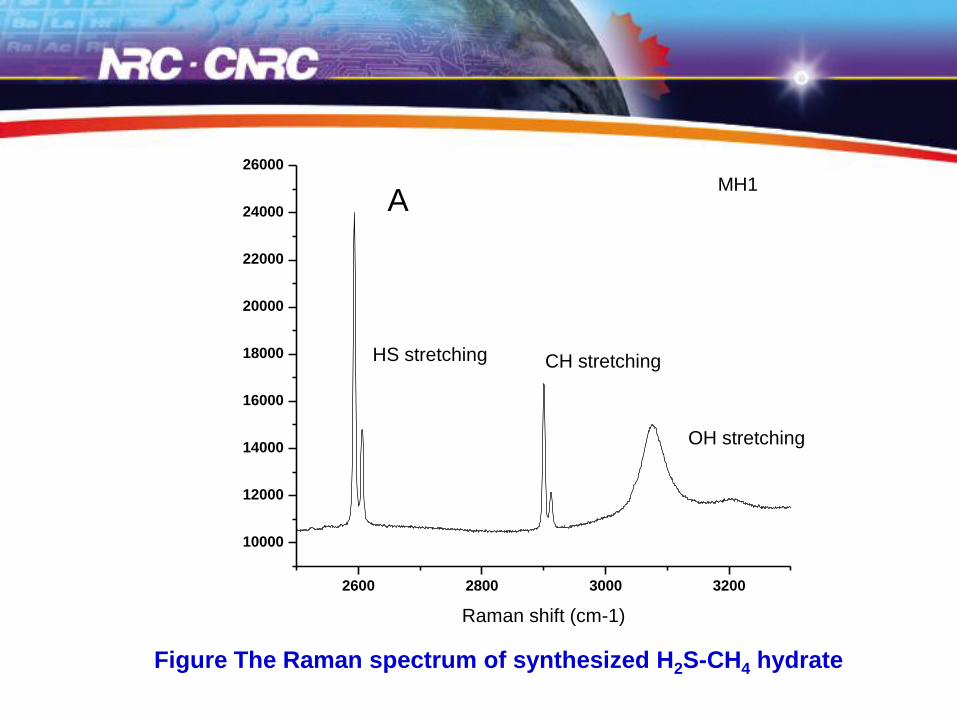
MH1
HS stretching CH stretching
OH stretching
Figure The Raman spectrum of synthesized H2S-CH4 hydrate

ATo synthesize gas hydrate for studying its chemical properties

A

Studies of gas hydrate inhibitor for natural gas transportation through pipeline
Planar growth of THF hydrate in the presence of 0.25 mM WfAFP (Zeng et al., 2003)
A
0.5 1 1.5 2 2.5 3 3.5 43.2
3.4
3.6
3.8
4
4.2
T (oC)
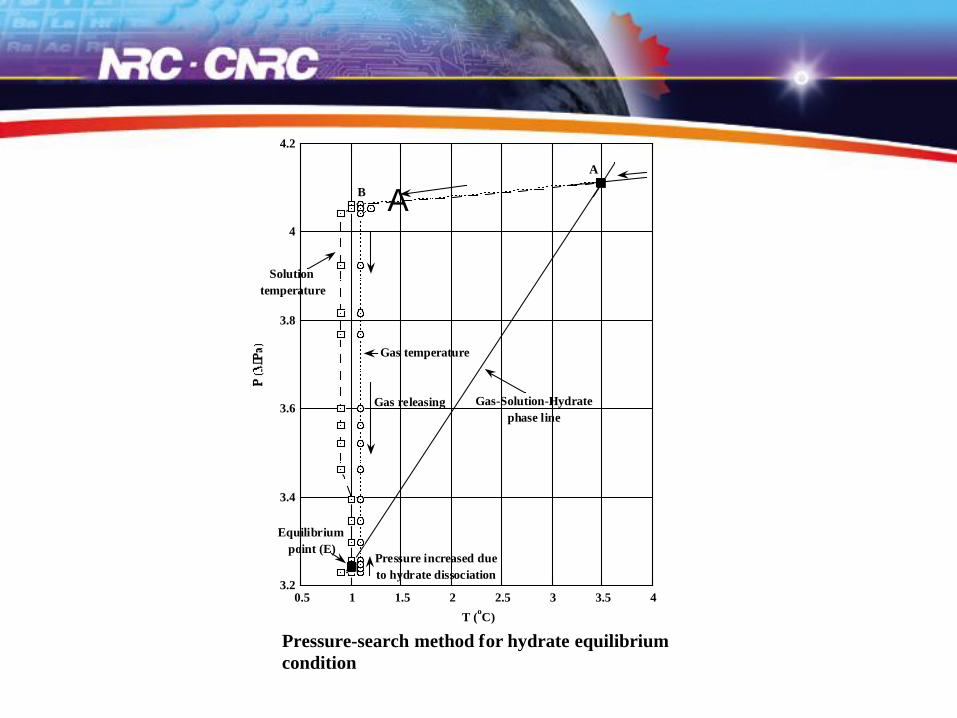
Solution
temperature
Gas temperature
Gas releasing
Pressure increased due
to hydrate dissociation
Equilibrium
point (E)
Gas-Solution-Hydrate
phase line
A
B
Pressure-search method for hydrate equilibrium
condition
A
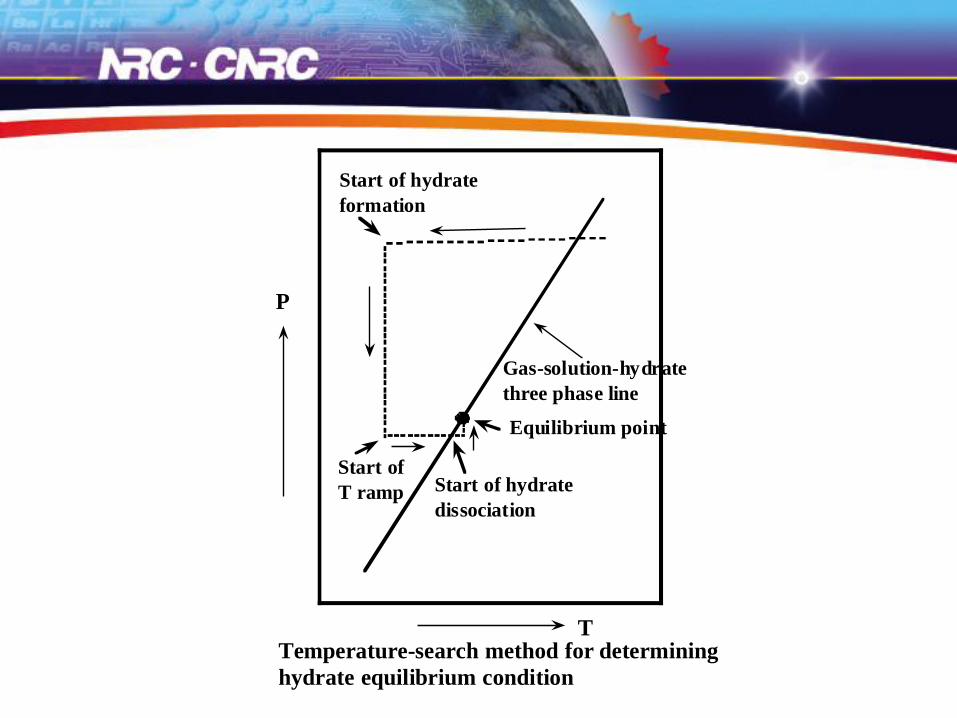
Gas-solution-hydrate
three phase line
P
T
Start of hydrate
formation
Start of
T ramp Start of hydrate
dissociation
Equilibrium point
Temperature-search method for determining
hydrate equilibrium condition

Lu and
Matsumoto
(2001)

Lu and
Matsumoto
(2005)
A

A

Lu and Matsumoto (2002)

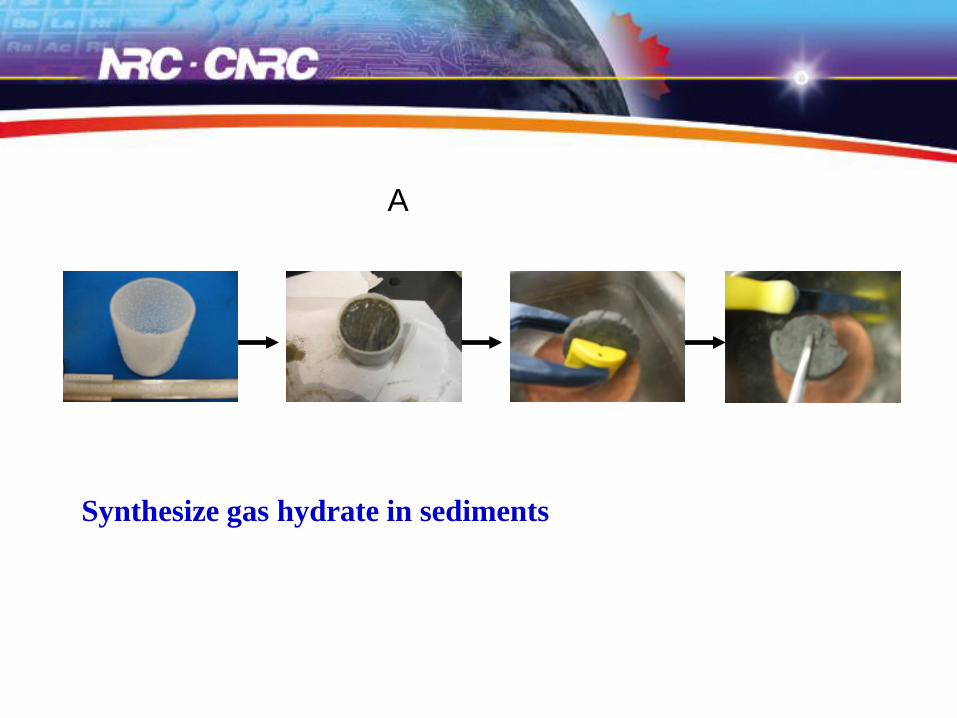
ATo synthesize gas hydrate for studying the formation
mechanism of gas hydrate in sediments
A
Synthesize gas hydrate in sediments
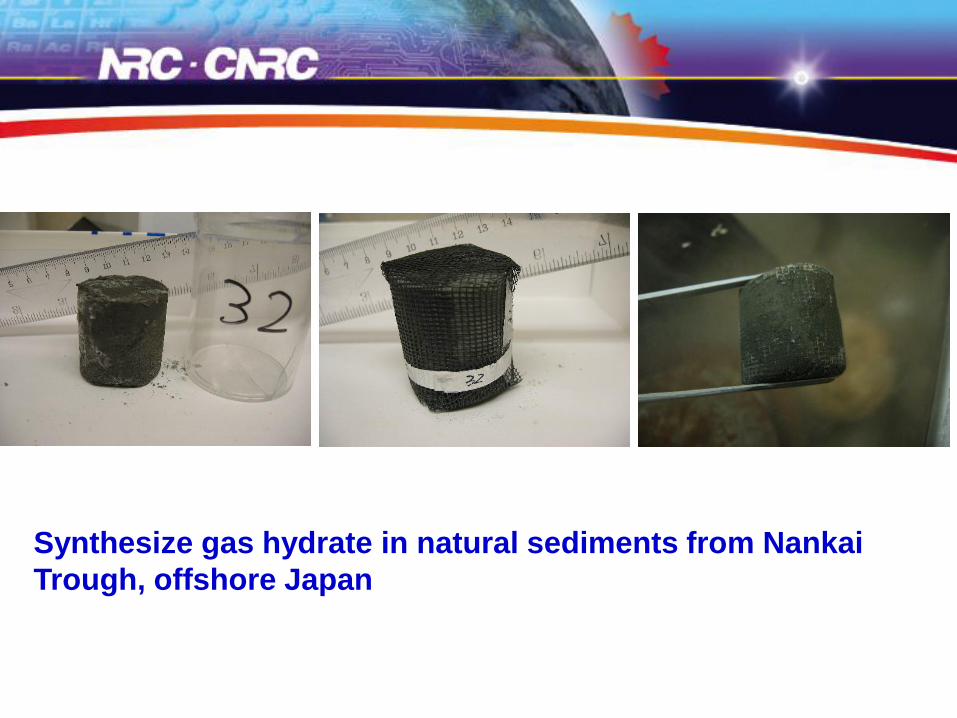
Synthesize gas hydrate in natural sediments from Nankai
Trough, offshore Japan

A
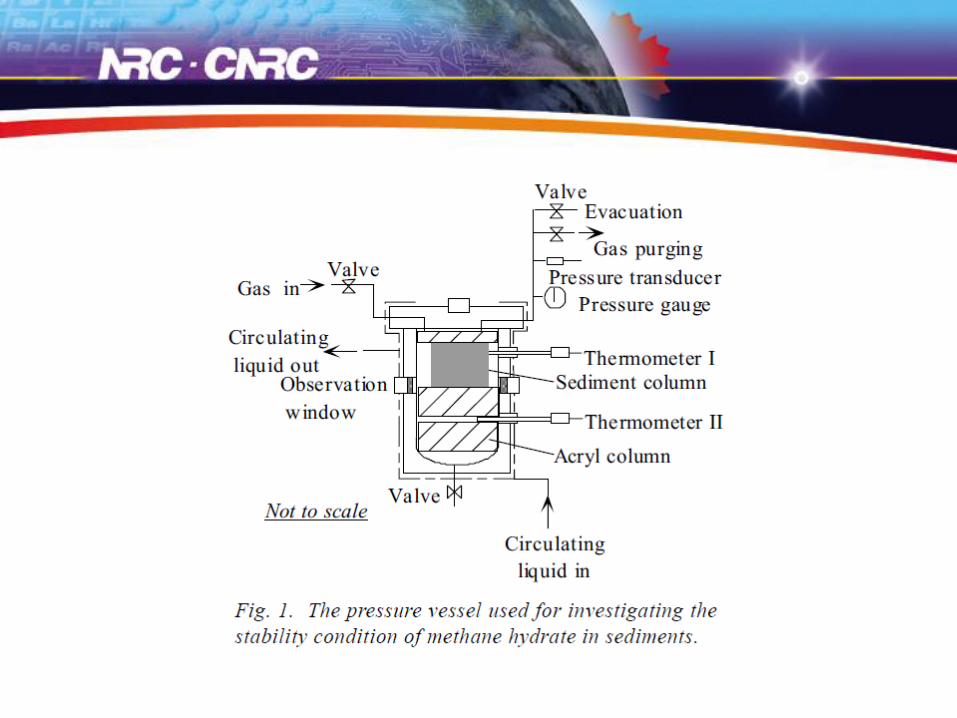
The sediment column prepared was set into a pressure cell
for hydrate synthesis

A
75
80
85
90
95
100
105
110
115
0 50 100 150 200 250 300 350
P (
ba
r)
Time (hours)
Figure 9. The pressure change during the process of methane reaction with Nankai
Trough sediments at 3 C.

A
Relationship between
the saturation level of
methane hydrate and
particle size in silica
sands with various
particle sizes

A

A

A
0
20
40
60
80
100
0 5 10 15
Radial distance from disc edge (mm)
#44
#42#32
Figure 10. The radial distribution of water conversion rate in the tested sediment core.

A
Figure 24 MRI cell allowing in situ observation of the reactions in two sample
holders simultaneously.
Not to scale
sample
holder
Pressure cell
Slice 1
Slice 2
Slice 3
Slice 4
Slice 5
A
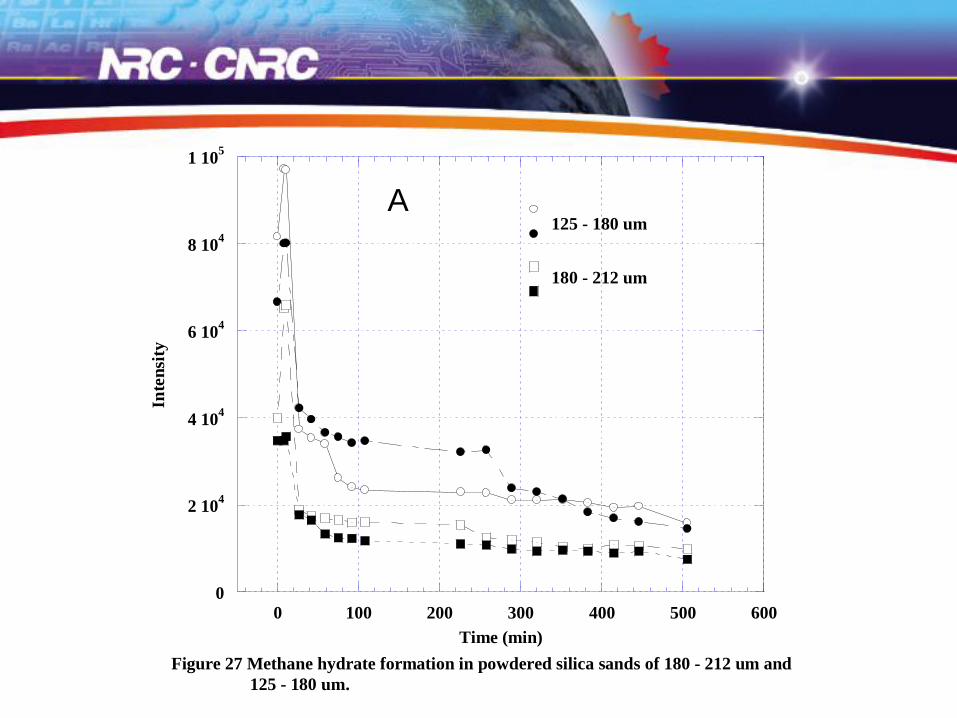
0
2 104
4 104
6 104
8 104
1 105
0 100 200 300 400 500 600
Inte
nsi
ty
Time (min)
Figure 27 Methane hydrate formation in powdered silica sands of 180 - 212 um and
125 - 180 um.
125 - 180 um
180 - 212 um
A
• Structure determination
• Gas composition determination
• Stability study
• Chemical and physical property study
• Determination of the saturation of gas
hydrate in sediments
• etc
Characterization of gas hydrate

A
Structure determination
Powder X-ray diffraction
Single-crystal X-ray diffraction

A

A
Hydrate sample to be ground with a mortar at LN2
temperature

A
Hydrate to be charged in a sample holder that is
mounted on a cold stage

A
A
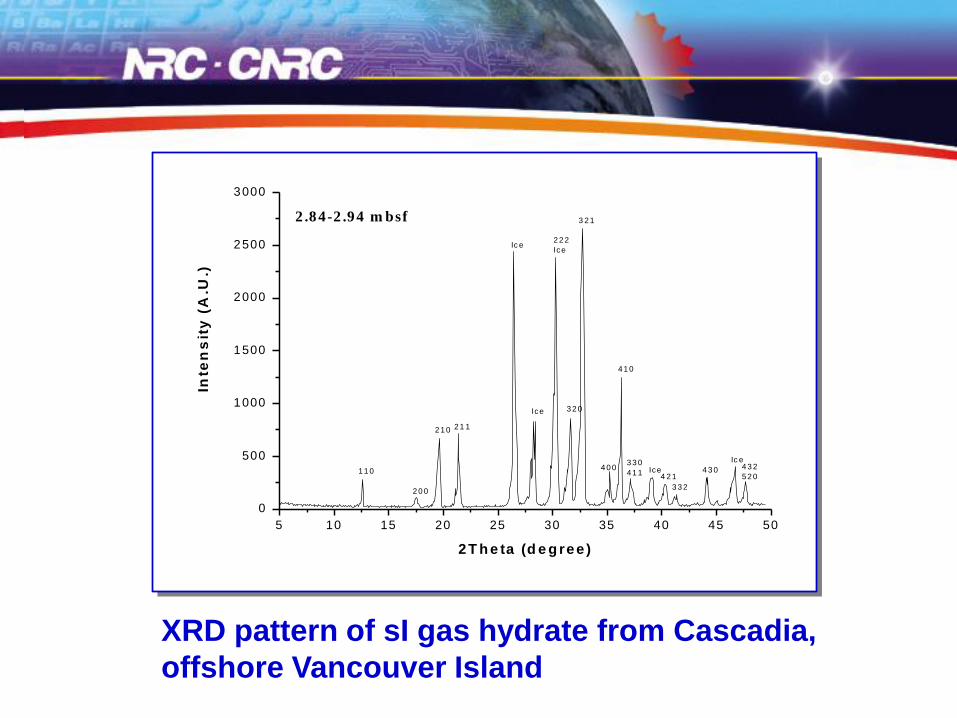
5 10 15 20 25 30 35 40 45 50
0
500
1000
1500
2000
2500
3000
2 .84-2 .94 m bsf
4 3 2
5 2 0
Ic e
4 3 0
3 3 2
4 2 1Ice
3 3 0
4 1 1
4 1 0
4 0 0
3 2 1
3 2 0
2 2 2
Ice
Ice
Ic e
2 1 12 1 0
2 0 0
1 1 0
Inte
ns
ity
(A
.U.)
2 T h e ta (d e g ree )
XRD pattern of sI gas hydrate from Cascadia,
offshore Vancouver Island
A
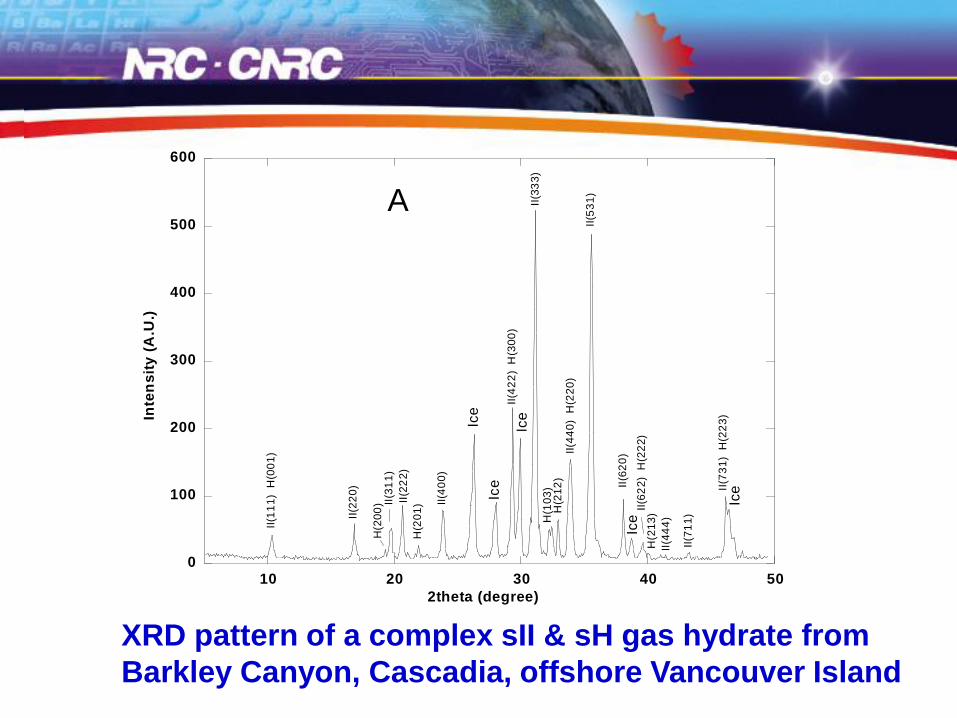
0
100
200
300
400
500
600
10 20 30 40 50
Inte
ns
ity
(A
.U.)
2theta (degree)
II(1
11
) H
(00
1)
II(3
11
)H
(20
0) II
(40
0)
H(2
01
)
Ice
Ice
Ice
Ice
Ice
II(4
22
) H
(30
0)
II(3
33
)H
(10
3)
H(2
12
)II
(44
0)
H(2
20
)
II(5
31
)
II(6
20
)
II(6
22
) H
(22
2)
H(2
13
)
II(7
11
)
II(7
31
) H
(22
3)
II(2
20
)
II(2
22
)
II(4
44
)
XRD pattern of a complex sII & sH gas hydrate from
Barkley Canyon, Cascadia, offshore Vancouver Island

A
Table 2. X-ray Powder Data for sII and sH gas hydrates recovered from Barkley Canyon,
offshore Vancouver Island
Structure type hkl D(obs) D(calc) Res(d)
111 9.85729 9.95462 -0.09733
220 6.07354 6.09593 -0.02239
311 5.17622 5.19863 -0.02240
222 4.95215 4.97731 -0.02516
400 4.30239 4.31048 -0.00808
422 3.50004 3.51949 -0.01944
333 3.30190 3.31821 -0.01630
440 3.03881 3.04797 -0.00915
531 2.90192 2.91441 -0.01249
620 2.71886 2.72618 -0.00733
622 2.61504 2.59931 0.01573
444 2.50599 2.48865 0.01733
711 2.40201 2.41435 -0.01234
sII
a = 1.724 ± 0.002 nm
731 2.26099 2.24470 0.01629
001 9.85748 10.06147 -0.20399
200 5.29615 5.27786 0.01828
201 4.66743 4.67385 -0.00642
300 3.50002 3.51858 -0.01855
103 3.19003 3.19636 -0.00634
212 3.12585 3.12597 -0.00012
220 3.03883 3.04718 -0.00835
222 2.61507 2.60634 0.00873
sH
a = 1.219 ± 0.009 nm
c = 1.006 ± 0.009 nm
223 2.26097 2.25531 0.00566

A
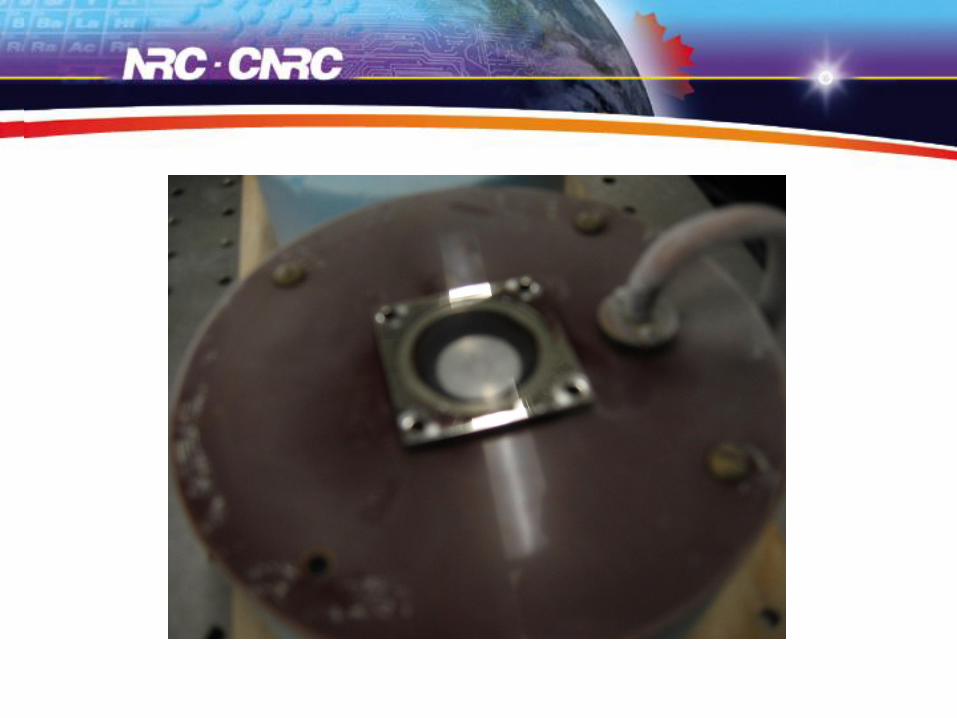
Single X-ray diffractometer

A
A B
A: Single crystal of sII gas hydrate(Barkley Canyon)
B: Single crystal of sI gas hydrate(Northern Cascadia)
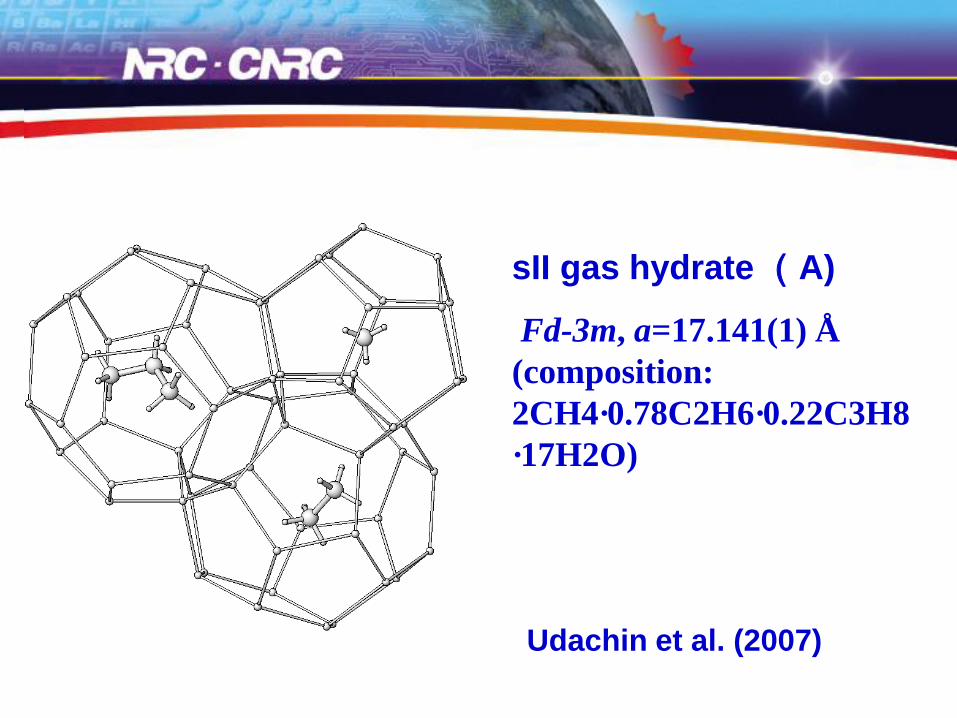
sII gas hydrate (A)
Fd-3m, a=17.141(1) Å
(composition:
2CH4·0.78C2H6·0.22C3H8
·17H2O)
Udachin et al. (2007)

ARaman study of gas hydrate

A

A
A

A
A
2 104
4 104
6 104
8 104
1 105
1.2 105
1.4 105
1.6 105
2800 3000 3200 3400 3600
Raman Shift
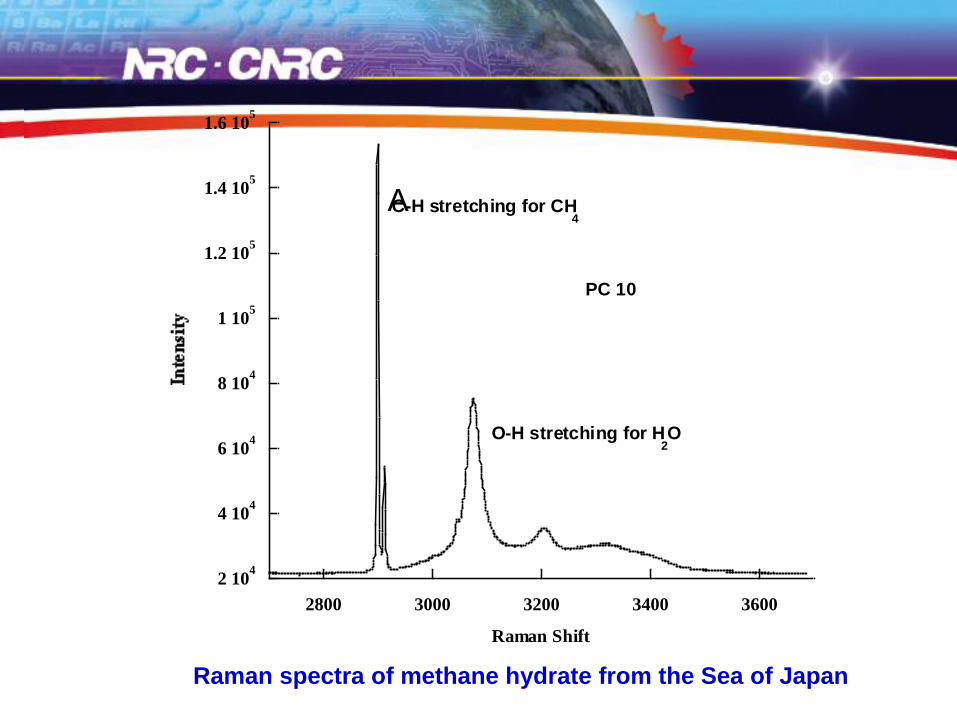
O-H stretching for H2O
C-H stretching for CH4
PC 10
Raman spectra of methane hydrate from the Sea of Japan

A
2600 2800 3000 3200
3048
2902
2914
3078
Raman shift (cm-1)
3208
U1328E 2X-2
2500 2550 2600 2650
2569
2593
2604
Raman spectra of mixed CH-HS hydrate from Cascadia, offshore Vancouver Island

A
Hester et al. (2007)
A
2700 2800 2900 3000 3100 3200
Inte
ns
ity
Raman shift (cm-1
)
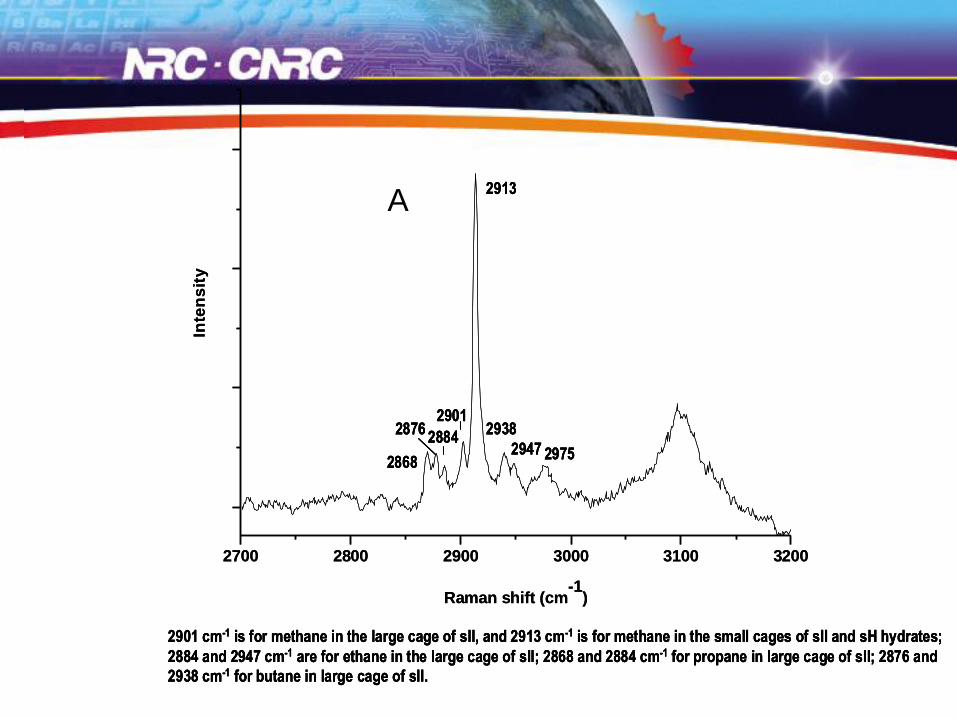
2913
2901
2868
28762884
2938
2947 2975
2901 cm-1 is for methane in the large cage of sII, and 2913 cm-1 is for methane in the small cages of sII and sH hydrates;
2884 and 2947 cm-1 are for ethane in the large cage of sII; 2868 and 2884 cm-1 for propane in large cage of sII; 2876 and
2938 cm-1 for butane in large cage of sII.
2700 2800 2900 3000 3100 3200
Inte
ns
ity
Raman shift (cm-1
)
2913
2901
2868
28762884
2938
2947 2975
2901 cm-1 is for methane in the large cage of sII, and 2913 cm-1 is for methane in the small cages of sII and sH hydrates;
2884 and 2947 cm-1 are for ethane in the large cage of sII; 2868 and 2884 cm-1 for propane in large cage of sII; 2876 and
2938 cm-1 for butane in large cage of sII.

A
Hester et al. 2006

The hydration number of gas hydrates from the Sea of Japan, as
estimated from methane peak intensities of Raman
Method
Sample # Occupancy Rate Hydration
numberLarge cage Small cage
Raman PC10-1 0.96826 0.78423 6.23
PC10-2 0.96833 0.78290 6.24
PC11-1 0.96853 0.77867 6.24
PC11-2 0.96830 0.78331 6.24
PC20-1 0.96842 0.78108 6.24
PC20-2 0.96993 0.74612 6.29
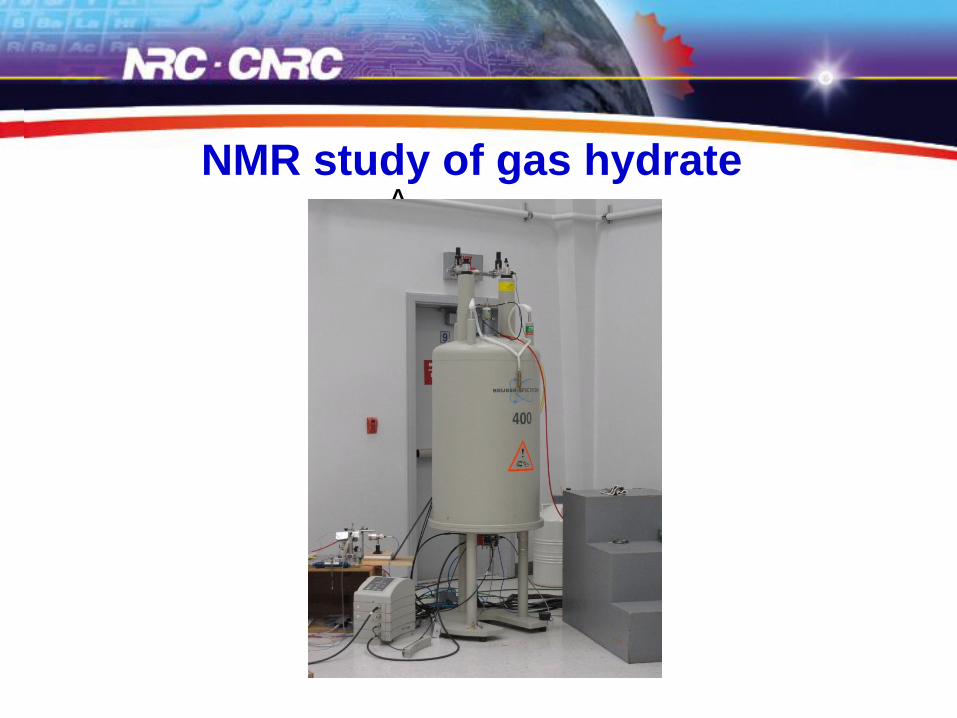
ANMR study of gas hydrate
A
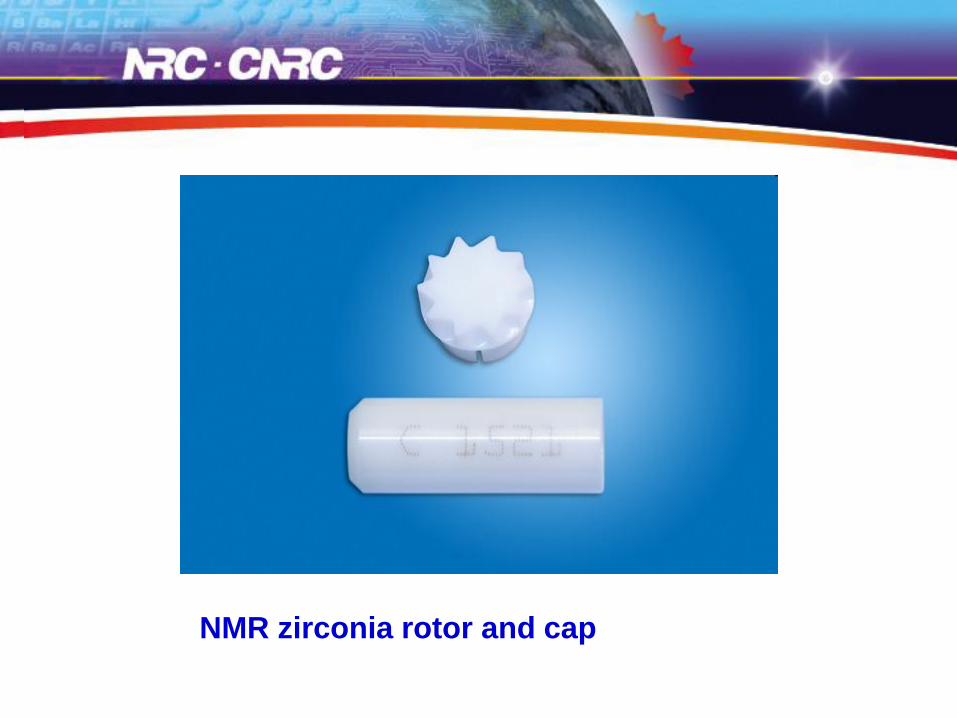
NMR zirconia rotor and cap

A
-14-1 2-10-8-6-4-2024681012141618
(ppm )
13C HP DE C M AS 2200 Hz IO DP
1
2
3
4
13C NMR spectra of methane hydrate from Cascadia, offshore Vancouver Island

(ppm)
-35-25-15-551525354555
-4
.4
-8
.2-
4.9
6.1
14
.8 13.7
16.7
17.5
23
.62
5.8
26.5
27.0
27
.327.7
22.7
33
.03
5.2
35.8
(ppm)
24.525.025.526.026.527.027.528.028.529.029.530.0
26.527.3
26.5
27
.7
25.7
(ppm)
24.525.025.526.026.527.027.528.028.529.029.530.0
26.527.3
26.5
27
.7
(ppm)
24.525.025.526.026.527.027.528.028.529.029.530.0
26.527.3
26.5
27
.7
25.7
-4
.9
(ppm)
-9.0-8.5-8.0-7.5-7.0-6.5-6.0-5.5-5.0-4.5-4.0-3.5-3.0
-8.2
13C NMR spectra of complex gas hydrate from Cascadia, offshore
Vancouver Island

( p p m )
- 1 8- 1 4- 1 0- 6- 2261 01 41 8
CH4
C2H6
13C NMR Spectrum of CH4+C2H6 hydrate(mixture of structure I & II)


DSC study of gas hydrate

U1328B 2H1-9
-100 -80 -60 -40 -20 0 20
T (oC)
CH4 hydrate
U1328B 2H1X-5 #2
U1328B 2H1X-5 #3
U1328B 2H1X-5 #1
U1328E 2X-2 80-90 cm
H2S hydrate
-80 °C
DSC pattern of
hydrate samples
from Cascadia
Characterization of natural gas hydrates
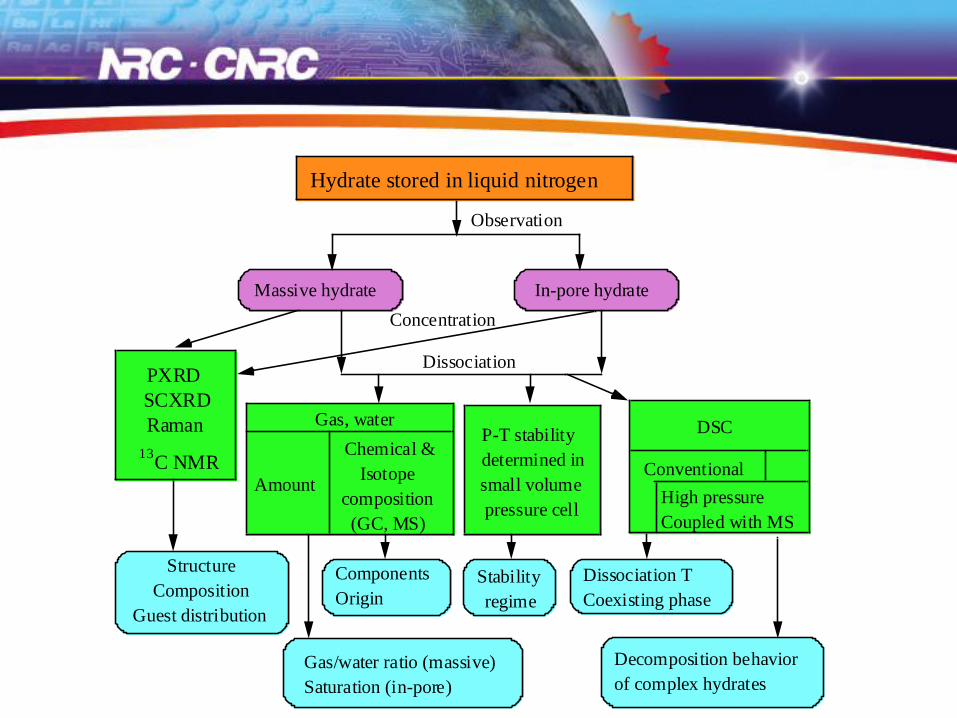
In-pore hydrate
Hydrate stored in liquid nitrogen
Massive hydrate
Observation
PXRD
SCXRD
Raman
13
C NMRAmount
Chemical &
Isotope
composition
(GC, MS)
Gas, waterP-T stability
determined in
small volume
pressure cell
Conventional
High pressure
Coupled with MS
DSC
Structure
Composition
Guest distribution
Gas/water ratio (massive)
Saturation (in-pore)
Components
Origin
Stability
regime
Dissociation T
Coexisting phase
Decomposition behavior
of complex hydrates
Concentration
Dissociation
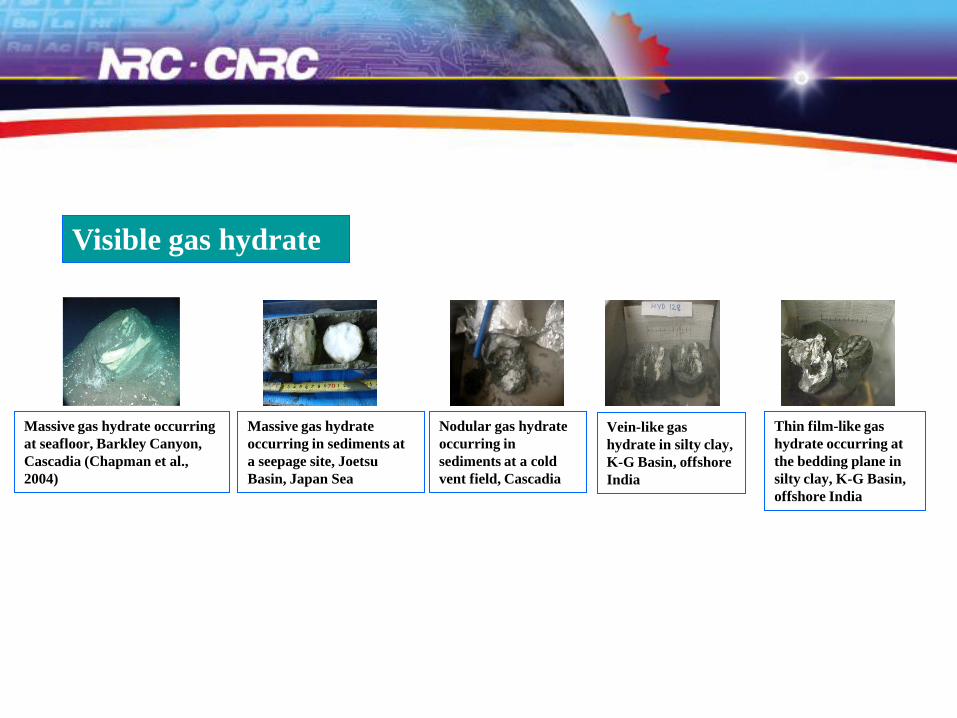
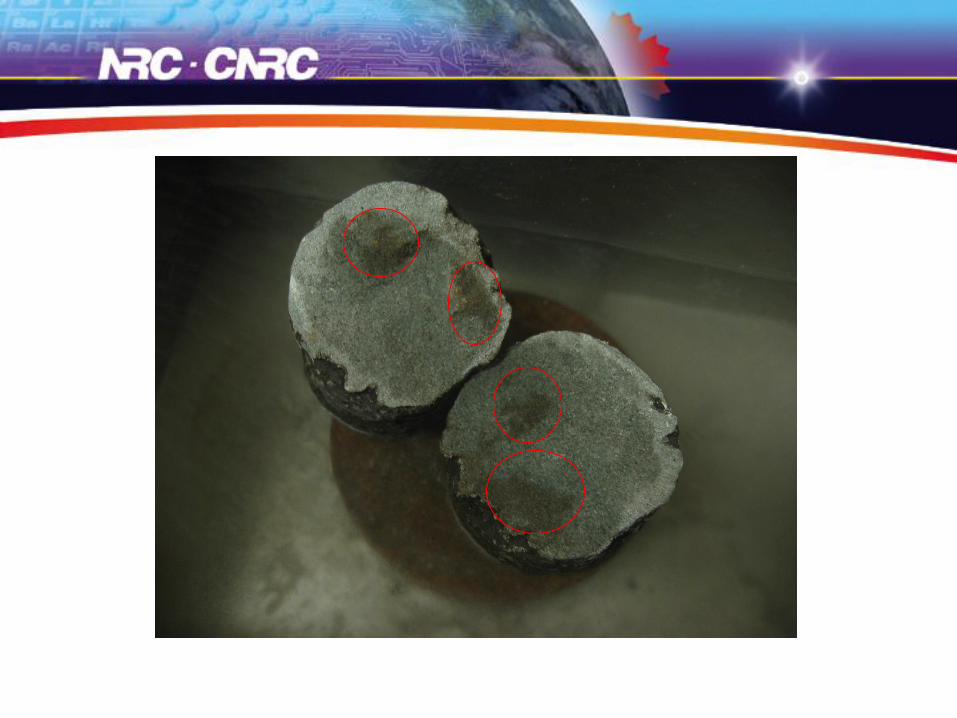
Visible gas hydrate
Massive gas hydrate occurring
at seafloor, Barkley Canyon,
Cascadia (Chapman et al.,
2004)
Massive gas hydrate
occurring in sediments at
a seepage site, Joetsu
Basin, Japan Sea
Nodular gas hydrate
occurring in
sediments at a cold
vent field, Cascadia
Vein-like gas
hydrate in silty clay,
K-G Basin, offshore
India
Thin film-like gas
hydrate occurring at
the bedding plane in
silty clay, K-G Basin,
offshore India

Invisible gas hydrate – In-pore gas hydrate
Gas hydrate in volcanic
ash, offshore Andaman
Island
Gas hydrate in silty clay,
K-G Basin, offshore
India
Gas hydrate in sand,
Mallik, Mackenzie
Delta, N.W.T., Canada
Gas hydrate in sand,
Nankai Trough, offshore
Japan
Gas hydrate in clay silt,
South China Sea
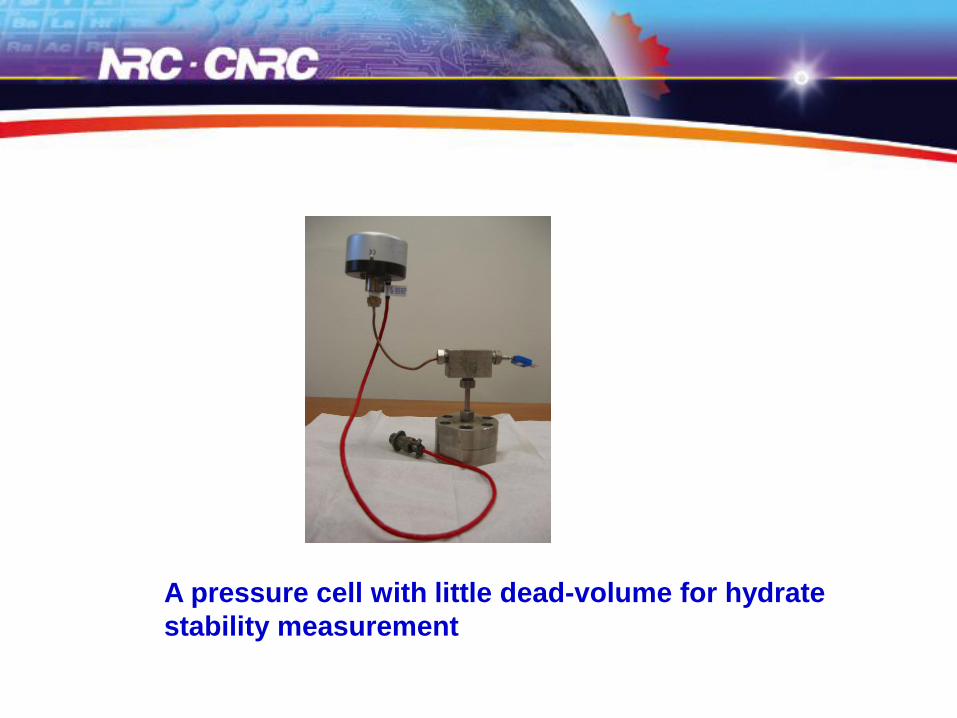
A pressure cell with little dead-volume for hydrate
stability measurement
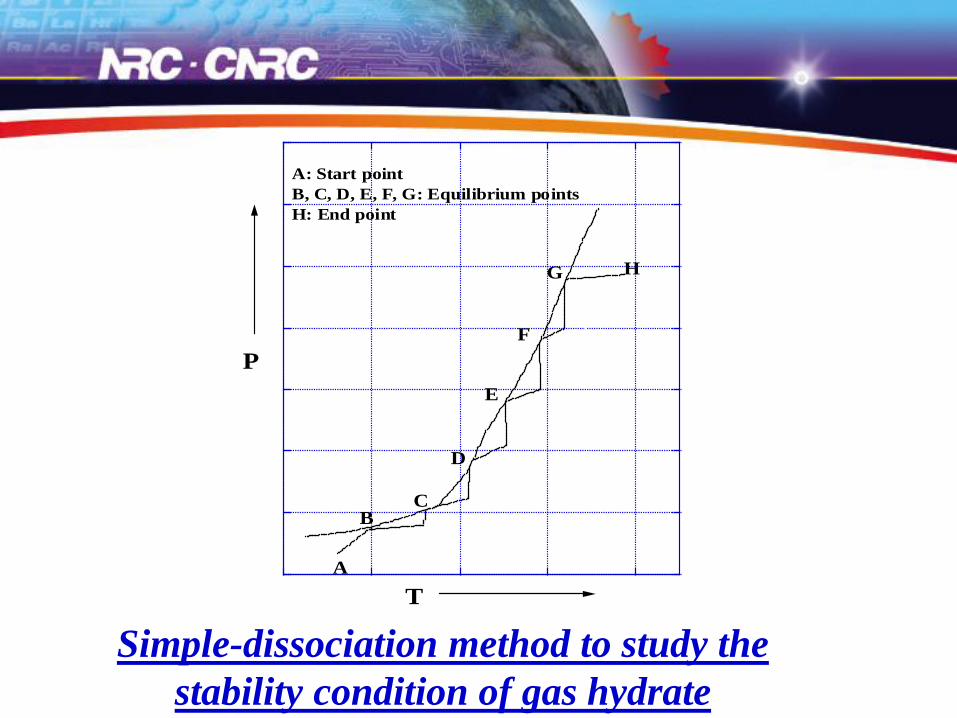
P
T
A
BC
D
E
F
G H
A: Start point
B, C, D, E, F, G: Equilibrium points
H: End point
Simple-dissociation method to study the
stability condition of gas hydrate
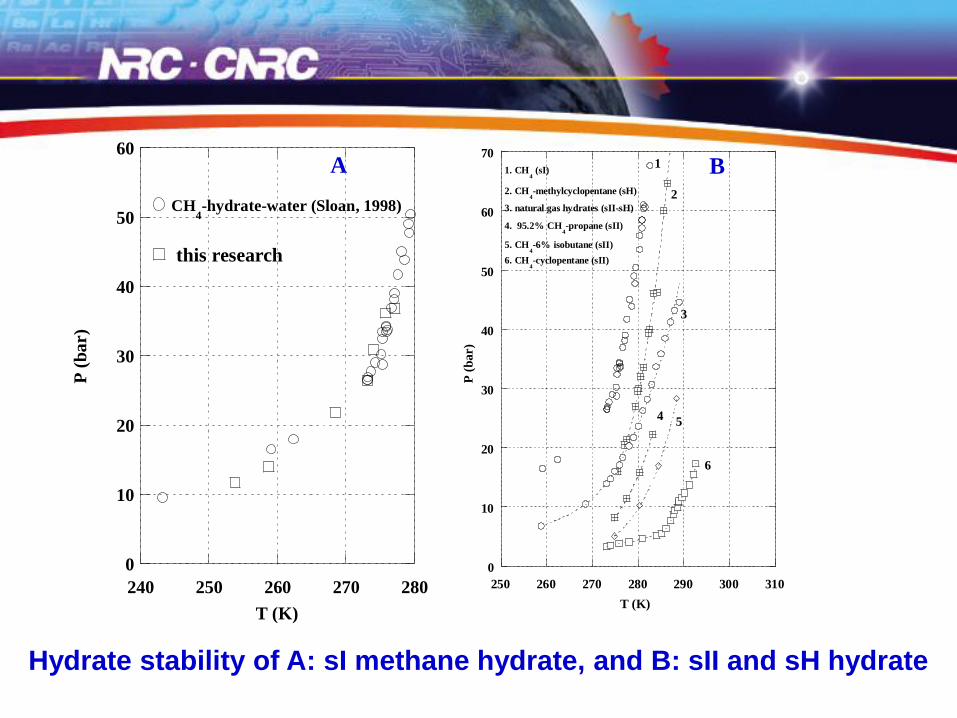
0
10
20
30
40
50
60
240 250 260 270 280
P (
bar)
T (K)
CH4-hydrate-water (Sloan, 1998)
this research
0
10
20
30
40
50
60
70
250 260 270 280 290 300 310
P (
bar)
T (K)
1
2
3
45
6
1. CH4 (sI)
2. CH4-methylcyclopentane (sH)
3. natural gas hydrates (sII-sH)
4. 95.2% CH4-propane (sII)
5. CH4-6% isobutane (sII)
6. CH4-cyclopentane (sII)
A B
Hydrate stability of A: sI methane hydrate, and B: sII and sH hydrate
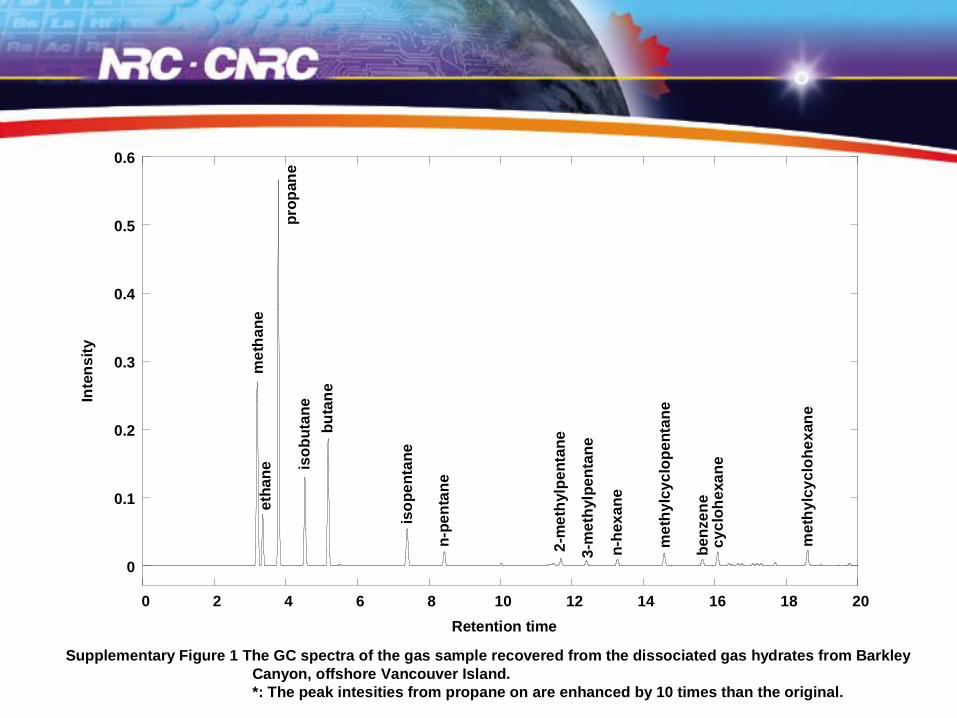
0
0.1
0.2
0.3
0.4
0.5
0.6
0 2 4 6 8 10 12 14 16 18 20
Inte
ns
ity
Retention time
me
tha
ne
eth
an
e
pro
pan
eis
ob
uta
ne
bu
tan
e
iso
pe
nta
ne
n-p
en
tan
e
me
thy
lcy
clo
he
xan
e
2-m
eth
ylp
en
tan
e
me
thy
lcy
clo
pe
nta
ne
cy
clo
he
xa
ne
3-m
eth
ylp
en
tan
e
n-h
ex
an
e
be
nze
ne
Supplementary Figure 1 The GC spectra of the gas sample recovered from the dissociated gas hydrates from Barkley
Canyon, offshore Vancouver Island.
*: The peak intesities from propane on are enhanced by 10 times than the original.
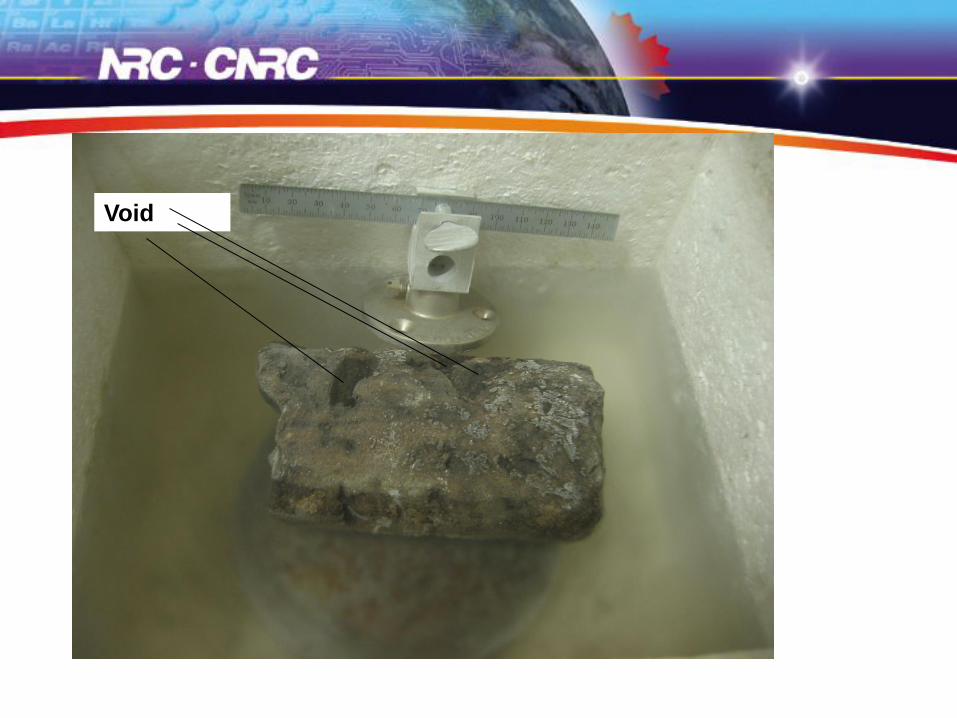
Void

AA
B
C
A’
B’
Subsampling of gas
hydrate-containing
sediment column (Mt.
Elbert, Alaskan North
Slope)
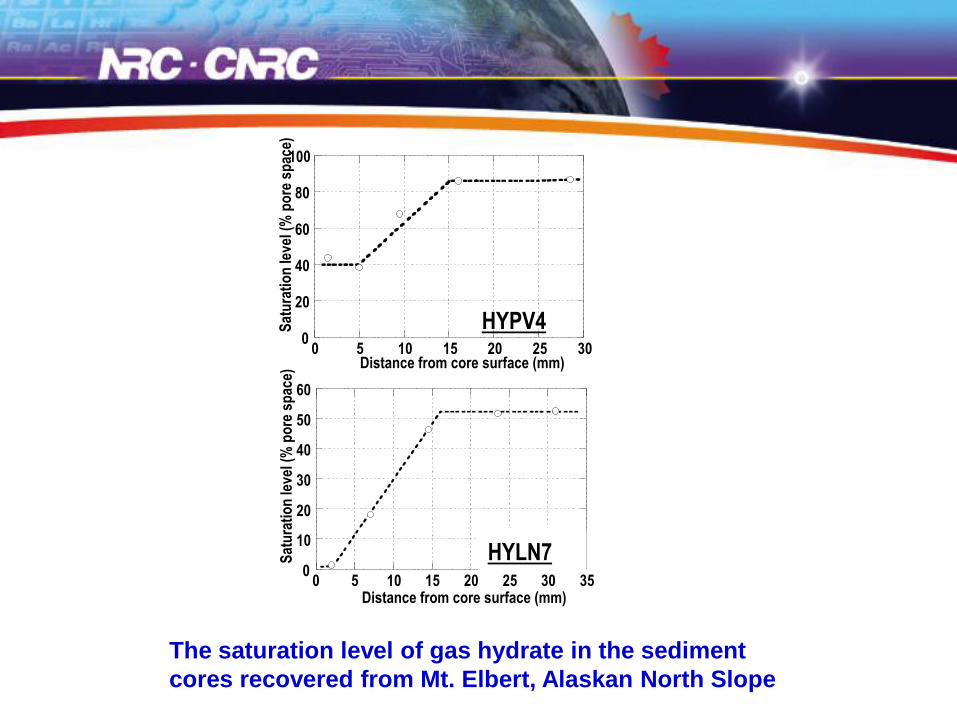
HYPV4
0
10
20
30
40
50
60
0 5 10 15 20 25 30 35
Sat
ura
tio
n le
vel (
% p
ore
sp
ace)
Distance from core surface (mm)
HYLN7
0
20
40
60
80
100
0 5 10 15 20 25 30
Sat
ura
tio
n le
vel (
% p
ore
sp
ace)
Distance from core surface (mm)
The saturation level of gas hydrate in the sediment
cores recovered from Mt. Elbert, Alaskan North Slope

HYLN7
HYPV4
10 20 30 40 50
2 Theta (degree)
feld
spar
002
012
112
022
Ice
Ice
Ice
Ice Ic
e
Ice
Qu
artz
023
123
004
014
114
124
233
Iro
n o
xid
e
Illit
e
035
135 00
6
feld
spar
feld
spar
Iro
n o
xid
e

HYLN7
HYPV4
2880 2900 2920 2940
Raman shift (cm-1)
2902
2914

-280
-240
-200
-160
0 10 20 30 40
HYLN7
-50
-45
-40
0 10 20 30 40
HYLN7
δ13C
c1
(‰)
δD
C1
(‰)
Distance from core surface (mm)
Figure The distributions of δ13C and δD in HYLN7 and HYPV4
-50
-45
-40
0 10 20 30 40
HYPV4
Sample
Pressurizing gas
-280
-240
-200
-160
0 10 20 30 40
HYPV4
Sample
Pressurizing gas

0
20
40
60
80
100
0 10 20 30 40
HYPV4
Distance from core surface (mm)
Con
trib
uti
on
of
seco
nd
ary
hyd
rate
(%
)
Figure The contribution of secondary formation of methane
hydrate to hydrate saturation in HYPV4

Thanks!