synthesis and characterization of corrosion …
TRANSCRIPT

SYNTHESIS AND CHARACTERIZATION OF HYDROXYL AMMONIUM IONIC LIQUIDS AS CORROSION INHIBITOR FOR CARBON STEEL
UNDER ACIDIC MEDIA
KIKI ADI KURNIA
DOCTOR OF PHILOSOPHY CHEMICAL ENGINEERING DEPARTMENT
UNIVERSITI TEKNOLOGI PETRONAS
AUGUST 2011


STATUS OF THESIS
Title of thesis SYNTHESIS AND CHARACTERIZATION OF HYDROXYL
AMMONIUM IONIC LIQUIDS AS CORROSION INHIBITOR
FOR CARBON STEEL UNDER ACIDIC MEDIA
I, KIKI ADI KURNIA
hereby allow my thesis to be placed at the Information Resource Center (IRC) of
Universiti Teknologi PETRONAS (UTP) with the following conditions:
i) The thesis becomes the property of UTP
ii) The IRC of UTP may make copies of the thesis for academic purposes only.
iii) This thesis is classified as
Confidential
√ Non-confidential
If this thesis is confidential, please state the reason: __________________________________________________________________________________________________________________________________________ The contents of the thesis will remain confidential for ___________ years.
Remarks on disclosure: __________________________________________________________________________________________________________________________________________
Endorsed by
Signature of Author Signature of Supervisor Permanent address: Name of Supervisor
Jln. Jend. Gatot Subroto No.173/118 Assoc. Prof. Dr. M. Ibrahim A. Mutalib Bandung, 40274, Indonesia
Date : Date : _____________________________

UNIVERSITI TEKNOLOGI PETRONAS
SYNTHESIS AND CHARACTERIZATION OF HYDROXYL AMMONIUM
IONIC LIQUIDS AS CORROSION INHIBITOR FOR CARBON STEEL UNDER
ACIDIC MEDIA
by
KIKI ADI KURNIA
The undersigned certify that they have read, and recommend to the Postgraduate
Studies Programme for acceptance this thesis for the fulfillment of the requirements
for the degree stated.
Signature : ___________________________________________ Main Supervisor : ASSOC. PROF. DR. M. IBRAHIM A. MUTALIB B Signature : __________________________________________ Head of Department : ASSOC. PROF. DR. SHUHAIMI MAHADZIR R
Date : __________________________________________

SYNTHESIS AND CHARACTERIZATION OF HYDROXYL AMMONIUM
IONIC LIQUIDS AS CORROSION INHIBITOR FOR CARBON STEEL UNDER
ACIDIC MEDIA
by
KIKI ADI KURNIA
A Thesis
Submitted to the Postgraduate Studies Programme
as a Requirement for the Degree of
DOCTOR OF PHILOSOPHY
DEPARTMENT OF CHEMICAL ENGINEERING
UNIVERSITI TEKNOLOGI PETRONAS
BANDAR SERI ISKANDAR,
PERAK
AUGUST 2011

iv
DECLARATION OF THESIS
Title of thesis SYNTHESIS AND CHARACTERIZATION OF HYDROXYL
AMMONIUM IONIC LIQUIDS AS LOW COST CORROSION
INHIBITOR FOR CARBON STEEL UNDER ACIDIC MEDIA
I, KIKI ADI KURNIA
hereby declare that the thesis is based on my original work except for quotations and
citations which have been duly acknowledged. I also declare that it has not been
previously or concurrently submitted for any other degree at UTP or other institutions.
Witnessed by
_____________________________ __________________________________
Signature of Author Signature of Supervisor
Permanent address: Name of Supervisor Jln. Jend. Gatot Subroto No.173/118 Assoc. Prof. Dr. M. Ibrahim A. Mutalib
Bandung, 40274, Indonesia Date : Date : _____________________________

v
DEDICATION
To my parents and grandparents, for their love and support. Who worked tirelessly,
so that their children could have better lives than they.

vi
ACKNOWLEDGMENTS
First and foremost I would like to express my sincere gratitude and appreciation to my
supervisor, Assoc. Prof. Dr. Mohamed Ibrahim Abdul Mutalib for his invaluable
advice, support, encouragement, and his patience throughout this course of thesis
study. I am forever grateful to him for believing in me and giving me the opportunity
to work with him, and being such an inspiring mentor with his immense enthusiasm.
I am also greatly thankful to Assoc. Prof. Dr. Bambang Ariwahjoedi from
Fundamental and Applied Science Department for his generous help, his expert
advice, and his approach to me like as if I am one of his own students. I would also
like to thank Assoc Prof. Dr. Mohamad Azmi Bustam, who gave generously imparted
some of his vast knowledge on me through my symposiums.
Financial support provided by Postgraduate Office, Universiti Teknologi
PETRONAS (UTP) in the form of graduate assistantship is gratefully acknowledged.
I would also like to thank Postgraduate Study Programme staff members and
Chemical Engineering Department staff members and technicians.
I would like to express my gratitude to the entire PETRONAS Ionic Liquids
center and my lab mates in block 5 for their help and support, and friendship that you
have given me over the years. Particularly, I would like to express my appreciation to
Anisa Ur Rahmah, Ariyanti Sarwono, Sabtanti Harimukti, and Hasiah Kamarudin for
not only making my days at UTP more fun and effective, but also for being great
friends to me when I am thousand miles away from my home ways. I wish you all the
best luck in your future endeavors!

vii
I wish to thank all my friends, especially to Dini Amalia, Sri Krisna Wisnu
Wardhana, Firman Syah, Abdul Munir, Tri Chandra, Fikri Irawan, Prantyo
Rizkyantoro, Aryo Handoko, Luluan Lubis, Belinda, Ela Nurlaela, Yunita Sari, and
Rere Rahardjati for carrying me with their presence, conversation, and their own
nature, which inspire me and change my life during my study in UTP.
Most importantly, I would like to express my true appreciation to my family for
their love, emotional support, understanding, and their patience. I would like to send
my deepest appreciation to my parents and my grandmother that have made biggest
sacrifices to enable me to achieve this goal, for their endless love and support, for that
I will forever be indebted to them, and without their encouragement this study would
not have been possible.
.

viii
ABSTRACT
The inhibition of carbon steel corrosion becomes of such interest because it is widely
used as constructional materials in many industries, such as erecting boilers, drums,
heat exchangers, pipe line, and many more. The acidization of oil and gas wells is
probably the most widely used work over and stimulation practice in oil industry. HCl
is widely used for stimulating carbonate-based reservoirs. Since HCl is strong
aggressive medium for oil and gas well equipment, the effective way to protect these
materials is to inject a suitable corrosion inhibitor. Accordingly, corrosion inhibitors
must be injected with the HCl solution to avoid the destructive effect of acid on the
surface of the pipe lines. Hence it is very important to measure the physical properties
of the new corrosion inhibitor.
A variety of organic additives as corrosion inhibitors have been tested in these
processes. However, there are some disadvantageous with the current inhibitor such
as toxic, difficult preparation method and the high material cost. Also it has been
reported that the lack of their physical properties data, has limited the design and
application of these corrosion inhibitors. Even though ionic liquids have been proven
as a potential inhibitor on carbon steel corrosion in acidic media, their price is
relatively higher compared to the commercially available corrosion inhibitor. An
alternative way is to find cheaper ionic liquids that can be applied as corrosion
inhibitor on carbon steel corrosion in acidic media. Hydroxyl ammonium ionic liquids
are relatively cheap and easy to produce in purity greater than 99%. In order to
develop low cost inhibitors, the recent investigations on application of the hydroxyl
ammonium ionic liquids as inhibitor on corrosion of carbon steel in 1 M HCl, seem
really worthwhile.

ix
The objectives of this research are to synthesis and characterize the range of ionic
liquids, and to study their potential application as inhibitor on carbon steel corrosion
in acidic media. For this study, sixteen hydroxyl ammonium ionic liquids were
synthesized and characterized. The structures of synthesized ionic liquids were
confirmed by infrared, 1H-NMR, and 13C-NMR spectra. Composition of synthesized
ionic liquids was also confirmed from elemental analysis. Water content of these ionic
liquids was found to be lower than 200 ppm. Physical properties of the ionic liquids
such density, viscosity, and refractive index were measured at atmospheric pressure
and temperature from 293.15 to 353.15 K, while refractive index was measured at
temperature from (293.15 to 323.15) K. The coefficients of thermal expansions were
calculated from experimental density data. In practical condition, corrosion inhibitors
are mixture of active components, solvents, and surfactant. In this work, the effects of
alcohol such as methanol, ethanol, and 1-propanol, as co-solvent on physical
properties namely density, viscosity, and refractive index of the ionic liquids were
also studied. The ionic liquids Bis(2-hydroxyethyl)ammonium formate, [BHEAF] was
chosen as model due to the highest inhibition performance.
The inhibition performance of the synthesized ionic liquids on carbon steel
corrosion in 1 M HCl was measured within concentration range of ionic liquids from
0.02 to 0.08 M while temperature range from 298.15 – 343.15 K using two methods,
weight loss and electrochemical. The obtained results showed that the inhibition
performance increased with increasing concentration of ionic liquids and decreasing
temperature of system. Tafel Plot analysis showed that these ionic liquids were mixed
type inhibitor, which reduced the corrosion rate by blocking both cathodic and anodic
site. Electrochemical Impedance Spectroscopy analysis showed that the addition of
ionic liquids did not change the mechanism of corrosion of carbon steel. The
synthesized ionic liquids reduced the corrosion rate of carbon steel by adsorbing
themselves on the carbon steel surface. The adsorptions of the ionic liquids on the
surface of carbon steel obey the Langmuir’s isotherm adsorption. The high values of
equilibrium constant and standard free energy of adsorption indicated that the
adsorption of ionic liquids on the surface of carbon steel was spontaneous and
occurred only by physisorption. The apparent activation energy of corrosion of carbon

x
steel in the presence of ionic liquids was higher compared to without ionic liquids.
This result indicated that the addition of ionic liquids give energy barrier for
corrosion. These results were also supported by their enthalpy and entropy of
adsorption. Addition of alcohol on ionic liquids did not alter the inhibition efficiency.
Thus, it can be concluded that these alcohols can be used as co-solvent with ionic
liquids, without reducing the ionic liquids performance. The organic solvent is
particularly helpful for reducing the viscosity of ionic liquids which is known to be
highly viscous
From these experimental results, it shows that hydroxyl ammonium ionic liquids
have potential as inhibitor on corrosion of carbon steel in 1 M HCl. It suggests that all
the synthesized hydroxyl ammonium ionic liquid in this work has the potential to be
used as inhibitor on carbon steel corrosion in 1 M HCl.

xi
ABSTRAK
Penghambatan korosi baja karbon menjadi kepentingan kerana banyak digunakan
sebagai bahan pembinaan di banyak industri, seperti boiler, drum, penukar panas,
paip, dan banyak lagi. The acidization telaga minyak dan gas bumi mungkin adalah
pekerjaan yang paling banyak digunakan di atas dan amalan stimulasi dalam industri
minyak. HCl secara meluas digunakan untuk merangsang reservoir karbonat yang
berpusat. Kerana HCl adalah sarana agresif yang kuat untuk minyak dan gas tetap,
cara efektif untuk melindungi material ini adalah dengan menyuntikkan inhibitor
korosi yang sesuai. Oleh kerana itu, inhibitor korosi harus disuntik dengan larutan
HCl untuk mengelakkan kesan merosakkan asid pada permukaan garis paip. Oleh
kerana itu sangat penting untuk mengukur sifat fizikal inhibitor korosi baru.
Berbagai aditif organik sebagai inhibitor korosi telah diuji dalam proses ini.
Namun, ada beberapa merugikan dengan inhibitor saat ini seperti beracun, kaedah
persiapan sulit dan kos bahan tinggi. Juga telah dilaporkan bahawa kurangnya data
sifat fizikal mereka, telah menyekat desain dan aplikasi dari inhibitor korosi.
Walaupun cecair ionik telah terbukti sebagai inhibitor berpotensi pada korosi baja
karbon dalam media asam, harga mereka relatif lebih tinggi berbanding dengan
inhibitor korosi tersedia secara komersil. Cara alternatif adalah untuk mencari cecair
ionik murah yang boleh digunakan sebagai inhibitor korosi pada korosi baja karbon
dalam media asam. Cecair ammonium ion hidroksil relatif murah dan mudah untuk
dibuat dalam kemurnian lebih dari 99%. Dalam rangka untuk mengembangkan kos
rendah dan persekitaran "ramah" inhibitor, penyelidikan baru pada penerapan cecair
ammonium ion hidroksil sebagai inhibitor terhadap korosi baja karbon dalam 1 M
HCl, tampak benar-benar berharga.

xii
Tujuan kajian ini adalah untuk sintesis dan mengkarakterisasi pelbagai cecair ion,
dan mempelajari aplikasi potensi mereka sebagai inhibitor korosi pada baja karbon
dalam media asam. Untuk kajian ini, sebanyak enam belas hidroksil amonium cecair
ionik yang disintesis dan disifatkan. Struktur cecair ionik disintesis disahkan dengan
spektra IR, 1H-NMR, dan 13C-NMR. Komposisi ionik cecair disintesis juga disahkan
daripada analisis unsur. Kadar air dari cairan ion dijumpai lebih rendah daripada 200
ppm.
Sifat fizikal dari cairan ionik tersebut, seperti kepadatan, viskositas, dan indeks
bias diukur dan dilaporkan. Kepadatan dan viskositas cecair ionik diukur pada
tekanan atmosfera dan suhu 29315-353.15 K, sedangkan indeks bias diukur pada suhu
dari (293.15-323.15) K. Pekali pengembangan terma dikira dari data kepadatan
eksperimental. Sifat fizikal cecair ionik yang menurun dengan peningkatan suhu.
Ketergantungan suhu sifat fizikal cecair ionik boleh dikorelasikan menggunakan
persamaan empirik.
Dalam keadaan praktikal, inhibitor korosi adalah campuran komponen aktif,
pelarut, dan surfaktan. Dalam karya ini, pengaruh alkohol seperti metanol, etanol, dan
1-propanol, sebagai cosolvent pada sifat fizikal dari cairan ionik juga dipelajari.
Cecair ionik [BHEAF] dipilih sebagai model kerana prestasi inhibisi tertinggi. Sifat
fizikal campuran binari ionik cecair [BHEAF] dengan alkohol dijumpai tertinggi pada
cecair ionik murni dan menurun dengan peningkatan konsentrasi alkohol. Selain itu,
kerapatan dan viskositas campuran cecair ion dengan alkohol menunjukkan
penyimpangan negatif dari ideal, sedangkan indeks bias menunjukkan penyimpangan
positif. Dari data percubaan, termodinamik sifat kelebihan seperti kelantangan molar
kelebihan, deviasi viskositas, dan deviasi indeks bias dihitung dan juga dilengkapi
dengan Redlich Kister persamaan polinomial. Kelantangan molar semu pada
pencairan tak terbatas cecair ion di cosolvent juga dipelajari. Keputusan yang
diperolehi menunjukkan bahawa cecair ionik mempunyai kelantangan molar lebih
rendah berbanding dengan sistem murni.
xiii
Prestasi penghambatan cecair ionik disintesis pada korosi baja karbon dalam 1 M
HCl diukur dalam liputan konsentrasi cairan ion 0.02 – 0.08 M sementara kisaran
suhu 298.15-343.15 K menggunakan dua kaedah, berat badan dan elektrokimia.
Keputusan yang diperolehi menunjukkan bahawa prestasi inhibisi meningkat dengan
peningkatan kepekatan ion cecair dan penurunan suhu sistem. Analisis Tafel Plot
menunjukkan bahawa cecair ionik adalah inhibitor jenis campuran, yang
mengurangkan laju korosi dengan menghalang kedua-dua laman katodik dan anodik.
Elektrokimia Spektroskopi Impedansi analisis menunjukkan bahawa penambahan
cecair ionik tidak merubah mekanisme kakisan baja karbon. Cecair ionik disintesis
mengurangkan laju korosi pada baja karbon dengan menyerap diri pada permukaan
baja karbon. Para jerapan dari cairan ion pada permukaan baja karbon mematuhi
jerapan isoterm yang Langmuir. Nilai tenaga yang tinggi keseimbangan tidak konstan
dan standard jerapan menunjukkan bahawa jerapan ion cecair pada permukaan baja
karbon spontan dan berlaku hanya oleh physisorption. Tenaga pengaktifan nyata dari
korosi baja karbon di hadapan cecair ion lebih tinggi berbanding dengan tanpa cecair
ionik. Keputusan ini menunjukkan bahawa penambahan cecair ionik memberikan
penghalang tenaga untuk korosi. Keputusan ini juga disokong oleh entalpi dan entropi
jerapan. Penambahan alkohol pada cecair ionik tidak mengubah kecekapan inhibisi.
Dengan demikian, dapat disimpulkan bahawa alkohol boleh digunakan sebagai
cosolvent dengan cecair ionik, tanpa mengurangkan prestasi cecair ionik. Pelarut
organik sangat bermanfaat untuk mengurangkan viskositas cecair ion yang dikenal
sangat kental
Dari hasil percubaan, hal itu menunjukkan bahawa cecair ion hidroksil amonium
mempunyai potensi sebagai inhibitor terhadap korosi baja karbon dalam 1 M HCl. Ini
menunjukkan bahawa semua cecair ammonium ion hidroksil disintesis dalam karya
ini mempunyai potensi untuk digunakan sebagai inhibitor korosi pada baja karbon
dalam 1 M HCl.

xiv
COPYRIGHT
In compliance with the terms of the Copyright Act 1987 and the IP Policy of the university, the copyright of this thesis has been reassigned by the author to the legal entity of the university,
Institute of Technology PETRONAS Sdn Bhd.
Due acknowledgement shall always be made of the use of any material contained in, or derived from, this thesis.
© Kiki Adi Kurnia, 2011 Institute of Technology PETRONAS Sdn Bhd All rights reserved.

xv
TABLE OF CONTENTS
STATUS OF THESIS................................................................................................ i
DEDICATION ....................................................................................................... v
ACKNOWLEDGMENTS ....................................................................................... vi
ABSTRACT .................................................................................................... viii ABSTRAK ...................................................................................................... xi
COPYRIGHT .................................................................................................... xiv
TABLE OF CONTENTS ........................................................................................ xv
LIST OF TABLES .............................................................................................. xviii LIST OF FIGURES ................................................................................................ xx
LIST OF SYMBOLS AND ABBREVIATIONS................................................. xxvii
CHAPTER 1: INTRODUCTION .......................................................................... 1
1.1 Background ..................................................................................................... 1
1.1.1 Ionic Liquids Corrosion Inhibitor ......................................................... 5
1.2 Problem Statement ........................................................................................... 6
1.3 Research Objectives and Scope of Study .......................................................... 9
1.4 Thesis Layout ................................................................................................ 10
CHAPTER 2: LITERATURE REVIEW ............................................................. 13
2.1 Ionic Liquids .................................................................................................. 13
2.1.1 Synthesis of Ionic Liquids .................................................................. 16
2.1.2 Purification of Ionic Liquids ............................................................... 20
2.2 Physical Properties of Ionic Liquids ............................................................... 21
2.2.1 Density ............................................................................................... 22
2.2.2 Viscosity ............................................................................................ 25
2.2.3 Refractive Index ................................................................................. 28
2.2.4 Effect of Co-solvent on Physical Properties of Ionic Liquids .............. 30
2.3 Carbon Steel Corrosion in Acidic Media ........................................................ 40

xvi
2.3.1 Recent Development on Corrosion Inhibitor in Acidic Media ............ 42
2.3.2 Method to Measure Corrosion Inhibition ............................................ 47
2.3.3 Adsorption of Inhibitor on Carbon Steel Surface ................................ 54
2.3.4 Thermodynamic of Adsorption .......................................................... 57
2.3.5 The Apparent Activation Energy ........................................................ 61
CHAPTER 3: RESEARCH METHODOLOGY.................................................. 65
3.1 Preparation of Ionic Liquids .......................................................................... 65
3.1.1 Chemicals .......................................................................................... 67
3.1.2 Synthesis of Ionic Liquids .................................................................. 67
3.1.3 Characterization of Ionic Liquids ....................................................... 72
3.2 Measurement of Physical Properties .............................................................. 73
3.2.1 Density .............................................................................................. 74
3.2.2 Viscosity ............................................................................................ 75
3.2.3 Refractive Index................................................................................. 76
3.2.4 Preparation of Binary Mixture............................................................ 77
3.3 Corrosion Study ............................................................................................ 78
3.3.1 Preparation of Solution ...................................................................... 78
3.3.2 Preparation of Specimen .................................................................... 78
3.3.3 Weight Loss Method .......................................................................... 80
3.3.4 Electrochemical Method .................................................................... 82
CHAPTER 4: SYNTHESIS AND PHYSICAL PROPERTIES OF IONIC LIQUIDS ..................................................................................... 87
4.1 Hydroxyl Ammonium Ionic Liquids .............................................................. 87
4.1.1 Infrared Spectrum .............................................................................. 88
4.1.2 NMR Spectrum .................................................................................. 91
4.1.3 Elemental Analysis ............................................................................ 95
4.1.4 Water Content .................................................................................... 96
4.2 Physical Properties of Ionic Liquids .............................................................. 97
4.2.1 Density .............................................................................................. 98
4.2.2 Coefficient of Thermal Expansion .................................................... 107
4.2.3 Viscosity .......................................................................................... 108
4.2.4 Refractive Index............................................................................... 113
4.3 Effect of Alcohol on Physical Properties of Ionic Liquids ............................ 115
4.3.1 Density of Binary Mixture and Volumetric Properties ...................... 116

xvii
4.3.2 Coefficient of Thermal Expansion for Binary Mixture ...................... 123
4.3.3 Viscosity of Binary Mixture ............................................................. 125
4.3.4 Refractive Index of Binary Mixture and Refractive Index Deviation . 130
4.4 Density of 1 M HCl ..................................................................................... 134
4.5 Concluding Remarks .................................................................................... 136
CHAPTER 5 APPLICATION OF IONIC LIQUIDS AS INHIBITOR ON CARBON STEEL CORROSION IN ACIDIC MEDIUM ........... 139
5.1 Effect of Concentration of Ionic Liquids on Corrosion Rate of Carbon Steel Corrosion ..................................................................................................... 139
5.1.1 Weight Loss Method ........................................................................ 141
5.1.2 Tafel Plots ........................................................................................ 150
5.1.3 Linear Polarization Resistance .......................................................... 153
5.1.4 Electrochemical Impedance Spectroscopy ........................................ 155
5.1.5 Effect of Temperature....................................................................... 160
5.1.6 Effect of Alcohol .............................................................................. 162
5.2 Adsorption of Ionic Liquids on the Carbon Steel Surface ............................. 164
5.2.1 Adsorption Isotherm ......................................................................... 164
5.2.2 Equilibrium Constant of Adsorption Process .................................... 166
5.2.3 Thermodynamics of Adsorption Process ........................................... 169
5.2.4 The Apparent Activation Energy ...................................................... 176
5.3 Inhibiting Mechanism .................................................................................. 179
5.4 Concluding Remarks .................................................................................... 181
CHAPTER 6 183
CONCLUSIONS AND RECOMMENDATIONS ................................................. 183
6.1 Conclusions ................................................................................................. 183
6.2 Recommendations ........................................................................................ 184
PUBLICATION ................................................................................................... 185 REFERENCES ................................................................................................... 187
APPENDIX A ................................................................................................... 205 APPENDIX B ................................................................................................... 210
APPENDIX C ................................................................................................... 216 APPENDIX D ................................................................................................... 234
xviii
LIST OF TABLES
Table 1.1 Price comparison of some precursor of imidazolium-based and
hydroxyl ammonium ionic liquids .......................................................... 7
Table 2.1 Density for some alcohols and ionic liquids at T = 298.15 K. ................ 23
Table 2.2 Viscosity of some organic solvents and ionic liquids at T = 298.15 K ... 26
Table 2.3 Refractive index of some organic solvents and ionic liquids at
temperature 298.15 K ........................................................................... 29
Table 2.4 Adsorption isotherm ............................................................................. 55
Table 2.5 The enthalpy and entropy of activation for mild steel in 1M HCl
solution in the absence and presence of [BMIM]Cl ............................... 61
Table 2.6 The apparent activation energy for mild steel in 1M HCl solution in
the absence and presence of [BMIM]Cl. ............................................... 62
Table 3.1 The amount of ionic liquids needed to make 0.02, 0.04, 0.06, and
0.08 M of solution ................................................................................ 79
Table 3.2 Chemical composition of carbon steel BS 970. ..................................... 79
Table 4.1 List of peak appear in the infrared spectrum of the synthesized ionic
liquids in this work ............................................................................... 91
Table 4.2 Elemental analysis of synthesized ionic liquids ..................................... 96
Table 4.3 Water content of synthesized ionic liquids ............................................ 97
Table 4.4 Comparison of density, ρ, values for pure ionic liquids and alcohol at
T = 298.15 K. ....................................................................................... 98
Table 4.5 The predicted density for hydroxyl ammonium ionic liquids using
COSMO-RS method............................................................................100

xix
Table 4.6 Fit parameter for temperature dependence of density calculated using
equation (2.1) and its standard deviation calculated using equation
(4.1) .................................................................................................... 104
Table 4.7 Comparison of viscosity values for pure ionic liquids at T = 298.15
K ........................................................................................................ 109
Table 4.8 Fit parameter for temperature dependence of viscosity calculated
using equation (2.4) and its standard deviation calculated using
equation (4.1). ..................................................................................... 112
Table 4.9 Fit parameter for temperature dependence of refractive index
calculated using equation (2.5) and its standard deviation calculated
using equation (4.1). ........................................................................... 114
Table 4.10 Fit parameter for temperature dependence of density of 1 M HCl
with the various concentrations of [BHEAF] calculated using
equation (2.1) and its standard deviation calculated using equation
(4.1) .................................................................................................... 135
Table 5.1 Electrochemical impedance parameters and the corresponding
inhibition efficiency for carbon steel in 1 M HCl in the presence of
various concentrations of ionic liquids [BHEAF] at 298.15 K. ............ 158

xx
LIST OF FIGURES
Figure 1.1 Structures of some recent discovered novel corrosion inhibitors in
acidic medium ........................................................................................ 3
Figure 1.2 Ionic liquids inhibitors on steel corrosion in acidic medium. ................... 6
Figure 2.1 Structure of common cations and anions used for ionic liquids ............. 14
Figure 2.2 General method to synthesis ionic liquids. ............................................ 17
Figure 2.3 Schematic formation of the protic ionic liquids ethylammonium
nitrate through proton transfer. ............................................................. 18
Figure 2.4 Structure of common cations used in protic ionic liquids. ..................... 19
Figure 2.5 Structure of common anions used in protic ionic liquids.. ..................... 19
Figure 2.6 Effect of temperature on density of the ionic liquids.. ........................... 24
Figure 2.7 Effect of temperature on viscosity of the ionic liquids .......................... 27
Figure 2.8 Experimental and predicted viscosity for ionic liquids. ......................... 28
Figure 2.9 Effect of temperature on refractive index of ionic liquids
[empy][EtSO4] ..................................................................................... 30
Figure 2.10 Density and excess molar volume ([BMIM]SCN + 1-propanol) binary
mixture at T = 298.15 K (a) Effect of composition on density of
binary mixture, (b) Excess volume molar of binary mixture, (--)
correlated using equation 2.11 .............................................................. 35
Figure 2.11 Viscosity of ([BMIM]SCN + 1-propanol) binary mixture at T =
298.15 K (a) Effect of composition on viscosity of binary mixture,
(b) Deviation of viscosity of binary mixture, (-) correlated using
equation 2.11 ........................................................................................ 37

xxi
Figure 2.12 Refractive index of ([empy][EtSO4] + 1-Propanol) binary mixture at
T = 298.15 K (a) Effect of composition on refractive index of binary
mixture, (b) Deviation of refractive index of binary mixture, (-)
correlated using equation 2.11 ............................................................... 39
Figure 2.13 The E-pH diagram of iron with the cathodic criterion at 25 °C. ............. 42
Figure 2.14 Mechanism of carbon steel corrosion in HCl solution in the absence
and presence of inhibitor ....................................................................... 45
Figure 2.15 Corrosion rate and inhibition efficiency in the absence and presence
of [BMIM]Cl for mild steel in 1 M HCl. .............................................. 48
Figure 2.16 Experimentally measured Tafel ploT. ................................................... 49
Figure 2.17 Effect of inhibitor concentration on the potentiodynamic polarization
response for mild steel in 1M HCl solution at 303 in various
concentration of [BMIM]Cl .................................................................. 50
Figure 2.18 Experimentally measured linear polarization resistance ......................... 51
Figure 2.19 Nyquist plot for mild steel in 1M HCl solution at 303.15 K in various
concentration of 1-butyl-3-methylimidazolium chloride. ....................... 52
Figure 2.20 Bode plot for mild steel in 1M HCl solution at 303.15 K in various
concentration of 1-butyl-3-methylimidazolium chloride.. ...................... 53
Figure 2.21 Electrical circuit analog corresponded to the Figure 2.19 and 2.20 ........ 53
Figure 2.22 Langmuir’s isotherm adsorption for ionic liquids 1-Butyl-3-
methylimidazolium chloride on the surface of mild steel at temperature
303 K .................................................................................................... 56
Figure 2.23 Equilibrium constant for mild steel in 1M HCl solution in the
presence of 0.005 M [BMIM]Cl at different temperatures .................... 57
Figure 2.24 Standard free energy for mild steel in 1M HCl solution in the
presence of 0.005 M [BMIM]Cl at different temperatures .................... 59

xxii
Figure 2.25 Plot the ln(CR/T) against. 1000/T for mild steel in 1M HCl solution in
the presence of 0.005 M 1-butyl-3-methylimidazolium chloride at
different temperatures ........................................................................... 60
Figure 2.26 Arrhenius plot for mild steel in 1M HCl solution in the presence of
0.005 M 1-butyl-3-methylimidazolium chloride at different
temperatures ......................................................................................... 62
Figure 3.1 Flow diagram of experimental in the present work................................ 66
Figure 3.2 Schematic preparation of ionic liquids through protonation of
alkanolamine using organic acid ........................................................... 67
Figure 3.3 Illustration of the working electrode used for measurement of
corrosion experiment. ........................................................................... 80
Figure 3.4 General setup for the measurement of corrosion rate using three
electrodes configurations ...................................................................... 83
Figure 4.1 Infrared spectra of ionic liquids [HEF], [HEA], [HEP], and [HEL] ....... 88
Figure 4.2 Infrared spectra of [BHEAF], [BHEAA], [BHEAP], and [BHEAL]...... 89
Figure 4.3 Infrared spectra of [BHEMF], [BHEMA], [BHEMP], and [BHEML] ... 89
Figure 4.4 Infrared spectra of [THEAF], [THEAA], [THEAP], and [THEAL] ...... 90
Figure 4.5 1H-NMR spectrum of [BHEAF]. .......................................................... 92
Figure 4.6 13C-NMR Spectrum of [BHEAF].......................................................... 92
Figure 4.7 Density of ionic liquids Bis(2-hydroxyethyl)ammonium with different
anion at temperature 298.15 K. ............................................................101
Figure 4.8 Density of ionic liquids with acetate and different cation at
temperature 298.15 K. .........................................................................102
Figure 4.9 Density of ionic liquids with formate anion and different cation as
function of temperature.. .....................................................................105
Figure 4.10 Density of ionic liquids with acetate anion and different cation as
function of temperature.. .....................................................................105
xxiii
Figure 4.11 Density of ionic liquids with propionate anion and different cation as
function of temperature. ...................................................................... 106
Figure 4.12 Density of ionic liquids with lactate anion and different cation as
function of temperature ....................................................................... 106
Figure 4.13 Coefficient of thermal expansion of ionic liquids and methanol at
several temperatures............................................................................ 107
Figure 4.14 Viscosity of ionic liquids as function of temperature. .......................... 111
Figure 4.15 Viscosities of ionic liquids from temperature (293.15 to 353.15) K
and its polynomial correlation using equation (4.2) (····). ..................... 112
Figure 4.16 Refractive index of ionic liquids as function of temperature and its
polynomial correlation using equation (2.1) (····). ................................ 115
Figure 4.17 Densities of {[HEF](1) + methanol(2)}binary mixture at temperature
298.15 K ............................................................................................. 116
Figure 4.18 Densities of binary mixture of ionic liquids with alcohol at
temperature 298.15 K.......................................................................... 117
Figure 4.19 Density-temperature dependence of {[BHEAF](1) + methanol(2)}
binary mixtures with different moles fraction of [BHEAF].................. 118
Figure 4.20 Excess molar volume, EmV , for {[BHEAF](1) + Alcohol(2)} binary
mixture at temperature 298.15 K.. ....................................................... 120
Figure 4.21 Excess molar volume, EmV , for {[BHEAF](1) + methanol(2)} binary
mixture at several temperature. ........................................................... 121
Figure 4.22 Partial molar volume, VΦ, for {[BHEAF](1) + methanol2)} binary
mixture at temperature 298.15 K. ........................................................ 122
Figure 4.23 Coefficient of thermal expansion for binary mixture of ionic liquids
with alcohol at temperature 298.15 K. ................................................. 124
Figure 4.24 Coefficient of thermal expansion for {[BHEAF](1) + methanol(2)}
binary mixture at several temperatures. ............................................... 125
xxiv
Figure 4.25 Viscosity of binary mixture of ionic liquids with alcohol at
temperature 298.15 K. .........................................................................126
Figure 4.26 Viscosity of {[BHEAF](1) + methanol(2)} binary mixture at several
temperatures. .......................................................................................127
Figure 4.27 Viscosity deviation, ∆η, for for {[BHEAF](1) + alcohol(2)} binary
mixture at temperature 298.15 K. ........................................................128
Figure 4.28 Viscosity deviation, ∆η, for {[BHEAF](1) + methanol(2)} binary
mixture at several temperature .............................................................129
Figure 4.29 Refractive index of binary mixture of ionic liquids with alcohol at
temperature 298.15 K. .........................................................................130
Figure 4.30 Refractive index of {[BHEAF](1) + methanol(2)} binary mixture at
several temperatures. ...........................................................................131
Figure 4.31 Refractive index deviation, ∆nD, for for {[BHEAF](1) + alcohol(2)}
binary mixture at temperature 298.15 K. Symbols: □, {[BHEAF](1) +
methanol(2)}; ◊, {[BHEAF](1) + ethanol(2)}; Δ, {[BHEAF](1) + 1-
propanol(2)}. .......................................................................................133
Figure 4.32 Refractive index deviation, ∆nD, for {[BHEAF](1) + methanol(2)}
binary mixture at several temperature ..................................................133
Figure 4.33 Density of 1 M HCl solution in the presence of various concentration
of ionic liquids [BHEAF] at several temperatures. ...............................134
Figure 4.34 Temperature dependence of density of 1 M HCl solution in the
presence of various concentration of ionic liquids [BHEAF] at several
temperatures. .......................................................................................135
Figure 5.1 Effect of ionic liquids concentration on corrosion rate of carbon steel
in 1 M HCl in 1 M HCl at 298.15 K determined using weight loss
method. (a) Ionic liquids with formate anion. (b) Ionic liquids with 2-
hydroxyethylammonium cation. ..........................................................140
Figure 5.2 Corrosion rate of carbon steel in 1 M HCl in the presence of various
concentrations of ionic liquids [BHEAF] at 298.15 K measured using

xxv
weight loss method. (a) Ionic liquids with formate anion. (b) Ionic
liquids with 2-hydroxyethylammonium cation. ................................... 143
Figure 5.3 Effect of anion on concentration dependence of inhibition efficiency
of ionic liquids on corrosion of carbon steel in 1 M HCl at
temperature 298.15 K using weight loss method. ................................ 144
Figure 5.4 Effect of cation on concentration dependence of inhibition efficiency
of ionic liquids on corrosion of carbon steel in 1 M HCl at
temperature 298.15 K using weight loss method ................................. 145
Figure 5.5 Effect of the cation and anion on the inhibition efficiency of 0.02 M
ionic liquids on carbon steel corrosion at 298.15 K. ............................ 148
Figure 5.6 SEM micrographs of carbon steel specimens (magnificent scale
3000x). (a) Before immersion, (b) After immersion in 1 M HCl
solution without inhibitor, and (c) after immersion in 1 M HCl
solution in the presence of 0.08 M of ionic liquids [BHEAF]. ............. 149
Figure 5.7 Tafel Plots of carbon steel dissolution in 1 M HCl at 298.15 K in the
presence of various concentrations of ionic liquids [BHEAF].. ............ 151
Figure 5.8 The effect of concentration of the ionic liquids on corrosion current
density of carbon steel in 1 M HCl at 298.15 K measured using Tafel
Plots. .................................................................................................. 151
Figure 5.9 The inhibition efficiency of ionic liquids determined using Tafel Plot
at 298.15 K. ........................................................................................ 152
Figure 5.10 The effect of concentration of the ionic liquids on polarization
resistance of carbon steel in 1 M HCl at 298.15 K measured using
Linear Polarization Resistance. ........................................................... 153
Figure 5.11 The inhibition efficiency of ionic liquids determined using Tafel Plot
at 298.15 K. ........................................................................................ 154
Figure 5.12 Nyquist plot of carbon steel in 1 M HCl with various concentrations
of ionic liquids at 298.15 K. ................................................................ 156

xxvi
Figure 5.13 Electrochemical impedance spectrum of carbon steel in 1 M HCl with
various concentrations of ionic liquids [BHEAF] at 298.15 K. .............157
Figure 5.14 Electrical Circuit Analog .....................................................................158
Figure 5.15 Corrosion rate of carbon steel in 1 M HCl with the presence of
various concentrations of ionic liquids [BHEAF] at several
temperatures using weight loss method. ...............................................161
Figure 5.16 Temperature dependence of inhibition efficiency of [BHEAF] on
corrosion of carbon steel in 1 M HCl at several temperatures using
weight loss method ..............................................................................162
Figure 5.17 Effect of alcohol on inhibition performance of 0.08 M of [BHEAF]
on carbon steel corrosion in acidic medium. ........................................163
Figure 5.18 Plots of Langmuir’s isotherm adsorption of [BHEAF] at several
temperatures using weight loss method. ...............................................166
Figure 5.19 Plots of equilibrium constant of adsorption process of ionic liquids on
carbon steel surface at several temperatures. ........................................167
Figure 5.20 Plots of standard free energy of adsorption process of ionic liquids on
carbon steel surface at several temperatures. ........................................170
Figure 5.21 Plot of ln(CR/T) against 1/T for ionic liquids. ......................................172
Figure 5.22 Plots of enthalpy of activation for carbon steel corrosion in the
presence of various concentrations of ionic liquids. .............................173
Figure 5.23 Plots of entropy of activation for carbon steel corrosion in the
presence of various concentrations of ionic liquids. .............................175
Figure 5.24 Plot of ln(C/R) against 1/T for ionic liquids. .......................................177
Figure 5.25 Plots of entropy of activation for carbon steel corrosion in the
presence of various concentrations of ionic liquids. .............................178
xxvii
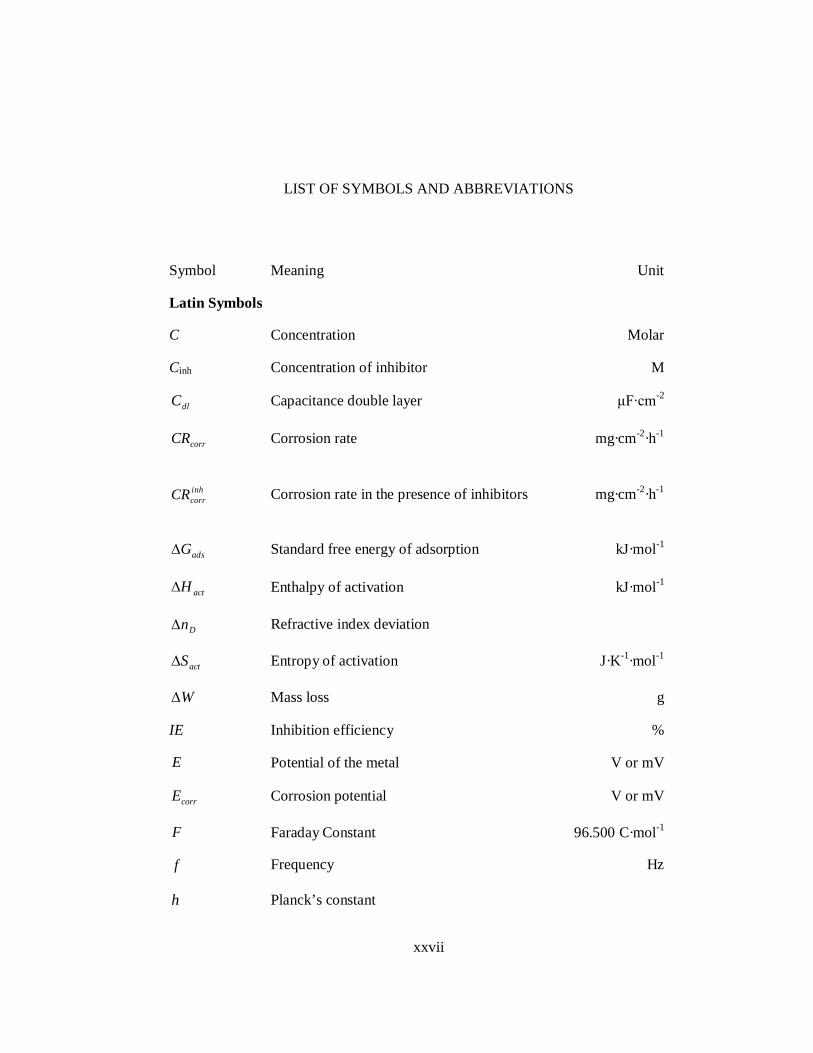
LIST OF SYMBOLS AND ABBREVIATIONS
Symbol Meaning Unit
Latin Symbols
C Concentration Molar
Cinh Concentration of inhibitor M
dlC Capacitance double layer μF·cm-2
corrCR Corrosion rate mg·cm-2·h-1
inhcorrCR Corrosion rate in the presence of inhibitors mg·cm-2·h-1
adsG Standard free energy of adsorption kJ·mol-1
actH Enthalpy of activation kJ·mol-1
Dn Refractive index deviation
actS Entropy of activation J·K-1·mol-1
W Mass loss g
IE Inhibition efficiency %
E Potential of the metal V or mV
corrE Corrosion potential V or mV
F Faraday Constant 96.500 C·mol-1
f Frequency Hz
h Planck’s constant

i Current A or mA
corri Corrosion current density A·cm-2
oxi Oxidation current A or mA
redi Reduction current A or mA
adsK Equilibrium constant of adsorption
M Molecular weight g·mol-1
Molar mass g·mol-1
1M Molecular weight of component 1 g·mol-1
2M Molecular weight of component 2 g·mol-1
m Mass g
AN Avogradro’s constant
n Number of electron
n Mole
1n Mole of component 1
2n Mole of component 2
Dn Refractive index
T Temperature °C
Absolute temperature K
Transmitance
t Time h
V Volume cm3

0V Volume ideal cm3·mol-1
01V Volume molar of component 1 cm3·mol-1
02V Volume molar of component 2 cm3·mol-1
EmV Excess molar volume cm3·mol-1
1,mV Volume molar partial of component 1 cm3·mol-1
2,mV Volume molar partial of component 2 cm3·mol-1
1,mV Volume molar partial of component 1 at infinite dilutioncm3·mol-1
2,mV Volume molar partial of component 2 at infinite dilutioncm3·mol-1
1,V Apparent molar volume of component 1 cm3·mol-1
2,V Apparent molar volume of component 2 cm3·mol-1
x Mole fraction
ix Mole fraction of component i
jx Mole fraction of component j
1x Mole fraction of component 1
2x Mole fraction of component 2
Z Atomic Weight
Z Impedance
'Z Real impedance
''Z Imaginary impedance

Greek Symbols
Coefficient of thermal expansion K-1
a Tafel constant for anodic V·decade
c Tafel constant for cathodic V·decade
Viscosity Deviation mPa·s
Viscosity mPa·s
Degree of surface coverage
Density g·cm-3
1 Density of component 1 g·cm-3
2 Density of component 2 g·cm-3
mix Density of mixture g·cm-3
Abbreviation Meaning
AC Alternating Current
[BHEAA] Bis(2-hydroxyethyl)ammonium Acetate
[BHEAF] Bis(2-hydroxyethyl)ammonium Formate
[BHEAL] Bis(2-hydroxyethyl)ammonium Lactate
[BHEAP] Bis(2-hydroxyethyl)ammonium Propionate
[BHEMA] Bis(2-hydroxyethyl)methylammonium Acetate
[BHEMF] Bis(2-hydroxyethyl)methylammonium Formate
[BHEML] Bis(2-hydroxyethyl)methylammonium Lactate
[BHEMP] Bis(2-hydroxyethyl)methylammonium Propionate

[BMIM]BF4 1-butyl-3-methylimidazolium tetrafluoroborate
[BMIM]Br 1-butyl-3-methylimidazolium bromide
[BMIM]Cl 1-butyl-3-methylimidazolium chlorides
[BMIM]HSO4 1-butyl-3-methylimidazolium hydrogen sulfate
[BMIM]PF6 1-Butyl-3-methylimidazolium
[BMIM]SCN 1-Butyl-3-methylimidazolium thiocyanate
[BMIM]Tf2N 1-Butyl-3-methylimidazolium bis[(trifluoromethyl)sulfonyl]imide
[empy][EtSO4] 1-ethyl-3-methylpyridinium ethylsulfate
[MMIM]MeSO4 1,3-Dimethylimidazolium methylsulfate
DEA Diethanolamine
DMSO Dimethyl sulfoxide
EIS Electrochemical Impedance Spectroscopy
EDL Electrochemical Double Layer
[HEA] 2-Hydroxyethylammonium Acetate
[HEF] 2-Hydroxyethylammonium Formate
[HEL] 2-Hydroxyethylammonium Lactate
[HEP] 2-Hydroxyethylammonium Propionate
[HMIM]Tf2N 1-Hexyl-3-methylimidazolium bis[(trifluoromethyl)sulfonyl]imide
IR Infrared
LPR Linear Polarization Resistance
MDEA Methyldiethanolamine
MEA Monoethanolamine
NMR Nuclear Magnetic Resonance

OCP Open Circuit Potential
[OMIM]Tf2N 1-Octyl-3-methylimidazolium bis[(trifluoromethyl)sulfonyl]imide
TEA Triethanolamine
TMS Tetramethyl silane
[THEAA] Tris(2-hydroxyethyl)ammonium Acetate
[THEAF] Tris (2-hydroxyethyl)ammonium Formate
[THEAL] Tris (2-hydroxyethyl)ammonium Lactate
[RHEAP] Tris (2-hydroxyethyl)ammonium Propionate

CHAPTER 1
INTRODUCTION
1.1 Background
The corrosion of metals is a common phenomenon in industry, and it has received
considerable amount of attention. Corrosion is defined in different ways, but the usual
interpretation of the term is “an attack on a metallic material by reaction with its
environment” [1]. One of the most studied environments is acidic medium. Acidic
medium is widely used in various industrial processes like pickling of metals to
remove scale in metallurgical industries, deactivation of equipments in atomic power
establishments, various chemical and petrochemical processes in an oil refinery,
removal of scales from heat exchangers in electricity producing plants, and rocket fuel
components in rocket technology [1].
There are several different approaches to reduce the effect of corrosion. These
approaches can be divided into four major groups; upgrading of materials, blending of
production fluids, process control, and use of corrosion inhibitor [1]. The right
material selection and upgrading for the use as corrosion resistant could solve most
problems encountered in any corrosive environment. Usually, the cost associated with
these higher-end alloys is prohibitively expensive. The development of nonmetallic
composites with corrosion resistant properties could become a potential option, but it
is hard to compete against the versatility, good structural properties, and low cost of
carbon steel. Blending is a process in which a production fluid with a high
concentration of corrosive species is mixed with another production fluid with lower

2
concentration, thus reducing the overall concentration of the corrosive species to an
acceptable level. Physical properties such as viscosity can also be reduced through the
blending of two streams of production fluid, which leads to a lower shear stress of the
production fluid and an increase in inhibitor efficiency. Process control reduces
corrosion through the control of temperature and flow rates of production media.
Reducing the temperature decreases the corrosion rate, but it will also increase
viscosity, so the method is dependent on where in the production process it is applied.
Controlling and lowering the flow rate of production media in particularly exposed
areas will reduce corrosion and increase inhibition efficiency.
Among the several methods for corrosion prevention and control mentioned
above, the use of corrosion inhibitors is highly popular. A corrosion inhibitor is a
chemical substance that, upon small quantity addition to a corrosive environment,
results in the reduction of corrosion rate to an acceptable level. Corrosion inhibitors
are generally used in small concentrations. A corrosion inhibitor should not only
mitigate the corrosion, but also be compatible with the environment in the sense that it
should not lead to any repercussions [1].
One of the major consumers of the corrosion inhibitors is the oil industry which
includes acid stimulation of oil and gas wells. The stimulation of oil and gas wells
using concentrated solutions of 1 to 5 M of HCl is a common practice, performed to
increase production and remove formation damage. The acid, which must be pumped
through steel pumping equipment, casing, and production tubing prior to entering the
formation, not only can create significant damage to those equipments, but also can
damage the formation by forming corrosion by-products such as FeS and Fe(OH)3.
Therefore, corrosion inhibitors are an indispensable part of the fluid mix pumped
downhole when well is acidized [2, 3].
Figure 1.1 shows some chemical structure of recent discovered novel corrosion
inhibitors. Organic inhibitors contain active functional groups that bond to the metal
surface and protect it. Most of the efficient inhibitors are organic compounds which
mainly contain oxygen, sulfur, nitrogen atoms and multiple bonds in the molecule
through which they are adsorbed on metal surface [4-9].

3
(a) (b)
(c) (d)
(e) (f)
Figure 1.1 Structures of some recent discovered novel corrosion inhibitors in acidic
medium. (a) Acenaphtho[1,2-b] Quinoxaline [4], (b) 1-methyl-3-pyridin-2-yl-thiourea
[5], (c) 2,5-bis(4-methoxyphenyl)-4-amino-1,2,4-triazole [6], (d) 2-(acetyl-
ethoxycarbonyl-methyleno)-3-phenyl-4-(phenylhydrazono)-1,3-thiazolidin-5-one [7],
(e) 1-ethyl-4-(2,4-dinitrophenyl)thiosemicarbazide [8], (f) 3-(3-Propylpyridinio)-2-
methylbenzoathiazolium bromide [9].

4
Nitrogen compounds constitute the largest class of inhibitors for corrosion of steel
in acidic medium. The most effective type of corrosion inhibitors for oil and gas wells
stimulation is film-forming amines and its salts [3]. Long chain aliphatic amines like
hexylamines, octylamines, decylamines, and dodecylamines are effective corrosion
inhibitors in acidic media containing sulfuric acid or hydrochloric acid [10]. The
behavior of quarternary ammonium compounds like tetraethyl ammonium chloride,
tetrabutyl ammonium chloride, benzyltrimethyl ammonium chloride, benzyltriethyl
ammonium chloride, benzyltributyl ammonium chloride, phenyltrimethyl ammonium
chloride, alkylbenzyldimethyl ammonium chloride, tetradecyltrimethyl ammonium
bromide and cetyltrimethyl ammonium bromide was studied in 0.1 M HCl solutions
[3]. It was found that inhibition efficiencies were closely related with the chain length
of the alkyl group as well as the presence of benzene ring in quaternary ammonium
compounds. Maximum inhibition efficiencies of cationic surfactants were observed
around and above critical micelle concentration, while the inhibition efficiencies of
the quaternary ammonium salts were found to increase with the increase in their
concentrations [10]. Cetyltrimethyl ammonium bromide has been identified to be an
effective corrosion inhibitor in both hydrochloric and sulfuric acid environments [11].
The inhibitors generally consist of a mixture of active component along with
surfactant and solvent. Nitrogen compounds and acetylenic alcohols are often used
together to give high levels of protection at elevated temperature and high acid
concentrations [12].
As discussed above, a wide range of corrosion inhibitors formulations have been
developed for carbon steel under acidic medium. However, there are some
disadvantages with the current inhibitor such as difficulty in the preparation method
and the high material cost. Also it has been reported that the lack of their physical
properties data, has limited the design and application of these corrosion inhibitors [4-
9].

5
1.1.1 Ionic Liquids Corrosion Inhibitor
Ionic liquids are generally defined as salts with a melting temperature below the
boiling point of water [13]. Most of the ionic liquids are liquid at room temperature
and are commonly known as room temperature ionic liquids. Ionic liquids are
considered as a good substitute to those volatile organic solvents, because of its low
vapor pressure and thus being environmental friendly. Furthermore, ionic liquids have
many other attractive features, including chemical stability [14], high thermal stability
[15-17], high ionic conductivity [18], and a wide electrochemical potential window
[19]. Ionic liquids have a variety of properties that could potentially make them as
ideal inhibitor for corrosion. For a start, preferred species of ionic liquids have larger
liquid range from ambient temperature up to 300 °C [20]. Additionally, the
preparation of ionic liquids is well known and the favorable viscosity and density
characteristic of ionic liquids is likewise well-documented [21].
Recently, inhibition performance on corrosion of steel in 1 M HCl by ionic
liquids, namely 1-butyl-3-methylimidazolium chlorides, [BMIM]Cl ; 1-butyl-3-
methylimidazolium hydrogen sulfate, [BMIM]HSO4 [22]; 1-butyl-3-
methylimidazolium bromide, [BMIM]Br [23]; 1,3-Dioctadecylimidazolium bromide
and N-Octadecylpyridinium bromide [24] has been investigated using electrochemical
impedance, potentiodynamic polarization and weight loss measurements. These ionic
liquids have showed good inhibition property for the corrosion of steel in 1M HCl
solution and the inhibition efficiency was improved significantly with ionic liquids
concentration. Figure 1.2 shows the structure of these ionic liquids corrosion
inhibitors [22-24].

6
(a) (b)
(c) (d) (e)
Figure 1.2 Ionic liquids inhibitors on steel corrosion in acidic medium (a) 1-butyl-3-
methylimidazolium chlorides, [BMIM]Cl; (b) 1-butyl-3-methylimidazolium hydrogen
sulfate, [BMIM]HSO4 [22]; (c) 1-butyl-3-methylimidazolium bromide, [BMIM]Br
[23]; (d) 1,3-Dioctadecylimidazolium bromide, [C18C18IM]Br; (e) N-
Octadecylpyridinium bromide, [C18Py]Br [24].
1.2 Problem Statement
For industrial implementation, the physical properties of corrosion inhibitor must be
known [25]. A screening of some properties such as density and viscosity of corrosion
inhibitor must be examined and reported together with their efficiency of inhibition.
However, most of the published reports on corrosion inhibitor lack these physical
properties data [4-9].
Even though ionic liquids have been proven as a potential inhibitor on corrosion
of mild steel in acidic medium, there are several considerations when choosing an
inhibitor, namely: (i) cost of the inhibitors which can sometime be very high when the
material involved is expensive or when the amount needed is huge and (ii) availability
of the inhibitor which will determine the selection of it and if the availability is low,
the inhibitor becomes often expensive. As can bee seen from Table 1.1, it is obvious
that 1-methylimidizole, a precursor for the manufacturing of imidazolium based ionic
liquids, is considerably more expensive than the precursor for hydroxyl ammonium
ionic liquids.

7
Table 1.1 Price comparison of some precursor of imidazolium-based and hydroxyl
ammonium ionic liquids
Chemical Package Price (RM)*
Precursor of Hydroxyl Ammonium Ionic Liquids
Monoethanolamine (reagentPlus®, ≥99%) 1 L 290.01
Diethanolamine (99%) 1 L 108.00
N-methyldiethanolamine (>99%) 1 L 134.91
Triethanolamine (>99%) 1 L 292.50
Formic acid (reagent grade, ≥99%) 1 L 498.51
Acetic acid (reagentPlus®, ≥99% ) 1 L 258.51
Propionic acid (reagent grade, ≥99%) 1 L 164.00
Lactic acid (reagent grade, ≥99%) 1 L 125.03
Precursor of Imidazolium-based Ionic Liquids
1-methylimidazole (99.9 %, Aldrich) 1 L 1596.52
n-butyl chloride (Anhydrous, 99.5 %, Aldrich) 1 L 560.01
n-butyl bromide (Anhydrous, 99.5 %, Aldrich) 1 kg 425.50
Ionic Liquids
[BMIM]Cl (dry, ≥ 99.0 %, Fluka) 5 g 498.51
25 g 1720.02
[BMIM]Br (≥ 98.5 %, Fluka) 5 g 512.51
25 g 2142.53
Hydroxyl ammonium ionic liquids NA NA
* Source: www.sigmaaldrich.com (Date of access: 15 July 2011)

8
By the time this compound is processed to the final ionic liquid product, its cost
will have increased to many times than of the commercial acid inhibitor. This is not
helped by the fact that at present there is a very limited market for these compounds,
keeping retail prices high. It is envisaged that if ionic liquid does become widely
accepted, then the cost of production will decrease rapidly. An alternative way is to
find cheaper ionic liquids corrosion inhibitor. Hydroxyl ammonium ionic liquids
could potentially be the alternatives.
Hydroxyl ammonium ionic liquids are a new class of ionic liquids [26-33]. The
first report on synthesis of hydroxyl ammonium ionic liquids was in 2008 [29]. It was
prepared through direct protonation of alkanolamine using organic acid. Hydroxyl
ammonium ionic liquids have been studied as potential solvent for CO2 absorption
[30, 31], removal of SO2 from natural gas [32], and their application in
electrochemical field [33]. However, no substantial information was available on
using hydroxyl ammonium ionic liquids as inhibitors on carbon steel corrosion in
acidic medium. Thus, the project is executed to study the inhibition effect of hydroxyl
ammonium ionic liquids on carbon steel corrosion in hydrochloric acid.
In practical condition, corrosion inhibitors are mixture of active components,
solvents, and surfactant [1, 25]. The corrosion inhibitor is used as its mixture with co-
solvent and surfactant. In acid stimulation of oil and gas wells, before the acid is
injected, it is mixed with the inhibitors solution [1]. Therefore, the corrosion inhibitor
shall compatible with the co-solvent and surfactant used. Among some co-solvent
used in the inhibitor solution, alcohol is widely used due to its stability and non-
reactive against most of corrosion inhibitor [1, 25]. The physical properties of
inhibitor solution, as well as its pure active components, shall be measured for the
new corrosion inhibitor. In this work, the physical properties of hydroxyl ammonium
ionic liquids as new corrosion inhibitor are measured. In addition, the effect of
methanol, ethanol, and 1-propanol on physical properties of ionic liquids is also
reported.

9
Another important parameter to design ionic liquids as corrosion inhibitor is their
inhibition mechanism. Organic corrosion inhibitors, as well as imidazolium ionic
liquids corrosion inhibitor, inhibit the corrosion of through adsorption of themselves
onto surface of carbon steel [22-24]. Their adsorption is affected by concentration
used and temperature. Therefore, the inhibition mechanism of the hydroxyl
ammonium ionic liquids in acidic media is proposed.
1.3 Research Objectives and Scope of Study
The objectives of this research are to synthesis and characterize hydroxyl ammonium
ionic liquids, and to study the potential application of these ionic liquids as inhibitor
on carbon steel corrosion in acidic medium. The objectives and scope of research
approaches will be discussed in the following:
1. Synthesis and Characterization of Hydroxyl Ammonium Ionic Liquids
For this study, sixteen hydroxyl ammonium ionic liquids are synthesized and
characterized. Alkanolamines such as monoethanolamine (MEA), diethanolamine
(DEA), methyldiethanolamine (MDEA), and triethanolamine (TEA) are used as
cation sources while organic acids such as acetic, formic, lactic, and propionic acid
are used as anion sources. The synthesis is carried out by direct protonation of
alkanolamines with acid. The characterizations of synthesized ionic liquids are carried
out using spectroscopies 1H-NMR, 13C-NMR, Infrared, Elemental Analysis, and water
content. Spectroscopies NMR and infrared are used to study structure of all ionic
liquids synthesized in the present work. Elemental analysis is used to determine the
Carbon, Hydrogen, and Oxygen composition of ionic liquids, while measurement of
water content is used to determine the water content and purity of synthesized ionic
liquids.

10
2. Measurement of Physical Properties of Synthesized Ionic Liquids
In the present work, density, viscosity, and refractive index of the ionic liquids bis(2-
hydroxyethyl)ammonium formate, [BHEAF], and its binary mixture with alcohol C1-
C3 are measured under atmospheric pressure within a whole composition range and at
different temperature. Ionic liquids [BHEAF] is chosen as model for ionic liquids in
binary mixture with solvent because it demonstrates the highest efficiency of
inhibition compare to other studied ionic liquids in this research.
3. Measurement of Inhibition Efficiency of The Synthesized Ionic Liquids on
Carbon Steel Corrosion in Acidic Medium
In this research, the inhibition efficiency is measured using two methods, namely,
weight loss and electrochemical, within different concentrations of ionic liquids and at
different temperatures. The concentration of ionic liquids is ranged from 0.02 to 0.08
M while temperature is ranged from (298.15 – 343.15) K. The inhibition efficiencies
are discussed by looking at the effect of cation and anion of ionic liquids,
concentration of ionic liquids, and temperature of solution. The present study is also
devoted to understanding the process of corrosion inhibition by proposing inhibition
mechanism of hydroxyl ammonium ionic liquids for carbon steel corrosion under
acidic media.
1.4 Thesis Layout
Chapter 1 provides the reader with background knowledge of corrosion inhibitor and
describes the motivation behind using ionic liquids as inhibitor on corrosion of carbon
steel in acidic medium. The objective and scope of research is also provided.
Chapter 2 presents a detailed review of literature to support the present work. This
chapter is divided into three sub chapters. The first sub chapter summarizes review of
literature related to synthesis and characterization of ionic liquids. In the second sub
chapter, a description on various techniques typically used in literature to measure
physical properties of pure ionic liquids and binary mixture containing ionic liquids is
11
discussed. A current research on using ionic liquids as inhibitors on steel corrosion in
acidic medium is presented in third subchapter.
Chapter 3 presents research methodology used in the present work. The list of
chemicals and apparatus used in this study to synthesis and characterize ionic liquids
are also given along with the detail experimental procedures. It also highlights the
experimental procedures, methodology, and basis for calculating inhibition efficiency
of ionic liquids on carbon steel corrosion in acidic medium.
Chapter 4 presents experimental results on synthesis and physical properties of
ionic liquids. This chapter is divided into three subchapters. In the first subchapter, the
analysis for synthesis and characterization of ionic liquids studied, include the
spectrum 1H-NMR and 13C-NMR, Infrared, elemental analysis, and water content of
the synthesized ionic liquids is presented. The spectroscopies methods, namely NMR
and FTIR are used to analyze structure of synthesized Ionic liquids, while elemental
analysis and measurement of water content are used to analyze the composition and
purity of the synthesized ionic liquids, respectively. The second subchapter presents
the results on measurement of physical property such as density, viscosity, and
refractive index of ionic liquids. The temperature dependence of physical properties
of ionic liquids is correlated using semi empirical equation. The third subchapter
presents the effect of alcohol on properties of ionic liquids [BHEAF]. The excess
thermodynamic properties are calculated to understand the interaction of ionic liquids
and alcohol.
Chapter 5 focuses on the application of the ionic liquids as inhibitor on corrosion
of carbon steel in acidic medium. The results are discussed using analysis of weight
lost, potentiodynamic, and electrochemical impedance spectroscopy. The performance
of corrosion inhibition of the ionic liquids are discussed in reference to the effect of
cation and anion of ionic liquids, concentration of ionic liquids, effect of cosolvent
and temperature. The mechanism of inhibition and its thermodynamic aspect are
analyzed based on the adsorption phenomena.
Chapter 6 presents the conclusions of the present research work and few
recommendations for future work.


CHAPTER 2
LITERATURE REVIEW
2.1 Ionic Liquids
Ionic liquids are generally defined as salts with a melting temperature below the
boiling point of water [13]. Most of the ionic liquids are liquid at room temperature
and are commonly known as room temperature Ionic liquids (RTIL). Ionic liquids are
considered as a good substitute to the volatile organic solvents, because of its low
vapor pressure [14] and thus being environmental friendly. Furthermore, ionic liquids
have many other attractive features, including chemical stability [14], high thermal
stability [15-17], high ionic conductivity [18] and a wide electrochemical potential
window [19].
Ionic liquids usually consist of nitrogen-containing organic cation combined with
inorganic or organic anions. Figure 2.1 shows the common cation and anion for ionic
liquids. Common cation for ionic liquids includes dialkyimidazolium,
alkylpyridinium, tetraalkylammonium, and tetraalkylphosphonium. The R group
usually represents alkyl chain, but the other functional groups such as aralkyl, amine
and hydroxyl can also present. Common anion includes chloride (Cl-), bromide (Br-),
hexafluorophosphate (PF6-), tetrafluoroborate (BF4
-), nitrate (NO3-), acetate
(CH3COO-), and bis(trifluoromethylsulfonyl)imide ((CF3SO2)2N-).

14
Figure 2.1 Structure of common cations and anions used for ionic liquids (a)
dialkyimidazolium (b) alkylpyridinium (c) tetraalkyl ammonium (d)
tetraalkylphosphonium. R is representing alkyl etc. and X- could be Cl, Br, PF6, BF4,
NO3, CH3COO, SO4, and (CF3SO2)2N.
Ionic liquids have attracted rising interest in the last decades with a diversified
range of applications. The types of ionic liquid available have also been extended to
include new families and generations of ionic liquids with more specific and targeted
properties. This expanding interest has led to a number of reviews on their physico-
chemical properties, the design of new families of ionic liquids, the chemical
engineering, and the wide range of arrangements in which ionic liquids have been
utilized and piloted for industrial developments [34, 35].
1. Ionic liquids as alternatives to organic solvents
Ionic liquids are beginning to be used as alternatives to organic solvents. Wide ranges
of ionic liquids have been used as solvent and catalyst for a number of different
organic reactions. The use of Ionic liquids in organic synthesis typically involved
many ionic liquids to achieve the desired activity such as alkylation of benzene [36-
39], alkylation of naphthalene [40, 41], Friedel-Crafts acylation of aromatics [42-45],
hydroformylation with carbon dioxide [46, 47], organocatalysis [48], hydrogenation
[49] , and esterification [50-55].

15
2. Ionic liquid in catalysis
Soluble ionic liquids have recently been used as supports for catalyst/reagent
immobilization and synthesis in homogeneous solution phase. The wide range of ionic
liquid supports available makes their use as supports compatible with most common
chemistries [56-64]. The solubility properties of these ionic-liquids can be tuned by
the variation made in the cations and anions used to make their phase separation
possible from less polar organic solvents and aqueous media. The ionic-liquid-
supported species can therefore be purified from the reaction mixture by simple
washings. Ionic-liquid-supported catalysts and reagents have been prepared and used,
and they are easily recovered and reused [65].
3. Ionic liquids in separation
The unique properties of modern imidazolium-based ionic liquids such as high
viscosity, broad liquid range, high thermostability, low volatility, good wetting ability
for fused silica capillary, and the possibility of multiple interactions with a variety of
solutes make them suitable to be used as gas chromatography stationary phases coated
on fused silica capillary columns [66-68]. Ionic liquids also have potential application
as selective additives in extractive distillation. Adding ionic liquids to an azeotropic
mixture has been shown to break the azeotrope and increase relative volatility of the
mixture allowing for an easier separation [69-71]. Ionic liquids 1,3-
Dimethylimidazolium methylsulfate [MMIM]MeSO4 is suitable for use as solvent in
the petrochemical extraction process for the removal of ethanol from its mixture with
hexane [72].
4. Ionic liquids in electrochemical devices and processing
Many ionic liquids offer a range of properties that make them attractive to the field of
electrochemistry [73]. A variety of electrochemical devices including solar cells [74,
75], high energy density batteries [76-78], fuel cells [79, 80], and super capacitors
[81, 82] have become of immense interest as part of the various solutions proposed to
continue sustaining the energy supply for current and future generation.

16
5. Gas solubility in ionic liquids
Study on gas solubility in ionic liquids have been conducted extensively [20, 30, 31,
83-90]. As ionic liquids are non-volatile, they could be easily separated and would not
pose any contamination to a gas stream. This feature gives ionic liquids an advantage
over traditional solvents used for absorbing gases [20].
6. Ionic liquids as corrosion inhibitor
Despite the rapid increasing number of papers describing the applications of ionic
liquids, there are relatively few papers reported on using ionic liquids as inhibitor on
corrosion of carbon steel in acidic medium [22-24]. Application of ionic liquids as
corrosion inhibitor is given in section 2.3.1.1. To expand our knowledge in ionic
liquids as corrosion inhibitor, it is thought worthwhile to study the corrosion
inhibition behavior of hydroxyl ammonium ionic liquids on carbon steel corrosion in
hydrochloric acid.
2.1.1 Synthesis of Ionic Liquids
The increasing interest in ionic liquids, especially in the light of their recent
widespread commercial availability, has resulted in further developments in their
synthesis and purification [13]. A subset of ionic liquids are protic ionic liquids,
which are easily produced through the combination of a Brønsted acid and Brønsted
base. In fact, the story of ionic liquids is generally regarded as beginning with the first
report on the preparation of protic ionic liquids ethylammonium nitrate in 1914 [91].
The same method has been applied to prepare other protic ionic liquids [29, 92-95].
The synthesis of ionic liquids can be divided into two steps: (i) formation of the
desired cation, and (ii) anion exchange to form the desired product. In some cases
only the first step is required, as with the formation of ethylammonium nitrate. In
other case, where the desired anion could not be formed directly from the first step,
the second step is needed which involves anion exchange. Figure 2.2 illustrates the
general formation of ionic liquids. Example of these is 1-butyl-3-methylimidazolium

17
chloride, [BMIM]Cl. The ionic liquid is formed through the first step only which the
product can be used to form 1-butyl-3-methylimidazolium tetrafluoroborate
[BMIM]BF4, using the second step involving anion exchange.
Figure 2.2 General method to synthesis ionic liquids. (1) Quarternization of the cation
by alkylation using alkyl halide (2) anion metathesis to form desired anion.
The following section focuses on the preparation of the protic ionic liquids, as the
hydroxyl ammonium ionic liquids falls into this category. Protic ionic liquids stand
out from other ionic liquids and many other solvents, because of its water like
properties in that it can form a three-dimensional hydrogen bonded network and has
an equal number of hydrogen donor and acceptor sites [27].
2.1.1.1 Synthesis of Protic Ionic Liquids
Protic ionic liquids are formed through the transfer of a proton from a Brønsted acid
to Brønsted base. This leads to its distinguish features from the other ionic liquids,
i.e., it has a proton available for hydrogen bonding. The protonation process to form
desired protic ionic liquids possesses the advantages which among others are: (i) a
wide range of cheap cation sources such as ammonium, and (ii) the protonation
reactions generally spontaneous at room temperature. The most common method for
the formation of such ionic liquids is simple mixing of the Brønsted acid to Brønsted
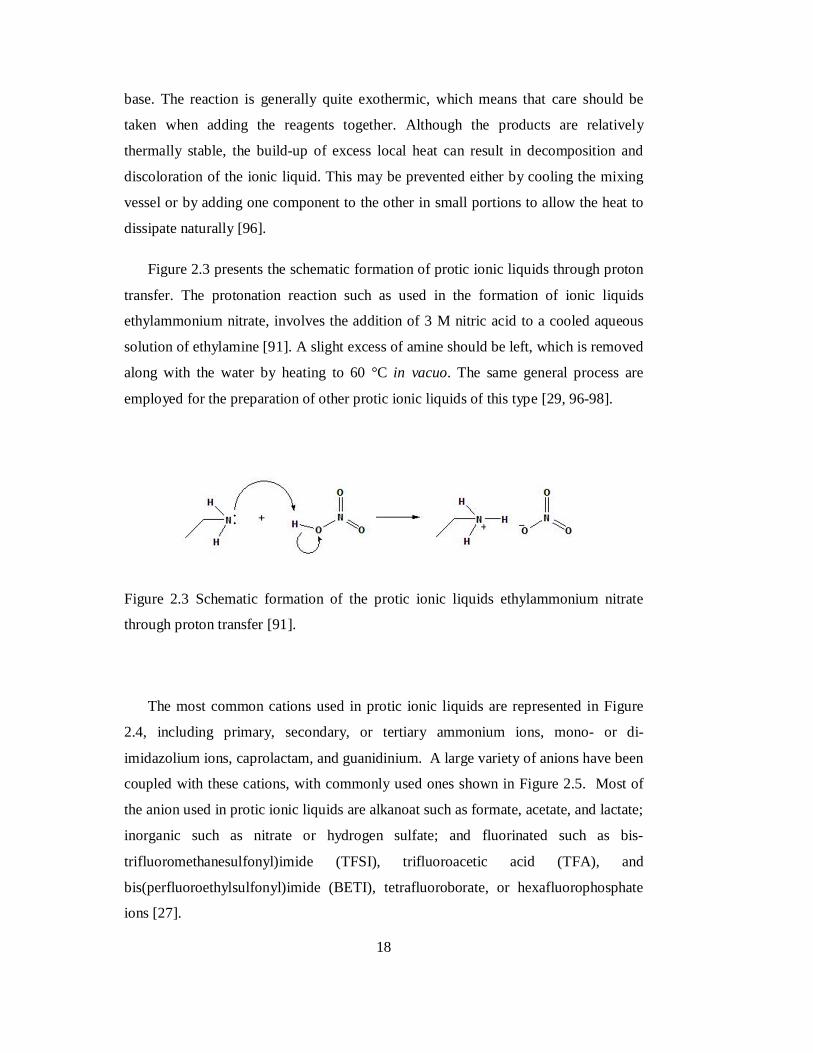
18
base. The reaction is generally quite exothermic, which means that care should be
taken when adding the reagents together. Although the products are relatively
thermally stable, the build-up of excess local heat can result in decomposition and
discoloration of the ionic liquid. This may be prevented either by cooling the mixing
vessel or by adding one component to the other in small portions to allow the heat to
dissipate naturally [96].
Figure 2.3 presents the schematic formation of protic ionic liquids through proton
transfer. The protonation reaction such as used in the formation of ionic liquids
ethylammonium nitrate, involves the addition of 3 M nitric acid to a cooled aqueous
solution of ethylamine [91]. A slight excess of amine should be left, which is removed
along with the water by heating to 60 °C in vacuo. The same general process are
employed for the preparation of other protic ionic liquids of this type [29, 96-98].
Figure 2.3 Schematic formation of the protic ionic liquids ethylammonium nitrate
through proton transfer [91].
The most common cations used in protic ionic liquids are represented in Figure
2.4, including primary, secondary, or tertiary ammonium ions, mono- or di-
imidazolium ions, caprolactam, and guanidinium. A large variety of anions have been
coupled with these cations, with commonly used ones shown in Figure 2.5. Most of
the anion used in protic ionic liquids are alkanoat such as formate, acetate, and lactate;
inorganic such as nitrate or hydrogen sulfate; and fluorinated such as bis-
trifluoromethanesulfonyl)imide (TFSI), trifluoroacetic acid (TFA), and
bis(perfluoroethylsulfonyl)imide (BETI), tetrafluoroborate, or hexafluorophosphate
ions [27].

19
Figure 2.4 Structure of common cations used in protic ionic liquids. (a) primary,
secondary, or tertiary ammonium cations, (b) 1-alkylimidazolium cations, (c) 1-alkyl-
2-alkylimidazolium cations, (d) caprolactam, and (e) 1,1,3,3-tetramethylguanidinine.
Figure 2.5 Structure of common anions used in protic ionic liquids. (a) carboxylates,
(b) trifluoroacetate, (c) bis(perfluoroethylsulfonyl)imide, (d) bis(trifluoromethane
sulfonyl)imide, (e) nitrate, and (f) hydrogen sulfate.

20
2.1.2 Purification of Ionic Liquids
The extremely low vapor pressure of the ionic liquids prevents its purification by
distillation. The counterpoint to this is that any volatile impurity can, in principle, be
separated from an ionic liquid by distillation. In general, it is better to remove as
many impurities as possible from the starting materials and, where possible, to use
synthetic methods that either generate as few side products as possible, or allow their
easy separation from the final ionic liquid product [13].
The presence of impurities in an ionic liquid may have different origins. It may
result from solvents used during formation of desired cation on their synthesis, from
unreacted starting materials of the protonation reaction or from any volatile organic
compound previously dissolved in the ionic liquid. In theory, volatile impurities can
be easily removed from the non-volatile ionic liquid by simple evaporation. However,
sometimes this process can take a considerable time. Factors that influence the time
required for the removal of all volatiles from an ionic liquid (under a given
temperature and pressure) are the following: (i) the amount of volatiles; (ii) their
boiling points; (iii) the viscosity of the ionic liquid, (iv) the surface of the ionic liquid
and – probably most important – (v) their interactions with the ionic liquid [13].
The removal of starting materials is generally achieved easily by heating the ionic
liquid under vacuum. Water is generally one of the most problematic to component to
be removed, and it is generally recommended that ionic liquids are heated to at least
70 °C for several hours with stirring to achieve an acceptably low degree of water
contamination. Thus it is advised that all liquids are dried directly before use. If the
amount of water present is of importance, this may be determined using Karl–Fischer
titration. The presence of water in an ionic liquid may be a problem for some
applications. In all cases one should know the approximate amount of water in the
ionic liquid used. Depending on the application, one should be aware of the fact that
water in the ionic liquid may not be inert. Moreover, the presence of water can have
significant influence on the physicochemical properties of the ionic liquids. Therefore,
it is very important to measure the water content of ionic liquids.

21
2.2 Physical Properties of Ionic Liquids
Inhibitor selection begins with the choice of physical properties [1] such as melting
and freezing point, degradation, and compatibility with the co-solvent. This list can be
extensive, but is important because it defines the domain of possible inhibitors. It
must be the first step of the inhibitor evaluation for any new system. These physical
measurements are those routinely done as part of minimal quality acceptance testing.
Therefore, it is important to measure the physical properties of hydroxyl ammonium
ionic liquids as new corrosion inhibitor.
In addition to measurement of physical properties of new corrosion inhibitor, it is
also expected to check the compatibility with co-solvent and their physical properties
[1, 25]. In practical condition, corrosion inhibitors are mixture of active components,
solvents, and surfactant [1]. The corrosion inhibitor is used as its mixture with co-
solvent and surfactant. Therefore, the corrosion inhibitor shall compatible with the co-
solvent and surfactant used. Among some co-solvent used in the inhibitor solution,
alcohol is widely used due to its stability and non-reactive against most of corrosion
inhibitor [1]. Thus, the physical properties of inhibitor solution, as well as its pure
active components, shall be measured for the new corrosion inhibitor.
Measurement of physical properties such as density, viscosity, and refractive
index of ionic liquids and its binary mixture with solvent has a large range of uses in
the study of the thermodynamic properties of ionic liquids. The change in density,
viscosity, and refractive index upon mixing two miscible liquids tells much about the
solvent-solute interactions that have occurred. Relative changes in density, viscosity,
and refractive index as a function of temperature and concentration related to the free
energy of solute-solvent system and are thus important in the study of
thermodynamic. Physical properties of various liquids with different ionic liquids are
becoming more widely available in the literature. Binary mixture containing ionic
liquids with alcohol [106, 107], alkenes [108], aromatic [109], water [100], and other
organic solvent [110, 111] have been reported.

22
2.2.1 Density
Solvent density, ρ, is an important physical property. This is a particularly used in
preparation of specific concentration of ionic liquids in the inhibitor solution. The
most direct way of determining density is by combining measurements of the mass of
a substance with measurement of its volume. Apparatus based on this method are
weighed syringes, pycnometers, and vibrating-tube densimeter [112].
Initial research on the properties of pure ionic liquids concentrated on developing
and understanding the relationship between the nature and structure of the cation and
anion and the changes in the physical properties [99]. The purity of an ionic liquid is a
very important issue when measuring physical properties. Physical properties of pure
ionic liquids such as density, viscosity, and refractive index are increasingly published
in the literature [21]. Considerable amounts of data on the density of ionic liquids are
available in the literature. Ionic liquids are generally denser than either organic
solvents or water, with typical density values ranging from 1 to 1.6 g·cm-3 [100-102].
Given that many of the ionic liquids have a heavy anion it would be expected that
their density would be relatively high when compared to organic solvents. Table 2.1
presents density data for ionic liquids and organic solvents at room temperature. As
can be seen from Table 2.1, the densities of ionic liquids are higher compared to
organic solvent. It also can be seen from Table 2.1, as the alkyl chain length on the
imidazolium cation increases from C4 to C8, the density of the corresponding ionic
liquids decreases. It has been speculated that the addition of alkyl group to the
imidazolium ring results in a reduction of the density for the imidazolium ionic
liquids [113]. One possible explanation for this discrepancy is that the densities of
ionic liquids are governed by van der Waals forces as well as electrostatic
interactions. [113]. The addition of two CH2 groups to the cation increases the size of
the ion, thereby decreasing the electrostatic attraction between the cation and anion.
The additional CH2 groups will also increase the dielectric shielding of the charges.
These combined effects will cause density to decrease more rapidly [113].
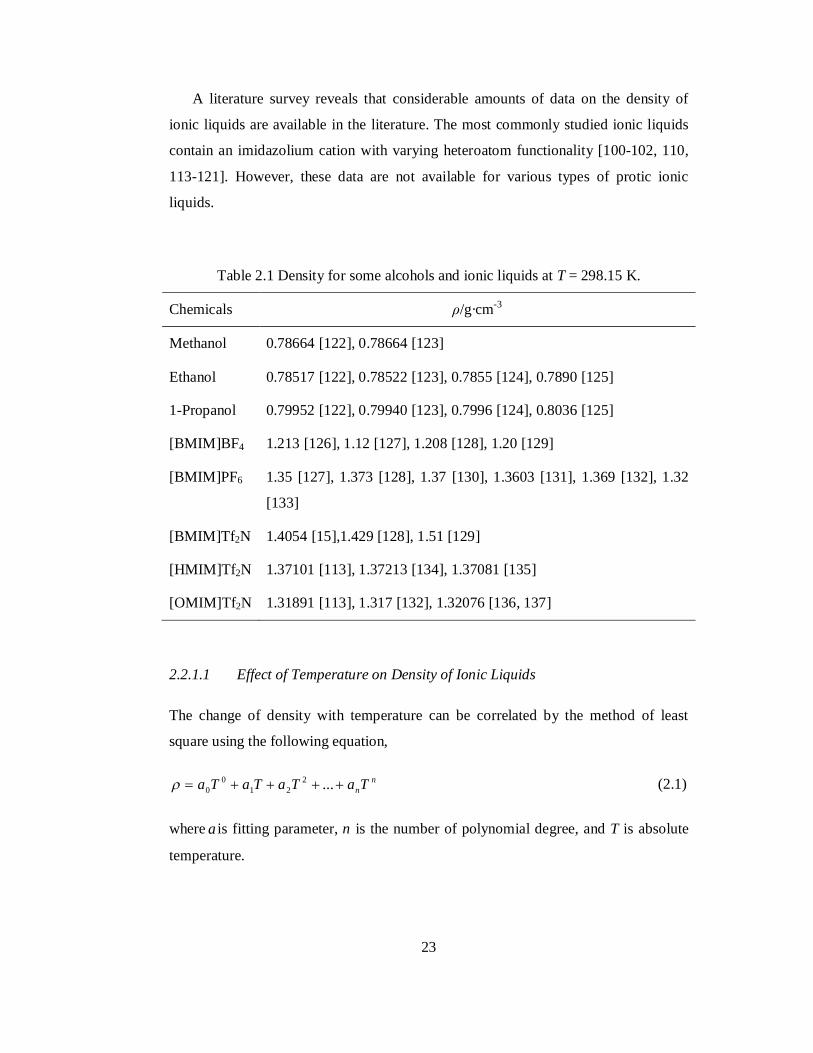
23
A literature survey reveals that considerable amounts of data on the density of
ionic liquids are available in the literature. The most commonly studied ionic liquids
contain an imidazolium cation with varying heteroatom functionality [100-102, 110,
113-121]. However, these data are not available for various types of protic ionic
liquids.
Table 2.1 Density for some alcohols and ionic liquids at T = 298.15 K.
Chemicals ρ/g·cm-3
Methanol 0.78664 [122], 0.78664 [123]
Ethanol 0.78517 [122], 0.78522 [123], 0.7855 [124], 0.7890 [125]
1-Propanol 0.79952 [122], 0.79940 [123], 0.7996 [124], 0.8036 [125]
[BMIM]BF4 1.213 [126], 1.12 [127], 1.208 [128], 1.20 [129]
[BMIM]PF6 1.35 [127], 1.373 [128], 1.37 [130], 1.3603 [131], 1.369 [132], 1.32
[133]
[BMIM]Tf2N 1.4054 [15],1.429 [128], 1.51 [129]
[HMIM]Tf2N 1.37101 [113], 1.37213 [134], 1.37081 [135]
[OMIM]Tf2N 1.31891 [113], 1.317 [132], 1.32076 [136, 137]
2.2.1.1 Effect of Temperature on Density of Ionic Liquids
The change of density with temperature can be correlated by the method of least
square using the following equation,
nnTaTaTaTa ...2
210
0 (2.1)
where a is fitting parameter, n is the number of polynomial degree, and T is absolute
temperature.
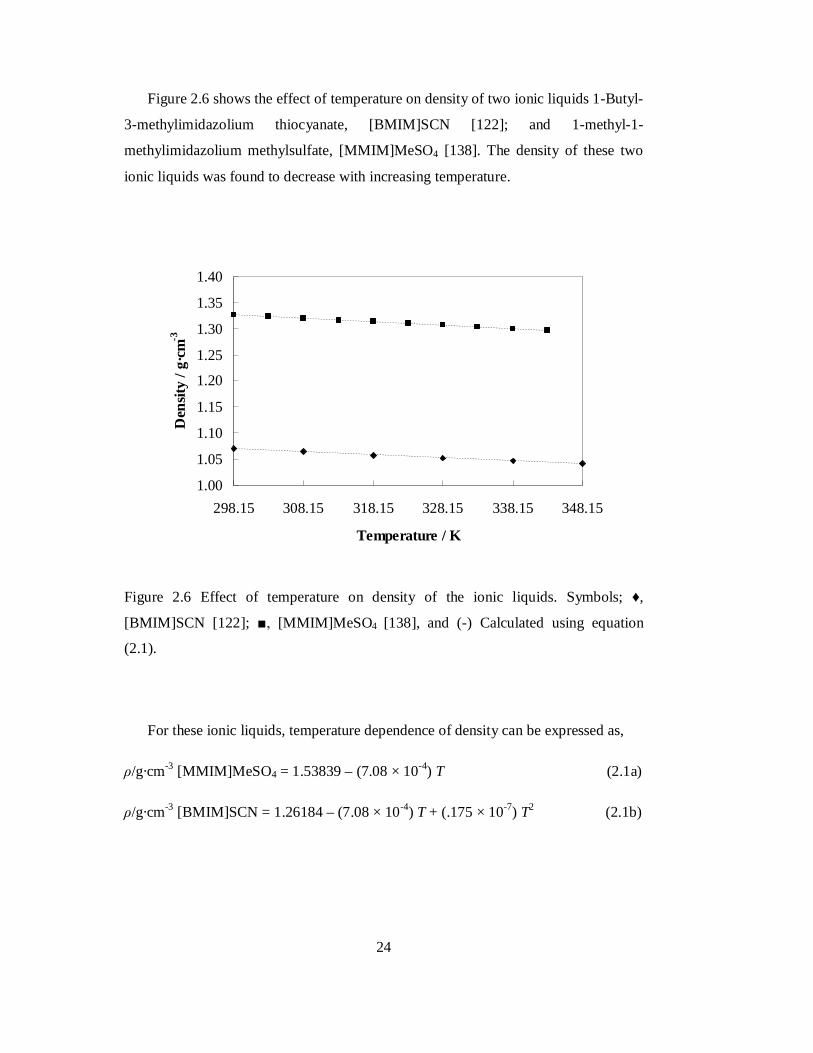
24
Figure 2.6 shows the effect of temperature on density of two ionic liquids 1-Butyl-
3-methylimidazolium thiocyanate, [BMIM]SCN [122]; and 1-methyl-1-
methylimidazolium methylsulfate, [MMIM]MeSO4 [138]. The density of these two
ionic liquids was found to decrease with increasing temperature.
Figure 2.6 Effect of temperature on density of the ionic liquids. Symbols; ♦,
[BMIM]SCN [122]; ■, [MMIM]MeSO4 [138], and (-) Calculated using equation
(2.1).
For these ionic liquids, temperature dependence of density can be expressed as,
ρ/g·cm-3 [MMIM]MeSO4 = 1.53839 – (7.08 × 10⁻⁴) T (2.1a)
ρ/g·cm-3 [BMIM]SCN = 1.26184 – (7.08 × 10⁻⁴) T + (.175 × 10-7) T2 (2.1b)
1.00
1.05
1.10
1.15
1.20
1.25
1.30
1.35
1.40
298.15 308.15 318.15 328.15 338.15 348.15
Temperature / K
Den
sity
/ g·c
m-3

25
2.2.1.2 Coefficient of Thermal Expansion
The density-temperature dependence leads to another thermodynamic property, a
coefficient of thermal expansion [112]. Coefficient of thermal expansion is the
tendency of matter to change in volume in response to a change in temperature. When
a substance is heated, its particles begin moving and become active thus maintaining a
greater average separation. Coefficient of thermal expansion α can be defined as,
PP TTV
V
11
(2.2)
under condition of constant pressure. Thus α can be used to estimate the relative
change in volume of liquid for a 1 K increase in temperature. For the ionic liquids
[BMIM]SCN and [MMIM]MeSO4 , α = 4 × 10⁻⁴ and 5 × 10⁻⁴ K-1 at 298.15 K,
respectively [122, 138].
2.2.2 Viscosity
Viscosity is an important transport property of matter, expressing its resistance to
irreversible deformation. More specifically, this property reflects the extent to which
relative motion of adjacent liquid layers is retarded and it can be generally regarded as
a measure of internal friction of the liquid [112]. From the engineering aspect, the
viscosity of ionic liquids can affect transport properties such as diffusion and may be
an issue in practical industrial applications [103-105]. It plays a major role in stirring,
mixing and pumping operations. The viscosity of many ionic liquids is relatively high
compared to conventional solvents, one to three orders of magnitude higher.
Experimentally determined viscosities are generally reported as either absolute
viscosity η or kinematics viscosity υ. The relationship between absolute viscosity η,
density ρ, and kinematics viscosity υ is given by,
/ (2.3)

26
The unit of absolute viscosity is the Poise (P/g·cm-1s-1) while the unit for kinematics
viscosity is the Stoke (St/cm2s-1). Several techniques to determine viscosity of liquid
based on this method are (1) poiseuille-type viscometers, (2) coutte-type rotational
viscometers, (3) Stokesian and falling body viscometers, and (4) dynamic
viscometers.
Ionic liquids are more viscous than most common molecular solvent. Table 2.2
presents viscosities of some selected ionic liquids. As can be seen in Table 2.2, within
a series of imidazolium ionic liquids containing the same cation, changing the anion
clearly impact the viscosity. This trend does not exactly correlate with anion size.
This may be due to importance of the effect of other anion properties on the viscosity,
such as their ability to form hydrogen bonding with the cation. The viscosity of ionic
liquids is also affected by identity of the cation. For ionic liquids with the same anion
the trend is larger alkyl substituent on cation lead to more viscous ionic liquids.
Table 2.2 Viscosity of some organic solvents and ionic liquids at T = 298.15 K
Chemicals η/mPa·s
Methanol 0.543 [123], 0.577 [122],
Ethanol 1.085 [123], 1.09 [122], 1.082 [124], 1.0569 [125]
1-Propanol 1.951 [123], 1.94 [122], 2.017 [124], 2.1178 [125]
[BMIM]BF4 75 [130], 219 [42, 84, 84], 180 [29, 15], 119.78 [19], 233 [12]
[BMIM]PF6 182 [130], 397 [83, 84], 450 [83], 312 [42]
[BMIM]Tf2N 87 [130]
[HMIM]Tf2N 68 [134]
[OMIM]Tf2N 96 [139]
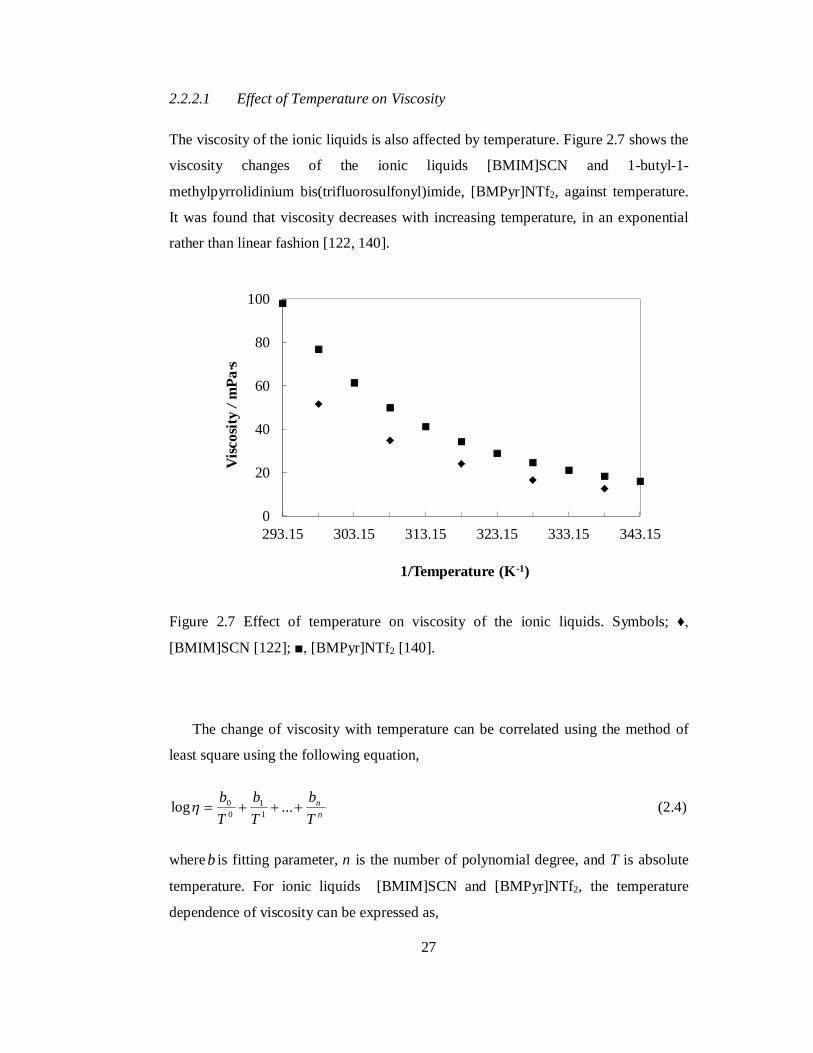
27
2.2.2.1 Effect of Temperature on Viscosity
The viscosity of the ionic liquids is also affected by temperature. Figure 2.7 shows the
viscosity changes of the ionic liquids [BMIM]SCN and 1-butyl-1-
methylpyrrolidinium bis(trifluorosulfonyl)imide, [BMPyr]NTf2, against temperature.
It was found that viscosity decreases with increasing temperature, in an exponential
rather than linear fashion [122, 140].
Figure 2.7 Effect of temperature on viscosity of the ionic liquids. Symbols; ♦,
[BMIM]SCN [122]; ■, [BMPyr]NTf2 [140].
The change of viscosity with temperature can be correlated using the method of
least square using the following equation,
nn
Tb
Tb
Tb
...log 11
00 (2.4)
where b is fitting parameter, n is the number of polynomial degree, and T is absolute
temperature. For ionic liquids [BMIM]SCN and [BMPyr]NTf2, the temperature
dependence of viscosity can be expressed as,
0
20
40
60
80
100
293.15 303.15 313.15 323.15 333.15 343.15
Visc
osity
/ mPa
·s
1/Temperature (K-1)

28
log η/mPa·s [BMIM]SCN = T
69.15956364.3 (2.4a)
log η/mPa·s[BMPyr]NTf2 = 2
5391671.1837983.3TT
(2.4b)
Figure 2.8 Experimental and predicted viscosity for ionic liquids. Symbols;
[BMIM]SCN [122]; ■, [BMPyr]NTf2 [140], (--) Calculated using equation (2.4).
2.2.3 Refractive Index
Refractive index, nD, is a fundamental physical property of a substance. It is often
used to identify a particular substance, confirm its purity, or measure its concentration
in mixture [129]. Table 2.3 presents the refractive index of some organic solvent and
ionic liquids. As can be seen from Table 2.3, refractive indexes of ionic liquids are
higher than common organic solvents. It can be used to identify the presence of ionic
liquids in its binary mixture with organic solvents.
0.70
1.05
1.40
1.75
2.10
0.0028 0.0029 0.0030 0.0031 0.0032 0.0033 0.0034
log
(visc
osity
) / m
Pa·s
1/Temperature (K-1)

29
Table 2.3 Refractive index of some organic solvents and ionic liquids at temperature
298.15 K
Chemicals nD
Methanol 1.3269 [104], 1.32687 [123], 1.32687 [141], 1.3272 [142]
Ethanol 1.3593 [143], 1.35960 [123]
1-Propanol 1.38302 [123]
[BMIM]BF4 1.42 [129], 1.4626 [144], 1.4219 [145], 1.4197 [146]
[BMIM]PF6 1.411 [12], 1.409 [83]
[BMIM]Tf2N 1.4271 [128]
[HMIM]Tf2N 1.42958 [134]
[OMIM]Tf2N 1.43329 [136], 1.43331 [137]
2.2.3.1 Effect of Temperature on Refractive Index
The refractive index of the ionic liquids is also affected by temperature. Figure 2.9
shows the refractive index values of the ionic liquids 1-ethyl-3-methylpyridinium
ethylsulfate, [empy][EtSO4] at several temperatures [147]. As can be seen in Figure
2.8, the refractive index of [empy][EtSO4] decreases with increased in the
temperature, in a linear fashion.
The change of refractive index with temperature can be correlated using the
method of least square using the following equation,
nnD TcTcTcTcn ...2
21
10
0 (2.5)
where c is the fitting parameter and T is the absolute temperature.

30
Figure 2.9 Effect of temperature on refractive index of ionic liquids [empy][EtSO4]
[147]. Symbols; ◊, density; (-) correlation using equation (2.5).
For the ionic liquids [empy][EtSO4], the temperature dependence of refractive
index can be expressed as,
TnD 0003.05915.1 (2.5a)
2.2.4 Effect of Co-solvent on Physical Properties of Ionic Liquids
In practical condition, corrosion inhibitors are mixture of active components, solvents,
and surfactant [1]. The corrosion inhibitor should be compatible with co-solvent and
surfactant used. Alcohol is widely used as co-solvent for inhibitor solution because it
does not react or interfere with the active component. In this work, alcohol such as
methanol, ethanol, and 1-propanol are chosen as co-solvent. The following section
discusses the literature review on physical properties of binary mixture of ionic
liquids with alcohol.
1.49
1.50
1.50
1.51
1.51
298.15 308.15 318.15 328.15 338.15
Ref
ract
ive
Inde
x
Temperature / K

31
2.2.4.1 Density of Binary Mixture and Volumetric Properties
The volume of mixture of two liquids will not equal the sum of the volumes of its
pure constituents for a combination of up to reasons: (1) size differences between
solvent and solute molecules, (2) shape differences between solvent and solute
molecules, (3) structural changes in the molecular ordering of the liquid, (4)
interaction differences between like and unlike molecules, and (5) chemical reactions
[112].
If a component (1) and component (2) are brought together but not allowed to
mix, the total volume V of (1) and (2) is,
022
011
0 VnVnV (no mixing) (2.6)
where 1n and 1n are the number of moles of component (1) and (2), respectively. If
mixing takes place, the volume changes from V0 to V. This change can be defined as
the excess volume,
0VVV E (mixing) (2.7)
It is more convenient to write equation (2.4) in terms of excess molar volumes,
21 nnVV
EE
m (2.8)
Combining equation (2.3) and (2.5) gives,
022
011 VxVxVV m
Em (2.9)
or
2
22
1
112211
MxMxMxMxV
mix
Em (2.10)
where mix is density of mixture, iM is the molar mass of the pure component, and
ix is the mole fraction of component. The values of EmV depend on temperature and

32
pressure. Experimental determination of EmV can be accomplished in two ways. One
can measure the actual volume change upon mixing, using special mixing or batch-
type dilatometers. Alternatively, one can measure changes in density using any of
several appropriate techniques. Of these, the vibrating-tube densimeter has become
the most popular technique.
Excess molar volumes are useful as a way of describing the mixture of miscible
liquids throughout the entire range of mixing ratios (0 ≤ x ≤ 1). Several studies have
been conducted to describe the solvent-solute interaction on mixing ionic liquids with
solvent. The binary mixture of ionic liquids with alcohol [106, 122, 148-151], water
[150, 152, 153], aromatic compound [115] and other organic solvent have been
studied extensively [143].
The excess molar volume can be correlated well with composition using Redlich-
Kister polynomial equation [154], which for binary mixture is,
kji
kkjiij xxAxxQ )(
0
(2.11)
where xi is the mole fraction of component i, Ak is the polynomial coefficient, and k is
the order of polynomial, which are estimated using the method of least squares.
Redlich-Kister polynomial equation, together with excess molar volume, is useful
quantity for the description of two completely miscible liquids. To provide a
quantitative description for mixing in such cases, one can amend equation (2.6) to
account for mixing by defining volume molar partial of component 1 and 2, Vm,1 and
Vm,2 , respectively, in binary mixtures using the following equation,
PT
EmE
mm xVxVVV
,2
011,
(2.12)
PT
EmE
mm xVxVVV
,1
022,
(2.13)
The derivatives in equation (2.12) and (2.13) are obtained by differentiation of
equation (2.6). It leads to the following equation,

33
121
0
22121
0
221,1, 2)(
i
kk
k
kkmm xxkAxxxxAxVV
(2.14)
121
02
2121
0
212,2, 2)(
i
kk
k
kkmm xxkAxxxxAxVV (2.15)
Much of the present interest is focused on the partial molar volume at infinite
dilution. The partial properties at infinite dilution are of interest since, at the limit of
infinite dilution, the solute–solute interactions disappear. The values of the partial
molar volume at infinite dilution provide information about solute–solvent interaction,
independent of the composition effect. Therefore, from equation (2.14), by setting x2 =
1 and x1 = 0,
0
011,
kkm AVV (2.16)
Similarly, setting x2 = 0 in equation (2.15), it gives
0
*22, )1(
k
kkm AVV (2.17)
Equations (2.16) and (2.17) represent the partial molar volumes of component 1, 1,mV ,
and component 2, 2,mV , at infinite dilution, respectively. The partial molar volumes
are calculated using the Redlich-Kister equation (2.11).
The Redlich–Kister coefficients can be excluded from the determination of the
partial molar volumes at infinite dilution by using “the apparent molar volume”
approach. The apparent molar volumes of component 1 in component 2, 1,V , and the
apparent molar volumes of component 2 in component 1, 2,V , can be expressed as,
1
2,21, x
VxVV mm
(2.18)

34
2
1,12, x
VxVV mm
(2.19)
in which Vm is molar volume of mixture. Combination of equations (2.6), (2.18), and
(2.19) leads to,
1
11, xV
VVE
m
(2.20)
2
22, xV
VVE
m
(2.21)
Figure 2.10 shows the density and excess molar volume for binary mixture of
[BMIM]SCN (1) and 1-propanol(2) at T =298.15 K. The densities are highest for pure
ionic liquids and are decreasing with increasing mole fraction of alcohol. Figure 2.9
also indicate that EmV exhibit negative deviation from ideality over the entire
composition range.
The negative deviation from ideality observed for this system has to be a result of
a strong interaction of ionic liquids with methanol. The strength of the intermolecular
hydrogen bonding is not only one factor influencing the EmV . The molecular size and
shape of the components and the packing effect are equally important factors.
The values for EmV of a mixture formed from two self-associated (H-bonded)
substances are result of a number of effects that may contribute terms differing in
sign. Disruption of H-bonds makes positive contribution, but specific interaction
makes negative contributions to EmV . The free volume effect, which depends on
differences in the characteristic pressures and temperatures of the components, makes
negative contribution.

35
Figure 2.10 Density and excess molar volume ([BMIM]SCN + 1-propanol) binary
mixture at T = 298.15 K (a) Effect of composition on density of binary mixture, (b)
Excess volume molar of binary mixture, (--) correlated using equation 2.11 [122].
0.790
0.840
0.890
0.940
0.990
1.040
1.090
0 0.2 0.4 0.6 0.8 1
Mo1e fraction of 1-Propanol
Den
sity
/ g·c
m-3
(a)
-1.0
-0.8
-0.6
-0.4
-0.2
0.0
0 0.2 0.4 0.6 0.8 1
Mo1e fraction of 1-Propanol
Exc
ess m
olar
vol
ume /
cm3 ·m
ol -1
(b)

36
Packing effects or conformational changes of the molecules in the mixtures are
more difficult to categorize. However, interstitial accommodation and the effect of the
condensation give further negative contributions. In the mixtures, the observed EmV
values may be explained by four opposing sets of contributions: (1) expansion of an
alcohol due to breaking of some of the hydrogen bonds of an alcohol during addition
of the ionic liquids; (2) contraction due to specific interactions of an alcohol molecule
with an ionic liquids; (3) size difference; and (4) expansion due to steric repulsion
between alkyl chain of an alcohol and that of [BMIM][SCN] van der Waals
interactions between the alkane chains [122].
2.2.4.2 Viscosity of Binary Mixture and Viscosity Deviation
The addition of cosolvent to the ionic liquids, to form binary mixture, can result in
dramatic reduction in the viscosity. The viscosity of the mixture of two liquids will
not be equal to the sum of the viscosity of its pure constituents [112],
2211 nxxmix (2.22)
where mix is viscosity of mixture and ix is the mole fraction of component.
Deviation of viscosity can be also correlated using Redlich Kister. For deviation
of viscosity, it can be expressed as,
kji
kkji xxAxx )(
0
(2.23)
Figure 2.11 shows the viscosity of ([BMIM]SCN + 1-propanol) binary mixture.
The observed decrease in viscosity with an increase in methanol content exhibits
negative deviation and is particularly strong in dilute solutions of an alcohol in the
ionic liquid. Ion-dipole interactions and/or hydrogen bonding between the cation of
the ionic liquids and the alcohol will take place when an alcohol is added to the ionic
liquids. This weakening of the strong hydrogen bonding interactions between cation
and anion of the ionic liquids leads to a higher mobility of the ions and a lower
viscosity of the mixture [122].

37
Figure 2.11 Viscosity of ([BMIM]SCN + 1-propanol) binary mixture at T = 298.15 K
(a) Effect of composition on viscosity of binary mixture, (b) Deviation of viscosity of
binary mixture, (-) correlated using equation 2.11 [122].
0
10
20
30
40
50
60
0 0.2 0.4 0.6 0.8 1
Mo1e fraction of 1-Propanol
Visc
osity
/ m
Pa·s
(a)
-18
-15
-12
-9
-6
-3
0
0 0.2 0.4 0.6 0.8 1
Mo1e fraction of 1-Propanol
Visc
osity
dev
iatio
n /
mPa
·s
(b)

38
Viscosity of binary mixture containing imidazolium ionic liquids have also been
studied with a range of cosolvent including water [155, 156], methanol, ethanol [155,
157], 1-propanol [125, 158], ethyl acetate, acetonitrile, and other organic solvent
[104]. However, for protic hydroxyl ammonium ionic liquids these data are very
scarce or hardly available.
2.2.4.3 Refractive Index of Binary Mixture and Refractive Index Deviation
The addition of cosolvent to ionic liquids, to form binary mixture, can result in
reduction in the refractive index. Figure 2.11 shows the refractive index of
([empy][EtSO4] + ethanol) binary mixture and its deviation of refractive index. As
can be seen from Figure 2.11a, the refractive index of the binary mixture decreases
with increasing composition of ethanol in the mixture. The refractive index is at
maximum at pure ionic liquids and minimum at pure ethanol.
The deviation of refractive index can be expressed as,
2,21,1 DDmixDD nxnxnn (2.24)
Deviation of refractive index can be also correlated using Redlich Kister. For
deviation of refractive index, it can be expressed as,
kji
kkjiD xxAxxn )(
0
(2.25)
Refractive index of binary mixture containing imidazolium ionic liquids have also
been studied with a range of cosolvent including water [159, 160], methanol, ethanol
[159, 160], 1-propanol [124], ethyl acetate [161], acetonitrile, and other organic
solvent [143]. However, for protic hydroxyl ammonium ionic liquids these data are
again hardy available

39
Figure 2.12 Refractive index of ([empy][EtSO4] + 1-Propanol) binary mixture at T =
298.15 K (a) Effect of composition on refractive index of binary mixture, (b)
Deviation of refractive index of binary mixture, (-) correlated using equation 2.11
1.37
1.39
1.41
1.43
1.45
1.47
1.49
0 0.2 0.4 0.6 0.8 1
Mo1e fraction of 1-Propanol
Ref
ract
ive
inde
x
(a)
0.00
0.01
0.02
0.03
0 0.2 0.4 0.6 0.8 1
Mo1e fraction of 1-Propanol
Ref
ract
ive
inde
x de
viat
ion
(b)

40
2.3 Carbon Steel Corrosion in Acidic Media
Carbon steel is used in a wide range of industrial applications such as erecting boilers,
drums, heat exchangers, tanks, and many others. On the other hand, acid solutions are
widely used in different industries. The most important fields of application are acid
pickling, industrial acid cleaning, acid descaling, and oil well acidising. The use of
acid solution for those processes has led to the corrosive attack on carbon steel [4-9,
11, 12].
In the case of steel in which iron presents as the major components, the iron is
corroded by acidic medium such as hydrochloric acid, HCl, as illustrated by the
following chemical reactions [1],
Fe + 2HCl → FeCl2 + H2 (2.26)
In ionic form the above reaction can be written as follows,
Fe + 2H+ + 2Cl- → Fe2+ + 2Cl- + H2 (2.27)
Eliminating Cl- from both of sides of the reaction gives,
Fe + 2H+ → Fe2+ + H2 (2.28)
Therefore, the above reaction can be separated into half reactions consisting of
oxidation-reduction as follows;
Anodic reaction, Fe → Fe2+ + 2e- (2.29)
Cathodic reaction, 2H+ + 2e- → H2 (2.30)
Commercial HCl usually contains ferric ion, present as iron chloride which makes
metals corrode much more rapidly due to availability of two cathodic reactions
namely, hydrogen evolution (Equation 2.30) and ferric ion reaction,
Fe3+ + e- → Fe2+ (2.31)

41
The stability of a metal and their alloy when exposed to a given environment
depends on a multitude of factors that may vary greatly with the pH and oxidizing or
reducing power of that environment. One useful concept to represent the effects of
aqueous environments on metals became known as potential-pH (E-pH) diagrams,
also called predominance or Pourbaix diagrams. The E-pH diagrams are typically
plotted for various equilibria on normal Cartesian coordinates with potential, E, as the
ordinate and pH as the abscissa [1]. Some interesting uses of such diagrams, which
have been constructed for most metals and a few alloys, are to (1) predict whether or
not corrosion can occur; (2) estimate the composition of the corrosion products
formed; and (3), predict environmental changes which will prevent or reduce
corrosion attack [1].
Figure 2.13 illustrates the E-pH diagram for iron at 25°C in the presence of water
or corrosive environments. At potentials more positive than -0.6 and at pH values
below 9, ferrous ion, Fe2+, is the stable substance. This indicates that iron corrodes
under these conditions according to the following reaction,
Fe → Fe2+ + 2e- (2.32)
In the other regions of the iron E-pH diagram, it can be seen that the corrosion of
iron produces ferric ions, Fe3+; ferric hydroxide, [Fe(OH)3]; ferrous hydroxide,
[Fe(OH)2]; and at very alkaline conditions, complex HFeO2- ions. In the acidic media,
which pH is equal to 1, reaction 2.26 is take place. It means that the carbon steel,
which mainly composed by iron, corrodes in acidic media to form Fe2+. These
diagrams also indicate that if the potential of iron is made sufficiently negative or
shifted cathodically below approximately -0.5 V vs. Standard Hydrogen Electrode
(SHE) in neutral or acidic environments, iron will less corrode. The addition of
corrosion inhibitor into the system shifts the potential of iron into more negative
value. It leads to cathodic protection criterion, in which iron will less corrode.

42
Figure 2.13 The E-pH diagram of iron with the cathodic criterion at 25 °C [1].
The difference between this cathodic potential and line (a) is indicative that such
potential will also tend to electrolyze water into hydrogen as indicated in the
following equations,
2 H3O+ + 2e- ↔ 2H2O(g) + H2 (2.33)
2H2O + 2e- ↔ H2 + 2OH- (2.34)
In the acidic media, in which concentration of H+ is high, reaction 2.34 takes place.
2.3.1 Recent Development on Corrosion Inhibitor in Acidic Media
Among the several methods of corrosion control and prevention, the use of corrosion
inhibitors is very popular [4-9, 11, 12, 162-175]. Corrosion inhibitors are substances
which when added in small concentrations to corrosive media decrease or prevent the
reaction of the metal with the media. Inhibitors are added to many systems viz.,
cooling systems, refinery units, chemicals, and oil and gas production units.

43
The acidization of oil and gas wells is probably the most widely used work over
and stimulation practice in oil industry. Acidization is oil reservoir stimulation
technique for increasing well productivity by removing near-well bore formation
damage or by creating alternate flow paths by dissolving small portions of the
formation. Generally speaking, acids, or acid-based fluids, are useful in this regard
due to their ability to dissolve both formation minerals and contaminants e.g., drilling
fluid coating the wellbore or that has penetrated the formation which were introduced
into the wellbore/formation during drilling or remedial operations [1].
Different acids are used in conventional acidization treatment. The most common
are hydrochloric acid, HCl; hydrofluoric acid, HF; acetic acid, CH3COOH; formic
acid, HCOOH; sulfamic acid, H2NSO3H, and chloroacetic acid, ClCH2COOH.
Among various acids, HCl is widely used for stimulating carbonate-based reservoirs
like lime stone and dolomite [1]. Since HCl is strong aggressive medium for oil and
gas well equipment. Thus, the effective way to protect these oil well tubular materials
is to inject a suitable corrosion inhibitor. Accordingly, corrosion inhibitors must be
injected with the HCl solution to avoid the destructive effect of acid on the surface of
the pipe lines. Hence it is very important to measure the physical properties, in this
case is viscosity, of the new corrosion inhibitor [1].
A number of organic compounds have been reported as corrosion inhibitors [4-9,
11, 12] and the screening of synthetic heterocyclic compounds is still being continued.
Most of them are toxic in nature. This has led to the development of non toxic
corrosion inhibitors such as amino acid [162-167] and natural product [168-172] such
as Khillah [168], pennyroyal oil [169], lawsonia [170], and opuntia [171]. The
inhibitive effect of four antibacterial drugs, namely ampicillin, cloxacillin,
flucloxacillin and amoxicillin towards the corrosion of aluminium was investigated.
The inhibition efficiency follow the order amoxicillin > ampicillin > cloxacillin >
flucloxacillin. The inhibition action of these drugs was attributed to blocking the
surface via formation of insoluble complexes on the metal surface [173]. Various
rhodanine azosulpha drugs were used as a potential class of corrosion inhibitor on 304
stainless steel [174]. El-Naggar have studied the corrosion inhibition activity of
sulpha drugs namely sulphaguanidine, sulphamethazine, sulphamethaxazole and
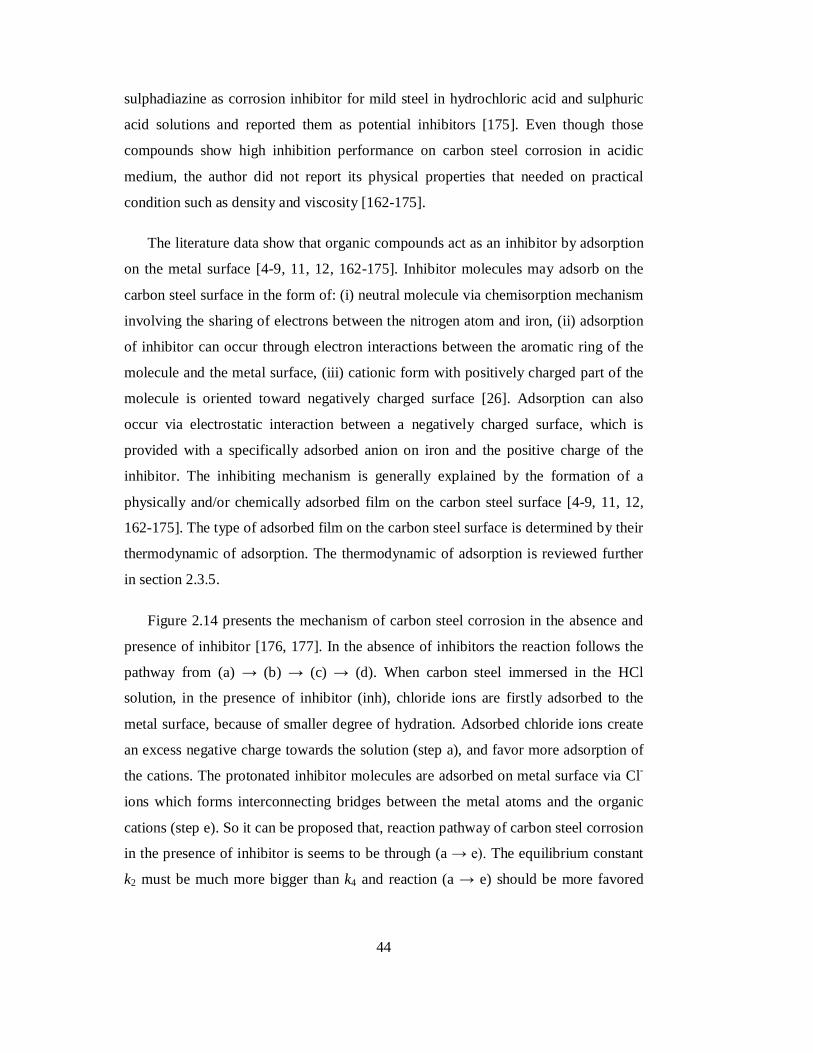
44
sulphadiazine as corrosion inhibitor for mild steel in hydrochloric acid and sulphuric
acid solutions and reported them as potential inhibitors [175]. Even though those
compounds show high inhibition performance on carbon steel corrosion in acidic
medium, the author did not report its physical properties that needed on practical
condition such as density and viscosity [162-175].
The literature data show that organic compounds act as an inhibitor by adsorption
on the metal surface [4-9, 11, 12, 162-175]. Inhibitor molecules may adsorb on the
carbon steel surface in the form of: (i) neutral molecule via chemisorption mechanism
involving the sharing of electrons between the nitrogen atom and iron, (ii) adsorption
of inhibitor can occur through electron interactions between the aromatic ring of the
molecule and the metal surface, (iii) cationic form with positively charged part of the
molecule is oriented toward negatively charged surface [26]. Adsorption can also
occur via electrostatic interaction between a negatively charged surface, which is
provided with a specifically adsorbed anion on iron and the positive charge of the
inhibitor. The inhibiting mechanism is generally explained by the formation of a
physically and/or chemically adsorbed film on the carbon steel surface [4-9, 11, 12,
162-175]. The type of adsorbed film on the carbon steel surface is determined by their
thermodynamic of adsorption. The thermodynamic of adsorption is reviewed further
in section 2.3.5.
Figure 2.14 presents the mechanism of carbon steel corrosion in the absence and
presence of inhibitor [176, 177]. In the absence of inhibitors the reaction follows the
pathway from (a) → (b) → (c) → (d). When carbon steel immersed in the HCl
solution, in the presence of inhibitor (inh), chloride ions are firstly adsorbed to the
metal surface, because of smaller degree of hydration. Adsorbed chloride ions create
an excess negative charge towards the solution (step a), and favor more adsorption of
the cations. The protonated inhibitor molecules are adsorbed on metal surface via Cl-
ions which forms interconnecting bridges between the metal atoms and the organic
cations (step e). So it can be proposed that, reaction pathway of carbon steel corrosion
in the presence of inhibitor is seems to be through (a → e). The equilibrium constant
k2 must be much more bigger than k4 and reaction (a → e) should be more favored

45
than (a) → (b) → (c) → (d). Thus, the inhibitor molecules may act as a barrier against
corrosion of the iron [176, 177].
Figure 2.14 Mechanism of carbon steel corrosion in HCl solution in the absence and
presence of inhibitor [176, 177].
In the case chemisorption, the same adsorption pathway is observed. In the first
step, negative charged metal surface was formed, by chloride ions as explained above,
following this step the reaction proceeded through forming (FeCl-Inh+)ads as a new
reaction pathway having equilibrium constant, of k3, e → f. The positively charged
inhibitor molecule will replace with Cl- due to more interaction ability of inhibitor,
and Cl− is displaced from the metal surface towards solution. Consequently, a new
double layer is formed and metal surface is loaded negative charge, against positive
charged inhibitor molecule (FeInh+)ads. The equilibrium constant related with forming
of (FeInh+)ads, k3, is must be bigger than k2 and k4, so the reaction do not stop at step e
and proceeds further with replacement of Cl- ions.
46
Though many synthetic compounds showed good anticorrosive activity, there are
some disadvantages with the reported inhibitor such as difficulty in the preparation
method and the high material cost. Also it has been reported that the lack of their
physical properties data, has limited the design and application of these corrosion
inhibitors [4-9, 11, 12, 162-175].
2.3.1.1 Ionic Liquids as Corrosion Inhibitor
The potential application of imidazolium and pyridinium based ionic liquids as
inhibitor on steel corrosion in acidic medium has been reported in open literature [22-
24]. Inhibition of corrosion of mild steel in 1M HCl by imidazolium based ionic
liquids, namely 1-butyl-3-methylimidazolium chlorides, [BMIM]Cl, and 1-butyl-3-
methylimidazolium hydrogen sulfate, [BMIM]HSO4, has been investigated using
electrochemical impedance, potentiodynamic polarization and weight loss
measurements. These two ionic liquids showed good inhibition property for the
corrosion of mild steel in 1M HCl solution and the inhibition efficiency was improved
significantly with ionic liquids concentration [22]. The adsorption of the inhibitors
molecules on the metal surface from 1M HCl solution obeys Langmiur adsorption
isotherm. The high value of adsorption equilibrium constant suggested that, the
inhibitors are strongly adsorbed on the mild steel surface. In addition, the increase in
activation energy after the addition of inhibitors to the 1M HCl solution and the value
of standard free energy of the adsorption indicated that the adsorption is more
physical than the chemical adsorption. The negative sign of the ΔGads and ΔH indicate
that the adsorption process is spontaneous and exothermic [22].
The inhibiting property of ionic liquids 1-butyl-3-methylimidazolium bromide,
[BMIM]Br, on corrosion of mild steel in 1 M HCl was also evaluated by various
corrosion monitoring techniques [23]. Potentiodynamic polarization data indicated
that the [BMIM]Br acts essentially as a mixed-type inhibitor. The adsorption of
inhibitor on the mild steel is found to follow the Langmuir adsorption isotherm.

47
More recently, the inhibition performance of imidazolium and pyridinium
bromides on mild steel corrosion in aqueous 1 M H2SO4 solution by was evaluated by
polarization curves and surface analysis techniques such as SEM, EDX, XRD, and
Mössbauer [24]. The results showed that these ionic liquids show a fair corrosion
inhibition with average corrosion efficiency within 82-88 % to protect the mild steel
corrosion in the aqueous solution of sulfuric acid; their efficiencies are increased with
the inhibitor concentration. These compounds affected both anodic and cathodic
reactions so they are classified as mixed type inhibitor. The ionic liquids adsorbed on
the mild steel surface due to chemisorption and obeyed the Langmuir’s isotherm.
2.3.2 Method to Measure Corrosion Inhibition
There are many methods to measure corrosion rate and monitor corrosion process.
The most common methods are Weight Loss (WL), Tafel Plot, Linear Polarization
Resistance (LPR), and Electrochemical Impedance Spectroscopy (EIS) [4-9, 11, 12,
162-175].
2.3.2.1 Weight Loss Method
The weight loss method measurement is based on geometric weight loss
measurement. This measurement requires long exposure time to reach measurable
corrosion rate. The weight loss method can be used for both corrosion rate
measurements and inhibition efficiency of inhibitor on corrosive system. The
inhibition efficiency for all inhibitors were calculated using the following equation,
100%
corr
inhcorrcorr
CRCRCR
IE (2.35)
where corrCR and inhcorrCR are the corrosion rate of carbon steel in the absence and
presence of the inhibitor, respectively. Figure 2.15 shows the corrosion rate and
inhibition performance of [BMIM]Cl on the mild steel corrosion in 1 M HCl at 303 K
using weight loss method and [22]. As can be seen from Figure 2.15 The corrosion
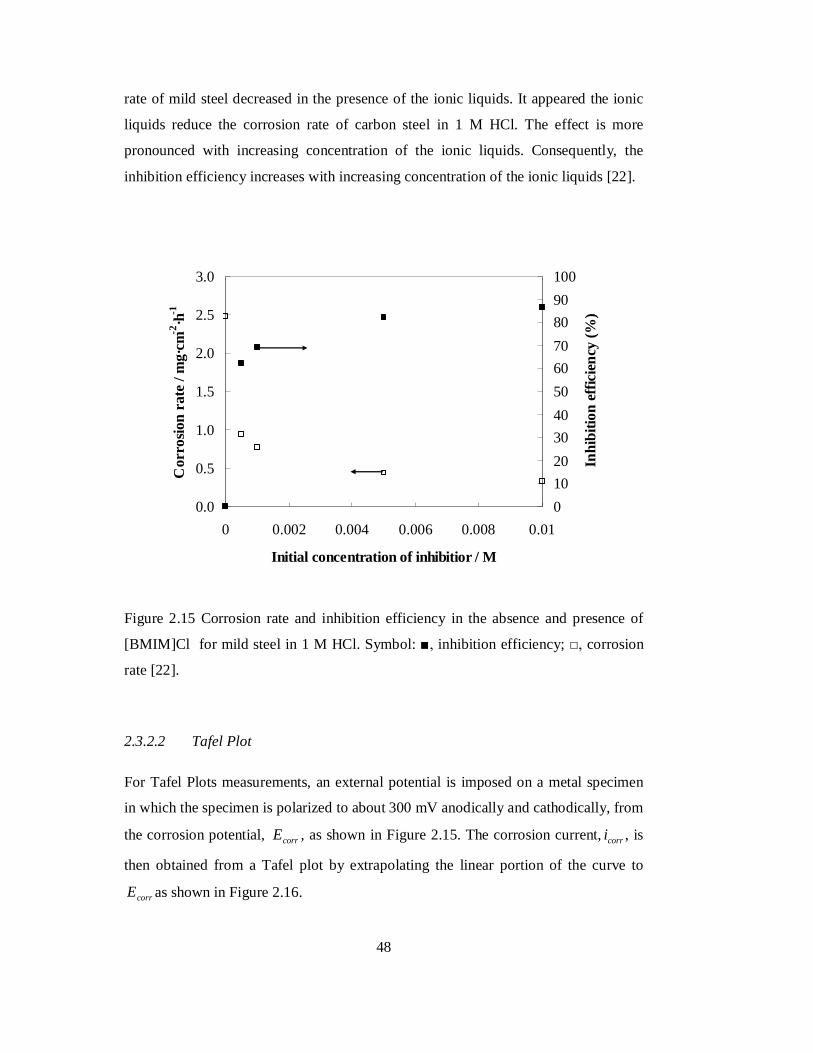
48
rate of mild steel decreased in the presence of the ionic liquids. It appeared the ionic
liquids reduce the corrosion rate of carbon steel in 1 M HCl. The effect is more
pronounced with increasing concentration of the ionic liquids. Consequently, the
inhibition efficiency increases with increasing concentration of the ionic liquids [22].
Figure 2.15 Corrosion rate and inhibition efficiency in the absence and presence of
[BMIM]Cl for mild steel in 1 M HCl. Symbol: ■, inhibition efficiency; □, corrosion
rate [22].
2.3.2.2 Tafel Plot
For Tafel Plots measurements, an external potential is imposed on a metal specimen
in which the specimen is polarized to about 300 mV anodically and cathodically, from
the corrosion potential, corrE , as shown in Figure 2.15. The corrosion current, corri , is
then obtained from a Tafel plot by extrapolating the linear portion of the curve to
corrE as shown in Figure 2.16.
0.0
0.5
1.0
1.5
2.0
2.5
3.0
0 0.002 0.004 0.006 0.008 0.01
Initial concentration of inhibitior / M
Cor
rosio
n ra
te / m
g·cm
-2·h
-1
0102030405060708090100
Inhi
bitio
n ef
ficie
ncy
(%)

49
Figure 2.16 Experimentally measured Tafel plot [1].
Figure 2.17 shows the Tafel Plot for mild steel in the presence and absence of
[BMIM]Cl at 303 K. The graph indicates that addition of the inhibitors causes more
negative shift in corrosion potential, Ecorr, especially at high concentrations. The
anodic Tafel slopes increase in the presence of the inhibitors and lines, which indicate
that the hydrogen evolution reaction is activation controlled and the addition of the
studied alkylimidazolium bases does not modify the mechanism of this process.
Addition of the alkylimidazolium bases affects both anodic and cathodic reaction.
Therefore, those compounds could be classified as mixed type inhibitors [22]. The
same behavior was also observed for other imidazolium based ionic liquids [23]. The
inhibition efficiency for all inhibitors are calculated using the following equation [22,
23],
100%
corr
inhcorrcorr
iii
IE (2.36)
where corri and inhcorri are the corrosion current in the absence and presence of inhibitor.

50
Figure 2.17 Effect of inhibitor concentration on the potentiodynamic polarization
response for mild steel in 1M HCl solution at 303 in various concentration of
[BMIM]Cl. Symbols: 1, blank; 2, 0.0005 M; 3, 0.001 M; 4, 0.005 M; 5, 0.01 M [22].
2.3.2.3 Linear Polarization Resistance
The linear polarization technique is rapid and gives corrosion rate data, which
correlate reasonably well with the weight loss method. The linear polarization
resistance (LPR) measurement is performed by scanning through a potential range
that is very close to the corrosion potential corrE . The polarization range is generally
±20 mV about corrE . The resulting current density is plotted versus potential as shown
in Figure 2.18.
LPR is widely used for corrosion rate measurement in high conductivity media
and also provides a faster corrosion rate measurement. This is not a destructive test so
it can be used on the same electrode to monitor long-term corrosion. The inhibition
efficiency for inhibitors can be calculated using the following equation [22, 23],

51
100%
inhp
pinhp
RRR
IE (2.37)
where pR and inhpR are the polarization resistance in the absence and presence of
inhibitor.
Figure 2.18 Experimentally measured linear polarization resistance [1]
2.3.2.4 Electrochemical Impedance Spectroscopy
Electrochemical Impedance Spectroscopy (EIS) has been successfully applied to the
study of the corrosion and its prevention system for over the years because this
method yields information on the type of corrosion, the kinetics of the corrosion, and
also corrosion rates. An important advantage of EIS over the other conventional
laboratory techniques is that it uses very small amplitude signals without disturbing
the nature of the metal surface being examined.
The effects of [BMIM]Cl on the impedance behavior of mild steel in 1M HCl
solution have been studied by Zhang and Hua [22]. Nyquist plots, Bode diagram, and
its electrical circuit analog are given in Figures 2.19, 2.20, and 2.21, respectively. It is
clear from Figure 2.19 that the impedance spectra obtained yields a semi circular
shape and only one time constant is observed in the Bode format. This indicates the
corrosion of the mild steel in 1M HCl solution is mainly controlled by a charge

52
transfer process. The charge transfer resistance, tR , must be corresponding to the
resistance between the metal and OHP (Outer Helmholtz plane) and can be calculated
from the difference in impedance at lower and higher frequencies. To obtain the
double-layer capacitance, dlC , the frequency at which the imaginary component of
the impedance is maximum, "maxZ , is determined and dlC values are calculated from
the following equation [1],
ctdl RC
Zf2
1"max (2.38)
From Figure 2.19, it is clear that the corrosion of mild steel is obviously inhibited
in the presence of the inhibitors. It is apparent that, the impedance response for mild
steel in HCl changes significantly with increasing inhibitor concentration. It is worthy
noting that similar profile of the Nyquist plots is observed in the absence and presence
of the inhibitors, indicating that addition of inhibitors do not change the mechanism
for the dissolution of mild steel in HCl [22].
Figure 2.19 Nyquist plot for mild steel in 1M HCl solution at 303.15 K in various
concentration of 1-butyl-3-methylimidazolium chloride. Symbols: 1, blank; 2, 0.0005
M; 3, 0.001 M; 4, 0.005 M; 5, 0.01 M [22].

53
Figure 2.20 Bode plot for mild steel in 1M HCl solution at 303.15 K in various
concentration of 1-butyl-3-methylimidazolium chloride. Symbols: 1, blank; 2, 0.005
[22].
Figure 2.21 Electrical circuit analog corresponded to the Figure 2.19 and 2.20
In the case of the electrochemical impedance spectroscopy, the inhibition
efficiency (IE) is calculated using charge transfer resistance as follows [22, 23],
100%
inht
tinht
RRRIE (2.39)
where tR and inhtR are the charge transfer resistance values without and with inhibitor
for mild steel in 1MHCl, respectively. As the inhibitor concentration increases, the Rt

54
values increase, while the dlC values decrease. The decrease in dlC value is due to the
adsorption of inhibitor on the metal surface. The inhibition efficiency increases with
increasing inhibitor concentration.
2.3.3 Adsorption of Inhibitor on Carbon Steel Surface
A corrosion inhibitor can function in two ways [1]. In some situations the added
inhibitors can alter the corrosive environment into a non corrosive or less corrosive
environment through its interaction with the corrosive species. In other cases the
corrosion inhibitor interacts with the metal surface and as a consequence inhibits the
corrosion of the metal. It is well recognized that the first step in inhibition of metallic
corrosion is the adsorption of organic inhibitor molecules at the metal/solution
interface and that the adsorption depends on the molecules chemical composition, the
temperature and the electrochemical potential at the metal/solution interface. In fact,
the solvent H2O molecules could also adsorb at metal/solution interface. So the
adsorption of organic inhibitor molecules from the aqueous solution can be regarded
as a quasi-substitution process between the organic compounds in the aqueous phase
[Org(sol)] and water molecules at the electrode surface [H2O(ads))] [4-9, 11, 12, 162-
175],
Org(sol) + nH2O(ads) Org(ads) + nH2O (2.40)
where n is the size ratio, that is, the number of water molecules replaced by one
organic inhibitor. For effective adsorption of the inhibitor on a metal surface the
forces of interaction of the metal and an inhibitor must be greater than the interaction
forces of metal and water molecules.
2.3.3.1 Adsorption Isotherm
Adsorption isotherm is shown to reflect the performance of inhibitors. When the
inhibitor is dissolved in a solution, it gets adsorbed on the metal surface and prevents
the corrosion. The adsorption changes the nature of electrified interface between

55
metal and the solution. The adsorption process is influenced by the chemical
structures of organic compounds, the distribution of charge in molecule, the nature
and surface charge of metal and the type of aggressive media [1].
The adsorption isotherms are given in Table 2.4. Most of the organic corrosion
inhibitors obey the Langmuir’s isotherm adsorption. The Langmuir’s isotherm
adsorption model is based on following assumptions: (i) The heat of adsorption is the
same for all adsorption sites and is independent of surface coverage, (ii) The total
numbers of adsorption sites are constant and each site can hold one adsorbed species,
and (iii) The adsorbed species do not interact with each other [1]. Figure 2.22 shows
the graph of Langmuir’s isotherm adsorption for [BMIM]Cl at temperature 303 K
[22]. A straight line was obtained on plotting Cinh/θ against Cinh as shown in Figure
2.21 which suggested that the adsorption of the inhibitors used from 1M HCl
solutions on mild steel follows Langmuir’s adsorption isotherm. Ionic liquids 1-butyl-
3-methylimidazolium chlorides, 1-butyl-3-methylimidazolium hydrogen sulfate, and
1,3-Dioctadecylimidazolium bromide, and N-Octadecylpyridinium bromide follows
Langmuir isotherm adsorption [24].
Table 2.4 Adsorption isotherm [1]
Isotherm Formula Equation
Langmuir inhadsCK
1 (2.41)
Frumkin inhadsCK
1
(2.42)
Temkin inhadsCK
fln1
(2.43)
Bockris-Swinkels
n
n
n nn 11
1
=
4.55
adsKce
(2.44)
Virial Parson inhads
f CKe 2 (2.45)

56
Figure 2.22 Langmuir’s isotherm adsorption for ionic liquids 1-Butyl-3-
methylimidazolium chloride on the surface of mild steel at temperature 303 K [22].
2.3.3.2 Equilibrium Constant of Adsorption
In the case of inhibitors which adsorb on the metal surface and inhibit the corrosion
there are two steps, namely: (i) partitioning of inhibitor between electrolyte system
and carbon steel surface; and (ii) carbon steel - inhibitor interactions. The equilibrium
constant of adsorption, adsK , reflect the adsorption of corrosion inhibitor from the
corrosive environment to the carbon steel surface and is given by [1],
1inh
ads CK (2.46)
where is degree of surface coverage of the metal surface and inhC is the inhibitor
concentration.
0.000
0.002
0.004
0.006
0.008
0.010
0.012
0.014
0.000 0.002 0.004 0.006 0.008 0.010 0.012
Initial concentration of inhibitor, C inh / M
Cin
h / θ

57
Figure 2.23 presents the value of adsK for adsorption of [BMIM]Cl onto the mild
surface in 1 M HCl at several temperatures. The high values for equilibrium constant
of adsorption are good indicative for a strong adsorption of the studied inhibitors on
mild steel surface. The higher adsK the stronger and more stable adsorbed layer being
forming, this increases the inhibition efficiency. The value of Kads decreases with
increasing temperature. It suggests that the inhibitors are physically adsorbed on the
metal surface and desorption process enhances with elevating temperature [1].
2.3.4 Thermodynamic of Adsorption
The thermodynamic of adsorption parameters are a useful tool for clarifying the
adsorption behavior of an inhibitor. It can be used to understand the effect of
concentration and temperature on the adsorption processes of the ionic liquids on the
carbon steel surface in 1 M HCl. The thermodynamic parameters include the standard
free energy of adsorption, and enthalpy and entropy of activation.
Figure 2.23 Equilibrium constant for mild steel in 1M HCl solution in the presence of
0.005 M [BMIM]Cl at different temperatures [22].
0
200
400
600
800
1000
303.15 313.15 323.15 333.15
Kad
s
Temperature / K

58
2.3.4.1 Standard Free Energy of Adsorption
Adsorption of inhibitors on the carbon steel surface can be due to either physisorption
or chemisorption. These types of adsorption are related to their standard free energy
of adsorption, ΔGads [1, 22-24],
adsads KRTG 5.55ln (2.47)
where R is gas constant, T is the absolute temperature, and Kads is the equilibrium
constant of adsorption.
Generally, the adsG values of -20 kJ·mol-1 or less negative are associated with an
electrostatic interaction between charged molecules and charged metal surface,
physisorption; those of -40 kJ·mol-1or more negative involve charge sharing or
transfer from the inhibitor molecules to the metal surface to form a coordinate
covalent bond, chemisorption [1].
Figure 2.24 shows the standard free energy for adsorption of [BMIM]Cl on the
mild surface in 1 M HCl at several temperatures. The values of adsG are negative,
indicating spontaneous interaction of inhibitor molecule with the corroding mild steel
surface. The graph also shows that the values of adsG around to be less than 40
kJ·mol-1 and higher than 20 kJ·mol-1. It is usually accepted as a threshold value
between chemisorption and physisorption
Inhibitors involved in physisorption can be desorbed with ease while inhibitors
involved in chemisorption are difficult to be desorbed. Physical adsorption forces are
relatively weak and they have low activation energy, Ea. Chemisorption of inhibitor
molecules on metals is slow and involves interaction forces stronger than the forces in
physisorption. A coordinate type of bond between the metal and the inhibitor is
thought to be present with charge transfer from the inhibitor to the metal. An
opposing view is that a chemical bond is not necessarily present in chemisorption of
an inhibitor on the metal surface. In some cases the temperature dependence shows
higher inhibition efficiency and higher activation energy Ea than physisorption [1].

59
Figure 2.24 Standard free energy for mild steel in 1M HCl solution in the presence of
0.005 M [BMIM]Cl at different temperatures [22].
2.3.4.2 Enthalpy and Entropy of Activation
The enthalpy of activation, actH , gives information on the strength of the interaction
between metal and dissolved inhibitor whereas the entropy of activation, actS ,
indicates the level of ordering that takes place in the iron/inhibitor mixture. These
thermodynamics properties can be determined from the following equation [1],
RTH
RS
NhRT actact expexprateCorrosion (2.48)
Where R is gas constant, T is the absolute temperature, h is the Planck’s constant, N
is the Avogadro’s number,
-30
-29
-28
-27
-26
-25
303.15 313.15 323.15 333.15
Temperature / K
Stan
dard
free
ene
rgy
/ kJ·
mol
-1

60
Figure 2.25 plots the ln(CR/T) against. 1000/T for mild steel in 1 M HCl in the
presence of 0.005 M 1-butyl-3-methylimidazolium chloride at several temperatures. A
plot of ln(CR/T) against. 1000/T give a straight line with a slope of ( actH /R) and
an intercept of [(ln(R/Nh)) + ( actS /R)], from which the values of actH and actS
are calculated and listed in Table 2.5.
The data show that the actH values of the corrosion of mild steel in 1M HCl
solution in the presence of the inhibitors are higher than those in the absence of
inhibitor. The actH value enhance with increasing inhibitor concentration, indicating
more energy barrier for the reaction in the presence of the inhibitor. The entropy of
activation actS in the absence and presence of the inhibitor is large and negative.
This indicates the activated complex in the rate determining step represents an
association rather than a dissociation step, meaning that, a decrease in disordering
takes place on going from reactants to the activated complex [22].
Figure 2.25 Plot the ln(CR/T) against. 1000/T for mild steel in 1M HCl solution in the
presence of 0.005 M 1-butyl-3-methylimidazolium chloride at different temperatures
[22].
-7.0
-6.5
-6.0
-5.5
-5.0
-4.5
-4.0
3.00 3.10 3.20 3.30
1000·K/T -1
ln (C
R/T
)

61
Table 2.5 The enthalpy and entropy of activation for mild steel in 1M HCl solution in
the absence and presence of [BMIM]Cl
Cinh/M actH / kJ·mol- actS / (J·K-1 ·mol-1 )
0 46.4 84.3
0.0005 55.2 63.5
0.0010 58.1 55.7
0.0050 67.1 30.1
0.0100 72.6 14.5
2.3.5 The Apparent Activation Energy
The apparent activation energy aE is calculated using Arrhenius equation [1],
ARTECR a
ln (2.49)
where aE is the apparent activation energy for the corrosion of iron in acidic solution,
R is the gas constant, A is the Arrhenius pre-exponential factor and T is the absolute
temperature.
Figure 2.25 presents the Arrhenius plot for mild steel in 1M HCl solution in the
presence of 0.005 M [BMIM]Cl at different temperatures. A plot of the natural
logarithm of the corrosion rate of mild steel against 1000·1/T gives straight lines as
shown in Figure 2.15. The apparent activation energy for mild steel in 1M HCl
solution in the absence or presence of various concentration of [BMIM]Cl is
calculated using equation (2.43), and the values are listed in Table 2.6.

62
Figure 2.26 Arrhenius plot for mild steel in 1M HCl solution in the presence of 0.005
M 1-butyl-3-methylimidazolium chloride at different temperatures [22].
Table 2.6 The apparent activation energy for mild steel in 1M HCl solution in the
absence and presence of [BMIM]Cl [22].
Cinh/M aE /kJ·mol-1
0 49.1
0.0005 57.9
0.0010 60.7
0.0050 69.8
0.0100 75.2
-1.0
-0.5
0.0
0.5
1.0
1.5
2.0
3.00 3.10 3.20 3.30
1000·K/T -1
ln C
R/m
g·cm
-2·h
-1

63
The data show that the apparent activation energy of the corrosion of mild steel in
1MHCl solution in the presence of the inhibitors is higher than those in the free acid
solution. The value of aE enhances with increasing inhibitor concentration, indicating
more energy barrier for the reaction in the presence of the inhibitor is attained [22].


CHAPTER 3
RESEARCH METHODOLOGY
This chapter covers the experimental part of the present work. Chapter 3.1 presents
the preparation of ionic liquids. The preparation includes synthesis and
characterization of ionic liquids used for the study of thermodynamic and application
of ionic liquids in this work. The structure of ionic liquids is determined using
spectroscopy 1H and 13C NMR and Infra-red. The purity of ionic liquids is determined
using elemental analysis and water content. Chapter 3.2 presents the measurement of
physical properties of ionic liquids and binary mixture of ionic liquids with organic
solvents. It includes density, viscosity, and refractive index. Finally, chapter 3.3
presents the experimental setup to measure the inhibition efficiency of ionic liquids on
corrosion of carbon steel in acidic medium. Figure 3.1 shows the flow diagram of
experimental work in the present work.
3.1 Preparation of Ionic Liquids
In the present work, ionic liquids were synthesized by protonation of alkanolamines
with different organic acids. Ease of manufacturing and commercially available as
well as low cost materials are some of the reasons for choosing alkanolamines as the
cation source.

66
Figure 3.1 Flow diagram of experimental in the present work.

67
3.1.1 Chemicals
Synthetic grade of alkanolamines, such as monoethanolamine (MEA), diethanolamine
(DEA), methyldiethanolamine (MDEA), and triethanolamine (TEA) were supplied
from Merck® (Merck, Malaysia Sdn. Bhd.). High purity organic acids; such as formic
acid, acetic acid, propionic acid, and lactic acid were also supplied from Merck®
(Merck, Malaysia Sdn. Bhd.). Alcohol with reagents for pharmacopoeia analysis
grade (ACS, ISO, Reag. Ph Eur) were also supplied from Merck® (Merck, Malaysia
Sdn. Bhd.). The structure, formula, molar mass, and CAS number of the chemical
used in this work are given in Table A.1 of Appendix A.
3.1.2 Synthesis of Ionic Liquids
In this work, ionic liquids were synthesized by protonation of alkanolamines using
organic acids. Otherwise stated, all chemicals listed in table 3.1 were used as received
from the supplier. Figure 3.2 gives the schematic preparation of ionic liquids
synthesized in this work. These ionic liquids can be classified as protic ionic liquids
as these ionic liquids were synthesized through direct protonation of alkanolamines
using organic acids [178].
Figure 3.2 Schematic preparation of ionic liquids through protonation of alkanolamine
using organic acid
68
3.1.2.1 Synthesis of 2-hydroxyethanaminium formate
A solution of 0.5 moles (18.9 mL) of formic acid were added slowly to a solution of
0.5 moles (29.9) mL of MEA in round bottom flask equipped with reflux condenser, a
magnetic stirrer, and thermometer. The mixing temperature, Tm, was kept at 25 °C
using ice bath. After all acid was added to the alkanolamine, the reaction mixture was
stirred with continues stirring at heating temperature, Th, 40 °C. The reaction was
monitored by a thin layer chromatography using aluminum sheets silica gel and
methanol as eluent. After reaching the reaction time, tr, for 24 hours the resulting
viscous liquid is washed with methanol and transferred into a rotary evaporator to
remove unreacted materials and methanol. To ensure removal of the starting materials
and methanol, the resulting viscous liquids is kept under vacuum oven for 24 hours.
The ionic liquids are then kept in vial with PTFE septum. For any characterization
purpose, ionic liquids are taken out using syringe equipped with needle to avoid
atmosphere contamination particularly from the moisture.
3.1.2.2 Synthesis of 2-hydroxyethanaminium Acetate
The procedure describe above is also used to synthesize 2-hydroxyethanaminium
Acetate [HEA]. For synthesis of [HEA], 28.6 ml of acetic acid and 29.9 ml of MEA
were used.
3.1.2.3 Synthesis of 2-hydroxyethanaminium Propionate
The procedure describe above is also used to synthesis 2-hydroxyethanaminium
propionate [HEP]. For synthesis of [HEP], 37.1 ml of propionic acid and 29.9 ml of
MEA were used.

69
3.1.2.4 Synthesis of 2-hydroxyethanaminium Lactate
The procedure describe above is also used to synthesize 2-hydroxyethanaminium
Lactate [HEL]. For synthesis of [HEL], 37.2 ml of acetic acid and 29.9 ml of MEA
were used.
3.1.2.5 Synthesis of Bis(2-hydroxyethyl)ammonium Formate
The procedure describe above is also used to synthesize
bis(2hydroxyethyl)ammonium Formate [BHEAF]. For synthesis of [BHEAF], 18.9
ml of formic acid and 48.2 ml of DEA were used with Tm, Th, and tr set at 40 °C,
50°C, and 48 hours, respectively.
3.1.2.6 Synthesis of Bis(2-hydroxyethyl)ammonium Acetate
The procedure describe above is also used to synthesize
bis(2hydroxyethyl)ammonium Acetate [BHEAA]. For synthesis of [BHEAA], 28.6
ml of acetic acid and 48.2 ml of DEA were used with Tm, Th, and tr set at 50 °C, 75°C,
and 72 hours, respectively.
3.1.2.7 Synthesis of Bis(2-hydroxyethyl)ammonium Propionate
The procedure describe above is also used to synthesize
bis(2hydroxyethyl)ammonium Propionate [BHEAP]. For synthesis of [BHEAP], 37.1
mL of propionic acid and 48.2 ml of DEA were used with Tm, Th, and tr set at 50 °C,
75°C, and 48 hours, respectively.
3.1.2.8 Synthesis of Bis(2-hydroxyethyl)ammonium Lactate
The procedure describe above is also used to synthesize
bis(2hydroxyethyl)ammonium Lactate [BHEAL]. For synthesis of [BHEAL], 37.2
70
mL of lactic acid and 48.2 ml of DEA were used with Tm, Th, and tr set at 50 °C, 75°C,
and 48 hours, respectively.
3.1.2.9 Synthesis of Bis(2-hydroxyethyl)methylammonium Formate
The procedure describe above is also used to synthesize
bis(2hydroxyethyl)methylammonium Formate [BHEMF]. For synthesis of [BHEMF],
18.9 mL of formic acid and 57.3 mL of MDEA were used with Tm, Th, and tr set at 40
°C, 55°C, and 36 hours, respectively.
3.1.2.10 Synthesis of Bis(2-hydroxyethyl)methylammonium Acetate
The procedure describe above is also used to synthesize
bis(2hydroxyethyl)methylammonium Acetate [BHEMA]. For synthesis of [BHEMA],
28.6 mL of acetic acid and 57.3 mL of MDEA were used with Tm, Th, and tr set at 40
°C, 55°C, and 36 hours, respectively.
3.1.2.11 Synthesis of Bis(2-hydroxyethyl)methylammonium Propionate
The procedure describe above is also used to synthesize
bis(2hydroxyethyl)methylammonium Propionate [BHEMP]. For synthesis of
[BHEMP], 37.1 mL of propionic acid and 57.3 mL of MDEA were used with Tm, Th,
and tr set at 40 °C, 55°C, and 36 hours, respectively.
3.1.2.12 Synthesis of Bis(2-hydroxyethyl)methylammonium Lactate
The procedure describe above is also used to synthesize
bis(2hydroxyethyl)methylammonium Lactate [BHEML]. For synthesis of [BHEML],
37.2 mL of lactic acid and 57.3 mL of MDEA were used with Tm, Th, and tr set at 40
°C, 55°C, and 36 hours, respectively.

71
3.1.2.13 Synthesis of Tris(2-hydroxyethyl)ammonium Formate
The procedure describe above is also used to synthesize
tris(2hydroxyethyl)ammonium Formate [THEAF]. For synthesis of [THEAF], 18.9
mL of formic acid and 66.6 mL of TEA were used with Tm, Th, and tr set at 50 °C,
75°C, and 72 hours, respectively. After 72 hours, the mixture was brought to room
temperature. The resulting white solid obtained is washed with methanol and
transferred into a rotary evaporator to remove any unreacted materials and methanol.
To ensure complete removal of starting materials and methanol, the resulting white
solid is kept under vacuum oven for 24 hours. The ionic liquids were kept in vial with
PTFE septum. [THEAF] is solid at room temperature.
3.1.2.14 Synthesis of Tris(2-hydroxyethyl)ammonium Acetate
The procedure describe above is also used to synthesize
tris(2hydroxyethyl)ammonium Acetate [THEAA]. For synthesis of [THEAA], 28.6
mL of acetic acid and 66.6 mL of TEA were used with Tm, Th, and tr set at 50 °C,
60°C, and 72 hours, respectively.
3.1.2.15 Synthesis of Tris(2-hydroxyethyl)ammonium Propionate
The procedure describe above is also used to synthesize
tris(2hydroxyethyl)ammonium Propionate [THEAP]. For synthesis of [THEAP], 37.1
mL of propionic acid and 66.6 mL of TEA were used with Tm, Th, and tr set at 50 °C,
50°C, and 72 hours, respectively.
3.1.2.16 Synthesis of Tris(2-hydroxyethyl)ammonium Lactate
The procedure describe above is also used to synthesize
tris(2hydroxyethyl)ammonium Lactate [THEAL]. For synthesis of [THEAL], 37.2

72
mL of lactic acid and 66.6 mL of TEA were used with Tm, Th, and tr at 50 °C, 50°C,
and 72 hours, respectively.
3.1.3 Characterization of Ionic Liquids
The synthesized ionic liquids are characterized using Spectroscopy Infrared (IR) and
Nuclear Magnetic Resonance (NMR); 1H-NMR, and 13C-NMR. The composition of
synthesized ionic liquids is determined using elemental analysis. The purity of
synthesized ionic liquids is determined using water content analysis.
3.1.3.1 Infrared Spectroscopy
The infrared (IR) spectra of synthesized ionic liquids are obtained on a Perkin Elmer
Spectrum One Fourier Transform Infrared spectrometer. The ionic liquid samples
were sandwiched between two plates of a salt. The plates are transparent to the
infrared light and do not introduce any lines onto the spectra. The IR spectra produced
had wave number range of 600 – 4000 cm-1.
3.1.3.2 Spectrum NMR
In NMR, 5 to 10 mg of sample was dissolved in ±0.7 cm3 of Dimethylsulfoxide
(DMSO). The 1H and 13C NMR spectra were recorded at room temperature on JEOL
JNM-ECA400 or Bruker Avance 300 spectrometer. The 1H and 13C chemical shifts
(δ) are reported in parts per million (ppm) references with Tetra methyl silane (TMS)
as an internal standard. Multiplicities are abbreviated as s, singlet; d, doublet; t,
triplet; and m, multiplet.
73
3.1.3.3 Elemental Analysis
The composition of synthesized ionic liquids is determined using Elemental analyses
are measured using CHNS-932 (LECO Instruments) elemental analyzer. The
instrument was calibrated using standard calibration sample with known chemical
composition provided by supplier before each measurement. A sample size of ±2mg
was used for each measurement and the analysis for each sample was done at least 3
times and the average values were reported.
3.1.3.4 Water Content
Apart from routine structure analysis and determination, it is essential that ionic
liquids are analyzed for its water content. Measurement of water content is an
important aspect in the synthesis and characterization of ionic liquids. Ideally the
ionic liquids should be dried until it contains negligible water content. In most cases,
the water contents of ionic liquids are reported in the range between 100 to 10000
ppm. In this work, the water content of ionic liquids is determined using a coulometer
Karl Fischer titrator, DL 39 (Mettler Toledo) with the Hydranal coulomat AG reagent
(Riedel-de Haen).
3.2 Measurement of Physical Properties
Once the ionic liquids are dried until it contained less than 500 ppm of water, it is then
measured for its physical properties. The ionic liquids are kept in vial with PTFE
septum under electronic desiccators. For physical properties measurements, the
samples are taken using syringe equipped with needle. This is done to avoid
absorption of water and moisturizer into the ionic liquids, as the synthesized ionic
liquids are highly hygroscopic and the presence of water can affect its physical
properties. The physical properties of interest in this work include density, viscosity,
and refractive index.

74
3.2.1 Density
The density of pure ionic liquids is measured using a densimeter, Anton Paar DMA
5000 (Anton Paar, Austria). The apparatus is calibrated regularly by measuring the
density of Millipore quality water (SH Calibration Service GmbH, Graz) and dried air
according to the prescribed manual. The calibrated apparatus is also verified using
organic solvents and commercial ionic liquids, and found to be with in the adjusted
uncertainty of the apparatus. The procedure for the density measurements of all the
samples is conducted according to the following steps;
1. Cleaning and drying of measuring cell
Suitable solvents are used to clean and dry the measuring cell. Two solvents are used,
the first solvent is used to clean up the measuring cell while the second solvent is used
to remove the residue of the first solvent and also to dry the measuring cell. In the
present work, methanol and acetone are used as the first and second solvent,
respectively. As the synthesized ionic liquids have high solubility in methanol, it will
be easy to remove the remaining sample in the measuring cell. The residue of
methanol in the measuring cell is removed by adding the second solvent. These
solvents are injected several times into the measuring cell using syringe. Later, dry air
is blown through the measuring cell using a built in air pump for 5-10 minutes.
2. Measurement settings
The settings for density measurement of all samples are adjusted to work at ‘medium
equilibrium mode’. For pure ionic liquids, densities are measured at temperature from
(273.15 to 353.15) K while for binary mixture, their densities are measured at
temperature from (273.15 to 323.15) K. The measurement temperature is adjusted
from a low temperature to a high temperature with 5 K step increment from the initial
to the final temperature range.
3. Density measurement
The sample is taken from the vial with PTFE septum using syringe and slowly
injected into a U-tube measuring sample ensuring that there is no bubble present in

75
the cell by viewing through the optical window. The preset method is activated to
start the density measurement which is then recorded in the data memory.
3.2.1.1 Measurement of Density of 1 M HCl Solution
In addition to measurement of density of pure ionic liquids and binary mixture of
ionic liquids [BHEAF] with alcohol, the density of 1 M HCl solution in the presence
of various concentration of ionic liquids [BHEAF] are also measured using
picnometer. Pycnometer is used instead of Anton Paar Densimeter DMA-5000
because its vibrating tube is not compatible with acid solution. For this purpose, an
empty 25 ml calibrated-pycnometer is weight using analytical balance (Mettler
Toledo, model AS120S) with a precision of ± 0.0001 g. The pycnometer is then filled
with desired solution and weight the mass of pycnometer with the solution. The
density is then calculated on the basis of mass change of the volume.
3.2.2 Viscosity
The viscosities are measured using a SVM 3000 Stabinger Viscometer, (Anton Paar,
Austria). The apparatus is calibrated using few standard calibration fluids according to
instruction given by the supplier. The calibrated apparatus is also verified using
organic solvents and commercial ionic liquids, and found to be with in the adjusted
uncertainty of the apparatus.
The procedure for the viscosity measurements of all the samples is outlined
below;
1. Cleaning and drying of measuring cell
Toluene is used as the solvent to clean and dry the measuring cell. This solvent is
injected several times into the measuring cell using syringe. Later, dry air is blown
through the measuring cell using a built in air pump for 5-10 minutes.

76
2. Measurement settings
The settings for viscosity measurement of all samples are adjusted to work at
‘medium equilibrium method’. For pure ionic liquids, viscosities are measured at
temperature from (273.15 to 353.15) K while for binary mixture, their viscosities are
measured at temperature from (273.15 to 323.15) K. The measurement temperature is
adjusted from a low temperature to a high temperature with 5 K step increment from
the initial to the final temperature range.
3. Viscosity measurement
The sample is taken from vial with PTFE septum using syringe and slowly injected
into U-tube measuring sample ensuring that there is no bubble in the cell and followed
by pressing the START button to execute the viscosity measurement.
3.2.3 Refractive Index
The refractive indexes of pure ionic liquids and its binary mixtures with organic
solvents are determined using ATAGO programmable digital refractometer model
RX-5000 alpha, with measuring accuracy of ± 5104 . The apparatus is calibrated
frequently and before each series of sample measurements through determining the
refractive index of Millipore quality water. The calibrated apparatus is also verified
by measuring the refractive index of organic solvents and commercial ionic liquids.
The measuring procedure for refractive index consists of the following steps
1. Cleaning and drying of measuring cell
Water and acetone are used to clean and dry the prism measuring cell. Water is used
as synthesized ionic liquids have high solubility in water. Hence the ionic liquids
sample can be easily removed. Meanwhile, the water residue is dried using acetone. A
few drops of solvents are placed in the prism measuring cell and wiped using tissue.

77
2. Measurement setting
The refractive indexes of ionic liquids and its binary mixture with organic solvents are
measured at temperature from (273.15 to 323.15) K. The temperatures are maintained
using Julabo F26 water circulation. The measurement temperature is adjusted from a
low temperature to a high temperature with 5 K step increment from the initial to the
final temperature range.
3. Refractive index measurement
A sample is placed on cleaned prism which is covered with a lid followed by pressing
the START button to execute the refractive index measurement. The results are
displayed on LCD in few seconds.
3.2.4 Preparation of Binary Mixture
The binary mixtures of ionic liquids [BHEAF] with methanol, ethanol, and 1-
propanol are prepared in glass vials with PTFE septum. Samples are taken from the
vial with a syringe through a PTFE septum. The samples are prepared in an inert
atmosphere glove box, using an analytical balance (Mettler Toledo, model AS120S)
with a precision of ± 0.0001 g. A glove box is used because the ionic liquids are
highly hygroscopic, and small quantities of water can cause considerable change in
the physical properties. The possible error in the mole fraction calculations is
estimated to be around ± 0.0001.
Methanol, Ethanol, and 1-propanol used in the present study are supplied by
Merck (Merck, Malaysia) and is degassed ultrasonically and dried over molecular
sieves type 4Ǻ, (supplied by Aldrich) and kept in bottles with PTFE septum under
electronic desiccators with water contents of less than 4×10⁻⁵ mass fraction.
The physical properties of interest for the binary mixture of ionic liquids with
alcohol include density, viscosity, and refractive index, The measurement method
used are the same as before for the pure ionic liquids.
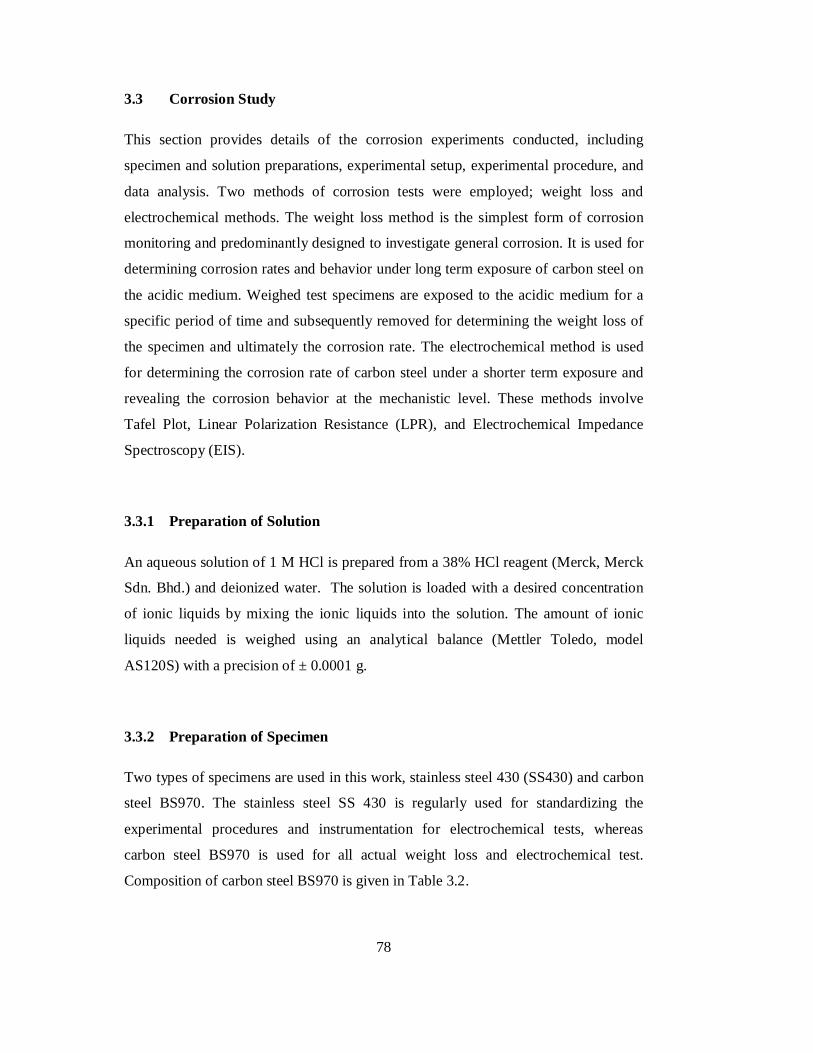
78
3.3 Corrosion Study
This section provides details of the corrosion experiments conducted, including
specimen and solution preparations, experimental setup, experimental procedure, and
data analysis. Two methods of corrosion tests were employed; weight loss and
electrochemical methods. The weight loss method is the simplest form of corrosion
monitoring and predominantly designed to investigate general corrosion. It is used for
determining corrosion rates and behavior under long term exposure of carbon steel on
the acidic medium. Weighed test specimens are exposed to the acidic medium for a
specific period of time and subsequently removed for determining the weight loss of
the specimen and ultimately the corrosion rate. The electrochemical method is used
for determining the corrosion rate of carbon steel under a shorter term exposure and
revealing the corrosion behavior at the mechanistic level. These methods involve
Tafel Plot, Linear Polarization Resistance (LPR), and Electrochemical Impedance
Spectroscopy (EIS).
3.3.1 Preparation of Solution
An aqueous solution of 1 M HCl is prepared from a 38% HCl reagent (Merck, Merck
Sdn. Bhd.) and deionized water. The solution is loaded with a desired concentration
of ionic liquids by mixing the ionic liquids into the solution. The amount of ionic
liquids needed is weighed using an analytical balance (Mettler Toledo, model
AS120S) with a precision of ± 0.0001 g.
3.3.2 Preparation of Specimen
Two types of specimens are used in this work, stainless steel 430 (SS430) and carbon
steel BS970. The stainless steel SS 430 is regularly used for standardizing the
experimental procedures and instrumentation for electrochemical tests, whereas
carbon steel BS970 is used for all actual weight loss and electrochemical test.
Composition of carbon steel BS970 is given in Table 3.2.

79
Table 3.1 The amount of ionic liquids needed to make 0.02, 0.04, 0.06, and 0.08 M of
solution
Concentration of inhibitor / M
0.02 0.04 0.06 0.08
HEF 2.14 4.28 6.43 8.57 HEA 2.42 4.85 7.27 9.69
HEP 2.70 5.41 8.11 10.81 HEL 3.02 6.05 9.07 12.09
BHEAF 3.02 6.05 9.07 12.09 BHEAA 3.30 6.61 9.91 13.22
BHEAP 3.58 7.17 10.75 14.34
BHEAL 3.90 7.81 11.71 15.62
BHEMF 3.30 6.61 9.91 13.22 BHEMA 3.58 7.16 10.75 14.33
BHEMP 3.86 7.73 11.59 15.46 BHEML 4.18 8.37 12.55 16.74
THEAF 3.90 7.81 11.71 15.62 THEAA 4.18 8.37 12.55 16.74
THEMP 4.47 8.93 13.40 17.86 THEAL 4.79 9.57 14.36 19.14
Table 3.2 Chemical composition of carbon steel BS 970.
Element Composition (%) Element Composition (%)
C 0.148 Cr 0.069
Si 0.175 Mo 0.014
Mn 0.799 Ni 0.065
P 0.01 Fe Balance
S 0.032

80
Figure 3.3 shows the sketches of specimens used for weight loss and
electrochemical experiments. Carbon steel BS970 with outer diameter of 12 mm is cut
into 10 mm long cylinder specimens, giving a specimen area of 113 mm2. Prior to the
tests, the specimens are prepared by wet grinding with 1200 grit silicon carbide paper
using isopropanol, cleaned with acetone in an ultrasonic bath and flushed with
ethanol. Then the specimens are blow-dried and mounted on the specimen holder. All
specimens are kept in a desiccator until it is used.
Figure 3.3 Illustration of the working electrode used for measurement of corrosion
experiment.
3.3.3 Weight Loss Method
This is the oldest, versatile and simplest technique, used both in laboratory and field,
to measure the average rate of uniform corrosion. The specimen used for these test is
called corrosion coupons. They can be rectangular or round and are usually stamped
for identification purposes. Surface finish of these coupons is important because
corrosion rate is very sensitive to the presence of surface defects and cold work.
Diamond or carbide abrasive papers are used in industries for cleaning the specimens.

81
The weight loss measurement method is based on the geometric weight loss. This
measurement requires long exposure time to reach measurable corrosion rate [1].
3.3.3.1 Experimental Procedures
The setup consists of 1 L beaker covered with Teflon lids, a heater equipped with
thermometer, and a pH meter. The test environment is maintained at the desired
temperature by means of the heater. The temperature is checked using thermometers
placed directly inside the cell. The weight loss of carbon steel coupon exposed to 1 L
of 1 M HCl solution at temperatures of 25, 40, 55, and 70 °C were determined after 24
h for acid solutions in the presence of various concentrations of ionic liquids used [22-
24].
3.3.3.2 Method of Cleaning Specimens after Test
Cleaning the specimens after the experiment is a vital step in the corrosion test
procedure. In this work, it is done by washing the specimen under running-tap water,
scrubbing and brushing lightly using a non metallic bristle brush to remove loose,
bulky corrosion products. Care should be taken to avoid the removal of sound metal.
The specimen is then dried with air and weighed [22-24].
3.3.3.3 Calculation of Corrosion Rate
The corrosion rate of carbon steel in the presence of various concentrations of ionic
liquids is calculated according to ASTM G1 - 03, Practice for Preparing, Cleaning,
and Evaluating using the following equation,
DTAWKCR
(3.1)
where CR is Corrosion rate in g·m-2·h-1, K is a constant (1.00 × 10⁴ × D), T is time of
exposure in hours to the nearest 0.01 h, A is area in cm2 to the nearest 0.01 cm2, W is

82
mass loss in g, to nearest 1 mg (corrected for any loss during cleaning, and ρ is
density of steel in g·cm-3.
3.3.3.4 Inhibition Calculation
The inhibition efficiency for all inhibitors is calculated using the equation 2.35,
100%
corr
inhcorrcorr
CRCRCR
IE (2.35)
3.3.4 Electrochemical Method
The setup consists of a corrosion cell, a potentiostat, a heater equipped with
thermometer, a gas supply set, and a data acquisition system. The corrosion cell is a
standard three electrode cell [25]. It is a fully equipped glass vessel used for
stimulating a corrosive environment. A schematic diagram of the corrosion cell is
shown in Figure 3.10. The potentiostat is an electronic device capable of supplying
and controlling the potentials of specimen (working electrode) and also measuring the
currents produced from the corrosion cell. An ACM potentiostat/galvanostat
providing an accuracy of ± 0.2% of the potential and current readings is used. To
ensure its performance, the potentiostat is calibrated regularly using a built in
calibration function mode.

83
Figure 3.4 General setup for the measurement of corrosion rate using three electrodes
configurations. (1) Glass cell, (2) N2 bubbler, (3) Reference electrode, (4) Working
electrode, (5) Counter electrode, (6) Thermometer, (7) pH meter, (8) Electrolyte
solution, and (9) Heater.
3.3.4.1 Tafel Plots
Tafel Plots is an electrochemical technique used to obtain some information on the
reaction mechanism of the inhibitor and also to evaluate its inhibition efficiency.
Unlike weight loss methods, which may take days or weeks, electrochemical
experiments is a rapid techniques which could be done in few hours. This is especially
useful for corrosion measurement of highly corrosion resistant metal or alloy. A Tafel
Plots is performed on a specimen by polarizing the specimen about ± 350 mV both
anodically and cathodically [22-24].
The corrosion cell, as shown in Figure 3.10, is filled with 1 L of 1 M HCl with
different concentration of ionic liquids. The top of the corrosion cell is covered with a
lid and fixed on the corrosion cell using two screws. A pre-polished coupon, reference
electrode, and counter electrode are installed and put the connection through the lid

84
cover. The three electrodes are connected to the ACM potentiostat/galvanostat and
kept for 90 minutes. Then, the potentiostat and the software were started and kept for
another 30 minutes to get stable open circuit potential (OCP). When stable OCP is
reached, the program is initiated to polarize the test electrode with ± 350 mV with
scan rate of 10 mV/minute. After completion, the data is imported to Excel file for Rp
values calculations. The Tafel Plot data measured by the software is plotted in Excel
file as potential vs. current densities for each run [22-24].
The inhibition efficiency for all inhibitors are calculated using the equation (2.36),
100%
corr
inhcorrcorr
iii
IE (2.36)
3.3.4.2 Linear Polarization Resistance
Linear Polarization Resistance (LPR) techniques is one of the most widely used
methods for measuring corrosion rate or inhibition efficiency of new inhibitor. LPR is
simple and rapid and when applied to aqueous electrolyte solutions, provides an
instantaneous measurement of corrosion rate. In fundamental terms, a small voltage of
polarization potential is applied to an electrode in solution. The current needed to
maintain a specific voltage shift, typically 10 mV, is directly related to the corrosion
on the surface of the electrode in the solution. By measuring the current, a corrosion
rate can be calculated. In this work, LPR is done using the same procedure for Tafel
plot, but the coupon is given a potential of 10 mV cathodically and anodically, instead
of 350 mV [22-24].
The inhibition efficiency for all inhibitors were calculated using equation (2.37),
100%
inhp
pinhp
RRR
IE (2.37)

85
3.3.4.3 Electrochemical Impedance Spectroscopy
The Electrochemical Impedance Spectroscopy (EIS) measurements are recorded
immediately after the LPR on the same electrode without any further surface
treatment. The response of the electrochemical system to alternating current (AC)
excitation with a frequency ranging mainly from 95 kHz to 0.1 Hz (in some cases
down to 0.03 Hz) and peak to peak amplitude of 10 mV was measured. The lock-in
amplifier technique is used in the frequency range of 5 Hz to 100 kHz with 5 points
per decade. Measurements below 10 Hz were performed using fast Fourier
transformation (FFT) technique with eight data cycles. All EIS are recorded at the
open circuit potential, i.e., at the corrosion potential Ecorr. Various equivalent circuit
models are fitted to the impedance data using a non-linear least squares fit procedure.
The inhibition efficiency is calculated using equation (2.33) [22-24],
100%
inht
tinht
RRR
IE (2.38)

CHAPTER 4
SYNTHESIS AND PHYSICAL PROPERTIES OF IONIC LIQUIDS
This chapter presents the experimental result on synthesis and physical properties of
the ionic liquids studied. Section 4.1 presents the result on synthesis and
characterization of the ionic liquids. The synthesized ionic liquids are characterized
using Spectroscopies infrared and 1H and 13C-NMR, CHN analysis, and its water
content. The result on measured physical properties of ionic liquids, namely density,
viscosity, and refractive index, are reported in section 4.2. The discussion is focused
on the effect of temperature on physical properties of the ionic liquids. A correlation
is developed to represent the temperature dependence of the physical properties of
ionic liquids. Moreover, from the temperature dependence of density, the coefficient
of thermal expansion is calculated. Finally, the effect of alcohol on the physical
properties of the ionic liquids is presented in section 4.3.
4.1 Hydroxyl Ammonium Ionic Liquids
In this work, 16 ionic liquids were synthesized. The chemical structure and
abbreviation is given in Table A.2 of Appendix A. The synthesized ionic liquids in
this work were liquids at room temperature, except for [THEAF]. [THEAF] is a white
solid. The same observation is reported in the literature [95]. This phenomenon can be
explained by looking through the structure of [THEAF]. [THEAF] has high symmetry
of cation with small size of anion thus enabling more efficient ion-ion packing in the
crystal cell of [THEAF]. Consequently, [THEAF] is solid at room temperature.

88
Further investigation using Differential Scanning Calorimetry (DSC) revealed that the
melting point of [THEAF] is 59°C. Hence, it still falls under ionic liquids category.
4.1.1 Infrared Spectrum
Figure 4.1 – 4.4 present the infrared (IR) spectra of synthesized ionic liquids in this
work. The two important areas for a preliminary examination of an IR spectrum are
the regions 4000 – 1300 and 900 – 650 cm-1. The high-frequency side of the IR
spectrum is attributed to the hydroxyl functional group within the ionic liquids. The
characteristic stretching frequencies for important functional group of synthesized
ionic liquids in this work such as hydroxyl (–OH), ammonium (–NH), and
carboxylate (–O–C=O) occur in this parts of the spectrum. The conversion of
carboxylic acid to a salt, in the case of ionic liquids, shows two characteristic carbonyl
absorption bands in addition to an ammonium band in the 2700 – 2200 cm-1 region
[179].
Figure 4.1 Infrared spectra of ionic liquids [HEF], [HEA], [HEP], and [HEL]
0
20
40
60
80
100
120
140
5001000150020002500300035004000
Tran
smitt
ance
/ %
Wavelength/cm-1
[HEL]
[HEP]
[HEF]
[HEL]
[HEA]
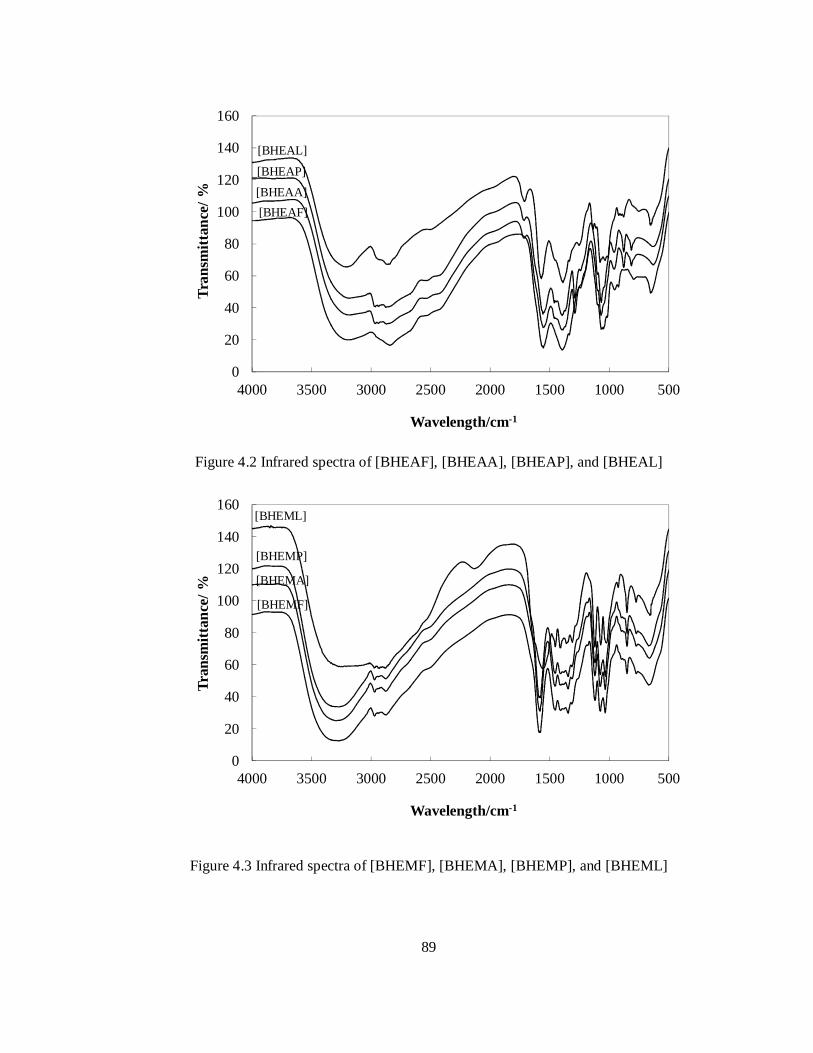
89
Figure 4.2 Infrared spectra of [BHEAF], [BHEAA], [BHEAP], and [BHEAL]
Figure 4.3 Infrared spectra of [BHEMF], [BHEMA], [BHEMP], and [BHEML]
0
20
40
60
80
100
120
140
160
5001000150020002500300035004000
Tran
smitt
ance
/ %
Wavelength/cm-1
[BHEAL]
[BHEAP]
[BHEAA][BHEAF]
0
20
40
60
80
100
120
140
160
5001000150020002500300035004000
Tran
smitt
ance
/ %
Wavelength/cm-1
[BHEML]
[BHEMP]
[BHEMF]
[BHEMA]

90
Figure 4.4 Infrared spectra of [THEAF], [THEAA], [THEAP], and [THEAL]
One of the characteristic bands observed in the IR spectra of the ionic liquids
resulted from the O–H stretching and C–O stretching. These vibrations are sensitive
to hydrogen bonding. Ionic liquids show intermolecular hydrogen bonding as a broad
band at 3172 cm-1. The C–O stretching vibrations produce a peak at 1066 cm-1. The
O–H in-plane bending vibration occurs in the general region of 1420 – 1330 cm-1. In
primary alcohol, as present in ionic liquids, the O–H in-plane bending couples with
the C–H wagging vibrations to produce two bands; the first near 1440 cm-1 and the
second near 1330 cm-1 [179]. Table 4.1 lists the regular peaks appear in the IR
spectrum of the synthesized ionic liquids.
The spectrum infrareds of the synthesized ionic liquids show similar feature,
vibration of hydroxyl functional group, amine salts, and carboxylic acid as expected
from hydroxyl ammonium ionic liquids. Therefore it can be concluded that the
synthesis method used in this work was successful.
0
20
40
60
80
100
120
140
160
5001000150020002500300035004000
Tran
smitt
ance
/ %
Wavelength/cm-1
[THEAL]
[THEAP][THEAA]
[THEAF]

91
Table 4.1 List of peak appear in the infrared spectrum of the synthesized ionic liquids
in this work
Peak Number (cm-1) Chemical group assignment [179].
3300 – 3030 N–H stretching vibration
3000 – 2800 asymmetrical and symmetrical stretching in the HN+ group
3000 – 2700 Salts of secondary amines
2700 – 2200 The conversion of carboxylic acid to a salt, in the case of
ionic liquids
1650 – 1550 The carboxylate anion
4.1.2 NMR Spectrum
Figure 4.5 and 4.6 present the 1H-NMR and 13C-NMR spectrum of [BHEAF],
respectively. The other NMR spectrums of the synthesized ionic liquids are given in
Appendix B. Figure 4.5 shows the 1H-NMR spectra for [BHEAF] which are in good
agreement with that reported in literature [95]. The proton at C-1 and C-2 showed
triplet peak and being deshielded effect of N+ ion at 2.81 and 3.48 ppm, respectively.
A broad peak is observed and centered at 4.53 ppm due to presence of hydrogen
attach to nitrogen and oxygen. Hydrogen attached in carboxylate anion, C-3, showed
single peak at 8.40 ppm. No extra peak is observed in the spectra indicating no
impurities on the ionic liquids [BHEAF].
Figure 4.3 shows the 13C-NMR spectra for [BHEAF]. 13C-NMR (400 MHz,
DMSO) δ 163.21 ppm (C carboxylate), 58.89 ppm (C-N), 39.40 (C-O) ppm. There are
no data reported in the literature for 13C-NMR spectrum of the other ionic liquids as
comparison. As can be seen from Figure 4.2 and 4.3, the spectrum of 1H and 13C-
NMR for [BHEAF] indicate that the synthesis of ionic liquids has been successful.

92
Figure 4.5 1H-NMR spectrum of [BHEAF].
Figure 4.6 13C-NMR Spectrum of [BHEAF].
The NMR results of the other ionic liquids show a similar general feature. The
number of hydrogen and carbon on the structure of the synthesized ionic liquids were
confirmed. Therefore it can be concluded that the synthesis method used in this work
was successful.

93
[HEF]: 1H-NMR (400 MHz, DMSO) δ 8.43 ppm (s, 1H, H–COO-), 6.12 ppm (broad,
4H, –NH and –OH), 3.60 ppm (t, 2H, –CH2–N), 2.87 ppm (t, 2H, –O–CH2). 13C-NMR
(400 MHz, DMSO) δ 167.41 ppm (C carboxylate), 58.25 ppm (C-N), 39.80 (C-O)
ppm.
[HEA]: 1H NMR (400 MHz, DMSO) δ 6.62 ppm (broad, 4H, –NH and –OH), 3.54
ppm (t, 2H, –CH2–N), 2.77 (t, 2H, –O–CH2), 1.72 ppm (s, 3H, H3C– COO-). 13C-
NMR (400 MHz, DMSO) δ 176.15 ppm (C carboxylate), 59.26 ppm (C-N), 39.68 (C-
O), 24.38 ppm (C-COO-).
[HEP]: 1H NMR (400 MHz, DMSO) δ 5.88 ppm (broad, 4H, –NH3 and –OH), 3.53
(t, 2H, –CH2–N), 2.77 (t, 2H, –CH2–N), 1.99 (m, 2H, –CH2– COO-), 0.92 (t, 3H,
H3C–C). 13C-NMR (400 MHz, DMSO) δ 178.70 ppm (C carboxylate), 59.77 ppm (C-
N), 42.52 (C-O), 30.33 ppm (C-COO-), 10.83 ppm (C, terminal carboxylate).
[HEL]: 1H-NMR (400 MHz, DMSO) δ 5.88 ppm (broad, 5H, –NH, –OH, and HO–C
Lactate), 3.53 ppm (t, 2H, –CH2–N), 2.80 ppm (t, 2H, –O–CH2), 2,52 ppm (m, 1H, –
CH– COO-), 1.13 ppm (d, 3H, H3C–C). 13C-NMR (400 MHz, DMSO) δ 175.25 ppm
(C carboxylate), 67.68 ppm (C-C carboxylate), 60.14 ppm (C-N), 40.06 (C-O), 21.88
(C, terminal carboxylate).
[BHEAF]: 1H-NMR (400 MHz, DMSO) δ 8.40 ppm (s, 1H, H–COO-), 4.53 ppm
(broad, 4H, –NH and –OH), 3.48 ppm (t, 4H, –CH2–N), 2.81 ppm (t, 2H, –O–CH2). 13C-NMR (400 MHz, DMSO) δ 163.28 ppm (C carboxylate), 58.89 ppm (C-N), 39.44
(C-O) ppm.
[BHEAA]: 1H NMR (400 MHz, DMSO) δ 5.52 ppm (broad, 4H, –NH3 and –OH),
3.55 ppm (t, 4H, –CH2–N), 2.76 (t, 4H, –O–CH2), 1.77 ppm (s, 3H, H3C– COO-). 13C-NMR (400 MHz, DMSO) δ 175.25 ppm (C carboxylate), 58.86 ppm (C-N), 40.04
ppm (C-O), 23.41 ppm (C-COO-).
[BHEAP]: 1H NMR (400 MHz, DMSO) δ 5.86 ppm (broad, 4H, –NH and –OH),
3.55 (t, 4H, –CH2–N), 2.78 (t, 4H, –CH2–N), 2.04 (m, 2H, –CH2– COO-), 0.98 (t, 3H,
H3C–C). 13C-NMR (400 MHz, DMSO) δ 177.73 ppm (C carboxylate), 58.82 ppm (C-
N), 39.74 (C-O), 29.05 ppm (C-COO-), 10.53 ppm (C, terminal carboxylate).
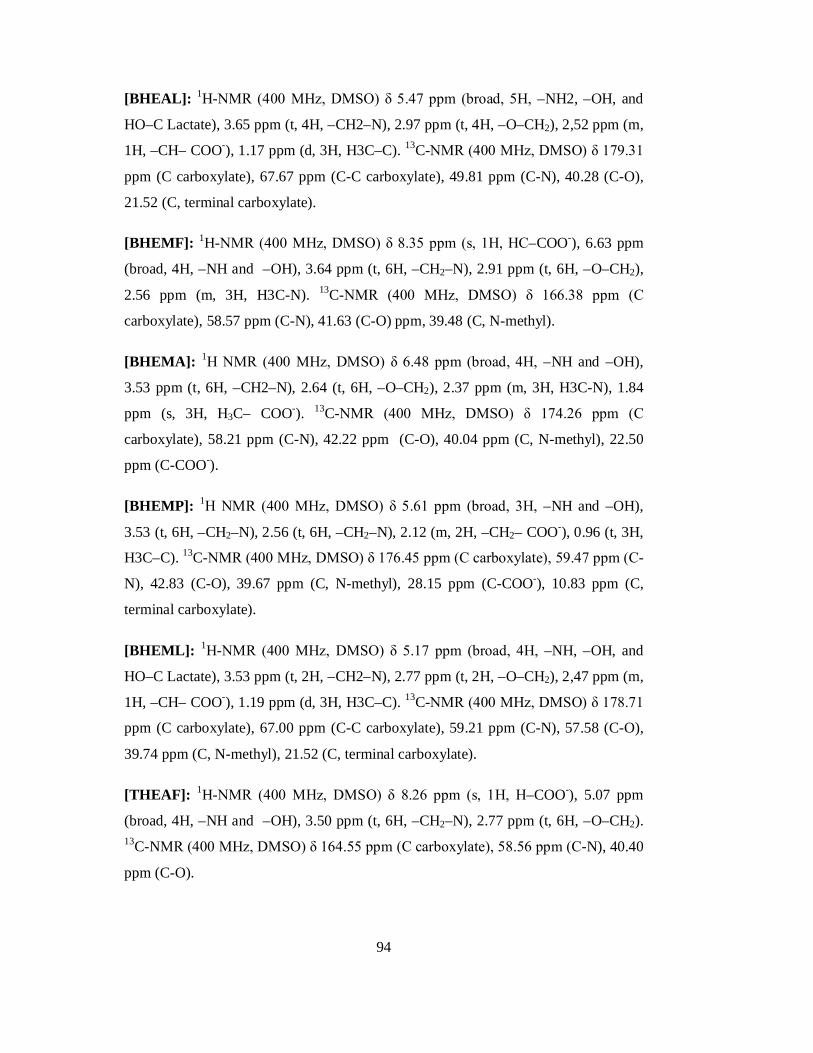
94
[BHEAL]: 1H-NMR (400 MHz, DMSO) δ 5.47 ppm (broad, 5H, –NH2, –OH, and
HO–C Lactate), 3.65 ppm (t, 4H, –CH2–N), 2.97 ppm (t, 4H, –O–CH2), 2,52 ppm (m,
1H, –CH– COO-), 1.17 ppm (d, 3H, H3C–C). 13C-NMR (400 MHz, DMSO) δ 179.31
ppm (C carboxylate), 67.67 ppm (C-C carboxylate), 49.81 ppm (C-N), 40.28 (C-O),
21.52 (C, terminal carboxylate).
[BHEMF]: 1H-NMR (400 MHz, DMSO) δ 8.35 ppm (s, 1H, HC–COO-), 6.63 ppm
(broad, 4H, –NH and –OH), 3.64 ppm (t, 6H, –CH2–N), 2.91 ppm (t, 6H, –O–CH2),
2.56 ppm (m, 3H, H3C-N). 13C-NMR (400 MHz, DMSO) δ 166.38 ppm (C
carboxylate), 58.57 ppm (C-N), 41.63 (C-O) ppm, 39.48 (C, N-methyl).
[BHEMA]: 1H NMR (400 MHz, DMSO) δ 6.48 ppm (broad, 4H, –NH and –OH),
3.53 ppm (t, 6H, –CH2–N), 2.64 (t, 6H, –O–CH2), 2.37 ppm (m, 3H, H3C-N), 1.84
ppm (s, 3H, H3C– COO-). 13C-NMR (400 MHz, DMSO) δ 174.26 ppm (C
carboxylate), 58.21 ppm (C-N), 42.22 ppm (C-O), 40.04 ppm (C, N-methyl), 22.50
ppm (C-COO-).
[BHEMP]: 1H NMR (400 MHz, DMSO) δ 5.61 ppm (broad, 3H, –NH and –OH),
3.53 (t, 6H, –CH2–N), 2.56 (t, 6H, –CH2–N), 2.12 (m, 2H, –CH2– COO-), 0.96 (t, 3H,
H3C–C). 13C-NMR (400 MHz, DMSO) δ 176.45 ppm (C carboxylate), 59.47 ppm (C-
N), 42.83 (C-O), 39.67 ppm (C, N-methyl), 28.15 ppm (C-COO-), 10.83 ppm (C,
terminal carboxylate).
[BHEML]: 1H-NMR (400 MHz, DMSO) δ 5.17 ppm (broad, 4H, –NH, –OH, and
HO–C Lactate), 3.53 ppm (t, 2H, –CH2–N), 2.77 ppm (t, 2H, –O–CH2), 2,47 ppm (m,
1H, –CH– COO-), 1.19 ppm (d, 3H, H3C–C). 13C-NMR (400 MHz, DMSO) δ 178.71
ppm (C carboxylate), 67.00 ppm (C-C carboxylate), 59.21 ppm (C-N), 57.58 (C-O),
39.74 ppm (C, N-methyl), 21.52 (C, terminal carboxylate).
[THEAF]: 1H-NMR (400 MHz, DMSO) δ 8.26 ppm (s, 1H, H–COO-), 5.07 ppm
(broad, 4H, –NH and –OH), 3.50 ppm (t, 6H, –CH2–N), 2.77 ppm (t, 6H, –O–CH2). 13C-NMR (400 MHz, DMSO) δ 164.55 ppm (C carboxylate), 58.56 ppm (C-N), 40.40
ppm (C-O).

95
[THEAA]: 1H NMR (400 MHz, DMSO) δ 5.53 ppm (broad, 4H, –NH and –OH),
3.65 ppm (t, 6H, –CH2–N), 2.79 (t, 6H, –O–CH2), 1.67 ppm (s, 3H, H3C– COO-). 13C-NMR (400 MHz, DMSO) δ 175.35 ppm (C carboxylate), 58.96 ppm (C-N), 40.14
ppm (C-O), 23.51 ppm (C-COO-).
[THEAP]: 1H NMR (400 MHz, DMSO) δ 5.78 ppm (broad, 4H, –NH and –OH),
3.43 (t, 6H, –CH2–N), 2.87 (t, 6H, –CH2–N), 1.98 (m, 2H, –CH2– COO-), 0.91 (t, 3H,
H3C–C). 13C-NMR (400 MHz, DMSO) δ 178.72 ppm (C carboxylate), 59.67 ppm (C-
N), 42.42 (C-O), 30.43 ppm (C-COO-), 10.82 ppm (C, terminal carboxylate).
[THEAL]: 1H-NMR (400 MHz, DMSO) δ 5.29 ppm (broad, 5H, –NH, –OH, and
HO–C Lactate), 3.58 ppm (t, 6H, –CH2–N), 2.90 ppm (t, 2H, –O–CH2), 2,57 ppm (m,
1H, –CH– COO-), 1.20 ppm (d, 3H, H3C–C). 13C-NMR (400 MHz, DMSO) δ 178.32
ppm (C carboxylate), 66.69 ppm (C-C carboxylate), 56.98 ppm (C-N), 39.42 (C-O),
21.23 (C, terminal carboxylate).
4.1.3 Elemental Analysis
The chemical composition is an important aspect in the synthesis and characterization
of ionic liquids. It determines the purity of the synthesized ionic liquids. In this work,
the chemical composition of the ionic liquids is measured using CHNS-932 (LECO
Instruments) elemental analyzer. The instrument was calibrated using standard
calibration sample with known chemical composition provided by supplier prior to
each measurement. Table 4.2 presents the result for elemental analysis of synthesized
ionic liquids. The experimental values are found to be in good agreement with the
calculated value. The standard deviation is found to be ±0.02 (wt%)

96
Table 4.2 Elemental analysis of synthesized ionic liquids
Ionic liquids Experimental (wt %) Calculated (wt %)
C H N C H N
[HEF] 33.71 8.41 13.10 33.64 8.47 13.08
[HEA] 39.69 9.11 11.53 39.66 9.15 11.56
[HEP] 44.49 9.60 10.29 44.43 9.69 10.36
[HEL] 39.71 8.60 9.21 39.73 8.67 9.27
[BHEAF] 39.79 8.61 9.21 39.73 8.67 9.27
[BHEAA] 43.62 9.11 8.47 43.63 9.15 8.48
[BHEAP] 46.94 9.52 7.79 46.91 9.56 7.82
[BHEAL] 43.11 8.72 7.15 43.07 8.78 7.18
[BHEMF] 43.70 9.12 8.45 43.63 9.15 8.48
[BHEMA] 46.89 9.52 7.76 46.91 9.56 7.82
[BHEMP] 49.67 9.89 7.29 49.72 9.91 7.25
[BHEML] 46.98 9.10 6.64 45.92 9.15 6.69
[THEAF] 43.11 8.69 7.20 43.07 8.78 7.18
[THEAA] 45.95 9.11 6.65 45.92 9.15 6.69
[THEAP] 48.48 9.42 6.21 48.42 9.48 6.27
[THEAL] 45.21 8.85 5.82 45.18 8.85 5.85
4.1.4 Water Content
Table 4.4 presents the values of the water content of the synthesized ionic liquids in
this work. As can be seen from Table 4.3, water content of these ionic liquids is found
to be less than 200 ppm. The standard deviation is found to be ±5 ppm.

97
Table 4.3 Water content of synthesized ionic liquids
Ionic liquids Water content (ppm) Ionic liquids Water content (ppm)
[HEF] 108 [BHEMF] 132
[HEA] 117 [BHEMA] 142
[HEP] 105 [BHEMP] 141
[HEL] 174 [BHEML] 139
[BHEAF] 128 [THEAF] 128
[BHEAA] 127 [THEAA] 169
[BHEAP] 115 [THEAP] 121
[BHEAL] 170 [THEAL] 172
4.2 Physical Properties of Ionic Liquids
The physical properties of new corrosion inhibitor must be determined before it
applies into the corrosive environment [1, 25]. However, most of the new corrosion
inhibitor in the literature is reported without their physical properties [4-9, 11, 12,
162-175]. In this work, the physical properties namely density, viscosity, and
refractive index of hydroxyl ammonium ionic liquids as new corrosion inhibitor were
measured and reported. In the following section, the results for density, viscosity, and
refractive index are discussed. First, the obtained data will be reported and compared
with literature where available. Thereafter, the effect of temperature on the respective
physical properties is reported and discussed. In general, for the ionic liquids
investigated in this study, there were lacks of literature found from previous study.

98
4.2.1 Density
The experimental density for all pure ionic liquids are presented in Table C.1 of
Appendix C. Prior to the measurement, the densimeter was calibrated regularly using
Millipore water and dried air according to the manual. The calibrated densimeter was
verified by measuring density of alcohol and 1-hexyl-3-methylimidazolium ionic
liquids. The densities of methanol, ethanol, and 1-propanol from this work are in good
agreement with the literature [122, 123, 125].
The density data for some of the studied ionic liquids are already available in the
open literature Table 4.4 lists the experimental densities of the ionic liquids measured
and compared with literature data. The experimental density values for [HEF] are
found to be slightly lower than those reported by Biçak (2005) and Yuan et al. (2007)
and notably higher than those given by Greave et al. (2006) and Igleasias et al.
(2008). This minor discrepancy could be due to the presence of impurities and the
variation of water content in the sample. Unfortunately, the authors have not
mentioned the water content in their sample.
Table 4.4 Comparison of density, ρ, values for pure ionic liquids and alcohol at T =
298.15 K.
Ionic Liquids ρ/g·cm-3
This work Literature
[HEF] 1.20025 1.184 [26]
1.204 [95]
1.17709 [97]
1.204 [180]
[HEA] 1.14622 1.176 [26]
1.120 [95]
[HEP] 1.10963 NA
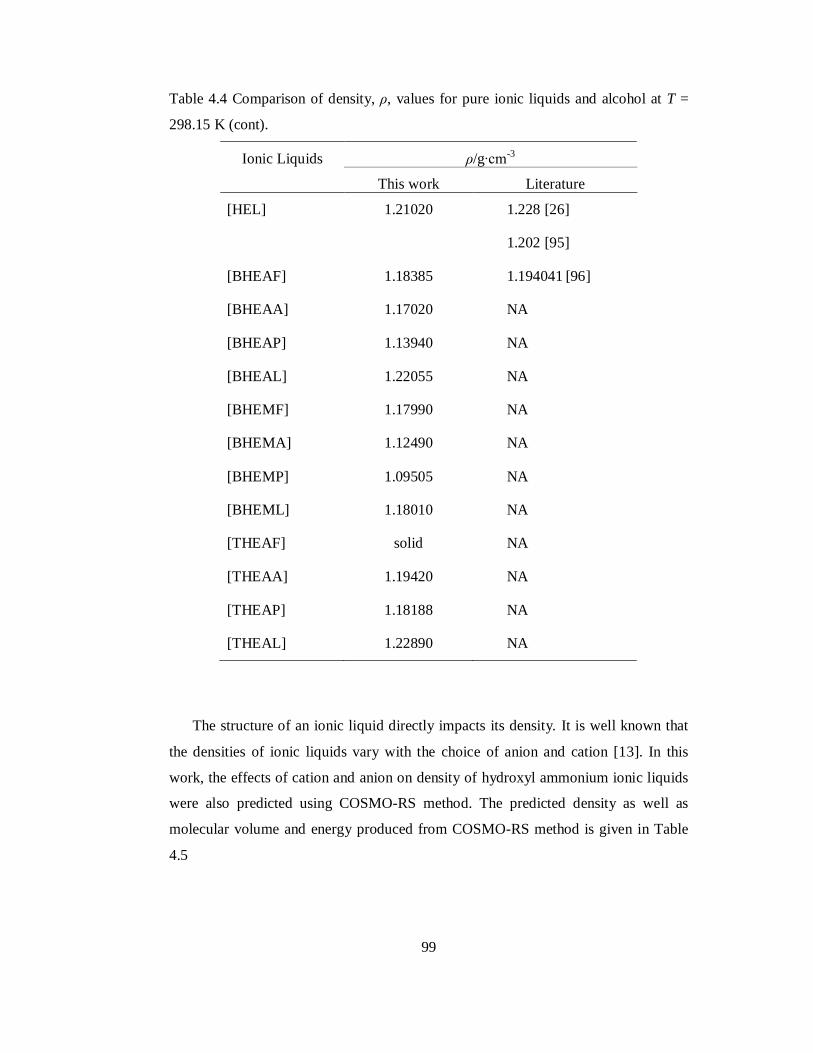
99
Table 4.4 Comparison of density, ρ, values for pure ionic liquids and alcohol at T =
298.15 K (cont).
Ionic Liquids ρ/g·cm-3
This work Literature
[HEL] 1.21020 1.228 [26]
1.202 [95]
[BHEAF] 1.18385 1.194041 [96]
[BHEAA] 1.17020 NA
[BHEAP] 1.13940 NA
[BHEAL] 1.22055 NA
[BHEMF] 1.17990 NA
[BHEMA] 1.12490 NA
[BHEMP] 1.09505 NA
[BHEML] 1.18010 NA
[THEAF] solid NA
[THEAA] 1.19420 NA
[THEAP] 1.18188 NA
[THEAL] 1.22890 NA
The structure of an ionic liquid directly impacts its density. It is well known that
the densities of ionic liquids vary with the choice of anion and cation [13]. In this
work, the effects of cation and anion on density of hydroxyl ammonium ionic liquids
were also predicted using COSMO-RS method. The predicted density as well as
molecular volume and energy produced from COSMO-RS method is given in Table
4.5

100
Table 4.5 The predicted density for hydroxyl ammonium ionic liquids using COSMO-
RS method.
Ionic liquids ρ/g·cm-3 V/nm3 Energy/kJ·mol-1
H_int H_MF H_HB H_vdW
[HEF] 1.0637 167.22 -48.42 2.63 -43.11 -7.94
[HEA] 1.0029 200.57 -53.48 3.20 -47.66 -9.01
[HEP] 0.9916 226.35 -54.27 3.39 -47.64 -10.02
[HEL] 1.0724 234.06 -45.27 3.13 -38.33 -10.07
[BHEAF] 1.1094 226.27 -41.87 6.13 -38.87 -9.67
[BHEAA] 1.0619 258.31 -46.86 6.66 -43.33 -10.75
[BHEAP] 1.0489 283.72 -48.05 6.45 -43.29 -11.76
[BHEAL] 1.1146 290.83 -40.70 5.00 -34.38 -11.80
[BHEMF] 1.0826 253.38 -30.13 9.59 -29.32 -10.40
[BHEMA] 1.0463 284.42 -34.48 10.09 -33.09 -11.47
[BHEMP] 1.0357 309.83 -36.10 9.55 -33.17 -12.48
[BHEML] 1.0979 316.47 -31.62 7.27 -26.39 -12.51
[THEAF] Solid
[THEAA] 1.0060 345.39 -57.48 7.01 -52.01 -12.49
[THEAP] 1.0001 370.70 -58.58 6.88 -51.96 -13.50
[THEAL] 1.0546 376.75 -49.96 5.38 -41.82 -13.52
Figure 4.7 presents the density of ionic liquids with 2-hydroxyethylammonium
cation and different anions. The experimental and predicted density using COSMO-
RS was found to be in qualitative agreement. It was observed that as the alkyl chain
length in the carboxylate anion increases, the density of the corresponding ionic
liquids decreases. According to COSMO-RS method, the density of ionic liquids are

101
influenced by size and interaction energy such as misfit (H_MF), hydrogen bond
(H_HB), and van der Walls (H_vdW). As the molecular volume increase from [HEF]
tp [HEP], the density of the ionic liquids decreases, reflecting higher misfit interaction
in the crystal lattice. Hence it was observed that the order of decreasing density for
ionic liquids composed of singe anion is formate > acetate > propionate. The same
trend is also observed for the other three cations when they coupled with this anion.
Figure 4.7 Density of ionic liquids Bis(2-hydroxyethyl)ammonium with different
anion at temperature 298.15 K.
The misfit energy arises from the unbalance atom to form hydrogen bonding
between cation and anion e.g. the 2-hydroxyethylammonium contain 3 hydrogen
becoming donor, however the anion could only accommodate 1 hydrogen on their
oxygen-carboxylate of the anion. The introduction of the (HO–) group into propionate
anion, as in lactate anion, would increase the density due to the extra hydrogen
bonding accommodated. Thus, it reduces the misfit interaction. From Figure 4.7,
[HEL] shows the highest value of density. The same trend is also observed with
lactate anion coupled with three other cations studied in this work.
0.0
0.2
0.4
0.6
0.8
1.0
1.2
1.4
1.6
[HEF] [HEA] [HEP] [HEL]
Ionic Liquids
Den
sity/
g∙cm
-3
COSMO-RS
Exp

102
The effect of cation size and structure is also studied. Figure 4.8 presents the ionic
liquids with different cation coupled with acetate. The presence of (HO–) group
would increase the density due to the hydrogen bonding. The experimental and
predicted density was found in the same trend, except for the tris(2-
hydroxyethyl)ammonium cation. The graph indicates that the order of increasing
density for ionic liquids with single cation is [HEA] < [BHEAA] < [THEAA].
However, the predicted density showed that density of [BHEAA] is higher than
[THEAA]. The difference maybe caused by the uncompleted conformer used for
tris(2-hydroxyethyl)ammonium cation in COSMO-RS.
Figure 4.8 Density of ionic liquids with acetate and different cation at temperature
298.15 K.
0.0
0.2
0.4
0.6
0.8
1.0
1.2
1.4
1.6
[HEA] [BHEAA] [THEAA] [BHEMA]
Ionic Liquids
Den
sity/
g∙cm
-3
COSMO-RS
Exp

103
On the other hand, addition of methyl chain into Bis(2-hydroxyethyl)ammonium
cation, as in the case of Bis(2-hydroxylethyl)methylammonium cation, would
decrease the density due to bigger size of the latter cation. The same trend was also
observed for predicted density data. According to COSMO-RS, addition of methyl
chain increase the misfit interaction in the ionic liquids, thus it was observed that, for
the same anion, the densities of ionic liquids with Bis(2-
hydroxylethyl)methylammonium cation is lower than Bis(2-hydroxyethyl) ammonium
cation.
4.2.1.1 Effect of Temperature on Density of Ionic Liquids
The experimental data for the densities of the ionic liquids from temperature (293.15
to 353.15) K were fitted to equation (2.1a) using the method of least squares,
Taa 10 (2.1a)
with is the density of the ionic liquids, T is absolute temperature; oa and 1a are the
fit parameters determined by applying the Newton-Rhapson numerical method with
confidence level of 95%. Fit parameters are listed in Table 4.6 along with their
standard deviation, σ, calculated using equation (4.1),
DAT
n
ical
n
ZZDAT
2exp )(
(4.1)
The standard deviation between experimental density and prediction using equation
(2.1a) was found to be less than 0.0015. It indicates that the correlation presented in
Table 4.8 can be used to predict the density of the synthesized ionic liquids within the
temperature range studied in this work.

104
Table 4.6 Fit parameter for temperature dependence of density calculated using
equation (2.1) and its standard deviation calculated using equation (4.1)
a0 104· a1 σ a0 104· a1 σ
[HEF] 1.3390 -4.6821 0.0005 [BHEMF] 1.3996 -7.3650 0.0004
[HEA] 1.3048 -5.3114 0.0007 [BHEMA] 1.3598 -7.8792 0.0001
[HEP] 1.2903 -6.0607 0.0002 [BHEMP] 1.4006 -10.2358 0.0011
[HEL] 1.3852 -5.8571 0.0004 [BHEML] 1.3658 -6.2342 0.0004
[BHEAF] 1.3936 -7.0275 0.0005 [THEAF] 1.4276 -6.3500 0.0001
[BHEAA] 1.3441 -5.8375 0.0002 [THEAA] 1.3688 -5.8493 0.0003
[BHEAP] 1.3113 -5.7725 0.0005 [THEAP] 1.3556 -5.8233 0.0004
[BHEAL] 1.4165 -6.5692 0.0008 [THEAL] 1.4015 -5.7942 0.0004
The plot of experimental density as function of temperature for the synthesized
ionic liquids is given in Figures 4.9 to 4.12. A decrease in the densities of the studied
ionic liquids was observed with an increase in temperature. The experimental data for
density of [HEF], [BHEAF], and [THEAF] within the temperature range of 293.15 to
353.15 K and its polynomial correlations using equation (2.1) are plotted with solid
lines shown in Figure 4.9. The densities of [THEAF] were found to be in good
agreement with literature [96]. On the other hand, the densities of [HEF] in the
temperature range studied were slightly higher compared to literature. Meanwhile, the
densities of [BHEAF] were slightly lower compared to the literature. The differences
may be attributed to the purity and water content of the sample. However, the
previous author did not mention on the water content in their ionic liquids [96].

105
Figure 4.9 Density of ionic liquids with formate anion and different cation as function
of temperature. Symbols: ■, [HEF] this work; □, [HEF] [96]; ♦, [BHEAF] this work;
◊, [BHEAF] [96]; ▲, [THEAF] this work; ∆, [THEAF] [96]; and (---) Correlation
using equation (2.1).
Figure 4.10 Density of ionic liquids with acetate anion and different cation as function
of temperature. Symbols: ▲, [HEA]; ♦, [BHEAA]; ■, [BHEMA]; ×, [THEAA]; and
(---) Correlation using equation (2.1).
1.00
1.05
1.10
1.15
1.20
1.25
1.30
293.15 303.15 313.15 323.15 333.15 343.15 353.15
Den
sity/
g·cm
-3
Temperature/K
1.04
1.08
1.12
1.16
1.20
1.24
293.15 313.15 333.15 353.15
Den
sity/
g∙cm
-3
Temperature/K

106
Figure 4.11 Density of ionic liquids with propionate anion and different cation as
function of temperature. Symbols: ▲, [HEP]; ♦, [BHEAP]; ■, [BHEMP]; ×,
[THEAP]; and (---) Correlation using equation (2.1).
Figure 4.12 Density of ionic liquids with lactate anion and different cation as function
of temperature. Symbols: ▲, [HEP]; ♦, [BHEAP]; ■, [BHEMP]; ×, [THEAP]; and (--
-) Correlation using equation (2.1).
1.00
1.04
1.08
1.12
1.16
1.20
293.15 313.15 333.15 353.15
Den
sity/
g∙cm
-3
Temperature/K
1.12
1.16
1.20
1.24
293.15 313.15 333.15 353.15
Den
sity
/g∙c
m-3
Temperature/K

107
4.2.2 Coefficient of Thermal Expansion
From density-temperature dependence, one can calculate the volume of expansivity or
also known as the coefficient of thermal expansion using equation (2.2),
PP TTV
V
11 (2.2)
The results of the analysis for the pure synthesized ionic liquids are listed in Table
B.2 of Appendix B. The values are comparable to the coefficient of thermal expansion
of the imidazolium and amino acid based ionic liquids [181-192]. Figure 4.13 presents
the plots of the coefficient of thermal expansion, , for the ionic liquids [HEF],
[BHEAF], [THEAF], and methanol as function of temperatures. The coefficient of
thermal expansion for [HEF] in this work was found to be slightly lower than
literature. This is due to the difference on experimental density, which is slightly
higher than literature [96].
Figure 4.13 Coefficient of thermal expansion of ionic liquids and methanol at several
temperatures. Symbols: ■, [HEF] this work; □, [HEF] [96]; ♦, [BHEAF] this work; ◊,
[BHEAF] [96]; ▲, [THEAF] this work; ∆, [THEAF] [96]; ×, methanol, this work; ○,
methanol [122].
0.0000
0.0002
0.0004
0.0006
0.0008
0.0010
0.0012
0.0014
293.15 303.15 313.15 323.15 333.15 343.15 353.15
Coe
fficn
t of t
herm
al e
xpan
sion
/T -1
Temperature/K

108
The coefficients of thermal expansion for both ionic liquids and methanol
increased with increasing temperature. This is a typical behavior for fluids in general
[112, 122]. The coefficients of thermal expansion of pure ionic liquids are
considerably less dependent on temperature when compared to methanol and were
found to be at lower values which show the impact of the difference in molecule
packing between ionic liquids and alcohol. Ionic liquids composed solely of ions
whereas alcohols are molecular solvent. One possible explanation for this phenomena
is that the coefficient of thermal expansions for ionic liquids are governed by the van
der Waals forces as well as strong electrostatic interactions between cation and anion
of the ionic liquids, thus causing it to be less influenced by temperature [101, 113].
4.2.3 Viscosity
Table 4.7 presents the experimental viscosity of pure ionic liquids and is compared to
the literature data. For the viscosity of [HEF], three data points are available in the
literature. Greaves et al. determined a viscosity of 220 mPa·s [26]. The authors give
no information on their measurements method. They also did not specify the purity of
the sample, its water content, and the uncertainty of their measurements. Yuan et al.
determined a viscosity of 118 mPa.s using NDJ-1 rotary type viscometer [95]. Bicak
determined a viscosity of 105 mPa·s at 298.15 K [180]. Viscosity was determined by
capillary viscometer method using a Canon-Fenske viscometer in a termostated bath.
The viscosities were given in terms of centi Poisse (cp), using distilled water as
reference. The author also did not specify the purity of the sample, its water content,
and the uncertainty of their measurements. These deviations may be attributed to the
difference in the water content and method to measure its viscosity.

109
Table 4.7 Comparison of viscosity values for pure ionic liquids at T = 298.15 K
Ionic Liquids η/mPa·s
This work Literature
[HEF] 130.67 118 [95]
220 [26]
105 [180]
[HEA] 409.72 640 [95]
701 [26]
[HEP] 284.14 NA
[HEL] 624.44 1200 [95]
1324 [26]
[BHEAF] 234.93 NA
[BHEAA] 761.43 NA
[BHEAP] 480.18 NA
[BHEAL] 963.05 NA
[BHEMF] 491.4 NA
[BHEMA] 625.31 NA
[BHEMP] 324.81 NA
[BHEML] 679.03 NA
[THEAF] Solid NA
[THEAA] 1920.7 NA
[THEAP] 1922.0 NA
[THEAL] 2785.6 NA

110
In general, the viscosity of ionic liquids is also governed by Coulomb forces like
van der Waals interactions and hydrogen bonding besides the entanglement between
the molecules. Hasse and co-worker stated in their work that charge delocalization
within the anion weakens the intermolecular hydrogen bonding with the cation,
leading to lower viscosities if not overcompensated by van der Waals interactions
[105]. For the ionic liquids containing the 2-hydroxyethnamaninium cation, the
highest viscosity found for [HEA] can be explained with the long side chain of the
anion, which increases the contributions to viscosity by entanglement and van der
Waals interactions. It is worth mentioning that more basic anions lead to tighter ion
pairing between the cation and the anion, which also increases the intermolecular
bonds such as hydrogen bonding [105]. The formate anion exhibits the lowest
viscosity, followed by propionate anion, which is in agreement with the order of the
viscosity of the three ionic liquids. Also for the comparison of different ionic liquids
containing the same anion, 2-hydroxytehanaminium exhibits the lowest viscosity,
followed by bis(2-hydroxyethyl)methylammonium and bis(2-hydroxyethyl)
ammonium. It is evident that a higher viscosity is caused by an increasing alkyl chain
length of the cation [13, 112].
4.2.3.1 Effect of Temperature on Viscosity of Ionic Liquids
Figure 4.14 shows the effect of temperature on viscosities of some ionic liquids. A
decrease in the viscosity of the studied ionic liquids was observed with increasing
temperature. The same trend was observed for the other synthesized ionic liquids in
this work. No previous data as a function of temperature has been reported in
literature for these systems for comparison.
The experimental data obtained for viscosities of the ionic liquids within the
temperature range of 293.15 to 353.15 K were fitted using the method of least squares
to the equation (2.4b) [140],
221
0logTb
Tbb (2.4b)

111
Figure 4.14 Viscosity of ionic liquids as function of temperature. Symbols: □, [HEF];
◊, [HEA]; Δ, [HEP]; and ×, [HEL].
The fitted parameters are listed in Table 4.8, along with their standard deviation
calculated using equation (4.1). The experimental data for viscosity of [HEF], [HEA],
[HEP], and [HEL] within the temperature range of 293.15 to 353.15 K and its
polynomial correlations using equation (4.2) are plotted with solid lines shown in
Figure 4.15. The standard deviation between experimental viscosity and prediction
using equation (2.4b) was found to be less than 0.005. It indicates that the correlation
presented in Table 4.8 can be used to predict the viscosity of the synthesized ionic
liquids within the temperature range studied in this work.
0
100200
300400500
600700
800900
1000
293.15 303.15 313.15 323.15
Visc
osity
/mPa
·s
Temperature/K

112
Figure 4.15 Viscosities of ionic liquids from temperature (293.15 to 353.15) K and its
polynomial correlation using equation (4.2) (····). Symbols: □, [HEF]; ◊, [HEA]; Δ,
[HEP]; and ×, [HEL].
Table 4.8 Fit parameter for temperature dependence of viscosity calculated using
equation (2.4) and its standard deviation calculated using equation (4.1).
Ionic liquids b0 b1 b2 σ
[HEF] 0.8642 47.184 -394.51 0.002
[HEA] 0.9101 60.800 -454.05 0.002
[HEP] 0.7324 65.133 -548.72 0.003
[HEL] 0.9613 68.943 -573.99 0.002
[BHEAF] 0.8219 58.151 -482.28 0.002
[BHEAA] 0.7352 81.203 -687.58 0.002
[BHEAP] 0.8237 69.501 -572.44 0.003
[BHEAL] 0.9180 76.507 -616.41 0.004
0.0
0.5
1.0
1.5
2.0
2.5
3.0
3.5
0.0028
log(
visc
osity
)/mPa
·s
1/Temperature (K-1)

113
Table 4.8 Fit parameter for temperature dependence of viscosity calculated using
equation (2.4) and its standard deviation calculated using equation (4.1) (cont)
Ionic liquids b0 b1 b2 σ
[BHEMF] 1.0958 59.923 -497.27 0.003
[BHEMA] 0.9578 69.042 -572.98 0.003
[BHEMP] 0.8648 62.050 -518.33 0.003
[BHEML] 1.1997 59.262 -460.97 0.002
[THEAF] 1.5144 119.157 -2088.59 0.001
[THEAA] 1.4257 69.501 -572.44 0.003
[THEAP] 1.1567 78.946 -639.21 0.004
[THEAL] 1.3178 78.946 -639.21 0.004
4.2.4 Refractive Index
The refractive index of the synthesized ionic liquids is measured using ATAGO RX-
5000 at a temperature of 293.15 to 353.15 K with intervals of 5 K. The experimental
results are given in Table B.4 of Appendix A. Prior to the measurement of the
refractive index calibration of the refractometer is done by measuring the refractive
index of selected organic solvent and imidazolium ionic liquids with known refractive
index within the temperature range of 293.15 to 323.15 K. Apparently there were no
previous data reported in literature on refractive index for the ionic liquids studied in
this work.
4.2.4.1 Effect of Temperature on Refractive Index of Ionic Liquids
The experimental data for the refractive index of the ionic liquids from temperature
293.15 to 353.15 K were fitted using the method of least squares to equation (2.5) in
order to determine its coefficient,

114
TccnD 10 (2.5)
where Dn is density of ionic liquids, T is absolute temperature, and oc and 1c are the
fitted parameters determined by applying the Newton-Rhapson numerical method
with confidence level of 95%. Fit parameters are listed in Table 4.9, along with their
standard deviation, σ, and calculated using equation (4.1). Figure 4.16 shows the
effect of temperature on the refractive index of the ionic liquids. The refractive index
of the ionic liquids decreased with increasing temperature. The same trend was
observed for the other synthesized ionic liquids in this work. No previous data as a
function of temperature has been reported in literature for these systems for
comparison.
Table 4.9 Fit parameter for temperature dependence of refractive index calculated
using equation (2.5) and its standard deviation calculated using equation (4.1).
ILs a0 104· a1 σ ILs a0 104· a1 σ
[HEF] 1.5194 -1.5672 0.0001 [BHEMF] 1.5352 -2.1588 0.0001
[HEA] 1.5135 -1.5611 0.0001 [BHEMA] 1.5322 -2.1546 0.0001
[HEP] 1.5272 -2.0486 0.0005 [BHEMP] 1.5282 -2.1561 0.0001
[HEL] 1.5373 -2.0463 0.0001 [BHEML] 1.5495 -2.6083 0.0001
[BHEAF] 1.5398 -2.2704 0.0002 [THEAF] Solid
[BHEAA] 1.5353 -2.2637 0.0001 [THEAA] 1.5479 -2.5100 0.0001
[BHEAP] 1.5307 -2.2457 0.0002 [THEAP] 1.5338 -2.1567 0.0001
[BHEAL] 1.5286 -1.7080 0.0006 [THEAL] 1.5322 -2.2474 0.0002

115
Figure 4.16 Refractive index of ionic liquids as function of temperature and its
polynomial correlation using equation (2.1) (····). Symbols: □, [HEF]; ◊, [HEA]; Δ,
[HEP]; and ×, [HEL].
4.3 Effect of Alcohol on Physical Properties of Ionic Liquids
In practical condition, corrosion inhibitor is mixture between active components, co-
solvent, and surfactant. Thus, it is important to understand the behavior of ionic
liquids, as the active component, and co-solvent [1, 25]. The co-solvent used shall not
react with the active component. For this purpose, alcohol is widely used as co-
solvent [1, 25]. In this work, co-solvents used were methanol, ethanol, and 1-
propanol. Ionic liquids [BHEAF] was chosen as the model for ionic liquids, since it
has the highest inhibition efficiency.

116
4.3.1 Density of Binary Mixture and Volumetric Properties
Prior to measuring the density of {[BHEAF](1) + alcohol(2)} binary mixture, the
densimeter was used to measure the density of a mixture containing [HEF] and
methanol for testing The data are plotted in Figure 4.17 and compared with literature
[97]. As can be seen from Figure 4.17, the densities of {[HEF](1) +
methanol(2)}binary mixture increases with increasing mole fraction of ionic liquids
and are in good agreement with data from literature [97].
To study the effect of alcohol composition and temperature on the density of
{[BHEAF](1) + alcohol(2)} binary mixture, 13 different composition of
{[BHEAF](1) + alcohol(2)} binary mixtures were prepared and their density
measured at several temperature from 293.15 to 323.15 K. The results are given in
Table C.1 of Appendix C.
Figure 4.17 Densities of {[HEF](1) + methanol(2)}binary mixture at temperature
298.15 K Symbols: ■, this work; □, Igleasias et al. [97]
0.0
0.2
0.4
0.6
0.8
1.0
1.2
1.4
0.0 0.2 0.4 0.6 0.8 1.0
Den
sity/
g·cm
-3
Mole fraction of [HEF]
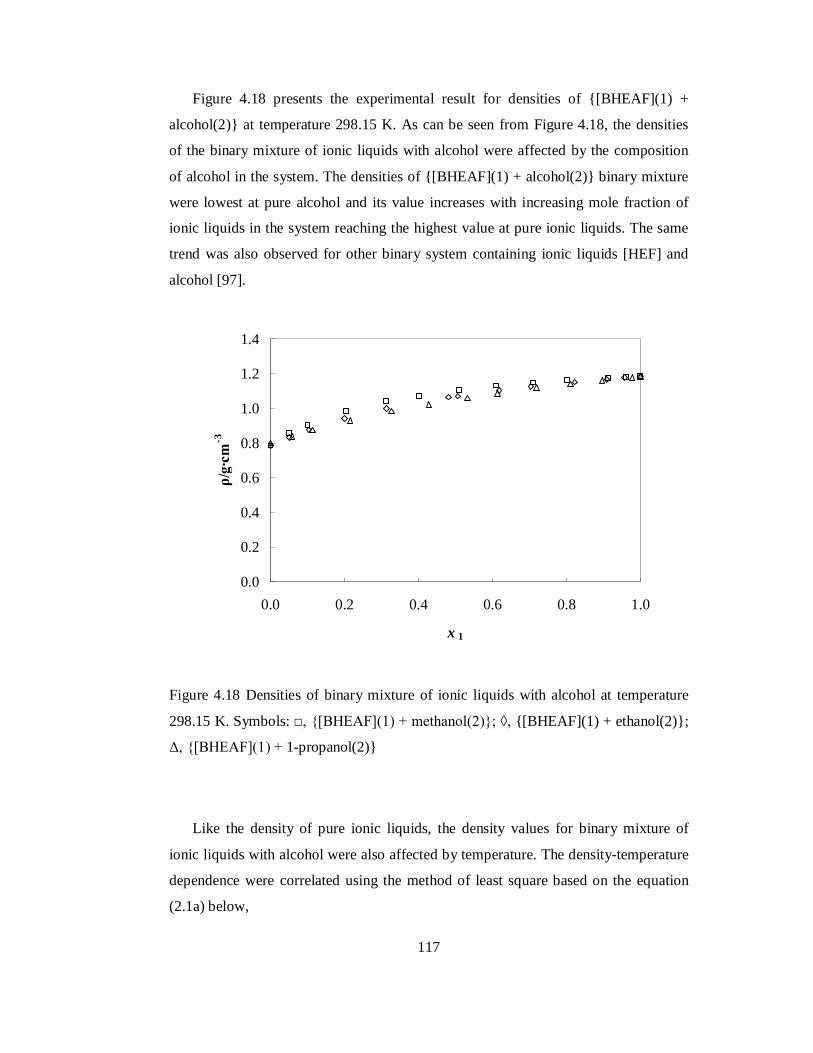
117
Figure 4.18 presents the experimental result for densities of {[BHEAF](1) +
alcohol(2)} at temperature 298.15 K. As can be seen from Figure 4.18, the densities
of the binary mixture of ionic liquids with alcohol were affected by the composition
of alcohol in the system. The densities of {[BHEAF](1) + alcohol(2)} binary mixture
were lowest at pure alcohol and its value increases with increasing mole fraction of
ionic liquids in the system reaching the highest value at pure ionic liquids. The same
trend was also observed for other binary system containing ionic liquids [HEF] and
alcohol [97].
Figure 4.18 Densities of binary mixture of ionic liquids with alcohol at temperature
298.15 K. Symbols: □, {[BHEAF](1) + methanol(2)}; ◊, {[BHEAF](1) + ethanol(2)};
Δ, {[BHEAF](1) + 1-propanol(2)}
Like the density of pure ionic liquids, the density values for binary mixture of
ionic liquids with alcohol were also affected by temperature. The density-temperature
dependence were correlated using the method of least square based on the equation
(2.1a) below,
0.0
0.2
0.4
0.6
0.8
1.0
1.2
1.4
0.0 0.2 0.4 0.6 0.8 1.0
x 1
ρ/g∙
cm -3
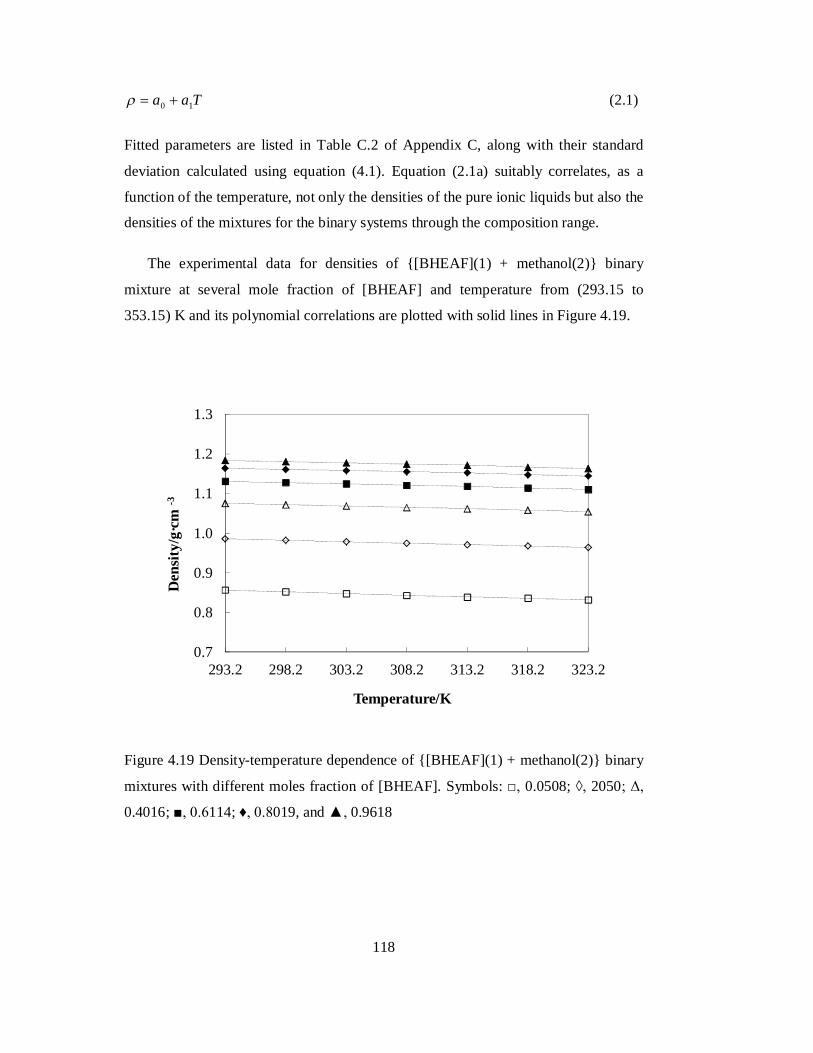
118
Taa 10 (2.1)
Fitted parameters are listed in Table C.2 of Appendix C, along with their standard
deviation calculated using equation (4.1). Equation (2.1a) suitably correlates, as a
function of the temperature, not only the densities of the pure ionic liquids but also the
densities of the mixtures for the binary systems through the composition range.
The experimental data for densities of {[BHEAF](1) + methanol(2)} binary
mixture at several mole fraction of [BHEAF] and temperature from (293.15 to
353.15) K and its polynomial correlations are plotted with solid lines in Figure 4.19.
Figure 4.19 Density-temperature dependence of {[BHEAF](1) + methanol(2)} binary
mixtures with different moles fraction of [BHEAF]. Symbols: □, 0.0508; ◊, 2050; Δ,
0.4016; ■, 0.6114; ♦, 0.8019, and ▲, 0.9618
0.7
0.8
0.9
1.0
1.1
1.2
1.3
293.2 298.2 303.2 308.2 313.2 318.2 323.2
Den
sity/
g·cm
-3
Temperature/K

119
4.3.1.1 Excess Molar Volume
The excess molar volumes for the binary mixture of ionic liquids with alcohol are
calculated using equation (2.10),
2
22
1
112211
MxMxMxMxV
mix
Em (2.10)
The values of EmV for binary mixture of ionic liquids with alcohol are listed in Table
C.3 of Appendix C.
The excess molar volume are fitted with the Redlich-Kister polynomial equation,
kji
kkjiij xxAxxQ )(
0
(2.11)
The fitted parameters of the Redlich-Kister polynomial equation for excess molar
volume of binary mixture of ionic liquids with alcohol are listed in Table C.4 of
Appendix C.
The values of excess molar volume for {[BHEAF](1) + methanol(2), or
ethanol(2), or 1-propanol(2)} binary mixture at temperature 298.15 K, as well as its
Redlich-Kister fits are plotted in Figure 4.20. The graphs of EmV indicate that all
mixture of {[BHEAP](1) + alcohol(2)} exhibit negative deviations from ideality over
the entire composition range. The negative excess molar volumes indicate that a
tighter packing and/or attractive interaction occurred when the ionic liquids and
alcohol were mixed. The same behavior was also observed for binary mixture of
imidazolium ionic liquids and alcohol [122-124]. Graphs depict also the
unsymmetrical behavior of the changes in the excess molar volumes with composition
for these systems. The values of EmV become more negative from 1-propanol to
methanol. The excess molar volume in these mixtures decreases as the chain length of
the alcohol decreases [122-124].

120
Figure 4.20 Excess molar volume, EmV , for {[BHEAF](1) + Alcohol(2)} binary
mixture at temperature 298.15 K. Symbols: □, {[BHEAF](1) + methanol(2)}; ◊,
{[BHEAF](1) + ethanol(2)}; Δ, {[BHEAF](1) + 1-propanol(2)}.
Figure 4.21 present the graph of excess molar volume for {[BHEAF](1) +
methanol(2)} binary mixture as a function of temperature. The graph indicates that
with increasing temperature, the value for the minimum EmV shifts to a lower one. The
same trends were also observed for the other two alcohol system. The excess molar
volume data become less negative in the following order: methanol ethanol 1-
propanol. It is known that in the series of alcohols, the dielectric constants increase
with decreasing carbon-chain length. Therefore, the strength of ion-dipole interactions
between the [BHEAF] and the alcohols is in agreement with the increasing order
observed. At higher temperatures, the minimum EmV shifts to the lower values.
-1.4
-1.2
-1.0
-0.8
-0.6
-0.4
-0.2
0.0
0.0 0.2 0.4 0.6 0.8 1.0
Exce
ss m
olar
vol
ume
/cm
3 ·mol
-1
Mole fraction of [BHEAF]

121
Figure 4.21 Excess molar volume, EmV , for {[BHEAF](1) + methanol(2)} binary
mixture at several temperature. Symbols: □, 293. 15 K; ◊, 303.15 K; Δ, 313.15 K; ■,
323.15 K
The high negative deviation from ideality, observed for these systems was a result
of strong intermolecular interactions between the ionic liquids and the alcohols. In
this binary mixtures, the observed EmV values may be explained by four opposing sets
of contributions: (1) weakening of interaction between the cation and the anion of
ionic liquids during addition of alcohol; (2) contraction of ionic liquids due to specific
interactions with the alcohol; (3) size difference; and (4) expansion due to steric
repulsion between alkyl chain of an alcohol i.e., 1-propanol, and that of [BHEAF],
van der Waals interactions between the alkane chains. The same behaviors of excess
molar volume were also reported for imidazolium based ionic liquids with methanol,
ethanol, and 1-propanol [122-124].
-1.6
-1.4
-1.2
-1.0
-0.8
-0.6
-0.4
-0.2
0.0
0.0 0.2 0.4 0.6 0.8 1.0
Exce
ss m
olar
vol
ume
/cm
3 ·mol
-1
Mole fraction of [BHEAF]
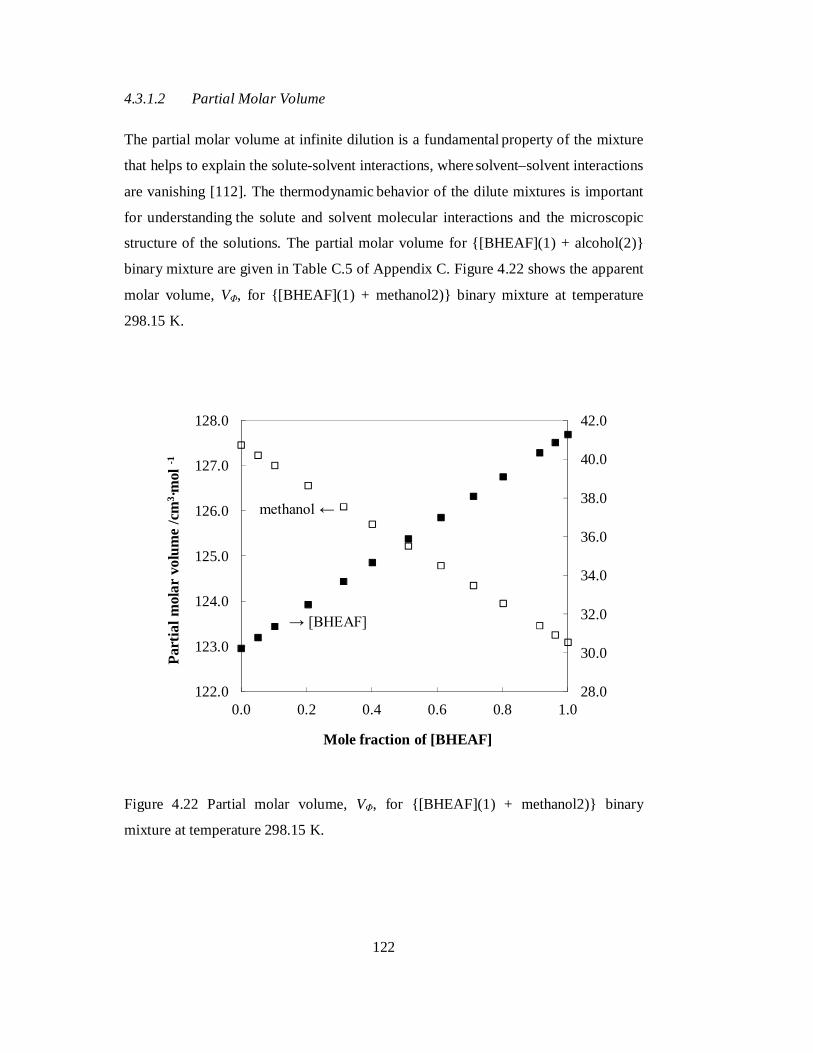
122
4.3.1.2 Partial Molar Volume
The partial molar volume at infinite dilution is a fundamental property of the mixture
that helps to explain the solute-solvent interactions, where solvent–solvent interactions
are vanishing [112]. The thermodynamic behavior of the dilute mixtures is important
for understanding the solute and solvent molecular interactions and the microscopic
structure of the solutions. The partial molar volume for {[BHEAF](1) + alcohol(2)}
binary mixture are given in Table C.5 of Appendix C. Figure 4.22 shows the apparent
molar volume, VΦ, for {[BHEAF](1) + methanol2)} binary mixture at temperature
298.15 K.
Figure 4.22 Partial molar volume, VΦ, for {[BHEAF](1) + methanol2)} binary
mixture at temperature 298.15 K.
28.0
30.0
32.0
34.0
36.0
38.0
40.0
42.0
122.0
123.0
124.0
125.0
126.0
127.0
128.0
0.0 0.2 0.4 0.6 0.8 1.0
Part
ial m
olar
vol
ume
/cm
3 ·mol
-1
Mole fraction of [BHEAF]
→ [BHEAF]
methanol ←

123
The graph indicates that the partial molar volume of species at infinite dilution is
smaller than corresponding molar volume of pure species. The partial molar volume
for the other two systems also shows the same pattern. The same trend was also
observed for the partial molar volume of imidazolium based ionic liquids with alcohol
[122-124]. This can be explained by the fact that alcohol molecule partially fit into the
open or empty spaces in ionic liquids. At infinite dilution, each ion is surrounded only
by the solvent molecules and being infinitely distant from the other ions. It follows
that the apparent molar volume at infinite dilution is unaffected by interaction among
ions and it is a pure measurement of the (ion + solvent) interaction [122-124].
4.3.2 Coefficient of Thermal Expansion for Binary Mixture
A frequently applied derived value for industrial mixtures is the temperature
dependence of volume, which is expressed as coefficient of thermal expansion. As in
the case of pure chemicals it can be calculated using equation (2.2),
PP TTV
V
11
(2.2)
Coefficient of thermal expansion for {[BHEAF](1) + alcohol(2)} binary mixture
is given in Appendix C.6 of Appendix C. Figure 4.23 presents the plot of coefficient
of thermal expansion for {[BHEAF](1) + alcohol(2)}binary mixture at temperature
298.15 K.

124
Figure 4.23 Coefficient of thermal expansion for binary mixture of ionic liquids with
alcohol at temperature 298.15 K. Symbols: □, {[BHEAF](1) + methanol(2)}; ◊,
{[BHEAF](1) + ethanol(2)}; Δ, {[BHEAF](1) + 1-propanol(2)}
The graph indicates that the coefficient of thermal expansion for {[BHEAF](1) +
alcohol(2)}binary mixture decreases with increasing concentration of ionic liquids.
The coefficient of thermal expansion is highest at pure alcohol and the value
decreases with increasing mole fraction of ionic liquids, and it reaches the lowest
value at pure ionic liquids. At mole fraction of ionic liquids above 0.2, the coefficients
of thermal expansion are less dependants on temperature compared to those observed
for mole fraction of ionic liquids below 0.2. The same trend was also observed at
higher temperature, as can be seen in Figure 4.24.
0.0004
0.0006
0.0008
0.0010
0.0012
0.0 0.2 0.4 0.6 0.8 1.0
Coe
ffici
ent o
f the
rmal
exp
ansio
n /T
-1
Mole fraction of [BHEAF]

125
Figure 4.24 Coefficient of thermal expansion for {[BHEAF](1) + methanol(2)} binary
mixture at several temperatures. Symbols: □, 293.15 K; ◊, 303.15 K; Δ, 313.15 K; ×,
323.15 K.
4.3.3 Viscosity of Binary Mixture
The viscosities of {[BHEAF](1) + alcohol(2)} binary mixture were measured using
vibrating-tube viscometer, SVM 3000 (Anton Paar, Austria) at temperature range
from 293.15 to 353.15 K with interval 5 K. The experimental results are given in
Table C.7 of Appendix C. Prior to the measurement of the viscosities of ionic liquids;
calibrations on the viscometer were done by measuring the viscosity of selected
organic solvent and some imidazolium ionic liquids which the viscosity are known.
0.0004
0.0006
0.0008
0.0010
0.0012
0.0 0.2 0.4 0.6 0.8 1.0
Coe
ffici
ent o
f the
rmal
exp
ansio
n /T
-1
Mole fraction of [BHEAF]

126
The changes of dynamic viscosities with composition is presented in Figure 4.25
for {[BHEAF](1) + alcohol(2)} binary mixture. The viscosities of binary mixture of
ionic liquids with alcohol were affected by the composition of alcohol in the system.
The viscosities of {[BHEAF](1) + alcohol(2)} binary mixture were lowest at pure
alcohol and its value increases with increasing mole fraction of ionic liquids in the
system, and reaches the highest value at pure ionic liquids. The observed decrease in
viscosity with an increase in the alcohol content is particularly more significant in
dilute solutions of an alcohol in the ionic liquid. As discussed above, ion-dipole
interactions and/or hydrogen bonding between the cation of the ionic liquids and an
alcohol will take place when an alcohol is added to the ionic liquid. This weakening
of the strong hydrogen bonding interactions between cation and anion of the ionic
liquid leads to a higher mobility of the ions and a lower viscosity of the mixture.
Figure 4.25 Viscosity of binary mixture of ionic liquids with alcohol at temperature
298.15 K. Symbols: □, {[BHEAF](1) + methanol(2)}; ◊, {[BHEAF](1) + ethanol(2)};
Δ, {[BHEAF](1) + 1-propanol(2)}
0
50
100
150
200
250
0.0 0.2 0.4 0.6 0.8 1.0
Visc
osity
/mPa
·s
Mole fraction of [BHEAF]
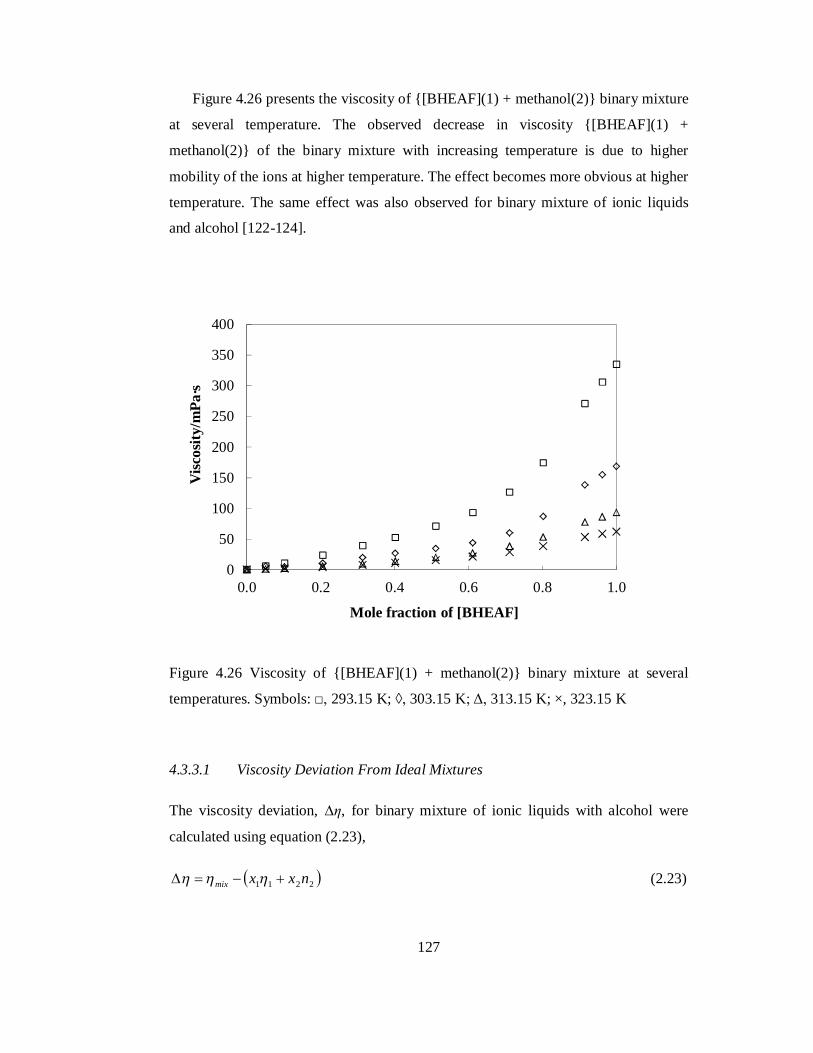
127
Figure 4.26 presents the viscosity of {[BHEAF](1) + methanol(2)} binary mixture
at several temperature. The observed decrease in viscosity {[BHEAF](1) +
methanol(2)} of the binary mixture with increasing temperature is due to higher
mobility of the ions at higher temperature. The effect becomes more obvious at higher
temperature. The same effect was also observed for binary mixture of ionic liquids
and alcohol [122-124].
Figure 4.26 Viscosity of {[BHEAF](1) + methanol(2)} binary mixture at several
temperatures. Symbols: □, 293.15 K; ◊, 303.15 K; Δ, 313.15 K; ×, 323.15 K
4.3.3.1 Viscosity Deviation From Ideal Mixtures
The viscosity deviation, ∆η, for binary mixture of ionic liquids with alcohol were
calculated using equation (2.23),
2211 nxxmix (2.23)
0
50
100
150
200
250
300
350
400
0.0 0.2 0.4 0.6 0.8 1.0
Visc
osity
/mPa
·s
Mole fraction of [BHEAF]

128
The values of ∆η for binary mixture of ionic liquids with alcohol are listed in Table
C.8 of Appendix C.
Deviation of viscosity can be also correlated using the Redlich Kister equation.
For deviation of viscosity, it can be calculated using equation (2.23),
kji
kkji xxAxx )(
0
The fitted parameters for the Redlich-Kister polynomial equation for viscosity
deviation of the binary mixture of ionic liquids with alcohol are listed in Table C.9 of
Appendix C. The viscosity deviation for {[BHEAF](1) + alcohol(2)} binary mixture
at temperature 298.15 K, as well as their Redlich-Kister correlation are plotted in
Figure 4.21. Whereas, the effect of temperature on viscosity deviation of {[BHEAF(1)
+ methanol(2)} at several temperatures is plotted in Figure 4.22.
Figure 4.27 Viscosity deviation, ∆η, for for {[BHEAF](1) + alcohol(2)} binary
mixture at temperature 298.15 K. Symbols: □, {[BHEAF](1) + methanol(2)}; ◊,
{[BHEAF](1) + ethanol(2)}; Δ, {[BHEAF](1) + 1-propanol(2)}.
-90-80-70-60-50-40-30-20-10
010
0.0 0.2 0.4 0.6 0.8 1.0
Visc
osity
dev
iatio
n/m
Pa·s
Mole fraction of [BHEAF]

129
Figure 4.28 Viscosity deviation, ∆η, for {[BHEAF](1) + methanol(2)} binary mixture
at several temperature. Symbols: □, 293. 15 K; ◊, 303.15 K; Δ, 313.15 K; ■, 323.15
K.
Theses graphs indicate that the viscosity deviations are negative over the whole
composition range. The extent of the deviation reduces as temperature increases and
this behavior is similar for all systems. The viscosity deviation is particularly
significant in solutions with dilute alcohol content due to the high differences in the
viscosity of the two pure compounds. The viscosity deviation at 293.15 K is greater
than at 303.15 K or 318.15 K or 323.15 K due to the larger reduction in the viscosity
of the pure ionic liquid at higher temperature. This agrees well with the result reported
for the mixture of the other ionic liquids with alcohol in general [122-124].
-120
-100
-80
-60
-40
-20
0
0.0 0.2 0.4 0.6 0.8 1.0
Visc
osity
dev
iatio
n/m
Pa·s
Mole fraction of [BHEAF]
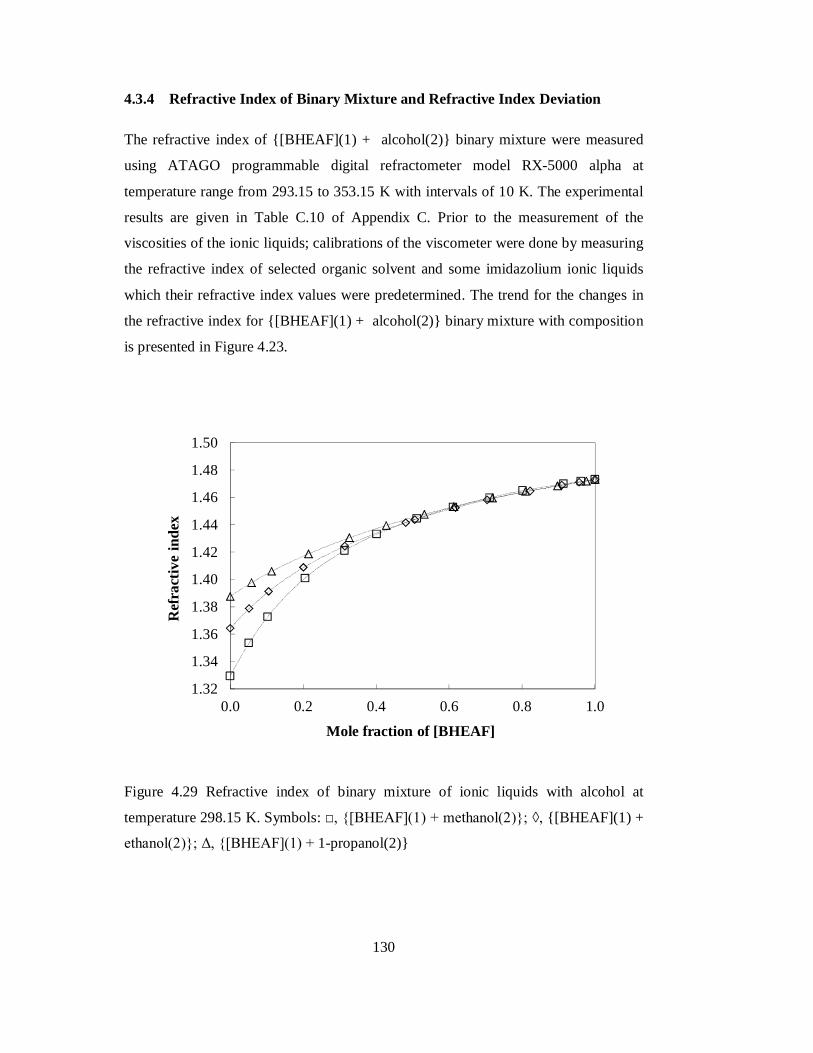
130
4.3.4 Refractive Index of Binary Mixture and Refractive Index Deviation
The refractive index of {[BHEAF](1) + alcohol(2)} binary mixture were measured
using ATAGO programmable digital refractometer model RX-5000 alpha at
temperature range from 293.15 to 353.15 K with intervals of 10 K. The experimental
results are given in Table C.10 of Appendix C. Prior to the measurement of the
viscosities of the ionic liquids; calibrations of the viscometer were done by measuring
the refractive index of selected organic solvent and some imidazolium ionic liquids
which their refractive index values were predetermined. The trend for the changes in
the refractive index for {[BHEAF](1) + alcohol(2)} binary mixture with composition
is presented in Figure 4.23.
Figure 4.29 Refractive index of binary mixture of ionic liquids with alcohol at
temperature 298.15 K. Symbols: □, {[BHEAF](1) + methanol(2)}; ◊, {[BHEAF](1) +
ethanol(2)}; Δ, {[BHEAF](1) + 1-propanol(2)}
1.32
1.34
1.36
1.38
1.40
1.42
1.44
1.46
1.48
1.50
0.0 0.2 0.4 0.6 0.8 1.0
Ref
ract
ive
inde
x
Mole fraction of [BHEAF]

131
As can be seen from Figure 4.23, the refractive index of the binary mixture of
ionic liquids with alcohol was also affected by the composition of alcohol in the
system. The viscosities of {[BHEAF](1) + alcohol(2)} binary mixture were lowest at
pure alcohol and its value increases with the mole fraction of ionic liquids in the
system, and reaches the highest value at pure ionic liquids, for the same reason as
discussed above for excess molar volume and viscosity deviation.
Figure 4.24 presents the refractive index of {[BHEAF](1) + methanol(2)} binary
mixture at several temperature. The graph indicates that the refractive index of the
binary mixture decreases with increasing temperature. The same trend was also
observed for the other two ionic liquids.
Figure 4.30 Refractive index of {[BHEAF](1) + methanol(2)} binary mixture at
several temperatures. Symbols: □, 293.15 K; ◊, 303.15 K; Δ, 313.15 K; ×, 323.15 K
1.301.321.341.361.381.40
1.421.441.461.481.50
0.0 0.2 0.4 0.6 0.8 1.0
Ref
ract
ive
inde
x
Mole fraction of [BHEAF]
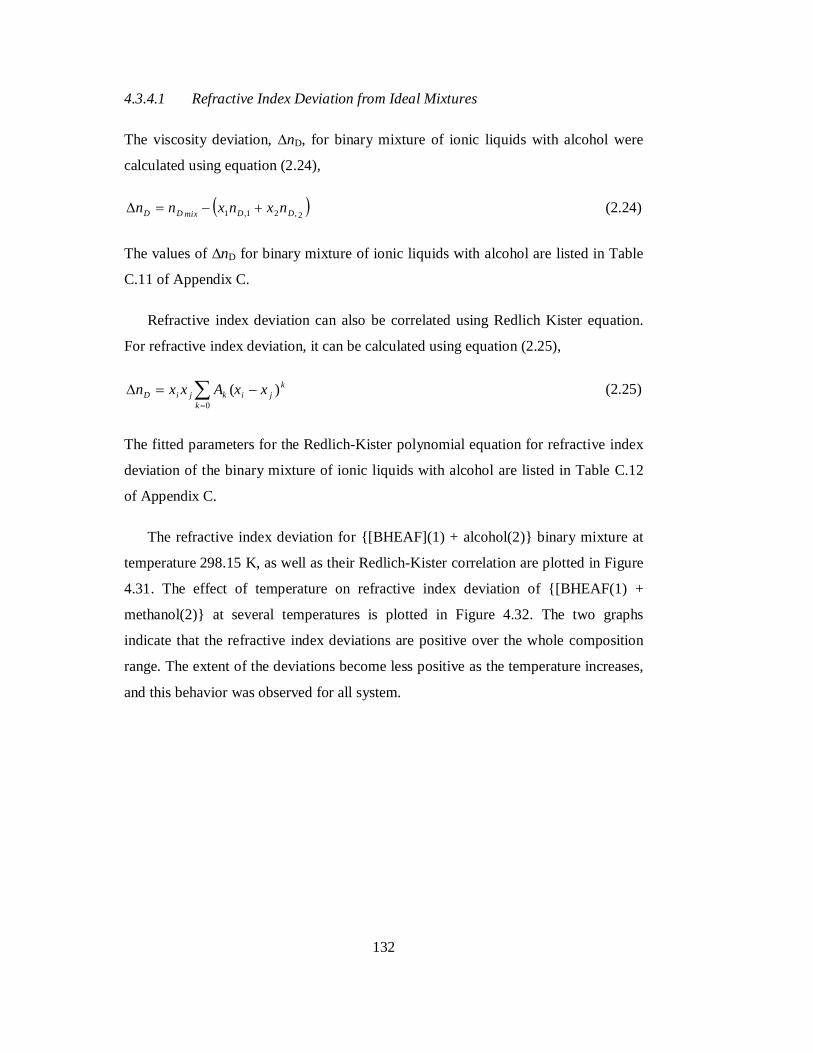
132
4.3.4.1 Refractive Index Deviation from Ideal Mixtures
The viscosity deviation, ∆nD, for binary mixture of ionic liquids with alcohol were
calculated using equation (2.24),
2,21,1 DDmixDD nxnxnn (2.24)
The values of ∆nD for binary mixture of ionic liquids with alcohol are listed in Table
C.11 of Appendix C.
Refractive index deviation can also be correlated using Redlich Kister equation.
For refractive index deviation, it can be calculated using equation (2.25),
kji
kkjiD xxAxxn )(
0
(2.25)
The fitted parameters for the Redlich-Kister polynomial equation for refractive index
deviation of the binary mixture of ionic liquids with alcohol are listed in Table C.12
of Appendix C.
The refractive index deviation for {[BHEAF](1) + alcohol(2)} binary mixture at
temperature 298.15 K, as well as their Redlich-Kister correlation are plotted in Figure
4.31. The effect of temperature on refractive index deviation of {[BHEAF(1) +
methanol(2)} at several temperatures is plotted in Figure 4.32. The two graphs
indicate that the refractive index deviations are positive over the whole composition
range. The extent of the deviations become less positive as the temperature increases,
and this behavior was observed for all system.

133
Figure 4.31 Refractive index deviation, ∆nD, for for {[BHEAF](1) + alcohol(2)}
binary mixture at temperature 298.15 K. Symbols: □, {[BHEAF](1) + methanol(2)};
◊, {[BHEAF](1) + ethanol(2)}; Δ, {[BHEAF](1) + 1-propanol(2)}.
Figure 4.32 Refractive index deviation, ∆nD, for {[BHEAF](1) + methanol(2)} binary
mixture at several temperature. Symbols: □, 293. 15 K; ◊, 303.15 K; Δ, 313.15 K; ■,
323.15 K
0.0000.0050.0100.0150.0200.0250.0300.0350.0400.0450.050
0.0 0.2 0.4 0.6 0.8 1.0
Ref
ract
ive
inde
x de
viat
ion
Mole fraction of [BHEAF]
0.000
0.010
0.020
0.030
0.040
0.050
0.060
0.0 0.2 0.4 0.6 0.8 1.0
Ref
ract
uve
inde
x de
viat
ion
Mole fraction of [BHEAF]

134
4.4 Density of 1 M HCl
The density of corrosive solution, 1 M HCl in the various concentrations of ionic
liquids [BHEAF] was measured at temperatures 303.15, 313.15, 323.15, and 333.15
K. The results are presented in Figure 4.33. The density of 1 M HCl slightly increases
with increasing concentration of ionic liquids and decreases with increasing
temperature. It is also noticed that the density of 1 M HCl in the presence of 0.08 M
of [BHEAF] has least effected by change of temperature. This is due to presence of
ionic liquids, which is known to be considerably less dependent on temperature [101,
113]. The temperature dependence of density is correlated using equation (2.1). Table
4.10 presents the fit parameter meanwhile Figure 4.34 presents the density of 1 M
HCl in the presence of various concentrations of ionic liquids [BHEAF] and their
correlation equation.
Figure 4.33 Density of 1 M HCl solution in the presence of various concentration of
ionic liquids [BHEAF] at several temperatures. Symbols: ■, T = 303. 15 K; ♦, T =
313. 15 K; ▲, T = 323. 15 K; and ×, T = 333. 15 K
0.995
1.000
1.005
1.010
1.015
1.020
1.025
1.030
0 0.02 0.04 0.06 0.08
Den
sity/
g·cm
-3
Concentration of [BHEAF]/M

135
As can be seen from Table 4.10 and 4.34, the temperature dependence of 1 M HCl in
the presence of various concentration of ionic liquids [BHEAF] is well correlated
using equation (2.1). The fit parameter given in Table 4.10 may helpful to predict the
density of 1 M HCl in the presence of 0 – 0.08 M ionic liquids [BHEAF]
Table 4.10 Fit parameter for temperature dependence of density of 1 M HCl with the
various concentrations of [BHEAF] calculated using equation (2.1) and its standard
deviation calculated using equation (4.1)
[BHEAF]/M 0.00 0.02 0.04 0.06 0.08
ao 1.2012 1.1812 1.1533 1.1377 1.1008
104· a1 -6.03 -5.30 -4.30 -3.70 -2.40
Figure 4.34 Temperature dependence of density of 1 M HCl solution in the presence
of various concentration of ionic liquids [BHEAF] at several temperatures. Symbols:
■, 0 M; ♦, 0.02 M;▲,0.04 M; ×, 0.06 M; and □, 0.08 M
R² = 0.9951
R² = 0.9979
R² = 0.9968
R² = 0.9956
R² = 0.96
0.995
1.000
1.005
1.010
1.015
1.020
1.025
1.030
303.15 313.15 323.15 333.15
Den
sity/
g·cm
-3
Temperature/K

136
4.5 Concluding Remarks
There are various commercial ionic liquids available in the market. However, their
prices are relatively higher compared to commercial corrosion inhibitor. An
alternative way is to find cheaper ionic liquids that can be applied as corrosion
inhibitor for carbon steel in acidic medium. Hydroxyl ammonium ionic liquids could
potentially be the alternatives. In this research, 16 different hydroxyl ammonium
ionic liquids were synthesized and characterized. The synthesis was carried out by
direct protonation of alkanolamines with acid. Ease of manufacturing as well as low
cost materials are some of the reasons for choosing alkanolamine as the cation source.
The structure of the synthesized ionic liquids was confirmed through infrared and
NMR spectra. The chemical composition of the synthesized ionic liquids was
established from CHN analysis.
Prior to applying ionic liquids for industrial application such as corrosion
inhibitor, the physical properties of the ionic liquids have to be determined. The
properties such as density and viscosity of the ionic liquids must be examined and
reported together with their performance for corrosion inhibition. However, most of
the published reports on corrosion inhibitor lack these physical properties data. In this
research, physical properties such as density, viscosity, and refractive index of pure
synthesized hydroxyl ammonium ionic liquids were measured at several temperatures.
The density and viscosity of the synthesized ionic liquids were found to be higher
than some organic solvent. The synthesized ionic liquids showed high solubility in
polar solvent such as methanol, ethanol, and 1-propanol. Further investigation was
conducted to study the solute-solvent behavior of ionic liquids with alcohol by
measuring physical properties of {ionic liquids(1) + alcohol(2)} binary mixture. The
obtained result indicated that a tighter packing and/or attractive interaction occurred
when the ionic liquids and alcohol were mixed. The extent of the packing tightness
and/or attractive interaction increases with increased in temperature. The partial
molar volumes of the ionic liquids in infinite dilution in alcohol showed that volume
of ionic liquids in solution is smaller compared to its pure system.

137
The high solubility of the synthesized ionic liquids in polar solvent such as
alcohol and HCl, may provide some advantages when used as corrosion inhibitor.
Firstly, it ensures that the synthesized ionic liquids could be completely mixed with
the HCl acid, thus reducing the concentration of the corrosive species down to an
acceptable level. Secondly, the physical properties of the ionic liquids such as
viscosity could also be reduced leading to a lower shear stress of the production fluid.
From this chapter, the synthesis, characterization, and physical properties of the
studied ionic liquids is well presented. In addition, the physical property of the
synthesized ionic liquids with alcohol is also reported. This analysis could be a good
platform to study the application of ionic liquids as corrosion inhibitor that will be
considered in the next chapter.


CHAPTER 5
APPLICATION OF IONIC LIQUIDS AS INHIBITOR ON CARBON STEEL
CORROSION IN ACIDIC MEDIUM
This chapter presents the test performed to measure the potential of applying the
synthesized ionic liquids as corrosion inhibitor on carbon steel under acidic medium.
Section 5.1 discusses the effect of concentration and temperature on inhibition
efficiency of the ionic liquids on carbon steel corrosion in acidic medium. The
inhibition potential is also discussed in terms of Tafel Plots and Electrochemical
Impedance Spectroscopy. The adsorption and thermodynamics of adsorption are
discussed in section 5.2. Section 5.3 presents the proposed inhibiting mechanism of
the carbon steel corrosion in acidic medium in the presence of the ionic liquids
corrosion inhibitor.
5.1 Effect of Concentration of Ionic Liquids on Corrosion Rate of Carbon
Steel Corrosion
The effect of ionic liquids concentration on carbon steel corrosion in 1 M HCl was
determined from concentration of 0.001 to 1 M. Figure 5.1 shows the effect of ionic
liquids concentration on corrosion rate of carbon steel in 1 M HCl at 298.15 K. It was
observed that the corrosion rate of carbon steel in 1 M HCl decrease with increasing
concentration of ionic liquids. It indicates that the addition of ionic liquids reduce the
corrosion rate of carbon steel in 1 M HCl. The same trend was observed for all
synthesized ionic liquids in this work.

140
Figure 5.1 Effect of ionic liquids concentration on corrosion rate of carbon steel in 1
M HCl in 1 M HCl at 298.15 K determined using weight loss method. (a) Ionic
liquids with formate anion. Symbols: □, [HEF]; ◊, [BHEAF]; Δ, [BHEMF], and ×,
[THEAF]. (b) Ionic liquids with 2-hydroxyethylammonium cation. Symbols: □,
[BHEAF]; ◊, [BHEAA]; Δ, [BHEAP], and ×, [BHEAL].
0.0
0.5
1.0
1.5
2.0
2.5
0.0 0.2 0.4 0.6 0.8 1.0
Cor
rosio
n ra
te/m
g·cm
-2·h
-1
Concentration of ionic liquids/M
(a)
0.0
0.5
1.0
1.5
2.0
2.5
0.0 0.2 0.4 0.6 0.8 1.0
Cor
rosio
n ra
te/m
g·cm
-2·h
-1
Concentration of ionic liquids/M
(b)

141
The corrosion rate of carbon steel in 1 M HCl decreases in the presence of ionic
liquids. It is due to ionic liquids adsorbed themselves on the carbon steel surface.
Quaternary ammonium salts were reported to inhibit corrosion of carbon steel in acid
media [3, 10, 11, 193-197]. As the charged nitrogen in such a molecule has no free
orbital for covalent bonding to the surface, it is likely to prevent corrosion by
geometrical blocking of the surface [193, 194]. Adsorption of
alkyltrimethylammonium bromides with carbon chains (C12–C18) were investigated
using quartz crystal microbalance (QCM) on model surfaces of iron and cementite
[197]. The adsorption was shown to be reversible and to reach a maximum near the
critical micelle concentration. It was concluded that the surfactants adsorbed as
discrete aggregates rather than as a film, since the amount adsorbed was less than
what was needed to form a monolayer [197]. This conclusion is further supported by
comparison to adsorption experiments on other hydrophilic surfaces [195], where
adsorption of discrete micelles has been observed by means of atomic force
microscopy.
In this work, the inhibition efficiency of the synthesized ionic liquids on carbon
steel corrosion in 1 M HCl at temperatures of 298.15, 313.15, 328.15, and 343.15 K is
measured using two methods, namely weight loss and electrochemical methods. The
effects of various parameters such as concentration of the ionic liquids, temperature,
and addition of alcohol on the efficiency of the ionic liquids as inhibitors are studied.
5.1.1 Weight Loss Method
The inhibition efficiency for all the synthesized ionic liquids was calculated using the
equation (2.29) as shown below,
100%/)(
corr
inhcorrcorr
CRCRCR
WLIE (2.29)
The inhibition efficiency for the carbon steel in 1 M HCl solution at 298.15, 313.15,
328.15, and 343.15 K in the presence of different types of ionic liquids are given in
Table D.2 of Appendix D.

142
Figure 5.2 show the inhibition efficiency of various ionic liquids with different
cation and anion on carbon steel corrosion in 1 M HCl at 298.15 K. In general, the
inhibition efficiency increases with increasing concentration, reaching a limiting
value, which depends on the used inhibitor and practically, is not influenced by
further concentration increase. The difference between the inhibitors is best seen in
the middle concentration range, reflecting the influence of the molecular structure on
their protective properties. Hence, in this study, the inhibition efficiencies are
discussed at concentration (0.02, 0.04, 0.06, and 0.08) M of ionic liquids.
5.1.1.1 Effect of Anion
The effect of the anion type on the inhibiting performance is investigated by looking
at four different anions namely Formate, Acetate, Propionate, and Lactate. Figure 5.3
shows the inhibition efficiency of the respective ionic liquids with different anions
coupled with bis(2-hydroxyethyl)ammonium as the cation. The inhibition efficiency
increases with increasing concentration of the ionic liquids. The ionic liquids
[BHEAF] shows the highest inhibition efficiency. It is followed by [BHEAA], then
[BHEAP] and [BHEAL] showing almost the same inhibition efficiency. Hence, for
the bis(2-hydoxyethyl)ammonium cation, the type of anion of the ionic liquids can be
ranked according to Formate > Acetate > Propionate > Lactate. It appears that the
inhibition effect of the anion decreases with increasing molecular size of the anion.
Increasing molecular size of the anion leads to decrease on the electrostatic interaction
with their cation, hence forming less dense protective layer on the carbon steel
surface.
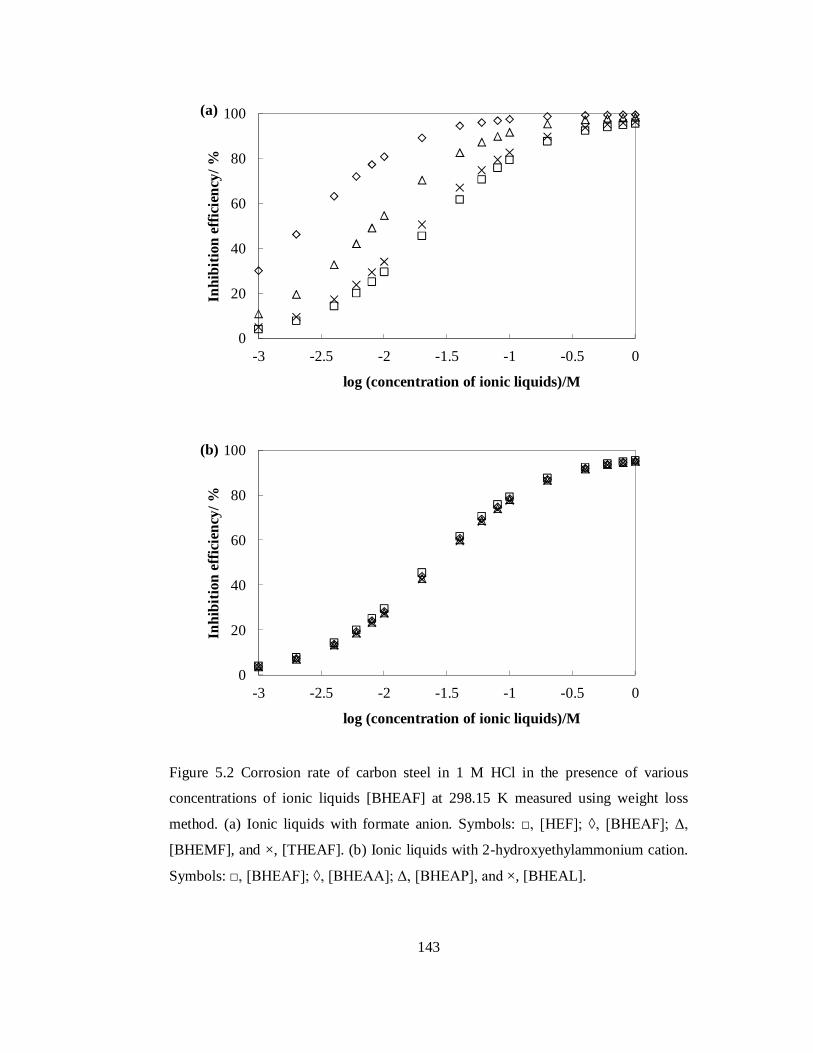
143
Figure 5.2 Corrosion rate of carbon steel in 1 M HCl in the presence of various
concentrations of ionic liquids [BHEAF] at 298.15 K measured using weight loss
method. (a) Ionic liquids with formate anion. Symbols: □, [HEF]; ◊, [BHEAF]; Δ,
[BHEMF], and ×, [THEAF]. (b) Ionic liquids with 2-hydroxyethylammonium cation.
Symbols: □, [BHEAF]; ◊, [BHEAA]; Δ, [BHEAP], and ×, [BHEAL].
0
20
40
60
80
100
-3 -2.5 -2 -1.5 -1 -0.5 0
Inhi
bitio
n ef
ficie
ncy/
%
log (concentration of ionic liquids)/M
(a)
0
20
40
60
80
100
-3 -2.5 -2 -1.5 -1 -0.5 0
Inhi
bitio
n ef
ficie
ncy/
%
log (concentration of ionic liquids)/M
(b)

144
Figure 5.3 Effect of anion on concentration dependence of inhibition efficiency of
ionic liquids on corrosion of carbon steel in 1 M HCl at temperature 298.15 K using
weight loss method. Symbols: □, [BHEAF]; ◊, [BHEAA]; Δ, [BHEAP]; and ×,
[BHEAL].
From Figure 5.3, the inhibition efficiency for [BHEAA] and [BHEAF] at 0.02 M
which are 88.79 and 89.26 %, respectively. The difference in the inhibition efficiency
for the different types of anions is smaller when compared to the cations. One
possible explanation for this observation is that the ionic liquids adsorbed on the
carbon steel surface are through its cations, instead of its anion. The same
observations were also reported for the imidazolium based cation [22-24] and
ammonium-salt corrosion inhibitor [3, 10, 11, 193-197].
As can be seen from Table D.1 and D.2 of Appendix D, the same trend of the
anion was also observed when it coupled with the three other cations studied in this
work. Hence, the effect of anion on the inhibition performance can be ranked in the
order of formate > acetate > propionate > lactate.
86
88
90
92
94
96
98
100
0 0.02 0.04 0.06 0.08
C i
%IE
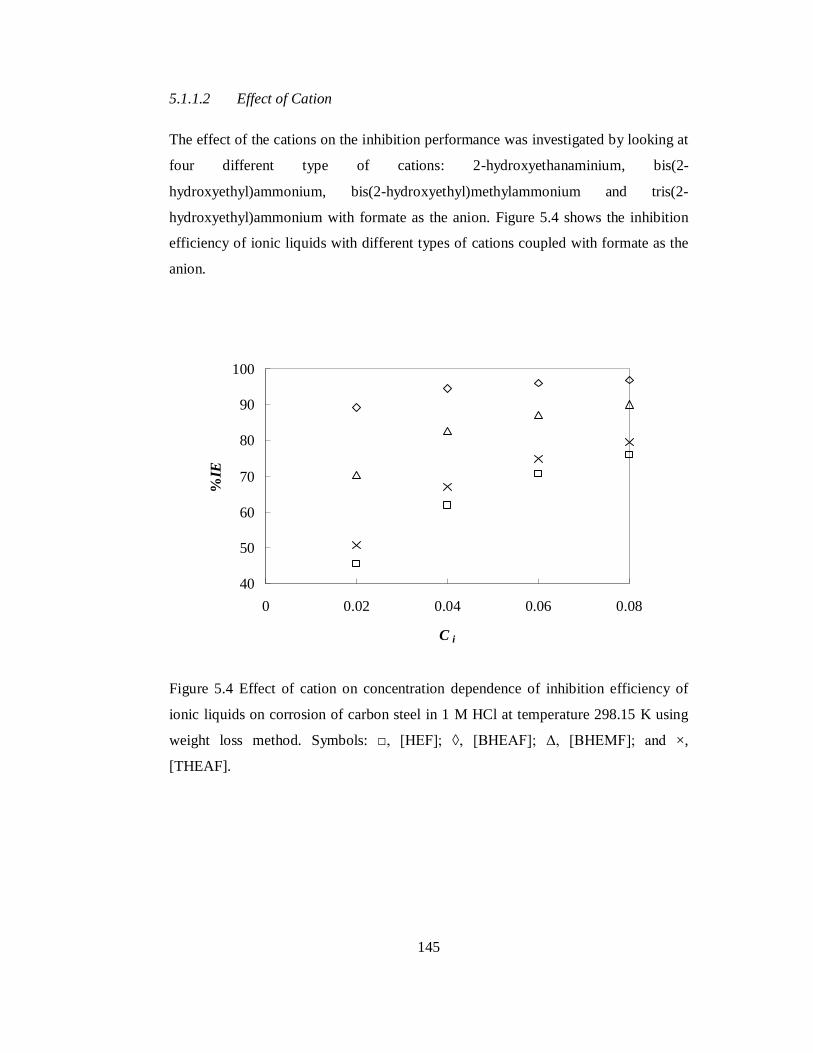
145
5.1.1.2 Effect of Cation
The effect of the cations on the inhibition performance was investigated by looking at
four different type of cations: 2-hydroxyethanaminium, bis(2-
hydroxyethyl)ammonium, bis(2-hydroxyethyl)methylammonium and tris(2-
hydroxyethyl)ammonium with formate as the anion. Figure 5.4 shows the inhibition
efficiency of ionic liquids with different types of cations coupled with formate as the
anion.
Figure 5.4 Effect of cation on concentration dependence of inhibition efficiency of
ionic liquids on corrosion of carbon steel in 1 M HCl at temperature 298.15 K using
weight loss method. Symbols: □, [HEF]; ◊, [BHEAF]; Δ, [BHEMF]; and ×,
[THEAF].
40
50
60
70
80
90
100
0 0.02 0.04 0.06 0.08
C i
%IE

146
From Figure 5.4, the inhibition efficiency increases with increasing concentration
of the ionic liquids. The ionic liquids [BHEAF] shows the highest inhibition
efficiency. It is followed by [BHEMF], then [THEAF] and [HEF]. Hence, for the
formate anion, the type of cation of the ionic liquids can be ranked according to bis(2-
hydroxyethyl)ammonium > bis(2-hydroxyethyl)methylammonium > tris(2-
hydroxyethyl)ammonium > 2-hydroxyethylammonium. As also shown in Figure 5.3,
the ionic liquids with bis(2-hydroxyethyl)ammonium has a considerably higher
inhibition efficiency than the other three cations. A significant increase in inhibition
efficiency is observed for [HEF] and [BHEAF]. While [HEF] could not exceed 80
%IE at concentration of 0.08 M, [BHEAF] shows more than 95 %IE. It appears that
the structure of the ionic liquids cation has dominant effect on their inhibition
efficiency. The same observations were also reported for the ammonium-salt
corrosion inhibitors [3, 10, 11, 193-197].
According to Sastri [1], stereochemical structures of the inhibitor determine their
effectiveness of corrosion protection capabilities. This effectiveness depends on the
packing of the inhibitor molecule on the carbon steel surface which depends on the
configuration of the inhibitor molecule; the denser the layer formed on the carbon
steel surface leads to higher inhibition efficiency [1].
The bis(2-hydroxyethyl)ammonium cation has the highest inhibition efficiency
compared to the three other cations. It is due to linear structure and two hydroxyl
functional groups attached at the end of both alkyl groups that lead to highest dense
protective layer on the carbon steel surface. Addition of methyl group and hydroxyl
functional group into the bis(2-hydroxyethyl)ammonium cation, such as on the bis(2-
hydroxyethyl)methylammonium and tris(2-hydroxyethyl)ammonium cation,
respectively, leads to decrease in inhibition efficiency. It is due to the steric effect of
which prevents these cations to have denser packing protective layer on the surface of
the carbon steel.

147
On the other hands, 2-hydroxyethylammonium cation has the least inhibition
efficiency compared to the three other cations. It is due to smaller molecular volume
of this cation compared to the other three studied cations. The smaller volume of the
cation leads to lower degree of surface coverage.
From Table D.1 and D.2 of Appendix D, the same trend of the cation was also
observed when it coupled with the three other anions studied in this work. Hence, the
effect of the cation on the inhibition performance can be ranked as bis(2-
hydroxyethyl)ammonium > bis(2-hydroxyethyl)methylammonium > tris(2-
hydroxyethyl)ammonium > 2-hydroxyethylammonium.
5.1.1.3 Effect of Anion and Cation
Figure 5.5 shows the effect of the anion and cation of the ionic liquids on the
inhibition performance. The ionic liquids [BHEAF] has the highest inhibition
efficiency, it is then followed by [BHEAA] > [BHEAP] > [BHEAL] > [BHEMF] >
[BHEMA] > [BHEMP] > [BHEML] > [THEAF] > [THEAA] > [THEAP] >
[THEAL] > [HEF] > [HEA] > [HEP] > [HEL].
From Figure 5.5, it can be seen clearly that differences of IE% values between
two different cations is much larger compared to different anions. As can be seen
from Table D.1 and D.2 of Appendix D, The same trend was also observed at
different concentration ionic liquids used and at three other temperatures studied in
this work. Thus, it can be concluded that the cation of the ionic liquids is responsible
on the adsorption on the carbon steel surface.
The following discussion is focused on the ionic liquids [BHEAF] as this ionic
liquids has the highest inhibition efficiency. However, it can also be used to
understand the inhibition performance of the other synthesized ionic liquids described
in this work.

148
Figure 5.5 Effect of the cation and anion on the inhibition efficiency of 0.02 M ionic
liquids on carbon steel corrosion at 298.15 K.
5.1.1.4 SEM Analyses
The surface morphology of the carbon steel specimen before and after immersion in 1
M HCl in the absence and presence of 0.08 M of ionic liquids [BHEAF] is shown in
Figure 5.6. It could be observed from Figure 5.6(b) that the carbon steel was strongly
damaged in the absence of ionic liquids. SEM images of the carbon steel surface after
immersion in 1 M HCl in the presence of 0.08 M of [BHEAF], is shown in Figure
5.6(c). It could be observed that in the presence of ionic liquids, the rate of carbon
steel corrosion was suppressed. One possible explanation is that the adsorbed ionic
liquids on the carbon steel surface form a protective film which was responsible for
the inhibition of carbon steel corrosion in 1 M HCl [3, 10, 11, 193-197].
BHEABHEM
THEAHE
FormateAcetate
PropionateLactate
0
10
20
30
40
50
60
70
80
90
100
IE%

149
Figure 5.6 SEM micrographs of carbon steel specimens (magnificent scale 3000x).
(a) Before immersion, (b) After immersion in 1 M HCl solution without inhibitor,
and (c) after immersion in 1 M HCl solution in the presence of 0.08 M of ionic
liquids [BHEAF].

150
5.1.2 Tafel Plots
The Tafel Plots for the carbon steel in acidic medium was measured in the various
concentrations of the ionic liquids and at temperatures of 298.15, 313.15, 328.15, and
343.15 K. The Tafel Plots of carbon steel specimens in 1 M HCl were obtained at the
potential range from -350 to +350 mV at a scan rate of 10 mV/minute. The respective
kinetic parameters including corrosion current density, icorr, and inhibition efficiency,
%IE, are given in Table D.3 and D.4 of Appendix D.
Figure 5.7 shows the Tafel Plots for carbon steel in 1 M HCl in the presence of
various concentration of [BHEAF] at 298.15 K. It is observed that the cathodic
current potential curves give rise to parallel Tafel lines indicating that the hydrogen
evolution reaction is activation controlled. The Tafel Plots also indicate that the ionic
liquids manage to suppress both anodic and cathodic reactions on the active site of the
carbon steel surface. It means that the ionic liquids reduce the corrosion rate of carbon
steel by simple adsorption mode and the mechanism of carbon steel corrosion is the
same both with and without the presence of the ionic liquids. Moreover, the value of
Ecorr in the presence of the ionic liquids [BHEAF] is nearly constant. This is a typical
of mixed type inhibitors with cathodic predominance. The same behavior was also
observed for imidazolium and pyridinium based ionic liquids corrosion inhibitor [22-
24] and ammonium-salt corrosion inhibitors [3, 10, 11, 193-197].
The addition of the ionic liquids changes the corrosion current density, Figure 5.8
shows the relation between the concentration of ionic liquids with the corrosion
current density, icorr, and inhibition efficiency. It shows that increasing the
concentration of the ionic liquids decreases the icorr and increases its inhibition
efficiency. The same trend is also observed for other ionic liquids studied. This can be
attributed to the adsorption mode of the ionic liquids. The ionic liquids inhibitor
molecules were adsorbed on the carbon steel surface thus blocking the surface active
sites. When the concentration of the ionic liquids increases, more surface active sites
will be protected because more ionic liquids molecules were adsorbed on the carbon
steel surface [22-24].

151
Figure 5.7 Tafel Plots of carbon steel dissolution in 1 M HCl at 298.15 K in the
presence of various concentrations of ionic liquids [BHEAF]. Symbols: 1, Blank; 2,
0.02 M; 3, 0.04 M; 4, 0.06 M; and 5, 0.08 M.
Figure 5.8 The effect of concentration of the ionic liquids on corrosion current density
of carbon steel in 1 M HCl at 298.15 K measured using Tafel Plots. Symbols: ■,
[HEF]; ♦, [BHEAF]; ▲, [BHEMF]; and ×, [THEAF].
-0.9
-0.7
-0.5
-0.3
-0.1
-4 -3.5 -3 -2.5 -2 -1.5 -1
Cor
rosio
n po
tent
ial/m
V
log current/A·cm-2
5 4 3 2 1
0.0
0.5
1.0
1.5
2.0
2.5
3.0
0.00 0.02 0.04 0.06 0.08
Cor
rosio
n cu
rren
t/mA
·cm
-2
Concentration of ionic liquids/M

152
The inhibition efficiency measured using Tafel Plots was calculated using
equation (2.30),
100%
corr
inhcorrcorr
iii
IE (2.30)
with i and inhi are corrosion current in the absence and presence of the ionic liquids,
respectively. The inhibition efficiency of ionic liquids under study was calculated
from Tafel Plots is also given in Table D.2 of Appendix D. Figure 5.9 shows the
inhibition efficiency of some selected ionic liquids determined using Tafel Plot at
temperature 298.15 K. The inhibition efficiency increases with increases
concentration of ionic liquids. The result is found to be in good agreement with the
values calculated from the weight loss method.
Figure 5.9 The inhibition efficiency of ionic liquids determined using Tafel Plot at
298.15 K. Symbols: ■, [HEF]; ♦, [BHEAF]; ▲, [BHEMF]; and ×, [THEAF].
0
20
40
60
80
100
0.00 0.02 0.04 0.06 0.08
Inhi
bitio
n ef
ficie
ncy/
%
Concentration of ionic liquids/M

153
5.1.3 Linear Polarization Resistance
The linear polarization resistance (LPR) for the carbon steel in acidic medium was
measured in various concentrations of the ionic liquids and at temperatures of 298.15,
313.15, 328.15, and 343.15 K. The LPR of the carbon steel specimens in 1 M HCl
were obtained in the potential range from -10 to +10 mV at a scan rate of 1
mV/minute. The respective kinetic parameter such as polarization resistance, Rp, is
given in Table D.7 and D.8 of Appendix D.
Figure 5.10 shows the effect of concentration of some selected ionic liquids on the
Rp values of carbon steel in 1 M HCl at 298.15. Increasing the concentration of the
ionic liquids increases the Rp value. This may be due to ionic liquids are adsorbed on
the carbon steel surface [3, 10, 11, 193-197]. It appears that the adsorbed ionic liquids
on the carbon steel increase the polarization resistance of carbon steel in acidic
medium. The same observations were also observed for ammonium-salt corrosion
inhibitor [3, 10, 11, 193-197].
Figure 5.10 The effect of concentration of the ionic liquids on polarization resistance
of carbon steel in 1 M HCl at 298.15 K measured using Linear Polarization
Resistance. Symbols: ■, [HEF]; ♦, [BHEAF]; ▲, [BHEMF]; and ×, [THEAF].
0
100
200
300
400
500
600
0.00 0.02 0.04 0.06 0.08
Pola
riza
tion
resis
tanc
e/Ω
∙cm
-2
Concentration of ionic liquids/M

154
The inhibition efficiency from LPR measurement was calculated using equation
(2.31),
100%
inhp
pinhp
RRR
IE (2.31)
with pR and inhpR are polarization resistance in the absence and presence of the ionic
liquids, respectively.
The polarization resistance, Rp, and inhibition efficiency, IE%, for all the studied ionic
liquids in this work are given in Table D.7 and D.8 of Appendix D. Figure 5.11
presents the inhibition efficiency determined using LPR method at temperature
298.15 K. The inhibition efficiency increases with increasing concentration of ionic
liquids. The result is also in good agreement with the values calculated from weight
loss method and Tafel Plots.
Figure 5.11 The inhibition efficiency of ionic liquids determined using Tafel Plot at
298.15 K. Symbols: ■, [HEF]; ♦, [BHEAF]; ▲, [BHEMF]; and ×, [THEAF].
0
20
40
60
80
100
0.00 0.02 0.04 0.06 0.08
Inhi
bitio
n ef
ficie
ncy/
%
Concentration of ionic liquids/M

155
5.1.4 Electrochemical Impedance Spectroscopy
The electrochemical impedance spectroscopy (EIS) for the carbon steel in acidic
medium was measured in the various concentrations of the ionic liquids and at
temperatures 298.15, 313.15, 328.15, and 343.15 K. The result is discussed based on
the term Nyquist and Bode plot, and its equivalent electrical circuit. The
electrochemical impedance parameters were obtained by fitting the EIS experimental
data using a circuit model via a non-linear least square program accompanying with
ACM potentiostat/galvanostat system. The electrochemical impedance parameters and
the corresponding inhibition efficiencies for carbon steel in 1 M HCl in the absence
and presence of ionic liquids inhibitor is given in Table D.5 and D.6 of Appendix D.
The typical EIS spectrum of carbon steel in 1 M HCl in the presence of various
concentrations of the ionic liquids [BHEAF] at 298.15 K is shown in Figure 5.12 to
5.13. The Nyquist spectra obtained yields a semi circular shape and only one time
constant is observed in its Bode plot. This indicates the corrosion of carbon steel in 1
M HCl is mainly controlled by a charge transfer process [3, 10, 11, 193-197]. The
Nyquist plots exhibit depressed semicircles centered below Z’ axis. The diameter of
semicircle increases with increasing concentration of ionic liquids. It indicates that the
charge transfer resistance increase with increasing concentration of ionic liquids. This
may be due to ionic liquids were adsorbed on the carbon steel surface. It formed a
protective layer on carbon steel surface. The formation of layer can be known by
change of the charge transfer resistance [3, 10, 11, 193-197].
According to Sastri [1], this deviations from the semicircle with a center at the Z’
axis is due to the thin films formed on the carbon steel surface, which gives rise to a
distribution in relaxation times for interfacial charge transfer reactions. The diameter
of these semicircles increases with increase in concentration of the ionic liquids. It
indicates that charge transfer resistance increases with increasing concentration of the
ionic liquids which lead to improved inhibition efficiency. The charge transfer
resistance was also responsible for the inhibition performance of imidazolium and
pyridinium based ionic liquids [22-24] and ammonium-salt corrosion inhibitor [3, 10,
11, 193-197].

156
Figure 5.12 Nyquist plot of carbon steel in 1 M HCl with various concentrations of
ionic liquids at 298.15 K. Symbols: 1, Blank; 2, 0.02 M; 3, 0.04 M; 4, 0.06 M; and 5,
0.08 M.
Electrical equivalent circuits were used to interpret these electrochemical
processes. Several electrical circuit analogs tried to fit to the experimental data. A
simple electrochemical circuit, as shown in Figure 5.14, gives the higher R2 compared
to the other electrochemical circuit. In this electrochemical circuit, Rs is the solution
resistance, Rt is the charge transfer resistance, and Cdl is the double layer capacitance
that characterizes the separation of the metal/electrolyte interface. The same electrical
equivalent circuit was also used to describe the electrochemical impedance parameters
of carbon steel in 1 M HCl in the presence of imidazolium and pyridinium based ionic
liquids [22-24].
0
50
100
150
200
250
300
350
400
0 200 400 600 800 1000
Imag
inar
y im
peda
nce/
ohm
Real impedance/ohm
1 2 3 4 5
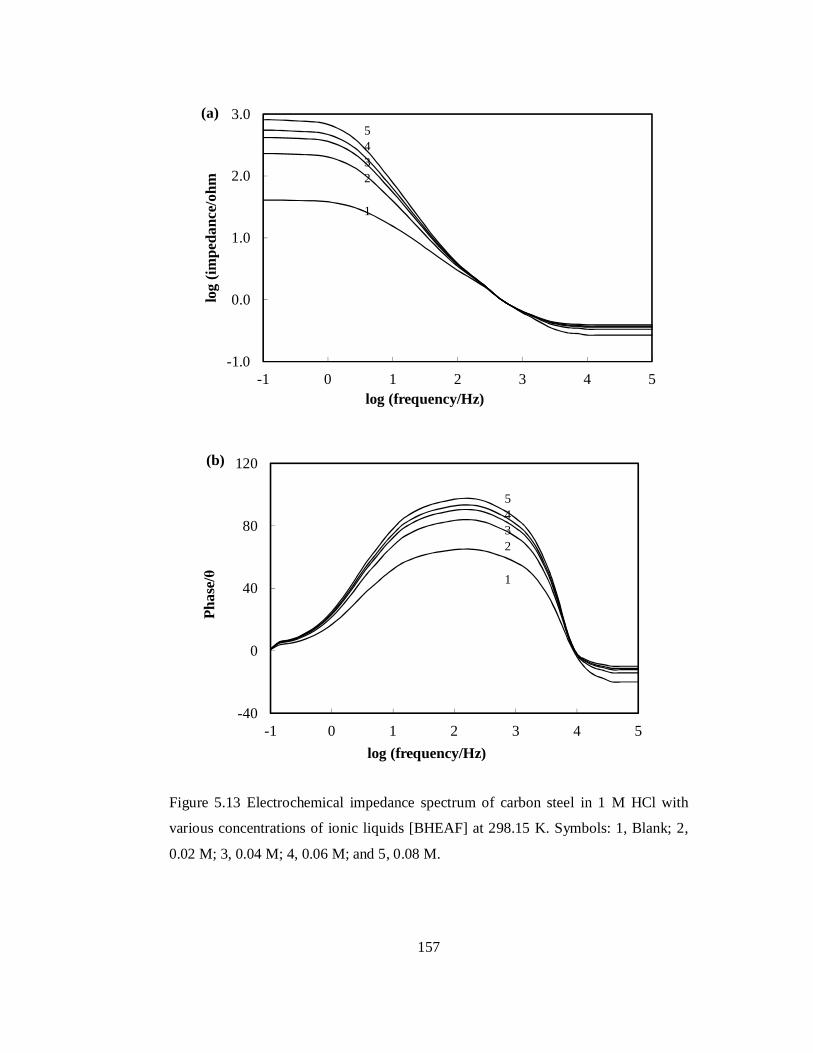
157
Figure 5.13 Electrochemical impedance spectrum of carbon steel in 1 M HCl with
various concentrations of ionic liquids [BHEAF] at 298.15 K. Symbols: 1, Blank; 2,
0.02 M; 3, 0.04 M; 4, 0.06 M; and 5, 0.08 M.
-1.0
0.0
1.0
2.0
3.0
-1 0 1 2 3 4 5
log
(impe
danc
e/oh
m
log (frequency/Hz)
5432
1
(a)
-40
0
40
80
120
-1 0 1 2 3 4 5
Phas
e/θ
log (frequency/Hz)
5432
1
(b)

158
Figure 5.14 Electrical Circuit Analog
Table 5.1 presents the electrochemical impedance parameters; Rs, Rt, and Cdl and
the corresponding inhibition efficiencies for carbon steel in 1 M HCl in the presence
of various concentrations of ionic liquids [BHEAF] at 298.15 K. From Table 5.1, the
solution resistance, Rs, almost constant for the carbon steel in the absence and
presence of different concentration of the ionic liquids [BHEAF]. However, the
charge transfer resistance, Rt, values changes with the addition of the ionic liquids
inhibitor. It appears that the presence of the ionic liquids increase the charge transfer
resistance that leads to the rise of corrosion efficiency. The effect is more pronounced
with increasing concentration of the ionic liquids inhibitor.
Table 5.1 Electrochemical impedance parameters and the corresponding inhibition
efficiency for carbon steel in 1 M HCl in the presence of various concentrations of
ionic liquids [BHEAF] at 298.15 K.
Ci/M Rs/Ω·cm2 Rt/Ω·cm2 Cdl/μF·cm-2 IE%
0.00 2.7 40.8 270 0.00
0.02 2.7 230.6 148 94.30
0.04 2.8 413.0 142 96.06
0.06 2.8 588.5 140 96.96
0.08 2.9 757.5 139 97.51

159
On the other hand the values of dlC decrease with increasing the inhibitor
concentration. As the inhibitor adsorbed onto the carbon steel surface, the capacitance
of the interface starts decreasing [3, 10, 11, 193-197].. The adsorbed ionic liquids on
the carbon steel surface forms protective film that reduces the dielectric constant
between the metal and electrolyte. Increasing concentration of the ionic liquids,
increase the thickness of the film and decrease the dielectric constant [3, 10, 11, 193-
197] .
In the case of the electrochemical impedance spectroscopy, the inhibition
efficiency was calculated using charge transfer resistance, Rt, according to equation
(2.33),
%100%
inht
tinht
RRR
IE (2.33)
The inhibition efficiency of the synthesized ionic liquids on carbon steel corrosion in
1 M HCl at 298.15 is given in Table C.4 of Appendix C. As expected, the inhibition
efficiency increases with increasing concentration of the ionic liquids. The result is in
good agreement with the values calculated from weight loss, Tafel Plots, and Linear
Polarization Resistance.
In general, all the synthesized ionic liquids showed high inhibition performance
on carbon steel corrosion in 1 M HCl. The inhibition efficiency measured from weight
loss, Tafel Plots, LPR, and EIS were in good agreement. However, as can be seen
from Table D.5 and D.6 of Appendix D, the IE% values calculated from weight loss
method were slightly higher than the other three methods used. It is due to time
needed to conduct the experiment; 24 hours for weight loss, 2 hours for Tafel Plots
and EIS, and 10 minutes for LPR. It assumes that equilibrium between metal and
electrolyte was reached during weight loss experiment. Thus, for further discussion,
the data is taken from weight loss method.

160
5.1.5 Effect of Temperature
In this work, the inhibition performances of the synthesized ionic liquids were
measured at four different temperatures of 298.15, 313.15, 328.15, and 343.15 K
using weight loss and electrochemical methods. The results are given in Table D.1 to
D.8 of Appendix D. In general, the inhibition efficiency decreases with increasing
temperature. A decrease in inhibition efficiency with increasing temperature indicates
that the adsorption of the ionic liquids molecules on the carbon steel surface is by
physisorption. This observation is supported by their standard free energy of
adsorption which was discussed in section 5.2.2.2.
A representation of temperature dependence of corrosion rate of carbon steel in 1
M HCl is given in Figure 5.15. It shows the corrosion rate of carbon steel in 1 M HCl
in the presence of various concentrations of ionic liquids [BHEAF] at the temperature
of 298.15, 313.15, 328.15, and 343.15 K using weight loss method. The corrosion rate
of carbon steel increased with increasing temperature. In the absence of the ionic
liquids, the corrosion rate of carbon steel increases significantly with increasing
temperature. However, in the presence of ionic liquids, the corrosion rate of carbon
steel decreased. It appears that the ionic liquids reduces corrosion rate of the carbon
steel in 1 HCl. It also suggests that the synthesized ionic liquids acted as good
inhibitor on carbon steel corrosion at the temperature of 298.15 – 343.15 K.
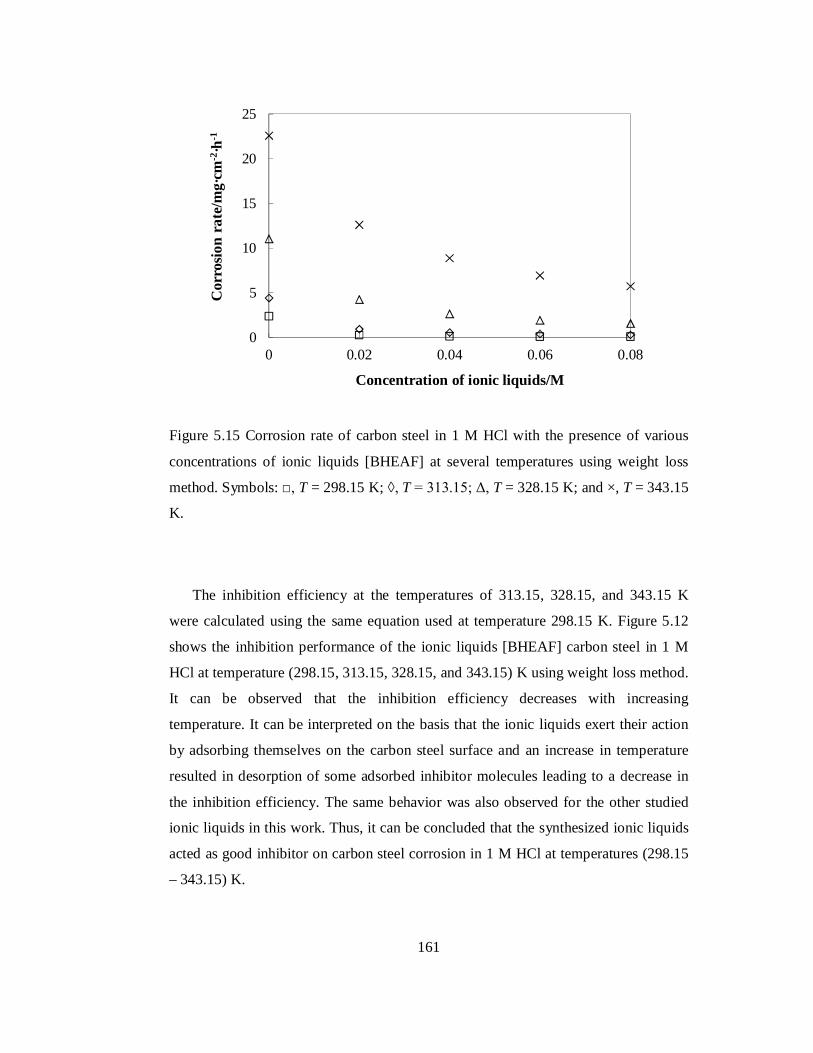
161
Figure 5.15 Corrosion rate of carbon steel in 1 M HCl with the presence of various
concentrations of ionic liquids [BHEAF] at several temperatures using weight loss
method. Symbols: □, T = 298.15 K; ◊, T = 313.15; Δ, T = 328.15 K; and ×, T = 343.15
K.
The inhibition efficiency at the temperatures of 313.15, 328.15, and 343.15 K
were calculated using the same equation used at temperature 298.15 K. Figure 5.12
shows the inhibition performance of the ionic liquids [BHEAF] carbon steel in 1 M
HCl at temperature (298.15, 313.15, 328.15, and 343.15) K using weight loss method.
It can be observed that the inhibition efficiency decreases with increasing
temperature. It can be interpreted on the basis that the ionic liquids exert their action
by adsorbing themselves on the carbon steel surface and an increase in temperature
resulted in desorption of some adsorbed inhibitor molecules leading to a decrease in
the inhibition efficiency. The same behavior was also observed for the other studied
ionic liquids in this work. Thus, it can be concluded that the synthesized ionic liquids
acted as good inhibitor on carbon steel corrosion in 1 M HCl at temperatures (298.15
– 343.15) K.
0
5
10
15
20
25
0 0.02 0.04 0.06 0.08
Cor
rosio
n ra
te/m
g·cm
-2·h
-1
Concentration of ionic liquids/M
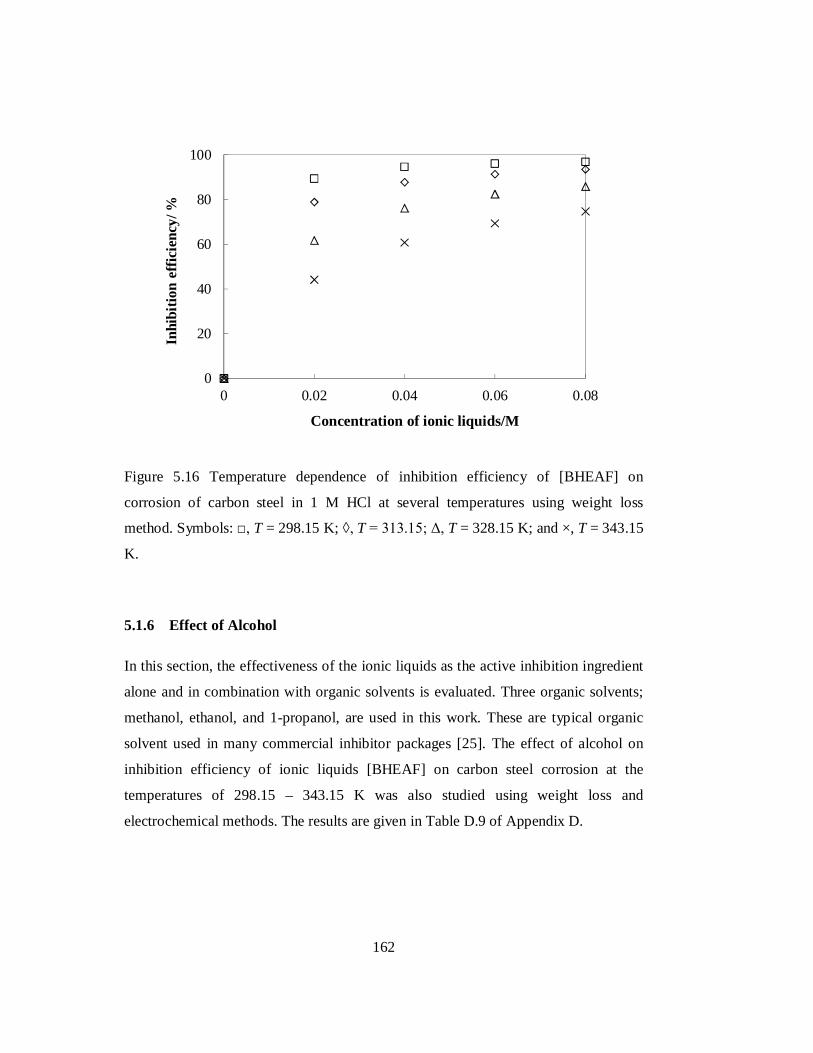
162
Figure 5.16 Temperature dependence of inhibition efficiency of [BHEAF] on
corrosion of carbon steel in 1 M HCl at several temperatures using weight loss
method. Symbols: □, T = 298.15 K; ◊, T = 313.15; Δ, T = 328.15 K; and ×, T = 343.15
K.
5.1.6 Effect of Alcohol
In this section, the effectiveness of the ionic liquids as the active inhibition ingredient
alone and in combination with organic solvents is evaluated. Three organic solvents;
methanol, ethanol, and 1-propanol, are used in this work. These are typical organic
solvent used in many commercial inhibitor packages [25]. The effect of alcohol on
inhibition efficiency of ionic liquids [BHEAF] on carbon steel corrosion at the
temperatures of 298.15 – 343.15 K was also studied using weight loss and
electrochemical methods. The results are given in Table D.9 of Appendix D.
0
20
40
60
80
100
0 0.02 0.04 0.06 0.08
Inhi
bitio
n ef
ficie
ncy/
%
Concentration of ionic liquids/M

163
A representative of inhibition performance of the ionic liquids [BHEAF] in the
presence of alcohol is given in Figure 5.17. It presents the inhibition efficiency of
0.08 M [BHEAF] in the absence and presence of methanol, ethanol, and 1 propanol
on the corrosion of carbon steel in 1 M HCl at temperature 298.15 using weight loss
methods. From Figure 5.13, the inhibition efficiency of [BHEAF] in the presence of
alcohol is found to be almost equal to the inhibition efficiency of [BHEAF] alone. It is
observed that the addition of alcohol did not change the inhibition efficiency, Tafel
Plot, or the electrochemical impedance parameters. The same phenomena are also
observed at higher temperatures. Thus, it can be concluded that these alcohols can be
used as cosolvent with ionic liquids, without reducing the ionic liquids performance.
The organic solvent is particularly helpful for reducing the viscosity of ionic liquids
which is known to be highly viscous, as discussed in Section 4.3.3.
Figure 5.17 Effect of alcohol on inhibition performance of 0.08 M of [BHEAF] on
carbon steel corrosion in acidic medium. Symbols; □, methanol; ◊, ethanol; Δ, 1-
propanol
0.00
0.02
0.04
0.06
0.08
0.10
0.00 0.02 0.04 0.06 0.08
Cor
rosio
n ra
te/m
g·cm
2 ·h-1
Concentration of alcohol/M

164
5.2 Adsorption of Ionic Liquids on the Carbon Steel Surface
The inhibiting effect of ammonium salt is attributed to either geometrical blocking of
the surface by the adsorbate or deactivating coverage, i.e. blocking of active surface
sites [3, 10, 11, 193-197]. In such cases the reduction in corrosion rate may be caused
by mass transfer restrictions or geometrical blocking. The adsorbed corrosion
inhibitor may be geometrically blocking the surface as a layer, thereby restricting the
access of corrosive species to the surface, or the transfer of corrosion products away
from it, or it may be blocking reaction sites by adsorption of inhibitor molecules [193,
194]. In this work, an attempt to study the protection-film formed by hydroxyl
ammonium ionic liquids was conducted using spectroscopy infrared and Raman. The
film formed was very thick that could not be detected by the instruments. Other
attempt was made by putting the carbon steel specimen into 100 ml pure ionic liquids.
Due to fluorescence effect, the spectroscopy Raman could not be used to detect the
interaction between ionic liquids and carbon steel. Future work is recommended to
use other method, such as quartz crystal microbalance (QCM) [197] or by means of
atomic force microscopy [195].
Taking into account that hydroxyl ammonium ionic liquids are ammonium salt, it
is believed that it reduces the corrosion rate of carbon steel by adsorbing themselves
on the carbon steel surface [3, 10, 11, 193-197]. The following section discussed the
adsorption of the hydroxyl ammonium ionic liquids on the carbon steel surface in 1 M
HCl.
5.2.1 Adsorption Isotherm
The adsorption isotherm used in this work refers to the relationship between the
inhibition efficiency and the concentration of inhibitors at constant temperature and it
gives an insight into the adsorption process. The type of the adsorption isotherm can
provide information on the properties of the tested compounds. Through adsorption
isotherm equations, the degree of surface coverage, θ, or its function with
concentration of inhibitors, inhC , can be correlated. The dependence of θ on inhC is

165
used to obtain the best fitting for adsorption isotherm. It is assumed that %IE is
comparable to the degree of coverage of metal surface by an inhibitor, θ [22, 23].
In this study, several adsorption isotherm equations; Langmuir, Frumkin, and
Temkin, were considered. It found that the Langmuir’s isotherm was the best to
represent the adsorption behavior of the studied ionic liquids. The Langmuir isotherm
was represented by equation (2.35),
inhads
inh CK
C
1
(2.35)
A representative of the plot of /inhC against inhC is given in Figure 5.18. It is
shown that the plot of /inhC against inhC for ionic liquids [BHEAF] on carbon steel
surface at temperature (298.15 – 343.15) K gives straight lines, with R2 are almost
equal to 1. The same trend was also observed for plot /inhC against inhC of the other
synthesized ionic liquids. It confirms that the adsorption of the ionic liquids in 1 M
HCl acid obeys the Langmuir isotherm adsorption within the temperature range
studied. The isotherm parameters for all the synthesized ionic liquids are listed in
Table D.9 of Appendix D.
According to Sastri [1], Langmuir adsorption isotherm assumes that the metal
surface has a fixed number of adsorption sites which could be occupied by the
absorbed species. In other words, the ionic liquids form a layer which covers all the
active sites on the surface of carbon steel without distinguishing between anodic and
cathodic sites. The same isotherm adsorption is also observed for other ionic liquids
based on imidazolium cation [22-24]. Thus, it can be concluded that the ionic liquids
suppresses the corrosion rate by adsorbing themselves on the carbon steel surface.
The adsorbed ionic liquids on the carbon steel surface form a protective layer.
Increasing the concentration of the ionic liquids leads to the increase in the thickness
of protective layer, which give higher energy barrier. This result is supported by their
apparent activation energy that discussed in Section 5.2.4.

166
Figure 5.18 Plots of Langmuir’s isotherm adsorption of [BHEAF] at several
temperatures using weight loss method. Symbols: □, T = 298.15 K; ◊, T = 313.15; Δ,
T = 328.15 K; ×, T = 343.15 K and (---) Correlation using equation (2.35).
5.2.2 Equilibrium Constant of Adsorption Process
The equilibrium constant of the adsorption process, adsK is calculated using equation
(2.40),
1inh
ads CK (2.40)
The values of adsK are listed in Table D.10 of Appendix D. A representative plot of
adsK as function of temperature is given in Figure 5.19.
0.00
0.02
0.04
0.06
0.08
0.10
0.12
0.02 0.04 0.06 0.08
C i
Ci/θ
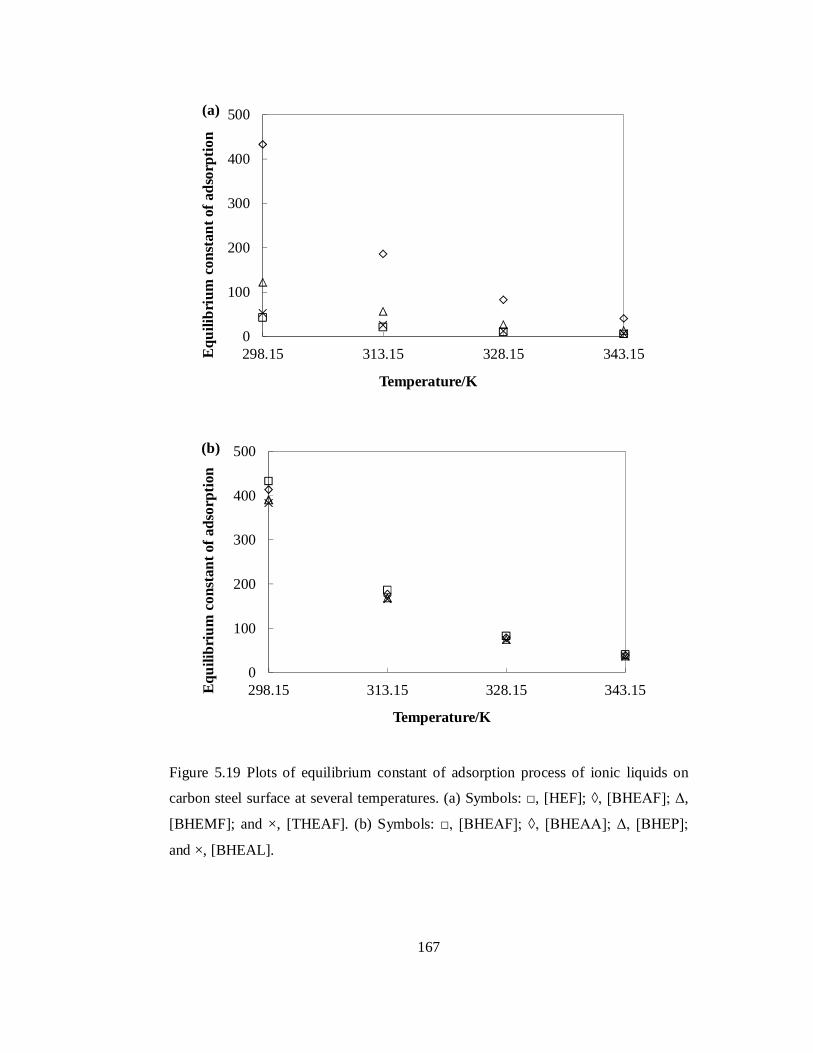
167
Figure 5.19 Plots of equilibrium constant of adsorption process of ionic liquids on
carbon steel surface at several temperatures. (a) Symbols: □, [HEF]; ◊, [BHEAF]; Δ,
[BHEMF]; and ×, [THEAF]. (b) Symbols: □, [BHEAF]; ◊, [BHEAA]; Δ, [BHEP];
and ×, [BHEAL].
0
100
200
300
400
500
298.15 313.15 328.15 343.15Equi
libri
um c
onst
ant o
f ads
orpt
ion
Temperature/K
(a)
0
100
200
300
400
500
298.15 313.15 328.15 343.15Equi
libri
um c
onst
ant o
f ads
orpt
ion
Temperature/K
(b)

168
Figure 5.19(a) shows the effect of the cation on the equilibrium constant of
adsorption process of the ionic liquids on carbon steel surface at temperature 298.15,
313.15, 328.15, and 343.15 K. The bis(2-hydroxyethyl)ammonium cation has the
highest adsK and it is followed by bis(2-hydroxyethyl)methylammonium, tris(2-
hydroxyethyl) ammonium, and 2-hydroxyethanaminium cation, regardless the anion.
This result is consistent with their inhibition efficiency behavior. Effect of the cation
on the equilibrium constant of adsorption process of the ionic liquids on carbon steel
surface is more dominant when it compared to their anion. The values of adsK at
298.15 K are 42.43 to 432.81 for [HEF] and [BHEAF], respectively. The difference of
adsK between the two cations is much higher when it is compared to the two anions.
Hence, it can be concluded that the cation has more effect on the equilibrium constant
of adsorption process of the ionic liquids on carbon steel surface. The same
observations were also reported for the imidazolium cation of ionic liquids [22-24]
and ammonium-salt corrosion inhibitor [3, 10, 11, 193-197].
As can be seen from Figure 5.19(a), the format anion shows the highest
equilibrium constant of adsorption, followed by acetate, propionate, and lactate. This
result is in good agreement with their inhibition efficiency order as discussed in
section 5.1.1.1. The effect of anion on the equilibrium constant of adsorption process
of the ionic liquids on carbon steel surface is minor compared to the cation. The
values of adsK at 298.15 K are 413.47 and 432.81 for [BHEAA] and [BHEAF],
respectively. The difference of adsK between the two anions is smaller when it is
compared to the two cations. It might be attributed to the adsorption mode of ionic
liquids through their cation, rather than their anion, as discussed above.
Increasing temperature leads to decrease in the adsK . The same observation is
observed all the synthesized ionic liquids in this work. Such behavior can be
interpreted on the basis that the inhibitors exert their action by adsorbing themselves
on the metal surface and an increase in temperature resulted in desorption of some
adsorbed inhibitor molecules leading to a decrease in their values of adsK . According
to Sastri [1], if the increases in temperature cause the decreases in adsK , it means that

169
the adsorption of the inhibitor on the steel surface is physical adsorption. This
physical adsorption of ionic liquids on the carbon steel surface is confirmed by their
standard free energy of adsorption, as discussed in section 5.2.3.1.
5.2.3 Thermodynamics of Adsorption Process
The thermodynamics adsorption parameter is another useful tool to explain the
mechanism of inhibition on carbon steel corrosion. It can be used to understand the
effect of concentration and temperature on the adsorption processes of the ionic
liquids on the carbon steel surface in 1 M HCl. The thermodynamic parameters
include standard free energy of adsorption, enthalpy and entropy of activation [22-
24].
5.2.3.1 Standard Free Energy of Adsorption
The standard free energy of adsorption, adsG is related to adsK , by the equation
(2.41),
adsads KRTG 5.55ln (2.41)
The standard free energy values for all studied ionic liquids are presented in Table
D.11 in Appendix D. A representative plot of adsG at different temperature is given
in Figure 5.20. The calculated values of adsG are negative which indicate the
adsorption of ionic liquids molecules on the surface of carbon steel are a spontaneous
reaction.

170
Figure 5.20 Plots of standard free energy of adsorption process of ionic liquids on
carbon steel surface at several temperatures. (a) Symbols: □, [HEF]; ◊, [BHEAF]; Δ,
[BHEMF]; and ×, [THEAF]. (b) Symbols: □, [BHEAF]; ◊, [BHEAA]; Δ, [BHEP];
and ×, [BHEAL].
-27
-25
-23
-21
-19
-17
-15
298.15 313.15 328.15 343.15
ΔGad
s/kJ•
mol
-1
Temperature/K
(a)
-27
-26
-25
-24
-23
-22
-21
298.15 313.15 328.15 343.15
ΔGad
s/kJ
•mol
-1
Temperature/K
(b)

171
According to Sastri [1] the values of adsG around -20 kJ·mol-1 or lower
consistent with physisorption process which is an electrostatic interaction between
charged molecules and the charged metal surface; those around -40 kJ·mol-1 or higher
are consistent with chemisorption, it involves charge sharing or transfer from organic
molecules to the metal surface to form a coordinate type of metal bond [1]. In this
work, the calculated adsG values are around -20 kJ·mol-1, thus indicating that the
adsorption of the ionic liquids molecules on the surface of carbon steel is by
physisorption.
Figure 5.20(a) shows the effect of the cation on the equilibrium constant of
adsorption process of the ionic liquids on carbon steel surface at temperature 298.15,
313.15, 328.15, and 343.15 K. The bis(2-hydroxyethyl)ammonium cation has the
highest adsG and it is followed by bis(2-hydroxyethyl)methylammonium, tris(2-
hydroxyethyl) ammonium, and 2-hydroxyethanaminium cation, regardless the anion.
This result is consistent with their inhibition efficiency behavior. Effect of the cation
on the standard free energy of adsorption of the ionic liquids on carbon steel surface is
more dominant when it compared to their anion. The values of adsG at 298.15 K are
-19.25 to -25.00 kJ·mol-1 for [HEF] and [BHEAF], respectively, meanwhile the values
of adsG for [BHEAF] and [BHEAA] are -25.00 and -24.89 kJ·mol-1, respectively
The difference of adsG between the two cations is much higher when it is compared
to the two anions. Hence, it can be concluded that the cation has more effect on the
equilibrium constant of adsorption process of the ionic liquids on carbon steel surface.
As can be seen from both 5.20(a) and (b) the value of adsG decreases with
increasing temperature. An increase in temperature resulted in desorption of some
adsorbed inhibitor molecules leading to a decrease in their values of adsG , which is
typical physical adsorption [1]. This result is also consistent with its equilibrium
constant of adsorption. The same observation is observed all the synthesized ionic
liquids in this work and for ammonium-salt corrosion inhibitor in acidic medium [3,
10, 11, 193-197].

172
5.2.3.2 Enthalpy and Entropy of Activation
The enthalpy and entropy of activation are calculated using equation (2.42),
RTH
RS
NhRTCR actact expexp (2.42)
The enthalpy and entropy of activation for carbon steel corrosion in the absence and
presence of various ionic liquids concentration is calculated by linear regression
between ln (CR/T) against 1/T. A representative for the plot of ln (CR/T) against 1/T is
shown in Figure 5.21. Tthe plot of ln (CR/T) in the presence of various concentrations
of ionic liquids [BHEAF] against 1/T is linear, with slope of RH act / and an
intercept of RSNhR act //ln from which the values of actH and actS are
calculated. The actH and actS values for all the synthesized ionic liquids are given
in Table D.12 and D.13 of Appendix D. Figure 5.22 and present the effect of ionic
liquids on the enthalpy and entropy of activation .
Figure 5.21 Plot of ln(CR/T) against 1/T for ionic liquids. Symbols: □, [BHEAF]; ◊,
[BHEAA]; Δ, [BHEP]; and ×, [BHEAL].
R² = 0.9958
R² = 0.998
R² = 0.9977R² = 0.9973
-2
-1
0
1
2
3
4
0.0029 0.0030 0.0031 0.0032 0.0033 0.0034
ln(c
orro
sion
rate
)/mg·
cm-2
·h-1
(1/Temperature)/(K-1)

173
Figure 5.22 Plots of enthalpy of activation for carbon steel corrosion in the presence
of various concentrations of ionic liquids. (a) Symbols: □, [HEF]; ◊, [BHEAF]; Δ,
[BHEMF]; and ×, [THEAF]. (b) Symbols: □, [BHEAF]; ◊, [BHEAA]; Δ, [BHEP];
and ×, [BHEAL].
40.0
50.0
60.0
70.0
80.0
90.0
0.00 0.02 0.04 0.06 0.08
Enth
alpy
of a
ctiv
atio
n/ k
J·m
ol -1
Concentration of ionic liquids/M
(a)
40.0
50.0
60.0
70.0
80.0
90.0
0.00 0.02 0.04 0.06 0.08
Enth
alpy
of a
ctiv
atio
n/ k
J·m
ol -1
Concentration of ionic liquids/M
(b)

174
The enthalpy of activation in the presence of ionic liquids is higher than without
the presence of the ionic liquids. Also, the value of the enthalpy of activation
increases with increasing concentration of the ionic liquids. One possible explanation
for this phenomenon is the adsorbed ionic liquids on the carbon steel surface form a
protective layer thus protecting it from corrosion. For this reason higher energy is
required for corrosion to take place in the presence of ionic liquids [1]. Figure 5.22(b)
shows the effect of the cation on the enthalpy activation of carbon steel corrosion in 1
M HCl and in the absence and presence of various concentrations of ionic liquids. The
bis(2-hydroxyethyl)ammonium cation has the highest enthalpy of activation within
the concentration range and followed by bis(2-hydroxyethyl)methylammonium,
tris(2-hydroxyethyl)ammonium, and 2-hydroxy ethanaminium cation, regardless the
anion. This result is consistent with their inhibition efficiency behavior. The effect of
the cation on the enthalpy of activation for the ionic liquids on carbon steel surface is
more dominant when it compared to their anion. The values of actH in the presence
of 0.02 M [HEF] and [BHEAF] are 50.27 and 72.46 kJ·mol-1, respectively.
Meanwhile, the values of actH in the presence of 0.02 M of [BHEAF] and
[BHEAA] are 72.46 and 72.00 kJ·mol-1, respectively. The difference of apparent
activation energy between the two cations is much higher when it is compared to the
two anions. Hence, it can be concluded that the cation has more effect on the enthalpy
activation of the ionic liquids on carbon steel surface. It might be attributed to the
same reason for their inhibition efficiency.
Figure 5.23 shows the effect of ionic liquids on the entropy of activation for
carbon steel corrosion in 1 M HCl and in the absence and presence of various
concentrations of ionic liquids. The value of actS for the carbon steel corrosion in
the presence of ionic liquids is higher than in the absence of ionic liquids. The value
becomes higher and positive with increasing ionic liquids concentration. This
indicates that the activated complex in the rate determining step represents an
association rather than a dissociation step, meaning that, a decrease in disordering
takes place going from reactants to the activated complex [3, 10, 11, 193-197].

175
Figure 5.23 Plots of entropy of activation for carbon steel corrosion in the presence of
various concentrations of ionic liquids. (a) Symbols: □, [HEF]; ◊, [BHEAF]; Δ,
[BHEMF]; and ×, [THEAF]. (b) Symbols: □, [BHEAF]; ◊, [BHEAA]; Δ, [BHEP];
and ×, [BHEAL].
-120
-100
-80
-60
-40
-20
0
20
0.00 0.02 0.04 0.06 0.08
Entr
opy
of a
ctiv
atio
n/ J
·K -1
·mol
-1
Concentration of ionic liquids/M
(a)
-120
-100
-80
-60
-40
-20
0
20
0.00 0.02 0.04 0.06 0.08
Entr
opy
of a
ctiv
atio
n/ J
·K -1
·mol
-1
Concentration of ionic liquids/M
(b)

176
The bis(2-hydroxyethyl)ammonium cation has the highest entropy of activation
within the concentration range and followed by bis(2-hydroxyethyl)methyl
ammonium, tris(2-hydroxyethyl)ammonium, and 2-hydroxyethanaminium cation,
regardless the anion. This result is consistent with their inhibition efficiency behavior.
The effect of the cation on the entropy of activation for the ionic liquids on carbon
steel surface is more dominant when it compared to their anion. The values of actS
in the presence of 0.02 M of [HEF] and [BHEAF] are -74.50 and -13.63 J·K-1·mol-1,
respectively. Meanwhile, the values of actS in the presence of 0.02 M of [BHEAF]
and [BHEAA] are -13.63 and -14.84 J·K-1·mol-1, respectively. The difference of the
entropy of activation between the two cations is much higher when it is compared to
the two anions. Hence, it can be concluded that the cation has more effect on the
entropy of activation for the ionic liquids on carbon steel surface. It might be
attributed to the same reason for their inhibition efficiency.
5.2.4 The Apparent Activation Energy
The apparent activation energies, Ea, of ionic liquids are calculated using equation
(2.43),
ARTECR a
ln (2.43)
where Ea represents the apparent activation energy, R the universal gas constant, T the
absolute temperature, and A is the pre-exponential factor. The apparent activation
energies for carbon steel corrosion in the absence and presence of various ionic
liquids concentration is calculated by linear regression between ln CR and 1/T. A
representative for the plot of ln CR against 1/T is shown in Figure 5.24. The plot of ln
CR in the presence of various concentrations of ionic liquids against 1/T shows a
linear relation, with R2 coefficients are close to 1. The slope of the straight line is
equal to –Ea/R. The linear regression coefficient values, R2, for all the synthesized
ionic liquids are listed in Table D.14 of Appendix D. All the R2 coefficients are close
to 1, indicating that the carbon steel corrosion in hydrochloric acid can be elucidated

177
using Arrhenius model. The activation energy values for the carbon steel corrosion in
1 M HCl in the presence of the synthesized ionic liquids are also given in Table D.14
of Appendix D.
Figure 5.24 Plot of ln(C/R) against 1/T for ionic liquids. Symbols: □, [BHEAF]; ◊,
[BHEAA]; Δ, [BHEP]; and ×, [BHEAL].
Figure 5.25 presents the apparent activation energy in the presence of various
concentrations of ionic liquids. The apparent activation energy in the presence of the
ionic liquids is higher than in the absence of the ionic liquids. It means higher energy
is required for carbon steel corrosion in the presence of the ionic liquids. Furthermore,
it is found that the energy barrier for the carbon steel corrosion reaction increases with
increasing the ionic liquids concentration, indicating that higher energy barrier is
brought by the presence of the ionic liquids. It is often interpreted by physical
adsorption lead to the formation of an adsorptive film of electrostatic character [1].
-7
-6
-5
-4
-3
-2
0.0029 0.0030 0.0031 0.0032 0.0033 0.0034
ln(C
R/T)
(1/Temperature)/(K-1)
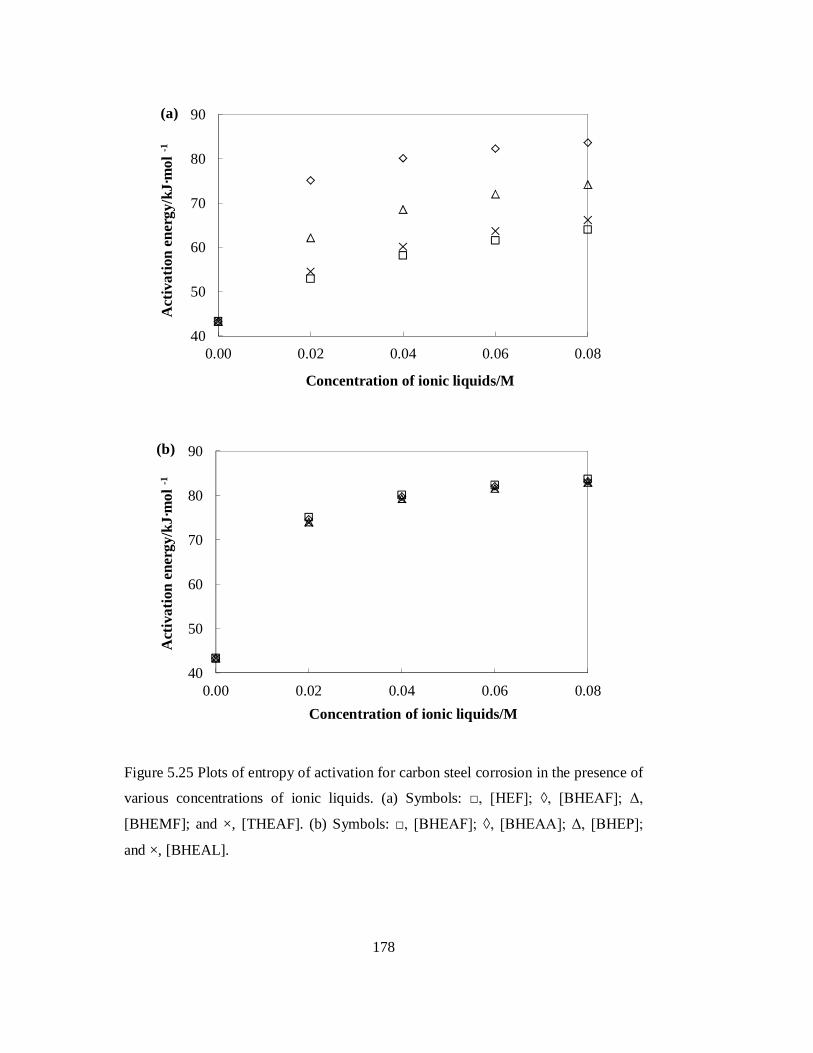
178
Figure 5.25 Plots of entropy of activation for carbon steel corrosion in the presence of
various concentrations of ionic liquids. (a) Symbols: □, [HEF]; ◊, [BHEAF]; Δ,
[BHEMF]; and ×, [THEAF]. (b) Symbols: □, [BHEAF]; ◊, [BHEAA]; Δ, [BHEP];
and ×, [BHEAL].
40
50
60
70
80
90
0.00 0.02 0.04 0.06 0.08
Act
ivat
ion
ener
gy/k
J·m
ol -1
Concentration of ionic liquids/M
(a)
40
50
60
70
80
90
0.00 0.02 0.04 0.06 0.08
Act
ivat
ion
ener
gy/k
J·m
ol -1
Concentration of ionic liquids/M
(b)
179
Figure 5.25(a) shows the effect of cation on the apparent activation energy for the
carbon steel. The bis(2-hydroxyethyl)ammonium cation has the highest apparent
activation energy within the concentration range and followed by bis(2-
hydroxyethyl)methylammonium, tris(2-hydroxyethyl)ammonium, and 2-hydroxy
ethanaminium cation, regardless the anion. This result is consistent with their
inhibition efficiency behavior. Meanwhile, Figure 5.23(b) shows effect of the anion
on the apparent activation energy for the carbon steel corrosion in the absence and
presence of various concentrations of the ionic liquids. The format anion shows the
highest apparent activation energy within the concentration range, followed by
acetate, propionate, and lactate, regardless the cation. This result is in good agreement
with their inhibition efficiency as discussed in section 5.1.1.1. The effect of anion on
the apparent activation energy of the ionic liquids on carbon steel surface is also
minor compared to the cation. As can be seen from Figure 5.23(b), the values of Ea in
the presence of 0.02 M of [BHEAF] and [BHEAA] are 75.12 and 74.65 kJ·mol-1,
respectively. The difference of the apparent activation energy between the anions is
smaller when it is compared to the cations. It might be attributed to the same reason
for their inhibition efficiency.
5.3 Inhibiting Mechanism
The aim of this study is to gain some insight into the effect of adding the synthesized
ionic liquids on the carbon steel corrosion in 1 M HCl and to describe the adsorption
mechanisms for the synthesized ionic liquids. The ionic liquids [BHEAF] is chosen as
model for inhibiting mechanism as it has the highest inhibition efficiency among the
studied ionic liquids in this work. The following mechanism is proposed for the
carbon steel corrosion in 1 M HCl in the presence of the ionic liquids based on their
adsorption and its thermodynamic as discussed earlier.
In the absence of the ionic liquids, the following reaction takes place when the
carbon steel immersed in the 1 M HCl [1],
Anodic reaction, Fe → Fen+ + ne- (5.1)

180
Cathodic reaction, 2H+ + 2e- → H2 (5.2)
The number of electron, n, involved in equation (5.1) depends on the corrosion
potential, Ecorr, of the carbon steel in acidic medium. From section 5.1.2, the Ecorr
value for carbon steel in the absence and presence of ionic liquids was around -0.5 V
(vs SHE). Using E-pH diagram of iron as given in Figure 2.13, the number of electron
involved in equation (5.1) is two. Thus, equation (5.1) can be written as,
Anodic reaction: Fe → Fe2+ + 2e- (5.1a)
In acidic media, the ionic liquids exist in the form of cation and anion species.
According to Bockris and Drazic (1962), the inhibition mechanism can be explained
by the Fe(Inh)ads reaction intermediates,
Fe + Inh ↔ Fe-(Inh)ads ↔ Fe2+ + 2e- + Inh (5.3)
For [BHEAF] it can be written as follow,
Fe + BHEA+ F- ↔ [Fe-(BHEA+F-)]ads ↔ Fe2+ + 2e- + BHEA+F- (5.4)
The [Fe-(BHEA+F-)]ads intermediate forms an adsorption layer through cation of the
ionic liquids. This fact is supported by their inhibition efficiency, as discussed in
sections 5.1.1.1 and 5.1.1.2, in which the cation is responsible for the protective
behavior of the ionic liquids. Also, as discussed in section 5.2.3.1, the adsorption of
the ionic liquids on the carbon steel surface is thermodynamically favored. Hence the
ionic liquids are adsorbed spontaneously on the carbon steel surface in 1 M HCl.
The adsorption layer acts as a hindrance to the hydrochloric acid solution and
enhances the protection of the metal surface. Initially when there is insufficient [Fe-
(BHEA+F-)]ads to cover the carbon steel surface, because the inhibitor concentration is
low or because the adsorption rate is slow, metal dissolution takes place at sites on the
carbon steel surface free of [Fe-(BHEA+F-)]ads. With high inhibitor concentration a
compact and coherent inhibitor over layer is formed on the carbon steel surface,
reducing chemical attack of the metal. This fact is also supported from their apparent

181
activation energy, as discussed in 5.2.4, in which an increase in the concentration of
ionic liquids increases the inhibition efficiency.
Reactions 5.3 and 5.4 take place on the anodic sites of the carbon steel. The ionic
liquids molecules also adsorbed at cathodic sites in competition with hydrogen ion. In
the presence of the ionic liquids, by the following mechanism:
Fe ↔ [Fe-(BHEA+F-)]ads (5.5)
Fe + H+ ↔ (FeH+)ads (5.6)
(FeH+)ads + e- → (FeH)ads (5.7)
(FeH)ads + H+ + e- → Fe + H2(g) (5.8)
As can be seen from equation (5.5), addition of the ionic liquids leads to the formation
of the adsorption layer [Fe-(BHEA+F-)]ads to cover the carbon steel surface. Initially
when there is insufficient [Fe-(BHEA+F-)]ads to cover the carbon steel surface, because
the inhibitor concentration is low or because the adsorption rate is slow, hydrogen
reduction takes place at sites on the carbon steel surface free of [Fe-(BHEA+F-)]ads.
With high inhibitor concentration a compact and coherent inhibitor over layer is
formed on the carbon steel surface, reducing the hydrogen reduction.
Therefore, addition of the ionic liquids suppresses both the dissolution of metal in
the anodic site and the reduction of hydrogen in the cathode site. This result support
the observation resulted from Tafel Plots, as discussed in section 5.1.2.
5.4 Concluding Remarks
Ionic liquids have become important as an environmentally acceptable and readily
available for a wide range of needed inhibitors. However, their price is relatively
higher compared to the commercially available corrosion inhibitor. An alternative
way is to find cheaper ionic liquids that can be applied as corrosion inhibitor on
carbon steel corrosion in acidic medium. Hydroxyl ammonium ionic liquids are
relatively cheap and easy to produce in purity greater than 99%. In order to develop

182
low cost corrosion inhibitors, the recent investigations on application of the ionic
liquids as inhibitor on corrosion of carbon steel in 1 M HCl, seem really worthwhile.
In this work, the inhibition performance of the synthesized ionic liquids on carbon
steel corrosion in 1 M HCl at temperatures (298.15 – 343.15) K was measured using
weight loss and electrochemical method. The electrochemical method included Tafel
Plot, LPR, and EIS. The result showed that the synthesized ionic liquids managed to
reduce the corrosion rate of carbon steel in 1 M HCl at temperature range studied in
this work. The inhibition performance could reach up to 96.87% in the presence of
0.08 M [BHEAF]. The ionic liquids inhibited the corrosion rate of carbon steel by
absorbing themselves on the surface of carbon steel. The adsorption process of the
ionic liquids on the carbon steel surface was spontaneous and it obeyed Langmuir
isotherm adsorption.
The ionic liquids adsorbed on the surface of carbon steel surface through its
cation. It was absorbed without distinguishing the cathode and anode site. The
adsorbed ionic liquids on the carbon steel surface forms a protective film that give
energy barrier between metal and electrolyte inter phase. Increasing concentration
increased the thickness of the protective film, which leads to higher energy barrier.
The inhibition performance decreased with increasing temperature. This is due to
desorption of some adsorbed inhibitor molecules leading to a decrease in the
inhibition efficiency. However, within the temperature range studied in this work, the
synthesized ionic liquids still showed high inhibition performance. It suggests that all
the synthesized ionic liquid in this work has the potential to be used as inhibitor on
carbon steel corrosion in 1 M HCl.

CHAPTER 6
CONCLUSIONS AND RECOMMENDATIONS
6.1 Conclusions
The following conclusions can be drawn based on the result from this work
1. The synthesis of hydroxyl ammonium ionic liquids was successful. The structure
of the synthesized ionic liquids was confirmed through Infrared and NMR spectra.
Moreover, chemical composition of the synthesized ionic liquids were verify from the
elemental analysis measurement.
2. The physical properties, namely density, viscosity, and refractive index, of the
pure ionic liquids and binary mixture of ionic liquids with alcohols were measured
from temperature 293.15 to 353.15 K. The physical properties were highest at pure
ionic liquids and decreased with increasing concentration of the alcohol, reaching the
lowest value at pure alcohols. Furthermore, the physical properties of the pure ionic
liquids and its binary mixture with alcohol were found to be decreased with increase
in temperature. The temperature dependence of physical properties of these systems
can be correlated using empirical method.
3. The synthesized ionic liquids could reduce the corrosion rate of carbon steel in 1
M HCl at temperature from 298.15 K to 343.15 K. The ionic liquids reduced the
corrosion rate by adsorbing themselves on the carbon steel surface and obeyed the
Langmuir’s isotherm adsorption. It formed protective layer on carbon steel surface
which give higher energy barrier for corrosion to take place. The inhibition

184
performance was more pronounced with increasing concentration of the ionic liquids.
Moreover, the adsorption of the ionic liquids on the carbon steel surface was
spontaneous within the temperature studied in this work. It suggests that all the
synthesized ionic liquid in this work has the potential to be used as inhibitor on
carbon steel corrosion in 1 M HCl.
4. Addition of alcohol on ionic liquids did not alter the inhibition efficiency. Thus, it
can be concluded that these alcohols can be used as cosolvent with ionic liquids,
without reducing the ionic liquids performance. The organic solvent is particularly
helpful for reducing the viscosity of ionic liquids which is known to be highly
viscous.
6.2 Recommendations
This research work has open up for several opportunities for further study. The
following issues are recommended for future work in investigating the application of
the ionic liquids on carbon steel corrosion in acidic media.
1. The organic corrosion inhibition is the most effective means of protecting the
severely internal corrosion of carbon steel pipelines for well acidising. The acid
solutions are required to be transported to the respective well. Transporting the acid
solution makes the corrosion problems even worse. Therefore it is also worthwhile to
consider the effect of the solution flow on the corrosion inhibition of the synthesized
ionic liquids.
2. In the industries, the equipments are often submitted to aggressive conditions such
as high temperature and pressure, involving the early apparition of corrosion. Thus
corrosion and corrosion inhibition studies under these conditions are very important
for industrial applications. Therefore to compliment results obtained in this work,
additional experiment can be done to study the effect of high temperature and
pressure on the inhibition performance of the synthesized ionic liquids.

185
PUBLICATION
A. Journal
1. Kiki A. Kurnia, M.I. Abdul Mutallib, B. Ariwahjoedi, “Estimation of Physical Properties of Ionic Liquids [H2N-C2mim][BF4] and [H2N-C3mim][BF4]”, Journal of Chemical and Engineering Data 2011, 56 (5), pp. 2557-2562.
2. M.C. Fatah, M.C. Ismail, B. Ari-Wahjoedi, Kiki A. Kurnia, “Effects of sulphide ion on the corrosion behaviour of X52 steel in a carbon dioxide environment at temperature 40 °C “, Materials Chemistry and Physics 2011, 127(1-2) : 347-352.
3. Kiki A. Kurnia, M.I. Abdul Mutalib, T. Murugesan, and B. Ariwahjoedi, “Physicochemical Properties of Binary Mixture of the Protic Ionic Liquid Bis(2-hydroxyethyl)methylammonium Formate with Methanol, Ethanol, and 1-Propanol”, Journal of Solution Chemistry, 2011, 40 (5), pp. 818-831.
4. Kiki Adi Kurnia, M.I. Abdul Mutalib, T. Murugesan, “Densities, Refractive Indices and Excess Molar Volumes for Binary Mixtures of Protic Ionic Liquids with Methanol at T = (293.15 to 313.15) K”, Journal of Molecular Liquids, 2011, 159 (3), pp. 211-219.
5. Kiki A. Kurnia, M.I. Abdul Mutalib, T. Murugesan, and B. Ariwahjoedi, “Density and Excess Molar Volume of Protic Ionic Liquids Bis(2-hydroxyethyl)ammonium Acetate with Alcohol”, Journal of Solution Chemistry, 2011, 40 (3), pp. 470-480.
6. Kiki A. Kurnia and M.I. Abdul Mutalib, “Densities and Viscosities of Binary Mixture of the Ionic Liquid Bis(2-hydroxyethyl)ammonium Propionate with Methanol, Ethanol, and 1-Propanol at T = (293.15, 303.15, 313.15, and 323.15) K and at P = 0.1 MPa”, 2011, Journal of Chemical and Engineering Data, 2011, 56 (1), pp. 79-83.
7. Faisal Harris, Kiki Adi Kurnia, M. I. Abdul Mutalib and Thanapalan Murugesan, “Heat Capacity of Sodium Aminoacetate Solutions before and after CO2 Absorption”, Journal of Chemical and Engineering Data, 2010, 55 (1), pp. 547-550
8. Kiki A. Kurnia, F. Harris, Cecilia D. Wilfred, M. I. Abdul Mutalib, T. Murugesan, “Thermodynamic of Carbon Dioxide Solubility in Hydroxyl Ammonium Ionic Liquids”, The Journal of Chemical Thermodynamic, 2009, 41 (10), pp. 1069-1073.
9. F. Harris, Kiki A. Kurnia, , M. I. Abdul Mutalib, T. Murugesan, “Density and Solubility of Carbon Dioxide in aqueous solution of Sodium Glycinate for absorption at high pressure”, Journal of Chemical and Engineering Data, 2009, 54 (1), pp. 144-147.

186
10. Kiki A. Kurnia, Cecilia D. Wilfred, T. Murugesan, “Thermochemical properties of Hydroxyl Ammonium Ionic Liquids”, The Journal of Chemical Thermodynamic, 2009, 41 (4), pp. 517-521.
B. Conference
1. Kiki A. Kurnia, Hasiah Kamarudin, M.R. Mohamed Ramli, M.I. Abdul Mutalib, Zakaria Man, M. Azmi Bustam, "Separation of aromatic from aliphatic hydrocarbon using ionic liquids. A COSMO-RS screening for potential ionic liquids", Workshop on Graduate Research Trends in France and in Malaysia: Compare and Contrast, SEACARL UTP - IFP, Malaysia, 2011.
2. Kiki A. Kurnia, M.I.A. Mutalib, and T. Murugesan, “Protic ionic liquids: A new class of inhibitor on corrosion of carbon steel in acidic medium”, Accepted in Asia Pacific Conference on Ionic Liquids and Green Processes, Dalian, China, 2010.
3. Kiki A. Kurnia, A.A.A. Khan, M. Fatah, B. Ariwahjoedi, M.I.A. Abdul Mutalib, and T. Murugesan, “ Effect of Bis(2-Hydroxyethyl)ammonium Formate on Corrosion of Carbon Steel in Acidic Medium”, Accepted in International Conference on Functional Material and Design 2010, University of Malaya, 2010
4. A.A.A. Khan, Kiki A. Kurnia, and M.A. Abdullah, “Montmorillonite-Modified Carbon Ionic Liquid Electrode for Cadmium (II) and Lead (II) Detection”, Accepted in International Conference on Functional Material and Design 2010, University of Malaya, 2010
5. A.A.A. Khan, Kiki A. Kurnia, and M.A. Abdullah, “Cadmium (II) Detection by Montmorillonite-Modified Carbon Ionic Liquids”, Accepted in International Conference of Green Technologies for Greener Environment, India, 2009
6. Kiki A. Kurnia, Mohamed Ibrahim Abdul Mutalib, and Thanabalan Murugesan, “Inhibition Effect of 2-Hydroxyethanaminium Acetate on Corrosion of Carbon Steel in Acidic Medium”, Accepted in Regional Conference on Ionic Liquids, University of Malaya, Malaysia, 2009.
7. Kiki A. Kurnia, F. Harris, Cecilia D. Wilfred, M. I. Abdul Mutalib, T. Murugesan, “Solubility of Carbon Dioxide in Hydroxyl Ammonium Ionic Liquids”, Accepted in 2nd International Conference on Mathematic and Natural Science, 2008.
8. Kiki A. Kurnia, Cecilia D. Wilfred, T. Murugesan, “Thermal Properties of Hydroxyl Ammonium Ionic Liquids”, Proceeding on Symposium of Malaysian Chemical Engineers, Malaysia, 2006

187
REFERENCES
[1]. V.S. Sastri, E. Ghali, M. Elboujdaini, "Corrosion Prevention and Protection: Practical Solutions", John Wiley & Sons Ltd., The Atrium, Southern Gate, Chichester, West Sussex PO19 8SQ, England, 2007.
[2]. M. El Azhar, M. Traisnel, B. Mernari, L. Gengembre, F. Bentiss, M. Lagrenée. (2002). Electrochemical and XPS studies of 2,5-bis(n-pyridyl)-1,3,4-thiadiazoles adsorption on mild steel in perchloric acid solution. Appl. Surf. Sci. 185 (3-4), pp. 197-205
[3]. H.A. Nasr-El-Din, A.M. Al-Othman, K.C. Taylor, A.H. Al-Ghamdi. (2004). Surface tension of HCl-based stimulation fluids at high temperatures. Journal of Petroleum Science and Engineering. 43 (1-2), pp. 57-73
[4]. I.B. Obot, N.O. Obi-Egbedi, N.W. Odozi. (2010). Acenaphtho [1,2-b] quinoxaline as a novel corrosion inhibitor for mild steel in 0.5 M H2SO4. Corros. Sci. 52 (3), pp. 923-926
[5]. S.M.A. Hosseini, A. Azimi. (2009). The inhibition of mild steel corrosion in acidic medium by 1-methyl-3-pyridin-2-yl-thiourea. Corros. Sci. 51 (4), pp. 728-732
[6]. F. Bentiss, C. Jama, B. Mernari, H.E. Attari, L.E. Kadi, M. Lebrini, M. Traisnel, M. Lagrenée. (2009). Corrosion control of mild steel using 3,5-bis(4-methoxyphenyl)-4-amino-1,2,4-triazole in normal hydrochloric acid medium. Corros. Sci. 51 (8), pp. 1628-1635
[7]. A.A. Al-Sarawy, A.S. Fouda, W.A.S. El-Dein. (2008). Some thiazole derivatives as corrosion inhibitors for carbon steel in acidic medium. Desalin. 229 (1-3), pp. 279-293
[8]. G.E. Badr. (2009). The role of some thiosemicarbazide derivatives as corrosion inhibitors for C-steel in acidic media. Corros. Sci. 51 (11), pp. 2529-2536
[9]. A. Popova, M. Christov, A. Vasilev. (2007). Inhibitive properties of quaternary ammonium bromides of N-containing heterocycles on acid mild steel corrosion. Part I: Gravimetric and voltammetric results. Corros. Sci. 49 (8), pp. 3276-3289

188
[10]. S.A. Ali, M.T. Saeed. (2001). Synthesis and corrosion inhibition study of some 1,6-hexanediamine-based N,N-diallyl quaternary ammonium salts and their polymers. Polymer. 42 (7), pp. 2785-2794
[11]. T.Y. Soror, M.A. El-Ziady. (2003). Effect of cetyl trimethyl ammonium bromide on the corrosion of carbon steel in acids. Mater. Chem. Phys. 77 (3), pp. 697-703
[12]. S. Bilgiç, M. Sahin. (2001). The corrosion inhibition of austenitic chromium-nickel steel in H2SO4 by 2-butyn-1-ol. Mater. Chem. Phys. 70 (3), pp. 290-295
[13]. P. Wasserscheid, T. Welton, "Ionic Liquids in Synthesis", 2nd Edition ed., WILEY-VCH Verlag GmbH & Co. KGaA, Darmstadt, Federal Republic of Germany, 2009.
[14]. F.F.C. Bazito, Y. Kawano, R.M. Torresi. (2007). Synthesis and characterization of two ionic liquids with emphasis on their chemical stability towards metallic lithium. Electrochim. Acta. 52 (23), pp. 6427-6437
[15]. C.P. Fredlake, J.M. Crosthwaite, D.G. Hert, S.N.V.K. Aki, J.F. Brennecke. (2004). Thermophysical Properties of Imidazolium-Based Ionic Liquids. J. Chem. Eng. Data. 49 (4), pp. 954-964
[16]. A. Fernández, J.S. Torrecilla, J. García, F. Rodríguez. (2007). Thermophysical Properties of 1-Ethyl-3-methylimidazolium Ethylsulfate and 1-Butyl-3-methylimidazolium Methylsulfate Ionic Liquids. J. Chem. Eng. Data. 52 (5), pp. 1979-1983
[17]. A.A. Strechan, Y.U. Paulechka, A.G. Kabo, A.V. Blokhin, G.J. Kabo. (2007). 1-Butyl-3-methylimidazolium Tosylate Ionic Liquid: Heat Capacity, Thermal Stability, and Phase Equilibrium of Its Binary Mixtures with Water and Caprolactam. J. Chem. Eng. Data. 52 (5), pp. 1791-1799
[18]. I. Bandrés, D.F. Montaño, I. Gascón, P. Cea, C. Lafuente. (2010). Study of the conductivity behavior of pyridinium-based ionic liquids. Electrochim. Acta. 55 (7), pp. 2252-2257
[19]. S.-H. Yeon, K.-S. Kim, S. Choi, H. Lee, H.S. Kim, H. Kim. (2005). Physical and electrochemical properties of 1-(2-hydroxyethyl)-3-methyl imidazolium and N-(2-hydroxyethyl)-N-methyl morpholinium ionic liquids. Electrochim. Acta. 50 (27), pp. 5399-5407
[20]. J.E. Bara, D.E. Camper, D.L. Gin, R.D. Noble. (2009). Room-Temperature Ionic Liquids and Composite Materials: Platform Technologies for CO2 Capture. Acc. Chem. Res. 43 (1), pp. 152-159

189
[21]. S.J. Zhang, X.M. Lu, Q. Zhou, X. Li, X. Zhang, S. Lu, "Ionic Liquids: Physicochemical Properties", 1rst Edition ed., Elsevier, Oxford - United Kingdom, 2009.
[22]. Q.B. Zhang, Y.X. Hua. (2009). Corrosion inhibition of mild steel by alkylimidazolium ionic liquids in hydrochloric acid. Electrochim. Acta. 54 (6), pp. 1881-1887
[23]. H. Ashassi-Sorkhabi, M. Es'haghi. (2009). Corrosion inhibition of mild steel in acidic media by [BMIm]Br Ionic liquid. Mater. Chem. Phys. 114 (1), pp. 267-271
[24]. N.V. Likhanova, M.A. Domínguez-Aguilar, O. Olivares-Xometl, N. Nava-Entzana, E. Arce, H. Dorantes. (2010). The Effect of Ionic Liquids with Imidazolium and Pyridinium Cations on the Corrosion Inhibition of Mild Steel in Acidic Environment. Corros. Sci. 52 pp. 2088-2097
[25]. R. Baboian, "NACE Corrosion Engineer's Reference Book", NACE International, 1440 South Creek Drive, Houston, TX 77084, 2002.
[26]. T.L. Greaves, A. Weerawardena, C. Fong, I. Krodkiewska, C.J. Drummond. (2006). Protic Ionic Liquids: Solvents with Tunable Phase Behavior and Physicochemical Properties. J. Phys. Chem. B. 110 (45), pp. 22479-22487
[27]. T.L. Greaves, C.J. Drummond. (2007). Protic Ionic Liquids: Properties and Applications. Chem. Rev. 108 (1), pp. 206-237
[28]. T.L. Greaves, A. Weerawardena, C. Fong, C.J. Drummond. (2007). Formation of Amphiphile Self-Assembly Phases in Protic Ionic Liquids. J. Phys. Chem. B. 111 (16), pp. 4082-4088
[29]. T.L. Greaves, A. Weerawardena, I. Krodkiewska, C.J. Drummond. (2008). Protic Ionic Liquids: Physicochemical Properties and Behavior as Amphiphile Self-Assembly Solvents. J. Phys. Chem. B. 112 (3), pp. 896-905
[30]. X. Yuan, S. Zhang, J. Liu, X. Lu. (2007). Solubilities of CO2 in hydroxyl ammonium ionic liquids at elevated pressures. Fluid Phase Equilib. 257 (2), pp. 195-200
[31]. K.A. Kurnia, F. Harris, C.D. Wilfred, M.I. Abdul Mutalib, T. Murugesan. (2009). Thermodynamic properties of CO2 absorption in hydroxyl ammonium ionic liquids at pressures of (100-1600) kPa. J. Chem. Thermodyn. 41 (10), pp. 1069-1073
[32]. L. Zhai, Q. Zhong, C. He, J. Wang. (2010). Hydroxyl ammonium ionic liquids synthesized by water-bath microwave: Synthesis and desulfurization. J. Hazard. Mater. 177 pp. 807-813

190
[33]. C. Zhao, G. Burrell, A.A.J. Torriero, F. Separovic, N.F. Dunlop, D.R. MacFarlane, A.M. Bond. (2008). Electrochemistry of Room Temperature Protic Ionic Liquids. J. Phys. Chem. B. 112 (23), pp. 6923-6936
[34]. A.G.e. Böwing, A. Jess. (2007). Kinetics and reactor design aspects of the synthesis of ionic liquids—Experimental and theoretical studies for ethylmethylimidazole ethylsulfate. Chem. Eng. Sci. 62 pp. 1760-1769
[35]. D. Torres-Martínez, R. Melgarejo-Torres, M. Gutiérrez-Rojas, L. Aguilera-Vázquez, M. Micheletti, G.J. Lye, S. Huerta-Ochoa. (2009). Hydrodynamic and oxygen mass transfer studies in a three-phase (air-water-ionic liquid) stirred tank bioreactor. Biochem. Eng. J. 45 (3), pp. 209-217
[36]. H. Xin, Q. Wu, M. Han, D. Wang, Y. Jin. (2005). Alkylation of benzene with 1-dodecene in ionic liquids [Rmim]+Al2Cl6X- (R = butyl, octyl and dodecyl; X = chlorine, bromine and iodine). Appl. Catal., A. 292 pp. 354-361
[37]. Z. Zhao, Z. Li, G. Wang, W. Qiao, L. Cheng. (2004). Friedel-Crafts alkylation of 2-methylnaphthalene in room temperature ionic liquids. Appl. Catal., A. 262 (1), pp. 69-73
[38]. K. Qiao, Y. Deng. (2001). Alkylations of benzene in room temperature ionic liquids modified with HCl. J. Mol. Catal. A: Chem. 171 (1-2), pp. 81-84
[39]. P. Wasserscheid, M. Sesing, W. Korth. (2002). Hydrogensulfate and tetrakis(hydrogensulfato)borate ionic liquids: synthesis and catalytic application in highly Bronsted-acidic systems for Friedel-Crafts alkylation. Green Chemistry. 4 (2), pp. 134-138
[40]. C.G. Blanco, D.C. Banciella, M.D.G. Azpíroz. (2006). Alkylation of naphthalene using three different ionic liquids. J. Mol. Catal. A: Chem. 253 (1-2), pp. 203-206
[41]. A.M. Scurto, W. Leitner. (2006). Expanding the useful range of ionic liquids: melting point depression of organic salts with carbon dioxide for biphasic catalytic reactions. Chemical Communications. (35), pp. 3681-3683
[42]. M.H. Valkenberg, C. deCastro, W.F. Hölderich. (2001). Friedel-Crafts acylation of aromatics catalysed by supported ionic liquids. Appl. Catal., A. 215 (1-2), pp. 185-190
[43]. M.J. Earle, U. Hakala, C. Hardacre, J. Karkkainen, B.J. McAuley, D.W. Rooney, K.R. Seddon, J.M. Thompson, K. Wahala. (2005). Chloroindate(iii) ionic liquids: recyclable media for Friedel-Crafts acylation reactions. Chemical Communications. (7), pp. 903-905
[44]. M.J. Earle, U. Hakala, B.J. McAuley, M. Nieuwenhuyzen, A. Ramani, K.R. Seddon. (2004). Metal bis{(trifluoromethyl)sulfonyl}amide complexes: highly

191
efficient Friedel-Crafts acylation catalysts. Chemical Communications. (12), pp. 1368-1369
[45]. B. Murphy, P. Goodrich, C. Hardacre, M. Oelgemoller. (2009). Green photochemistry: photo-Friedel-Crafts acylations of 1,4-naphthoquinone in room temperature ionic liquids. Green Chemistry. 11 (11), pp. 1867-1870
[46]. M. Haumann, A. Riisager. (2008). Hydroformylation in Room Temperature Ionic Liquids (RTILs): Catalyst and Process Developments. Chem. Rev. 108 (4), pp. 1474-1497
[47]. L.c. Leclercq, I. Suisse, F. Agbossou-Niedercorn. (2008). Biphasic hydroformylation in ionic liquids: interaction between phosphane ligands and imidazolium triflate, toward an asymmetric process. Chemical Communications. (3), pp. 311-313
[48]. J. Durand, E. Teuma, M. Gómez. (2007). Ionic liquids as a medium for enantioselective catalysis. C.R. Chim. 10 (3), pp. 152-177
[49]. M. Zou, X. Mu, N. Yan, Y. Kou. (2007). Selective Hydrogenation of Cinnamaldehyde by Ionic Copolymer-Stabilized Pt Nanoparticles in Ionic Liquids. Chin. J. Catal. 28 (5), pp. 389-391
[50]. Y. Deng, F. Shi, J. Beng, K. Qiao. (2001). Ionic liquid as a green catalytic reaction medium for esterifications. J. Mol. Catal. A: Chem. 165 (1-2), pp. 33-36
[51]. J. Gui, X. Cong, D. Liu, X. Zhang, Z. Hu, Z. Sun. (2004). Novel Brønsted acidic ionic liquid as efficient and reusable catalyst system for esterification. Catal. Commun. 5 (9), pp. 473-477
[52]. H. Zhao, C.L. Jones, J.V. Cowins. (2009). Lipase dissolution and stabilization in ether-functionalized ionic liquids. Green Chemistry. 11 (8), pp. 1128-1138
[53]. J. Mutschler, T. Rausis, J.-M. Bourgeois, C. Bastian, D. Zufferey, I.V. Mohrenz, F. Fischer. (2009). Ionic liquid-coated immobilized lipase for the synthesis of methylglucose fatty acid esters. Green Chemistry. 11 (11), pp. 1793-1800
[54]. B. Major, I. Kelemen-Horvath, Z. Csanadi, K. Belafi-Bako, L. Gubicza. (2009). Microwave assisted enzymatic esterification of lactic acid and ethanol in phosphonium type ionic liquids as co-solvents. Green Chemistry. 11 (5), pp. 614-616
[55]. H. Zhang, F. Xu, X. Zhou, G. Zhang, C. Wang. (2007). A Bronsted acidic ionic liquid as an efficient and reusable catalyst system for esterification. Green Chemistry. 9 (11), pp. 1208-1211

192
[56]. J. Arras, D. Ruppert, P. Claus. (2009). Supported ruthenium catalysed selective hydrogenation of citral in presence of [NTf2]- based ionic liquids. Appl. Catal., A. 371 (1-2), pp. 73-77
[57]. A. Chrobok, S. Baj, W. Pudlo, A. Jarzebski. (2009). Supported hydrogensulfate ionic liquid catalysis in Baeyer-Villiger reaction. Appl. Catal., A. 366 (1), pp. 22-28
[58]. S. Gago, S.S. Balula, S. Figueiredo, A.D. Lopes, A.A. Valente, M. Pillinger, I.S. Gonçalves. (2010). Catalytic olefin epoxidation with cationic molybdenum(VI) cis-dioxo complexes and ionic liquids. Appl. Catal., A. 372 (1), pp. 67-72
[59]. C.M. Gordon. (2001). New developments in catalysis using ionic liquids. Appl. Catal., A. 222 (1-2), pp. 101-117
[60]. J. Joni, M. Haumann, P. Wasserscheid. Continuous gas-phase isopropylation of toluene and cumene using highly acidic Supported Ionic Liquid Phase (SILP) catalysts. Appl. Catal., A. 372 (1), pp. 8-15
[61]. J.-P.T. Mikkola, P.P. Virtanen, K. Kordás, H. Karhu, T.O. Salmi. (2007). SILCA--Supported ionic liquid catalysts for fine chemicals. Appl. Catal., A. 328 (1), pp. 68-76
[62]. E. Öchsner, K. Schneiders, K. Junge, M. Beller, P. Wasserscheid. (2009). Highly enantioselective Ru-catalyzed asymmetric hydrogenation of [beta]-keto ester in ionic liquid/methanol mixtures. Appl. Catal., A. 364 (1-2), pp. 8-14
[63]. J. Fraga-Dubreuil, K. Bourahla, M. Rahmouni, J.P. Bazureau, J. Hamelin. (2002). Catalysed esterifications in room temperature ionic liquids with acidic counteranion as recyclable reaction media. Catal. Commun. 3 (5), pp. 185-190
[64]. M. Herbert, A. Galindo, F. Montilla. (2007). Catalytic epoxidation of cyclooctene using molybdenum(VI) compounds and urea-hydrogen peroxide in the ionic liquid [bmim]PF6. Catal. Commun. 8 (7), pp. 987-990
[65]. S. Breitenlechner, M. Fleck, T.E. Müller, A. Suppan. (2004). Solid catalysts on the basis of supported ionic liquids and their use in hydroamination reactions. J. Mol. Catal. A: Chem. 214 (1), pp. 175-179
[66]. N.V. Gwala, N. Deenadayalu, K. Tumba, D. Ramjugernath. (2010). Activity coefficients at infinite dilution for solutes in the trioctylmethylammonium bis(trifluoromethylsulfonyl)imide ionic liquid using gas-liquid chromatography. J. Chem. Thermodyn. 42 (2), pp. 256-261
[67]. T.M. Letcher, U. Domanska, M. Marciniak, A. Marciniak. (2005). Activity coefficients at infinite dilution measurements for organic solutes in the ionic liquid 1-butyl-3-methyl-imidazolium 2-(2-methoxyethoxy) ethyl sulfate using

193
g.l.c. at T = (298.15, 303.15, and 308.15) K. J. Chem. Thermodyn. 37 (6), pp. 587-593
[68]. M. Sobota, V. Dohnal, P. Vrbka. (2009). Activity Coefficients at Infinite Dilution of Organic Solutes in the Ionic Liquid 1-Ethyl-3-methyl-imidazolium Nitrate. J. Phys. Chem. B. 113 (13), pp. 4323-4332
[69]. G.W. Meindersma, A.B. de Haan. (2008). Conceptual process design for aromatic/aliphatic separation with ionic liquids. Chem. Eng. Res. Des. 86 (7), pp. 745-752
[70]. A.B. Pereiro, F.J. Deive, J.M.S.S. Esperança, A. Rodríguez. (2010). Alkylsulfate-based ionic liquids to separate azeotropic mixtures. Fluid Phase Equilib. 291 (1), pp. 13-17
[71]. A.B. Pereiro, A. Rodrguez. (2008). Separation of Ethanol−Heptane Azeotropic Mixtures by Solvent Extraction with an Ionic Liquid. Ind. Eng. Chem. Res. 48 (3), pp. 1579-1585
[72]. A.B. Pereiro, A. Rodríguez. (2009). Effective extraction in packed column of ethanol from the azeotropic mixture ethanol + hexane with an ionic liquid as solvent. Chem. Eng. J. 153 (1-3), pp. 80-85
[73]. D.R. MacFarlane, M. Forsyth, P.C. Howlett, J.M. Pringle, J. Sun, G. Annat, W. Neil, E.I. Izgorodina. (2007). Ionic Liquids in Electrochemical Devices and Processes: Managing Interfacial Electrochemistry. Acc. Chem. Res. 40 (11), pp. 1165-1173
[74]. Q. Dai, D.B. Menzies, D.R. MacFarlane, S.R. Batten, S. Forsyth, L. Spiccia, Y.-B. Cheng, M. Forsyth. (2010). Dye-sensitized nanocrystalline solar cells incorporating ethylmethylimidazolium-based ionic liquid electrolytes. C.R. Chim. 9 (5-6), pp. 617-621
[75]. K. Suzuki, M. Yamaguchi, M. Kumagai, N. Tanabe, S. Yanagida. (2006). Dye-sensitized solar cells with ionic gel electrolytes prepared from imidazolium salts and agarose. C.R. Chim. 9 (5-6), pp. 611-616
[76]. V. Baranchugov, E. Markevich, E. Pollak, G. Salitra, D. Aurbach. (2007). Amorphous silicon thin films as a high capacity anodes for Li-ion batteries in ionic liquid electrolytes. Electrochem. Commun. 9 (4), pp. 796-800
[77]. J.N. Barisci, G.G. Wallace, D.R. MacFarlane, R.H. Baughman. (2004). Investigation of ionic liquids as electrolytes for carbon nanotube electrodes. Electrochem. Commun. 6 (1), pp. 22-27
[78]. J. Jin, H.H. Li, J.P. Wei, X.K. Bian, Z. Zhou, J. Yan. (2009). Li/LiFePO4 batteries with room temperature ionic liquid as electrolyte. Electrochem. Commun. 11 (7), pp. 1500-1503

194
[79]. R.F. de Souza, J.C. Padilha, R.S. Gonçalves, J. Dupont. (2003). Room temperature dialkylimidazolium ionic liquid-based fuel cells. Electrochem. Commun. 5 (8), pp. 728-731
[80]. G. Lakshminarayana, M. Nogami. (2010). Inorganic-organic hybrid membranes with anhydrous proton conduction prepared from tetramethoxysilane/methyl-trimethoxysilane/trimethylphosphate and 1-ethyl-3-methylimidazolium-bis (trifluoromethanesulfonyl) imide for H2/O2 fuel cells. Electrochim. Acta. 55 (3), pp. 1160-1168
[81]. A. Balducci, U. Bardi, S. Caporali, M. Mastragostino, F. Soavi. (2004). Ionic liquids for hybrid supercapacitors. Electrochem. Commun. 6 (6), pp. 566-570
[82]. D. Wei, T.W. Ng. (2009). Application of novel room temperature ionic liquids in flexible supercapacitors. Electrochem. Commun. 11 (10), pp. 1996-1999
[83]. J.L. Anderson, J.K. Dixon, J.F. Brennecke. (2007). Solubility of CO2, CH4, C2H6, C2H4, O2, and N2 in 1-Hexyl-3-methylpyridinium Bis(trifluoromethylsulfonyl)imide: Comparison to Other Ionic Liquids. Acc. Chem. Res. 40 (11), pp. 1208-1216
[84]. J. Kumelan, D. Tuma, G. Maurer. (2009). Partial molar volumes of selected gases in some ionic liquids. Fluid Phase Equilib. 275 (2), pp. 132-144
[85]. A.M. Schilderman, S. Raeissi, C.J. Peters. (2007). Solubility of carbon dioxide in the ionic liquid 1-ethyl-3-methylimidazolium bis(trifluoromethylsulfonyl)imide. Fluid Phase Equilib. 260 (1), pp. 19-22
[86]. T. Wang, C. Peng, H. Liu, Y. Hu. (2006). Description of the pVT behavior of ionic liquids and the solubility of gases in ionic liquids using an equation of state. Fluid Phase Equilib. 250 (1-2), pp. 150-157
[87]. Á.P.-S. Kamps, D. Tuma, J. Xia, G. Maurer. (2003). Solubility of CO2 in the Ionic Liquid [bmim][PF6]. J. Chem. Eng. Data. 48 (3), pp. 746-749
[88]. X. Li, M. Hou, B. Han, X. Wang, L. Zou. (2008). Solubility of CO2 in a Choline Chloride + Urea Eutectic Mixture. J. Chem. Eng. Data. 53 (2), pp. 548-550
[89]. S. Raeissi, C.J. Peters. (2008). Carbon Dioxide Solubility in the Homologous 1-Alkyl-3-methylimidazolium Bis(trifluoromethylsulfonyl)imide Family. J. Chem. Eng. Data. 54 (2), pp. 382-386
[90]. M.B. Shiflett, A. Yokozeki. (2007). Solubility of CO2 in Room Temperature Ionic Liquid [hmim][Tf2N]. J. Phys. Chem. B. 111 (8), pp. 2070-2074
[91]. P. Walden. (1914). Bulletin of Academia and Imperial Science (St. Petersburg). (8), pp. 405-422

195
[92]. M. Anouti, M. Caillon-Caravanier, Y. Dridi, J. Jacquemin, C. Hardacre, D. Lemordant. (2009). Liquid densities, heat capacities, refractive index and excess quantities for {protic ionic liquids + water} binary system. J. Chem. Thermodyn. 41 (6), pp. 799-808
[93]. J.-P. Belieres, C.A. Angell. (2007). Protic Ionic Liquids: Preparation, Characterization, and Proton Free Energy Level Representation. J. Phys. Chem. B. 111 (18), pp. 4926-4937
[94]. C.A. Angell, N. Byrne, J.-P. Belieres. (2007). Parallel Developments in Aprotic and Protic Ionic Liquids: Physical Chemistry and Applications. Acc. Chem. Res. 40 (11), pp. 1228-1236
[95]. X.L. Yuan, S.J. Zhang, X.M. Lu. (2007). Hydroxyl Ammonium Ionic Liquids: Synthesis, Properties, and Solubility of SO2. J. Chem. Eng. Data. 52 (2), pp. 596-599
[96]. I. Cota, R. Gonzalez-Olmos, M. Iglesias, F. Medina. (2007). New Short Aliphatic Chain Ionic Liquids: Synthesis, Physical Properties, and Catalytic Activity in Aldol Condensations. J. Phys. Chem. B. 111 (43), pp. 12468-12477
[97]. M. Iglesias, A. Torres, R. Gonzalez-Olmos, D. Salvatierra. (2008). Effect of temperature on mixing thermodynamics of a new ionic liquid: {2-Hydroxy ethylammonium formate (2-HEAF) + short hydroxylic solvents}. J. Chem. Thermodyn. 40 (1), pp. 119-133
[98]. M. Anouti, A. Vigeant, J. Jacquemin, C. Brigouleix, D. Lemordant. (2010). Volumetric properties, viscosity and refractive index of the Protic Ionic Liquid, pyrrolidinium octanoate, in molecular solvents. J. Chem. Thermodyn. 42 (7), pp. 834-845
[99]. K.N. Marsh, J.A. Boxall, R. Lichtenthaler. (2004). Room temperature ionic liquids and their mixtures--a review. Fluid Phase Equilib. 219 (1), pp. 93-98
[100]. E. Rilo, J. Pico, S. García-Garabal, L.M. Varela, O. Cabeza. (2009). Density and surface tension in binary mixtures of CnMIM-BF4 ionic liquids with water and ethanol. Fluid Phase Equilib. 285 (1-2), pp. 83-89
[101]. R.L. Gardas, H.F. Costa, M.G. Freire, P.J. Carvalho, I.M. Marrucho, I.M.A. Fonseca, A.G.M. Ferreira, J.A.P. Coutinho. (2008). Densities and Derived Thermodynamic Properties of Imidazolium-, Pyridinium-, Pyrrolidinium-, and Piperidinium-Based Ionic Liquids. J. Chem. Eng. Data. 53 (3), pp. 805-811
[102]. J.M.S.S. Esperança, H.J.R. Guedes, M. Blesic, L.P.N. Rebelo. (2005). Densities and Derived Thermodynamic Properties of Ionic Liquids. 3. Phosphonium-Based Ionic Liquids over an Extended Pressure Range. J. Chem. Eng. Data. 51 (1), pp. 237-242

196
[103]. O. Borodin, G.D. Smith, H. Kim. (2009). Viscosity of a Room Temperature Ionic Liquid: Predictions from Nonequilibrium and Equilibrium Molecular Dynamics Simulations. J. Phys. Chem. B. 113 (14), pp. 4771-4774
[104]. M.T. Zafarani-Moattar, R. Majdan-Cegincara. (2007). Viscosity, Density, Speed of Sound, and Refractive Index of Binary Mixtures of Organic Solvent + Ionic Liquid, 1-Butyl-3-methylimidazolium Hexafluorophosphate at 298.15 K. J. Chem. Eng. Data. 52 (6), pp. 2359-2364
[105]. B. Hasse, J. Lehmann, D. Assenbaum, P. Wasserscheid, A. Leipertz, A.P. Frba. (2009). Viscosity, Interfacial Tension, Density, and Refractive Index of Ionic Liquids [EMIM][MeSO3], [EMIM][MeOHPO2], [EMIM][OcSO4], and [BBIM][NTf2] in Dependence on Temperature at Atmospheric Pressure. J. Chem. Eng. Data. 54 (9), pp. 2576-2583
[106]. U. Domanska, M. Królikowska, M. Królikowski. (2010). Phase behaviour and physico-chemical properties of the binary systems {1-ethyl-3-methylimidazolium thiocyanate, or 1-ethyl-3-methylimidazolium tosylate + water, or + an alcohol}. Fluid Phase Equilib. In Press, Accepted Manuscript pp.
[107]. M.G. Freire, L.M.N.B.F. Santos, I.M. Marrucho, J.A.P. Coutinho. (2007). Evaluation of COSMO-RS for the prediction of LLE and VLE of alcohols + ionic liquids. Fluid Phase Equilib. 255 (2), pp. 167-178
[108]. A. Heintz, D.V. Kulikov, S.P. Verevkin. (2001). Thermodynamic Properties of Mixtures Containing Ionic Liquids. 1. Activity Coefficients at Infinite Dilution of Alkanes, Alkenes, and Alkylbenzenes in 4-Methyl-n-butylpyridinium Tetrafluoroborate Using Gas−Liquid Chromatography. J. Chem. Eng. Data. 46 (6), pp. 1526-1529
[109]. S.P. Verevkin, J. Safarov, E. Bich, E. Hassel, A. Heintz. (2005). Thermodynamic properties of mixtures containing ionic liquids: Vapor pressures and activity coefficients of n-alcohols and benzene in binary mixtures with 1-methyl-3-butyl-imidazolium bis(trifluoromethyl-sulfonyl) imide. Fluid Phase Equilib. 236 (1-2), pp. 222-228
[110]. Y. Geng, T. Wang, D. Yu, C. Peng, H. Liu, Y. Hu. (2008). Densities and Viscosities of the Ionic Liquid [C4mim][PF6]+ N, N-dimethylformamide Binary Mixtures at 293.15 K to 318.15 K. Chin. J. Chem. Eng. 16 (2), pp. 256-262
[111]. S.P. Verevkin, T.V. Vasiltsova, E. Bich, A. Heintz. (2004). Thermodynamic properties of mixtures containing ionic liquids: Activity coefficients of aldehydes and ketones in 1-methyl-3-ethyl-imidazolium bis(trifluoromethyl-sulfonyl) imide using the transpiration method. Fluid Phase Equilib. 218 (2), pp. 165-175

197
[112]. B.W. Rossiter, R.C. Baetzold, "Physical Methods of Chemistry", 2nd Edition ed., John Wiley & Sons, Inc., United States of America, 1992.
[113]. M. Tariq, P.A.S. Forte, M.F.C. Gomes, J.N.C. Lopes, L.P.N. Rebelo. (2009). Densities and refractive indices of imidazolium- and phosphonium-based ionic liquids: Effect of temperature, alkyl chain length, and anion. J. Chem. Thermodyn. 41 (6), pp. 790-798
[114]. M.A. Iglesias-Otero, J. Troncoso, E. Carballo, L. Roman. (2008). Densities and Excess Enthalpies for Ionic Liquids + Ethanol or + Nitromethane. J. Chem. Eng. Data. 53 (6), pp. 1298-1301
[115]. Y. Zhong, H. Wang, K. Diao. (2007). Densities and excess volumes of binary mixtures of the ionic liquid 1-butyl-3-methylimidazolium hexafluorophosphate with aromatic compound at T = (298.15 to 313.15) K. J. Chem. Thermodyn. 39 (2), pp. 291-296
[116]. A.B. Pereiro, P. Verdía, E. Tojo, A. Rodríguez. (2007). Physical Properties of 1-Butyl-3-methylimidazolium Methyl Sulfate as a Function of Temperature. J. Chem. Eng. Data. 52 (2), pp. 377-380
[117]. Q. Zhou, L.-S. Wang, H.-P. Chen. (2006). Densities and Viscosities of 1-Butyl-3-methylimidazolium Tetrafluoroborate + H2O Binary Mixtures from (303.15 to 353.15) K. J. Chem. Eng. Data. 51 (3), pp. 905-908
[118]. Chan Han, Shuqian Xia, Peisheng Ma, F. Zeng. (2009). Densities of Ionic Liquid [BMIM][BF4] + Ethanol, + Benzene, and + Acetonitrile at Different Temperature and Pressure. J. Chem. Eng. Data. 54 (10), pp. 2971-2977
[119]. A.N. Soriano, B.T. Doma Jr, M.-H. Li. (2010). Density and refractive index measurements of 1-ethyl-3-methylimidazolium-based ionic liquids. J. Taiwan Inst. Chem. Eng. 41 (1), pp. 115-121
[120]. P. Kilaru, G.A. Baker, P. Scovazzo. (2007). Density and Surface Tension Measurements of Imidazolium-, Quaternary Phosphonium-, and Ammonium-Based Room-Temperature Ionic Liquids: Data and Correlations. J. Chem. Eng. Data. 52 (6), pp. 2306-2314
[121]. W. Fan, Q. Zhou, J. Sun, S. Zhang. (2009). Density, Excess Molar Volume, and Viscosity for the Methyl Methacrylate + 1-Butyl-3-methylimidazolium Hexafluorophosphate Ionic Liquid Binary System at Atmospheric Pressure. J. Chem. Eng. Data. 54 (8), pp. 2307-2311
[122]. U. Domanska, M. Laskowska. (2009). Temperature and Composition Dependence of the Density and Viscosity of Binary Mixtures of {1-Butyl-3-methylimidazolium Thiocyanate + 1-Alcohols}. J. Chem. Eng. Data. 54 (7), pp. 2113-2119
198
[123]. E.J. González, L. Alonso, Á. Domínguez. (2006). Physical Properties of Binary Mixtures of the Ionic Liquid 1-Methyl-3-octylimidazolium Chloride with Methanol, Ethanol, and 1-Propanol at T = (298.15, 313.15, and 328.15) K and at P = 0.1 MPa. J. Chem. Eng. Data. 51 (4), pp. 1446-1452
[124]. B. González, N. Calvar, E. Gomez, I. Dominguez, A. Dominguez. (2009). Synthesis and Physical Properties of 1-Ethylpyridinium Ethylsulfate and its Binary Mixtures with Ethanol and 1-Propanol at Several Temperatures. J. Chem. Eng. Data. 54 (4), pp. 1353-1358
[125]. B. Mokhtarani, A. Sharifi, H.R. Mortaheb, M. Mirzaei, M. Mafi, F. Sadeghian. (2009). Density and viscosity of 1-butyl-3-methylimidazolium nitrate with ethanol, 1-propanol, or 1-butanol at several temperatures. J. Chem. Thermodyn. 41 (12), pp. 1432-1438
[126]. C.A. Ohlin, P.J. Dyson, G. Laurenczy. (2004). Carbon monoxide solubility in ionic liquids: determination, prediction and relevance to hydroformylation. Chemical Communications. (9), pp. 1070-1071
[127]. J.G. Huddleston, A.E. Visser, W.M. Reichert, H.D. Willauer, G.A. Broker, R.D. Rogers. (2001). Characterization and comparison of hydrophilic and hydrophobic room temperature ionic liquids incorporating the imidazolium cation. Green Chemistry. 3 (4), pp. 156-164
[128]. A. Berthod, M. Ruiz-Angel, S. Carda-Broch. (2008). Ionic liquids in separation techniques. J. Chromatogr. A. 1184 pp. 6-18
[129]. K.-S. Kim, B.-K. Shin, H. Lee, F. Ziegler. (2004). Refractive index and heat capacity of 1-butyl-3-methylimidazolium bromide and 1-butyl-3-methylimidazolium tetrafluoroborate, and vapor pressure of binary systems for 1-butyl-3-methylimidazolium bromide + trifluoroethanol and 1-butyl-3-methylimidazolium tetrafluoroborate + trifluoroethanol. Fluid Phase Equilib. 218 (2), pp. 215-220
[130]. H. Tokuda, K. Hayamizu, K. Ishii, M.A.B.H. Susan, M. Watanabe. (2006). How Ionic Are Room-Temperature Ionic Liquids? An Indicator of the Physicochemical Properties. J. Phys. Chem. B. 110 (39), pp. 19593-19600
[131]. Z. Gu, J.F. Brennecke. (2002). Volume Expansivities and Isothermal Compressibilities of Imidazolium and Pyridinium-Based Ionic Liquids. J. Chem. Eng. Data. 47 (2), pp. 339-345
[132]. S.H. Lee, S.B. Lee. (2005). The Hildebrand solubility parameters, cohesive energy densities and internal energies of 1-alkyl-3-methylimidazolium-based room temperature ionic liquids. Chemical Communications. (27), pp. 3469-3471

199
[133]. R. Fortunato, C.A.M. Afonso, M.A.M. Reis, J.G. Crespo. (2004). Supported liquid membranes using ionic liquids: study of stability and transport mechanisms. J. Membr. Sci. 242 (1-2), pp. 197-209
[134]. A. Muhammad, M.I. Abdul Mutalib, C.D. Wilfred, T. Murugesan, A. Shafeeq. (2008). Thermophysical properties of 1-hexyl-3-methyl imidazolium based ionic liquids with tetrafluoroborate, hexafluorophosphate and bis(trifluoromethylsulfonyl)imide anions. J. Chem. Thermodyn. 40 (9), pp. 1433-1438
[135]. R. Gomes de Azevedo, J.M.S.S. Esperança, J. Szydlowski, Z.P. Visak, P.F. Pires, H.J.R. Guedes, L.P.N. Rebelo. (2005). Thermophysical and thermodynamic properties of ionic liquids over an extended pressure range: [bmim][NTf2] and [hmim][NTf2]. J. Chem. Thermodyn. 37 (9), pp. 888-899
[136]. L. Alonso, A. Arce, M. Francisco, A. Soto. (2007). Measurement and Correlation of Liquid−Liquid Equilibria of Two Imidazolium Ionic Liquids with Thiophene and Methylcyclohexane. J. Chem. Eng. Data. 52 (6), pp. 2409-2412
[137]. L. Alonso, A. Arce, M. Francisco, A. Soto. (2008). (Liquid + liquid) equilibria of [C8mim][NTf2] ionic liquid with a sulfur-component and hydrocarbons. J. Chem. Thermodyn. 40 (2), pp. 265-270
[138]. A.B. Pereiro, A. Rodríguez. (2008). A study on the liquid-liquid equilibria of 1-alkyl-3-methylimidazolium hexafluorophosphate with ethanol and alkanes. Fluid Phase Equilib. 270 (1-2), pp. 23-29
[139]. B.D. Fitchett, T.N. Knepp, J.C. Conboy. (2004). 1-Alkyl-3-methylimidazolium Bis(perfluoroalkylsulfonyl)imide Water-Immiscible Ionic Liquids. Journal of Electrochemical Society. 151 (7), pp. E219-E225
[140]. A.B. Pereiro, H.I.M. Veiga, J.M.S.S. Esperança, A. Rodríguez. (2009). Effect of temperature on the physical properties of two ionic liquids. J. Chem. Thermodyn. 41 (12), pp. 1419-1423
[141]. E.J. González, B. González, N. Calvar, Á. Domínguez. (2007). Physical Properties of Binary Mixtures of the Ionic Liquid 1-Ethyl-3-methylimidazolium Ethyl Sulfate with Several Alcohols at T = (298.15, 313.15, and 328.15) K and Atmospheric Pressure. J. Chem. Eng. Data. 52 (5), pp. 1641-1648
[142]. H. Shekaari, S.S. Mousavi. (2010). Volumetric properties of ionic liquid 1,3-dimethylimidazolium methyl sulfate + molecular solvents at T = (298.15-328.15) K. Fluid Phase Equilib. 291 (2), pp. 201-207
[143]. M.A. Iglesias-Otero, J. Troncoso, E. Carballo, L. Romaní. (2008). Density and refractive index in mixtures of ionic liquids and organic solvents: Correlations and predictions. J. Chem. Thermodyn. 40 (6), pp. 949-956

200
[144]. W. Liu, T. Zhang, H. Wang, M. Yu. (2006). The Physical Properties of Aqueous Solutions of the Ionic Liquid [BMIM][BF4] J. Solution Chem. 35 pp. 1337-1346
[145]. M.A. Iglesias-Otero, J. Trancoso, E. Carballo. (2007). Density and Refractive Index for Binary Systems of the Ionic Liquid [Bmim][BF4] with Methanol, 1,3-Dichloropropane, and Dimethyl Carbonate. J. Solution Chem. 26 pp. 1219-1230
[146]. A. Kumar. (2008). Estimates of Internal Pressure and Molar Refraction of Imidazolium Based Ionic Liquids as a Function of Temperature. J. Solution Chem. 37 pp. 203-214
[147]. B. González, N. Calvar, E. Gomez, E.A. Macedo, A. Dominguez. (2008). Synthesis and Physical Properties of 1-Ethyl 3-methylpyridinium Ethylsulfate and Its Binary Mixtures with Ethanol and Water at Several Temperatures. J. Chem. Eng. Data. 53 (8), pp. 1824-1828
[148]. A. Gołdon, K. Dbrowska, T. Hofman. (2007). Densities and Excess Volumes of the 1,3-Dimethylimidazolium Methylsulfate + Methanol System at Temperatures from (313.15 to 333.15) K and Pressures from (0.1 to 25) MPa. J. Chem. Eng. Data. 52 (5), pp. 1830-1837
[149]. T. Hofman, A. Goldon, A. Nevines, T.M. Letcher. (2008). Densities, excess volumes, isobaric expansivity, and isothermal compressibility of the (1-ethyl-3-methylimidazolium ethylsulfate + methanol) system at temperatures (283.15 to 333.15) K and pressures from (0.1 to 35) MPa. J. Chem. Thermodyn. 40 (4), pp. 580-591
[150]. J. Ortega, R. Vreekamp, E. Penco, E. Marrero. (2008). Mixing thermodynamic properties of 1-butyl-4-methylpyridinium tetrafluoroborate [b4mpy][BF4] with water and with an alkan-1ol (methanol to pentanol). J. Chem. Thermodyn. 40 (7), pp. 1087-1094
[151]. M. Abareshi, E.K. Goharshadi, S.M. Zebarjad. (2009). Thermodynamic properties of the mixtures of some ionic liquids with alcohols using a simple equation of state. J. Mol. Liq. 149 (3), pp. 66-73
[152]. I. Bou Malham, P. Letellier, A. Mayaffre, M. Turmine. (2007). Part I: Thermodynamic analysis of volumetric properties of concentrated aqueous solutions of 1-butyl-3-methylimidazolium tetrafluoroborate, 1-butyl-2,3-dimethylimidazolium tetrafluoroborate, and ethylammonium nitrate based on pseudo-lattice theory. J. Chem. Thermodyn. 39 (8), pp. 1132-1143
[153]. S. Wang, J. Jacquemin, P. Husson, C. Hardacre, M.F. Costa Gomes. (2009). Liquid-liquid miscibility and volumetric properties of aqueous solutions of ionic liquids as a function of temperature. J. Chem. Thermodyn. 41 (11), pp. 1206-1214

201
[154]. O. Redlich, A.T. Kister. (1948). Algebraic Representation of Thermodynamic Properties and the Classification of Solutions. Ind. Eng. Chem. 40 (2), pp. 345-348
[155]. A. Arce, A. Soto, J. Ortega, G. Sabater. (2008). Viscosities and Volumetric Properties of Binary and Ternary Mixtures of Tris(2-hydroxyethyl) Methylammonium Methylsulfate + Water + Ethanol at 298.15 K. J. Chem. Eng. Data. 53 (3), pp. 770-775
[156]. I. Bou Malham, M. Turmine. (2008). Viscosities and refractive indices of binary mixtures of 1-butyl-3-methylimidazolium tetrafluoroborate and 1-butyl-2,3-dimethylimidazolium tetrafluoroborate with water at 298 K. J. Chem. Thermodyn. 40 (4), pp. 718-723
[157]. J. Restolho, A.P. Serro, J.L. Mata, B. Saramago. (2009). Viscosity and Surface Tension of 1-Ethanol-3-methylimidazolium Tetrafluoroborate and 1-Methyl-3-octylimidazolium Tetrafluoroborate over a Wide Temperature Range. J. Chem. Eng. Data. 54 (3), pp. 950-955
[158]. B. González, N. Calvar, E. González, Á. Domínguez. (2008). Density and Viscosity Experimental Data of the Ternary Mixtures 1-Propanol or 2-Propanol + Water + 1-Ethyl-3-methylimidazolium Ethylsulfate. Correlation and Prediction of Physical Properties of the Ternary Systems. J. Chem. Eng. Data. 53 (3), pp. 881-887
[159]. E. Gómez, B. González, N. Calvar, Á. Domínguez. (2008). Excess molar properties of ternary system (ethanol + water + 1,3-dimethylimidazolium methylsulphate) and its binary mixtures at several temperatures. J. Chem. Thermodyn. 40 (8), pp. 1208-1216
[160]. B. González, N. Calvar, E. Gómez, Á. Domínguez. (2008). Physical properties of the ternary system (ethanol + water + 1-butyl-3-methylimidazolium methylsulphate) and its binary mixtures at several temperatures. J. Chem. Thermodyn. 40 (8), pp. 1274-1281
[161]. E. Vercher, F.J. Llopis, M.V. Gonzalez-Alfaro, A. Martinez-Andreu. (2009). Density, Speed of Sound, and Refractive Index of 1-Ethyl-3-methylimidazolium Trifluoromethanesulfonate with Acetone, Methyl Acetate, and Ethyl Acetate at Temperatures from (278.15 to 328.15) K. J. Chem. Eng. Data. 55 (3), pp. 1377-1388
[162]. M.A. Kiani, M.F. Mousavi, S. Ghasemi, M. Shamsipur, S.H. Kazemi. (2008). Inhibitory effect of some amino acids on corrosion of Pb-Ca-Sn alloy in sulfuric acid solution. Corros. Sci. 50 (4), pp. 1035-1045
[163]. N.H. Helal, M.M. El-Rabiee, G.M.A. El-Hafez, W.A. Badawy. (2008). Environmentally safe corrosion inhibition of Pb in aqueous solutions. Journal of Alloys and Compounds. 456 (1-2), pp. 372-378

202
[164]. K. Barouni, L. Bazzi, R. Salghi, M. Mihit, B. Hammouti, A. Albourine, S. El Issami. (2008). Some amino acids as corrosion inhibitors for copper in nitric acid solution. Mater. Lett. 62 (19), pp. 3325-3327
[165]. M. Spah, D.C. Spah, B. Deshwal, S. Lee, Y.-K. Chae, J.W. Park. (2009). Thermodynamic studies on corrosion inhibition of aqueous solutions of amino/carboxylic acids toward copper by EMF measurement. Corros. Sci. 51 (6), pp. 1293-1298
[166]. D.-Q. Zhang, Q.-R. Cai, X.-M. He, L.-X. Gao, G.-D. Zhou. (2008). Inhibition effect of some amino acids on copper corrosion in HCl solution. Mater. Chem. Phys. 112 (2), pp. 353-358
[167]. D.-Q. Zhang, Q.-R. Cai, L.-X. Gao, K.Y. Lee. (2008). Effect of serine, threonine and glutamic acid on the corrosion of copper in aerated hydrochloric acid solution. Corros. Sci. 50 (12), pp. 3615-3621
[168]. P.B. Raja, M.G. Sethuraman. (2008). Natural products as corrosion inhibitor for metals in corrosive media -- A review. Mater. Lett. 62 (1), pp. 113-116
[169]. A.Y. El-Etre. (2006). Khillah extract as inhibitor for acid corrosion of SX 316 steel. Appl. Surf. Sci. 252 (24), pp. 8521-8525
[170]. A. Bouyanzer, B. Hammouti, L. Majidi. (2006). Pennyroyal oil from Mentha pulegium as corrosion inhibitor for steel in 1 M HCl. Mater. Lett. 60 (23), pp. 2840-2843
[171]. A.Y. El-Etre, M. Abdallah, Z.E. El-Tantawy. (2005). Corrosion inhibition of some metals using lawsonia extract. Corros. Sci. 47 (2), pp. 385-395
[172]. A.Y. El-Etre. (2003). Inhibition of aluminum corrosion using Opuntia extract. Corros. Sci. 45 (11), pp. 2485-2495
[173]. M. Abdallah. (2004). Antibacterial drugs as corrosion inhibitors for corrosion of aluminium in hydrochloric solution. Corros. Sci. 46 (8), pp. 1981-1996
[174]. M. Abdallah. (2002). Rhodanine azosulpha drugs as corrosion inhibitors for corrosion of 304 stainless steel in hydrochloric acid solution. Corros. Sci. 44 (4), pp. 717-728
[175]. M.M. El-Naggar. (2007). Corrosion inhibition of mild steel in acidic medium by some sulfa drugs compounds. Corros. Sci. 49 (5), pp. 2226-2236
[176]. H. Keles, M. Keles, I. Dehri, O. Serindag. (2008). Adsorption and inhibitive properties of aminobiphenyl and its Schiff base on mild steel corrosion in 0.5 M HCl medium. Colloids and Surfaces A: Physicochemical and Engineering Aspects. 320 (1-3), pp. 138-145

203
[177]. H. Keles, M. Keles, I. Dehri, O. Serindag. (2008). The inhibitive effect of 6-amino-m-cresol and its Schiff base on the corrosion of mild steel in 0.5 M HCI medium. Mater. Chem. Phys. 112 (1), pp. 173-179
[178]. K.A. Kurnia, "Development of Ionic Liquids for CO2 Absorption", M.Sc. Thesis, Department of Chemical Engineering, Universiti Teknologi PETRONAS, Tronoh, Malaysia, 2008
[179]. R.M. Silverstein, F.X. Webster, D.J. Kiemle, "Spectrometric Identification of Organic Compounds", 7th Edition ed., John Wiley & Sons, Inc., New York, United States of America, 2005.
[180]. N. Bicak. (2005). A new ionic liquid: 2-hydroxy ethylammonium formate. J. Mol. Liq. 116 (1), pp. 15-18
[181]. S.-l. Zang, D.-W. Fang, J.-x. LI, Y.-Y. Zhang, S. Yue. (2009). Estimation of Physicochemical Properties of Ionic Liquid HPReO4 Using Surface Tension and Density. J. Chem. Eng. Data. 54 (9), pp. 2498-2500
[182]. J. Tong, M. Hong, W. Guan, J.-B. Li, J.-Z. Yang. (2006). Studies on the thermodynamic properties of new ionic liquids: 1-Methyl-3-pentylimidazolium salts containing metal of group III. J. Chem. Thermodyn. 38 (11), pp. 1416-1421
[183]. J.-Z. Yang, Q.-G. Zhang, F. Xue. (2006). Studies on the properties of EMIGaCl4. J. Mol. Liq. 128 (1-3), pp. 81-84
[184]. J. Tong, Q.-S. Liu, W. Guan, J.-Z. Yang. (2007). Estimation of Physicochemical Properties of Ionic Liquid C6MIGaCl4 Using Surface Tension and Density. J. Phys. Chem. B. 111 (12), pp. 3197-3200
[185]. J. Tong, Q.-S. Liu, W.-G. Xu, D.-W. Fang, J.-Z. Yang. (2008). Estimation of Physicochemical Properties of Ionic Liquids 1-Alkyl-3-methylimidazolium Chloroaluminate. J. Phys. Chem. B. 112 (14), pp. 4381-4386
[186]. S.-G. Sun, Y. Wei, D.-W. Fang, Q.-G. Zhang. (2008). Estimation of properties of the ionic liquid BMIZn3Cl7. Fluid Phase Equilib. 273 (1-2), pp. 27-30
[187]. S.-l. Zang, D.-W. Fang, J.-x. Li, Y.-Y. Zhang, S. Yue. (2009). The estimation of physico-chemical properties of ionic liquid N-propylpyridine rheniumate. Fluid Phase Equilib. 283 (1-2), pp. 93-96
[188]. S.-L. Zang, Q.-G. Zhang, M. Huang, B. Wang, J.-Z. Yang. (2005). Studies on the properties of ionic liquid EMIInCl4. Fluid Phase Equilib. 230 (1-2), pp. 192-196
[189]. Q.-G. Zhang, J.-Z. Yang, X.-M. Lu, J.-S. Gui, M. Huang. (2004). Studies on an ionic liquid based on FeCl3 and its properties. Fluid Phase Equilib. 226 pp. 207-211

204
[190]. Q.-S. Liu, J. Tong, Z.-C. Tan, U. Welz-Biermann, J.-Z. Yang. (2010). Density and Surface Tension of Ionic Liquid [C2mim][PF3(CF2CF3)3] and Prediction of Properties [Cnmim][PF3(CF2CF3)3] (n = 1, 3, 4, 5, 6). J. Chem. Eng. Data. 55 pp. 2586-2589
[191]. J.-y. Wang, F.-Y. Zhao, R.-j. Liu, Y.-q. Hu. (2010). Thermophysical properties of 1-methyl-3-methylimidazolium dimethylphosphate and 1-ethyl-3-methylimidazolium diethylphosphate. J. Chem. Thermodyn. 43 (1), pp. 47-50
[192]. J.-Z. Yang, Q.-G. Zhang, B. Wang, J. Tong. (2006). Study on the Properties of Amino Acid Ionic Liquid EMIGly. J. Phys. Chem. B. 110 (45), pp. 22521-22524
[193]. R.J. Meakins. (1963). Alkyl quaternary ammonium compounds as inhibitors of the acid corrosion of steel. Journal of Applied Chemistry. 13 pp. 339-345
[194]. V. Branzoi, F. Branzoi, M. Baibarac. (2000). The inhibition of the corrosion of ARMCO iron in HCl solutions in the presence of surfactants of the type of N-alkyl quaternary ammonium salts Mater. Chem. Phys. 65 pp. 288-297
[195]. S.B. Velegol, B.D. Fleming, S. Biggs, E.J. Wanless, R.D. Tilton. (2000). Counterion effects on hexadecyltrimethylammonium surfactant adsorption and self-assembly on silica. Langmuir. 16 pp. 2548–2556
[196]. G. Bereket, A. Yurt. (2002). Inhibition of the corrosion of low carbon steel in acidic solution by selected quaternary ammonium compounds. Anti-Corrosion Methods and Materials. 49 pp. 210-220
[197]. M. Knag, J. Sjoblom, G. Oye, E. Gulbrandsen. (2005). A quartz crystal microbalance study of the adsorption of quaternary ammonium derivates on iron and cementite. Colloids and Surfaces A—Psychochemical and Engineering Aspects. 250 (269–278),