synthesis, analysis and processing of novel materials
TRANSCRIPT

Synthesis, analysis and processing of novel materials in the Y2O3-Al2O3 system
by
Julien Claudius Marchal
A dissertation submitted in partial fulfillment of the requirements for the degree of
Doctor of Philosophy (Materials Science and Engineering)
in The University of Michigan 2008
Doctoral Committee: Professor Richard M. Laine, Chair Professor Stephen C. Rand Professor John W. Halloran Professor Frank E. Filisko

Dedicated to my family and all the friends that helped me through this.
ii

ACKNOWLEDGMENTS
First I must thank the (too numerous to list) funding sources that have allowed me
to pursue this degree. I would like to thank Richard Laine for his patience and guidance
during my graduate studies. My committee members; John Halloran, Xiaoqing Pan, and
Stephen Rand deserve special thanks for taking on the task of serving for this thesis
committee.
I could not have done this work without the support of my family, friends and
fellow graduate students. In particular I would like to thanks the members of the fafnir
team that worked with me on these experiments, Min Kim and Jose Azurdia. I would like
to also thank Nancy Polashak who worked hard to ensure we had the materials we
needed.
iii

TABLE OF CONTENTS
DEDICATION ii
ACKNOWLEDGMENTS .......................................................................................iii
LIST OF TABLES ...................................................................................................viii
LIST OF FIGURES .................................................................................................ix
ABSTRACT..............................................................................................................xi
CHAPTER 1
Introduction 1
1.1 Nanograined ceramics 2
1.1.1 Pore formation and evolution 3
1.1.2 Optical properties and optical/photonic applications 6
1.1.3 Difficulties in synthesizing nano-grained ceramics 8
1.2 Liquid-feed flame spray pyrolysis 9
1.3 Y2O3-Al2O3 system 13
1.4 References 16
CHAPTER 2
General experimental, materials and methods 23
2.1 Introduction 23
2.2 General materials 23
2.2.1 Materials 23
2.2.2Metallorganic precursors synthesis 24
2.3 General processes 25
2.3.1 Liquid-feed and suspension-feed FSP 25
iv

2.3.2 Heat treatment 26
2.3.3 General green bodies formation 26
2.4 Analytical methods 27
2.4.1 Thermal gravimetric analysis-differential thermal analysis 27
2.4.2 X-ray diffraction analysis 27
2.4.3 Diffuse reflectance FTIR spectra 28
2.4.4 Surface analysis 28
2.4.5 Scanning electron microscopy 28
2.4.6 Transmission electron microscopy 29
2.4.7 Sintering curves 29
CHAPTER 3
Yttrium aluminum garnet nanopowders produced by liquid-feed
flame spray pyrolysis (LF-FSP) of metalloorganic precursors
30
3.1 Introduction 30
3.2 Experimental section 32
3.3 Results 33
3.3.1 Precursor formulation 33
3.3.2 Powder characterization 35
3.2.2.1 Surface analyses 36
3.3.2.2 Scanning electron microscopy 36
3.3.2.3 Thermal analyses (TGA) 37
3.3.2.4 FTIR (DRIFT mode) 38
3.3.2.5 X-ray diffraction analysis 40
3.3.2.6 Transmission electron microscopy 42
3.3.2.7 Annealing 44
3.3.3 General comments 44
3.4 conclusion 46
v
3.5 references 68
CHAPTER 4
A new Y3Al5O12 phase produced by liquid-feed flame spray 72
pyrolysis (LF-FSP)
4.1 Introduction 72
4.2 Experimental 73
4.3 Results 74
4.3.1 Analysis 74
4.3.2 Sintering studies 77
4.4 Conclusion 78
4.5 References 84
CHAPTER 5
Nano-α-Al2O3 by suspension-feed flame spray 86
pyrolysis (SF-FSP)
5.1 Introduction 86
5.2 Experimental 87
5.2.1 Precursor suspension 87
5.2.2 Pellet preparation 87
5.3 Results and discussion 88
5.3.1 SF-FSP powder characterization 88
5.3.1.1 XRD 89
5.3.1.2 SEM and TEM 89
5.3.1.3 Particle size analysis 90
5.3.1.4 Infrared spectroscopy 90
5.3.2 Sintering studies 91
5.3.2.1 Constant heating rate experiments 91
5.3.2.3 Grain size control 91
5.4 Conclusion 92
vi

5.5 References 93
CHAPTER 6
Future work 108
5.1 Discussion 108
5.2 References 110
vii

LIST OF TABLES
3.1 NMR data of the dried yttrium propionate 47
3.2 List of precursors formulated (all with 3Y:5Al stoichiometry). 48
3.3 Initial surface area and mean particle size 49
3.4 Ceramic yield of the powders at 1400°C 50
3.5 FTIR peaks of reference materials (cm-1) 51
3.6 YAG starting formation temperature and Ea 52
5.1 Rietveld refinement phase composition of nano-Al2O3 93
before/after LF-FSP.
viii

LIST OF FIGURES
3.1 TGA-DTA of the propionate powder-THF solvate 52
3.2 Possible structures for the yttrium propionate precursor 53
3.3 Micrograph of Sample 1 (yttrium nitrate/aluminum nitrate). 54
3.4 Micrograph of Sample 6 (yttrium propionate/aluminum 54
acetylacetonate)
3.5 FTIR of reference samples (4000-1200 cm-1) 55
3.6 FTIR of various samples (4000-1200 cm-1) 56
3.7 FTIR of various samples II (4000-1200 cm-1) 57
3.8 FTIR of reference samples (1000-400 cm-1). 58
3.9 FTIR or various samples (1000-400 cm-1). 59
3.10 FTIR of various samples II (1000-400 cm-1). 60
3.11 XRD of the as-collected powders 61
3.12 XRD of the as-collected powders II 62
3.13 Low angle XRD of the as-collected powders. 63
3.14 TEM of Sample 6 (yttrium propionate/aluminum acetylacetonate) 64
3.15 DTA of various samples 65
3.16 XRD of Sample 2 showing the formation of the YAlO3 (II) 66
phase on heating to 1050°C/10°C/min and then cooling at the same rate.
4.1.a TEM of LF-FSP produced Y3Al5O12 composition nanopowders 79
4.1.b single particle Tem and electron diffraction 80
4.2 XRD of Y3Al5O12 obtained from LF-FSP 81
4.3 Crystal structure model of hexagonal Y3Al5O12 82
4.4 SEM of pellet fracture surface 83
5.1. XRD of precursor 94
5.2. XRD of SF-FSP powder. 95
ix

5.3. SEM of SF-FSP powder obtained from LF-FSP precursor 96
5.4 to 5.5. TEM of SF-FSP powder obtained from LF-FSP 97
precursor
5.6. HRTEM of a single particle of SF-FSP powder obtained 99
from LF-FSP precursor.
5.7. electron diffraction of a single particle of SF-FSP powder 100
obtained from LF-FSP precursor
5.8. DLS of SF-FSP powder obtained from LF-FSP precursor 101
5.9. FTIR of LF-FSP precursor powder and SF-FSP powder 102
derived from it.
5.10. Sintering curve at constant heating rate (5, 10, 20 °C/min) 103
5.11 SEM of sintered pellet fractured surface 104
(after thermal etching)
5.12 Photograph of pellet after HIPing (text under pellet 105
is times new roman size 12)
6.1 Photograph of doped and undoped YAG monoliths 109
x

ABSTRACT
In the current work, liquid feed flame spray pyrolysis (LF-FSP) was used to create
three novel nanopowders in the Y2O3-Al2O3 system: α-Al2O3, YAG (garnet Y3Al5O12)
and hexagonal Y3Al5O12.
For example, LF-FSP combustion of metalloorganic yttrium and aluminum
precursors in a 3/5 ratio forms hexagonal Y3Al5O12, a newly discovered crystalline phase
detailed in this work. The resulting 15-35 nm average particle size, single crystal
nanopowders were characterized by TGA-DTA, XRD, HR-TEM, electron diffraction and
FTIR. The data was used to establish a model for the crystal structure of this new phase
(hexagonal, with crystal parameter of a = 0.736 nm, c = 1.052) consisting of a
superlattice of substituted hexagonal YAlO3.
YAG has been extensively investigated for its applications as scintillators,
phosphors and as a laser host. Fully dispersible, unaggregated single crystal YAG
nanopowders with average particle sizes of 35-50 nm were obtained from hexagonal
Y3Al5O12 after annealing at 850°C-1200°C (for 2h-8d). The resulting YAG nanopowder
was processed into green bodies using cold isostatic pressing after adding binders. 99%+
dense monoliths were obtained after sintering at 1400°C in vacuum (6-8 h), while
maintaining grain sizes < 500 nm. The ability to sinter while keeping sub-micron grains
differs from present techniques (where translucency is obtained through exaggerated
grain growth to 5-10 microns) reported in the literature for sintering polycrystalline
YAG. and is the first step for improving polycrystalline YAG laser host optical
properties.
LF-FSP processing of transition Al2O3 nanopowders converts them to single
crystal α-Al2O3 nanopowders, previously thought impossible to obtain. The α-Al2O3
xi

nanopowders thus obtained, consist of unaggregated 30-40 nm single particles These
nanopowders were characterized by XRD, HR-TEM, SEM, DLS, FTIR. Green bodies of
α-Al2O3 nanopowders were sintered to 99% density without sintering aids at 1400°C (6-8
h). After HIPing at 1400°C and 138 MPa, the pellets exhibited some transparency. LF-
FSP thus allows synthesis of large quantities of previously unavailable α-Al2O3
nanopowders necessary for developing nanograined α-Al2O3 ceramic monoliths for
transparent armors, polycrystalline laser hosts and prosthetic implants. Most importantly,
it demonstrates the use of LF-FSP to modify the crystalline phase of nanopowders,
without causing aggregation.
xii

Chapter 1: Introduction
The fields of ceramic science and engineering are too vast to define easily as a
whole. New ceramic materials both natural and man-made are synthesized, engineered or
discovered, each year for numerous applications. These materials encompass ceramics
used for cookware, whiteware or construction materials, as well as for advanced
applications such as super conducting ceramics, transparent conductors or laser hosts
among others.
A better understanding of chemical composition, micro-structure as well as
processing methods will always allow one to tailor ceramics for a wider range of
properties. For example tailoring of indium tin oxide (Sn:In2O3, transparent conductor),1
barium iron oxide (BaFe12O19, hard magnets),2 boron carbide (B4C, radiation shielding),3
α-alumina (Al2O3, translucent envelope, structural prostheses),4-6 silicon nitride (Si3N4,
cutting tools),7 mullite (Al6Si2O13 thermal insulation),8 zinc oxide (ZnO, gas sensors),9
has led to better properties for applications with more demanding performance
requirements.10-11
Ceramics used primarily for electrical and electronics purposes are also varied in
composition and versatile in applications. Historically, ceramics were used as insulators
but now encompass the whole range of properties from insulators to semi-conductors to
conducting ceramics,12 to low and high k dielectrics,13-14 piezoelectrics,15 ferroelectrics
1

and superconductors.16-17 The design and properties optimization of these advanced
ceramics requires control over their chemical and phase composition, microstructure and
processing conditions. For electronic, structural and photonic applications, control
mandates starting with highly homogeneous powders and sub-micron particle sizes.
In the following, we first discuss the development of nano-grained ceramics and their
potential for better mechanical and photonic properties. We then detail liquid-feed flame
spray pyrolysis (LF-FSP) as a means of synthesizing the oxide nanopowders needed for
manufacturing nano-grained ceramics. Finally we use the Y2O3-Al2O3 system to
demonstrate how LF-FSP can be used to solve the difficulties inherent to synthesizing
and processing nanopowders. Chapter 2 describes the general experimental methods.
Thereafter Chapters 3 to 5 discuss the formation of YAG composition nanopowders by
LF-FSP, the identification of a new Y3Al5O12 crystalline phase and its sintering behavior,
and finish with the conversion of transition aluminas into α−Al2O3 nanopowder, as well
as its sintering properties.
1.1 Nano-grained ceramics
Grain size control in dense ceramic monoliths has been investigated extensively as a
means to tailor properties.19-20 The resulting development of sub-micron grain size
ceramic monoliths has paved the way for theoretical prediction of the properties of nano-
grained dense ceramic monoliths.21 In this section, we focus on pore formation and
evolution and the influence of grain size. Coincidentally small grain sizes improve their
in-line transmission of light (potential for optical/photonic applications). We then discuss
the difficulties generally encountered in synthesizing and processing ceramic
2

nanopowders with the requisite characteristics to sinter into fully dense, nano-grained
monoliths.
1.1.1 Pore formation and evolution
Sub-micron grained polycrystalline ceramics have been investigated extensively for
structural applications,22-28 including their use in prosthetics, bone implants, ceramic
blades or armor due to their high hardness and high toughness.22-27 Lack of control,
during processing of ceramic powders into green bodies or during sintering of these green
bodies to polycrystalline ceramics monoliths, results in defects that severely decrease
their hardness and toughness.21 In particular, understanding pore formation and evolution
is essential to designing high toughness and/or transparent polycrystalline ceramics.
Several kinds of pores occur during the processing of ceramic powders into the initial
green bodies.29-32 First (comprising most of the initial pore volume) are the interstitial
spaces between particles resulting from packing. Interstitial pore sizes range from 20 to
50% of the particle sizes in the case of perfect packing of spherical particles and are
larger when packing defects are present.29
Additional porosity is introduced by aggregation of particles in the powders forming
the green body. These aggregates generally form porous fractal shapes that also pack
unevenly in the green bodies. These pores are either inside the fractal aggregates or
interstitials between aggregates and in both case are significantly larger than the average
particle size.30
Several kinds of pores are also specific to the processing techniques used to form the
green bodies. Uniaxial pressing results in density gradients leading to inhomogeneous
3

distribution of type and amount of porosity in a green body.31 The use of slurries can
result in air bubbles up to 0.5 mm in size.32
Sintering green bodies to final dense polycrystalline monolith occurs in three stages33
(1) Initial stage. Particles merge forming necks at inter-particle contacts.
(2) Intermediate stage. Continuous pore networks form as most of the
densification occurs. The surface energy of small particles is higher than that
of larger ones, resulting in the disappearance of the finest grains and growth of
larger grains.34 This generally results in homogenization of grain sizes
(3) Final stage. Pore networks close followed by pore diffusion.
During each of these three stages, the different pores discussed above evolve as new
kinds of porosity emerge. A full nomenclature of porosity changes is beyond the scope of
this study, but the most relevant examples are discussed below.
Differences in local sintering rate result in uneven densification. There are several
reasons for this phenomenon. Diffusion rates during the first two stages of sintering can
be affected by density gradients resulting from initial processing. An uneven distribution
of dopants within green bodies can also change diffusion rates locally.35 Secondary
phases might also alter the local sintering mechanisms involved.35 Also, aggregates with
already formed necks between particles have higher local sintering rates than their
unaggregated surrounding.36,37 These differences in local sintering rates lead to uneven
densification, resulting in pores forming at the interface between zones with high and low
sintering rates.
The driving forces for all pores removal depend on the ratio of pore size to particle
size, causing all pores above a critical size dc to initially grow as the smaller pores
4

disappear or coalesce)34, 38, 39 Equation (1) details the dependence of this critical pore size
on the coordination number of the pore described as the number of grains in contact with
the pore (n=1 for intra-granular pores, 2 for pores located at the grain boundary between
two grains…) as well as the surface and interface tension: pores with lower coordination
numbers can have slightly larger size and still disappear
dc = D ×( πns
)1/ 2
sin( πns
)1/ 2×
2γ s
γ i
−1⎛
⎝ ⎜
⎞
⎠ ⎟ (1)
D is the average grain size, dc is the critical pore size. ns is the coordination
number of the pore (number of grains in contact with pore). γi and γs are the
interface and surface tension at the surface of the pore.
The coordination number of a pore is dependant on the packing of the particles in the
green body and in particularly dependent on the kind of defect causing the pore. Average
pore sizes in the various stages of sintering will thus be vastly different than those of the
pores initially present in the green bodies.
Initial porosity, as well as the evolution of porosity during the first two steps of
sintering, determines most of the residual porosity in the polycrystalline monoliths after
the third stage of sintering. Control of this residual porosity is essential to optimizing
mechanical properties and requires rigid control of the initial green body porosity and of
the pore evolution during sintering. Control of pore evolution can be achieved by
controlling the sintering rates and mechanisms during each of the sintering stages. Both
are heavily influenced by the grain size, whose growth can be limited during sintering.
Recent experiments show that densification can occur with limited grain
growth.40,41,21 Dense polycrystalline monolith can therefore be obtained while controlling
5

the grain size (and size distribution) resulting in better control of the porosity. This
control requires smaller initial particles.21
Controlling grain sizes thus offers the potential to control the residual porosity as
described above. Decreasing grain size can also increase the in-line transmission of
polycrystalline ceramics by reducing the effects of grain boundaries on refraction and
light scattering as discussed below.
1.1.2 Optical properties and optical/photonic applications
In photonic applications, one encounters single crystal or glass lasers most
commonly. For example, Yttrium aluminum garnet (Nd:Y3Al5O12) is one of the most
widely used laser materials in medicine for surgery as well as for industrial cutting,42-43
exemplifying traditional single crystal solid-state lasers.44 However, recent studies have
shown that polycrystalline Nd:Y3Al5O12 transparent ceramic lasers can be made that offer
properties superior to single crystal lasers. In particular they offer higher concentrations
and controllable distributions of dopants, as well as better performance in ultra-short
pulse mode.45-46 Other potential applications for transparent polycrystalline ceramics
include radomes and transparent armor.47-48
Reducing grain size in translucent ceramics potentially offers benefits in regards
to their photonic properties. Current translucent ceramics, commonly used for high
pressure metal vapor lamp envelopes, generally have 10-20 µm average grain sizes to
minimize interactions between light and the grains or residual pores (the effect of grain
boundary reflection in particular decrease with extraordinary grain growth).49 This
increases their sensitivity to fatigue (due to anisotropy of α-Al2O3 coefficient of thermal
expansion).
6

Several photonic properties also depend on grain size, in-line transmission of light
being the main example.50 In ceramics, light transmission can be hindered by
birefringence, light scattering caused by residual porosity, grain boundary refraction and
reflection.51 Grain boundary refraction is caused by anisotropy of the refractive index in
non-cubic crystal structures, (different crystallographic orientations have different
refractive indexes), resulting in index mismatches at grain boundaries.52 The resulting
loss of in-line transmission depends on grain sizes, as well as the maximum refractive
index mismatch as described in Equation (2). The in-line transmission gets closer to
single crystal light transmission when the average grain size decreases, but decreases
when the average grain size increases. 51
Transmission = (1− R)e−
3π 2tΔn 2dλ2
(
R is the reflectance of the material, t is the sample thickness, Δn the
maximum mismatch in refractive index between the crystallographic directions, d
the average grain size, λ is the wavelength of light transmitted.
(2)
Residual porosity and secondary phases in the ceramic also limit in-line
transmission by scattering light. Equation (3) describes the general influence of defects
on the in-line transmission as a function of the defect size. The in-line transmission
decreases as the average defect size increases. The size of most of these defects, resulting
from residual porosity, is on the order of the average grain size as discussed above.
7

Transmission = (1− R)e−
3π × t(2 kdefect ⋅d defect Δndefect2∑ )
λ2
⎛
⎝
⎜ ⎜
⎞
⎠
⎟ ⎟ (3)
R is the reflectance of the material, t is the sample thickness, kdefect a form
factor of the defect, Δndefect the difference in refractive index between the material
(average index) and the defect considered (pores or secondary phases), ddefect the
average defect size, λ is the wavelength of light transmitted.
Development of transparent ceramics with higher in-line transmission (closer to
theory), and structural ceramics with higher mechanical properties could thus be achieved
by sintering to full density while limiting grain and pore growth.
1.1.3 Difficulties in synthesizing nano-grained ceramics.
Nano-grained ceramics thus present considerable potential for improved photonic
properties, according to equations (2)-(3). Two technological difficulties hinder the
processing of nano-grained ceramics (optimally with average grain size < 200 nm). First,
as explained above, large quantities of high purity, unaggregated, sub 100 nm powders
with uniform dispersity are essential for controlling final grain size in nano-grained
ceramics. There are many methods of synthesizing metal oxide nanopowders, from
classical methods such as gas-feed combustion of metal chlorides53 and chemical
precipitation techniques54,55 to thermal decomposition of metal alkoxides.56 Each of these
techniques has been reviewed in detail in the litterature.57,58 They do not produce the
8

required quality and/or quantity of nanopowders, mostly due to high degrees of
aggregation in the resulting nanopowders. Mixed-metal oxide nanopowders are even
more difficult to obtain with most of these techniques further limiting development of
doped or mixed-metal oxide nano-grained ceramics.
The second difficulty in developing nano-grained ceramics is in their processing to
green bodies.59 Van der Waals interactions between nanoparticles increase greatly
because of their high surface to volume ratios, increasing the viscosities of nanopowder
slurries compared to slurries of micron-sized powders of the same material. Furthermore,
differences in surface chemistry between micron and nanoparticles of the same
composition can also result in difficulties in wet-processing of these nanopowders.
This thesis discusses liquid-feed flame spray pyrolysis (LF-FSP) as a means to
produce large quantities of high purity, unaggregated, single or mixed-metal oxide
nanopowders with uniform dispersity. It will also discuss LF-FSP for phase conversion in
nanopowders, processing of these nanopowders into green compacts, and the process of
sintering to fully dense polycrystalline monoliths.
1.2 Liquid-Feed Flame Spray pyrolysis.
Liquid-feed flame spray pyrolysis has emerged as a promising technique for
producing both single and mixed-metal oxide nanopowders with the required properties
for processing nano-grained ceramics: (1) nanoparticles in the 10-50 nm range; (2)
complete control over purity and stoichiometry; (3) narrow particle size distributions and;
(4) limited aggregation.34,60
In LF-FSP processing, detailed in Chapter 2, the fuel/chemical precursor is
transformed in an oxygen-rich aerosol by a Bernoulli mist nozzle and ignited using pilot
9

torches. Despite the fact that the LF-FSP flame temperatures range from 1500° to
2000°C, the choice of precursor seems to make a considerable difference in the quality of
the powder produced both in terms of phase and particle morphology as discussed in
Chapter 3.61,62 Differences in nanopowder morphologies can be explained by
combustion/decomposition mechanisms that occur at the beginning of the combustion
process as briefly discussed below.
In LF-FSP, the initial spray generally consists of a solution of metal propionates
and/or acetylacetonates in ethanol (0.5-5 wt% ceramic loading). This precursor is mixed
with oxygen in a Bernoulli mist nozzle and ignited using pilot torches The resulting
micron-sized droplets in the aerosol start to vaporize and ignite on their exterior surface
until boiling occurs inside the droplet, causing it to fragment.63 These fragmented
droplets themselves vaporize and ignite, possibly undergoing further fragmentation.
Combustion of the metalloorganic precursor in the droplets forms oxo or hydroxyl
species. Organic ligands are expected to combust simultaneously with the fuel, resulting
in high flame temperatures. The resulting oxo or hydroxyl product species condense in
the gas phase forming nanoparticles that grow until they are quickly quenched. This rapid
quenching limits their sizes.
Combustion mechanisms are quite different for metal nitrate precursors. Particle
formation starts before the fragmentation of the droplets described above. The nitrates
partially decompose and/or the particles form melted droplets,61,63,64 resulting in the
formation of networked particles that act as seeds for the formation of micron-sized
particles in the gas phase as hypothesized from the work of Zacharia63 and Madler,64 as
well as earlier studies in our group.61 This also causes a bimodal distribution of particle
10
sizes as not all the nitrate molecules decompose at the same time. Smaller particles could
thus be the result of melting/decomposition occurring after droplet fragmentation. The
exact mechanism by which this residual metal nitrate results in some smaller
nanoparticles as seen in Chapter 3 is as yet not fully understood. Changes in the flame
temperature, as well as dwell time, also result in changes in both the morphology,
average particle size, particle size distribution and crystalline phase of the nanopowder
formed as will be discussed in Chapters 3 and 4.
Thus even though widely available and relatively inexpensive, metal nitrates are
of limited use for LF-FSP. Development of new metalloorganic precursors for LF-FSP
can provide high metal purity (six nines) nanopowders with the required properties for
processing nanograined ceramics. There are also several benefits to developing
metalloorganic precursors for LF-FSP. First they can be purified to metal purities
exceeding six nines. In addition, through sufficient development, compatible chemistries
can be found to produce mutually soluble precursors containing several metal species, in
turn allowing for production of homogeneous mixed-metal oxide ceramic
nanopowders.65-69 Additional impurities found in LF-FSP powders derived from
metalloorganic precursor includes carbonates and hydroxyl groups (generally 1-5 wt%).
Particles produced in the flame are rapidly quenched as described in Chapter 2,
resulting in nanoparticles with limited interparticle contacts at high temperature as
described below, inhibiting aggregation in the final nanopowders. This inhibition of
aggregation inspired a further development of the LF-FSP technique called suspension-
feed flame spray pyrolysis (SF-FSP), in which the precursors consist of various
suspensions of nanopowder in alcohols with or without metalloorganic precursors. An
11

aerosol is then formed and ignited using techniques similar to LF-FSP. As the droplets
ignite, the nanoparticles in suspension are exposed to high flame temperature (1200-
2200°C) for a brief instant and quenched extremely fast to 300-500°C. This brief
exposure to the flame does not permit aggregation, due to the combination of the high
flow rates and rapid quenching, but is enough to cause phase changes. For the same
reasons, particle growth is limited during the process with the resulting nanopowders
having relatively similar sizes to the nanopowders used as precursor. Chapter 5 describes
the use of SF-FSP to produce nano α-Al2O3 as well as the influence of the initial
nanopowders in the precursor suspension.
The use of metalloorganic precursors with dispersed nanopowders in SF-FSP
results in oxo or hydroxyl species produced by combustion of the metalloorganic
precursor condensing on the precursor nanopowder. With the right flame temperatures
and choice of precursors, this can result in core-shell nanopowders.68-69 These oxo or
hydroxyl species can also react with the nanopowder precursor forming doped or mixed-
metal nanopowder (such as in our study of neodymium or chromium propionate
precursor on δ-Al2O3 nanopowder, discussed in the appendixes). 70
The nanopowder phases can also differ from the stable crystalline phases expected
thermodynamically, due to rapid quenching coupled with high initial temperatures in the
flame. For single metal nano-oxides, this often results in kinetic phases being formed, as
the dwell time at high temperatures (maximum of 0.05 sec) can be insufficient for
thermodynamic phases to form. The formation of kinetic phases can also extend the
composition range in a phase field for some mixed-metal nano-oxides, as our studies on
spinel-type materials has shown.67, 71
12

1.3 Y2O3-Al2O3 System
These developments in the LF-FSP technique allow better control of the particle
morphology and phases of the as-produced nanopowders. To demonstrate the utility of
these new LF-FSP techniques, we investigated production of nanoparticles in the Y2O3-
Al2O3 system. This system was chosen for two reasons: first the extensive polymorphism
of all but one of the line compounds in the system is ideal for demonstrating phase
control. Several phases in this system are hard to obtain as nanopowders, especially
yttrium aluminum garnet, YAG (Y3Al5O12) and α-Al2O3, as earlier work in this group
showed.61 Secondly the Y2O3-Al2O3 system has been studied extensively over the past
decades due to the many varied applications of its three main compositions: Al2O3
(electrical insulation, transparent envelopes for metal vapor lamps, refractory, abrasive,
prostheses…),72-77 Y3Al5O12 (laser hosts, scintillators, phospors, creep resistant structural
materials)78-82 and Y2O3 (phosphors, up-converters).83-84
Al2O3 can exist as eight main polymorphs, with α-Al2O3 being the
thermodynamically most stable phase. The other polymorphs, called transition aluminas,
are products resulting from the dehydration of the various aluminum hydroxides and
convert to α-Al2O3 after 1-3 phase changes. Among these polymorphs, δ−Al2O3 is also
produced as nano-alumina (< 100 nm) in ton/year quantities for fluorescent light
coatings, chemical mechanical polishing, transparent reinforcing fillers for polymers.
These polymorphs have properties very different from α-Al2O3: in particular they have
13

lower densities and a face centered cubic (FCC) arrangement of oxygen atoms in their
crystal structure as opposed to the HCP arrangement in α-Al2O3. Rapid changes of
density during conversion to α-Al2O3 cause the formation of a highly aggregated
vermicular structure, which limit the use of transition alumina nanopowders to obtain
high quality unaggregated α-Al2O3 nanopowders.
α-Al2O3 nanopowders could in theory be sintered into high strength transparent
ceramic monoliths as described earlier for such applications as transparent polycrystalline
armor, radome or sodium vapor lamp envelopes.73 There are no industrial techniques to
obtain α−Al2O3 powders with average particle sizes below 100 nm, despite the wide
availability of micron size powders.
The second composition we studied, namely Y3Al5O12, has only two polymorphs,
yttrium aluminum garnet (YAG) and yttroalumnite. Both have a complex cubic crystal
structure with yttroalumnite being the high temperature, distorted structure of YAG, as
described in Chapter 4. YAG materials have been studied extensively over many decades
because of their exceptional high temperature mechanical strength coupled with low
creep and their photonic properties.80-82 The recent development of polycrystalline doped
YAG monoliths allows easy access to laser hosts having properties comparable to single
YAG crystal.45-46
Several methods produce Y3Al5O12 composition nanopowders,54,55 but they result in
precursor nanopowders that require annealing at 1000-1400°C to form YAG. Uniform
YAG formation is also difficult due to the formation of secondary phases in YAG
composition material caused by minor variations in the yttrium/aluminum stoichiometry
between particles: α−Al2O3, three YAlO3 polymorphs (hexagonal, orthorhombic and
14

cubic) or Y4Al2O9 can thus form in YAG powders.56 The YAlO3 polymorphs are also the
kinetically favored phase during the formation of YAG, especially if using gas-phase
synthesis.58 Hence, these secondary phases often reside at the grain boundaries of YAG
polycrystalline ceramics, thereby reducing its optical properties.
15

1.4 References
1C.G. Granqvist, “Transparent conductors as solar energy materials: A panoramic
review“, Sol. En. Mater. and Sol. Cells, 2007 91 (17) 1529. 2L. Affleck, M.D. Aguas, I.P. Parkin, Q.A. Pankhurst and M.V. Kuznetsov,
“Microstructural aspects of the self-propagating high temperature synthesis of hexagonal
barium ferrites in an external magnetic field”, J. Mater. Chem., 2000 10 (8) 1925. 3D. Emin, T.L. Aselage, “A proposed boron-carbide-based solid-state neutron detector”,
J. Appl. Phys. 2005 97 (1) 013529. 4V. Saikko, J. Keränen, “Wear simulation of alumina-on-alumina prosthetic hip joints
using a multidirectional motion pin-on-disk device”, J. Am. Ceram. Soc., 2002 85 2785. 5J. D’Antonio, W. Capello, M. Manley, B. Bierbaum, “New experience with alumina-on-
alumina ceramic bearings for total hip arthroplasty”, J. Arthroplasty, 2002 17 390. 6A. Krell, P. Blank, H. Ma, T. Hutzler, M. Nebelung, “Processing of high-density
submicrometer Al O for new applications2 3 ”, J. Am. Ceram. Soc., 2003 86 12. 7X.Y. Wang, S Luao, D. Liu, X. Zhu, “Study on mechanical properties of hot-press
sintering silicon nitride ceramics”, Rare Met. Mater. and Eng., 2007 36 302. 8D.N. Boccaccini,, C. Leonelli, I. Dlouhy, P. Veronesi, “Thermal shock behaviour of
mullite-cordierite refractory materials”, Adv. in Appl. Ceram.. 2007 106 142. 9 T. Wagner, T. Waitz, J. Roggenbuck, M. Fröba, C.D. Kohl, M. Tiemann “Ordered
mesoporous ZnO for gas sensing”, Thin Sol. Films, 2007 515 (23) 8360. 10R.S. Lima, B.R. Marple,” Thermal spray coatings engineered from nanostructured
ceramic agglomerated powders for structural, thermal barrier and biomedical
applications: A review”, J. Therm. Spray Tech., 2007 16 (1) 40. 11A. Mukhopadhyay, B. Basu,” Pressureless sintering of ZrO2-ZrB2 composites:
Microstructure and properties”, Int. Mater. Rev., 2007 52 (5) 257. 12X.L. Zhou, M Zhu, F Deng, G Meng, X Liu “Electrical properties, sintering and
thermal expansion behavior of composite ceramic interconnecting materials,
La0.7Ca0.3CrO3−δ/Y0.2Ce0.8O1.9 for SOFCs”, Acta Materiala, 2007 55 (6) 2113. 13R.A. Farrell, K. Cherkaoui, N. Petkov, H. Amenitsch, J.D. Holmes, P.K. Hurley, M.A.
Morris, “Physical and electrical properties of low dielectric constant self-assembled
16

mesoporous silica thin films”, Microelectronics Reliability, 2007 47 (4-5) 759. 14N. Umezawa, K. Shiraishi, S. Sugino, A. Tachibana, “Suppression of oxygen vacancy
formation in Hf-based high-k dielectrics by lanthanum incorporation”, Appl. Phys. Let.,
2007 91 (13) 132904. 15P. Zubko, G. Catalan, A. Buckley, P.R.L. Welche, J.F. Scott, “Strain-gradient-induced
polarization in SrTiO single crystals3 ”, Phys.Rev. Let., 2007 99 (16) 167601. 16K.A. Rabe, M. Dawber, C. Lichtensteiger, C.H. Ahn, J. M. Triscone, “Modern physics
of ferroelectrics: Essential background”, Phys. Ferroelectrics, 2007 105 1. 17G. Aldica, P. Badica, J.R. Groza, “Field-assisted-sintering of MgB superconductor
doped with SiC and B C2
4 ”, J. Opt and Adv Mater., 2007 9 (6) 1742. 18G.Y. Akimov, G.A. Marinin, E.V. Chaika, V.N. Varyukhin, “Effect of the grain size on
the formation of a nanophase structure and tribological properties of the friction surface
of a ceramic made of partly stabilized zirconia”, Tech. Phys., 2007 52 (10) 1362. 19W. Jo, T.H. Kim, D.Y. Kim, “Effects of grain size on the dielectric properties of
Pb(Mg Nb )O -30 mol % PbTiO ceramics1/3 2/3 3 3 ”, J. Appl. Phys., 2007 102 (7) 074116. 20R.W. Rice, “Grain size and porosity dependence of ceramic fracture energy and
toughness at 22°C”, J. Mater. Sci., 1996 31 (8) 1969. 21 P. Bowen, C. Carry, “From powders to sintered pieces: forming, transformations and
sintering of nanostructured ceramic oxides”, Powder. Tech., 2002 128 (2-3) 248. 22W.A. Yarbrough, R. Roy, “Microstructural evolution in sintering of ALOOH gels”, J.
Mater. Res., 1987 2 (4) 494. 23J.P. Parimal, G. Gilde, P. Dehmer, J. McCauley, “Fracture properties and behavior of
transparent ceramics”, SPIE Proc., 2000 4102 15. 24G. Fischman, “Validated Microstructural Assessment of Femoral Heads”, J. ASTM Int.,
2004 1 1. 25V. Saikko, J. Keränen, “Wear simulation of alumina-on-alumina prosthetic hip joints
using a multidirectional motion pin-on-disk device”, J. Am. Ceram. Soc., 2002 85 2785. 26S. Eliot, “Silicon carbide ceramic armor”, Adv. Mater. Proc., 2007 165 (10) 29. 27K.E. Kuehn, “Developments in ceramic armor patenting”, Am. Ceram. Soc. Bul., 2006
85 (3) 29. 28 J. Zhou, Y. Li, R. Zhu, Z. Zhang, “The grain size and porosity dependent elastic
17

moduli and yield strength of nanocrystalline ceramics”, Mater. Sci. and Eng., 2007 445
717. 29N. Chantaramee, S. Tanaka, “The effect of packing structure of powder particles on
warping during sintering”, J. Eur. Ceram. Soc., 2008 28 (1) 21. 30M. Kitayama, J. Pask , “Formation and Control of Agglomerates in Alumina Powder”,
J. Am.Ceram. Soc., 1996 79 (8) 2003. 31T.J. Vogler, M.Y. Lee, D.E. Grady, ”Static and dynamic compaction of ceramic
powders”, Int. J. Sol. and Structures, 2007 44 (2) 636. 32S.W. Sofie, F. Dogan, “Freeze Casting of Aqueous Alumina Slurries with Glycerol”, J.
Am. Ceram. Soc., 2001 7 1459. 33R.L. Coble, “Sintering Crystalline Solids. I. Intermediate and Final State Diffusion
Models”, J. Appl. Phys., 1961 32 (5) 787. 34J.L. Shi, “Solid state sintering of ceramics: pore microstructure models, densification
equations and applications”, J. Mater. Sci., 1999 34 (15) 3801. 35W.C. Johnson, R.L. Coble, “A Test of the Second-Phase and Impurity-Segregation
Models for MgO-Enhanced Densification of Sintered Alumina”, J. Am. Cer. Soc., 1978
61 (3-4) 110. 36J.L. Shi, X. Lint, S. Yen, “Effect of agglomerates in ZrO2 powder compacts on
microstructural development”, J. Mater. Sci., 1993 28 (2) 342. 37M.A. Spears, A.G. Evans, “Microstructure Development during Final Intermediate
Stage Sintering”, Acta Materiala, 1982 65 (10) 498. 38F.F. Lange, “Sinterability of Agglomerated Powders” J. Am. Ceram. Soc., 1984 67(1)
83. 39W.D. Kingery, M. Berg, “Study of the initial stages of sintering solids by viscous flow,
evaporation-condensation, and self-diffusion” J. Appl. Phys., 1955 26 (10) 1205. 40R. Chaim, “Superfast densification of nanocrystalline oxide powders by spark plasma
sintering”J. Mater Sci., 2006 41 (23) 7862. 41M.B. Park, N.H. Cho, C.D. Kim, S.K. Lee, “Phase Transition and Physical
Characteristics of Nanograined BaTiO3 Ceramics .Synthesized from Surface-Coated
Nanopowders”, J. Am. Ceram. Soc., 2004 87 (3) 510.
18

42B. Gaspirc, U. Skaleric, “Clinical evaluation of periodontal surgical treatment with an
Er : YAG laser: 5-year results“, J. Periodontology, 2007 78 (10) 1864. 43F. Quintero, J. Pou, F. Lusquiños, A. Riveiro, M. Pérez-Amo, “Single-pass and multi-
pass laser cutting of Si-SiC: Assessment of the cut quality and microstructure in the heat
affected zone” J. Las. Appl., 2007 19 (3) 170. 44A.L. Schawlow, C.H. Townes, “Infrared and optical masers”, Phys. Rev., 1958 112
1940. 45J. Lu, M. Prabhu, J. Song, C. Li, J. Xu, K. Ueda, H. Yagi, “Highly efficient Nd :
Y Al O ceramic laser3 5 12 ”, Jpn. J. Appl. Phys. 2001 40 552. 46A. Ikesue, T. Kinoshita, K. Kamata, K. Yoshida, “Fabrication and Optical Properties of
High-Performance Polycrystalline Nd:YAG Ceramics for Solid-State Lasers”, J. Am.
Ceram. Soc., 1995 78 (4) 1033. 47J.P. Parimal, G. Gilde, P. Dehmer, J. McCauley, “Transparent ceramics for armor and
EM window applications”, SPIE Proc., 2000 4102 1. 48Z. Zalevsky, A. Rudnitsky, M. Nathan,”Nano photonic and ultra fast all-optical
processing modules”, Opt. Express, 2005 13 (25) 10272. 49O. Katsutoshi; T. Kusunoki, “The effect of ultrafine pigment color filters on cathode ray
tube brightness, contrast, and color purity”, J. Electrochem. Soc., 1996 143 1063. 50R. Apetz, M.B.P. van Bruggen, “Transparent Alumina: A Light-Scattering Model”, J.
Am. Ceram. Soc. 2003 86 (3) 480. 51V.V. Shvartsman, A.L. Kholkin, C. Verdier, Z. Yong, D.C. Lupascu, “Investigation of
fatigue mechanism in ferroelectric ceramic via piezoresponse force microscopy”, J. Eur.
Ceram. Soc, 2005 25 (12) 2559. 52Y.C. Kang, Y.S. Chung, P.S. Bin, “Preparation of YAG:Europium Red Phosphors by
Spray Pyrolysis Using a Filter-Expansion Aerosol Generator”, J. Am. Ceram. Soc., 1999
82(8) 2056. 53M. Nyman, J. Caruso, M.J. Hamden-Smith, T.T. Kodas, “Comparison of solid-state and
spray-pyrolysis synthesis of yttrium aluminate powders ”, J. Am. Ceram. Soc., 1997 80
1231. 54J. Li, T. Ikegami, J. Lee, T. Mori, Y. Yajima, “Co-precipitation synthesis and sintering
of yttrium aluminum garnet (YAG) powders: the effect of precipitant”, J. Eur. Ceram.
19

Soc., 2000 20 2395 55K.T. Pillai, R.V. Kamat, V.N. Vaidya, D.D. Sood, “Synthesis of yttrium aluminium
garnet by the gel entrapment technique using hexamine”, Mater. Chem. Phys., 1996 46
67. 56D.M. Veith, S. Mathur S, A. Kareiva, M. Jilavi, M. Zimmer, V. Huch, “Low
temperature synthesis of nanocrystalline Y Al O (YAG) and Ce-doped Y Al O via
different sol-gel methods3 5 12 3 5 12
”, J. Mater. Chem. 1999 9 3069. 57J.R. Groza, “nanosintering”, Nanostructured Mater. , 1999 12 (5-8) 987. 58E. Pratsinis, R. Strobel, “Flame aerosol synthesis of smart nanostructured materials”, J.
Mater. Chem., 2007 17 (45) 4743. 59I.W.P. Chen, J. Chen, “Sintering of Fine Oxide Powders: I, Microstructural Evolution”,
J. Am. Ceram. Soc., 1996 79 (12) 3129. 60I.W.P. Chen, J. Chen, “Sintering of Fine Oxide Powders: II, Sintering Mechanisms”, J.
Am. Ceram. Soc., 1997 80 (3) 637. 61T. Hinklin, B. Toury, C. Gervais, F. Babonneau, J.J. Gislason, R.W. Morton, R.M.
Laine “Liquid-Feed Flame Spray Pyrolytic Synthesis of Nanoalumina Powders”, Chem.
Mater., 2004 16 (1) 21. 62J. Marchal, T. John, R. Baranwal, T. Hinklin, R.M. Laine, “Yttrium aluminum garnet
nanopowders produced by liquid-feed flame spray pyrolysis (LF-FSP) of metalloorganic
precursors“, Chem. Mater., 2004 16 (5) 822. 63A. Zacharia, S. Gucer, B. Izgi, H. Karaaslan, “Direct atomic absorption spectrometry
determination of tin, lead, cadmium and zinc in high-purity graphite with flame furnace
atomizer”, Talanta, 2007 72 (2) 825. 64M.C. Heine, L. Mädler, R. Jossen, S.E. Pratsinis, “Direct measurement of entrainment
during nanoparticle synthesis in spray flames”, Combustion and Flame, 2006 144 (4)
809. 65T. Hinklin, R.M. Laine, “Synthesis of Metastable Phases in the Magnesium
Spinel−Alumina System”, Chem. Mater., 2008 20 (2) 553. 66J. Azurdia, J. Marchal, R.M. Laine, “Synthesis and Characterization of Mixed-Metal
Oxide Nanopowders Along the CoOx–Al2O3 Tie Line Using Liquid-Feed Flame Spray
Pyrolysis”, J. Am. Ceram. Soc., 2006 8 (9) 2749.
20
67J.A. Azurdia, J.C. Marchal, P. Shea, H. Sun, X.Q. Pan, R.M. Laine; “Liquid-feed flame
spray pyrolysis (LF-FSP) as a method of producing mixed-metal oxide nanopowders of
potential interest as catalytic materials. Nanopowders along the NiO-Al2O3 tie-line
including (NiO)0.22(Al2O3)0.78, a new inverse spinel composition”, Chem. Mater., 2006
18, 731. 68S. Kim, M. Kim, R.M. Laine, “Combinatorial processing of mixed-metal oxide
nanopowders along the ZnO-Al2O3 tie line using liquid-feed flame spray pyrolysis (LF-
FSP)”, Chem. Mater. 2004, 16, 2336. 69 M. Kim, R.M. Laine, “Combinatorial processing of mixed-metal oxide nanopowders
along the ZrO2-Al2O3 tie line using liquid-feed flame spray pyrolysis (LF-FSP)”, Ceram.
Pro. Res., submitted. 70R.M. Laine, J.M. Marchal, J. Azurdia, R. Rennensund, “Liquid Feed Flame Spray
Modification of Nanoparticles”, U.S. patent application 20060087062 (2006). 71R.M. Laine, J. Marchal, J. Azurdia, M, Kim, ”Finding spinel in all the wrong places”,
Adv. Mater, in press. 72J. Crunteanu, F. Dumas-Bouchiat, C. Champeaux, A. Catherinot, P. Blondy, “Electrical
conduction mechanisms of metal nanoclusters embedded in an amorphous Al2O3 matrix”,
Thin Sol. Films, 2007 515 (16) 6324. 73T. Markus, U. Niemann, K. Hilpert “High temperature gas phase chemistry for the
development of advanced ceramic discharge lamps”, J. Phys. and Chem. Sol., 2005 66
(2-4) 372. 74J.M. Auvray, C. Gault, M. Huger, “Evolution of elastic properties and microstructural
changes versus temperature in bonding phases of alumina and alumina–magnesia
refractory castables”, J. Eur. Ceram. Soc. 2007 27 (12) 3489. 75P.H. Shipway, J.J. Haqq, “Wear of bulk ceramics in micro-scale abrasion - The role of
abrasive shape and hardness and its relevance to testing of ceramic coatings”, Wear, 2007
263 (4) 887. 76T. Tateiwa, I.C. Clarke, G. Pezzotti, L. Sedel, T. Kumakura, “Surface micro-analyses of
long-term worn retrieved "Osteal™" alumina ceramic total hip replacement”, J. Bio.
Mater. Res., 2007 83B (2) 562.
21

77J.Z. Sun, T. Stirner, A. Matthews, “Structure and electronic properties calculation of
ultrathin alpha-Al O films on (0001) alpha-Cr O templates2 3 2 3 ”, Sur. Sci., 2007 601 (21)
5050. 78R.A. Yukna, R.L. Carr, G.H. Evans, “Histologic evaluation of an Nd : YAG laser-
assisted new attachment procedure in humans ”, Int. J. Periondontics and Restorative
Dent. , 2007 27 (6) 577. 79F. Druon, F. Balembois, P. George, “New laser crystals for the generation of ultrashort
pulses”, Comptes Rendus Phys., 2007 8 (2) 153. 80S.H. Yang, C.Y. Liu, J. Electrochem. Soc. “Influence of doping and coating on the
photoluminescence properties of yttrium aluminum garnet phosphors”, 2007 154 (12)
397. 81J.X Meng, K.W. Cheah, J. Shi, P. Zhao; J.Q. Li, “Intense 1540 nm emission from Er
doped Ce : YAG phosphor”, Appl. Phys. Let., 2007 91 (15) 151107 . 82R.C. Pullar, M.D. Taylor, A.K. Battacharya, “Effect of sodium on the creep resistance
of yttrium aluminium garnet (YAG) fibres”, J. Eur. Cer. Soc. , 2006 26 (9) 1577. 83S. Redmond, S.C. Rand, X.L. Ruan, M. Xaviany, “Multiple scattering and nonlinear
thermal emission of Yb3+, Er3+: Y2O3 nanopowders”, J. Appl. Phys., 2004 95 (8) 4069. 84S. Ray, A. Patra, P. Pramanik , “Photoluminescence properties of nanocrystalline Tb3+
doped Y2O3 phosphor prepared through a novel synthetic route”, Opt. Mater., 2007 30
(4) 608.
22
Chapter 2: General experimental, materials and methods 2.1 Introduction
This chapter details the general laboratory techniques used in this thesis.
Additional experimental descriptions are provided in the following chapters, which are
more specific to work conducted in those chapters.
2.2 General materials
This section details the synthesis of the metalloorganic precursors used in LF-FSP
and SF-FSP to produce the nanopowders described in this thesis. It also lists the chemical
compounds used for processing the nanopowders into green bodies.
2.2.1 Materials
Anhydrous yttrium chloride (YCl3, 99.99%), yttrium nitrate hexahydrate
[Y(NO3)3.6H2O, 99.9%], aluminum nitrate nonahydrate [Al(NO3)3
.9H2O,98%],
methoxyacetic acid (CH3COCH2CO2H, 98%), chromium nitrate hexahydrate
[Cr(NO3)3.6H2O, 99.9%], neodymium nitrate hexahydrate [Nd(NO3)3
.6H2O, 99.9%],
bicine (99%), were purchased from Aldrich (Milwaukee, WI) and used as received.
Anhydrous butanol (99.9%) and THF (99.9%) were also purchased from Aldrich.
Yttrium tris(2-ethylhexanoate) [Y(O2CCHEtC4H9)3, 99.8%) and propionic acid
(C2H5CO2H, 99+%), were purchased from Alfa Aesar and used as received. Yttrium
trisacetylacetonate [Y(CH2COCH=COCH3)3, 99.9%] and aluminum trisacetylacetonate
[Al(CH2COCH=C(O)CH3)3, 99.8%] were purchased from MacKenzie (Bush, LA) and
either used as received, or recrystallized by dissolving in boiling THF then cooling the
solution to 2°C.
The following surfactants and additives were used for processing the nanopowders
into green bodies: Tetronic 304 was received as a gift from BASF (Parsipany, NJ) and
23

used as received. Darvan C-N was recei ed as a gift from Vanderbilt (Norwalk, CT) and
used as received. Dynol 604 was received as a gift from Air Products and used as
received. Duramax B-1000 was received as a gift from Rohm Haas (Philadelphia, PA)
and used as received.
2.2.2 Metalloorganic precursor synthesis
2.2.2.1 Alumatrane, N(CH2CH2O)3Al
Alumatrane was prepared by adding 1200 g (5.0 mol) aluminum tri-(sec-butoxide)
[C2H5CH(CH3)O]3Al 97% (Chattem Chemical) dropwise through an addition funnel into
a 5 L mechanically stirred four-necked flask equipped with a standard distillation head
under N2 (the necks are connected respectively to the addition funnel, the distillation
head, the mechanical stirrer and the nitrogen line/exhaust) containing 745 g (5.0 mol)
triethanolamine (HOCH2CH2)3N 98% (Aldrich) and ≈ 1 L of ethanol; to reduce the
viscosity of the triethanolamine. After complete addition of the aluminum tri-(sec-
butoxide), the by-product (sec-butanol) and ethanol solvent were distilled off until a
viscous yellow solution was obtained. The resulting solution was analyzed by TGA for
ceramic content. The ceramic yield was confirmed by thermogravimetric analysis,
typically 8-10 wt% Al2O3.
2.2.2.2 Yttrium methoxyacetate, Y(O2CCH2COCH3)3 Anhydrous YCl3 (25.0 g, 0.0825 mole) was introduced to a 250 mL two-necked flask
equipped with a magnetic stir bar and reflux condenser under N2. Methoxyacetic acid
(CH3COCH2CO2H, 50mL, 0.65 mole) was then added via syringe and the solution was
heated for 2 h to the boiling point of methoxyacetic acid (135°C) during which time
byproduct HCl (g) was vented to a hood. After reaction was complete (≈ 2 h), the
solution was cooled, filtered and additional methoxyacetic acid added to produce a 50 mL
solution with a TGA ceramic yield of 37 wt. %. The exact product formed was not
determined but is assumed to be similar to the propionate below.
2.2.2.3 Yttrium propionate, Y(O2CCH2CH3)2OH
Y(NO3)3.6H2O powder (50.0 g, 0.1306 mole) was placed in a 500 mL three-necked
flask equipped with a still head, addition funnel, under a flow of N2 sparged directly into
23

the liquid via a fritted glass tube. The N2 flow also serves the function of stirring the
solution. Propionic acid (250 mL, 3.40 moles) was added rapidly and the resulting
solution heated to the boiling point of propionic acid (145°C) for 6 h to distill off ~150
mL of liquid (water/propionic acid) and release NOx gas. A pH-meter probe was placed
in a water bubbler above the distillation pot, to monitor release of NOx. The pH decreases
from 8 to 3.5 during the reaction. When the reaction no longer releases any detectable
NOx (small quantities of NOx in propionic acid give a orange/red hue to the solution), the
solution is then cooled for one hour under N2.
The solution is then tested (to confirm the presence of yttrium propionate) by adding
0.5 ml of the solution to 25 mL of ethanol and 1 gram of aluminum acetylacetonate
(Al(CH2COCH=CO)CH3)3, insoluble in ethanol): yttrium propionate
(Y(CH3CH2COO)2OH) complexes with the aluminum acetylacetonate, as discussed in
Chapter three and the test-solution becomes clear after 5 second of manual stirring (the
complex formed being soluble in ethanol), confirming the presence of yttrium
propionate.yp
50 mL of THF is added to precipitate the product. The precipitated product is washed
with another 50 mL of THF and dried in flowing nitrogen for 30 min and then vacuum
for 4 h. The dry product was characterized as discussed in Chapter three, and identified
as Y(O2CEt)2OH.
2.2.2.4 Chromium propionate, Cr(O2CC2H5)3
Cr(NO3)3.6H2O powder (100 g, 0.29 mole) was placed in a 1000 mL three-necked
flask equipped with a still head, addition funnel, under a flow of N2 sparged directly into
the liquid via a fritted glass tube. Propionic acid (500 mL, 6.8 moles) was added rapidly
and the resulting solution heated to the boiling point of propionic acid (145°C) for 12 h to
distill off ~250 mL of liquid (water/propionic acid) and release NOx gas. The solution is
then placed in a rotary evaporator until all solvents are evaporated leaving a dry red solid.
The precursor was identified by TGA-DTA: After evaporation of residual solvent, two
mass losses are observed. The first one is attributed to the reaction:
Cr(O2CEt)3 Cr(OH)3 + 3CH3CH=C=O
The calculated mass loss is 62.0% (observed mass loss is 62.3%)
24

The second mass loss is attributed to
Cr(OH)3 0.5 Cr2O3 + 1.5 H2O
The calculated mass loss is 12.9% (observed mass loss is 12.7%).
2.2.2.5 Neodymium propionate, Cr(O2CC2H5)3
Nd(NO3)3.6H2O powder (50 g, 0.11 mole) was placed in a 500 mL three-necked flask
equipped with a still head, addition funnel, under a flow of N2 sparged directly into the
liquid via a fritted glass tube. Propionic acid (250 mL, 3.40 moles) was added rapidly and
the resulting solution heated to the boiling point of propionic acid (145°C) for 8 h to
distill off ~150 mL of liquid (water/propionic acid) and release NOx gas. The solution is
then placed in a rotary evaporator until all solvents are evaporated leaving a dry purple
solid. The precursor was identified by TGA-DTA: After evaporation of residual solvent,
two mass losses are observed. The first one is attributed to the reaction:
Nd(O2CEt)3 Nd(OH)3 + 3CH3CH=C=O
The calculated mass loss is 46.3% (observed mass loss is 46.2%)
The second mass loss is attributed to
Nd(OH)3 0.5 Nd2O3 + 1.5 H2O
The calculated mass loss is 9.6% (observed mass loss is 9.6%).
2.3 General processes
This section describes the LF-FSP and SF-FSP process used in this thesis as well as
the techniques used to process the nanopowders obtained.
2.3.1 Liquid-feed and suspension-feed FSP
The apparatus used for LF-FSP and SF-FSP consists of an aerosol generator, a
combustion chamber and an electrostatic powder collection system.
The aerosol generator consists of a pump injecting the solution/suspension in a
Bernoulli mist nozzle, with oxygen used as the aerosol gas
Two methane/oxygen pilot torches ignite the aerosol formed by the nozzle in the
quartz combustion chamber. The chamber can have two air intakes located at the pilot
torches and/or 1 meter from them. Combustion produces temperatures >1500°C which
25

can be adjusted by the solution/oxygen ratio, the pumping rate, the air intakes and the
precursors in solution/suspension.
The nanosized oxide powders resulting from the combustion are collected in
aluminum electrostatic precipitators (ESP, kept at 10 kV potential and air cooled)
connected to the combustion chamber by quartz connectors. The production rate was
typically ~50 g/h (range of 10-200 g/h).
2.3.2 Heat treatments
Heat treatments in air were conducted in a Lindberg/Blue box furnace (Model No.
58114, Watertown WI, controlled by a Eurotherm microprocessor, model No. 818P,
Northing, England). Heat treatment under controlled atmospheres were done using a
Lindberg 55322 tube furnace (using a quartz tube) for dry air/oxygen/nitrogen up to
1200°C or a Thermolyne 54500 tube furnace (using a 99% dense alumina tube) up to
1500°C or under vacuum/hydrogen-nitrogen. Pressure was kept at 15 psi for controlled
atmosphere. Heating rates and specific dwelling times are described in their respective
chapters.
2.3.3 General formation of green compacts
Nanopowders (5g per batch) were dispersed in 250 mL of acetone/water solution
(10/90 volume ratio) using a 12.57 mm ultrasonic horn (Sonics and Materials 600 VCX,
Newtown, CT) for 50 min in a Teflon beaker (cycle of 10 minute at 10% power, 20
minute at 40%, 10 minute at 25%, 10 min at 40%). Pre-dissolved surfactants (2 wt%
bicine or 2 wt% stearic acid in water) were added if needed as described in Chapters four
and five. The suspension was left idle for 8 h to settle any large particles. The dispersed
powders were dried at 100°C overnight and ground. The powders were then sieved using
a 200-mesh nylon sieve and re-dispersed in either ethanol/acetone or water/acetone with
pre-dissolved binders (PVA, PEG, PMA) as described in Chapters four and five. They
were than dried at 70-100°C for 12-48 h, ground in an alumina mortar and pestle and
sieved with a 400-mesh nylon sieve.
26

The modified powders were then pressed (100-170 MPa) in a 12.57 mm dual
action tungsten carbide coated die before being pressed (250-350 MPa) in an isostatic
press (Autoclave Engineers, Erie PA).
2.4 Analytical methods
This section describes the various analysis techniques used to analyze the
nanopowders obtained by LF-FSP/SF-FSP, the green bodies and sintered monoliths made
from these nanopowders.
2.4.1Thermal gravimetric analysis-differential thermal analysis (TGA-DTA)
TGA-DTA was performed on a SDT 2960 simultaneous DTA-TGA (TA instrument,
Inc., New Castle, DE). The instrument was calibrated with gold supplied by Perkin-
Elmer. Measurements were performed under a continuous flow of air (60 mL/min).
Samples (100 mg) were heated at 10°C/min to 1400°C and then allowed to cool to
ambient at 20°C/min. If needed additional runs were made using a ramp rate of 10°C/min
to 850°C and then 1°, 2° or 5°C/min to 1200°C to determine activation energies of the
exothermic reactions observed.
2.4.2 X-ray diffraction analysis (XRD)
XRD was performed on a Rigaku Rotating Anode Goniometer (Rigaku Denki Co.,
LTD., Tokyo, Japan). The powders were packed on a glass specimen holder. XRD scans
were made from 10° to 60° 2θ, using a scan rate of 1-2°/min in 0.05° increments and
CuKα radiation (1.542 A°) operating at 40 kV and 100 mA. The Jade program (version
3.1 and 7.0 from Materials Data, Inc, Livermore, CA) was used to identify the
crystallographic phases and to determine the relative phase compositions.
For this latter part, we first used the phase analysis integrated function of the Jade
program, then used a simulation function to confirm the results. The size of the particles
is an important parameter for this simulation and was chosen as the mean average size
given by the surface area analysis. The particle size was then adjusted until the simulated
pattern matched the XRD pattern. X-ray broadening was also used to confirm the size
obtained by surface area analysis and simulation.
27

2.4.3 Diffuse reflectance FTIR spectra (DRIFTs)
DRIFTs were recorded on a Galaxy series 3000 FTIR (Mattson Instruments, Inc,
Madison, WI). Each sample consisted of 500 mg of single crystal KBr first ground in an
alumina mortar and then mixed with 5 mg of nanopowder and ground again. A new
reference sample (500 mg ground KBr) was made every 5 samples. The system was
flushed with nitrogen for 15 min before each analysis to remove atmospheric CO2. Each
analysis consisted of a minimum of 64 scans and the resolution was ± 4 cm-1.
2.4.4 Surface analyses
Specific surface area analyses were conducted at 77K using a Micromeritics ASAP
2000 (Norcross, GA), with N2 as the adsorbate gas. Samples were degassed at 400°C
until the outgas rate was 5 mm Hg/min. The specific surface areas were calculated using
the BET multipoint method with a minimum of 5 data points. The particle average size
(APS) was derived from the equation 4 ( <R> is the average particle diameter, ρ is the
density and ssa is the specific surface area obtained from the BET method):
< R >=6
ρ × ssa (4)
2.4.5 Scanning electron microscopy (SEM)
Micrographs were taken using a XL30 SEM (Phillips) or a Nova Nanolab dualbeam
focused ion beam workstation and scanning electron microscope (FEI, Hillsoboron
Oregon). Powder samples were dispersed in distilled water using an ultrasonic horn
(Vibra-cell, Sonics and Materials, Inc., Newton, CT). Drops of the dispersed materials
were deposited on an aluminum SEM stub and dried for 3 h on a hot plate. Ceramic
monolith samples where either cracked or cut and polished, then thermally etched at
1200°C in air. All samples were then coated with a gold/palladium coating by sputtering
for 1-2 min, using a Technics Hummer VI sputtering system (Anatech, Ltd.,
Alexandria,VA).
28

2.4.6 Transmission electron microscopy
Micrographs were taken on a JEOL 2100 XL (JEOL, Tokyo Japan). Samples were
prepared using a carbon coated copper TEM grid (300 mesh). The powder was dispersed
in distilled water using an ultrasonic horn, as above, and then a drop of the dispersed
powder/water mixture was deposited on the grid. The grid was then dried for 4 h at 80oC.
The JEOL 2100 XL was used with an accelerating voltage of 200 kV.
2.4.7 Sintering curves
Constant heating rate sintering curves were obtained using a Dilatronics 6548 (theta,
Port Washington, NY) operating under 10 psi (oxygen, nitrogen or air) or under vacuum.
Samples consisted of sections of the green bodies (after binder burnout as described in
chapter four and five) and heating rates were 1-20°C/min.
29

Chapter 3: Yttrium aluminum garnet nanopowders produced by liquid-feed flame spray pyrolysis (LF-FSP) of metalloorganic
precursors.
3.1 Introduction
We report here the synthesis of yttrium-aluminum garnet oxide (Y3Al5O12) nanopowders
by liquid-feed flame spray pyrolysis (LF-FSP) of combinations of yttrium and aluminum
precursors dissolved in EtOH, nBuOH and/or THF. These include solutions of: yttrium
and aluminum nitrates in EtOH or nBuOH; yttrium 2-ethylhexanoate and alumatrane
[N(CH2CH2O)3Al] in THF or EtOH; yttrium methoxyacetate and alumatrane in EtOH;
yttrium acetylacetonate and alumatrane in EtOH, and yttrium propionate and aluminum
acetylacetonate, in EtOH or THF. Each precursor system was aerosolized using oxygen
and subsequently ignited. Following combustion, the resulting powders were collected by
electrostatic precipitation at rates of 50 g/h.
Surprisingly, the precursor choice strongly influences both the initial phase
composition and morphology of the LF-FSP powder, as well as the phase changes that
occur during annealing. As-collected LF-FSP nanopowders (≤100 nm ave. particle size)
had the YAG composition of the precursor feed; but XRD shows what initially appears as
a mixture of hexagonal YAlO3 (I) and Y4Al2O9 (YAM). Since such a phase mixture
cannot account for all the alumina in the powder, the remaining alumina would be
anticipated to be present either as nanosegregated amorphous alumina or in defect
structures. However, the most homogeneous powders exhibit FTIR, TGA/DTA, TEM
and XRD data that suggest a new phase with a modified YAlO3 (I) crystal structure and a
YAG composition. Annealing studies demonstrated that at 900-1000°C (7-10 d) these
powders transform without coincident grain growth or necking to free-flowing YAG
phase powders. The activation energy for this phase transition was found to be ≈100
kJ/mol, much lower than most reported values.1
30
YAG (Y3Al5O12) materials in various forms have proven useful for many diverse
applications. For example, Ce3+ doped YAG is a phosphor used for fast response
scanners and scintillators.2-5 YAG phosphors have also been well studied because of their
stability in electron beams.6 YAG single crystals grown from the melt are used for laser
applications.7 Polycrystalline YAG exhibits extremely low creep, and melts at ~1900°C,
making it an excellent material for high temperature structural applications.
YAG nanopowders offer the potential to carefully control the final grain structure in
dense polycrystalline YAG8 used for structural applications, while nanosized spherical
particles offer potential for higher definition and brightness in phosphor applications.3
Sintered micron-sized YAG powders provide efficient, transparent, polycrystalline YAG
lasers as well.9 In addition, a wide variety of nanopowders exhibit lasing properties that
differ from micron-sized powders: an emission behavior explained by Anderson
localization of light and now reported by several groups.10-12,14 Hence there is significant
motivation to develop methods of preparing large-scale quantities of high quality YAG
nanopowders.
Many techniques have been used to synthesize YAG nanopowders including
coprecipitation,15 gel entrapment,16 spray pyrolysis17-18 and thermal decomposition of
mixed-metal alkoxides.19 Although YAG is the thermodynamically stable phase;
kinetically favored phases [e.g., hexagonal, orthorhombic or cubic YAlO3 and monoclinic
Y4Al2O9] often form first in these processes. For example, hexagonal and orthorhombic
YAlO3 are the common kinetic phases formed during gas phase synthesis techniques.
Nyman et al18 studied the influence of precursor on the formation of YAG during spray
pyrolysis, concluding that short reaction times prevent the formation of the YAG phase
(they obtained Y2O3 and hexagonal YAlO3). In earlier work from these laboratories,
Baranwal et al were able to use LF-FSP of metalloorganics to produce YAG composition
(YAlO3/Al2O3) nanopowders.20 However, efforts to transform these YAlO3/Al2O3
nanopowders to pure YAG phase by heating led to extensive particle necking followed
by excessive grain growth.
We report here the successful synthesis of YAG composition nanopowders that
readily transform to YAG phase without necking or particle growth. We further report on
31

the surprising effects of changes in precursor chemistry on the properties of FSP derived
powders.
3.2 Experimental Section
Additional information can be found in Chapter 2
Yttrium proprionate (Precursor 6 and 7).
The dry product described in chapter 3 was characterized as discussed below. The 1H
NMR data for the resulting material is listed in Table 3.1. The peaks at 4.8 and 3.1 ppm
can be attributed to trace amounts of methanol solvent used in the precipitate synthesis.
Peaks attributed to THF of crystallization are found at 3.52 and 1.66 pm. The peaks at
2.05 and 0.89 ppm correspond to the CH2 and CH3 groups of the propionate ligand. Note
that the integration ratio of the peaks attributed to THF:peaks attributed to the proprionate
was constant in four different samples suggesting that the compound forms a stable THF
solvate, as discussed below in more detail.
32

3.3 Results
As noted above, the goal of this work is to produce unaggregated, single crystal,
phase pure, dispersible, YAG nanopowders using the LF-FSP process. We recently
learned that despite the fact that the LF-FSP flame temperatures range from 1500° to
2000°C, the choice of precursor seems to make a considerable difference in the quality of
the powder produced both in terms of phase and particle morphology.13,22,23 As a
consequence, especially because of our previous failure to make high quality YAG
nanopowders, we revisited these materials, the types of precursors used, and can now
report success.
In recent studies on LF-FSP processing of high quality alumina powders, we
determined that metal nitrates although relatively inexpensive are actually very poor
precursors for FSP processing since they tend to form larger (200-2000 nm) hollow
particles, whereas alumatrane (NCH2CH2O)3Al provides access to very high quality
powders.13 Based on these results, and our previous experience in making spinnable YAG
precursors,37 we selected a series of possible FSP precursors and precursor formulations,
including the nitrates listed in Table 3.2. We then used these seven precursors to produce
nine different powder samples, which we analyzed using various analytical tools (BET,
SEM, XRD, FTIR, TGA-DTA), to determine the optimal precursor in terms of powder
size, morphology and ease of conversion via annealing to dispersible YAG nanopowders.
We also obtained a commercial sample of YAG precursor powder from Tal Materials
Inc. Our discussions begin with the precursor materials.
3.3.1 Precursor formulations
The seven different precursor systems used are those listed in Table 3.2. Previously,
our understanding of the FSP process was such that we assumed that precursor chemistry
would not make a difference in the type of nanopowders produced, given the high flame
temperatures, which were assumed to convert any precursor compounds to ions, simple
oxide molecules or clusters.20,22,23 However, as noted above, this proved not to be the
case.
Consequently, we began studies to elucidate the various chemistry issues with
coincident goals of producing optimal mixed-metal oxide nanopowders using LF-FSP
processing. As shown below, the yttrium proprionate based YAG precursor systems offer
33

the best nanopowders produced to date. Hence, we begin by describing the nature of this
yttrium precursor system.
Yttrium propionate
Yttrium propionate was prepared from yttrium nitrate using the method described in
the experimental section. The resulting product can be precipitated from reaction
solutions as a white powder upon addition of THF. Following vacuum drying, FTIR of
the dry powder shows a strong ν-OH peak at 3370 cm-1. Two broad peaks observed at
1500 and 1290 cm-1 correspond to νC-O bands of bound carboxylate groups. The FTIR
suggests the presence of at least one hydroxyl group on the yttrium. 1H NMR (see experimental) studies confirm the presence of the propionate groups but
no OH proton, which is expected because of rapid exchange with the deuterated solvent.
Surprisingly, 1H NMR reveals the presence of THF solvent molecules in a ≈ 2:3
THF:yttrium propionate ratio. This ratio was constant in four different batches of the
powder. The presence of THF solvate is further supported by the TGA results.
TGA studies were conducted to identify the decomposition patterns for comparison
with our previous work.25,37 In the TGA (Figure 3.1), a mass loss of ≈ 16 wt. % is
observed beginning at ≈ 100°C (10 °C/min/air) and is assumed to be loss of THF of
crystallization.
After loss of the solvate molecules, a further mass loss is observed (≈ 175°C, Figure
3.1) of 39 wt %. If we ignore the solvent loss for the moment, then the actual ceramic
yield at this point is 53.2 %. On further heating, a slower mass loss of 17 wt. % is
observed that appears to continue to ≈ 700°C. The final ceramic yield, disregarding
solvent loss is 43.7 wt. %.
Based on these numbers and our previous studies,25,37 several model compounds can
be suggested for the actual structure of the yttrium propionate, as shown in Figure 3.2.
The corresponding ceramic yields are also given.
Based on the FTIR data and the ceramic yield data, model “a,” Y(O2CEt)2OH,
appears to be the correct choice. Further support for this model comes from the
following.
If we assume that the precursor is actually Y(O2CEt)2)OH (F.W. = 252.006) and
THF is present in a 2:3 ratio, then it is possible to calculate that the expected solvent loss
34

will be 16.1 wt. %. We observe a value of 16.1 wt. %. We can then suggest that the
175°C mass loss arises from thermal fragmentation of the carboxylates with loss of
ketene based on our earlier studies of metal carboxylate decomposition patterns, and as
shown below:25,37
Y(O2CEt)2OH Y(OH)3 + 2CH3CH=C=O (1)
The expected mass loss is then 43.7 wt % which is exactly that found. The final ≈ 17.0
wt% mass loss can be attributed to loss of the hydroxyl groups, reaction (2), which is
calculated to be 19 %.
Y(OH)3 0.5 Y2O3 + 1.5 H2O (2)
The fact that there are two THF molecules:three yttriums, suggests a trimeric species has
formed.
The precursors listed in Table 3.2, were combusted under conditions very similar to
those described in earlier work20,22 and as described in Chapter 3. Typically, 43 wt %
(37.5 mol%) alumina as precursor and 57 wt % (62.5 mol%) yttria as precursor were
dissolved in the chosen solvent and aerosolized at rates that led to production of ≈ 50 g/h
of powder. The pressure in the aerosol generator was kept at 20 psi. Two methane torches
were used to ignite the aerosol.
Although most precursor systems remain soluble for indefinite periods of time;
precursor 7 was difficult to work with because of the poor solubility of Al(acac)3 in THF,
leading to off-stoichiometries as discussed below. An eighth and ninth sample were
prepared using precursor 6 and by increasing the flow speed (as well as improving the
regularity of the flow) in the process. These two samples had much smaller particle sizes
and correspondingly higher surface areas.
3.3.2 Powder characterization
Given that our goal is to produce high quality YAG nanopowders in terms of particles
sizes, surface chemistry, morphology, and phase composition, we begin by discussing
powder surface areas and then powder morphology for the nine samples. We first discuss
the specific surface areas (SSAs) obtained by porosimetry. The goal is to identify the
precursor that produces the highest surface area materials without microporosity as this
will provide a first estimate of particle size. FTIR and XRD were then used to analyze the
surface chemistry, phases present and also as a second indirect method of determining
35

particle sizes. SEM micrographs were also obtained as a direct method of examining
particle sizes and size distributions. This was done primarily to observe the general
population especially with respect to larger particles. TEM images were also obtained. As
XRD studies showed that YAG phase is not formed directly by FSP, we then conducted
TGA-DTA studies to learn which samples convert most easily to YAG phase. These
studies provide the basis for determining optimum annealing conditions for conversion to
the YAG phase.
3.3.2.1 Surface area analyses.
Mean particle sizes determined from the specific surface areas24 and x-ray line
broadening are shown in Table 3.3. As seen, the SSAs show a strong dependence on the
precursor used and to a lesser extent, on the solvent used. X-ray line broadening studies
show very similar results, apart from Sample 2, which consists of a mixture of 30 nm and
polycrystalline 200-2000 nm particles.
As expected13,20,26,28 the nitrate based precursors (Samples 1 and 2) gave low surface
area powders. However, precursors that are expected to have significant vapor pressurs,27
such as the yttrium and aluminum acetylacetonates, and alumatrane permit better mixing
and burning conditions,13 and thus produce finer powders. Hence, FSP powders obtained
from precursors 3, 4, 6, and 7 have similar higher SSAs and smaller apparent particle
sizes. Note that without the propionate precursor, the acetylacetonates are highly
insoluble, suggesting the formation of a mixed-metal precursor in solution.
3.3.2.2 Scanning electron microscopy (SEM)
SEM was used to assess the particle size distribution for the various FSP produced
nanopowders. Micrographs show that the particles exhibit spherical morphologies. SEMs
of the nitrate-based precursors show large and sometimes hollow particles ranging from
200 nm to 2 μm, Figure 3.3,13,26 however a significant portion of particles have sizes
<100 nm. This suggests that two separate mechanisms contribute to the generation of the
nitrate-derived powders. One is premature decomposition common for spray pyrolysis of
nitrates.26 In this process, the nitrates partially melt and then decompose rather than
combust on heat up just after exiting the spray nozzle. This produces hollow, large
36

particles typical of spray pyrolysis rather than the fine particles typical of combustion.
The second process likely results from straightforward combustion of the spray droplet
without melting. These processes may be a consequence of where the droplets are in the
cone of mist that exits the nozzle.
In contrast to the nitrate products, Precursors 3, 4 and 6 produce very regular
particles. As illustrated for Sample 6 in Figure 3.4, almost all the particles are 20-50 nm
in diameter, as might be anticipated from the SSA and XRD line broadening studies.
Samples 8 and 9 consisted of particles in the 5-100 nm range, with most particles in the
5-25 nm range.
3.3.2.3 Thermal analyses (TGA)
TGAs were performed to determine the quantity of various surface species on the
powders, water in particular. Sample 1 TGA differs from all the other samples giving a
ceramic yield of 99.8 wt. % at 1400°C, which indicates an absence of contaminating
surfaces species, as confirmed by FTIR (see below). This observation is surely a
consequence of the large average particle sizes, which equates to relatively low SSAs.
Sample 2, with a similar SSA behaves differently since significant portions of its particles
are much smaller (<30 nm).
All samples, apart from 1 and 6 show mass losses of 1-2 wt. % below 200°C, which
can be attributed to water loss (confirmed by FTIR, see below). Samples 7 and 8 exhibit a
mass loss of 3-4 wt % at 200°C, indicating a higher proportion of surface species, as
expected for the higher surface areas. Although, Samples 6 and 7 have exactly identical
surface areas, they do not show similar mass losses. An explanation is that the surface
chemistries are different, one favoring formation of chemi- and physisorbed water and
the other not. This implies that the atomic mixing is different between Samples 6-9. As
such, FTIR of these four samples should show some important differences, especially
with respect to the OH peaks.
Sample 5 shows two additional mass losses at 450°C (0.36 wt%) and at 800°C (0.52
wt%). As discussed below, this can be linked to the presence of surface carbonaceous
species.
37

3.3.2.4 FTIR (DRIFT mode)
FTIR was used both to identify surfaces species present on sample surfaces and to
observe the phases present. Y3Al5O12, YAlO3 (I), δ:θ-Al2O3 and Y2O3 all present very
specific FTIR spectra, mostly in the 400-1000 cm-1 range.29-35 As relatively few studies
have been made of the FTIR spectra of the other phases in the Y2O3-Al2O3 system, we
decided to compare our samples to reference powders also prepared using FSP.
FTIR reference materials
Yttria powders were prepared by FSP using yttrium proprionate in EtOH (solution
ceramic yield, 5 wt%). The XRD powder patterns for these materials indicate formation
of a 30/70 mixture of monoclinic and cubic Y2O3 (ratio determined by Jade program as
described in chapter 3). We also synthesized δ:θ-Al2O3 by FSP using an alumatrane
solution in EtOH (solution ceramic yield, 5 wt %).13 Commercial samples of amorphous
aluminum hydroxide [Al(OH)3] powder were also used as a reference. A YAG reference
material was obtained by heating Sample 6 at 1200oC/30 min/air. A reference YAP
sample was also prepared using a 1:1 yttrium methoxyacetate:Al(Acac)3 EtOH solution.
XRD was used to confirm the phase. Scans of LF-FSP samples are showned in Figures
3.6, 3.7, 3.9, and 3.10. A commercial YAG composition nanopowder from Tal Materials
Inc. (TM) is included in Figures 3.7, 3.10.
Spectra for the various samples, YAG, as-shot yttria, YAlO3 (I) crystallized by
heating at 900oC, δ:θ- and amorphous alumina are presented in Figures 3.5 and 3.8. Most
peaks observed in these spectra are common to all samples and can be related to those
observed in the reference materials.
Broad peaks between 3800 and 3200 cm-1 can be assigned to O-H stretching
vibrations (νOH) indicative of the presence of surface hydroxyl groups arising from both
physi- and chemisorbed water, per the work of Peri,31,32 on alumina surfaces. Bands in
the 3500 to 3200 cm-1 range are attributed to νOH from physisorbed water, while those in
the 3800-3600 cm-1 range derive from isolated hydroxyl groups.
YAG, δ:θ-alumina13 and amorphous alumina exhibit similar peaks in this range,
showing both types of hydroxyls groups. The YAlO3 (I) sample also shows the same two
peaks, but their relative intensities are different. It appears from the νOH band pattern
that more physisorbed than chemisorbed water is present on the surface. It should also be
38

noted that hydroxyl peaks in the yttria sample are very weak, while the surface area of
this sample is similar to other samples (all reference samples have average particle sizes
of 20-50 nm, except the amorphous alumina which consists of micron sized particles and
the Tal Materials Inc. sample which has an 80 nm average particle size).
Apart from Sample 1, where no surface species are seen (as expected from its TGA,
see Table 3.4), all samples exhibit typical νOH peaks. Sample 7 exhibits a third water
peak centered at 3800 cm-1, which may arise from isolated alumina specific νOH sites per
Lee and Condrate.33
As noted above, the TGA studies suggest that samples 6 and 7 have different surface
chemistries based on their different mass losses in the region where chemi- and
physisorbed water come off. The DRIFTS data support this and suggest some
nanosegregation within Sample 7 particles or at least at their surfaces, which is likely
solvent dependent since the precursors are the same. Thus in addition to precursor effects,
solvents also seem to play a role in product formation. The role could take the form of
solvation of mixed-metal complexes that form as intermediates or in the flame
temperature. Since we note above that Al(Acac)3 is not particularly soluble in THF, we
suspect that this is at least partially the reason for the difference in surface chemistries: as
discussed above yttrium proprionate appears to form a trimeric species with THF of
crystallization. The isolated compound does not react with Al(Acac)3 to form the putative
“yttrium proprionate/aluminum acetylacetonate complex.” Alternately, it may be that the
particles are off-stoichiometry based on the poor solubility. Because THF has a higher
fuel value than ethanol, flame temperatures should not be an issue, THF’s higher
temperatures are likely to favor formation of YAG phase-see above. The fuel value of
THF is 2533 kJ/mol41 while ethanol has a fuel value of 1366 kJ/mol.42
The peaks observed in our samples and the reference materials, in the 1560-1600 cm-1
and 1320-1380 cm-1 regions, are typically assigned to asymmetric and symmetric νC-O
bands in carbonate (CO3-) species,33,35 respectively. Given that all our samples are
produced in a flame; have small average particle sizes and therefore high surface areas,
they can be expected to absorb CO2 to form carbonate species. The one exception is
Sample 1, which has a much larger average particle size and much lower surface area (6
39

m2/g) compared to the other samples (>20 m2/g). Hence CO2 pickup should be limited, as
observed.
For all of the Samples, the peaks below 1000 cm-1 are unexceptional, except for the
peak at 740 cm-1 in most samples. This peak is usually assigned to asymmetric νAl-O in
isolated AlO4 tetrahedra or combinatorial vibrations between AlOx tetrahedra or
pentahedra and AlO6 octahedra as discussed by Saniger34 and Tarte.35 As such, this peak
is not observed in δ:θ-alumina,13 Al(OH)3, nor in the YAP reference (made with a 1:1
Y/Al ratio). In the Y2O3-Al2O3 system, this peak might be expected if excess Al3+ (Y:Al
ratio <1) substitutes for Y3+ in the YAlO3 (I) phase. It is also observed in the YAG
phase29,30 where all Al3+ ions are located in isolated AlO4 tetrahedra and AlO6 octahedra.
As such this peak is observed in the reference YAG sample as expected. However based
on the characteristic YAG peaks (see Table 3.5), these materials are not YAG.
The 740 cm-1 peak is observed in Samples 5, 6, 8, 9 and the Tal Materials (TM)
sample and to a lesser extent in Samples 1 and 7. Note that although sample 4 gives good
particle sizes this peak is absent, suggesting different mixing at the nanoscale. This type
of intimate mixing at the very least has important implications vis a vis YAG phase
crystallization activation energies and temperatures as discussed below. This will be
discussed further in Chapter four as indicative of a new Y3Al5O12 phase.
3.3.2.5 XRD analyses
Figures 3.11 and 3.12 provide XRD data for the as-processed samples. The YAG
phase from an annealed sample (see below) and pure YAlO3 (I) phase are shown at the
bottom to illustrate the differences. As expected from our earlier work,20 none of the
precursors provide YAG phase in the as-processed FSP powders. Among the known
crystalline phase in the Y2O3-Al2O3 system only a mixture of YAlO3 (I) and some YAM
phase seem to match the XRD pattern observed. Close examination reveals that the match
is far from perfect which will be discussed in much more detail in chapter four as it
indicates a new crystalline phase.
It should be noted that Sample 1 was mostly amorphous. Differences in flame
temperature and in cooling rates, due to differences in the combustion of the various
precursors could explain the phase variation between samples, but further studies of
flame temperature effects must be made to fully understand this phenomenon. In
40

addition, despite the differences in the FTIR for Samples 6 and 7, their XRDs show
essentially identical powders.
Kriven et al1 have reviewed the effects of temperature on YAG crystallization in
variously processed YAG composition powders. They found that the temperature
determined which intermediate phase would form on crystallization of YAG. This could
partially explain the influence of flame temperature and cooling rate on the phase
distribution seen here.
YAlO3 and Y4Al2O9 are aluminum deficient compared to the 3:5 Y:Al ratio of the
precursors used to produce Samples 1-9 and TM. Thus, around half of the Al3+ ions must
be present in an amorphous phase or are in defect structures wherein Al3+ for Y3+
substitution occurs in the YAlO3 (I) phase as discussed above.
The above FTIR interpretation suggests that for Samples 5-9 and TM, the latter
hypothesis may be the correct interpretation, as Al3+ ions appear to be present in defect
positions. Similar hypotheses were made by Yamaguchi38 and Veitch,39 who both
observed the formation of several YAlO3 phases as intermediary to YAG formation in
differently processed YAG composition powders and explained the placement of the
excess Al3+ by either defects38 or amorphous phases.39 Intermediate YAlO3 phases were
also observed by Hess et al40 who studied the crystallization of YAG from amorphous
powders. They suggest that low temperature reactions could allow the direct formation of
YAG, as earlier work in our group37 also indicates, while higher temperatures would
result in the formation of intermediate YAlO3. The question of placement of the excess
Al3+ remains unresolved. Quick calculations from the XRD patterns suggest that in all
samples ≈ 50% of the Al3+ is unaccounted for. Based on stochiometry one would expect
an amorphous hump to be easily observed in the XRD if these Al3+ were in an amorphous
phase. The absence of an amorphous hump in all samples but Sample 1 makes the
presence of an amorphous phase dubious and again suggests the excess Al3+ is present in
a regular defect structure.
Given that that the XRD 2θ values for the peaks mostly correspond to the YAlO3 (I)
phase, but not to the peak intensities [e.g. in particular the (002) peak is only a fraction of
its theoretical intensity] we sought to identify a peak associated with the defect structure.
Thus, further XRD studies were done at lower angles. Figure 3.13 reveals the presence at
41

8.3-8.5 °2θ peaks in Samples 5, 6, 8, 9 and the TM commercial sample, but not in Sample
4 as might be expected from the absence of the 740 cm-1 peak in the FTIR. Also
important is that YAG samples (obtained from sample 5 and 6 after annealing at
1200oC/30min) don’t show this peak. This is despite the fact that a peak in this range
should correspond to a lattice parameter of ≈ 1.1 nm, close to the unit cell dimensions for
crystalline YAG and close to the (001) interplanar distance of YAlO3 (I). Authentic
samples of YAlO3 (I) do not exhibit this peak because of the equivalence between (002)
and (001) planes. While qualitatively, samples with finer particle sizes (6, 8, 9) show
much stronger peaks in this region, the TM sample also exhibits a strong peak despite the
larger particle size.
3.3.2.6 Transmission electron microscopy (TEM)
TEM studies were performed to examine particle morphology. Almost all particles
are below 100 nm with most in the 10-50 nm range, as expected from Table 3.3. Figure
3.14 gives a representative image.
3.3.2.6 Annealing
Given that our goal is free flowing, high quality YAG phase nanopowders and given
that none of the as-processed powders were YAG phase by XRD, we resorted to
annealing to effect conversion to the YAG phase without necking. To determine the
optimum annealing temperature and duration, DTA studies were first run as shown in
Figure 3.15.
Most samples exhibited several exotherms. To identify the various processes
associated with these exotherms, samples were heated to just beyond the exotherm
temperature (at the same heating rate of 10°C/min), cooled (-10°C/min) and then
analyzed by XRD.
All precursor-derived powders except Samples 5, 6, 8 and 9 show two exotherms, the
first exotherm is actually two nearly coincidental peaks which were discerned by running
additional DTAs at lower heating rates (1°C/min). These peaks correspond respectively
to the formation of the YAlO3 (II) and YAM phases as confirmed by XRD (one example
is seen in Figures 3.16).
42

Clearly, the Samples that do not show the 740 cm-1 peak in the FTIR nor the 8.3 °2θ
peak in the XRD do not offer the degree of atomic mixing and homogeneity of the other
materials. This again points to differences in molecular structures in the precursors and
to the formation of different species or poorly mixed species in the gas phase. The
conclusion is that chemistry is very important in the FSP process, as discussed in more
detail below.
Note that the exotherms for Samples 1 and 2 are at higher temperature than for the
other samples. The DTA data for Samples 5, 6 and 9 differ in having only one obvious
exotherm >800°C, the YAlO3 (II) and YAM peaks are very faint and can only be
observed on heating at 1oC/min. Further XRD and DTA analyses showed that these
phases form but at slower rates than with the other precursors. This could be explained by
a regular defect structure (or new intermediate phase) as suggested by the FTIR, XRD
and TEM: the uniform dispersion of Al3+ would favor a direct reaction path to YAG,
which would, for these two samples, have a lower Ea than the YAH path. In this direct
reaction path, the defect (new intermediate phase) structure should lower the Ea, as the
Al3+ ions needs less displacement in transforming from the YAlO3 (I) to the YAG crystal
structure, as discussed below.
Sample 5 also exhibits an exotherm at 450ºC, which likely corresponds to the
elimination of traces of carbonaceous surface species as confirmed by the mass loss
observed in the TGA. It is important to note that the only carbonaceous species seen
above are carbonates as seen in Figures 3.6 and 3.7.
Given that the DTA exotherms for YAG conversion (1100°-1400°C) occur at
temperatures where necking and sintering are anticipated to occur, and based on
annealing studies of nano-mullite powders,22 we explored the use of annealing to promote
phase transformation at 800°-900°C. With the goal of converting the powders to the
YAG phase in a reasonable amount of time, without necking; we determined the
activation energy (Ea) for phase conversion using methods similar to those of Kriven.1
We used the constant heating method, with the modified Kissinger equation to
calculate Ea in Table 3.6 from the shift of the YAG exotherm in the DTA (Tm-T0) with
changes in heating rate (c is a constant, α is the heating rate, Tm is the peak temperature
43

of the exotherm observed on a DTA run at the rate α>5°C/min , T0 is the peak
temperature of the exotherm when the DTA run at the rate of 5°C/min):1
ln( α
Tm − T0
) =1
Tm
×Ea
R+ c
These activation energies provide a reasonable basis for defining the annealing
studies and for choice of the optimum precursor. According to the activation energy
calculations, complete conversion to the YAG phase should occur after annealing at
850°C for 10 d with Sample 6. We were able to confirm complete conversion to YAG
(100% YAG crystalline phase as observed by XRD): 850°C for 10 days with Sample 6.
This temperature is much lower than the usual temperature for YAG formation,15-18 and
allows conversion without necking or particle growth (SSA remains unchanged at 39, 79,
92 m2/g for Samples 6, 8 and 9 respectively and SEM shows no necking).
General comments:
Both DTA and FTIR seem to indicate that samples 5, 6, 8, 9 and TM have better
atomic mixing, which may be explained by the formation of mixed-metal precursor
complexes. We have previously reported that the formation of yttrium:aluminum mixed-
metal precursors allows direct formation of YAG phase without the intermediacy of YAP
or YAM.37 However, it is still unclear how a mixed-metal solution phase precursor might
give a better nanopowder product after combustion.
The simplest explanation is that in the short time before combustion, partial
evaporation of the aerosol droplet occurs that might lead to some segregation or
vaporization in systems where a mixed-metal precursor cannot form.36 If we assume that
this is the case, then it might be reasonable to argue that combustion leads to a vapor
phase were there is an uneven distribution of ions. Due to the rapid quenching that occurs
during FSP, this would lead to uneven condensation of these ions to form the first nuclei,
as we have discussed earlier.23
Finally, the diminution or absence of the 740 cm-1 νAl-O band typical of
combinatorial vibrations in the other samples (e.g. Sample 4) suggests less efficient
mixing during FSP. Less efficient mixing will the regularity of these defects that is
44

indicated by the combinatorial vibration, resulting in the diminution or elimination of this
peak.
A metastable, regular defect structure (or new intermediate phase) seems to be caused
by this efficient mixing, as FTIR indicates the presence in Samples 5, 6, 8, 9 and TM
commercial sample offer a regular defect structure of isolated AlOx, which will be
discussed in greater detail in chapter 5.
Kriven1 conducted similar studies on YAG crystallization from amorphous YAG
composition glass (micron-sized powders) finding an Ea of 427 kJ/mol. In our
experiments Ea was found to be much lower and precursor dependent. This was expected,
as smaller particle sizes will result in lower Ea for phase formation. But particle sizes
alone cannot explain the difference in Ea: in particular Samples 6 and 7 have same
average particle size but different Ea, while Sample 5 has lower Ea despite having higher
average particle size.
The presence of a regular defect structure or new intermediate phase could explain
these differences: A powder with more homogenous mixing of Y3+ and Al3+ ions (shorter
diffusion distances), as this metastable structure will require less energy for conversion to
YAG phase than, for example, powders formed from core-shell type condensation
mechanisms.23,28 It should be noted that the much lower Ea values than any previously
reported,1,40 suggest that diffusion in the phase transformation process is intraparticle and
short-range, as they are much lower than reported for intergranular diffusion in the YAG
phase.
The difference in the DTA analyses can also be explained by a metastable or
intermediate phase structure: Samples 5, 6, 8 and 9 all transform directly to YAG which
may suggest a metastable intermediate phase, while Samples 1-4 seem to follow a YAlO3
(II) route of transformation. In Samples 5, 6, 8 and 9, the regularity of this structure
allows direct transformation to YAG, which can be expected to have a lower Ea than a
transformation process via an additional intermediate phase, ie. YAlO3(II).
45

3.4. Conclusions
Phase pure, dispersible, yttrium aluminum garnet nanopowders are easily synthesized
using liquid-feed flame spray pyrolysis followed by careful annealing (850°C for 7 d) at
lower temperature than usual in processing YAG powders, due to very low activation
energies (≈ 100 kJ/mol). The FSP derived powders can have very high specific surface
areas, up to 90 m2/g. The precursors and to some extent the solvent systems play a critical
role in the formation of YAG nanopowders. The data also suggest the formation of a
novel phase in the as-processed powders. Additional work on this new phase will be
described in Chapter four, including detailed studies on the type of phase/defect structure
formed and the low-temperature sintering of these materials.
46
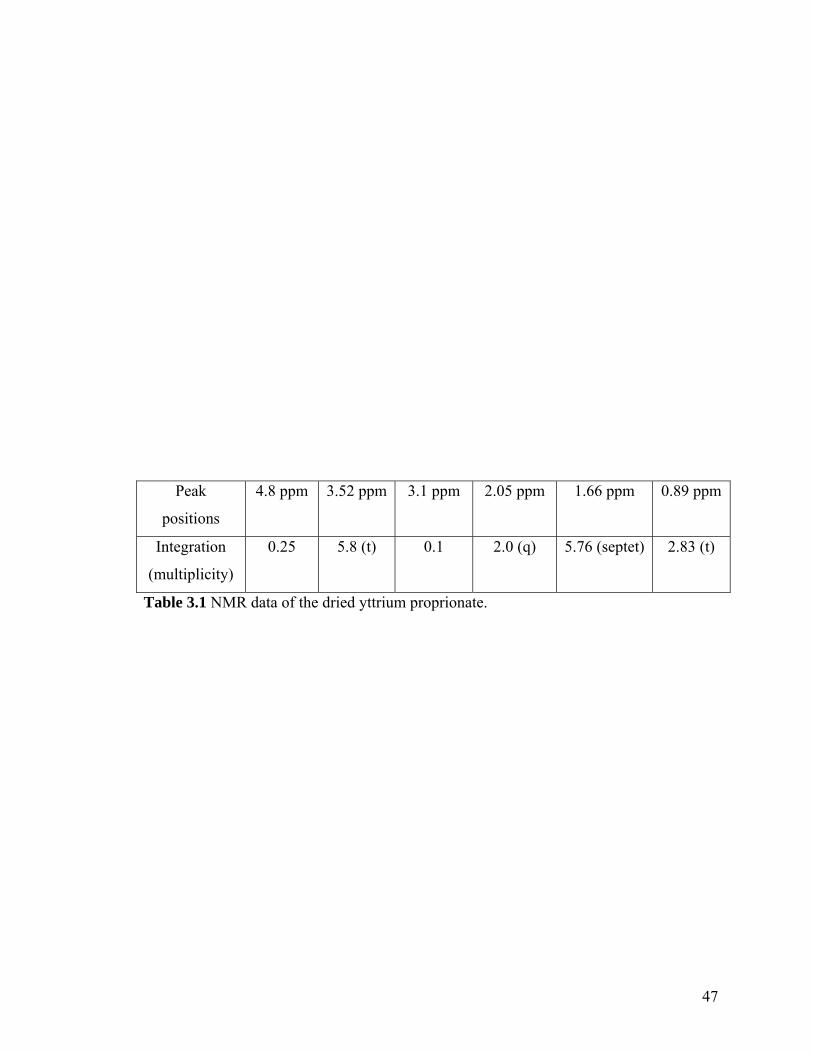
Peak
positions
4.8 ppm 3.52 ppm 3.1 ppm 2.05 ppm 1.66 ppm 0.89 ppm
Integration
(multiplicity)
0.25 5.8 (t) 0.1 2.0 (q) 5.76 (septet) 2.83 (t)
Table 3.1 NMR data of the dried yttrium proprionate.
47

Sample Y source Al source Solvent
Ceramic yield
(wt%)
1 Y(NO3)3.6H20 Al(NO3)3
.9H20 EtOH
2.5
2 Y(NO3)3.6H20 Al(NO3)3
.9H20 BuOH 5
3 Y(O2CCH2OCH3)3 N(CH2CH2O)3Al EtOH
5
4 Y(O2CCHEtC4H9)3 N(CH2CH2O)3Al THF/EtOH 90/10 mol%
2.5
5 Y(O2CCH2OCH3)3 N(CH2CH2O)3Al EtOH/H2O 97/3 mol%
5
6/8/9 Y(O2CEt)2OH Al(Acac)3 EtOH
2.5
7 Y(O2CEt)2OH Al(Acac)3 THF 2.5
Table 3.2 List of precursors formulated (all with 3Y:5Al stoichiometry).
48

Sample 1 2 3 4 5 6 7 8 9 Tal*
SSA (m2/g) 5.4 6.7 30 36 14 39 39 79 92 15
Mean particle size (nm) 247 198 44 37 95 34 34 16 13 88
Size by line broadening (nm) na 30 45 35 90 35 35 15 10 90
*Commercial material obtained from Tal Materials, Inc.
Table 3.3 Initial surface area and mean particle size.
49

Sample 1 2 3 4 5 6 7 8 9
Ceramic yield
Wt %
99.8 98 97.5 98 96 98 96 97 98
Table 3.4 Ceramic yield of the powders at 1400°C
50

Peaks Y2O3 YAG Al(OH)3 δ-Al2O3 YAlO3 (I)
νOH chemisorbed
H2O
3580 (w,br) 3540 (w,br) 3560 (w,br) 3580 (w,br) 3600 (w,br)
νOH physisorbed
H2O
3210 (w,br) 3210 (w,br) Broad Broad 3200 (w,br)
νM-O 570 (s), 500
(s), 460 (m),
430 (w), 410
(w),
440 (m), 500
(s,br), 570 (s), 700
(w), 740 (s,br)
and 790 (s)
610 (br) 810 (br)
and 610
(br)
440 (s), 500 (s),
650(m),
700 (s),800 (w) 860
(w), 870(w), 900 (w)
νCO carbonate 1575 (w,br),
1350(w,br)
1500 (w,br) 1380
(w,br)
1500 (w,br) 1600 (w,br)
1350 (w,br)
1540 (w,br), 1350
(w,br)
• s = strong, m = medium, w = weak, br = broad; center of peak reported.
• Table 3.5 FTIR peaks of reference materials (cm-1).
51

Precursor 1 2 3 4 5 6 7 8 9
YAG formation (°C) 1280 1270 1060 1050 960 1100 1110 1100 1075
Ea (kJ/mol) 210 208 210 280 86 106 166 100 96
The formation starting temperature was obtained at a heating rate of 10°C/min.
Table 3.6. YAG starting formation temperature and Ea.
52

0 20 0 40 0 60 0 80 0 10 0 0
ypropder2.txt
- 4
- 2
0
2
4
6
8
0 200 400 600 800
16.1 wt % mass loss
39.3 wt % mass loss
17.0% mass loss
Figure 3.1 TGA (top)-DTA (bottom) of the proprionate powder-THF solvate.
53

O
O
Y
O H
O
O
Y
O H
O H2
O
O
O
O
Y
O
O
Y
O H
O H
a.
b.
c.
d.
Mod el/Calc. Ce rami c Yie ld (w t %) a 43.0 b 46.0 c 33.9 d 53.6
Figure 3.2 Possible structures for the yttrium proprionate precursor.
54

Figure 3.3 Micrograph of Sample 1 (yttrium nitrate/aluminum nitrate).
Figure 3.4 SEM micrograph of Sample 6 (yttrium proprionate/aluminum
acetylacetonate)
55

1 2 0 01 6 0 02 0 0 02 4 0 02 8 0 03 2 0 03 6 0 04 0 0 0
wavenumber (cm-1)
δ -Al 2O 3
Al (OH) 3
Y2 O 3
YAP
YAG
Figure 3.5 FTIR of reference samples (4000-1200 cm-1).
56

1 2 0 01 6 0 02 0 0 02 4 0 02 8 0 03 2 0 03 6 0 04 0 0 0
Waven u mber s (cm-1)
Sampl e 1: Y(NO 3 )3 /A l(NO 3)3 in ethan ol
Sampl e 2: Y(NO 3)3/A l(NO 3)3 in butano l
Samp l e 3: Y(Acac) /A l umatr an e
Samp le 4: Y(ethyl hexan oate) /a lu matran e
Figure 3.6 FTIR of various samples (4000-1200 cm-1).
57

1 2 0 01 6 0 02 0 0 02 4 0 02 8 0 03 2 0 03 6 0 04 0 0 0
Wavenumbers (cm-1
)
Sample 5: Y(methoxyacetate) /alumatrane
Sample 6: Y(proprionate)/Al(Acac) in ethanol
Sample 7: Y(proprionate) /Al(Acac) in THF
Sample 8: Y(proprionate) , improved process
Tal Materials commercial sample
Figure 3.7 FTIR of various samples (4000-1200 cm-1).
58

4005006007008009001000
wavenumber (cm-1)
INTE
NS
ITY
Al2O
3δ−
Al(OH) 3
Y2O3
YAP
YAG
Figure 3.8 FTIR of reference samples (1000-400 cm-1). Black dot indicates ν-Al-O
combinatorial vibrations.
59

4005006007008009001000
Wavenumbers (cm-1)
INTE
NS
ITY
Sample 1: Y(NO3)3/Al(NO3)3 in ethanol
Sample 4: Y(ethylhexanoate)/Alumatrane
Sample 3: Y(Acac)/alumatrane
Sample 2: Y(NO3)3/Al(NO3)3 in butanol
Figure 3.9 FTIR or various samples (1000-400 cm-1). Black dot indicates ν-Al-O
combinatorial vibrations.
60

4 0 05 0 06 0 07 0 08 0 09 0 01 0 0 0
Wavenumbers (cm-1
)
Sample 5: Y(methoxyacetate)/alumatrane
Tal Mater ials commercial sample
Sample 8: Y (propr ionate), improved process
Sample 6 Y(proprionate)/Al (Acac) in ethanol
Sample 7: Y (proprionate)/Al(Acac) in THF
Figure 3.10 FTIR of various samples (1000-400 cm-1). Black dot indicates ν-Al-O
combinatorial vibrations.
61
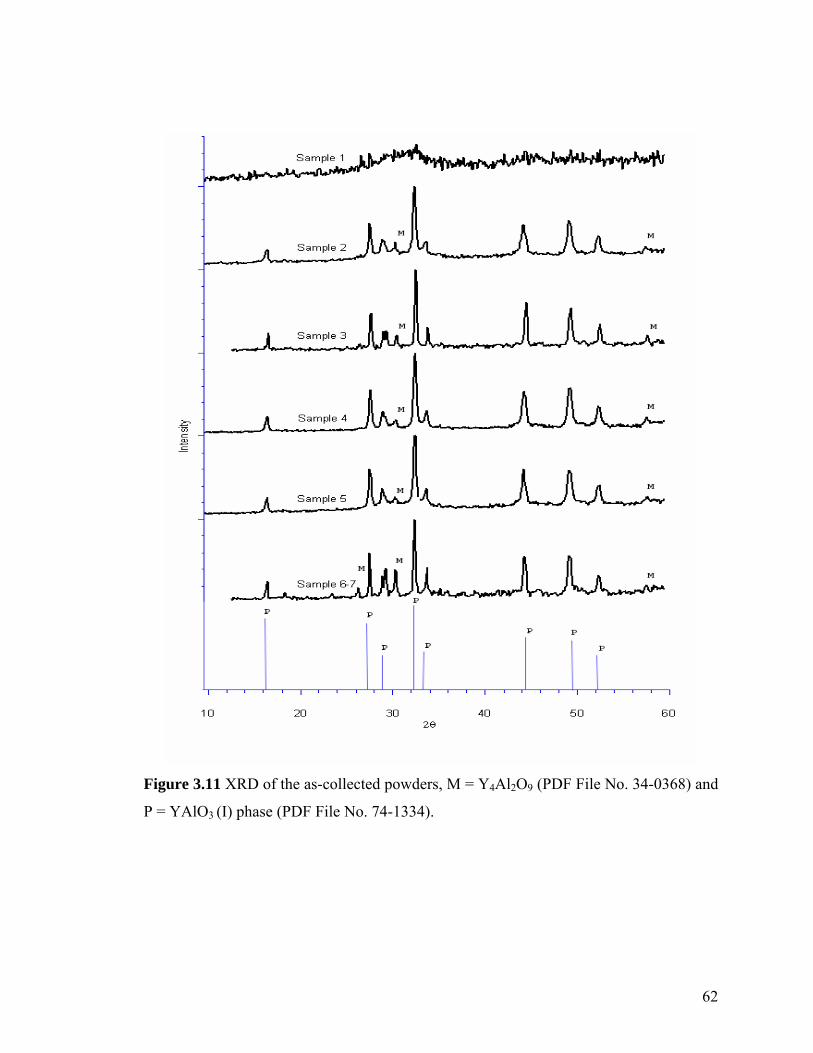
Figure 3.11 XRD of the as-collected powders, M = Y4Al2O9 (PDF File No. 34-0368) and
P = YAlO3 (I) phase (PDF File No. 74-1334).
62

Figure 3.12 XRD of the as-collected powders, M = Y4Al2O9 (PDF File No. 34-0368) and
P = YAlO3 (I) phase (PDF File No. 74-1334), Y (II) corresponds to tetragonal
yttroalumnite (II) (PDF File No. 09-0310).
63

4 5 6 7 8 9
YAG sample 6
Sample 2
Sample 3
Sample 4
Sample 5
Sample 6
Sample 7
Tal materials sample
Sample 8
Sample 9
YAP
YAG sample 5
2θ10
Figure 3.13 Low angle XRD of the as-collected powders.
64

Figure 3.14 TEM of Sample 6 (yttrium propionate/aluminum acetylacetonate), APS ≈ 18
nm.
65

Figure 3.15 DTA of various Samples (M/H/Y: Exotherm attributed respectively to the
formation/development of the Y4Al2O9/YAlO3/YAG phase).
66

Figure 3.16 XRD of Sample 2 showing the formation of the YAlO3 (II) phase on heating
to 1050°C/10°C/min and then cooling at the same rate. M = Y4Al2O9, H = YAlO3 (II) and
P = YAlO3 (I) phase.
67

3.5 References 1B.R. Johnson, W.M. Kriven, “Crystallization kinetics of yttrium aluminum garnet”, J.
Mater. Res., 2001 16 1795. 2Y.C. Kang, I.W. Lenggoro, S.B. Park, K. Okuyama, “YAG : Ce phosphor particles
prepared by ultrasonic spray pyrolysis”, Mater. Res. Bulletin, 2000 35 789. 3J. McKittrick, B. Hoghooghi, W. Dubbelday, K. Kavanagh, K Kinsman, L. Shea, E.
Sluzky, “Size effect in YAG-Cr phospors”, MRS Symp. Proc., 1994 348 519. 4P.R. Rao, “Synthesis of fine grain YAG:RE3+ phosphors for low-voltage display
devices”, Proc. SPIE, 1996 2651 139. 5Y.C. Kang, I.W. Lenggoro, S.B. Park, K. Okuyama, “Photoluminescence characteristics
of YAG : Tb phosphor particles with spherical morphology and non-aggregation”, J.
Phys. Chem. Sol., 1999 60 1855. 6 O. Katsutoshi, T. Kusunoki, “The effect of ultrafine pigment color filters on cathode ray
tube brightness, contrast, and color purity”, J. Electrochem. Soc. ,1996 143 1063. 7 Y. Peizhi, D. Peizhen, Y. Zhiwen, T. Yulian, ”The growth defects in Czochralski-grown
Yb : YAG crystal”, J. Crystal Growth, 2000 218 87. 8R.C. Pullar, M.D. Taylor, A.K. Bhattacharya, ”The sintering behaviour, mechanical
properties and creep resistance of aligned polycrystalline yttrium aluminium garnet
(YAG) fibres, produced from an aqueous sol-gel precursor”, J. Eur. Ceram. Soc., 1999
19 1747. 9A. Ikesue, T. Kinoshita, K. Kamata, K. Yoshida, “Fabrication and Optical Properties of
High-Performance Polycrystalline Nd:YAG Ceramics for Solid-State Lasers”, J. Am.
Ceram. Soc., 1995 78 (4) 1033. 10R.M. Laine, T. Hinklin, G. Williams, S.C Rand, “Low-cost nanopowders for phosphor
and laser applications by flame spray pyrolysis”, Metastable Mech. Alloyed Nano Mater.,
2000 (1-2) 500. 11P.W. Anderson, ”The question of classical localization” Phil. Mag., 1985 52 505. 12D. Wiersma, A. Lagendijk, ” Interference effects in multiple-light scattering with gain”,
Phys. A, 1997 241 82.
68

13T. Hinklin, B. Toury, C. Gervais, F. Babonneau, J.J. Gislason, R.W. Morton, R.M.
Laine “Liquid-Feed Flame Spray Pyrolytic Synthesis of Nanoalumina Powders”, Chem.
Mater., 2004 16 (1) 21. 14C. Shihui, H. Sentiong, C Hui, “Design of gain clamped erbium doped fiber
amplifiers”, LEOS'99, 1999 2 417. 15J. Li, T. Ikegami, J. Lee, T. Mori, Y. Yajima, “ Co-precipitation synthesis and sintering
of YAG powders: the effect of precipitant”, J. Eur. Ceram. Soc., 2000 20 2395. 16K.T. Pillai, R.V. Kamat, V.N. Vaidya, D.D. Sood, “Synthesis of yttrium aluminium
garnet by the gel entrapment technique using hexamine”, Mater. Chem. Phys., 1996, 46
67. 17Y.C. Kang, Y.S. Chung, P.S. Bin, “Preparation of YAG : Europium red phosphors by
spray pyrolysis using a filter-expansion aerosol generator”, J. Am. Ceram. Soc., 1999 82
2056. 18M. Nyman, J. Caruso, M. J. Hamden-Smith, T.T. Kodas, “Comparison of solid-state
and spray-pyrolysis synthesis of yttrium aluminate powders”, J. Am. Ceram. Soc., 1997
80 1231. 19D. M. Veith, S. Mathur, A. Kareiva, M. Jilavi, M. Zimmer and V. Huch, “Low
temperature synthesis of nanocrystalline YAG and Ce-doped YAG via different sol-gel
methods”, J. Mater. Chem. 1999 9 3069. 20R. Baranwal, “Synthesis of Nanopowders” Ph.D. Dissertation, University of Michigan
1996. 21R.M. Laine, K. Waldner, C. Bickmore, D. Treadwell, U.S. patent 5,614,596 (March
1997). 22R. Baranwal, M.P. Villar, R. Garcia, R.M. Laine, “Flame spray pyrolysis of precursors
as a route to nano-mullite powder: Powder characterization and sintering behavior”,
J.Am. Ceram. Soc., 2001 84 951. 23R.M. Laine, R. Baranwal, T. Hinklin, D. Treadwell, A. Sutorik, C.R. Bickmore, K.
Waldner, S.S. Neo “Novel Synthetic and Processing Routes to Ceramics”, Ed. by
Uematsu, H. Otsuka, Eds., Key engineering Materials, K. Trans Tech Publ. Ltd.
Switzerland, 1998 17.
69

24 < Diameter >=6
SSA × ρ
25R.M. Laine, K.A. Youngdahl, R.A. Kennish, M.L. Hoppe, Z.F. Zhang,
“Superconducting fibers from organometallic precursors. Part II: Chemistry and low
temperature processing”, J. Mater. Res., 1991 6 895. 26S. Jain, D.J. Skamser, T. Kodas, “Morphology of single-component particles produced
by spray pyrolysis”, Aer. Sci. Tech., 1997 27 575 b. R. Mahadevan, D. Lee, H. Sakurai,
M.R. Zachariah, “Measurement of condensed-phase reaction kinetics in the aerosol phase
using single particle mass spectrometry”, J. Phys Chem. A, 2002 106 11083 c. L. Madler,
S.E. Pratsinis, “Bismuth oxide nanoparticles by flame spray pyrolysis”, J. Am. Ceram.
Soc. 2002 85 1713. 27G.T. Carreno, M.P. Morales, C.J. Sena, ”Preparation of uniform γ-Fe2O3 particles with
nanometer size by spray pyrolysis”, Mater. Let., 1993 18 151. 28S.E. Pratsinis, S. Vemury, “Particle formation in gases: A review”, Powder Tech., 1996
88 267. 29A.M. George, N.C Mishra, M.S. Nagar, N.C Jayadevan, “Formation of YAG from
coprecipitated yttrium aluminium hydroxides”, J. Therm An., 1996 47 1701. 30S. Le Floch, M. Gervais, F. Gervais, ”Infrared reflectivity study of the metastable solid
solution Y2O3-Al2O3 on both side of the YAG composition”, Mater. Sci. Eng., 1995 B33
217. 31J.B. Peri, “Infrared and gravimetric study of surface hydration of gamma-alumina”, J.
Phys. Chem., 1965 69 211. 32J.B. Peri, “A Model for the Surface of γ-Alumina”, J. Phys. Chem., 1965 69 220. 33D.H. Lee, R.A. Condrate, “An FTIR spectral investigation of the structural species
found on alumina surfaces”, Mater. Lett., 1995 23 241. 34J.M. Saniger, “Al-O Infrared vibrational frequencies of gamma-alumina”, Mater. Lett.,
1995 22 109. 35P. Tarte, “Infra-red spectra of inorganic aluminates and characteristic vibrational
frequencies”, Spectr. Acta, 1967 23A 2127. 36A. Gurav, T. Kodas, T. Pluym, Y. Xiong, ”Aerosol processing of materials” Aer. Sci.
Tech., 1993 19 411.
70

37Y. Liu, Z.F. Zhang, B. King, J. Halloran, R.M. Laine, “Synthesis of yttrium aluminum
garnet from yttrium and aluminum isobutyrate precursors”, J. Am. Ceram. Soc., 1996 79
385. 38O. Yamaguchi, K. Takeoka, A. Hayashida, “Formation of alkoxy-derived Y Al O3 5 12”,J.
Mater. Sci. Lett., 1991 10 101. 39C.D. Veitch, “Synthesis of polycrystalline yttrium-iron garnet and yttrium-aluminum
garnet from organic precursors”, J. Mater. Sci., 1991 26 6527. 40N.J. Hess, G.D. Maupin, L.A. Chick, D.S. Sunberg, D.E. McCreedy and
T. R. Armstrong, “Synthesis and crystallization of yttrium-aluminum garnet and related
compounds”, J. Mater. Sci., 1994 29 1873. 41A.S. Pell, G. Pilcher, “Measurement of heat of combustion by calorimetry”, Trans.
Faraday Soc. 1965 61 71. 42F.D. Rossini, J. Res. NBS, “The heat of formation of hydrogen chloride and some
related thermodynamic data”, 193 8 119. 43J. Marchal, R.M Laine, H. Sun, X Pan, “A new Y Al O phase produced by liquid-feed
flame spray pyrolysis (LF-FSP)3 5 12
”, Adv Mater., 2005 17 830.
71

Chapter 4: A new Y3Al5O12 phase produced by liquid-feed flame spray pyrolysis (LF-FSP)
4.1 Introduction
Yttrium aluminum garnet, YAG (Y3Al5O12) materials have been studied extensively
over many decades because of their exceptional high temperature mechanical strength
coupled with low creep, utility as phosphors, scintillators and most importantly for their
photonic properties.1-6 Single crystal YAG dominates commercial solid-state laser
markets while also offering aesthetic beauty as YAG jewelry.
Laser applications have provided the impetus for in-depth examinations of the
properties and processing of Y3Al5O12 composition melts, glasses and single-phase
materials.6-10 The recent advent of transparent polycrystalline YAG lasers that outperform
single crystal YAG lasers has intensified interest in the development of very fine YAG
particles that are easily sintered to full density and transparency.11,12 In chapter 3 we
produced nanosized Y3Al5O12 powders for this purpose that result in a new phase.
LF-FSP allows the synthesis of nanopowders with average particle diameters < 20 nm
(≈ 90 m2/g) with the Y3Al5O12 composition. Characterization of these powders by FTIR,
XRD, TGA-DTA, TEM and powder pattern modeling studies suggest the formation of a
new hexagonal phase with the Y3Al5O12 composition with unit cell parameters of a =
0.736 nm and c = 1.052 nm and a density of 5.5 g/cc vs 4.5 for the YAG phase.
Hexagonal Y3Al5O12 nanopowder is easily formed into green bodies with densities that
are 62-64 wt % of theory. Those green bodies sinter to the YAG phase and higher than
99.5% density at 1400°C/2 h with grain sizes < 500 nm, using sintering conditions that
involve an intermediate heating step in vacuum at 1000°C. This novel material offers
potential for making high quality YAG materials including ceramic lasers with
exceptional control of processing parameters.
72

4.2 Experimental
4.2.1 Pellets formation
Powder dispersed as described in chapter 3, were re-dispersed (5 grams of powder
in 500 mL of ethanol) with an ultrasonic horn in ethanol with 2 wt/% PEO/PVA binders.
The suspension was then dried at 80°C in a drying oven for 48h. The resulting powder
was then hand ground in an alumina mortar and sieved with a polymer 400 mesh.
Compacts were formed by loading 1.00 ± 0.10 g of powders into a tungsten carbide
double-action die (diameter of 12.75 mm) and pressing in a laboratory press (model
3912, Carver). Powder were compacted between 40 and 260 MPa for ≈ 10 minute, we
found that 120 MPa gave the best mechanical properties to the green bodies and further
experiments were done with pellets processed at this pressure. Then the pellets were cold
isostatically pressed.
4.2.2 Cold Isostatic pressing
Pellets were placed in Food Saver bags and evacuated using a Food Saver 400
(Jarden, NY) which automatically sealed the evacuated bags under vacuum. The bags
were pressed in an Autoclave Engineers (Erie, PA) cold isostatic press. The bags were
pressed at 300 MPa, with a ramp of 5 MPa/min and held for 30 min and released at 5
MPa/min. The dimensions, measured by digital micrometer, and mass of the compact
were used to calculate the green densities.
73

4.3 Results
4.3.1 Analysis
In Chapter three, we found that 3:5 mixtures of Y(O2CCH2CH3)2OH and Al(Acac)3
dissolved in EtOH gave nanopowders with average particle sizes (APS) below 50 nm
(Figure 4.1a). The as-produced particles are unnecked, easily dispersed and single
crystals as determined by high resolution TEM (Figure 4.1b).
In contrast to what was anticipated, the digital diffraction and XRD powder patterns
for the
as-produced powders do not match those of YAG as described in Chapter 3. As shown in
Figure 4.2, the XRD most closely resembles that of the hexagonal phase of YAlO3. Since
this is a commonly observed kinetic phase in this system, this finding was not too
surprising. However, if we had produced YAlO3 then the overall stoichiometry of the
system would be 3YAlO3.Al2O3. The excess alumina (25 mol %) would be expected to be
visible either as a crystalline phase (not observed), an amorphous phase with an
amorphous hump in the XRD powder patterns (not observed), or last and least likely,
present in defect structures.
On careful examination, the XRD peak intensities obtained differ from those expected
for YAlO3. This prompted examination of the low angle XRD pattern shown in chapter
three, revealing a peak at 8.3-8.5°2θ corresponding to a lattice parameter of ≈ 1.1 nm,
close to the unit cell dimensions for crystalline YAG and to the (001) interplanar distance
of hexagonal YAlO3. However neither true YAG samples (obtained after annealing at
1200°C/30 min), nor authentic samples of LF-FSP nano hexagonal YAlO3 show this peak
74

(due respectively to the structure factor of YAG and the equivalency of YAlO3 (002) and
(001) planes).
FTIR studies also suggest a novel material. The Y3Al5O3 composition powders
contain small but typical νO-H and carbonate νC-O bands in the 3400-3600 cm-1 and
1400-1600 cm-1 regions, respectively. Both result from the high water and CO2
environment in the flames. Likewise peaks for νAl-O and νY-O are those common to
most of the materials in the Y2O3-Al2O3 system. However, one peak at 740 cm-1 is unique
to the new material. This peak is usually assigned to asymmetric νAl-O in isolated AlO4
tetrahedra as in the YAG phase. Alternately, it is observed for specific interactive
vibrations between AlO4 or AlO5 species bound to AlO6 octahedra as discussed by
Saniger14 and Tarte.15 Restated, this band appears when at least one AlO4,5 species forms
Al-O-Al (Y) bonds to a second AlO6 or YO6 species. As such, this peak is not observed
in δ-alumina, Al(OH)3, or in hexagonal YAlO3.
In the Y2O3-Al2O3 system, this peak might be expected if excess Al3+ (Y:Al ratio <1)
substitutes for Y3+ in the hexagonal YAlO3 phase resulting in AlO6 octahedra connected
to AlO4,5 species forming a regular defect structure.
Random substitution of Y3+ by Al3+ would not show either the 740 cm-1 FTIR peak or
the differences in the XRD pattern. Furthermore, the XRD powder pattern reported above
can be closely simulated (Figure 4.2) in terms of peak positions and intensities suggesting
a regular atomic ordering of atoms and therefore a new phase in the Y3Al5O12
composition.
The simulation also allows us to suggest a structure for the new phase that is
hexagonal, a = 0.736 nm and c = 1.052 nm. This unit cell resembles hexagonal YAlO3
75

but is 4 times bigger and has a regular defect structure in the (002) plane: half of the Y3+
are substituted by Al3+ forming a regular pattern. The structure is best described layer by
layer (all parallel to the 001 plane): Layer a: hexagonal layer of yttrium ions, layer b:
hexagonal layer of oxygen ions, layer c: hexagonal layer of alternating five coordinate
Al3+ and O2- ions, layer d: hexagonal layer of alternating octahedral Y3+ and octahedral
Al3+ ions. Thus, the unit cell consists of an ABCBDBCBA arrangement contrasting with
the ABCBABCBA layers of hexagonal YAlO3. This causes the extra 8.4° 2θ peak in the
low angle XRD. These unit cell dimensions indicate that the density of this material is
5.52 vs 4.51 for YAG. A model of the lattice cell is shown in Figure 4.3.
The literature on YAG glasses8,9 suggests that there are actually two glass phases, one
having a lower density than the other and being the thermodynamically most stable of the
two. It is tempting to argue that LF-FSP produces hexagonal Y3Al5O12 by gas phase
formation of the higher density of these two glasses followed by crystallization.
However, the structure of these materials is dominated by a tetrahedral alumina
framework, which differs from that observed here where it appears that the only Al3+ ions
present are penta- or hexa-coordinated. As YAG glasses form with all three Al3+ ion
types, a different crystallization route seems more probable.
The Ea for conversion to the YAG phase was determined in Chapter 3 to be ≈ 110
kJ/mol,13 much lower than the 550 kJ/mol16 reported for conversion from YAlO3 and
Al2O3 to YAG. Hence, there appears to be a very strong driving force for formation of the
YAG phase. This driving force when coupled with the roughly 20% higher density of the
hexagonal phase should provide improved sintering as conversion to the lower density
76

YAG phase may aid in removing porosity during the sintering process. This prompted
the following sintering studies.
4.3.2 Sintering studies
We cleaned the powders as described in Chapter 2 and added binders as described in
the experimental section. We then formed several green bodies by regular pressing at 120
MPa, followed by CIPing at 300 MPa, as described in the experimental section (green
density of 62-64%). The pellets were then heated at 800°C (heating rate of 5°C/min, 2
hours dwell) under pure oxygen (flow of 60mL/min) to remove the binders. The resulting
pellets were then annealed under vacuum at 1000°C (heating rate of 10°C/min, 2 hours
dwell) to homogenize the pellet phase and the pore size as discussed in Chapter 1.
Several sets of pellets prepared identically were sintered in a vacuum furnace using
heating rate from 5 to 20°C and dwelling temperature of 1375-1425°C. The highest final
density was obtained with pellets sintered at 1400°C (10°C/min to 800°C for 2 hours,
vacuum 10°C/min to 1000°C for 2 h, followed by 10°C/min to 1400°C, 8 h), which were
97+% dense (as determined with an Archimedes balance) while maintaining grain sizes of
< 500 nm as can be seen in Figure 4.4
77

4.4 Conclusions
The LF-FSP process allows the synthesis of a new hexagonal Y3Al5O12 phase
characterized using FTIR, XRD, TGA-DTA and TEM. This phase is only present as a
high surface area (70-90 m2/g) nanopowder and consists of spherical, easily dispersed,
nanoparticles. This new phase can be processed in high density green bodies through
typical wet processing. While the nanopowder converts to YAG nanopowder with low
activation energy as described in chapter 3, green bodies of the new phases can be
sintered to essentially full density YAG monoliths at 1400°C while keeping grain size
below 500 nm.
78

Figure 4.1 a. TEM of LF-FSP produced Y3Al5O12 composition nanopowders (Sample 6
described in chapter 3, APS 20-50 by XRD line broadening, BET surface area analysis,
40-90 m2/g).
79

Figure 4.1 b. HTREM of single particle (Sample 6, described in Chapter 3), digital
diffraction pattern inset.
80

10 20 30 40 50 602θ
YAG: PDF 33-0040
YAH: PDF 74-1634
Y3Al
5O
12
New Phase
Simulation
Figure 4.2. XRD patterns of a. YAG from annealed powder, b. new phase, low angle
peak at 8.2°2θ not shown, c. YAG ICDD 33-0040, d. Hexagonal YAlO3 ICDD 74-1634
and d. Simulation of XRD powder pattern of new phase
81

Figure 4.3 Model of the new hexagonal Y3Al5O12 phase.
82

1 micron
Figure 4.4 SEM of a pellet (sintered at 1400°C for 8 h, heated rate of 10°C/min with a 2
h step at 1000°C) fractured surface after additional thermal etching at 1200°C.
83

4.5 References
1W.R., Blumenthal; D.S. Phillips, “High-Temperature Deformation of Single-Crystal
Yttrium-Aluminum Garnet (YAG)”, J. Am. Ceram. Soc., 1996 79 1047.
2S., Karato; Z .,Wang; K., Fujino, “High-temperature creep of yttrium-aluminium garnet
single crystals”, J. Mat. Scie., 1994 29 6458.
3Y., Pan; Y., Sun; M.,Wu; Q., Su,” Effect of pre-aging pH on the formation of yttrium
aluminum garnet powder (YAG) via the solid state reaction method”, J. Phys. Chem.
Sol., 2004 65 845.
4Y.H., Zhou; J., Lin; M., Yu; S.M., Han; S.B., Wang; H.J., Zhang,” Morphology control
and luminescent property of Y3Al5O12:Tb particles prepared by spray pyrolysis”, Mater.
Res. Bul., 2003 38 1289.
5J. McKittrick; L.E. Sheab; C.F. Bacalskia; E.J., Boszea, “The influence of processing
parameters on luminescent oxides produced by combustion synthesis”, Displays, 1999 19
169.
6V. Babin, A. Krasnikov, Y. Maksimov, K. Nejezchleb, M. Nikl, T. Savikhina and S.
Zazubovich, ”Luminescence of Pr3+-doped garnet single crystals”, Opt. Mater., 2007 30
30.
7K. Nagashio; K. Kuribayashi, “Rapid solidification of Y3Al5O12 garnet from
hypercooled melt”, Acta Materiala, 2001 49 1947.
8P. Yang; P. Deng; Z. Yin,; Y. Tian, “The growth defects in Czochralski-grown
Yb : YAG crystal”, J. Crys. Growth, 2000 218 87.
9M.C. Wilding; P.F. McMillan; A. Navrotsky, “Calorimetric study of glasses and liquids
in the polyamorphic system Y2O3-Al2O3”, Phys. Chem. Glasses, 2002 43 306.
84

10M.C. Wilding, P.F. McMillan, A. Navrotsky, “Thermodynamic assessment of the
MgO–Al2O3–SiO2 system”, Physica A, 2002 314 379.
11J. Zhang; J. Ning; X. Liu; Y. Pan; L. Huang, “Low-temperature synthesis of single-
phase nanocrystalline YAG:Eu phosphor”, J. Mater. Sci. Lett., 2003 22 13.
12A. Ikesue; K. Yoshida; K. Kamata, “Transparent Cr4+-doped YAG ceramics for tunable
lasers”, J. Am. Ceram. Soc., 1996 79 507.
13J. Lu, M. Prabhu, J. Song, C. Li, J. Xu, K.I. Ueda, H., Yagi, T. Yanagitani, A.A.
Kaminskii, “110 W ceramic Nd 3+:Y3Al5O12 laser”, Jpn. J. Appl. Phys., 2001 40 552.
14J. Marchal, J. Tyrone, R. Baranwal, T. Hinklin, R.M. Laine, “Yttrium Aluminum
Garnet Nanopowders Produced by Liquid-Feed Flame Spray Pyrolysis (LF-FSP) of
Metalloorganic Precursors”, Mater. Chem. , 2004 16 822.
15J.M. Saniger, “Al-O infrared vibrational frequencies of gama-alumina”, Mater. Lett.,
1995 22 109.
16P. Tarte, “Infrared Spectra of Inorganic Aluminates and Characteristic Vibrational
Frequencies”, Spectr. Acta, 1967 23A 2127.
17 R.S. Hay, “Kinetics and Deformation during the Reaction of Yttrium-Aluminum
Perovskite and Alumina to Yttrium-Aluminum Garnet”, J. Am. Ceram. Soc., 1994 77
1473.
85
Chapter 5: Nano-α-Al2O3 by liquid-feed flame spray pyrolysis (LF-FSP)
5.1 Introduction
From a commercial perspective, there is considerable impetus to develop an
economical source of sub-100 nm average particle size (APS) α-Al2O3 for applications
ranging from tough prosthetic implants, to transparent armor, to transparent rather than
translucent sodium vapor lamp envelopes, and possibly polycrystalline lasers, as well as
for more common applications, nano/submicron-grained α-Al2O3 shapes offering
significant advantages over micron-grained shapes1-6 Despite this considerable potential,
there are no commercial sources of sub-100 nm α-Al2O3, even though nano-alumina is
easily produced in ton quantities.
Nano-alumina is produced using a variety of gas phase processes7-11 and consist of
transition aluminas, mainly of δ− with some γ− and θ-Al2O3. While transition aluminas
do convert to the desired α phase, the high Ea for nucleating α-Al2O3 greatly impedes
efforts to process dense α-Al2O3 with controlled grain sizes especially for submicron
materials. Typically α-Al2O3 nucleation within t-aluminas is sporadic rather than uniform
leading to exaggerated grain growth and vermicular microstructures without full
densification.7 As of yet there is no published technique for converting these easy to
obtain t-aluminas into the α-alumina nanopowder required to manufacture fully dense
sub-micron grained alumina monoliths.
Liquid-feed flame spray pyrolysis, has proven to be a cheap way of producing
important quantities of t-aluminas.10 The short time during which particles are exposed to
high temperature, as well as the fast quenching, limits aggregation in the resulting
powder. While the powders obtained from LF-FSP of metallo-organic precursors are
transition alumina instead of the desired α phase, they are easily dispersed in various
alcohols, which prompted us to modify the process to use a suspension of t-aluminas as
86

precursor. High temperature in the flame should allow for nucleation of the alpha phase,
while fast quenching and limited contact between particles in the flame should limit
necking or particle growth.
This suspension-feed flame spray pyrolysis (SF-FSP) process allows the formation of
dispersible α alumina nanopowder of 30-80 nm average particle size, with a conversion
rate of 50-85%. This nanopowder exhibits some unusual properties, which initially were
problematic in further processing of the powder. Nonetheless, fully dense α-alumina
monoliths were obtained by presssureless sintering without sintering aids. Additional
sintering studies were done to further investigate the sintering mechanisms in this new
material.
5.2 Experimental
5.2.1 Precursors preparation
Precursors powders for the SF-FSP process consisted of three gas-phase synthesized
nanopowders obtained from Degussa, Nanophase and home made by LF-FSP of
alumatrane.10 A different precursor was also made using Gibbsite. Each precursor
consisted of 1-10 wt % nano t-alumina powders milled with alumina media in an
ethanol/acetone solution (90/10 by volume) for 24 hours. After being left to decant for
twelve hours, the suspension was ultrasonicated for 30 min with a 500 W titanium horn
(Sonic, Newton, CT).
This dispersion is aerosolized with O2 using techniques described in Chapter 3 and
combusted at temperatures near 1600°C. Pumping rate was 70 mL/min and oxygen flow
was 40 mL/min (pressure of 480 kPa) to form the aerosol. Production rate of the
nanopowder was 100g/h.
5.2.2 Pellet preparation
Batches of 10 grams of SF-FSP powders obtained from Degussa or LF-FSP precursors
were dispersed with Bis-(2-hydroxyethyl)-glycine (Bicine, 2 wt%) in 500 mL of
ethanol/acetone solution (90/10 by volume) using a 500 W titanium horn (Sonic, Newton,
86

CT) for 30 minutes. The suspension was then decanted for 24 hours and the upper portion
was separated. The non-dispersible portion of the powder was below 10 wt% in all
samples. Binders were added to the suspension (1 wt% PVA and 1 wt% 8000 MW PEG)
and dispersed for another 30 minutes. The suspension was then dried for 48 hours at
80°C.
The resulting powder was hand ground in an alumina mortar and pestle and sieved
through a polymer 400 mesh. Pellets were then uniaxially pressed (45 MPa) from 1 gram
of powder each. After cold isostatic pressing at 200 MPa, the pellets had green densities
of 53±2%. Binder burnout was done in controlled atmosphere furnace as described in
chapter 3 (5°C/min/800°C/4 h/O2). The resulting pellets were then annealed under
vacuum at 1000°C (heating rate of 10°C/min, 2 hours dwell) to homogenize the pellet
phase (as well as pore size). Pellets were then used for sintering studies using dilatometry
as described in Chapter 3 and 5.
87

5.3 Results and discussion
From an academic perspective, there is considerable speculation in the literature as to
why it is apparently impossible to make polycrystalline nano-α-Al2O3 monoliths let alone
free flowing nanopowders of α-Al2O3.12-16 Based on studies of high surface area
polycrystalline t- and α-alumina, the literature suggests that it may be difficult to
generate α-Al2O3 nuclei under conditions where complete conversion of t-aluminas to the
alpha phase will occur without extensive grain growth. More problematic, the vermicular
microstructures caused by this phase change inhibit any further densification of these
materials. Studies by McHale et al suggest that polycrystalline nano-α-Al2O3 is not stable
with respect to polycrystalline nano-γ-Al2O3 at surface areas of ≈ 125 m2/g, equivalent to
grain sizes of ≈ 8 nm.16 One possible explanation is that hydrated, nanostructured
polycrystalline γ-Al2O3 might be more stable than similarly hydrated α-Al2O3; however
the McHale et al studies appear to rule this out.16 It should be noted that a brief report by
Krell et al describes the preparation of nano-α-Al2O3 by templating crystallization of
amorphous aluminum-sec-butoxide and aluminun nitrate with diaspore.17 This work
highlights the difficulties in obtaining homogenous green bodies from nanopowders.
Our studies in chapter 5 as well as works described elsewhere18-19 indicate that LF-FSP
and SF-FSP, because they offer access to kinetic products have the potential to produce
novel phases as well as expand known phase-fields. Conditions in the SF-FSP process
could therefore allow α nucleation while keeping the powder dispersible and consisting
of un-necked nanoparticles. The four powders synthesized by the SF-FSP process were
analyzed as described below. Pellets were also made from SF-FSP powder derived from
Degussa and LF-FSP nanopowder and used for sintering studies to investigate sintering
mechanism of this new material.
5.3.1 SF-FSP powder characterization
Analysis of the SF-FSP powder had two goals: first to determine the actual phase
composition of the powder (determined by XRD), but more importantly to determine that
the powder particle size was still below 100 nm (BET, SEM, TEM, DLS). FTIR were
also done to investigate hydroxyl groups on the surface of the powder.
88

5.3.1.1 X-ray powder diffraction patterns (XRD)
The precursors obtained from gas synthesis are mostly a mixture of the various
δ phases and the γ phase (Table 5.1 and Figure 5.1). The as-collected powders exhibit
XRD patterns (Table 5.1 and Figure 5.2) that indicate a high degree of conversion to
mixtures of θ and α-Al2O3, with the gibbsite derived powders having the lowest
conversions at roughly 50% and the LF-FSP, Nanophase and Degussa δ-Al2O3
nanopowders having conversions at 80-85%. The initial presence of θ and α-Al2O3 in the
LF-FSP t-alumina explain the higher α content in this powder, the actual conversion rate
seems similar between those three gas synthesis powders. Crystallites sizes increase
between the gas synthesis precursor powders and the SF-FSP powders with a final size of
29-36 nm, this would indicates that each alpha crystallite is formed by several close
neighbor particles in the flame. In the case of the gibbsite powder, the size decrease is
due to two factors: first the 89% increase in density between gibbsite and α−alumina and
secondly to the removal of hydroxyl groups from the gibbsite structure to form
α−alumina.
To our knowledge there are no precedents for converting t-aluminas to dispersible sub
100 nm α-Al2O3 powders. Thus, the actual conversion mechanism here can only be
conjecture. It may be that although hydration energetics are not an issue in determining
the relative stability of polycrystalline, high surface area α- vs γ-Al2O3,14 it is an issue
here, in an environment where grain boundary interactions are nonexistent. This appears
to be a reasonable argument given that the LF-FSP process generates enormous amounts
of H2O and CO2, at high temperatures.
5.3.1.2 Scanning electron microscopy and transmission electron microscopy
Figure 5.3 shows a SEM of the SF-FSP powder, (the three gas synthesis precursor
giving similar SF-FSP powders), showing the uniformity of the as-produced α-Al2O3
with no particles > 100 nm. The particles are faceted contrary to most particles formed by
89

LF-FSP (as seen in chapter 4), but this was observed before with the traces of alpha
alumina in LF-FSP produced transition aluminas.10 Figure 5.4 and 5.5 shows TEMs of
groups of alpha particles after dispersion in EtOH and further drying. Those TEMs shows
that the particles can be dispersed and are not necked. HRTEM and electron diffraction
were done on a single 15 nm alpha particles as shown in Figure 5.6 and 5.7, showing the
facets more clearly as well as the hexagonal crystal structure.
5.3.1.3 Particle size analysis
To confirm the APS of the resulting nano-α-Al2O3, bicine dispersions of the SF-
FSP powders were examined by dynamic laser light scattering (Figure 5.8) giving APS of
30-40 nm. BET of the same powder gave similar results (with SSA of 40-60 m2/g). This
is in keeping with APS values obtained from XRD line broadening (Table 5.1) and
indicating that the powders are mostly single crystals.
5.3.1.4 Infrared spectroscopy
FTIR spectra of the Degussa alumina precursor powder before and after
conversion is shown in Figures 5.9. The spectra is characterized by broad νOH bands in
the 3700 to 3500 cm-1 region which likely indicates an overlap of both physi- and
chemisorbed species. Typically, isolated νOH bands for chemisorbed species appear at
3600-3700 cm-1 whereas bands for hydrogen-bonded OH groups appear lower, at 3400-
3500 cm-1. These are typical for most LF-FSP derived powders as discussed in Chapter 4.
The degussa and nanophase alumina nanopowder shows similar broad peaks.
The SF-FSP α-Al2O3 nanopowder surprisingly does not exhibit those peaks, which would
indicate that the surface of the powder is devoid of any chemisorbed or physisorbed
water. This is highly unusual for powder obtained either from LF-FSP or SF-FSP
process18-19 and the fact that water presence in the flame should have an influence on α
nucleation.
90

5.3.2 Sintering studies
Although the resulting α-Al2O3 nanopowders are not 100 % phase pure, the residual
θ−Al2O3 is expected to convert without vermicular growth due to the high number of α-
nuclei as shown in work with Taimicron powders.21 One of the difficulties in processing
the resulting powder is that, contrary to regular LF-FSP transition alumina (disperse
spontaneously in water or EtOH)10 surfactants are essential to dispersing these powders.
This can be explained by the lack of hydroxyl groups on the surface of the powder linked
to the surface being hydrophobic without the use of surfactants (as opposed to other LF-
FSP nanopowder whose surfaces are generally hydrophilic). Bis-(2-hydroxyethyl)-
glycine (Bicine) was most efficient (using 2 wt%),20 allowing homogenous drying of the
dispersions and further processing into green bodies.
5.3.2.1 Constant heating rate experiments
To determine optimum temperature conditions for sintering while keeping grain
size as low as possible we heated a pellet of the SF-FSP powder under a constant heating
rate (20˚C/min) in a dilatometer as described in Chapter two, as shown in Figure 5.10.
First stage of sintering (necks formation) seems to end around 1260°C and the third stage
of sintering (pores removal) to start at 1550°C. There were no discernable differences
between the two different kind of pellets (SF-FSP obtained from LF-FSP or Degussa
precursor powder).
5.3.2.2 Controlled grain size
From those sintering curves experiments we were able to determine optimum
sintering temperatures to limit grain growth while obtaining full density. Pellets were
heated at 20°C/min to 1425°C, kept there for 1 h then step-cooled to 1350°C where they
dwelled for 5 h, under vacuum. Figure 5.11 shows the SEM of a representative fractured
surface (after thermal etching at 1250°C for two hours). Grain sizes are below 500 nm
and the pellet is essentially dense (> 99% as determined by Archimedes measurements).
The sintering temperature of 1350°C was chosen as it correspond to the second stage of
sintering on the sintering curve, but still has limited sintering rates (high sintering rates
91

during the second stage of sintering are indicative of faster grain growth.)23 After using a
hot isostatic press at 1400°C and 138 MPa (heating rate of 10°C/min), the pellet (2.8 mm
thick, 9.5 mm diameter) is highly transluscent as can be seen in Figure 5.12.
5.4 Conclusions
SF-FSP allows conversion of easily obtained transition alumina nanopowders into
dispersible α-alumina nanopowders. This nanopowder can be used to form dense nano-
grained ceramic monoliths, without using sintering aids. Preliminary results with hot
isostatic pressing shows that these pellets can be sintered to transluscency.
92
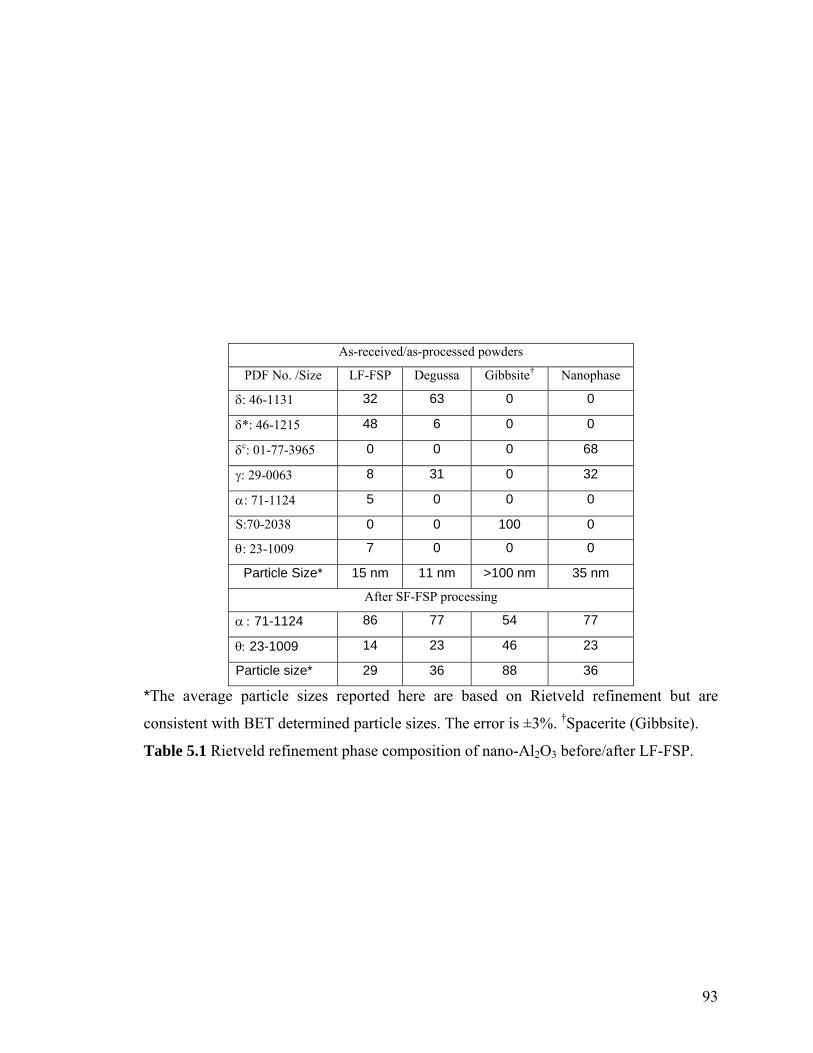
As-received/as-processed powders
PDF No. /Size LF-FSP Degussa Gibbsite† Nanophase
δ: 46-1131 32 63 0 0
δ*: 46-1215 48 6 0 0
δc: 01-77-3965 0 0 0 68
γ: 29-0063 8 31 0 32
α: 71-1124 5 0 0 0
S:70-2038 0 0 100 0
θ: 23-1009 7 0 0 0
Particle Size* 15 nm 11 nm >100 nm 35 nm
After SF-FSP processing
α : 71-1124 86 77 54 77
θ: 23-1009 14 23 46 23
Particle size* 29 36 88 36
*The average particle sizes reported here are based on Rietveld refinement but are
consistent with BET determined particle sizes. The error is ±3%. †Spacerite (Gibbsite).
Table 5.1 Rietveld refinement phase composition of nano-Al2O3 before/after LF-FSP.
93

10 20 30 40 50 60
Rel
ativ
e in
tens
ity
Gibbsite
Nanophase alumina
Degussa alumina
LF-FSP alumina
SSSSSSSSSSSSS
SS
SSSS
S
δ
δ
δ
δδ
δδδ*
δ*
δ*
δ*
δ*
δ*δ*δ*
δ*
δ*
δ*
δ*
δ*δ*
δ*
α
δ*δ*
δ*
δ*δ*
δ*
αα
αα
S
δ
2θ
δc
δc
δcδc
δcδc
δcδc δcδc
Figure 5.1 XRD of precursor transition alumina powders (S= PDF# 70-2038, δc=PDF#
01-77-3965, δ= PDF# 46-1131, δ*= PDF# 46-1215, α=71-1124).
94

10 20 30 40 50 60 70 80
0
0.5
1
1.5
2
2.5
3
Rel
ativ
e in
tens
ity
2Θ
From Gibbsite
From Degussa
From LF-FSP
GibbsiteDegussaLF-FSPPhase597688Alpha412412Theta923829Particle size
α
α α
α α
α
α
α
α
α
α
α
α
α
α
α
α
α
α
α
α
α
α
α
α
α
α
θ θ
θ θ
θ θ
θ θ
θ θ
θ θ
θ
θ
θ
θ θ θ θ θ θ
θ
θ θ
θ
θ
θ
θ
θ
θ θ
θ θ
θ θ
θ θ θ
θ θ θ
θ
θ
Figure 5.2 XRD of SF-FSP powder (α = PDF 71-1124, θ = PDF 23-109).
95

Figure 5.3 SEM of SF-FSP powder (86% α-Al2O3) obtained from LF-FSP t-Al2O3
precursor powder.
96

Figure 5.4 TEM of SF-FSP (86% α-Al2O3) powder obtained from LF-FSP t-Al2O3
precursor powder (Darvan-CN was used as dispersant)
97

20 nm
Figure 5.5 TEM of SF-FSP (86% α-Al2O3) powder obtained from LF-FSP t-Al2O3
precursor powder.
98

Figure 5.6 HRTEM of a single particle of SF-FSP α-Al2O3 powder obtained from LF-
FSP t-Al2O3 precursor powder (Moire fringes can be observed at 45° from the lattice
planes due to interference from other crystallographic planes).
99

Figure 5.7. Electron diffraction of a single particle of SF-FSP α-Al2O3 powder obtained
from LF-FSP t-Al2O3 precursor powder.
100

40 nm Pr
obab
ility
Figure 5.8 DLS of SF-FSP (86% α-Al2O3) powder obtained from LF-FSP t-Al2O3
precursor powder, indicating an average particle size of 35 nm, highest size probability of
40 nm.
101

Figure 5.9 FTIR of Degussa precursor and SF-FSP powder derived from it.
102

2
2.5
3
3.5
4
800 900 1000 1100 1200 1300 1400 1500 1600
density (10c/min)density (20�C/min)density 5C/min)
temperature (�C)
Den
sity
(g/c
m3)
Figure 5.10 Sintering curve of α-Al2O3 pellets (after binder burnout at 800°C for 2 h) at
constant heating rate (5, 10, 20°C/min).
103
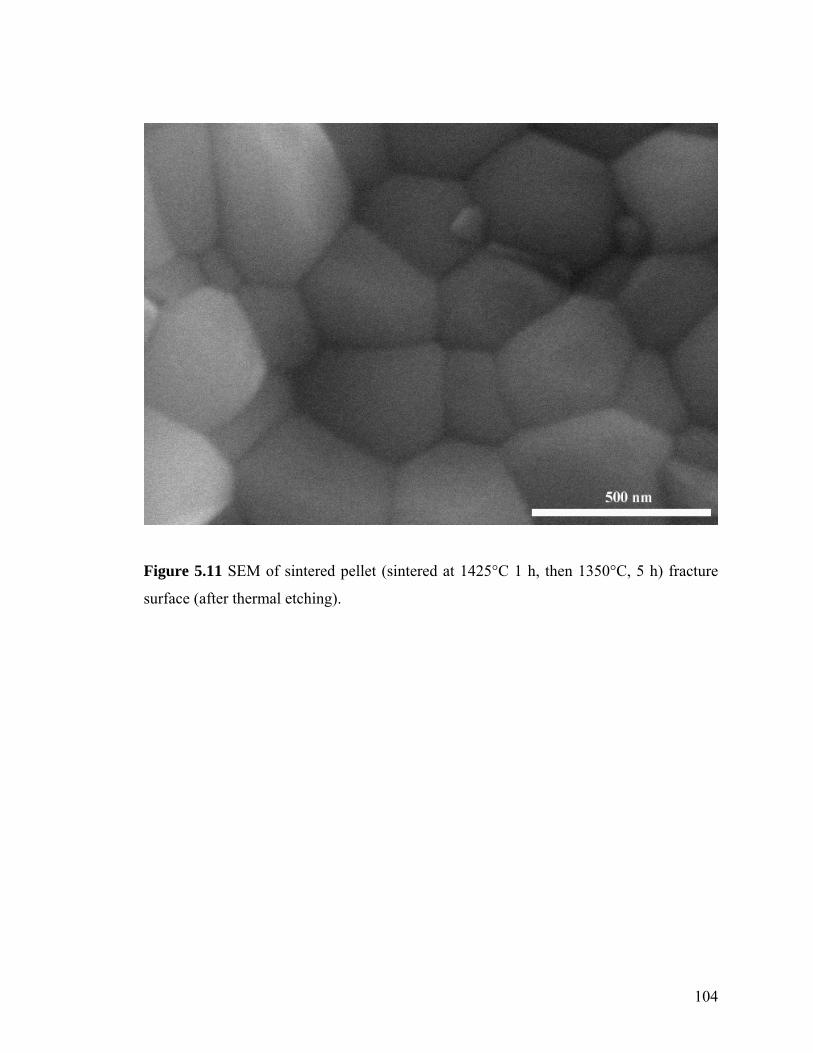
Figure 5.11 SEM of sintered pellet (sintered at 1425°C 1 h, then 1350°C, 5 h) fracture
surface (after thermal etching).
104
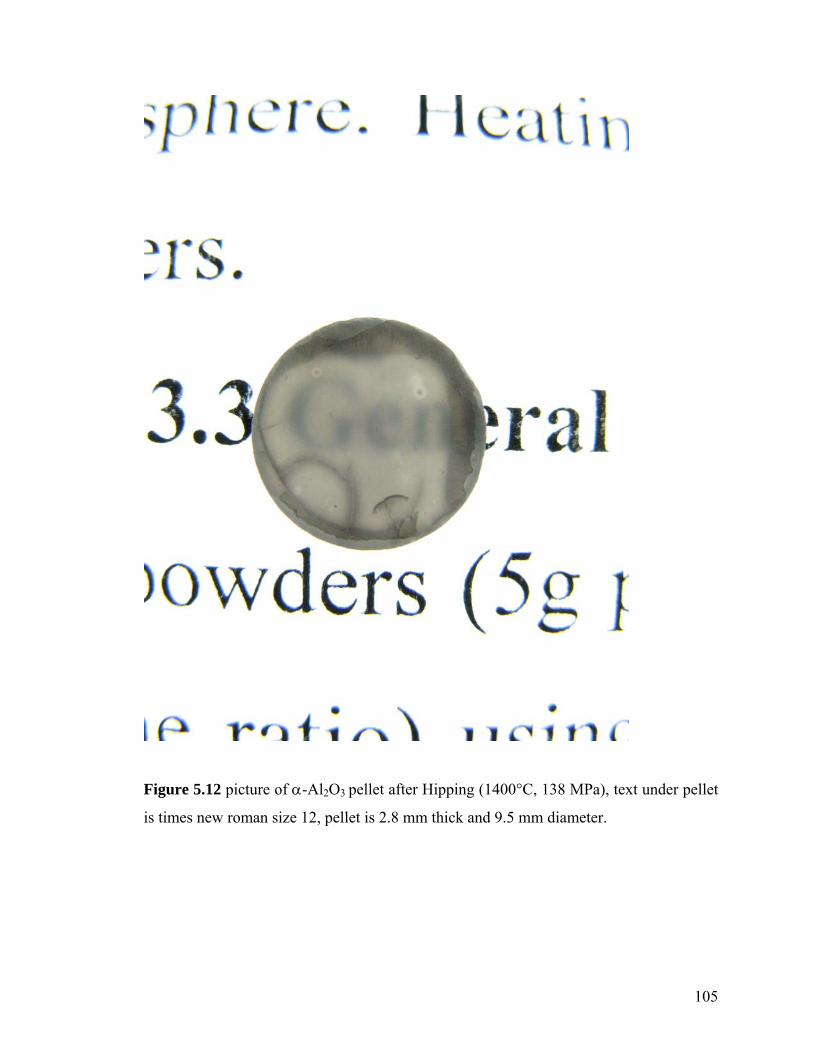
Figure 5.12 picture of α-Al2O3 pellet after Hipping (1400°C, 138 MPa), text under pellet
is times new roman size 12, pellet is 2.8 mm thick and 9.5 mm diameter.
105

5.5 References 1W.A. Yarbrough, R. Roy, “Microstructural evolution in sintering of AlOOH gels”, J.
Mater. Res., 1987 2 (4) 494. 2J. P. Parimal, G. Gilde, P. Dehmer, J. McCauley, “Transparent ceramics for armor and
EM window applications”, SPIE Proc., 2000 4102 1. 3G. Fischman, “Validated Microstructural Assessment of Femoral Heads”, J. ASTM Int.,
2004 1 1. 4V. Saikko, J. Keränen, “Wear simulation of alumina-on-alumina prosthetic hip joints
using a multidirectional motion pin-on-disk device”, J. Am. Ceram. Soc., 2002 85 2785. 5J. D’Antonio, W. Capello, M. Manley, B. Bierbaum, “New experience with alumina-on-
alumina ceramic bearings for total hip arthroplasty”, J. Arthroplasty, 2002 17 390. 6A. Krell, P. Blank, H. Ma, T. Hutzler, M. Nebelung, “Processing of high-density
submicrometer Al O for new applications2 3 ”, J. Am. Ceram. Soc., 2003 86 12. 7M.T. Swihart, “Vapor-phase synthesis of nanoparticles”, Current. Opinion Col.
Interface Sci., 2003 8 127. 8A. Gutsch, M. Krämer, G. Michael, H. Mühlenweg, M. Pridöhl, G. Zimmermann, “Gas
Phase Production of Nanoparticles”, Kona, 2002 20 24. 9T. Hinklin, B. Toury, C. Gervais, F. Babonneau, J.J. Gislason, R.W. Morton, R.M. Laine
“Liquid-Feed Flame Spray Pyrolytic Synthesis of Nanoalumina Powders”, Chem. Mater.,
2004 16 (1) 21. 10G. P. Johnston, R. Muenchausen, S. Foltyn, D.M. Smith, W. Fahrenholtz, “Reactive
laser ablation synthesis of nanosize alumina powder”, J. Am. Ceram. Soc., 1992 75 3293. 11R. Apetz, R.P. Brugen, “Transparent Alumina: A Light-Scattering Model”, J. Am.
Ceram. Soc., 2003 86 (3) 480. 12R.B Bagwell, G.L Messing, P.R Howell, “The Formation of α-Al2O3 from θ-Al2O3:
The relevance of a “critical size”, J. Mater. Sci,. 2001 36 1833. 13H.L. Wen, F.S. Yen, “Growth characteristics of boehmite-derived ultrafine theta and
alpha-alumina particles during phase transformation”, J. Crystal Growth, 2000 208 696. 14J. Echeberria, J. Tarazona, J.Y. He, T. Butler, F Castro,”Sinter-HIP of α-alumina
powders with sub-micron grain sizes”, J. Europ. Ceram. Soc., 2002 22 1801.
106

15J.M. Hale, A. Aurox, A.J. Perotta,, A. Navrotsky “Surface Energies and
Thermodynamic Phase Stability in Nanocrystalline Aluminas”, Science, 1997 277 788. 16J.M. McHale, A Navrotsky, A.J. Perrotta, “Surface Energies and Thermodynamic Phase
Stability in Nanocrystalline Aluminas”J. Phys. Chem. B, 1997 101 603. 17M. Hongwei , A Krell, ”Synthesis and processing of nano-alpha-Al2O3 powders”, Key
Eng. Mater., 2002 200 43. 18J. Azurdia, J. Marchal, R.M. Laine, “Synthesis and Characterization of Mixed-Metal
Oxide Nanopowders Along the CoOx–Al2O3 Tie Line Using Liquid-Feed Flame Spray
Pyrolysis”, J. Am. Ceram. Soc., 2006 8 (9) 2749. 19R.M., Laine, J., Marchal, H.P. Sun, X.P. Pan, “A new Y Al O phase produced by
liquid-feed flame spray pyrolysis (LF-FSP)3 5 12
”, Adv. Mater., 2005 17 (7) 83020. 20R.A. Kimel, J.H. Adair, ”Aqueous Synthesis at 200°C of Sub-10 Nanometer Yttria
Tetragonally Stabilized Zirconia Using a Metal-Ligand Approach”, J. Am. Ceram. Soc,.
2005 88 (5) 1133. 21D. Godlinski, M. Kuntz, G. Grathwohl, “Transparent alumina with submicrometer
grains by float packing and sintering ”, J Am Cer Soc , 2002 85 (10) 2449. 22I.W.P. Chen, J. Chen, “Sintering of Fine Oxide Powders: II, Sintering Mechanisms”, J.
Am. Ceram. Soc., 1997 80 (3) 637.
107

Chapter 6: Future work
6.1 Discussion
In this work, liquid and suspension-feed flame spray pyrolysis (LF-FSP and SF-
FSP) was used to demonstrate control of stoichiometry as well as the phases obtained in
single and mixed metal oxide nanopowders. These processes allow the synthesis of YAG
(garnet Y3Al5O12), hexagonal Y3Al5O12 and α-Al2O3 unagregated nanopowders.
Nanograined translucent YAG and α-Al2O3 monoliths were obtained by pressureless
sintering of these nanopowders. Investigation of hot isostatic pressing of YAG and α-
Al2O3 to obtain ceramic monoliths with high transparency for optical applications, was
limited due to technical difficulties, but early results with a custom- designed
molybdenum furnace hot isostatic press showed promising results as detailed in Chapter
5.
Initial work has been done on doping YAG and α-Al2O3 with transition metal (Cr,
Fe, Ti) as well as rare earth (Nd, Yb, Pr, Yb, Eu) or other dopants (Si). Sintering these
nanopowders into transparent monoliths, using our new HIP apparatus would allow
development of new polycrystalline laser hosts.2,3 Figure 6.1 shows early work on doped
YAG monoliths. Further investigation is required to determine the differences in sintering
behavior in these doped materials as well the dopants solubility in these nano-materials.
The SF-FSP technique developed in this work, was used by other members of the
group to form core shell nanopowders in the ceria-zirconia-alumina system.4 Further
investigation of core shell nanopowders could involve coating α-Al2O3 with sintering
aids (MgO, Cr2O3) to potentially decrease sintering temperatures and therefore obtain
transparent α-Al2O3 monoliths with even smaller grain size (and higher in-line
transmission of light). Investigation of dopants surface or bulk location in the
nanopowders, by comparing luminescence results between doped YAG obtained by one-
step LF-FSP (homogeneous distribution of dopants in the particle) or two step SF-FSP
(dopants located at surface of particle) could show the potential for tailored phosphors.
FS-FSP could also be used to react nanopowders with metalloorganic precursor
to potentially change the phase obtained in multi-metallic oxide nanopowders. For
108

example, α-Al2O3 nanopowders could be reacted with yttrium propionate precursors in
SF-FSP to obtain YAG nanopowders.
Further work should examine the conversion of doped (Cr, Mg, Fe, Ce) transition
alumina nanopowders to doped α-Al2O3 by SF-FSP and possible changes in sintering
behavior. Studies have already been made on Cr-doped transition alumina5 and those
early results prompted the development of the SF-FSP techniques described in chapter 5.
Pressureless sintering and/or HIPing of these nanopowders would provide a new route to
manufacture polycrystalline lasers.
109

Figure 6.1 Photograph of doped and undoped YAG monoliths (each pellet is 2.5-3 mm
thick and 11-13mm diameter). From Top left corner, clockwise: 1 mol% Ni:YAG, YAG,
0.1mol% Si:YAG, 0.5mol% YAG, YAG, 2 mol% Ni:YAG.
110

6.2 References
1M. Heyrman, C. Chatillon, “Thermodynamics of the Al–C–O Ternary System”, J.
Electrochem. Soc., 2006 153, E119. 2E.A. Khazanov, M. Sergeev, “Concept study of a 100-PW femtosecond laser based
on laser ceramics doped with chromium ions”, Laser Phys, 2007 17 (12) 1398. 3Y. Wu, J. Li, Y. Pan, J, Guo, B. Jiang, “Diode-Pumped Yb:YAG Ceramic
Laser”, J. Am. Cer. Soc. 2007 90 (10) 3334. 4M. Kim, R. Laine, “Combinatorial processing of mixed-metal oxide nanopowders
along the ZrO2-Al2O3 tie line using LF-FSP”, J. Cer. Proc. Res., 2007 8 129. 5R.M. Laine, J. Marchal, J. Azurdia, R, Rennensund, “LF-FSP Modification of
nanoparticles”, US patent application 20060087062 (2006).
111