syntax - top 30 enrolling centers: i - bcis.org.uk · andrejs bochenek janus drzewiecki elisabeth...
TRANSCRIPT
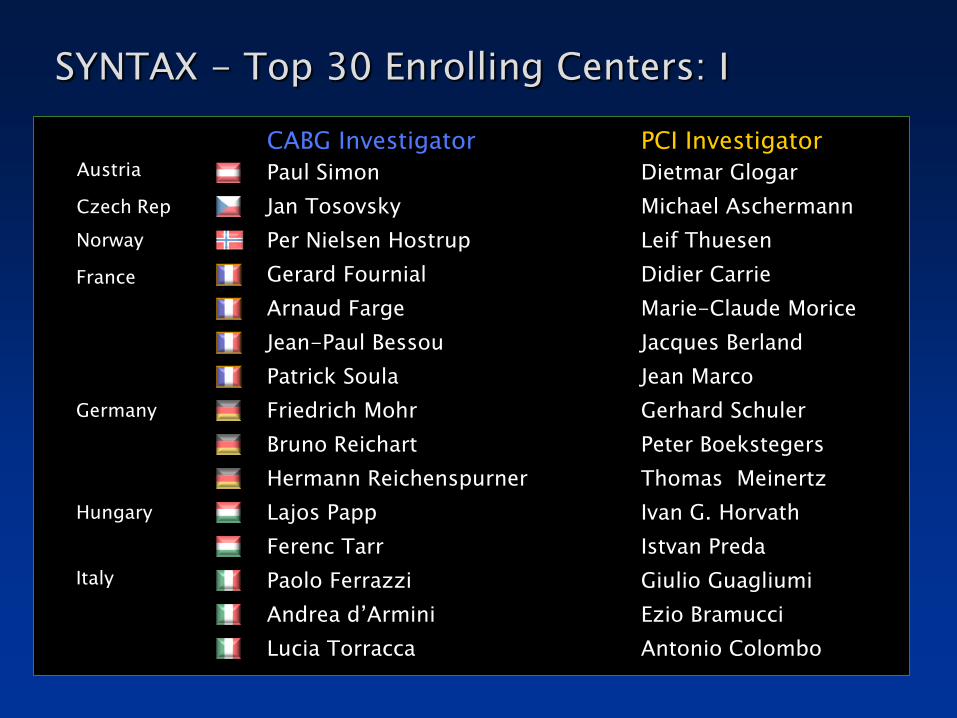
SYNTAX - Top 30 Enrolling Centers: I
CABG Investigator PCI Investigator
Paul Simon Dietmar Glogar
Jan Tosovsky Michael Aschermann
Per Nielsen Hostrup Leif Thuesen
Gerard Fournial Didier Carrie
Arnaud Farge Marie-Claude Morice
Jean-Paul Bessou Jacques Berland
Patrick Soula Jean Marco
Friedrich Mohr Gerhard Schuler
Bruno Reichart Peter Boekstegers
Hermann Reichenspurner Thomas Meinertz
Lajos Papp Ivan G. Horvath
Ferenc Tarr Istvan Preda
Paolo Ferrazzi Giulio Guagliumi
Andrea d’Armini Ezio Bramucci
Lucia Torracca Antonio Colombo
Austria
Czech Rep
Norway
France
Germany
Hungary
Italy

CABG Investigator PCI Investigator
Mattia Glauber Sergio Berti
Romans Lacis Andrejs Erglis
Pieter Kappetein Patrick Serruys
Jacques Schonberger Jacques Koolen
Andrejs Bochenek Janus Drzewiecki
Elisabeth Stahle Stefan James
Stephen Westaby Adrian Banning
Geoff Berg Keith G. Oldroyd
Steven Livesey Keith D. Dawkins
Jatin Desai Martyn Thomas
Tomasz Spyt Anthony H. Gershlick
Andrew Forsyth Adam De Belder
Graham Venn Simon Redwood
William Killinger Tift Mann
Michael Mack David L. Brown
SYNTAX - Top 30 Enrolling Centers: II
Italy
Latvia
Netherlands
Poland
Sweden
UK
US

SYNTAX
Heart team meeting - surgeon(s) and interventional cardiologist(s) assess each patient
Operative risk (EuroSCORE & Parsonnet score)
Coronary lesion complexity (SYNTAX score)
Sianos et al, EuroIntervention 2005;1:219-227 Valgimigli et al, Am J Cardiol 2007;99:1072-1081 Serruys et al, EuroIntervention 2007;3:450-459
BARI classification of coronary segments Leaman score, Circ 1981;63:285-299 Lesions classification ACC/AHA , Circ 2001;103:3019-3041 Bifurcation classification, CCI 2000;49:274-283 CTO classification, J Am Coll Cardiol 1997;30:649-656
No. &
Location
of lesion Left
Main
Tortuosity
3 Vessel Thrombus
Bifurcation CTO
Calcification
SYNTAX
SCORE
Dominance

Isolated left main
Limited Exclusion Criteria Previous interventions (PCI or CABG) Acute MI with CPK>2x Concomitant cardiac surgery
SYNTAX Trial- Eligible Patients
De novo disease
Revascularisation in all 3 vascular territories
3-vessel disease
left main + 1-vessel disease
left main + 2-vessel disease
left main + 3-vessel disease
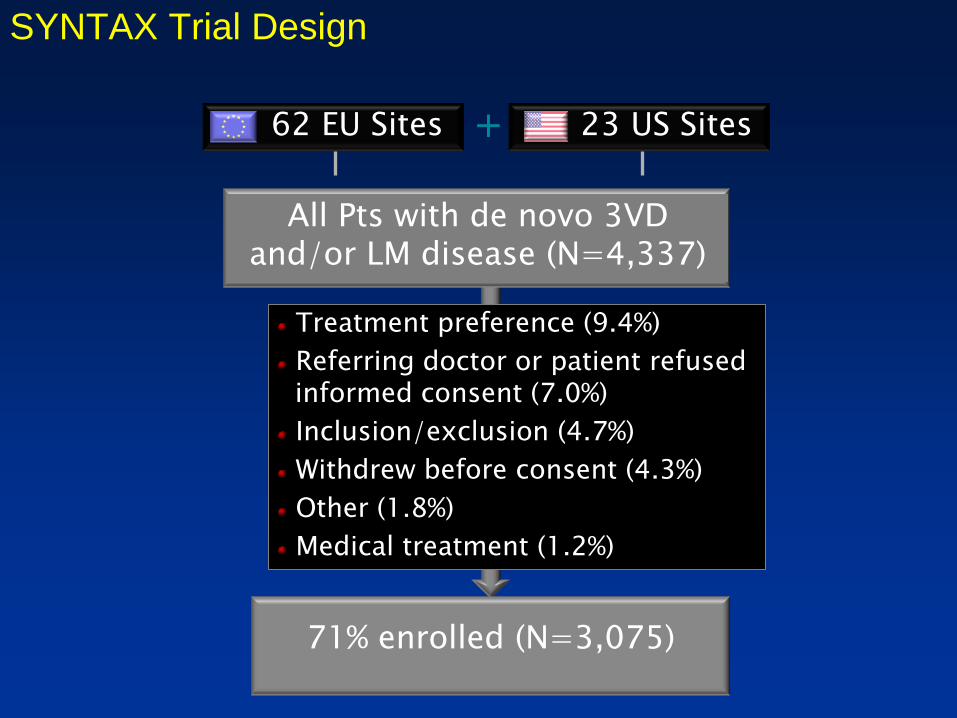
71% enrolled (N=3,075)
All Pts with de novo 3VD and/or LM disease (N=4,337)
Treatment preference (9.4%)
Referring doctor or patient refused informed consent (7.0%)
Inclusion/exclusion (4.7%)
Withdrew before consent (4.3%)
Other (1.8%)
Medical treatment (1.2%)
23 US Sites 62 EU Sites +
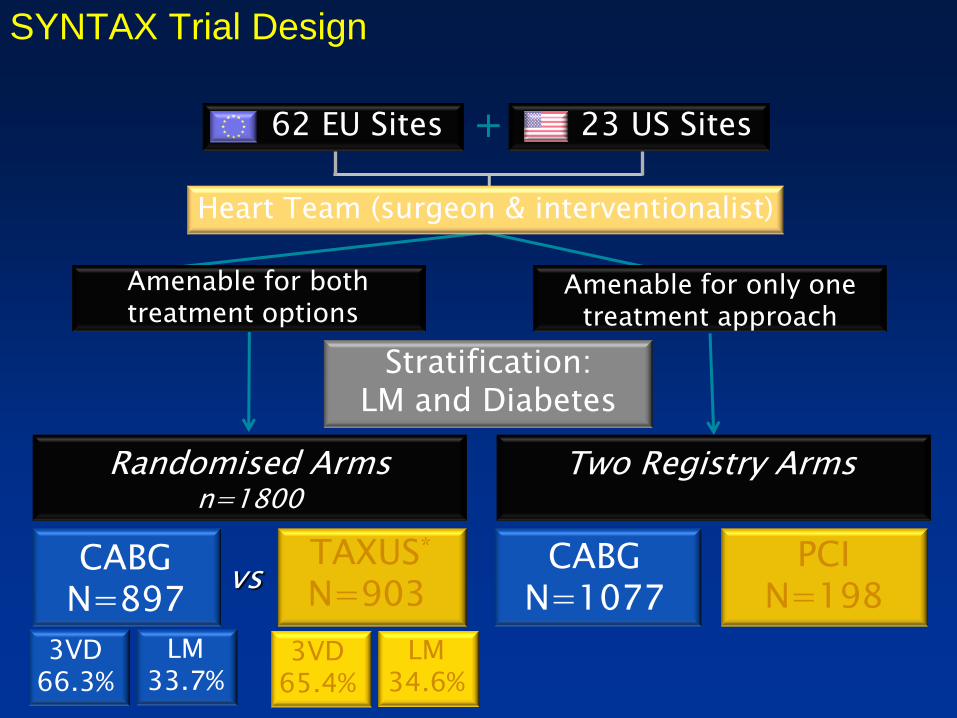
SYNTAX Trial Design
TAXUS n=903
PCI n=198
CABG n=1077
CABG n=897
no f/u n=428
5yr f/u n=649
PCI all captured w/
follow up
CABG 2500
750 w/ f/u vs
Total enrollment N=3075
Stratification: LM and Diabetes
Two Registry Arms
Randomized Arms n=1800
Two Registry Arms
Randomised Arms n=1800
Heart Team (surgeon & interventionalist)
PCI N=198
CABG N=1077
Amenable for only one treatment approach
TAXUS*
N=903 CABG
N=897 vs
Amenable for both treatment options
Stratification: LM and Diabetes
LM 33.7%
3VD 66.3%
LM 34.6%
3VD 65.4%
23 US Sites 62 EU Sites +
SYNTAX Trial Design

71% enrolled (N=3,075)
All Pts with de novo 3VD and/or LM disease (n=4,337)
Treatment preference (9.4%)
Referring MD or pts. refused informed consent (7.0%)
Inclusion/exclusion (4.7%)
Withdrew before consent (4.3%)
Other (1.8%)
Medical treatment (1.2%) TAXUS n=903
PCI n=198
CABG n=1077
CABG n=897
no f/u n=428
5yr f/u n=649
PCI all captured w/
follow up
CABG 2500
750 w/ f/u vs
Total enrollment N=3075
Stratification: LM and Diabetes
Two Registry Arms
Randomized Arms n=1800
Two Registry Arms
Randomised Arms n=1800
Heart Team (surgeon & interventionalist)
PCI N=198
CABG N=1077
Amenable for only one treatment approach
TAXUS*
N=903 CABG
N=897 vs
Amenable for both treatment options
Stratification: LM and Diabetes
LM 33.7%
3VD 66.3%
LM 34.6%
3VD 65.4%
DM 28.5%
Non DM 71.5%
NonDM 71.8%
DM 28.2%
23 US Sites 62 EU Sites +
SYNTAX Trial Design
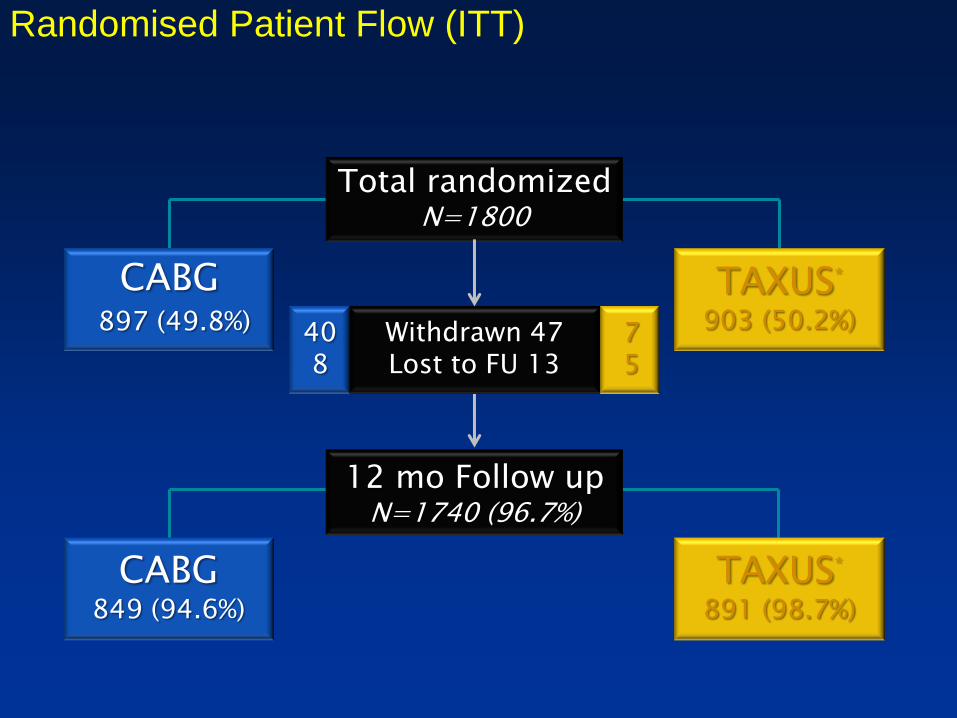
Withdrawn 47 Lost to FU 13
12 mo Follow up N=1740 (96.7%)
Total randomized N=1800
TAXUS*
891 (98.7%)
7 5
TAXUS*
903 (50.2%)
CABG 897 (49.8%)
CABG 849 (94.6%)
40 8
Randomised Patient Flow (ITT)

Patient Characteristics (l) Randomised Cohort
CABG N=897
TAXUS* N=903
P value
Age, mean ± SD (y) 65.0 ± 9.8 65.2 ± 9.7 0.55
Male, % 78.9 76.4 0.20
BMI, mean ± SD 27.9 ± 4.5 28.1 ± 4.8 0.37
Diabetes, % 28.5 28.2 0.89
Hypertension, % 77.0 74.0 0.14
Hyperlipidemia, % 77.2 78.7 0.44
Current smoker, % 22.0 18.5 0.06
Prior MI, % 33.8 31.9 0.39
Unstable angina, % 28.0 28.9 0.67
Additive EuroSCORE, mean ± SD 3.8 ± 2.7 3.8 ± 2.6 0.78
Total Parsonnet score , mean ± SD 8.4 ± 6.8 8.5 ± 7.0 0.76
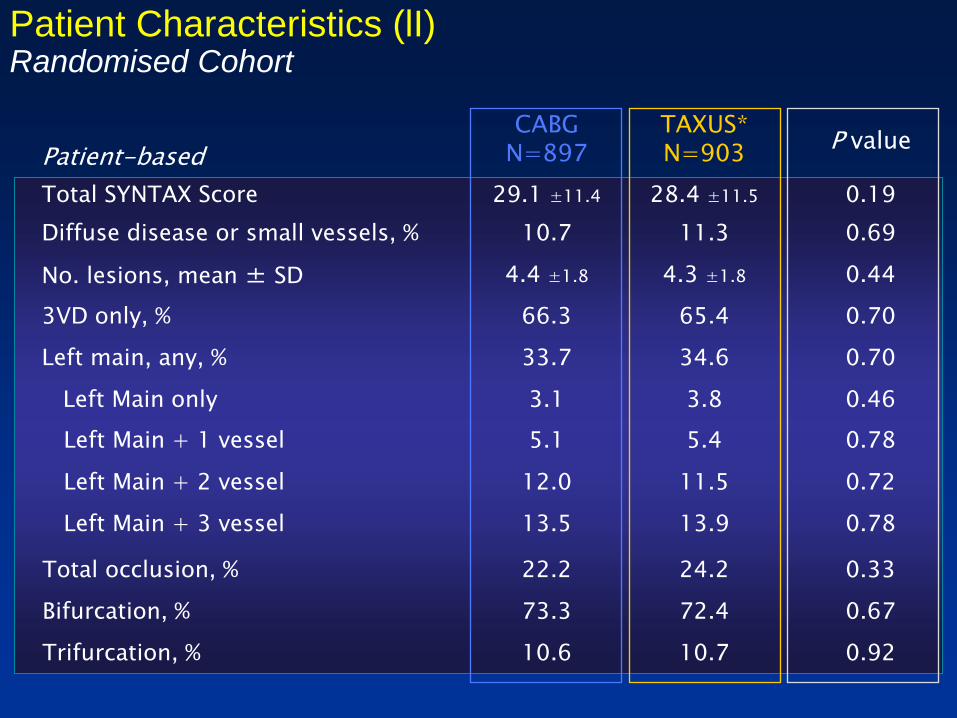
Patient Characteristics (lI) Randomised Cohort
Patient-based
CABG N=897
TAXUS* N=903
P value
Total SYNTAX Score 29.1 ±11.4 28.4 ±11.5 0.19
Diffuse disease or small vessels, % 10.7 11.3 0.69
No. lesions, mean ± SD 4.4 ±1.8 4.3 ±1.8 0.44
3VD only, % 66.3 65.4 0.70
Left main, any, % 33.7 34.6 0.70
Left Main only 3.1 3.8 0.46
Left Main + 1 vessel 5.1 5.4 0.78
Left Main + 2 vessel 12.0 11.5 0.72
Left Main + 3 vessel 13.5 13.9 0.78
Total occlusion, % 22.2 24.2 0.33
Bifurcation, % 73.3 72.4 0.67
Trifurcation, % 10.6 10.7 0.92

Baseline Characteristics in DES Patients SYNTAX Trial Versus 2 Large, Multicenter MVD Registries
ARTS II
N=607
NY State
N=9963
SYNTAX
N=903
Age, mean±SD (y) 63 ± 10 65.4 ± 11.9 65.2 ± 9.7
Male, % 77 67.2 76.4
BMI, mean±SD 27.5 ± 4.1 - 28.1 ± 4.8
Diabetes, % 26 32.7 28.2
Hypertension, % 67 - 74.0
Hyperlipidemia, % 74 - 78.7
Current smoker, % 19 - 18.5
Prior MI, % 34 33.7 31.9
History of CHF, % - 10.1 4.0
Renal Failure* - 1.4 1.1
Left Main, % excluded excluded 35%
3 Vessel Disease, % 54% 25% 91%
*Creatinine >220µmol/liter for NY State, >200µmol/liter for the SYNTAX trial
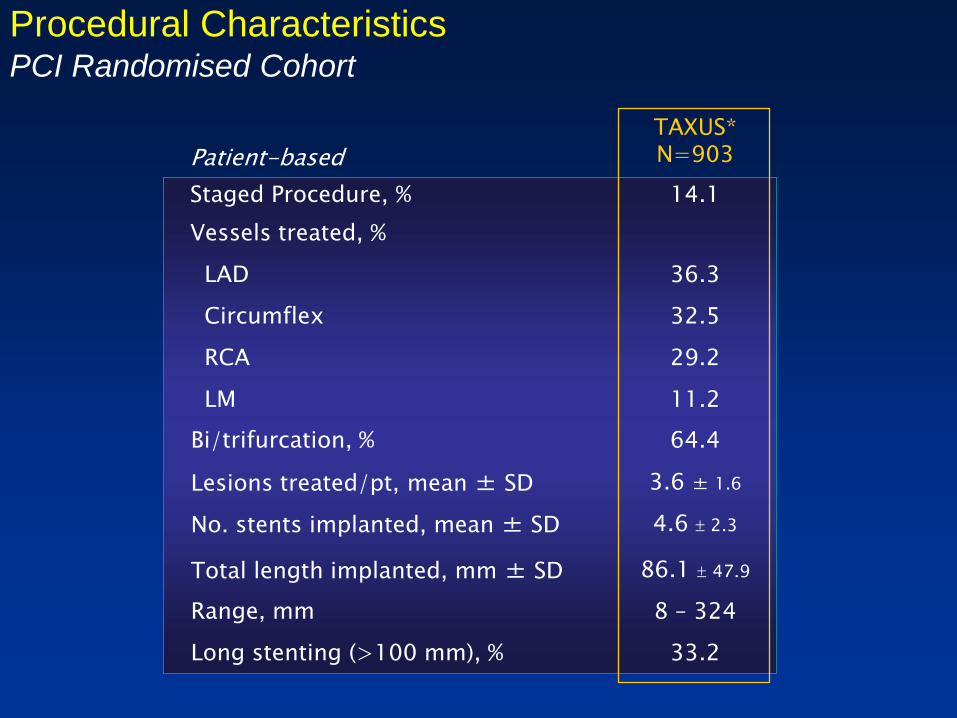
Patient-based
TAXUS* N=903
Staged Procedure, % 14.1
Vessels treated, %
LAD 36.3
Circumflex 32.5
RCA 29.2
LM 11.2
Bi/trifurcation, % 64.4
Lesions treated/pt, mean ± SD 3.6 ± 1.6
No. stents implanted, mean ± SD 4.6 2.3
Total length implanted, mm ± SD 86.1 47.9
Range, mm 8 – 324
Long stenting (>100 mm), % 33.2
Procedural Characteristics PCI Randomised Cohort
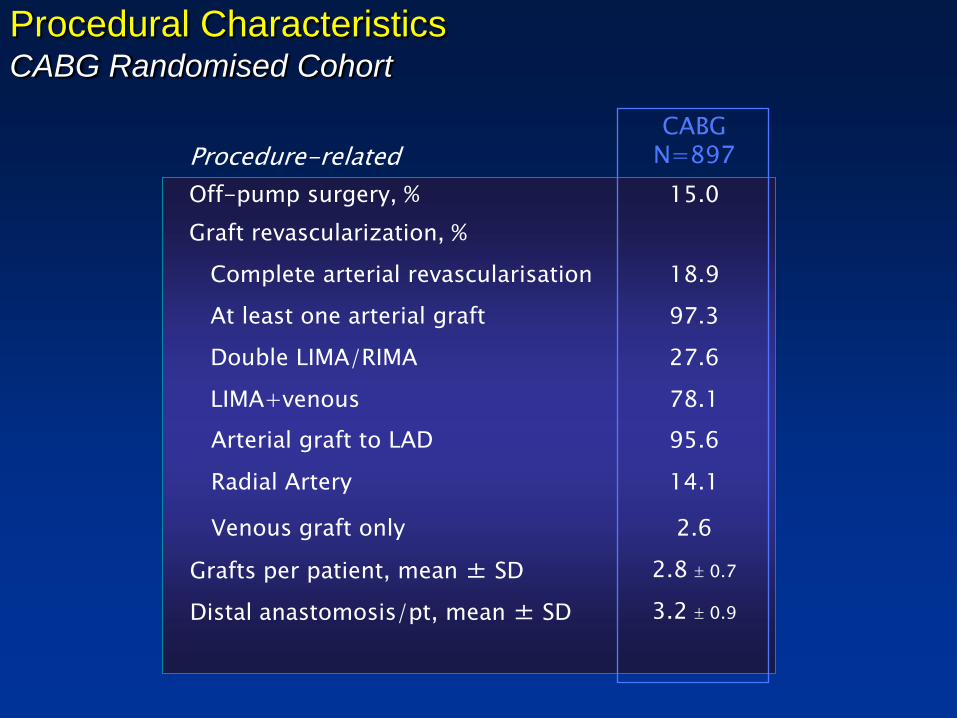
Procedure-related CABG
N=897
Off-pump surgery, % 15.0
Graft revascularization, %
Complete arterial revascularisation 18.9
At least one arterial graft 97.3
Double LIMA/RIMA 27.6
LIMA+venous 78.1
Arterial graft to LAD 95.6
Radial Artery 14.1
Venous graft only 2.6
Grafts per patient, mean ± SD 2.8 0.7
Distal anastomosis/pt, mean ± SD 3.2 0.9
Procedural Characteristics CABG Randomised Cohort
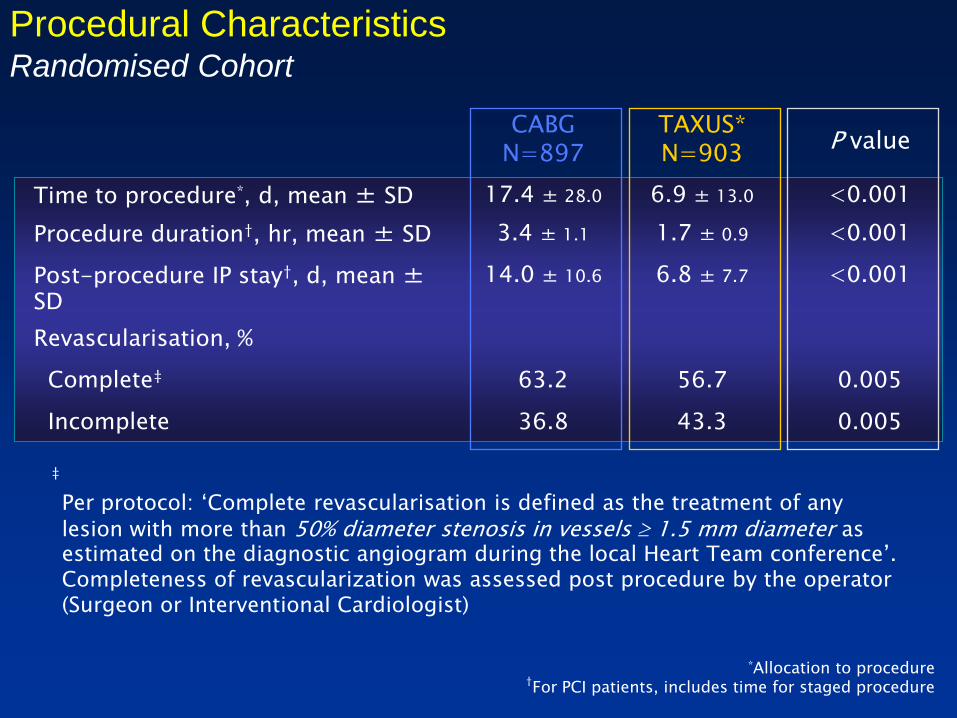
Procedural Characteristics Randomised Cohort
CABG N=897
TAXUS* N=903
P value
Time to procedure*, d, mean ± SD 17.4 ± 28.0 6.9 ± 13.0 <0.001
Procedure duration†, hr, mean ± SD 3.4 ± 1.1 1.7 ± 0.9 <0.001
Post-procedure IP stay†, d, mean ± SD
14.0 ± 10.6 6.8 ± 7.7 <0.001
Revascularisation, %
Complete‡ 63.2 56.7 0.005
Incomplete 36.8 43.3 0.005
*Allocation to procedure †For PCI patients, includes time for staged procedure
Per protocol: ‘Complete revascularisation is defined as the treatment of any
lesion with more than 50% diameter stenosis in vessels 1.5 mm diameter as estimated on the diagnostic angiogram during the local Heart Team conference’. Completeness of revascularization was assessed post procedure by the operator (Surgeon or Interventional Cardiologist)
‡
ITT; ¥Fisher Exact Test
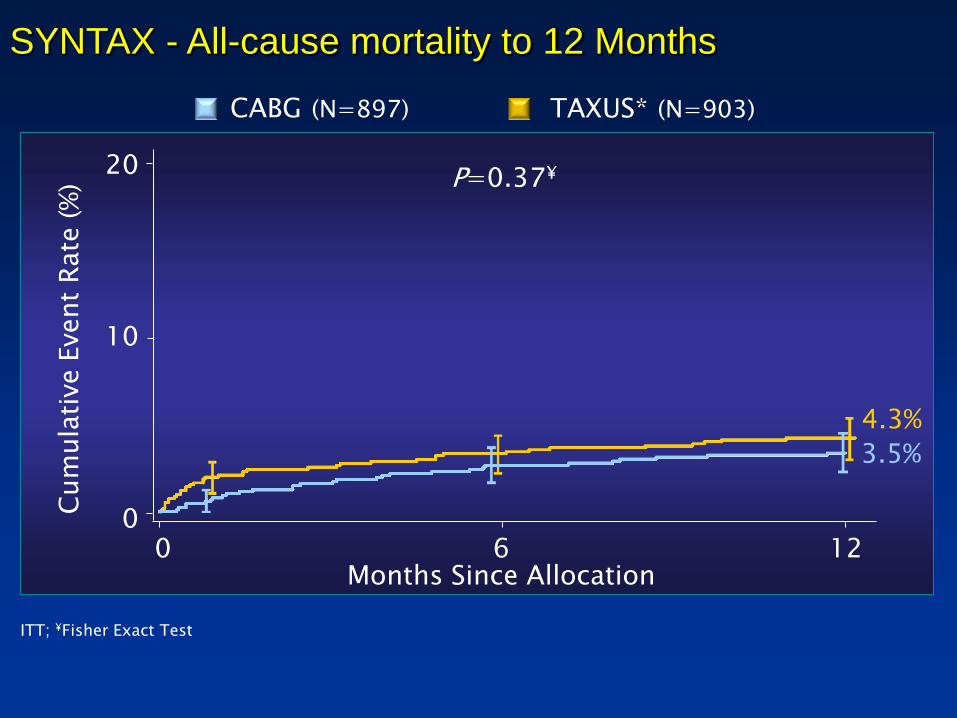
P=0.37¥
SYNTAX - All-cause mortality to 12 Months
4.3%
3.5%
0 6 12
10
20
0
Months Since Allocation
Cum
ula
tive E
vent
Rate
(%
)
TAXUS* (N=903) CABG (N=897)
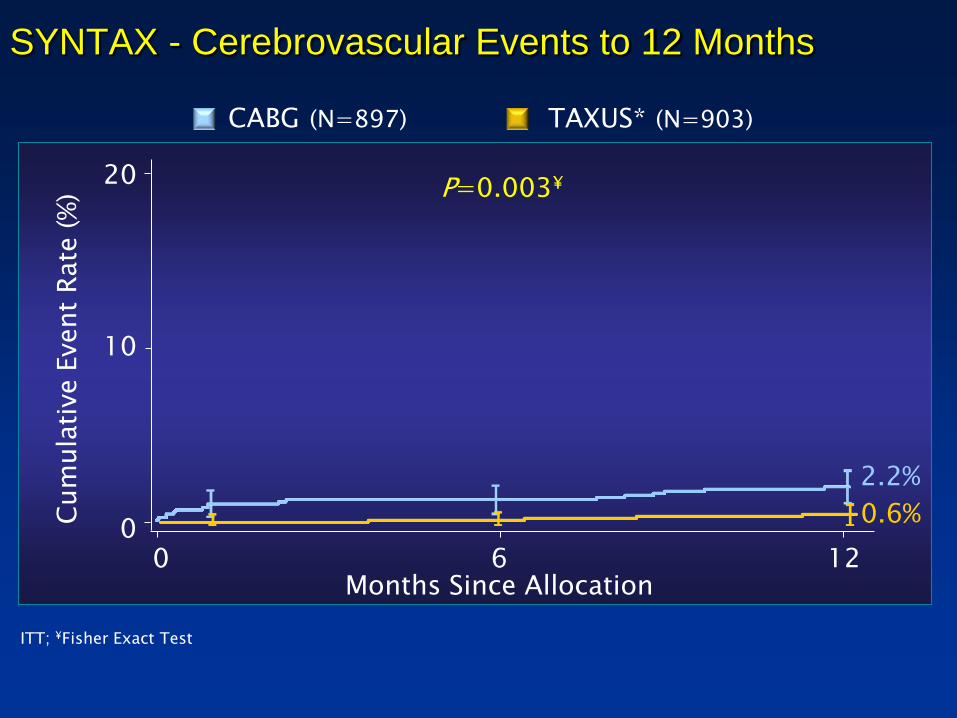
SYNTAX - Cerebrovascular Events to 12 Months
0.6%
2.2%
0 6 12
10
20
0
Months Since Allocation
Cum
ula
tive E
vent
Rate
(%
)
TAXUS* (N=903) CABG (N=897)
P=0.003¥
ITT; ¥Fisher Exact Test
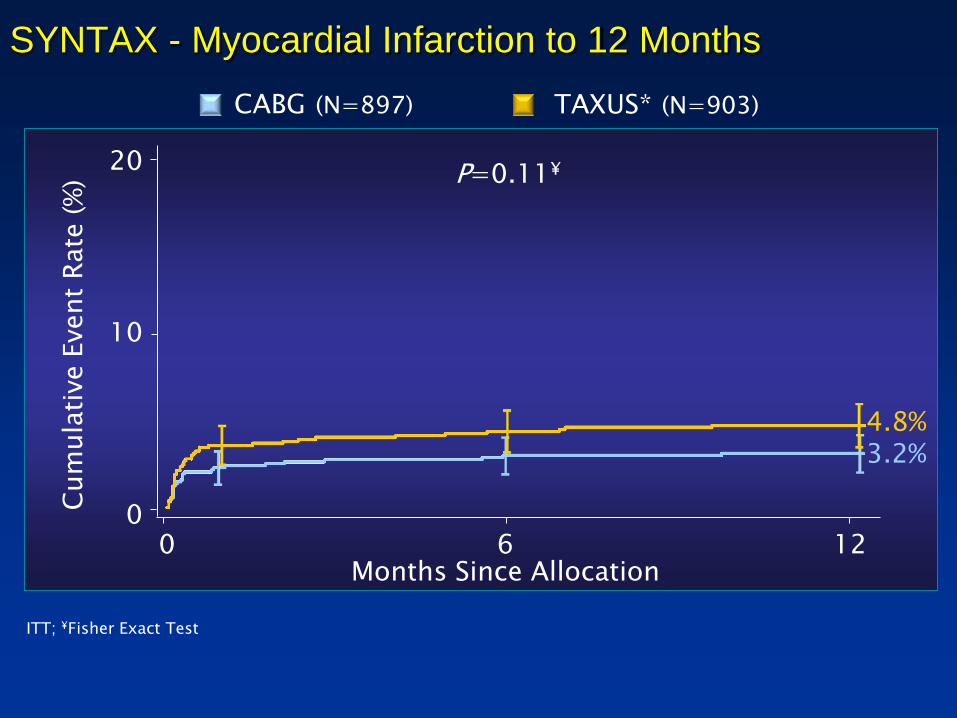
SYNTAX - Myocardial Infarction to 12 Months
3.2% 4.8%
0 6 12
10
20
0
Months Since Allocation
Cum
ula
tive E
vent
Rate
(%
)
TAXUS* (N=903) CABG (N=897)
P=0.11¥
ITT; ¥Fisher Exact Test
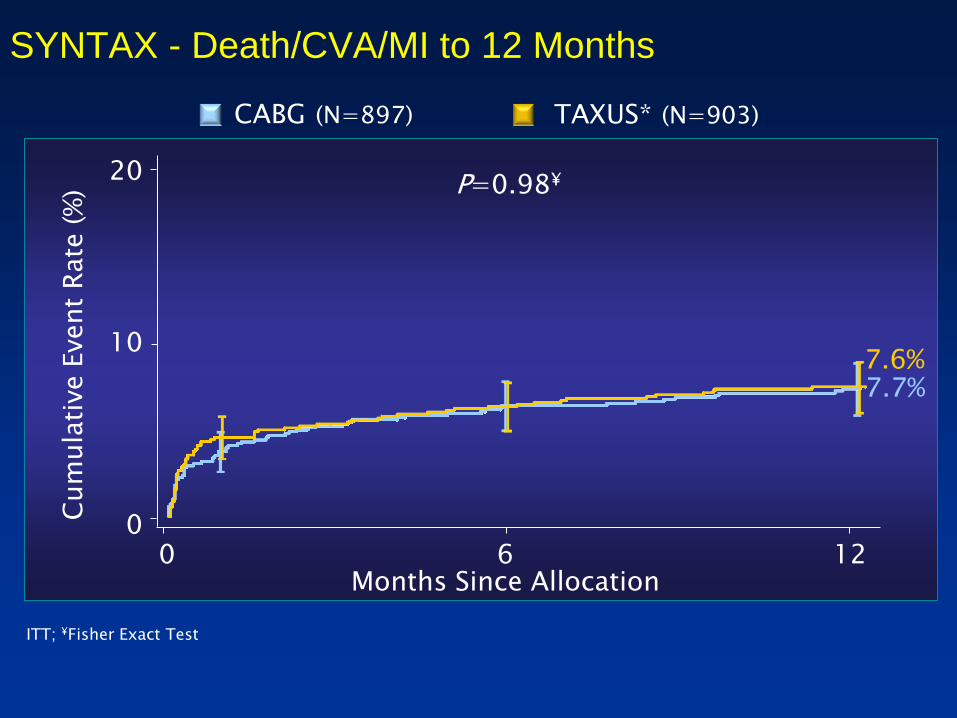
SYNTAX - Death/CVA/MI to 12 Months
P=0.98¥
0 6 12
10
20
0
Months Since Allocation
Cum
ula
tive E
vent
Rate
(%
)
7.7% 7.6%
TAXUS* (N=903) CABG (N=897)
ITT; ¥Fisher Exact Test

SYNTAX - Symptomatic Graft Occlusion & Stent Thrombosis at 12 Months
3.3 3.4
P=0.89
CABG TAXUS
Pati
ents
(%
)
n=27 n=28
TAXUS* (N=903) CABG (N=897)
ITT population

SYNTAX - Repeat Revascularisation to 12 Months
5.9%
13.7%
0 6 12
10
20
0
Months Since Allocation
Cum
ula
tive E
vent
Rate
(%
)
TAXUS* (N=903) CABG (N=897)
P<0.0001¥
ITT; ¥Fisher Exact Test
Repeat Revasc
CABG Group
PCI Group
PCI 4.7% 11.4%
CABG 1.3% 2.8%
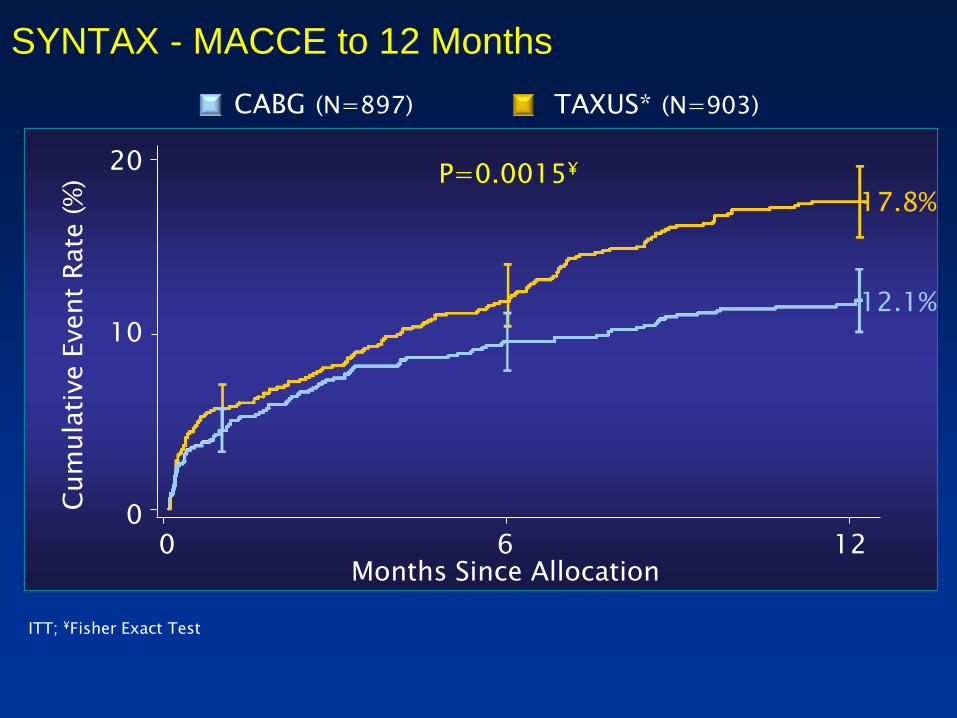
SYNTAX - MACCE to 12 Months
P=0.0015¥
0 6 12
10
20
0
Months Since Allocation
Cum
ula
tive E
vent
Rate
(%
)
12.1%
17.8%
TAXUS* (N=903) CABG (N=897)
ITT; ¥Fisher Exact Test

SYNTAX - 12 Month Clinical Event Rates
Patients (%)
CABG (N=897) TAXUS* (N=903)
ITT, Kaplan-Meier Rates; Fisher Exact Test
All Death
CVA
MI
Death/MI/CVA
Revascularisation
P=0.37
P=0.003
P=0.11
P=0.98
P<0.0001
3.5
2.2
3.2
7.7
5.9
4.3
0.6
4.8
7.6
13.7

Primary Endpoint: 12 Month MACCE Non-inferiority analysis
Non-inferiority comparison was not met for the primary endpoint, further comparisons for the LM and 3VD subgroups are observational only and hypothesis generating
0 5% 10% 15%
Pre-specified Margin = 6.6%
Difference in MACCE
20%
+95% CI = 8.3% 5.5%

48% of patients received ≥5 stents
Max #
14 stents!
Stent Number and Length Higher in the SYNTAX Trial
0
5
10
15
20
0 1 2 3 4 5 6 7 8 9 10 11 12 13 14
Pa
tie
nts
(%
)
Total Number of Stents Implanted per Patient
Multivessel disease: 96.2%*
3-vessel disease: 90.8%
Avg. stents per patient: 4.6 ± 2.3
Avg. stented length: 86.1 mm
*3VD+LM/3VD+LM/2VD+LM/1VD
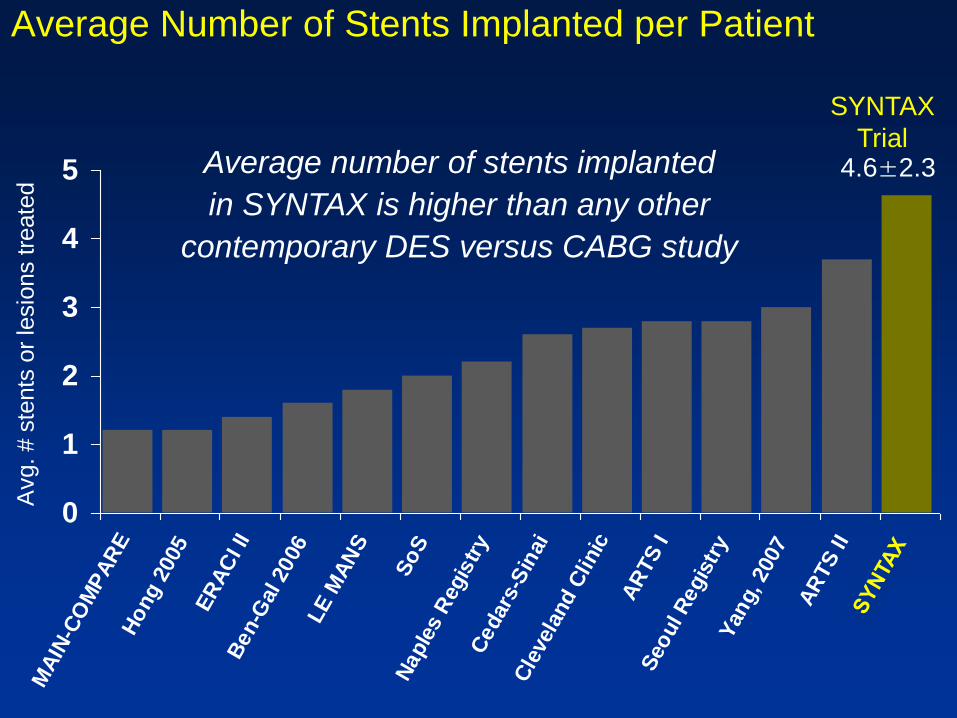
Average Number of Stents Implanted per Patient
0
1
2
3
4
5
MA
IN-C
OM
PA
RE
Ho
ng 2
005
ER
AC
I II
Ben-G
al 2006
LE
MA
NS
So
SN
aple
s R
egis
try
Cedars
-Sin
ai
Cle
vela
nd C
linic
AR
TS
IS
eo
ul R
egis
try
Yan
g, 2007
AR
TS
II
SY
NTA
X
Avg. # s
tents
or
lesio
ns tre
ate
d
4.6±2.3
SYNTAX
Trial Average number of stents implanted
in SYNTAX is higher than any other
contemporary DES versus CABG study

Average Total Stented Length
0
20
40
60
80
100
MA
IN-C
OM
PA
RE
Hong 2
005
Naple
s R
egis
try
Cedars
-Sin
ai
AR
TS
I
Seoul R
egis
try
AR
TS
II
SY
NTA
X
86.1±47.9
SYNTAX
Trial
Avera
ge tota
l ste
nt
length
(m
m)

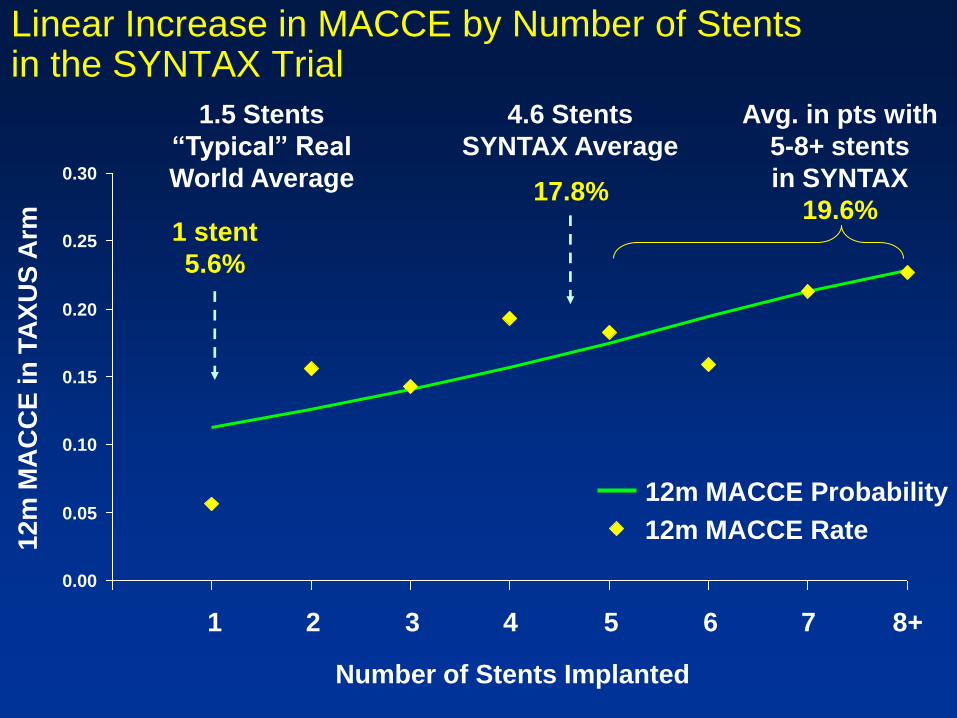
Linear Increase in MACCE by Number of Stents in the SYNTAX Trial
0.00
0.05
0.10
0.15
0.20
0.25
0.30
12
m M
AC
CE
in
TA
XU
S A
rm
1 2 3 4 5 6 7 8+
Number of Stents Implanted
12m MACCE Probability
12m MACCE Rate
4.6 Stents
SYNTAX Average
17.8%
1.5 Stents
“Typical” Real
World Average
1 stent
5.6%
Avg. in pts with
5-8+ stents
in SYNTAX
19.6%


SYNTAX - Outcome according to Diabetic Status
Diabetes (Medical Treatment)
N=452
Non-Diabetic
N=1348
TAXUS CABG
Death/CVA/MI MACCE Death/CVA/MI MACCE
P=0.96 P=0.0025 P=0.08 P=0.97
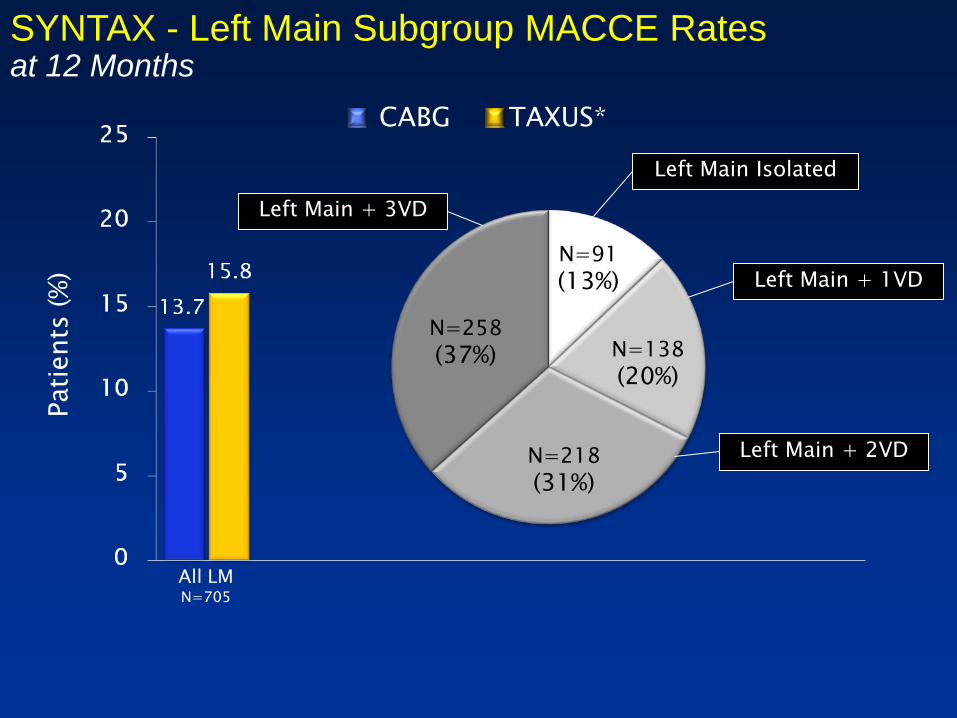
SYNTAX - Left Main Subgroup MACCE Rates at 12 Months
Left Main Isolated
Left Main + 3VD
Left Main + 2VD
Left Main + 1VD
N=258
(37%)
N=218
(31%)
N=138
(20%)
N=91
(13%)
CABG TAXUS*
Pati
ents
(%
)
All LM N=705
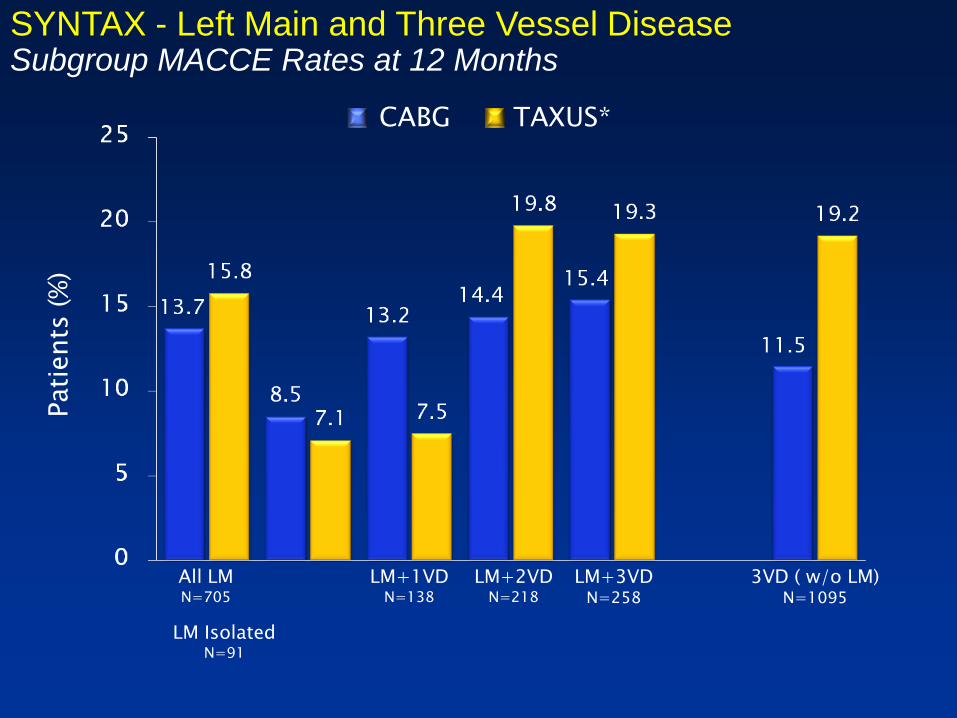
SYNTAX - Left Main and Three Vessel Disease Subgroup MACCE Rates at 12 Months
CABG TAXUS*
Pati
ents
(%
)
All LM N=705
LM+1VD N=138
LM Isolated N=91
LM+2VD N=218
LM+3VD N=258
3VD ( w/o LM) N=1095

Contemporary studies of DES versus CABG 1-Year Mortality in CABG Arm
3.2 2.7
8.0
3.1 3.5
8.4
12.3
15.2
6.4
0
5
10
15
20Multivessel Left Main
Yang
2008
(n=390)
ARTS I
(n=602)
Lee, 2007
(n=103)
Javaid
2008
(n=505)
SYNTAX
Trial
(n=897)
Sanmartin
2007
(n=245)
Palmerini
2006
(n=154)
Lee
2006
(n=123)
Chieffo
2006
(n=142)
Patients
(%
)
Multivessel
and/or
Left Main

Contemporary studies of DES versus CABG 1-Year TVR (PCI or CABG) in CABG Arm
0.8
3.73.0
5.9
0.8
2.6
5.5
3.6
0
2
4
6
8
10
Multivessel Left Main
Lee
2007
(n=103)
Sanmartin
2007
(n=245)
Palmerini
2006
(n=154)
Lee
2006
(n=123)
Chieffo
2006
(n=142)
Patients
(%
)
ARTS I
(n=602)
Yang
2008
(n=390)
SYNTAX
Trial
(n=897)
Multivessel
and/or
Left Main

Contemporary studies of DES versus CABG 1-Year Stroke Rates in CABG Arm
0.8
1.8
4.0
1.0
2.2
0.8 0.7
0
1
2
3
4
5 Multivessel Left Main
Lee
2007
(n=103)
Javaid
2008
(n=505)
Sanmartin
2007
(n=245)
Chieffo
2006
(n=142)
Patients
(%
)
ARTS I
(n=602)
Yang
2008
(n=390)
SYNTAX
Trial
(n=897)
Multivessel
and/or
Left Main

Contemporary studies of DES versus CABG 1-Year MAC(C)E* Rates in CABG Arm
4.2
11.6 12.010.8
12.411.4
24.8
0
5
10
15
20
25
30
Multivessel Left Main
Lee
2007
(n=103)
Javaid
2008
(n=505)
*definitions vary
across studies
Sanmartin
2007
(n=245)
Lee
2006
(n=123)
Patients
(%
)
ARTS I
(n=602)
Yang
2008
(n=390)
SYNTAX
Trial
(n=897)
Multivessel
and/or
Left Main
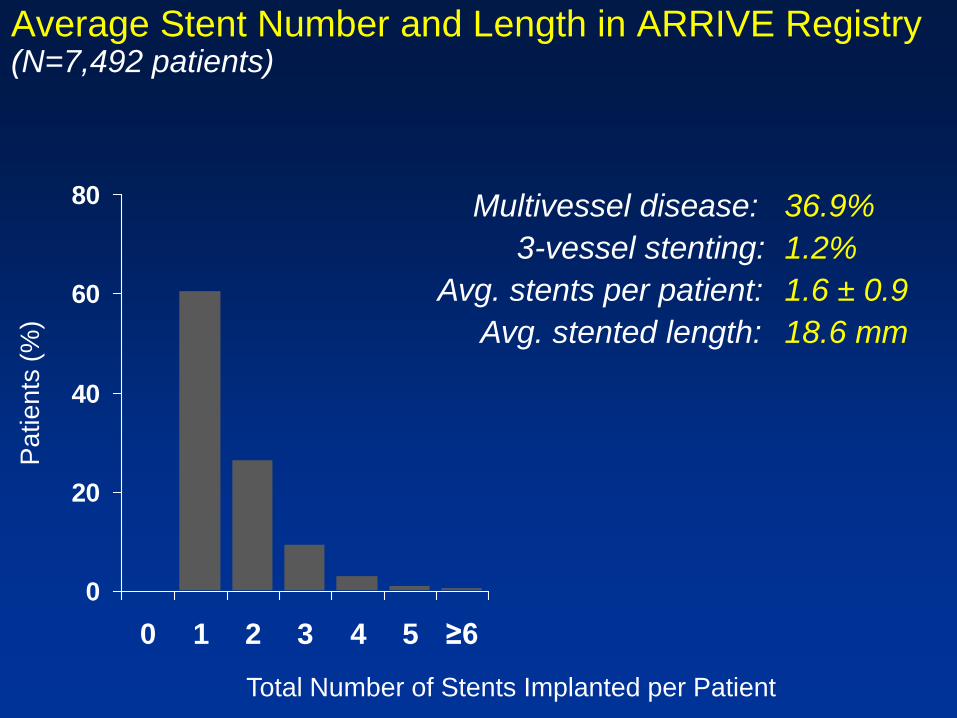
Average Stent Number and Length in ARRIVE Registry (N=7,492 patients)
0
20
40
60
80
0 1 2 3 4 5 ≥6 7 8 9 10 11 12 13 14
Pa
tie
nts
(%
)
Total Number of Stents Implanted per Patient
Multivessel disease: 36.9%
3-vessel stenting: 1.2%
Avg. stents per patient: 1.6 ± 0.9
Avg. stented length: 18.6 mm
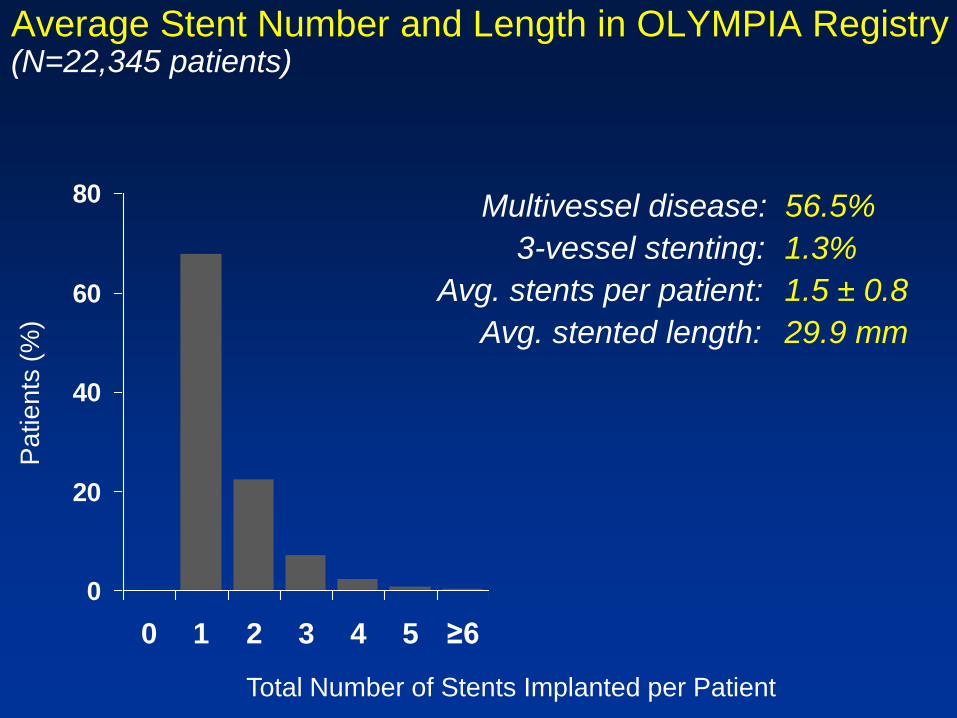
Average Stent Number and Length in OLYMPIA Registry (N=22,345 patients)
0
20
40
60
80
0 1 2 3 4 5 ≥6 7 8 9 10 11 12 13 14
Pa
tie
nts
(%
)
Total Number of Stents Implanted per Patient
Multivessel disease: 56.5%
3-vessel stenting: 1.3%
Avg. stents per patient: 1.5 ± 0.8
Avg. stented length: 29.9 mm

48% of patients received ≥5 stents
Max #
14 stents!
Stent Number and Length Higher in the SYNTAX Trial
0
5
10
15
20
0 1 2 3 4 5 6 7 8 9 10 11 12 13 14
Pa
tie
nts
(%
)
Total Number of Stents Implanted per Patient
Multivessel disease: 96.2%*
3-vessel disease: 90.8%
Avg. stents per patient: 4.6 ± 2.3
Avg. stented length: 86.1 mm
*3VD+LM/3VD+LM/2VD+LM/1VD

Average Number of Stents Implanted per Patient
0
1
2
3
4
5
MA
IN-C
OM
PA
RE
Ho
ng 2
005
ER
AC
I II
Ben-G
al 2006
LE
MA
NS
So
SN
aple
s R
egis
try
Cedars
-Sin
ai
Cle
vela
nd C
linic
AR
TS
IS
eo
ul R
egis
try
Yan
g, 2007
AR
TS
II
SY
NTA
X
Avg. # s
tents
or
lesio
ns tre
ate
d
4.6±2.3
SYNTAX
Trial Average number of stents implanted
in SYNTAX is higher than any other
contemporary DES versus CABG study

Average Total Stented Length
0
20
40
60
80
100
MA
IN-C
OM
PA
RE
Hong 2
005
Naple
s R
egis
try
Cedars
-Sin
ai
AR
TS
I
Seoul R
egis
try
AR
TS
II
SY
NTA
X
86.1±47.9
SYNTAX
Trial
Avera
ge tota
l ste
nt
length
(m
m)
Linear Increase in MACCE by Number of Stents in the SYNTAX Trial
0.00
0.05
0.10
0.15
0.20
0.25
0.30
12
m M
AC
CE
in
TA
XU
S A
rm
1 2 3 4 5 6 7 8+
Number of Stents Implanted
12m MACCE Probability
12m MACCE Rate
4.6 Stents
SYNTAX Average
17.8%
1.5 Stents
“Typical” Real
World Average
1 stent
5.6%
Avg. in pts with
5-8+ stents
in SYNTAX
19.6%
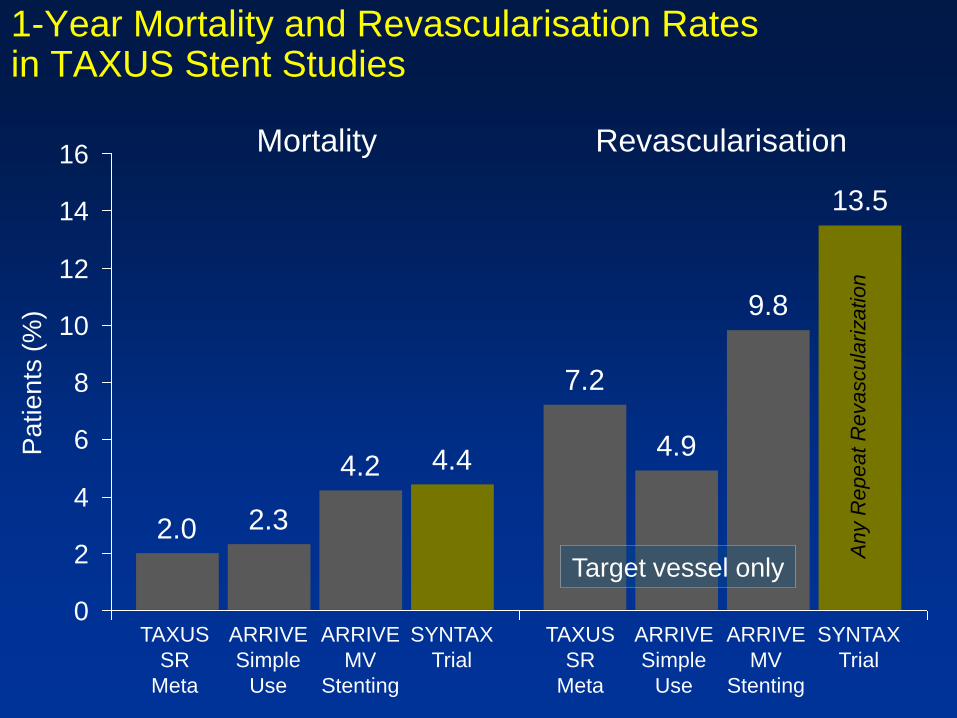
2.0
7.2
2.3
4.94.2
9.8
4.4
13.5
0
2
4
6
8
10
12
14
16
1-Year Mortality and Revascularisation Rates in TAXUS Stent Studies
Pa
tie
nts
(%
)
Mortality Revascularisation
TAXUS
SR
Meta
ARRIVE
Simple
Use
ARRIVE
MV
Stenting
SYNTAX
Trial
TAXUS
SR
Meta
ARRIVE
Simple
Use
ARRIVE
MV
Stenting
SYNTAX
Trial
Target vessel only
Any R
epeat R
evascula
rization

Contemporary studies of DES versus CABG 1-Year Revascularisation in DES Arm
10.28.5
26.0
13.5
10.0
5.2
25.5
13.3
19.6
0
10
20
30
Multivessel Left Main
Yang
2008
(n=441)
ARTS II
(n=607)
Hannan
2008
(n=9963)
DELFT
2008
(n=358)
Sanmartin
2007
(n=96)
Palmerini
2006
(n=157)
Lee
2006
(n=50)
Chieffo
2006
(n=107)
Patients
(%
)
42%
3VD
91%
3VD
54%
3VD
35%
LM
25%
3VD (TVR) (TVR) (TLR) (TVR)
All Revasc.
All Revascularization
SYNTAX
Trial
(n=903)
Multivessel
and/or
Left Main
(All)

Contemporary studies of DES versus CABG 1-Year Mortality in DES Arm
2.11.0
10.0
4.9
10.9
4.4
6.75.2
13.4
4.4
2.8
0
5
10
15
20Multivessel Left Main
Yang
2008
(n=441)
ARTS II
(n=607)
Lee, 2007
(n=102)
Hannan
2008
(n=9963)
Javaid
2008
(n=95)
(cardiac)
DELFT
2008
(n=358)
Sanmartin
2007
(n=96)
Palmerini
2006
(n=157)
Lee
2006
(n=50)
Chieffo
2006
(n=107)
Patients
(%
)
SYNTAX
Trial
(n=903)
Multivessel
and/or
Left Main

Contemporary studies of DES versus CABG 1-Year Stroke Rates in DES Arm
0.7
1.0
0.0
1.1
0.6
0.0
0.9
0
1
2
3Multivessel Left Main
Yang
2008
(n=441)
ARTS II
(n=607)
Lee
2007
(n=102)
Javaid
2008
(n=95)
Sanmartin
2007
(n=96)
Chieffo
2006
(n=107)
Patients
(%
)
SYNTAX
Trial
(n=903)
Multivessel
and/or
Left Main

Contemporary studies of DES versus CABG 1-Year MAC(C)E* Rates in DES Arm
13.0
10.4
27.028.2
19.2
15.8
24.3
10.4
17.1
0
5
10
15
20
25
30
35
40Multivessel Left Main
Yang
2008
(n=441)
ARTS II
(n=607)
Lee
2007
(n=102)
Javaid
2008
(n=95)
DELFT
2008
(n=358)
*definitions vary
across studies
Sanmartin
2007
(n=96)
Lee
2006
(n=50) SYNTAX Trial
Patients
(%
)
3VD LM

Atherosclerosis: A progressive process
Disease progression
PHASE I: Initiation PHASE II: Progression PHASE III: Complication

Atherosclerotic progression: Glagov’s remodeling hypothesis
Normal
vessel
Progression
Glagov S, et al. N Engl J Med. 1987;316:1371-1375.
Moderate
CAD
Compensatory expansion
maintains constant lumen
Minimal
CAD
Expansion
overcome:
lumen narrows
Advanced
CAD
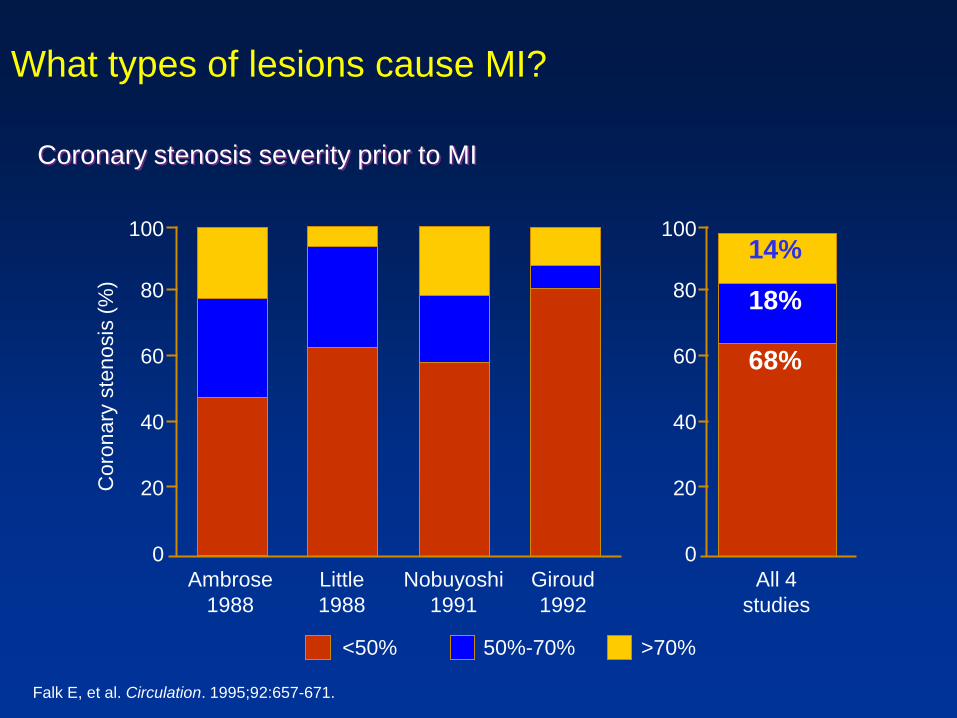
What types of lesions cause MI?
Falk E, et al. Circulation. 1995;92:657-671.
100
80
60
40
20
0
14%
18%
68%
All 4
studies
50%-70% <50% >70%
100
60
40
20
0
Ambrose
1988
Little
1988
Nobuyoshi
1991
Giroud
1992
Coro
nary
ste
nosis
(%
)
Coronary stenosis severity prior to MI
80
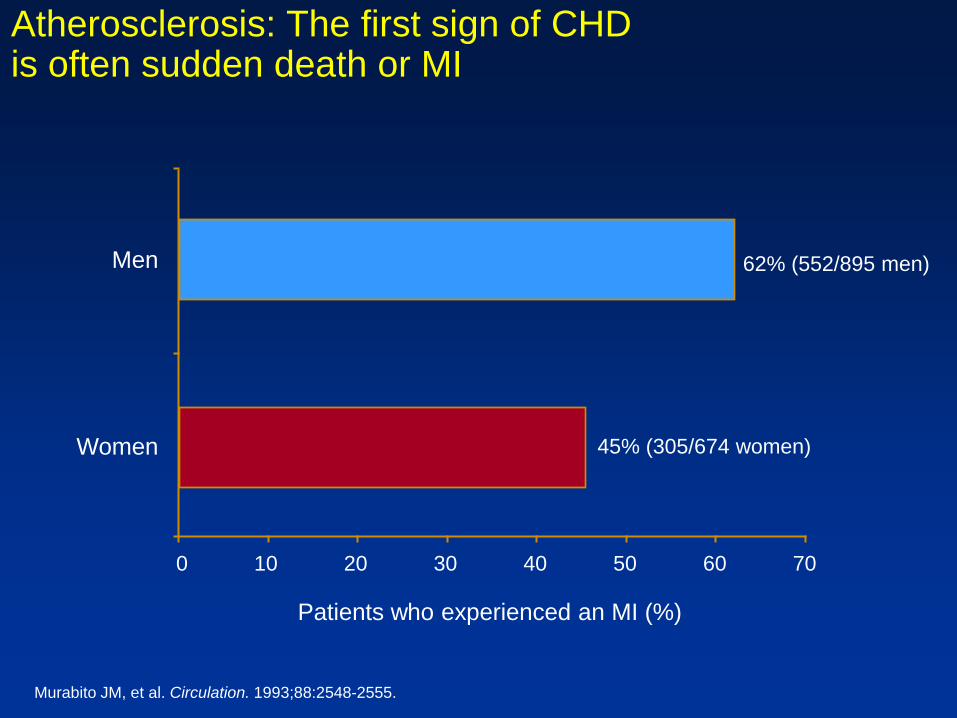
Atherosclerosis: The first sign of CHD is often sudden death or MI
0
62% (552/895 men) Men
45% (305/674 women) Women
Patients who experienced an MI (%)
Murabito JM, et al. Circulation. 1993;88:2548-2555.
20 30 40 50 60 70 10

Breakdown of Current CAD Treatment
CDC MMWR 2007;56:113-118
Eur Heart J 2005;26:1011-1022
J Am Coll Cardiol 2002;39:1096-1103
US Europe
91%
7%
2%
Medical Rx
PCI
CABG
85%
8%6%
1%Medical Rx
PCI
CABG
PCI + CABG
CABG is the current gold-standard of care in patients with left main & multivessel disease

Isolated LM includes portion of ostial LAD and CX. A lesion
would have to be 3x RVD away from another lesion to count as
a separate lesion. So if lesion originates in LM and extends to
both LAD and CX that would be a LM isolated. Only when the
RVD criteria is met further down vessel, or obviously RCA, does
it count as +1/2/3.