synopsis a sustainable supply chain … contents 1 ... et al., 1995), e-waste management, (dhanda...
TRANSCRIPT

Synopsis
A SUSTAINABLE SUPPLY CHAIN MANAGEMENT
FRAMEWORK FOR IT PRODUCTS: AN EXPLORATORY
STUDY
By
Vishal Gupta
Enrolment No. 10409053
Supervisors
Prof. Naseem Abidi
Dr. Asit Bandyopadhyay
JAYPEE BUSINESS SCHOOL
JAYPEE INSTITUE OF INFORMATION TECHNOLOGY
A-10, SECTOR-62, NOIDA, INDIA

Synopsis-1
Contents
1. INTRODUCTION ............................................................................................................ 2
1.1. Rationale of Research ........................................................................................................... 3
1.2. Objectives of the Research ................................................................................................... 4
2. OVERVIEW OF INDIAN IT INDUSTRY .................................................................... 5
3. LITERATURE REVIEW ................................................................................................ 5
4. METHODOLOGY ........................................................................................................... 7
5. ANALYSIS AND DISCUSSION ..................................................................................... 9
5.1. Case study .............................................................................................................................. 9
5.2. SSCM framework ................................................................................................................. 9
5.3. SSCM framework (Detailed View) .................................................................................... 11
5.3.1. Dimension 1: Supply Chain ............................................................................................ 12
5.3.2. Dimension 2: Management ............................................................................................. 13
5.3.3. Dimension 3: Sustainability ............................................................................................ 13
5.4. SSCM Metric ....................................................................................................................... 14
5.5. SSCM Performance Measures for Manufacturer ............................................................ 15
5.6. Sustainability Index for Manufacturer ............................................................................. 16
5.7. Verification and testing ...................................................................................................... 20
6. CONCLUSIONS ............................................................................................................. 21
7. IMPLICATIONS OF RESEARCH .............................................................................. 22
8. SCOPE OF FUTURE RESEARCH .............................................................................. 22
9. SELECTED REFERENCES ......................................................................................... 23
10. LIST OF PUBLICATIONS ........................................................................................... 25
APPENDIX 1: Case Study .................................................................................................... 26
APPENDIX 2: SSCM PERFORMANCE METRIC FOR MANAGEMENT
(ECONOMIC) ........................................................................................................................ 30
APPENDIX 3: SSCM PERFORMANCE METRIC FOR SUSTAINABILITY .............. 30
APPENDIX 4: ECONOMIC PERFORMANCE MEASURE FOR SSCM -
MANUFACTURER ............................................................................................................... 31
APPENDIX 5: SUSTAINABILITY PERFORMANCE MEASURE FOR SSCM –
MANUFACTURER ............................................................................................................... 32

Synopsis-2
1. INTRODUCTION
The way the business is done at present has undergone radical change due to globalization,
outsourcing, intense competition and changing markets, use of technology and increasing
expectations of consumers. The increasing focus on environmental and social issues has
made the business environment more dynamic and complex. The focus has shifted from a
single organization to a network of organizations collaborating together to provide real-time
solutions. Integration of business activities and collaboration with upstream and downstream
partners has become an integral part of doing business. Organizations realized the importance
of integration and collaboration among the partners (Mentzer, et al., 2001), (Cousins & R.
Spekman, 2003), (Chow, et al., 2006), (Lambert, 2008) for efficient and economic utilization
of resources leading to the idea of Supply Chain Management (SCM). As the supply chain
became more and more complex, it entailed measurement of its performance on different
parameters. Sink and Tuttle (1989) claim that ‘‘you cannot manage what you cannot
measure’’. Measurement of supply chain processes and their benchmarking is essential for
improving the efficiency and effectiveness of supply chain management. Various
performance measurement systems (Beamon, 1998), (Kaplan & Norton, 1992), (Saad &
Patel, 2006), (Gunasekaran & Kobu, 2007), (SCC, 2010) were implemented across industry
with varying degree of success. Thus for any business organization, measurement of its
supply chain performance becomes critical and necessitates a robust performance
measurement system.
Recently, the concept of Supply Chain Management (SCM) has embraced the concern for
environmental degradation and social responsibility; and the business community apart from
reporting on economic parameters, has included environmental and social aspects also. As the
environment has become a global concern, governments have started framing rules and
business firms have started making their supply chains ‘greener’ by introducing new ideas in
their organizations and also to their supply chain partners. Green supply chain management
(GrSCM) (Hervani, et al., 2005), (Fortes, 2009), (Srivastava, 2007), (Gupta, et al., 2013),
addressed the issues of manufacturing environment friendly products, reverse logistics
(Carter & Ellram, 1998), (Dowlatshahi, 2000), (Kopicki, et al., 1993), (Beamon, 1999)
(Thierry, et al., 1995), E-waste management, (Dhanda & Peters, 2005), (Fortes, 2009), and
‘end of life’ management (Hervani, et al., 2005), (Zhu, et al., 2010).
Synopsis-3
The issues such as human rights and safety of the workers as well as of the society at large
and concern for enhancing the quality of life also began to appear centre stage in the global
outlook and the business community is also not unaffected by it. The concept is rapidly being
adopted by the supply chain managers, and organizations have begun reporting on the triple
parameters of economic performance, environmental safety and social welfare (Elkington,
1998), (Carter & Rogers, 2008), (Spreckley, 1981 ). This inclusiveness of ideas to SCM is
being deliberated by the researchers as Sustainable Supply Chain Management (SSCM). The
whole idea is to develop sustainable supply chains which reduce costs as well as help the
environment and the society. A sustainable supply chain is a supply chain that is not only
optimal for the focal firm, but is optimal relative to its environmental and societal impact.
1.1. Rationale of Research
Supply chains of IT hardware industry are peculiar in nature and are influenced by the
innovative nature of its products; reverse logistics procedures required to reuse, refurbish,
recycle and cannibalize electronic equipments; and green supply chain initiatives to handle
the amount of e-waste generated due to the fast obsolescence. With the enhanced emphasis
on ‘e-waste’ management, the Government of India formulated E-Waste (Management and
Handling) Rules 2011 which came into effect on May 1, 2012 for Waste Electrical and
Electronic Equipment (WEEE) provisions, and Restriction of Hazardous Substances (RoHS)
provisions which were to be enforced from May 1, 2014. Ministry of Corporate Affairs came
out with the 'National Voluntary Guidelines (NVG) on Social, Environmental and Economic
Responsibilities of Business' and Securities and Exchange Board of India (SEBI) has
mandated inclusion of ‘Business Responsibility Reports’ as part of the Annual Reports for
top 100 listed entities based on market capitalisation at BSE and NSE as on March 31, 2012.
Growing concern from civil society, investors and the local authorities has motivated the
organizations to improve their corporate image. Global sustainability watchdogs such as Dow
Jones Sustainability Indexes and Global Reporting Initiative provide standards for
sustainability best practices. By reporting transparently and with accountability, organizations
can increase the trust that stakeholders have in them, and in the global economy. Ethical
business practices are highlighted as part of this exercise. Transparency in work culture,
providing equal opportunity of employment, compliance with regulations and fair
implementation of policies and procedures has become noticeable assets and add to the
goodwill. Organizations have to be accountable for the actions as part of their business

Synopsis-4
operations which have a negative impact on the natural resources as well as human resources.
Contributing to the social justice, upholding of the human rights, discouraging child labor,
handling layoffs and worker disputes, and providing relief during catastrophic disasters are
few performance measures for sustainability. Cleaner sources of energy and efficient
utilization of using existing processes provide cost benefits along with reducing emission of
greenhouse gases. Innovations in manufacturing processes and reduction of hazardous
substances help reducing the negative effect on the environment. Rules and regulations
formulated and implemented by many governments have encouraged protection of
environment as well as community development as part of corporate partnership.
Above mentioned arguments induced the researchers to develop more inclusive framework
for supply chain management for addressing not only the economic concern but also the
concern for environment and social issues. From the existing literature, it can be observed
that the issue of sustainability in supply chain is a recent phenomenon and researchers are
suggesting conceptual frameworks and factors to be included for developing SSCM.
Sustainable practices that work for one industry may not work for other industries, and the
topic being at a nascent stage, no researcher has made an attempt to develop industry specific
framework for SSCM. All the researches reviewed on the issue of SSCM proposes
framework; but none of them is specific to IT industry or have made an attempt to develop
suitable metric and performance measures of SSCM. Considering the current dynamic and
ever changing scenario of sustainable supply chain management, it is imperative to develop a
suitable sustainable supply chain framework, metric and performance measures for the Indian
IT product industry, which caters to the needs of developing nations such as India
considering indigenous economic, environmental, social and cultural factors.
1.2. Objectives of the Research
Objectives of the study are as follows:
1. To study the supply chain practices with reference to sustainability parameters in select
IT companies.
2. To develop a sustainable supply chain management framework for IT product companies.
3. To develop metric for proposed sustainable supply chain management framework.
4. To develop sustainable supply chain management performance measures for IT product
manufacturer.

Synopsis-5
5. Verification and testing of sustainable supply chain management framework, metric and
performance measures with select IT product companies.
2. OVERVIEW OF INDIAN IT INDUSTRY
The Information Technology (IT) is the world’s largest and fastest growing industry. IT is
increasingly finding applications in all sectors of the economy and thus is accepted as a key
enabler in development [1]. The rapid emergence of the Information and Communication
Technology (ICT) sector has placed India on the global stage during the last one and a half
decades [2]. The IT industry is broadly categorized into IT services and software, Information
technology enabled services-business process outsourcing (ITeS-BPO) and IT hardware
products segment. [2]. IT Hardware segment includes personal storage devices, printers,
servers, Personal Computers (PCs), supercomputers, data processing equipment and
peripherals such as monitors, keyboards, disk drives, plotters, SMPS, modems, networking
products and add-on cards [3].
The share of hardware in total IT spending is expected by BMI to remain above 50% during
the 2012-2016 forecast period. BMI forecasts the PC market will grow at a CAGR of 22%
between 2012 and 2016. Overall, the hardware market is predicted to grow from an estimated
US$9.3bn in 2012 to US$16.0bn in 2016, with PC sales including accessories projected to
rise from an estimated US$7.6bn to US$13.0bn over the same period. Annual PC sales were
estimated at 11.8mn units in 2011 and could rise to more than 30mn by 2016.
3. LITERATURE REVIEW
Literature review helped to identify, appraise, select and synthesize all high quality research
evidence relevant to supply chain management. Ever since 1982, when Keith Oliver used the
term Supply Chain Management(SCM) for the first time, researchers and practitioners have
contributed and developed the concept to great significance. Literature review facilitated to
categorize research articles on supply chain optimization, integration, restructuring,
performance, efficiency, environment and social parameters. It also provided evidence that
the growing importance to environment and social issues are incorporated in supply chain
research leading to the concept of Green Supply chain Management and Sustainable Supply
Chain management.

Synopsis-6
The literature review on the related topics of SCM and sustainability helped to identify,
appraise, select and synthesize all high quality research evidence, summarized in the Table 1
below.
S.No Topic Author
1 SCM Beamon, 1998; Mentzer et al., 2001; Fleischmann et al., 2002:
Olhager, et al., 2002; Cousins & Speckman, 2003; Chow, et
al., 2006; Lambert, 2008; Naslund & Williamson, 2010; Stock
& Boyer, 2009
2 Performance
Measurement in
SCM
Kaplan & Norton, 1992; Beamon, 1998; Gunasekaran et al.,
2001; Singh & Shah, 2001; Saad & Patel, 2006; SCOR Model
10.0, 2010
3 Reverse logistics,
Product ‘End of
life’
Kopicki, et al., 1993; Thierry, et al., 1995; Carter and Ellram,
1998; Beamon, 1999; Dowlatshahi, 2000; Dhanda & Peters,
2005; Zhu, et al., 2007; Zhu, et al., 2010
4 Green SCM Guide & Srivastava, 1998; Hervani, et al., 2005; Srivastava,
2007; Srivastava, 2007; Fortes, 2009; Ninlawan, et al., 2011;
Gupta, et al., 2013
5 Supply Chain
Innovation
Schumpeter, 1934; Eric von Hippel,1988; OECD Oslo
Manual, 2005; Storer & Hayland, 2009; Pagell & Zhaohui,
2009; GRI, 2011
6 E-waste
management
Roy & Whelan, 1992; Barve & Muduli, 2011; Dhanda &
Peters, 2005; Fortes, 2009;
7 Sustainability Spreckley, 1981; Brundtland Commission, 1987; Rio Summit,
1992; O’Connor, 1994; New, 1997; Rao & Holt, 2005; Carter
& Rogers, 2008; Seuring & Müller, 2008; Pagell & Zhaohui,
2009; Mann et al, 2010; Ramudhin, et al., 2010; ISO 26000:
2010; Silvius, 2010; GRI, 2011; Dey et al, 2011; Hassini et al.,
2012;
Table 1: Literature Review
The above literature review traces the origin of concept of SCM, its performance measure,
and different related disciplines researcher have explored during its evolution over the years.
The review has revealed four distinct branches of SCM research, viz. Planning and Designing
SCM, Performance Measurement, Green Supply Chain Management, and Sustainable SCM.
Contrary to concept of supply chain, researchers also suggested Demand Chain Management
(DCM) in order to sense and proactively manage the demand of the innovative products
which have shorter lifecycle and demand uncertainty due to their innovative nature. The aim
of supply chain management is to integrate the processes in a supply chain for efficient
utilization of resources and reduction in costs, leading to shareholder’s profit maximization.
Synopsis-7
However, the concept of stakeholder’s theory (Freeman, 1984) demands that a company's
responsibility lies with stakeholders rather than shareholders. Supply chain processes involve
exploitation of natural resources as well as the human capital. Thus the stakeholders in a
supply chain would include the society as well as the ecological environment. The idea of
integrating social and environmental factors to economic activity is termed as sustainability.
Sustainable supply chain management would include the economic responsibility as a base
level of a supply chain’s responsibility.
Organization’s innovation capabilities and its alignment towards environmental, social and
economic goals lead to an economically viable as well as sustainable supply chain (Pagell &
Wu, 2009). Thus sustainability can be achieved by supply chains which are innovative, are
environment conscious and have social objectives as one of the basis of doing business. The
operational definition of SSCM formulated and utilized in this study is “Managing network
of all actors in a supply chain to improve economic performance and to achieve
environmental and social sustainability through innovations”.
4. METHODOLOGY
The research design for this study is primarily exploratory in nature. The study identifies the
key dimensions and factors to develop framework, metric and measures on all dimensions of
sustainable supply chain. These investigations were carried at three levels, viz. literature
review, academicians review and practitioner’s review, to analyse, discuss, integrate and
arrive at SSCM framework for IT product companies.
Integrative Literature Review: An integrative literature review is a form of research that
reviews, critiques, and synthesizes representative literature on a topic in an integrated way
such that new frameworks and perspectives on the topic are generated [4]. Focussed
integrative literature review of existing frameworks of SSCM helped in identifying the
dimensions and factors used in the frameworks and also to identify the scope for
improvement. Integrative literature review has provided an opportunity to assimilate these
perspectives to develop the framework for SSCM.
Case Study Method: Considering the nature of the study, an exploratory research design in
the form of a case study method is employed. The exploratory case study method is used to
study the phenomenon of sustainability in supply chain in its contextual conditions and tries
to answer the ‘what’ question. Specifically, the guidelines for good case study design and
Synopsis-8
conduct provided by Yin (1994) was used to consider six IT product companies as a case
study.
Sampling Design: The member companies of Manufacturer’s Association of IT companies
(MAIT) having manufacturing facilities in the hardware segment in the financial year 2011-
12 was considered as sampling frame for this research. The total members of MAIT in this
financial year were 75, out of which 41 members were companies having manufacturing
facilities in India, which were divided into three categories of large, medium and small sizes
based on their turnover. A turnover of more than Rs.1000 Crores is considered as large size
company, a turnover of more than Rs.200 Crores but less than Rs.1000 Crores as medium
size and less than Rs. 200 Crores as small size companies respectively. This categorization
was in line with NASSCOM and puts 21 companies in large scale, 14 in medium scale and 6
in small scale category. Considering judgment sampling technique, on the basis of level of
sustainability initiatives taken and willingness to cooperate, three companies each from large
and medium scale categories were selected as a case study. Considering the objectives of the
study and case study approach to study the SSCM practices, developing framework, metric
and measures and to verify the results, a sample size of three companies from each category
is well justified.
Experience Survey: Churchill (1979) defined experience surveys as discussions with “a
judgment sample of persons who can offer some ideas and insights into the phenomenon”.
Several other researchers (Gerbing and Anderson 1988, Dunn, Seaker, and Waller 1994,
Bienstock, Mentzer, and Bird 1997, Min and Mentzer, 2004) recommended the process of
developing measurement items as: (1) Item generation through literature review and
experience / interviews with industry experts; (2) Academic expert review; (3) Debriefing
with experts; and (4) Item purification. Five eminent academic experts from the area of
supply chain management were consulted to provide their valuable insights on developed
SSCM framework, metric and performance measures. Similarly, two senior manager from
each selected large scale and one from each selected medium scale company from the area of
supply chain management i.e. total nine practitioners from the IT product companies were
interviewed for collecting information about their current practices of the supply chain on the
parameters of sustainability. The practitioners were also consulted for verification of
developed framework and metric for all the SSCM actors; and performance measures for the
manufacturer.

Synopsis-9
5. ANALYSIS AND DISCUSSION
5.1. Case study
Current practices in supply chains of the six selected companies with respect to their
procurement, manufacturing facilities, products, distribution, innovation, recycling and
sustainability were explored using case study method. The initial draft of these case studies
was developed using secondary information about the company from reports, websites and
review of documents as well as published material mainly consisting of business dailies,
business weekly, corporate magazines, and the material available online. Subsequently, the
existing functions, processes, procedure and policies and future plans were discussed with
concerned managers through semi-structured interviews and documented as a separate case
for each company given in Appendix 1. In view of the concerns raised by the practitioners
regarding the confidentiality of data and their own involvement, the names of the companies
and practitioners have been withheld.
5.2. SSCM framework
Literature has defined sustainability within the three major dimensions, viz. economic,
environmental and social [5] and highest level of economic performance will occur at the
intersection of environmental, social, and economic performance [6]. Few studies have
suggested that the organization’s innovation capabilities and its alignment towards
environmental, social and economic goals lead to an economically viable as well as
sustainable supply chain [7], while few have suggested that internal business processes,
customer, reverse logistics processes, waste management and legislation influence the
sustainability of an organization [8] [9] [10]. Thus sustainability can be achieved by supply
chains which are innovative, are environment conscious and have social objectives as one of
the basis of doing business. The integrative literature review of the SSCM frameworks is
summarized in Table 2.
However, this study has a view that the economic responsibility is the base level for any
supply chain management. Right application of management (all levels) on supply chain
actors addresses the economic responsibility of the supply chain. The economic objectives of
the firm may be achieved even when the business does not include the environment or the
social aspects. Therefore, an alternate line of thought is proposed which considers economic
activity as separate from sustainability objectives, and social and environmental performance
complements the economic activities.

Synopsis-10
S.No Year Author Contribution Sustainability Parameters
1 1999 Elkington Triple Bottom Line concept of
Economic, Environment and Social
Economic, Environment and
Social
2 2008 Carter &
Rogers
Highest level of economic
performance will occur at the
intersection of environmental,
social, and economic performance
Economic, Environment and
Social
3 2009 Pagell & Wu Organization’s innovation
capabilities and its alignment
towards environmental, social and
economic goals lead to sustainable
supply chain
Economic, Environment and
Social, added Innovation
4 2010 Mann et al., Identified drivers for sustainable
SCM practices based on the
‘balanced scorecard configuration’
viz. financial, internal business
process, customer, environment,
legislation and social.
Financial, Social,
Environment, Internal
processes, Customer,
legislation
5 2010 Ramudhin et
al.,
Framework incorporating all three
dimensions of sustainability, added
green house gases (GHGs)
emissions, energy conservation,
noise, traffic congestion and stress
as factors
Environment – Reverse
Logistics, Energy
conservation; Societal
wellbeing
6 2011 Dey et al., Integrated sustainability with the
different processes in a supply
chain, sustainable end of product
life.
Value Chain, Distribution
Chain, Product ‘End of
Life’ management
7 2012 Hassini et al., Added policies, regulations, ethics,
fair trade practices as dimension is
social sustainability.
Green design, RoHS,
Recycle, Regulations, Fair
trade practices
Table 2: Integrative Review of SSCM Frameworks
The research integrates the idea of sustainability in supply chain management and suggests a
Supply Chain (SC), Management (M) and Sustainability (S) as three dimensions of SSCM
and delineates its constituents and their inter-relationships. To make a SC sustainable, all SC
actors have to ensure their performance on all the three levels of management and
sustainability dimension. This discussion leads us to a three-dimensional framework for
SSCM in which the first dimension represented on X-Axis is “Supply Chain” actors, the
Synopsis-11
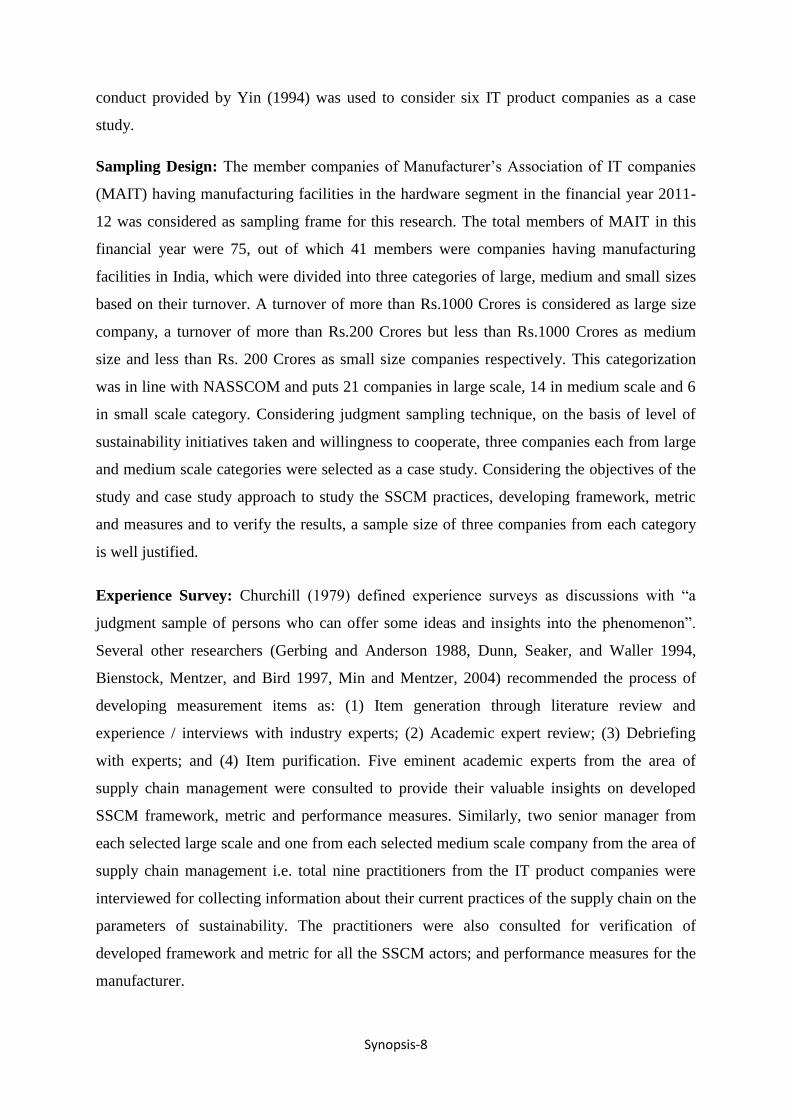
second dimension on Y-Axis refers to the “Management” while the third dimension on Z-
Axis show the “Sustainability”. The sequence of actors in supply chain and levels in
management and sustainability of the framework are shown in Figure 1 given below.
Sustainability may be added as a dimension to the existing economic objective of the firm.
Therefore, sustainability would exclude economic dimension and include social and
environment dimensions [11]. In case of industries where technology changes very fast and
organizations need to continuously improve their products and processes, study includes
‘innovation’ as a third dimension to the sustainability definition. The proposed three-
dimensional SSCM suggests that the supply chain actors (X-Axis) economic (efficiency) can
be accomplished by applying management (Y-Axis) on it and measuring on
Supplier Manufacturer Distributor Retailer Customer
Ope
ratio
nal
Tact
ical
Str
ateg
ic
Socia
l
Supply Chain
Sustainability
Management (Economic)
Innov
ation
Envir
onm
ent
Figure 1: Three-Dimensional Framework for Sustainable Supply Chain Management
three levels, viz. strategic, tactical and operational. The performance of actors on
sustainability (Z-Axis) should be measured on innovation, environment and social
parameters. The interaction of management and sustainability on actors of supply chain
makes in three-dimensional.
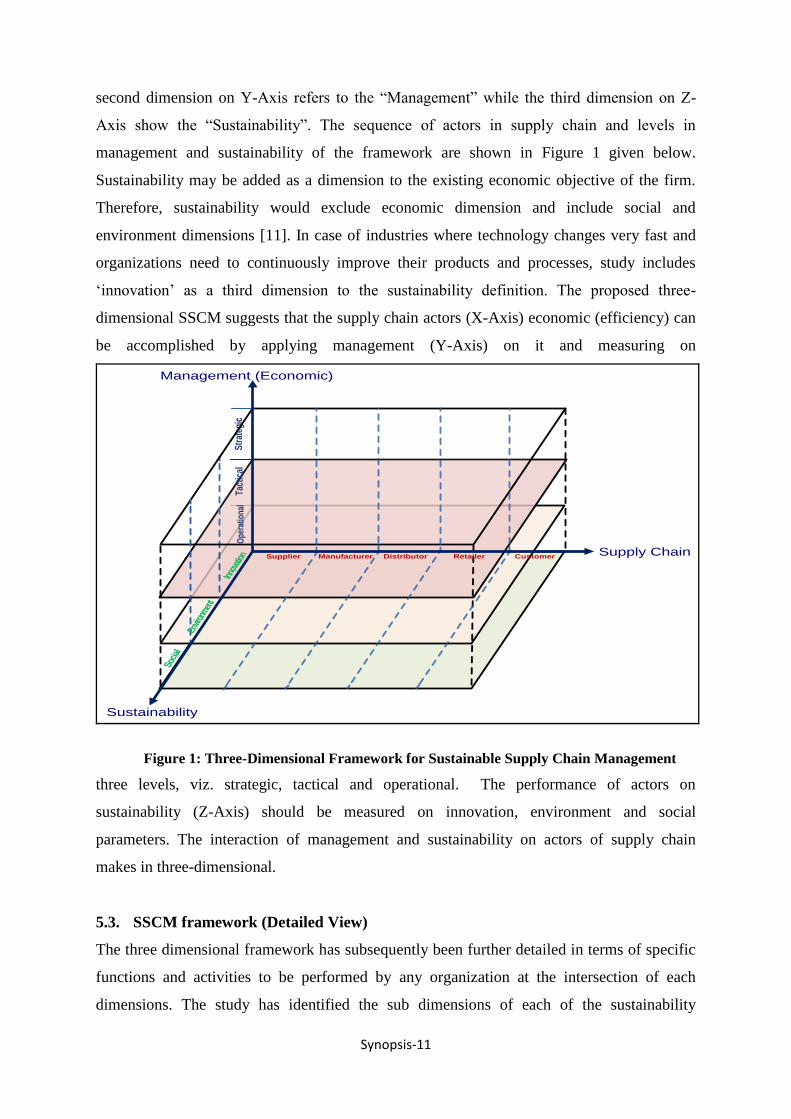
5.3. SSCM framework (Detailed View)
The three dimensional framework has subsequently been further detailed in terms of specific
functions and activities to be performed by any organization at the intersection of each
dimensions. The study has identified the sub dimensions of each of the sustainability
Synopsis-12
parameters and developed the detailed framework showing the linkage and interaction of
sustainability parameters as well as value chain parameters with the supply chain actors.
Innovation has been categorized in five levels, while environment aspects include the reverse
logistics process and five factors, viz. green manufacturing, green products, green
distribution, waste management and compliance. The social sub dimension includes aspects
of equity, transparency, human rights, social welfare and compliance to government laws and
regulations. All the factors in each sub-dimension are linked to the specific supply chain
actors with whom the responsibility of planning and execution lies.
The review with academic experts suggested changes in the nomenclature of supply chain
actors (‘Distributor’ in IT industry context was detailed into ‘Channel Partner’ and
‘Dealer/Reseller’). It also suggested adding ‘Organization Level Innovation’ as a metric for
defining Innovation, while excluding ‘Source Level Innovation’ which is only applicable to
supply side. Similarly, academicians also suggested defining environment sub dimension
with ‘Green Manufacturing’, ‘Green Products’, ‘Green Distribution’, ‘Waste Management’
and ‘Environmental Compliance and Reporting’. In the Social sub dimension, ‘Equity’ and
‘Governance’ were added to, ‘Ethics and Transparency’ were clubbed together, and ‘Social
Welfare’ was enhanced to ‘Human Rights and Social welfare’.
Review with industry practitioners validated the three dimensional view of SSCM. It
suggested that IT supply chain identifies ‘Dealer/Value Added Reseller’ as ‘System
Integrators’ or ‘Assemblers’. ‘Social Innovation’ was added as responsibility of all the supply
chain partners including customers. ‘Equity’ in organization is named as “Equity and Non
discrimination Policy’ while the ‘Governance’ factor was better defined as ‘Compliance to
Government Regulations’. Accountability as a separate policy did not exist in any of the
organization studied, and was thus removed. Sub dimensions of “Human Rights’ and “Social
Welfare’ were separated, with Sexual Harassment Policy, Health and Safety as a part of
Human Rights. The detailed framework for SSCM of IT products, after review and
verification by academic and industry practitioners, is represented in Figure 2.
5.3.1. Dimension 1: Supply Chain
The literature provides two broad classification of supply chain. One is based on process i.e.
procurement, production, distribution and sales, while the other one is based on actors. The

Synopsis-13
actors in a supply chain generally include the supplier, manufacturer, distributor, retailer and
the customer.
5.3.2. Dimension 2: Management
The “Management” functions of supply chain are traditionally being managed at strategic,
tactical and operational levels [12] [13]. Each level is distinguished by the period of time over
which decisions are made, and the granularity of decisions during that period.
Material FlowInformation Flow
Su
sta
ina
bil
ity
Op
era
tio
na
l
Ta
ctic
al
Stra
te
gic
En
vir
on
me
nta
lS
oc
ial
Transparency
and EthicsSocial Welfare
Equity and Non
DiscriminationHuman Rights Compliance
Va
lue
Ch
ain
Procurement Production SalesDistribution
Market
Analysis
PoS
Data
Demand
Analysis
Sensing
Consumer
Empower channel
Partners
Supplier ManufacturerChannel
Partner
Dealer/Reseller/
Assembler/SIRetailer
Su
pp
ly
Ch
ain
Customer
Inn
ov
ati
on
Process
Level
Market
Level
Environment
Level
Organization
Level
Product
Level
Recycle
Cannibalize
Refurbish
Repair
Reuse
Landfill
Collection
and
Inspection
Green
Manufacturing
Green
Products
Compliance &
Reporting
Waste
Management
Green
Distribution
Social
Level
Figure 2: Detailed Framework for Sustainable Supply Chain Management
5.3.3. Dimension 3: Sustainability
The study suggests that similar to the levels of management, dimension of sustainability also
have three levels such as innovation, environment and social.
Innovation: This is the base level of sustainability dimension comparable to the operational
level of management dimension. Innovations may be introduced across the supply chain,
starting from the organization level (innovations in way of managing business), process level
(introduction of a new process for making or delivering goods and services; organization’s
management systems), product level (the introduction of a new product, or a significant
qualitative change in an existing product), environment and social level (spread across the
Synopsis-14
supply chain, include steps taken by suppliers, manufacturer, distributors and customers),
and market level (competitors, customers).
Environment: This is the middle level of the sustainability dimension, comparable to tactical
level of management dimension. The organizations moving towards achieving sustainability
must include green practices to save environment, and social initiatives to contribute to the
societal wellbeing. This will entail innovations in existing way of doing business. Cleaner
sources of energy and efficient utilization of using existing processes provide cost benefits
along with reducing emission of greenhouse gases. Compliance to rules and regulations
formulated and implemented by government ensure protection of environment and ecology.
Social: This is the highest level in sustainability dimension comparable to strategic level of
management dimension. The actors in supply chain have to be accountable for their actions
as part of their business operations which have a negative impact on human resources as well
as on society at large. Transparency in work culture, providing equal opportunity of
employment, compliance with regulations and fair implementation of policies and procedures
contribute to the goodwill of the organization.
5.4. SSCM Metric
For any business organization, measurement of its performance is critical. The performance
metric needs to be integrated and aligned with the organization’s business goals. Previous
studies on developing a framework on sustainable supply chain management have identified
the sub dimensions of sustainability parameters, but none of them details their metric which
may be used by the practitioners to identify and implement. Similarly, none of the studies
identifies the performance measures which can help practitioners to judge the level of
sustenance of their supply chain operations. However, this study identifies not only the
metrics of each dimension, but also attempts to define the performance measures for the
manufacturer of IT products with respect to its management (economic) and sustainability
dimensions.
The new framework developed for designing and managing a sustainable supply chain
requires parameters to measure the performance, which are represented in the framework of
metric in this research. With respect to the two corresponding dimensions of economic
management and sustainability, two separate metric have been developed for each of the
supply chain actor. The metric for economic (management) aspects of the supply chain were

Synopsis-15
identified and categorized at three levels, viz. Strategic, Tactical and operational. Each actor
in the supply chain has different set of metric for measuring the performance of it efficiency
and effectiveness. The metric for economic (management) and sustainability dimension of
SSCM framework for all supply chain actors have been reviewed by the academicians and
practitioners for their appropriateness and content and have been refined as per their inputs
provided in Appendix-2 and Appendix-3 respectively.
5.5. SSCM Performance Measures for Manufacturer
In the sustainable supply chain of IT products, out of the five identified actors, viz. supplier,
manufacturer, channel partner, dealer/retailer and customer, manufacturer is the focal firm
which derives the supply chain and therefore is the most vital link. This study in its present
form has focused on the performance measures of the manufacturer only, with respect to the
two corresponding dimensions of economic (management) and sustainability.
Review of performance measure of manufacturer by academic experts suggested using SCOR
measures as basis to develop the economic performance measures. Three additional measures
were suggested by the practitioners to be incorporated for measuring the economic
performance of the manufacturer (refer Appendix-4). Practitioners also suggested adding
CSR budget spend, social policies covering the partner employees and role of organization in
shaping industry standards and government legislations as part of network bodies to
sustainability measures (refer Appendix-5).
Economic Measures: Performance measures for the economic management of the SSCM are
largely based on Supply Chain Council SCOR model [14]. SCOR is the most comprehensive
model and it translates qualitative performance in metric and gives a comprehensive list
of metrics for supply chain. However, measures suggested by practitioners additional to
SCOR were also incorporated, which were specific to Indian industry as many a time data
regarding SCOR measures is not maintained in Indian organizations. These measures for
economic dimensions are further classified into strategic, tactical and operational levels. The
data captured at the operational level leads to calculation of tactical level measures which can
be further utilized to take strategic level decisions.
Sustainability Measures: Similarly, this research also identifies the performance
measures for all the three sustainability dimensions. The measures have been divided as
General measures, Policy level measures, Implementation level measures, and measures
Synopsis-16
related to compliance to government laws and regulations. General measures relate to the
data independent of financial year. Rest of the measures relate to the particular financial year.
At the policy level, 2 measures are related to Innovation, 6 measures for Environment and 6
measures for Social sub-dimension, which makes a total of 14 policy measures. At the
implementation level, 32 measures identified to capture the operational details of
implementation of sustainability parameters have been delineated, with 7 measures judging
the innovation, and 13 measures for environment and 12 for social parameters of a supply
chain. The 14 compliance level measures try to identify any action taken by the enforcement
agencies against any violation/complaint as per the applicable regulation and laws.
5.6. Sustainability Index for Manufacturer
The Sustainability measures have been quantified and an index has been developed which
may be used by a manufacturing organization to measure its annual score on SSCM. The
Sustainability Index (SI) is divided into four parts, with Part A includes General Measures
and Part B, C and D are the three levels namely Policy level, Implementation level, and
Compliance level. Since such an index does not previously exist, and this study makes a first
attempt towards quantifying the sustainability of supply chain for an IT manufacturer, no
standards/benchmarks are available to compare the scores. Therefore, this study proposes
scoring of parameters of sustainability for the base year on actual data at each facility of the
organization. The measures at the operational level need to be captured for each
manufacturing facility. The scores of all facilities will be aggregated for a composite
sustainability score of the organization. However, in the next year, the scores of each facility
will be relative to its own previous measures. The data provided by each facility for each
financial year needs to be maintained with relevant supporting documents for audit by
internal as well as external independent agency.
Scoring Rationale: The General Measures of SI comprising basic information related to
organization including number of products which are RoHS compliant, number of facilities
certified by LEED /ISO 14001, the reporting to GRI/Dow Jones Index and total patents the
manufacturer holds etc. Since this information is basic and static in nature, no scores are
assigned to them.
Scoring Rationale for the base year: The financial year in which a manufacturer starts
evaluating its performance on the sustainability index will be considered as the base year. At

Synopsis-17
the policy level, scoring is based on the response of the practitioners against each policy at
three levels such as
1. Policy exist in the organization,
2. Policy is documented and
3. Accessible to all stakeholders.
These can be answered as ‘Yes’ or ‘No’ and will draw 1 point if the policy exists in the
organization, considering the fact that most organizations agree with the statement. It requires
strategic orientation, organizational will and due diligence for an organization to have a
documented policy on each relevant sub-dimensions of sustainability. So, in case a policy on
any of the sub-dimension of sustainability is available in written form, the organization is
awarded 3 points. To ensure effective implementation of policy, organization needs to
promote, encourage and make it easily available to all stakeholders. Organizations making
their policies easily accessible to all stakeholders are awarded 5 points. A total of maximum
5 points can be earned on each policy and a total maximum score from policy level would be
70.
At the operational level, there are total 36 measures on 3 sub-dimensions of sustainability (7
for innovation, 13 for environment and 16 for social) to judge the level of implementation of
policies on sustainability. Each facility needs to input actual data for the operational measures
and each measure is accorded 5 points in the base year of assessment. In case, no data is
provided, the measure will earn zero points. Thus the innovation dimension will earn a
maximum of 35 points, 65 points for environment measures and 80 points for social
measures, making a total of 180 points. In case the value of the measure is zero, it needs to be
entered to earn 5 points, for example, cases of reported child labor at the facility is ‘zero’,
then number ‘0’ needs to be entered against the statement rather than leaving it blank. The
base year scoring rationale is given in Table 3.
Each sub-dimension of sustainability will have a maximum score derived by adding the
policy level and the implementation level scores. Thus the sub dimension Innovation will
have a maximum score of 45; Environment would have a maximum score of 95 and in the
Social sub dimension, a maximum of 110 points. In total it will be of 250 points for all three
sub-dimensions.
Synopsis-18
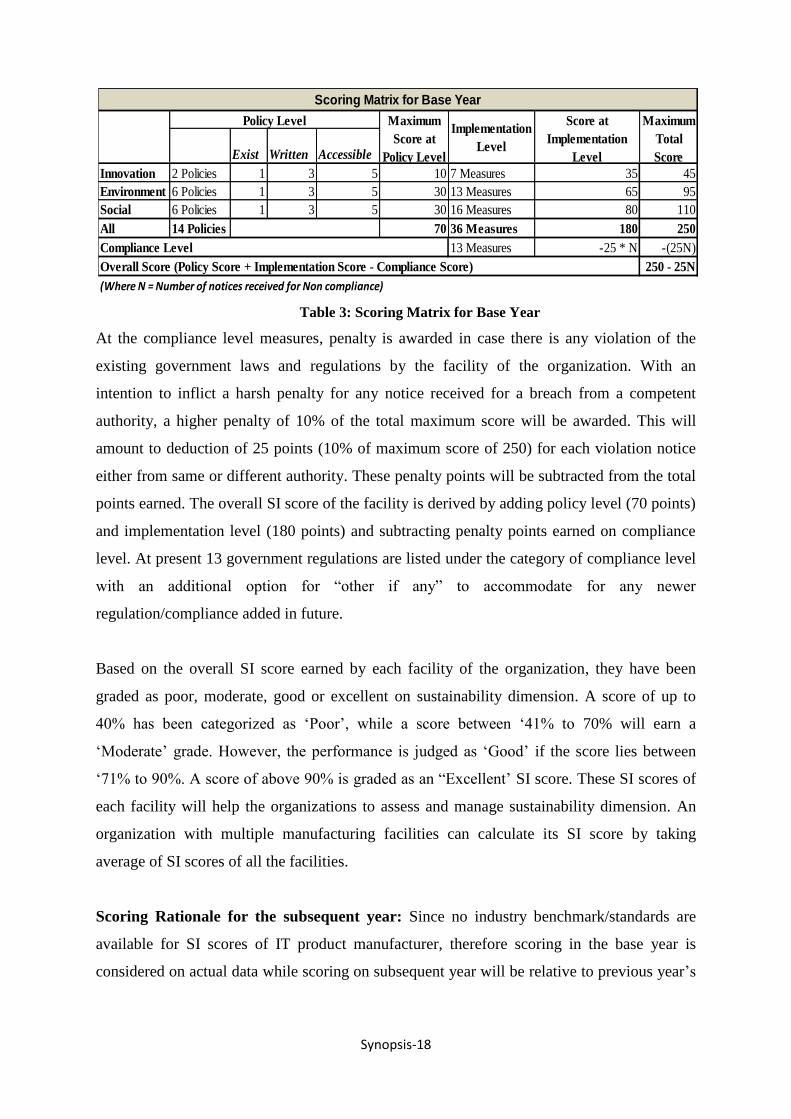
Table 3: Scoring Matrix for Base Year
At the compliance level measures, penalty is awarded in case there is any violation of the
existing government laws and regulations by the facility of the organization. With an
intention to inflict a harsh penalty for any notice received for a breach from a competent
authority, a higher penalty of 10% of the total maximum score will be awarded. This will
amount to deduction of 25 points (10% of maximum score of 250) for each violation notice
either from same or different authority. These penalty points will be subtracted from the total
points earned. The overall SI score of the facility is derived by adding policy level (70 points)
and implementation level (180 points) and subtracting penalty points earned on compliance
level. At present 13 government regulations are listed under the category of compliance level
with an additional option for “other if any” to accommodate for any newer
regulation/compliance added in future.
Based on the overall SI score earned by each facility of the organization, they have been
graded as poor, moderate, good or excellent on sustainability dimension. A score of up to
40% has been categorized as ‘Poor’, while a score between ‘41% to 70% will earn a
‘Moderate’ grade. However, the performance is judged as ‘Good’ if the score lies between
‘71% to 90%. A score of above 90% is graded as an “Excellent’ SI score. These SI scores of
each facility will help the organizations to assess and manage sustainability dimension. An
organization with multiple manufacturing facilities can calculate its SI score by taking
average of SI scores of all the facilities.
Scoring Rationale for the subsequent year: Since no industry benchmark/standards are
available for SI scores of IT product manufacturer, therefore scoring in the base year is
considered on actual data while scoring on subsequent year will be relative to previous year’s
Exist Written Accessible
Innovation 2 Policies 1 3 5 10 7 Measures 35 45
Environment 6 Policies 1 3 5 30 13 Measures 65 95
Social 6 Policies 1 3 5 30 16 Measures 80 110
All 14 Policies 70 36 Measures 180 250
13 Measures -25 * N -(25N)
250 - 25NOverall Score (Policy Score + Implementation Score - Compliance Score)
(Where N = Number of notices received for Non compliance)
Compliance Level
Scoring Matrix for Base Year
Maximum
Score at
Policy Level
Score at
Implementation
Level
Implementation
Level
Policy Level Maximum
Total
Score

Synopsis-19
data. The relative comparison of scores will help to chalk out the progress made, and identify
the areas for improvement as well.
In case an improvement is observed in the subsequent year over the base year, each measure
will get a score of 5 points. If the data remains unchanged, i.e. there is no improvement and
status quo is maintained, a lower score of 3 points will be awarded. However, in case of
decline in performance over the last year reported data, a lower score of 1 point is scored. In
case a measure was not reported in the previous year as it was not captured by the facility, but
is reported in this year, it will be considered as base value and scored at 5 points. However, if
an organization fails to report on a particular measure, on which it has reported earlier, it
would be seen as deliberate avoidance/dereliction, and a penalty of ‘-1’ point will be awarded
for that measure.
Based on the nature of data for all 36 measures, they have been categorized and scored as
depicted in the Table 4 below.
Category A: A higher value is considered as improvement and will score 5 points. For
example, for the measure “Percent reduction in e-waste generation”, if there is an increase
in the value over previous year’s data, 5 points will be awarded, In case the status quo is
maintained 3 points, or if the data show a decline, a single point will be scored.
Category B: A lower value is considered as improvement and will score 5 points. For
example, for the measure “Overall carbon footprint of your manufacturing processes (In
Carbon Dioxide equivalent (CO2e))”, if there is a decrease in the value over previous
year’s data, 5 points will be awarded, In case the status quo is maintained 3 points, or if
the data show an increase, a single point will be scored.
Category C: Measures in this category have an ideal value to compare, such as 100%, 1:1
ratio or 0. For example, ‘Percentage of work force covered under PF Act’ measure has an
ideal value of 100%. This category measures are divided into two sub-categories C1 and
C2. C1 category comprise of measures in which having higher value as compared to base
year vale is considered as better measure, while in C2 a lower value as compared to base
year value is considered a better measure.

Synopsis-20
Table 4: Scoring Rationale for Subsequent Year
For C1 category, if the facility has reported an ideal value in the base year, then the
unchanged values will also score 5 points. For example, in ‘Percentage of work force
covered under PF Act’, if the base year value is ‘100%’, then the same ideal value
‘100%’ will earn 5 points as no further improvement is possible. In case the value in
the subsequent year is higher than the base year value, 5 points will be scored, while
for a lower value only 1 point will be awarded. However, in case a value reported in
the base year is unreported in the subsequent year, it would be penalized with 1 point.
For C2 category, if the facility has reported an ideal value in the base year, then the
unchanged values will also score 5 points. For example, in ‘Cases of reported child
labor’, if the base year value is ‘Zero’, then the same ideal value ‘Zero’ will earn 5
points as no further improvement is possible. In case the value in the subsequent year
is lower than the base year value, 5 points will be scored, while for a higher value
only 1 point will be awarded. However, in case a value reported in the base year is
unreported in the subsequent year, it would be penalized with 1 point.
5.7. Verification and testing
The conceptual framework, metric and measures for SSCM developed on the basis of
integrative literature review was reviewed and refined on the basis of inputs from
academicians in the area of SCM and industry practitioners for its suitability and applicability
in their supply chain processes. The refined SSCM framework, metric and performance
measure for manufacturer were verified with practitioners in selected companies for their
applicability. The verified framework, metric and measures are described in section 5.3, 5.4
and 5.5 respectively.
The real-time data of the selected manufacturing companies was tested as per the developed
sustainability performance measure index. The analysis shows that the large size companies
have framed policies and procedures to efficiently merge the sustainability parameters into
Category A 24 Measures 5 3 1 5 -1
Category B 3 Measures 1 3 5 5 -1
Category C1 4 Measures 5 5 1 5 -1
Category C2 5 Measures 1 5 5 5 -1
Reported in the base year but
not reported in subsequent year
Higher
Value
Scoring Rationale for Subsequent Year
Score as compared to Base YearNumber of measures per
category Unchanged
Value
Lower
Value
Not reported in
the base year

Synopsis-21
their SC processes. They are also capturing the data to measure their environmental and
societal impact as well as generating new ideas and innovation to become sustainable.
Medium size companies contacted in this study were found not reporting on most of the
parameters of sustainability. Policies related to social dimension do exist but they lack at the
implementation level. However, they are following the E-waste and RoHS regulations
implemented by the Indian government and have framed polices as per the rules. They have
also set up e-waste collections centers, their own or through an external agency, for reverse
logistics processes. However, much needs to be done to increase the amount of recycled
material, and proper infrastructure needs to be developed to manage the reverse logistics
processes.
6. CONCLUSIONS
The increasing environmental and social concerns at global, regional, national and local
levels are being embraced by the researchers, governments and the business firms with
varying degree of commitments. This research has used integrative literature review approach
to assimilate the emerging concepts on design and planning innovation, environment, social
issues and performance measures in supply chains. Representative literature on the topic of
sustainability frameworks were reviewed criticized and synthesized with the help of
integrative literature review. Following inputs from these reviews a more inclusive
framework of SSCM for IT product companies is developed and further detailed in terms of
specific linkage and interaction of sustainability parameters as well as value chain parameters
with the supply chain actors.
The three-dimensional framework for SSCM may help organizations to conceptualize and
redesign their supply chain based on sustainability parameters. The managers need to think at
strategic, tactical and operational levels and delineate the activities that need to be performed
at each level to manage the economic as well as sustainable aspects of the supply chain. Thus
the SSCM needs to be understood in terms of economic prosperity of the supply chain along
with its sustainability, and management at strategic, tactical and operational levels.
Apart from proposing a new framework for SSCM, this research further identifies the metric
applicable to each dimension of the SSCM for all the actors in the supply chain of IT
products industry. SSCM performance metric for management (economic) and sustainability
dimensions were developed for each actor in the supply chain, and the metric have been

Synopsis-22
divided at three levels of management, viz. strategic, tactical and operational. The metric for
innovation, environment and social parameters may be focused upon by the practitioners to
develop the measurement systems for sustainable supply chains. Subsequently, moving down
to the implementation level, the performance measures for evaluating the economic and
sustainability aspects for the IT product manufacturer have been identified and verified by the
academic and industry experts. The sustainability measures have been quantified and an
index has been developed which may be used by a manufacturing organization to score its
supply chain on the parameters of sustainability.
7. IMPLICATIONS OF RESEARCH
This research has practical implication for the IT product industry as it provides a framework
for the organizations to conceptualize and redesign their supply chains. The metric and
measures may be utilized by the SCM practitioners to measure their supply chain on the
parameters of sustainability. The Sustainability Index (SI) for IT product industry may help
the organization to calculate its scores and judge its own sustainability performance on
annual basis. Sustainability performance of supply chain actors may be compared with the
previous year’s data to identify the progress, and also recognize the areas for improvement.
8. SCOPE OF FUTURE RESEARCH
Since the performance measure of other actors, viz. supplier, channel partner, retailer and
customer on economic and sustainability parameters were not in the scope of study, further
research may measure their performance on these parameters. An overall sustainability score
of the entire supply chain may be arrived at by aggregating the indices of all supply chain
actors. Further, research may be carried on developing indices, best practices and
benchmarks.
Since it is imperative for the businesses to inculcate sustainability practices in their supply
chains, the adoption and implementation of a ‘SSCM framework’ will provide a starting
point. However, the implementation of such a framework would require commitment of the
management and necessitate additional resources. Sustainability objective may be achieved
by realization of environment and social goals of an organization through innovative
practices, while financial implications of these initiatives will require a separate in-depth
analysis. The returns on investing in sustainability initiative may not be direct and might
manifest in long term, and may not always be in monetary terms. Therefore, the financial

Synopsis-23
implications of adopting such a sustainability framework and its cost benefit analysis may be
undertaken as a scope of future research, after testing and verification of the framework on a
larger sample size.
9. SELECTED REFERENCES
[1] DIT, “Information Technology Annual Report,” Department of Information Technology
- MCIT, New Delhi, 2010-11.
[2] OECD, “The Information and Communication Technology Sector in India: Performance,
Growth and Key Challenges,” OECD Digital Economy Papers, No. 174, OECD
Publishing, 2010.
[3] NSDC, “Human Resource and Skill Requirements in the Electronics and IT Hardware
Industry,” Naitonal Skill Development Corporation, New Delhi, 2009.
[4] R. J. Torraco, “Writing integrative literature reviews: Guidelines and examples,” Human
Resource Development Review, vol. 4, pp. 356-367, 2005.
[5] J. Elkington, Cannibals with Forks: The Triple Bottom Line of the 21st Century, Stoney
Creek, CT: New Society Publishers, 1998.
[6] C. Carter and D. Rogers, “A framework of sustainable supply chain management:
moving toward new theory,” International Journal of Physical Distribution & Logistics
Management,, vol. 38, no. 5, pp. 360-387, 2008.
[7] M. Pagell and Z. Wu, “Building a more complete theory of sustinable supply chain
management using case studies of 10 exemplers,” Journal of Supply Chain Management,
vol. 45, no. 2, pp. 37-56, 2009.
[8] H. Mann, U. Kumar, V. Kumar and I. Mann, “Drivers of Sustainable Supply Chain
Management,” The IUP Journal of Operations Management, vol. IX, no. 4, pp. 52-63,
2010.
[9] A. Dey, P. LaGuardia and M. Srinivasan, “Building sustainability in logistics operations:
a research agenda,” Management Research Review, vol. 34, no. 11, pp. 1237-1259,
2011.
[10] A. Ramudhin, A. Chaabane and M. Paquet, “Carbon market sensitive sustainable supply
chain network design,” International Journal of Management Science and Engineering
Management, vol. 5, no. 1, pp. 30-38, 2010.
[11] V. Gupta, N. Abidi and A. Bandyopadhayay, “Supply Chain Management - A Three
Dimensional Framework,” Journal of Management Research, vol. 5, no. 4, pp. 76-97,
2013.
[12] M. Fox, J. Chionglo and M. & Barbuceanu, “The Integrated Supply Chain Management
System,” Working Paper, Enterprise Integration Laboratory, University of Toronto,
1993.
[13] B. Fleischmann and H. Meyr, “Planning Hierarchy, Modeling and Advanced Planning
Systems,” in Supply Chain Management: Design, Coordination, Operation, Handbooks
in Operations Research and Management Science, Amsterdam, Elsevier, 2003, p. 11:
457–523.
[14] SCC, “Supply-chain.org/scor,” Supply Chain Council, 2010. [Online]. Available:
www.supply-chain.org/scor. [Accessed October 2012].
[15] M. Saad and B. Patel, “An investigation of supply chain performance measurement in

Synopsis-24
the Indian automotive sector,” Benchmarking: An International Journal, vol. 13, no. 1/2,
pp. 36-53, 2006.
[16] B. Beamon, “Supply chain design and analysis: models and methods,” International
Journal of Production Economics, vol. 55, pp. 281-94, 1998.
[17] H. Infosystems, “community-initiative,” [Online]. Available:
http://www.hclinfosystems.in/about-us/community-initiative.
[18] D. Lambert, An executive summary of Supply Chain Management: Process,
Partnerships, Performance, Jacksonville: The Hartley Press Inc, 2008.
[19] N. Singh and J. Shah, ““Benchmarking Internal supply chain performance: development
of a framework”,,” The Journal of Supply Chain Management, vol. winter, pp. 37-47,
2001.
[20] A. Gunasekaran and B. Kobu, “Performance measures and metrics in logistics and
supply chain management: a review of recent literature (1995–2004) for research and
applications,” International Journal of Production Research, vol. 45, no. 12, pp. 2819-
2840, 2007.
[21] R. Kaplan and D. Norton, “The balance score card: measures that drive performance,”
Harvard Business Review, pp. 71-9., 1992.
[22] J. T. Mentzer, W. DeWitt, J. S. Keebler, S. Min, N. W. Nix, C. D. Smith and Z. G.
Zacharia, “Defining Supply Chain Management,” Journal of Business Logistics, vol. 22,
no. 2, pp. 1-25, 2001.
[23] W. Chow, C. Madu, C. Kuei, M. Lu, C. Lin and H. Tseng, “Supply chain management in
the US and Taiwan: An empirical study,” Omega, Available online 5 May 2006, 2006.
[24] P. D. Cousins and R.Spekman, “Strategic Supply and the Management of Inter- and
Intra-Organisational Relationships,” Journal of Purchasing and Supply Management,
vol. 9, no. 1, pp. 19-29, 2003.
[25] F. Spreckley, “Social Audit - A Management Tool for Co-operative Working,”
Beechwood College Ltd, Leeds, UK, 1981 .
[26] A. A. Hervani, M. Helms and J. Sarkis, “Performance measurement for green supply
chain management,” Benchmarking: An International Journal, vol. 12, no. 4, pp. 330-
353, 2005.
[27] V. Gupta, N. Abidi, T. Bansal and R. K. Jain, “Green Supply Chain Management
Initiatives by IT Companies in India,” The IUP Journal of Operations Management, vol.
XII, no. 2, pp. 6-24, 2013.
[28] J. Fortes, “Green Supply Chain Management: A Literature Review,” Otago Management
Graduate Review, vol. 7, no. 1, pp. 51-62, 2009.
[29] S. Srivastava, “Green Supply-Chain Management: A State-of-the-Art Literature
Review,” International Journal of Management Reviews, vol. 9, no. 1, pp. 53-80, 2007.
[30] K. K. Dhanda and A. Peters, “Reverse Logistics in the Computer Industry,”
International Journal of Computers, Systems and Signals, vol. 6, no. 2, pp. 57-67, 2005.
[31] C. R. Carter and L. M. Ellram, “Reverse logistics: A review of the literature and
framework for future investigation,” Journal of Business Logistics, vol. 19, no. 1, pp. 85-
102, 1998.
[32] S. Dowlatshahi, “Developing a theory of reverse logistics,” Interfaces, vol. 30, no. 3, pp.
143-155, 2000.
[33] M. Thierry, L. N. Wassenhove, J. A. E. E. Van Nunen and M. Salomon, “Strategic
issues in product recovery management,” California Management Review, vol. 37, no. 2,

Synopsis-25
pp. 114-135, 1995.
[34] R. Kopicki, M. B. Berg, L. Legg, V. Dasappa and C. Maggioni, Reuse and Recycling –
Reverse Logistics Opportunities, Oak Brook, IL: Council of Logistics Management,
1993.
[35] B. Beamon, “Measuring supply chain performance,” International Journal of
Operations & Production Management, vol. 19, no. 3, pp. 275-92, 1999.
[36] Q. Zhu, Y. Geng, T. Fujita and S. Hashimoto, “Green Supply Chain Management in
Leading Manufacturers: Case Studies in Japanese Large Companies,” Management
Research Review, vol. 33, no. 4, pp. 380-392, 2010.
[37] H. Infosystems, “Esafe Initiatives,” 2012. [Online]. Available:
http://www.hclinfosystems.in/hclesafe_initiative.htm. [Accessed 03 September 2012].
[38] S. Seuring and M. Muller, “From a literature review to a conceptual framework for
sustainable supply chain management,” Journal of Cleaner Production, vol. 16, pp.
1699-1710, 2008.
10. LIST OF PUBLICATIONS
1. Gupta, V., Abidi, N., Bansal, T. and Jain, R.K. (2013) 'Green Supply Chain Management
Initiatives by IT Companies in India', The IUP Journal of Operations Management, vol.
XII, no. 2, pp. 6-24. (National Journal Indexed in EBSCO & Proquest)
2. Gupta, V., Abidi, N. and Bandyopadhayay, A. (2013) 'Supply Chain Management - A
Three Dimensional Framework', Journal of Management Research, vol. 5, no. 4, pp. 76-
97, Macrothink Institute, Las Vegas, Nevada 89108, USA. (International Journal Indexed
in Web of Science, Proquest)
3. Gupta, V., Abidi, N. and Bandyopadhayay, A. (2013) 'Framework for Managing
Innovations in Supply Chains of ICT Products', International Journal Of Innovative
Research And Development, vol. 2, no. 12, pp. 160-66. (International Journal)

Synopsis-26
APPENDIX 1: Case Study
Company A1
A1 is India´s premier hardware, services and Information and Communication Technology
(ICT) systems Integration Company, which offers a wide spectrum of ICT products that
includes Computing, Storage, Networking, Security, Telecommunication, Imaging and Retail
solutions. A1 has four hardware manufacturing plants, 2 at Puducherry, 1 at Chennai in South
India while 1 at Rudrapur in North India. A1 has India's largest distribution and retail
network with 27 warehouses across 24 states, 700 plus re-distribution stockists, 93000 outlets
in 11000 plus towns in India.
A1 always focused on developing a sustainable future through environment friendly ICT
products and services. A1 has been recognized as one of the greenest company among Indian
ICT manufacturing companies. The company launched ‘A1 ecoSafe’ program which ensures
that all A1 products are matching standards and compliances. This led to introduction of
Green desktops, equipped with the unique DES (Dynamic Energy Saver) technology, that cut
overall power consumption by 20-35%. It also developed RoHS compliant Desktops Servers
and Laptops and is a leader in Green Integrated Circuit Technology (GICT) manufacturers.
A1 also has a comprehensive e-waste recycling policy, wherein A1 facilitates its consumers
to recycle / dispose their ‘end of life’ products in an environmentally safe manner. The A1
initiatives for Green Manufacturing, Recycling and Safe Disposal of unused ICT products,
have helped the supply chain to be more environment-friendly.
In line with its Code of Business Ethics and Conduct (COBEC), A1 places significant
emphasis on the respect and dignity of every employee. A1 employees are empowered to
drive innovation, transforming client engagements and markedly improving client
satisfaction. A1 complies with anti-corruption and anti-bribery laws as applicable. A1 is an
equal opportunity employer and has a strong, clear and documented stand against any form of
harassment at the workplace.
Company A2
A2 Infotech is a leading manufacturer of computer hardware and provider of IT services in
India and the Middle East region. The IT Products segment sells a range of A2 personal
desktop computers, A2 servers and A2 notebooks. The Company is also a value added
reseller of desktops, servers, notebooks, storage products, networking solutions and packaged
software for leading international brands. A2 PC products are manufactured at a state-of-the-
art facility in Puducherry and Kotdwar. These Green manufacturing units facilitate 100%
ROHS compliant products in line with ecological sustainability directives. 83% of the total
waste from IT India operations is recycled through both in-house recycling units and through
authorized vendor tie-ups. All manufacturing locations have quality, EMS (Environmental
Management System) and Health & Safety, which does thorough audit of the sustainable
practices within the organization as a part of certification process.
The core of A2’s social and community initiatives is focused Eco-eye policy which enables
engagement with stakeholders - on the journey to more sustainable business practices. The

Synopsis-27
initiative focuses on reducing ecological footprint of its business operations, engagement with
employees and its supply chain, partners and customers to create a more sustainable society,
and transparent reporting/disclosures.
Engagement with employees focuses on health and safety, people development, and
increasing diversity and inclusivity at workplace. The key pillars of diversity in A2 are
Gender, Nationality, Persons with Disabilities and socio economic background. Transparent
reporting is important for its internal and external stakeholders. Having a robust
whistleblower policy that employees and other stakeholders can use without fear or
apprehension is a sine non qua for a transparent and ethical company. A2 has revamped its
sexual harassment investigation process and procedure to make it more comprehensive,
spread awareness, make the reporting easy and faster resolution of complaints
Company A3
A3 Computer India Private Ltd. was established in the city of Bangalore, India in the year
1996, and it has been among the fastest growing technology companies in India and
continues to be among the top three IT companies. A3 manufacturing (India Customer
Center-ICC) facility was inaugurated in Sriperumbudur, near Chennai, in Tamil Nadu in
2007. A3 had pioneered a unique direct model of selling PCs bypassing the conventional
model of selling them through the retail channel. Using the direct model, A3 provided
consumers with tailor-made products, built only after procuring the order from them. In the
process, it was able to reduce inventory costs and overheads as it didn't need any
intermediaries.
As a strategy for reducing its carbon footprints the company has taken several initiatives to
make the processes more environments friendly. All A3 products and solutions are designed
with the environment in mind and without sacrificing performance or reliability. A3 is
committed to developing innovative products that help you do more while minimizing your
environmental impact. A3 is committed to reducing impact of its operations and those of its
supply chain on the planet and the communities. Central to this idea is the practice of using
resources efficiently and managing wastes effectively. A3's industry-leading packaging
solutions focus on reducing packaging volume, increasing the use of sustainable content and
making it easy for you to responsibly dispose of packaging through recycling or even
composting.
A3 targets to establish itself as a transparent and ethical company. Being an equal opportunity
employer, A3 discourages any form of undue influence or canvassing by candidates. It
protects employees to engage directly without fear or apprehension as per the robust
whistleblower policy. It encourages diversity and inclusivity across its location round the
globe. A3 has clearly laid down anti-sexual harassment policy which envisages easy
reporting and quick action.
Company B1
B1 Technologies, incepted in the year 1996 is an IT and Consumer Electronics Company.
The company has a pan-India presence through its wide network comprising 30 branches and

Synopsis-28
over 700 service points. B1's manufacturing domain comprises of three associate
manufacturing units located at Jammu (30,000 sq.ft. and 20,000 sq. ft area) and Manpura
(Baddi, HP 51,000 sq. ft area). The company has a strong Centre for Design and
Development in Delhi. B1 is ISO 9001:2008 certified. Sales are routed through a channel
network comprising of 1100+ distributors and 40,000+ dealers spread across the country. The
company launched its chain of exclusive retail outlets- B1 SQUARE and has 42 stores
operational across country and also has a new fully-equipped service centre in Nehru Place.
B1 has put in place an all India collection mechanism to assist its customers for disposal of e-
waste as per the new Rules effective May 1, 2012. B1 assures all its customers that all its e-
waste collected under these Rules will be recycled/disposed by an authorized recycling
agency.
B1 is known for its consistent policy of transparent, fair and ethical trade practices. B1 has no
legal case regarding corrupt practices. B1 believes in Equal Opportunity Employment and
affirmative action. It does not discriminate against or harass any employee or applicant for
the employment on the basis of race, color, and creed, religion, national origin, sex and
sexual orientation, disability, age, marital status or status with regard to public assistance.
Company B2
An ISO 9001:2008, 14001:2004 & 18001:2007 certified Company, B2 Infosystems Limited
has built its reputation through the brand Chirag - an indigenous range of desktops and
workstations. The Company’s latest innovation is called 'Greenputer™', a range of eco-
friendly desktops that require only one-third of the power that other PCs normally consume.
The business segments at B2 are PC & Laptop integration – CHIRAG Brand, Hardware and
Network Integration and Maintenance and Facility management services. B2 has state-of-the-
art factories at Parwanoo in Himachal Pradesh and Howrah in West Bengal. At present B2
network covers 400+ dealers and Value Added Retailers and over 200+ dedicated retail
outlets across India.
B2 adheres to the draft e-waste (Management and Handling) Rules, 2012. B2’s overall e-
waste management policy aims at providing efficient and easy product recovery options to
consumers under IPR/EPR to facilitate responsible product retirement of all its manufactured
products along with taking financial responsibility for the same. Chirag manufacturing
facilities are fully ISO 14001:2004 compliant. B2 has also adopted OHSAS 18001:2007
standards for health &safety. B2 Infosystems is working towards moving from RoHS
compliance to getting its products RoHS certified.
B2 is fully committed to develop and operate a safe, healthy and clean environment to protect
vital human resources. The Company has clearly defined policy against sexual harassment as
defined in the Indian laws and has zero Tolerance towards instances of sexual harassment and
discrimination. B2 is an equal opportunity employer and any type of canvassing by the
candidate leads to immediate disqualification. B2 does not employ anybody who is less than

Synopsis-29
18 years directly or indirectly. Also, B2 does not practice forced labour, in any form, for any
reason whatsoever.
Company B3
B3 Systems Ltd. is one of India's leading networking companies, established in the year
1993. The company has a robust product portfolio and a nationwide reach through its
network of national and regional distributors, resellers and system integrators. B3 business
outline includes DIGISOL - Active Networking Solutions, DIGILITE – Motherboards and
More, DIGICARE - Service & Support, Research & Development, Electronic Manufacturing
Services and Contract & In-house Manufacturing. The existing manufacturing facility located
at Goa has ISO ISO9001: 2008 and ISO 14001:2004 certified plants. B3’s unique distribution
system comprises of 17 Branch Offices, 22 Regional Distributors, over 200 Empower Value
System Integrators, over 1000 Empower Value Added Resellers and over 5000 Empower
Authorised Partners.
B3 adheres to the draft e-waste (Management and Handling) Rules, 2012. B3’s overall e-
waste management policy aims at providing efficient and easy product recovery options to
consumers under IPR/EPR to facilitate responsible product retirement of all its manufactured
products along with taking financial responsibility for the same. It is also the first of its kind
IT organization to adapt OHSAS 18001:2007 standards for health &safety. B3 is working
towards moving from RoHS compliance to getting its products RoHS certified.
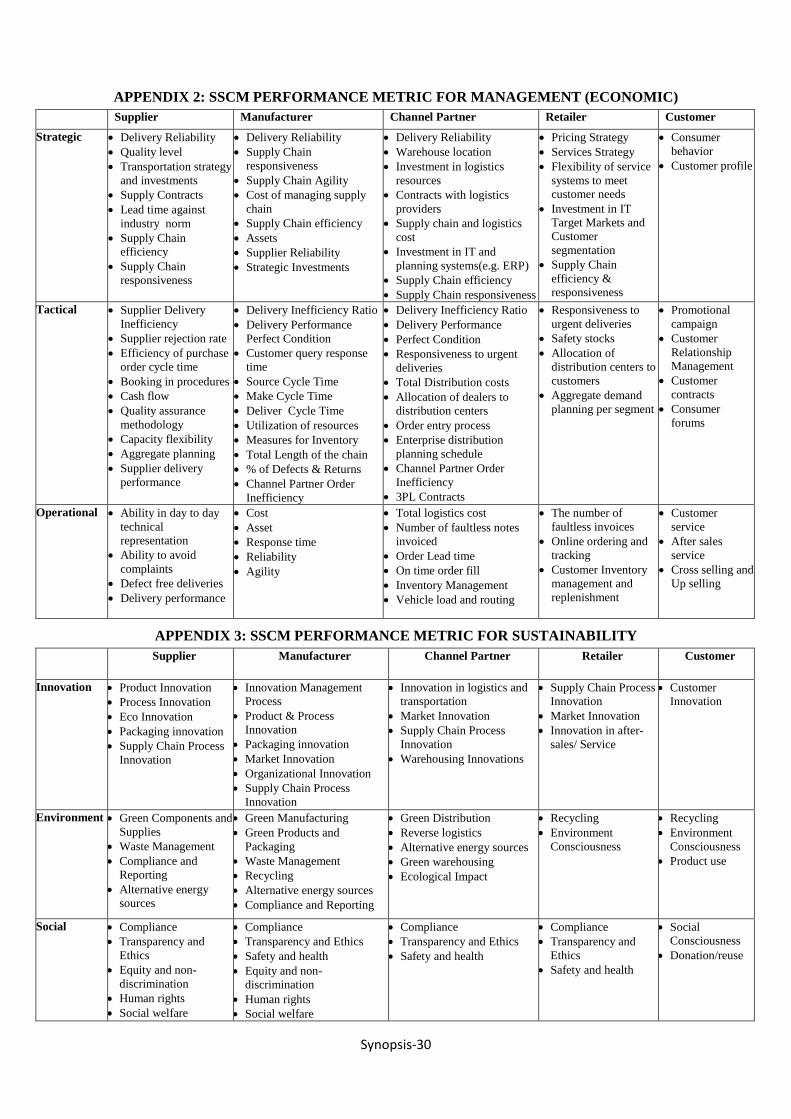
Synopsis-30
APPENDIX 2: SSCM PERFORMANCE METRIC FOR MANAGEMENT (ECONOMIC)
Supplier Manufacturer Channel Partner Retailer Customer
Strategic Delivery Reliability
Quality level
Transportation strategy
and investments
Supply Contracts
Lead time against
industry norm
Supply Chain
efficiency
Supply Chain
responsiveness
Delivery Reliability
Supply Chain
responsiveness
Supply Chain Agility
Cost of managing supply
chain
Supply Chain efficiency
Assets
Supplier Reliability
Strategic Investments
Delivery Reliability
Warehouse location
Investment in logistics
resources
Contracts with logistics
providers
Supply chain and logistics
cost
Investment in IT and
planning systems(e.g. ERP)
Supply Chain efficiency
Supply Chain responsiveness
Pricing Strategy
Services Strategy
Flexibility of service
systems to meet
customer needs
Investment in IT
Target Markets and
Customer
segmentation
Supply Chain
efficiency &
responsiveness
Consumer
behavior
Customer profile
Tactical Supplier Delivery
Inefficiency
Supplier rejection rate
Efficiency of purchase
order cycle time
Booking in procedures
Cash flow
Quality assurance
methodology
Capacity flexibility
Aggregate planning
Supplier delivery
performance
Delivery Inefficiency Ratio
Delivery Performance
Perfect Condition
Customer query response
time
Source Cycle Time
Make Cycle Time
Deliver Cycle Time
Utilization of resources
Measures for Inventory
Total Length of the chain
% of Defects & Returns
Channel Partner Order
Inefficiency
Delivery Inefficiency Ratio
Delivery Performance
Perfect Condition
Responsiveness to urgent
deliveries
Total Distribution costs
Allocation of dealers to
distribution centers
Order entry process
Enterprise distribution
planning schedule
Channel Partner Order
Inefficiency
3PL Contracts
Responsiveness to
urgent deliveries
Safety stocks
Allocation of
distribution centers to
customers
Aggregate demand
planning per segment
Promotional
campaign
Customer
Relationship
Management
Customer
contracts
Consumer
forums
Operational Ability in day to day
technical
representation
Ability to avoid
complaints
Defect free deliveries
Delivery performance
Cost
Asset
Response time
Reliability
Agility
Total logistics cost
Number of faultless notes
invoiced
Order Lead time
On time order fill
Inventory Management
Vehicle load and routing
The number of
faultless invoices
Online ordering and
tracking
Customer Inventory
management and
replenishment
Customer
service
After sales
service
Cross selling and
Up selling
APPENDIX 3: SSCM PERFORMANCE METRIC FOR SUSTAINABILITY
Supplier Manufacturer Channel Partner Retailer Customer
Innovation Product Innovation
Process Innovation
Eco Innovation
Packaging innovation
Supply Chain Process
Innovation
Innovation Management
Process
Product & Process
Innovation
Packaging innovation
Market Innovation
Organizational Innovation
Supply Chain Process
Innovation
Innovation in logistics and
transportation
Market Innovation
Supply Chain Process
Innovation
Warehousing Innovations
Supply Chain Process
Innovation
Market Innovation
Innovation in after-
sales/ Service
Customer
Innovation
Environment Green Components and
Supplies
Waste Management
Compliance and
Reporting
Alternative energy
sources
Green Manufacturing
Green Products and
Packaging
Waste Management
Recycling
Alternative energy sources
Compliance and Reporting
Green Distribution
Reverse logistics
Alternative energy sources
Green warehousing
Ecological Impact
Recycling
Environment
Consciousness
Recycling
Environment
Consciousness
Product use
Social Compliance
Transparency and
Ethics
Equity and non-
discrimination
Human rights
Social welfare
Compliance
Transparency and Ethics
Safety and health
Equity and non-
discrimination
Human rights
Social welfare
Compliance
Transparency and Ethics
Safety and health
Compliance
Transparency and
Ethics
Safety and health
Social
Consciousness
Donation/reuse
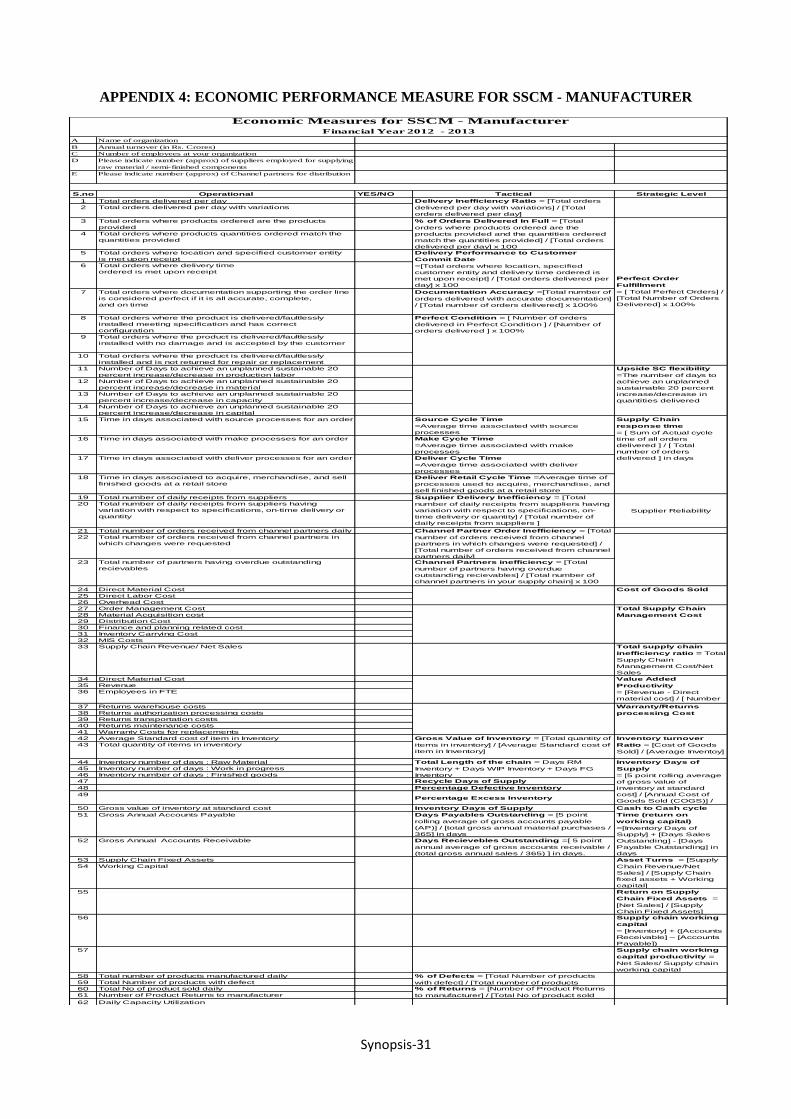
Synopsis-31
APPENDIX 4: ECONOMIC PERFORMANCE MEASURE FOR SSCM - MANUFACTURER
A Name of organization
B Annual turnover (in Rs. Crores)
C Number of employees at your organization
D Please indicate number (approx) of suppliers employed for supplying
raw material / semi-finished components
E Please indicate number (approx) of Channel partners for distribution
S.no Operational YES/NO Tactical Strategic Level
1 Total orders delivered per day
2 Total orders delivered per day with variations
3 Total orders where products ordered are the products
provided
4 Total orders where products quantities ordered match the
quantities provided
5 Total orders where location and specified customer entity
is met upon receipt
6 Total orders where delivery time
ordered is met upon receipt
7 Total orders where documentation supporting the order line
is considered perfect if it is all accurate, complete,
and on time
Documentation Accuracy =[Total number of
orders delivered with accurate documentation]
/ [Total number of orders delivered] x 100%
8 Total orders where the product is delivered/faultlessly
installed meeting specification and has correct
configuration
9 Total orders where the product is delivered/faultlessly
installed with no damage and is accepted by the customer
10 Total orders where the product is delivered/faultlessly
installed and is not returned for repair or replacement
11 Number of Days to achieve an unplanned sustainable 20
percent increase/decrease in production labor
12 Number of Days to achieve an unplanned sustainable 20
percent increase/decrease in material
13 Number of Days to achieve an unplanned sustainable 20
percent increase/decrease in capacity
14 Number of Days to achieve an unplanned sustainable 20
percent increase/decrease in capital
15 Time in days associated with source processes for an order Source Cycle Time
=Average time associated with source
processes
16 Time in days associated with make processes for an order Make Cycle Time
=Average time associated with make
processes
17 Time in days associated with deliver processes for an order Deliver Cycle Time
=Average time associated with deliver
processes
18 Time in days associated to acquire, merchandise, and sell
finished goods at a retail store
Deliver Retail Cycle Time =Average time of
processes used to acquire, merchandise, and
sell finished goods at a retail store
19 Total number of daily receipts from suppliers
20 Total number of daily receipts from suppliers having
variation with respect to specifications, on-time delivery or
quantity
21 Total number of orders received from channel partners daily
22 Total number of orders received from channel partners in
which changes were requested
23 Total number of partners having overdue outstanding
recievables
Channel Partners inefficiency = [Total
number of partners having overdue
outstanding recievables] / [Total number of
channel partners in your supply chain] x 100
24 Direct Material Cost
25 Direct Labor Cost
26 Overhead Cost
27 Order Management Cost
28 Material Acquisition cost
29 Distribution Cost
30 Finance and planning related cost
31 Inventory Carrying Cost
32 MIS Costs
33 Supply Chain Revenue/ Net Sales Total supply chain
inefficiency ratio = Total
Supply Chain
Management Cost/Net
Sales
34 Direct Material Cost
35 Revenue
36 Employees in FTE
37 Returns warehouse costs
38 Returns authorization processing costs
39 Returns transportation costs
40 Returns maintenance costs
41 Warranty Costs for replacements
42 Average Standard cost of item in Inventory
43 Total quantity of items in inventory
44 Inventory number of days : Raw Material
45 Inventory number of days : Work in progress
46 Inventory number of days : Finished goods
47 Recycle Days of Supply
48 Percentage Defective Inventory
49Percentage Excess Inventory
50 Gross value of inventory at standard cost Inventory Days of Supply
51 Gross Annual Accounts Payable Days Payables Outstanding = [5 point
rolling average of gross accounts payable
(AP)] / [total gross annual material purchases /
365] in days
52 Gross Annual Accounts Receivable Days Recievebles Outstanding =[ 5 point
annual average of gross accounts receivable /
(total gross annual sales / 365) ] in days.
53 Supply Chain Fixed Assets
54 Working Capital
55 Return on Supply
Chain Fixed Assets =
[Net Sales] / [Supply
Chain Fixed Assets]
56 Supply chain working
capital
= [Inventory] + ([Accounts
Receivable] – [Accounts
Payable])
57 Supply chain working
capital productivity =
Net Sales/ Supply chain
working capital
58 Total number of products manufactured daily
59 Total Number of products with defect
60 Total No of product sold daily
61 Number of Product Returns to manufacturer
62 Daily Capacity Utilization
% of Returns = [Number of Product Returns
to manufacturer] / [Total No of product sold
daily]
Cash to Cash cycle
Time (return on
working capital)
=[Inventory Days of
Supply] + [Days Sales
Outstanding] - [Days
Payable Outstanding] in
days
Asset Turns = [Supply
Chain Revenue/Net
Sales] / [Supply Chain
fixed assets + Working
capital]
% of Defects = [Total Number of products
with defect] / [Total number of products
Warranty/Returns
processing Cost
Gross Value of Inventory = [Total quantity of
items in inventory] / [Average Standard cost of
item in Inventory]
Inventory turnover
Ratio = [Cost of Goods
Sold] / [Average Inventoy]
Total Length of the chain = Days RM
Inventory + Days WIP Inventory + Days FG
Inventory
Inventory Days of
Supply
= [5 point rolling average
of gross value of
inventory at standard
cost] / [Annual Cost of
Goods Sold (COGS)] /
365 in days
Cost of Goods Sold
Total Supply Chain
Management Cost
Value Added
Productivity
= [Revenue - Direct
material cost] / [ Number
of employees ]
Channel Partner Order Inefficiency = [Total
number of orders received from channel
partners in which changes were requested] /
[Total number of orders received from channel
partners daily]
Delivery Inefficiency Ratio = [Total orders
delivered per day with variations] / [Total
orders delivered per day]
% of Orders Delivered In Full = [Total
orders where products ordered are the
products provided and the quantities ordered
match the quantities provided] / [Total orders
delivered per day] x 100
Perfect Order
Fulfillment
= [ Total Perfect Orders] /
[Total Number of Orders
Delivered] x 100%
Delivery Performance to Customer
Commit Date
=[Total orders where location, specified
customer entity and delivery time ordered is
met upon receipt] / [Total orders delivered per
day] x 100
Perfect Condition = [ Number of orders
delivered in Perfect Condition ] / [Number of
orders delivered ] x 100%
Upside SC flexibility
=The number of days to
achieve an unplanned
sustainable 20 percent
increase/decrease in
quantities delivered
Supply Chain
response time
= [ Sum of Actual cycle
time of all orders
delivered ] / [ Total
number of orders
delivered ] in days
Supplier Delivery Inefficiency = [Total
number of daily receipts from suppliers having
variation with respect to specifications, on-
time delivery or quantity] / [Total number of
daily receipts from suppliers ]
Supplier Reliability
Economic Measures for SSCM - Manufacturer
Financial Year 2012 - 2013

Synopsis-32
APPENDIX 5: SUSTAINABILITY PERFORMANCE MEASURE FOR SSCM –
MANUFACTURER
a Name of organization e Number of products which are RoHS
compliantPolicy, Implementation &
Non ComplianceMax Score
b Turnover f No. of facilities/buildings certified by LEED
/ISO 14001Innovation 45 0
c Number of employees g Do you report to GRI/Dow Jones Index Environment 95 0
d Location and Total/Built-Up area of the
manufacturing plant
h Total number of patents your organzation
holds Social 110 0
Overall 250 0
Does your organization has a policy for Exists Documented Accessible Score Does your organization has a policy for Exists Documented Accessible Score
i Products and Process Innovation viii Suppliers Selection/Evaluation (based on
Environment norms) Sustainability Parameter Max Score
ii Supply Chain Innovation ix Suppliers Selection/Evaluation (based on
Social norms)Innovation 10 0
iii Reverse logistics x Ethics and Transparency Environment 30 0
iv Reduction of hazardous substances(RoHS) xi Equity/Non-Discrimination Social 30 0
v E-waste management xii Social welfare Total 70 0vi Energy Conservation xiii Occupational Health and safety
vii Environmental and Social Regulations xiv Human Rights (Child labour//Minimum
Wages/Anti Sexual Harrassment)
i.a vii.bSustainability Parameter Max Score
i.b viii.aInnovation 35 0
i.c ix.aEnvironment 65 0
i.d x.aSocial 80 0
i.e x.bTotal 180 0
ii.a x.c
ii.b x.d
iii.a xi.a Poor
(Upto 40%)
iii.b xi.bModerate
(41-70%)
iii.c xi.c Good
(71-90%)
iii.dxi.d Excellent
(91-100%)
iv.a xii.a
iv.b xii.b
v.a xii.c
v.b xiii.a
vi.a xiv.a
vi.b xiv.b
vii.a xiv.c
i viii Max Score
ii ixTotal 0 0
iii x
iv xi
v xii
vi xiii
vii xiv
Legend
Part A: General Measures
Part B: Policy Measures [Instructions : In your organization a policy, EXISTS (means is in regular practice), DOCUMENTED (means is available in
written form), ACCESSIBLE (means is accessible to all the stakeholders). Kindly mark the following as Y= Yes, N=No]
Percent reduction in GHG emissions over base year
Number of Patents filed by your organization
Percentage of external scrutiny/queries resolved Number of Supply Chain innovations
Number of network/ government bodies your
organization is a part of?
Number of employees awarded/recognized for
creativity/innovations internally by the organization
Number of events/workshops/seminars organized to
promote innovations
Sustainability Score
Part C: Implementation Measures [Kindly provide the data for the financial year 2012 - 2013]
Number of Certificate/Award/Recognition received by
your organization related to innovation?
Number of employees awarded for
creativity/innovations by an external agency
Implementation
Policy
Percentage of suppliers complying with environmental
norms
Sustainability Index of SSCM - Manufacturer (Financial Year 2012-13)
Number of reported cases of unethical practices
(Including partner employees onsite)
Percentage of suppliers complying with social norms
Percentage of water recycled and reused.
Percentage reduction in use of packing material
Number of reported incidents of discrimination
(Including partner employees onsite)
Amount in rupess spent by innovation cell to monitor
innovations
Percentage of material that is recycled
Number of resolved cases of unethical practices
(Including partner employees onsite)
Ratio of basic salary of men to women by employee
category.
Number of cases of discrimination where corrective
actions taken (Including partner employees onsite)
Percentage of work force covered under PF Act
Any certificate/Award/Recognition related to CSR?
Percentage of packaging that is recycled
No. of products which are certified RoHS compliant
in current year
Percentage of women in total workforce
Percentage reduction in use of hazardous materials
Non Compliance
Number of e-waste collection centers
Total Spend on CSR activities (as % of Profit after
tax)
Percent of alternate energy consumption to total
energy consumption
Cases of reported child labour
Percent reduction in e-waste generation
Overall carbon footprint of your manufacturing
processes (In Carbon Dioxide equivalent (CO2e))
Percent reduction in energy costs Cases of reported violation of minimum wages to
factory employees (Including partner employees
Number of Safety related incidences (Including
partner employees onsite)
Cases of reported sexual harrassment (Including
partner employees onsite)
Part D: Compliance Measures [Does your organization receive any notice regarding violation of following government laws? Kindly mark as Y= Yes, N=No]
Employees Provident Fund and Miscellaneous
Environment (Protection) Act, 1986
Companies Act, 1956
E Waste (Management &, Handling) Rukes, 2012
Equal Remuneration Act, 1976
Protection of Human Rights (Amendment) Act, 2006
Child Labour (Prohibition & Regulation) Act, 1986 Any other (Specify)
Prevention of Corruption Act, 1988
Persons with Disabilities (Equal Opportunities,
Air (Prevention and Control of Pollution) Act, 1981
Energy Conservation Act, 2001Vishaka v. State of Rajasthan, (1997) 6 SCC 241
Water (Prevention and Control of Pollution) Act , 1974