syndromic surveillance climate and health guidance … · syndromic surveillance climate and health...
TRANSCRIPT

SYNDROMIC SURVEILLANCE CLIMATE AND HEALTH GUIDANCE DOCUMENTHow Jurisdisctions Can Use Surveillance to Quantify and Track Climate-Related Health Impacts
September 2017
Environmental Health/Occupational Health/InjuryClimate and Health

Syndromic surveillance climate and health guidance document
Laurel Harduar Morano1, Meredith A. Jagger2, Erika C Barrett3a, Vjollca Berisha4a, Marija
Borjan5a, Kristen Heitzinger6a, Rasneet Kumar4a, Kathryn Lane7a, Margaret Lumia5a, Henri
Menager8a, Lauren Thie9a, CSTE Climate and Health Syndromic Surveillance Workgroup
1International Society of Disease Surveillance
2Public Health Division, Oregon Health Authority,
3College of Public Health, University of Arizona
4Office of Epidemiology and Data Services, Maricopa County Public Health
5Occupational Health Surveillance Unit, NJ Department of Health
6Division of Epidemiology and Health Planning, Kentucky Department for Public Health
7Bureau of Environmental Surveillance and Policy, New York City Department of Health and Mental Hygiene
8Environmental Public Health Tracking Program, Bureau of Epidemiology and Public Health Informatics, Kansas Department of Health and Environment
9Occupational and Environmental Epidemiology, NC Division of Public Health, NC Department of Health and Human Services
aThese authors contributed equally to this document
ii
Acknowledgements
This document was a result of work completed by the Council of State and Territorial
Epidemiologists (CSTE) Climate and Health Syndromic Surveillance Workgroup; part of the
CSTE Climate Change Subcommittee. This publication was supported in part by Cooperative
Agreement Number 5U38HM000414 from the CSTE.
The authors would like to thank the reviewers of this document:
Shandy Dearth International Society for Disease Surveillance
Eric Howard
OKC-County Health Department Amy Ising
Carolina Center for Health Informatics, Department of Emergency Medicine, University of North Carolina at Chapel Hill
Colleen Kaelin
Division of Public Health Protection and Safety, Kentucky Department for Public Health
Fatema Mamou
Surveillance and Infectious Disease Epidemiology Section, Bureau of Disease Control, Prevention, and Epidemiology, Michigan Department of Health and Human Services
Paul Schramm
National Center for Environmental Health Centers for Disease Control and Prevention
1
TABLE OF CONTENTS
I: Introduction ............................................................................................................................................... 2
How might syndromic surveillance data supplement traditional surveillance methods or systems? ..... 4
II: Identifying a weather- or climate-related outcome for surveillance ....................................................... 5
III: Developing a syndrome case definition ................................................................................................... 9
Keywords ................................................................................................................................................. 10
Diagnosis codes ....................................................................................................................................... 12
Other factors ........................................................................................................................................... 15
Validate and evaluate effectiveness of case definition .......................................................................... 17
Manual review .................................................................................................................................... 17
Identifying a gold standard and calculating performance measures ................................................. 18
Temporality comparison and weather assessment ............................................................................ 19
Using machine learning techniques to identify keywords ...................................................................... 19
Syndromic surveillance of work-related outcomes ................................................................................ 22
IV: Using environmental data with syndromic surveillance ....................................................................... 25
Externally-housed data ........................................................................................................................... 26
Integrating environmental data into syndromic surveillance systems ................................................... 26
The future of environmental data enhancing syndromic surveillance systems ..................................... 28
V: Interpreting and displaying the data ...................................................................................................... 28
VI: Identifying and engaging potential partners ......................................................................................... 31
Identifying and working with partners and stakeholders ....................................................................... 31
Presenting to partners and stakeholders................................................................................................ 32
VII: Strengths and limitations...................................................................................................................... 34
Strengths ................................................................................................................................................. 34
Limitations of using syndromic surveillance: in general and for climate-related exposures ................. 34
VIII: Conclusion ........................................................................................................................................... 35
References .................................................................................................................................................. 36

2
I: INTRODUCTION
A broad range of adverse health outcomes are associated with the changing climate [Moulton 2017;
Luber 2014]. Examples include but are not limited to: exacerbations of chronic conditions such as
cardiovascular or respiratory diseases, diseases and injuries associated with natural disasters, increased
presentation and differing distribution of vector-borne and zoonotic diseases, heat- or cold-related illness,
and mental health outcomes associated with displacement and interruption of care [Hess 2009, Schulte
2009; Crimmins 2016]. Adverse outcomes may also arise from climate change adaptation and mitigation
efforts, such as increased injuries to pedestrians and cyclists if non-motorized transport is promoted
without concurrent increases in infrastructure (e.g., bike lanes or sidewalks) [Pucher 2003; Pucher 2010;
Zegeer 2012].
Researchers and applied public health practitioners from many disciplines are working to minimize the
changing climate’s impact on population health and well-being. This includes but is not limited to:
identifying the current risks and vulnerabilities [Manangan 2014], modeling the future risks and
vulnerabilities [Kintziger 2017], and creating and implementing adaption and mitigation strategies
[Anderson 2017]. For public health practitioners, surveillance is a key activity used to protect and improve
the health of the populations they serve. Surveillance can be defined as “the continuous and systematic
collection, analysis, interpretation, and dissemination of data to be used for public health action (e.g.,
policy, planning evaluation)” [Pascal 2012; Porta 2008]. In general, data from public health surveillance
can be used for short- and long-term planning and response through retrospective data analysis of trends
over time or specific events [Hall 2012]. Combining health outcome data (e.g., hospitalizations or deaths)
with environmental and socio-demographic information also provides a more complete picture of most
vulnerable populations. However, a recent article noted that climate and health surveillance in the United
States (U.S.) was still in the embryonic phase [Moulton 2017]. Therefore, the goal of this document is
to encourage surveillance improvements by providing a general instruction on how a jurisdiction
may use their syndromic surveillance systems for climate and health surveillance.
Climate is the long-term variation in weather patterns, typically over decades [Walsh 2014]. However, for
the purpose of public health surveillance, the word climate used in the phrase climate and health
encompasses both short-term meteorological events (weather-related), such as a flood or a winter storm,
and long-term meteorological influences (climate-related), such as droughts and increased wildfire activity
due to decades of warmer temperatures [Joyce 2014]. As part of the response to climate-related impacts,
data from public health surveillance systems are already being used, in some jurisdictions, as the basis
for modeling future disease burden and implementing climate change adaptation work [English 2009;
Hess 2015].
Syndromic surveillance systems can be a valuable tool for climate and health surveillance. As opposed to
traditional surveillance data sources (e.g., hospital discharge data or death certificates) which may have

3
long lags before the data become available, syndromic surveillance systems use (near) real-time health-
related data for the early identification of disease outbreaks, disease trend monitoring and the tracking of
adverse health outcomes related to an event [ISDS 2012]. This approach allows for rapid response by
public health professionals including situational awareness, which may inform an ongoing response, help
to activate a response, or potentially determine how response resources are distributed [ISDS 2012]. For
instance, in the aftermath of Hurricane Irene (2011), the North Carolina Public Health Department used
their syndromic surveillance system to identify an increase in heat-related illness associated with power
outages [Personal Communication: Lauren Thie L, NC Department of Public Health, May 2017].
Vulnerable populations in specific counties were identified, and information was shared with internal
groups: public health preparedness, emergency management, communicable disease, and environmental
health. Syndromic surveillance may also provide some assurance of the absence of health impacts in
some situations. The potentially unique data sources and data elements collected by syndromic
surveillance systems may also be used for evaluating disease (or adverse health outcomes) over time or
in relation to an exposure(s).
There are several types of syndromic surveillance systems used by jurisdictions in the U.S.: Electronic
Surveillance System for the Early Notification of Community-Based Epidemics (ESSENCE) within the
National Syndromic Surveillance Program (NSSP)1, local installations of ESSENCE, commercial
syndromic surveillance systems such as EpiCenter, and in-house (e.g., created by the jurisdiction)
syndromic surveillance systems [CDC 2017]. The majority of syndromic surveillance systems collect data
from emergency departments (EDs), which is the focus of this document. Depending on the jurisdiction,
syndromic surveillance systems may also include: ambulance or emergency transport dispatches, calls to
poison centers, urgent care or ambulatory care center visits, in-patient hospitalizations, or school
absenteeism.
In order to provide near real-time information, EDs typically provide preclinical information to the system.
The preclinical information may include chief complaints, an admission diagnosis code, and, depending
on the system and facility, triage notes and patient vitals (e.g., temperature or blood pressure) [CDC
2015]. Preclinical information is collected prior to physician evaluation and a diagnosis determination;
whereas the data from traditional surveillance sources are provided after the clinical evaluation and/or lab
testing, resulting in a more accurate diagnosis.
Case definitions can be designed using keywords (and/or diagnosis codes) to identify patients (e.g., from
ED visits) with outcome symptoms that reflect the distribution of the confirmed designated health
outcome. EDs may update individual visit data, providing discharge (i.e., post-visit) diagnosis codes (i.e.,
diagnosis or external cause codes). Analysis of discharge diagnostic codes in combination with preclinical
1 The NSSP BioSense platform hosts ESSENCE along with a number of other software tools https://www.cdc.gov/nssp/biosense/index.html.

4
free-text data may also provide useful information such as the situation at the time of injury or disease
onset. For instance, a patient with a diagnosis of carbon monoxide poisoning may indicate to the intake
nurse that the exposure was related to a generator or related to exhaust fumes from a car. Additionally,
analysis of both diagnosis codes and free-text information may provide a case definition validation, of
sorts, via concordance of symptoms with diagnoses.
Using syndromic surveillance systems for climate and health surveillance offers the unique opportunity to
help quantify and track in near-real time the burden of disease from climate and weather impacts. Once
the disease burden for a climate-related health outcome is described, other climate and health public
health initiatives can begin. Syndromic surveillance system administrators and epidemiologists may work
together to develop syndromes for climate and health conditions, such as impacts from heat, cold, fire, or
extreme weather events. This guidance document will provide instruction in five areas: (1)
identifying a weather- or climate-related surveillance outcome, (2) developing a syndrome case
definition, (3) combining, externally and internally, syndromic surveillance data with
environmental data, (4) interpretation and display of data, and (5) engaging with partners. The final
section of the document will discuss the strengths and limitations of adding data from a
syndromic surveillance system to climate and health surveillance.
The climate and health surveillance workgroup hopes that this document may serve as a guide for public
health professionals to understand and implement climate and health syndromic surveillance in their
jurisdiction. All unreferenced state-specific examples presented in the document were provided by
workgroup members.
HOW MIGHT SYNDROMIC SURVEILLANCE DATA SUPPLEMENT TRADITIONAL
SURVEILLANCE METHODS OR SYSTEMS?
Syndromic surveillance data may be used for near real-time detection and monitoring of disease
outbreaks and public health emergencies, monitoring of disease trends, case finding, seasonal event
response, program management, and development of summary reports. Syndromic surveillance can
enhance current surveillance by providing, in some cases, the most up-to-date information on the health
impact of an event, and it can contribute to an appropriate and timely public health response. An
additional notable characteristic of syndromic surveillance systems is the ability to monitor both
communicable and non-communicable health outcomes that, depending on the system, may be entirely
user-defined. In addition to health outcomes it may be possible to identify vulnerable populations, such as
individuals with a specific occupation or who are homeless. Depending on the outcome, the potential
flexibility in defining a syndromic surveillance outcome(s) may provide a more complete picture (e.g.,
situation) of the health impact of an event than traditional surveillance alone. It may additionally enhance
traditional disease surveillance efforts if reportable diseases detected exclusively through syndromic

5
surveillance queries are used by public health authorities as opportunities to educate healthcare providers
regarding reporting requirements [O'Connell 2010].
II: IDENTIFYING A WEATHER- OR CLIMATE-RELATED OUTCOME FOR
SURVEILLANCE
Climate change represents a significant threat to the health and wellbeing of individuals and, as the
climate continues to change, the risk to human and animal health continues to grow [Frumkin 2008].
Rising greenhouse gas concentrations result in increases in temperature, changes in precipitation,
increases in the frequency and intensity of some extreme weather events, and rising sea levels [Hess
2012]. Impacts of these factors endanger both human and animal health by affecting food and water
sources, the air, weather experiences, and interactions with the built and natural environments [Hess
2012]. In the context of climate change, it is important to identify outcomes related to the adverse event or
exposure. The following list includes general items to consider when developing an outcome for
surveillance:
1. Identify/consider adverse outcomes directly related to current/forecasted weather patterns
2. Identify/consider adverse outcomes related to environmental exposures whose occurrence may
change (e.g., increase) or shift geographically due to climate change
3. Note how, when, and where health impacts will vary by regions (or smaller geographies) and
populations due to a susceptibility (e.g., vulnerable sub-populations or location in a flood plain),
adaptability (e.g., availability of resources) and ability to respond to adverse events and
exposures
4. Understand and account for potentially multiple adverse outcomes associated with a single
event/exposure
Climate factors can affect health outcomes in various ways. Some effects are relatively direct such as
extreme weather-related injury, illness, or death. Other effects have more complex pathways where the
climate factor leads to an environmental change resulting in human health effects and disease [NIEHS
2016]. For example, higher temperatures and low precipitation can increase the number and severity of
wildfires, which in turn can reduce air quality by releasing harmful emissions such as carbon monoxide
and particulate matter. Higher summer temperatures are also associated with higher levels of ozone. The
poor air quality leads to an increase in respiratory and cardiovascular illness such as asthma, bronchitis,
chest pain and other ailments [Crimmins 2016]. Therefore, when deciding on an outcome for surveillance,
it is important to think about how current or forecasted weather patterns may directly result in adverse
health outcomes. It is also important to consider the adverse health outcomes related to other types of
environmental exposures, such as wildfires or air pollution, that are impacted by changing climate
patterns. Table 1 below includes various examples of how climate factors can affect human health.

6
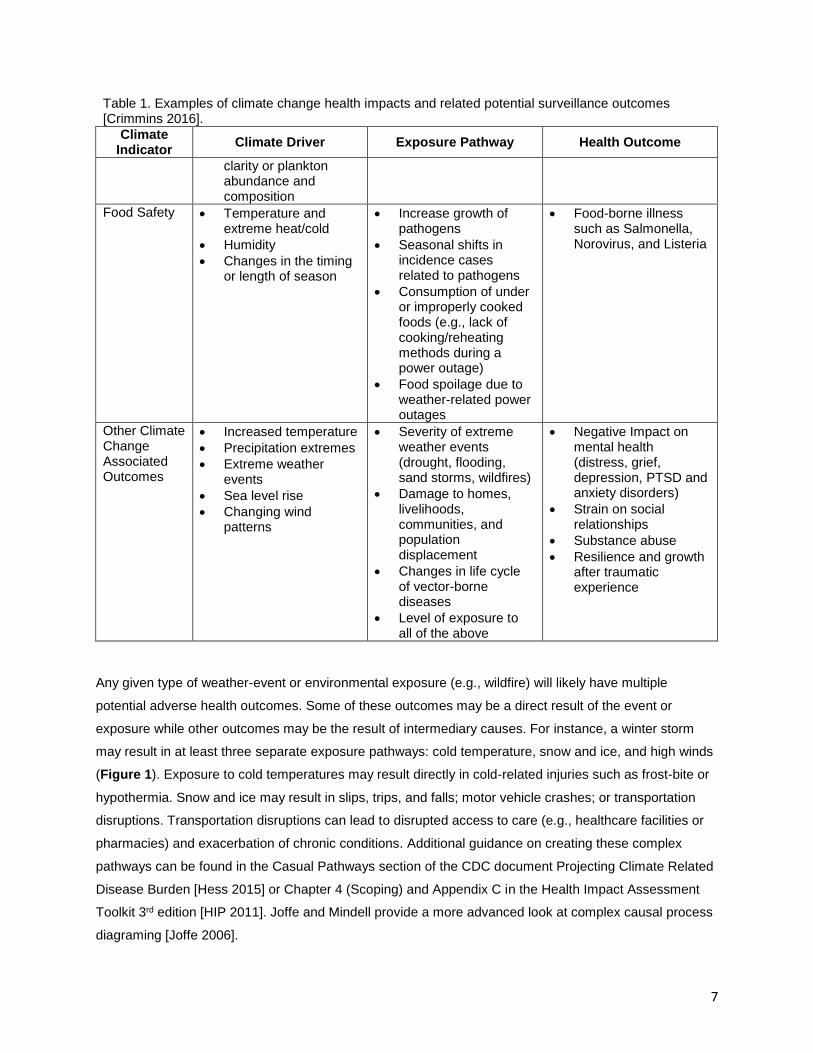
Table 1. Examples of climate change health impacts and related potential surveillance outcomes [Crimmins 2016].
Climate Indicator
Climate Driver Exposure Pathway Health Outcome
Extreme Heat • More frequent elevated temperatures
• Prolonged and more severe heat waves
• Changes in timing and length or warm/cold seasons
• Exposure to elevated temperatures (daily, maximum, minimum and mean)
• Exposure to elevated nightly temperatures
• Combined impact of temperature, humidity, wind and sunlight
• Heat-related deaths, illness, hospital and emergency department visits
Air Quality • Increasing atmospheric carbon dioxide
• Increasing temperatures in many locations
• Changes in precipitation patterns
• Extreme weather events
• Changes in cloudiness, humidity and wind speed
• Poor outdoor air quality due to high levels of ozone, particulate matter and carbon dioxide (CO2)
• Higher pollen counts with increased allergenicity, geographic range, a longer pollen season
• Premature death
• Hospital ER visits for acute respiratory symptoms
• Allergic sensitivity or disease
• Lung cancer, chronic obstructive pulmonary disease (COPD), and cardiovascular disease associated with (particulate matter 2.5 micrometers (PM2.5)
exposure
• Lost school or work days
Flooding • More frequent and intense precipitation
• More intense hurricane rainfall
• Sea level rise-related increases in storm surge events
• Flood waters and debris
• Loss of essential infrastructure
• Contaminated drinking water
• Evacuation and population displacement
• Drowning
• Injuries
• Mental health consequences
• Gastrointestinal and other Illness
Vector-borne Diseases
• High and low temperature extremes
• Changing precipitation patterns
• Changes in season weather patterns
• Earlier and geographically expanded or shifted vector activity
• Vector-borne diseases such as, Lyme disease, Zika, Dengue and West Nile
Water-related Diseases
• Increasing sea surface temperature
• Changes in precipitation, freshwater runoff, drought, sea-level rise, coastal flooding and storm surge, with resulting changes to coastal salinity, water
• Recreational exposure to seawater during swimming
• Ingestion of raw or undercooked shellfish
• Diarrhea and intestinal illness
• Wound infections
• Eye and ear infections
• Bloodstream infections
• Death
7
Table 1. Examples of climate change health impacts and related potential surveillance outcomes [Crimmins 2016].
Climate Indicator
Climate Driver Exposure Pathway Health Outcome
clarity or plankton abundance and composition
Food Safety • Temperature and extreme heat/cold
• Humidity
• Changes in the timing or length of season
• Increase growth of pathogens
• Seasonal shifts in incidence cases related to pathogens
• Consumption of under or improperly cooked foods (e.g., lack of cooking/reheating methods during a power outage)
• Food spoilage due to weather-related power outages
• Food-borne illness such as Salmonella, Norovirus, and Listeria
Other Climate Change Associated Outcomes
• Increased temperature
• Precipitation extremes
• Extreme weather events
• Sea level rise
• Changing wind patterns
• Severity of extreme weather events (drought, flooding, sand storms, wildfires)
• Damage to homes, livelihoods, communities, and population displacement
• Changes in life cycle of vector-borne diseases
• Level of exposure to all of the above
• Negative Impact on mental health (distress, grief, depression, PTSD and anxiety disorders)
• Strain on social relationships
• Substance abuse
• Resilience and growth after traumatic experience
Any given type of weather-event or environmental exposure (e.g., wildfire) will likely have multiple
potential adverse health outcomes. Some of these outcomes may be a direct result of the event or
exposure while other outcomes may be the result of intermediary causes. For instance, a winter storm
may result in at least three separate exposure pathways: cold temperature, snow and ice, and high winds
(Figure 1). Exposure to cold temperatures may result directly in cold-related injuries such as frost-bite or
hypothermia. Snow and ice may result in slips, trips, and falls; motor vehicle crashes; or transportation
disruptions. Transportation disruptions can lead to disrupted access to care (e.g., healthcare facilities or
pharmacies) and exacerbation of chronic conditions. Additional guidance on creating these complex
pathways can be found in the Casual Pathways section of the CDC document Projecting Climate Related
Disease Burden [Hess 2015] or Chapter 4 (Scoping) and Appendix C in the Health Impact Assessment
Toolkit 3rd edition [HIP 2011]. Joffe and Mindell provide a more advanced look at complex causal process
diagraming [Joffe 2006].

8
Figure 1. Potential direct and indirect effects of a winter storm. Example surveillance outcomes are highlighted in grey. Abbreviations: MVCs = motor vehicle crashes, ED = emergency department, CO = Carbon monoxide, CVD = cardiovascular disease
When deciding on health outcomes for surveillance, it is important to note that different regions and
different populations in the country (or jurisdiction) will likely experience health impacts from climate
change differently. In addition, some populations will be more vulnerable than others. Social determinants
of health such as poverty, education, the use of non-English language, and other factors increase
vulnerability to weather- or climate-related health outcomes [Manangan 2014]. Jurisdictions can use
existing expertise and knowledge to choose the health outcome(s) with the largest projected impact and
can potentially focus on vulnerable sub-populations. This may entail talking with or reviewing the work of
other jurisdictions to inform which surveillance outcomes should be considered. It may be especially
helpful to look at similar jurisdictions in a region as different climate factors affect different regions in the
U.S. A summary of regional differences, including examples, can be found in the Regions section
(chapters 16-25) of the 2014 National Climate Assessment located at:
http://nca2014.globalchange.gov/report [Melillo 2014].
It is also possible that a surveillance outcome may be identified by information from another data source.
For example, in 2006, the Maricopa County Department of Public Health (Arizona) observed an increase
in heat-related deaths which initiated communication with the Office of Medical Examiner, resulting in
development of ongoing heat-associated mortality surveillance [MC DPH 2016]. Maricopa County is
currently using their heat-related surveillance model to initiate surveillance for other climate outcomes in
order to monitor health outcomes related to dust storms, allergen levels, and wildfires.
9
Finally, when considering which surveillance outcomes to utilize, it is useful to assess the priorities and
available resources of your jurisdiction. It is up to each jurisdiction to determine where the resources are
best spent and to understand the jurisdiction’s capacity to implement any program. How will the
syndromic surveillance data be used? What types of solutions and interventions can be implemented
based on the near real-time results? Can the syndromic surveillance data be used to contribute evidence
to implement or direct the implementation of a solution to the outcome?
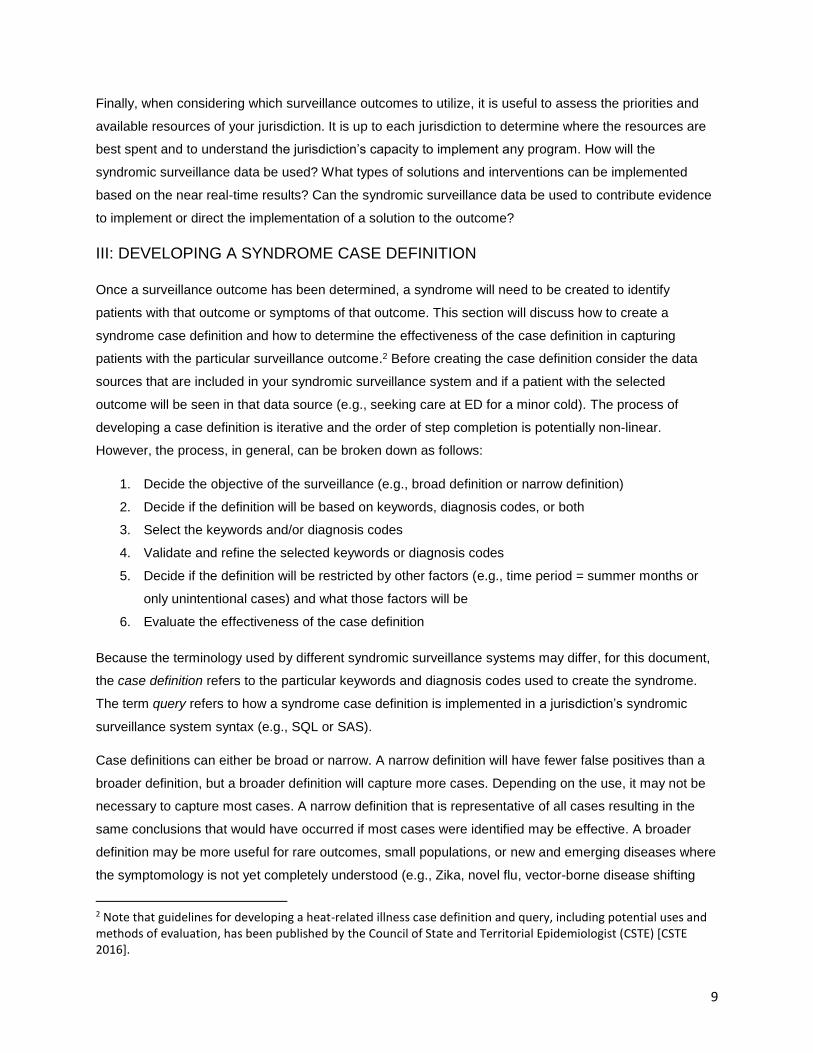
III: DEVELOPING A SYNDROME CASE DEFINITION
Once a surveillance outcome has been determined, a syndrome will need to be created to identify
patients with that outcome or symptoms of that outcome. This section will discuss how to create a
syndrome case definition and how to determine the effectiveness of the case definition in capturing
patients with the particular surveillance outcome.2 Before creating the case definition consider the data
sources that are included in your syndromic surveillance system and if a patient with the selected
outcome will be seen in that data source (e.g., seeking care at ED for a minor cold). The process of
developing a case definition is iterative and the order of step completion is potentially non-linear.
However, the process, in general, can be broken down as follows:
1. Decide the objective of the surveillance (e.g., broad definition or narrow definition)
2. Decide if the definition will be based on keywords, diagnosis codes, or both
3. Select the keywords and/or diagnosis codes
4. Validate and refine the selected keywords or diagnosis codes
5. Decide if the definition will be restricted by other factors (e.g., time period = summer months or
only unintentional cases) and what those factors will be
6. Evaluate the effectiveness of the case definition
Because the terminology used by different syndromic surveillance systems may differ, for this document,
the case definition refers to the particular keywords and diagnosis codes used to create the syndrome.
The term query refers to how a syndrome case definition is implemented in a jurisdiction’s syndromic
surveillance system syntax (e.g., SQL or SAS).
Case definitions can either be broad or narrow. A narrow definition will have fewer false positives than a
broader definition, but a broader definition will capture more cases. Depending on the use, it may not be
necessary to capture most cases. A narrow definition that is representative of all cases resulting in the
same conclusions that would have occurred if most cases were identified may be effective. A broader
definition may be more useful for rare outcomes, small populations, or new and emerging diseases where
the symptomology is not yet completely understood (e.g., Zika, novel flu, vector-borne disease shifting
2 Note that guidelines for developing a heat-related illness case definition and query, including potential uses and methods of evaluation, has been published by the Council of State and Territorial Epidemiologist (CSTE) [CSTE 2016].
10
regions). When developing a case definition, it can be helpful to start with a broad definition, capturing as
many probable cases as possible and then refine the definition to increase the specificity (i.e., proportion
of cases without the outcome are not captured by the definition).
After the syndrome case definition has been finalized, alert thresholds will need to be determined. These
thresholds may be based on the statistical algorithms used by your jurisdiction’s syndromic surveillance
system3 to identify higher than expected
number of syndrome cases (i.e.,
surveillance signals). Alternatively, it may
be decided that all identified syndrome
cases should be reviewed. The frequency
of review will depend on the purpose of
the surveillance.
KEYWORDS
Keywords are identified from preclinical
administrative notes (e.g., chief
complaints or triage notes) which are
usually free text fields. However, some
facilities use pre-defined chief complaint
pick-lists (e.g., drop down menus). These
administrative notes are typically
recorded at time of the intake/admission
and are based on the patient’s complaint
or the nurse’s initial assessment of that
patient at triage. These notes are
available in near real-time – dependent
on when the system is updated (e.g.,
hourly, every 12 hours, every 24 hours).
For each record in the syndromic
surveillance system, specific inclusion
and exclusion keywords located in the
administrative notes are used to identify
cases with symptoms of a particular
outcome or exposure. The inclusion
keywords are used to identify potential
3 Contact your syndromic surveillance coordinator to discuss the algorithms currently being used in the system.
Insert 1: Hypothetical case definition development
Scenario 1: Health Department X (HDX) is preparing for a
hurricane. As part of the emergency planning and
response, a carbon monoxide case definition is developed.
The exposure of interest is carbon monoxide poisoning due
to generator misuse. HDX plans to update their emergency
operations center (EOC) daily. The case definition query
will be run every day till the EOC stands down or all power
is restored. Based on prior information from the death
certificate and hospital discharge records, HDX believes
there is a low prevalence of carbon monoxide cases in their
state. They decide to develop a broad definition based on
chief complaint keywords that will capture as many cases
as possible. After a conversation with a neighboring state,
HDX decides to use a similar case definition. During the
response, HDX plans to manually review the chief
complaints from identified case.
Scenario 2: Health Department Z (HDZ) has decided to use
their syndromic surveillance system for surveillance of heat-
related illness due to outdoor ambient temperature. After
reviewing the literature, HDZ understands that high outdoor
ambient temperature may result in many different health
outcomes such as cardiovascular or respiratory disease.
HDZ decides to use the specific outcome of heat-related
illness. They decide to use both keywords and diagnosis
codes. HDZ starts out by using the CSTE heat query in
ESSENCE. However, to make sure they haven’t missed
any keywords, HDZ extracts all records for the prior year
with a diagnosis code of heat-related illness. They then
examine the chief complaints and triage notes for any
additional inclusion/exclusion keywords. After a final
keyword definition was created, HDZ used the discharge
diagnosis to calculate the sensitivity and positive predictive
value. They also compared daily counts identified by the
heat-related illness diagnosis and keyword case definition
with daily counts of heat-related hospitalizations to
determine if temporal pattern was similar.

11
cases. The exclusion keywords are used to remove cases that have an inclusion keyword but do not have
the outcome symptoms. For instance, if the goal is to identify cases of carbon monoxide poisoning due to
generators, then an exclusion keyword may be “fire.” Cases with carbon monoxide poisoning due to
smoke inhalation would then be removed. Dependent on the jurisdiction, keywords may be in languages
other than English (e.g., Demasiado caliente [English translation: too hot]) or may be abbreviations (e.g.,
OTJ = on the job). The process of identifying syndrome keywords is iterative and may include a
combination of the methods discussed below. These methods were identified by the workgroup as
common ways of identifying syndrome keywords. The use of the method(s) will depend on the resources
available to the public health practitioner. Note that none of the methods are exact and there is a
component of personal decision making.
Identify keywords based on keywords used in another jurisdiction’s syndromic surveillance system: This
can be as simple as contacting a colleague from another jurisdiction and requesting their case definition.
Depending on the syndrome, there may be guidance documents available with a summary of keywords.
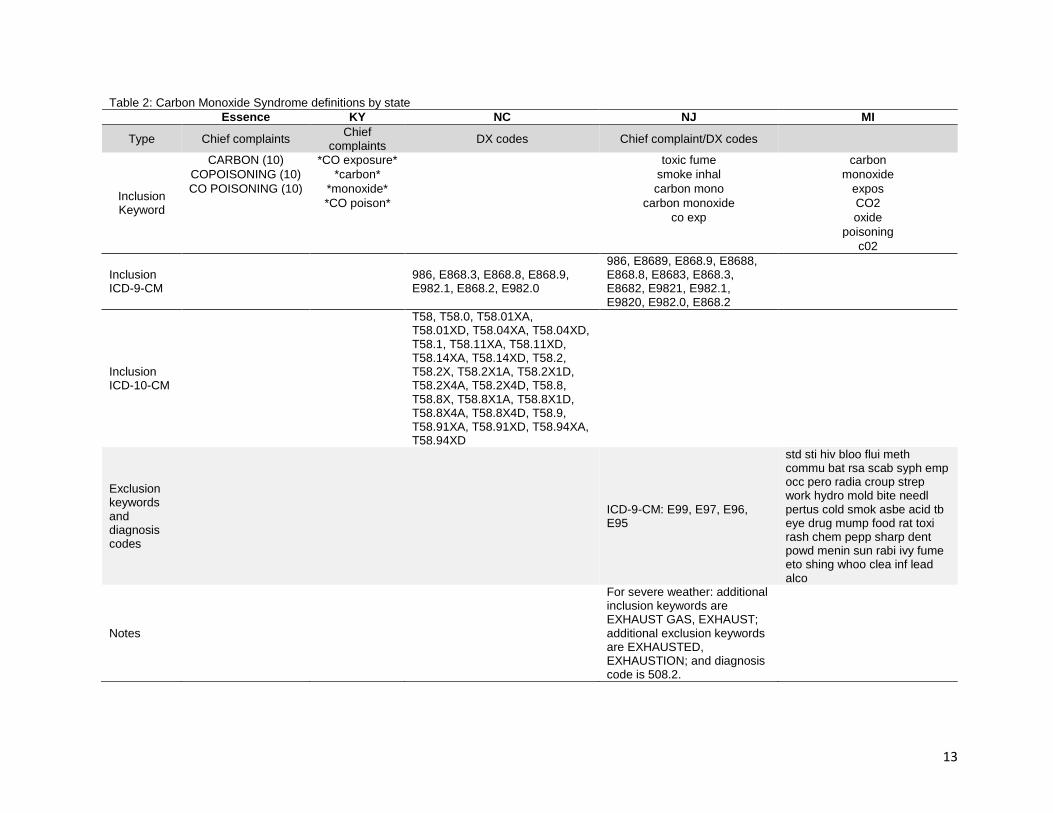
For instance, Table 2 contains the carbon monoxide keyword definitions from multiple states. Heat-
related illness syndrome keywords were published in a Council of State and Territorial Epidemiologist
(CSTE) guidance document for heat-related syndromic surveillance [CSTE 2016]. A literature search may
also provide articles with keywords used in prior studies.
Identify keywords based on diagnosis codes: This method requires your syndromic surveillance system to
receive diagnosis codes. The system may contain one diagnosis text field with multiple diagnosis codes
or multiple numeric diagnosis fields with a single diagnosis code per field. This method works well for
outcomes with a clear diagnosis code. For instance, the diagnosis code for the toxic effects of carbon
monoxide is ICD-10-CM T58 or ICD-9-CM 986. All records with the desired diagnosis codes (e.g., ICD-
10-CM T58) are extracted into a dataset. The corresponding chief complaints and, if available, triage
notes are read to identify keywords. This process can be done manually by reading each record and
visually identifying the most common outcome-specific words. Or the data can be placed into a text
mining program to identify common outcome-specific words. The threshold for a “common” word will be
determined by the public health practitioner and the frequency of words (or phrases) within the data.
Identify keywords based on an event: This approach is retrospective. After a particular event has
occurred, like a flood or a hurricane, all records during the event time period and the affected geographic
area can be extracted into a dataset. Similar to the prior method, the chief complaints and triage notes
are reviewed to identify the most common keywords.
Identify keywords by speaking with partners: Keywords may be identified by discussing syndrome case
definition creation with knowledgeable partners, especially experts on the health outcome and community
members and medical professionals who are familiar with the populations who most often develop these
outcomes. Community members and stakeholders may be able to provide more detailed and granular
information for defining keywords as well as timeliness of when to use the keywords (see Other Factors,
12
page 15), whereas experts on the outcome may help more with common diagnosis codes and where to
look for important information within available data elements.
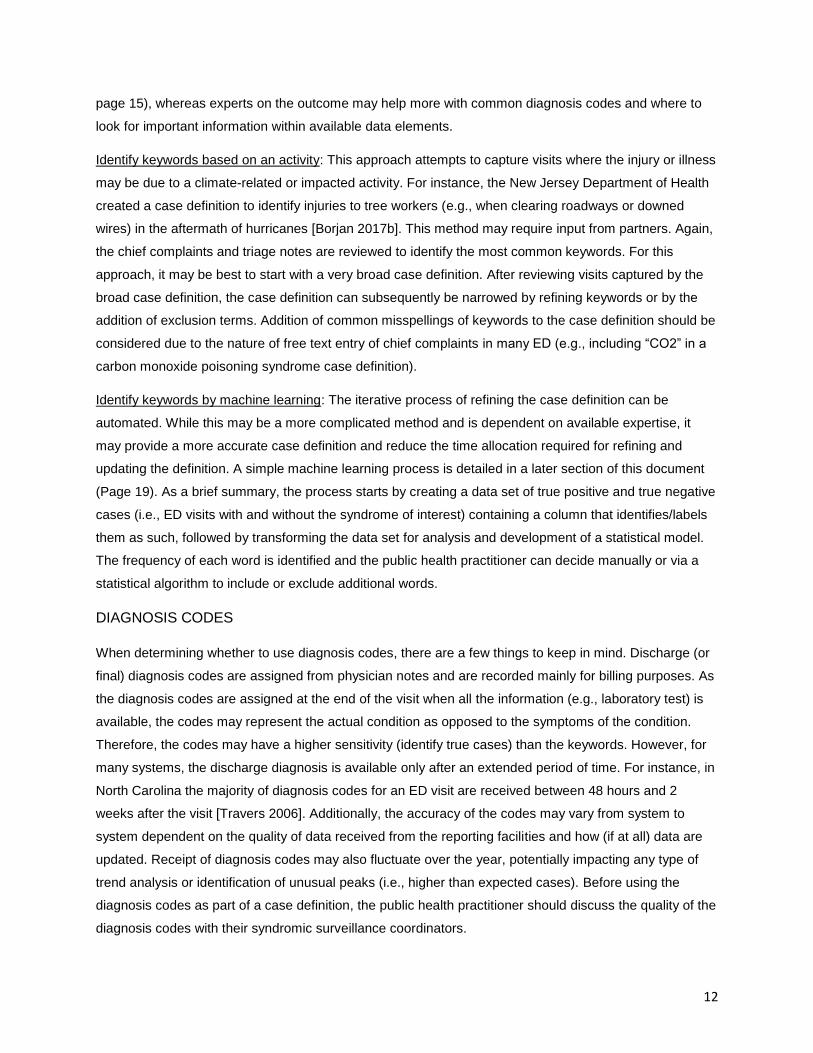
Identify keywords based on an activity: This approach attempts to capture visits where the injury or illness
may be due to a climate-related or impacted activity. For instance, the New Jersey Department of Health
created a case definition to identify injuries to tree workers (e.g., when clearing roadways or downed
wires) in the aftermath of hurricanes [Borjan 2017b]. This method may require input from partners. Again,
the chief complaints and triage notes are reviewed to identify the most common keywords. For this
approach, it may be best to start with a very broad case definition. After reviewing visits captured by the
broad case definition, the case definition can subsequently be narrowed by refining keywords or by the
addition of exclusion terms. Addition of common misspellings of keywords to the case definition should be
considered due to the nature of free text entry of chief complaints in many ED (e.g., including “CO2” in a
carbon monoxide poisoning syndrome case definition).
Identify keywords by machine learning: The iterative process of refining the case definition can be
automated. While this may be a more complicated method and is dependent on available expertise, it
may provide a more accurate case definition and reduce the time allocation required for refining and
updating the definition. A simple machine learning process is detailed in a later section of this document
(Page 19). As a brief summary, the process starts by creating a data set of true positive and true negative
cases (i.e., ED visits with and without the syndrome of interest) containing a column that identifies/labels
them as such, followed by transforming the data set for analysis and development of a statistical model.
The frequency of each word is identified and the public health practitioner can decide manually or via a
statistical algorithm to include or exclude additional words.
DIAGNOSIS CODES
When determining whether to use diagnosis codes, there are a few things to keep in mind. Discharge (or
final) diagnosis codes are assigned from physician notes and are recorded mainly for billing purposes. As
the diagnosis codes are assigned at the end of the visit when all the information (e.g., laboratory test) is
available, the codes may represent the actual condition as opposed to the symptoms of the condition.
Therefore, the codes may have a higher sensitivity (identify true cases) than the keywords. However, for
many systems, the discharge diagnosis is available only after an extended period of time. For instance, in
North Carolina the majority of diagnosis codes for an ED visit are received between 48 hours and 2
weeks after the visit [Travers 2006]. Additionally, the accuracy of the codes may vary from system to
system dependent on the quality of data received from the reporting facilities and how (if at all) data are
updated. Receipt of diagnosis codes may also fluctuate over the year, potentially impacting any type of
trend analysis or identification of unusual peaks (i.e., higher than expected cases). Before using the
diagnosis codes as part of a case definition, the public health practitioner should discuss the quality of the
diagnosis codes with their syndromic surveillance coordinators.
13
Table 2: Carbon Monoxide Syndrome definitions by state
Essence KY NC NJ MI
Type Chief complaints Chief
complaints DX codes Chief complaint/DX codes
Inclusion Keyword
CARBON (10) *CO exposure* toxic fume carbon
COPOISONING (10) *carbon* smoke inhal monoxide
CO POISONING (10) *monoxide* carbon mono expos *CO poison* carbon monoxide CO2 co exp oxide poisoning c02
Inclusion ICD-9-CM
986, E868.3, E868.8, E868.9, E982.1, E868.2, E982.0
986, E8689, E868.9, E8688, E868.8, E8683, E868.3, E8682, E9821, E982.1, E9820, E982.0, E868.2
Inclusion ICD-10-CM
T58, T58.0, T58.01XA, T58.01XD, T58.04XA, T58.04XD, T58.1, T58.11XA, T58.11XD, T58.14XA, T58.14XD, T58.2, T58.2X, T58.2X1A, T58.2X1D, T58.2X4A, T58.2X4D, T58.8, T58.8X, T58.8X1A, T58.8X1D, T58.8X4A, T58.8X4D, T58.9, T58.91XA, T58.91XD, T58.94XA, T58.94XD
Exclusion keywords and diagnosis codes
ICD-9-CM: E99, E97, E96, E95
std sti hiv bloo flui meth commu bat rsa scab syph emp occ pero radia croup strep work hydro mold bite needl pertus cold smok asbe acid tb eye drug mump food rat toxi rash chem pepp sharp dent powd menin sun rabi ivy fume eto shing whoo clea inf lead alco
Notes
For severe weather: additional inclusion keywords are EXHAUST GAS, EXHAUST; additional exclusion keywords are EXHAUSTED, EXHAUSTION; and diagnosis code is 508.2.
14
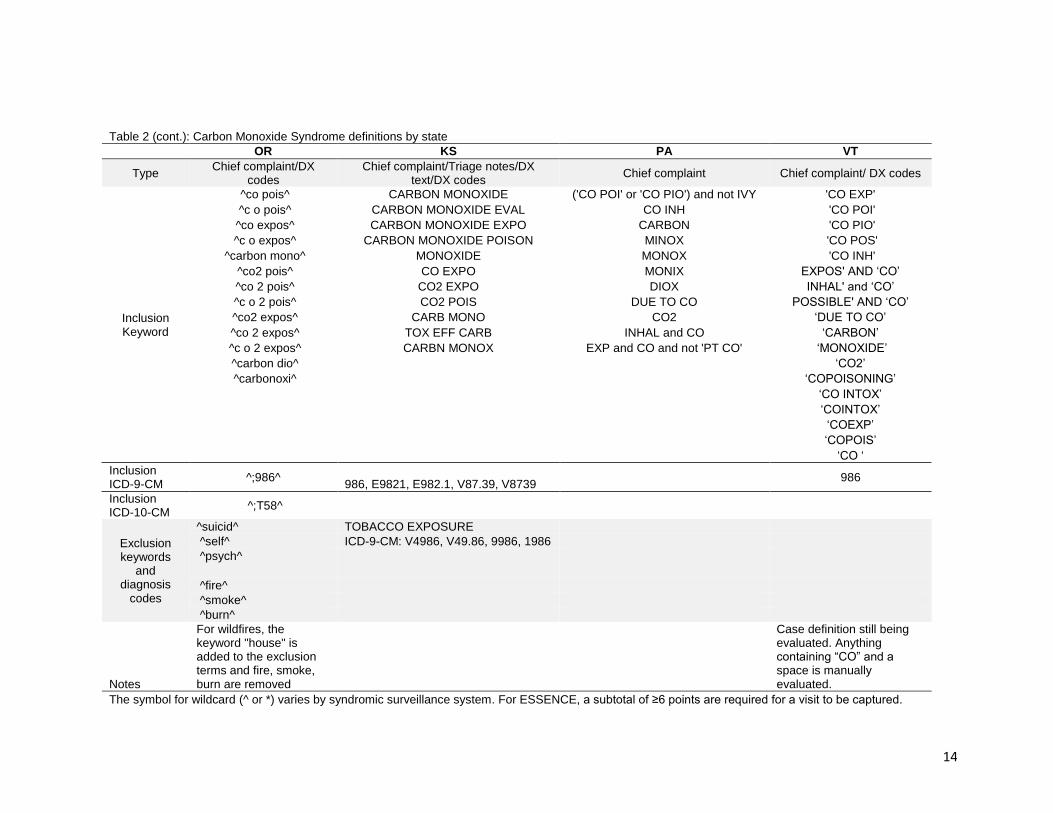
Table 2 (cont.): Carbon Monoxide Syndrome definitions by state
OR KS PA VT
Type Chief complaint/DX
codes Chief complaint/Triage notes/DX
text/DX codes Chief complaint Chief complaint/ DX codes
Inclusion Keyword
^co pois^ CARBON MONOXIDE ('CO POI' or 'CO PIO') and not IVY 'CO EXP'
^c o pois^ CARBON MONOXIDE EVAL CO INH 'CO POI'
^co expos^ CARBON MONOXIDE EXPO CARBON 'CO PIO'
^c o expos^ CARBON MONOXIDE POISON MINOX 'CO POS'
^carbon mono^ MONOXIDE MONOX 'CO INH'
^co2 pois^ CO EXPO MONIX EXPOS' AND ‘CO’
^co 2 pois^ CO2 EXPO DIOX INHAL' and ‘CO’
^c o 2 pois^ CO2 POIS DUE TO CO POSSIBLE' AND ‘CO’
^co2 expos^ CARB MONO CO2 ‘DUE TO CO’
^co 2 expos^ TOX EFF CARB INHAL and CO ‘CARBON’
^c o 2 expos^ CARBN MONOX EXP and CO and not 'PT CO' ‘MONOXIDE’
^carbon dio^ ‘CO2’
^carbonoxi^ ‘COPOISONING’ ‘CO INTOX’ ‘COINTOX’ ‘COEXP’ ‘COPOIS’ ‘CO ‘
Inclusion ICD-9-CM
^;986^ 986, E9821, E982.1, V87.39, V8739
986
Inclusion ICD-10-CM
^;T58^
Exclusion keywords
and diagnosis
codes
^suicid^ TOBACCO EXPOSURE
^self^ ICD-9-CM: V4986, V49.86, 9986, 1986
^psych^
^fire^
^smoke^
^burn^
Notes
For wildfires, the keyword "house" is added to the exclusion terms and fire, smoke, burn are removed
Case definition still being evaluated. Anything containing “CO” and a space is manually evaluated.
The symbol for wildcard (^ or *) varies by syndromic surveillance system. For ESSENCE, a subtotal of ≥6 points are required for a visit to be captured.

15
Diagnosis codes may also be found in the administrative notes. Codes found in the administrative notes
are assigned at time of intake/admission. As a result, diagnosis codes may also be treated as keywords.
For instance, as part of Kansas’ carbon monoxide case definition, ICD-9-CM code ‘986’ (toxic effect of
carbon monoxide) is searched for as an inclusion keyword in the admission notes while the ICD-9-CM
codes ‘9986’ (Persistent postoperative fistula) and ‘1986’ (Secondary malignant neoplasm of other
specified sites: Ovary) are treated as exclusion keywords.
Identify diagnosis codes based on previously published documents or another jurisdiction’s case
definition: Diagnosis codes are used for medical billing purposes and therefore are available in
administrative datasets (e.g., hospital discharge data, ED visit data, Medicare/Medicaid data). As a result,
diagnosis codes are used in many retrospective analyses and are the basis of numerous surveillance
health indicators. Climate-related health surveillance indicators have been created by the Environmental
Public Health Tracking Program (https://ephtracking.cdc.gov/searchMetadata) and CSTE
(http://www.cste.org/group/indicators) to name a couple of examples. A simple literature search may
identify peer-reviewed publications which could provide diagnosis codes for the chosen surveillance
outcome (example reference = [Tsai 2016]). Additionally, as with keywords, requesting the case definition
from another jurisdiction is also an option.
Identify diagnosis codes by searching the code manual: The ICD-10-CM (or ICD-9-CM) description for
each code may be searched for the chosen outcome (e.g., carbon monoxide or Lyme disease). The code
list and descriptions are provided by the Center for Disease Control (CDC) National Center for Health
Statistics (ICD-10-CM: https://www.cdc.gov/nchs/icd/icd10cm.htm; ICD-9-CM:
https://www.cdc.gov/nchs/icd/icd9cm.htm). Published code manuals may also contain an index with a list
of diseases/outcomes and their corresponding codes [“ICD-10-CM” 2013]. However, when using this
method, it is important to read the entire code description and make sure the code will identify cases with
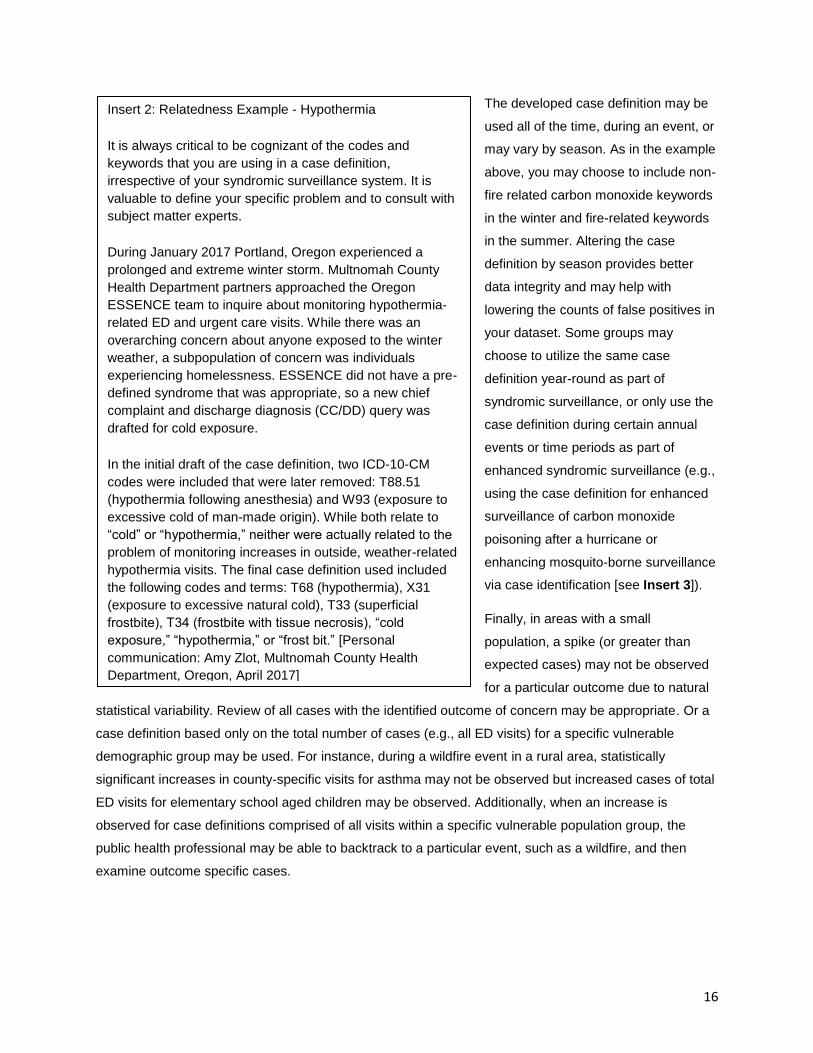
the particular outcome of interested (e.g., hyperthermia due to outdoor ambient temperatures [see Insert
2])
OTHER FACTORS
The selected outcome may encompass multiple etiologies and may require additional restrictions to the
case definition. For instance, during the winter, cold-related surveillance may include unintentional, non-
fire related carbon monoxide poisoning, while in the summer unintentional fire-related carbon monoxide
poisoning may be part of wildfire surveillance. Depending on the restriction, inclusion or exclusion criteria
may be created using either diagnosis codes, keywords, or both (Table 2). For instance, the public health
practitioner may want to exclude all cases of carbon monoxide poisoning with a suicide or homicide
diagnosis. Or the public health practitioner may want to include all cases of carbon monoxide poisoning
with an unintentional or undetermined intent diagnosis. In the latter situation, cases without an intent
diagnosis code would not be captured.
16
The developed case definition may be
used all of the time, during an event, or
may vary by season. As in the example
above, you may choose to include non-
fire related carbon monoxide keywords
in the winter and fire-related keywords
in the summer. Altering the case
definition by season provides better
data integrity and may help with
lowering the counts of false positives in
your dataset. Some groups may
choose to utilize the same case
definition year-round as part of
syndromic surveillance, or only use the
case definition during certain annual
events or time periods as part of
enhanced syndromic surveillance (e.g.,
using the case definition for enhanced
surveillance of carbon monoxide
poisoning after a hurricane or
enhancing mosquito-borne surveillance
via case identification [see Insert 3]).
Finally, in areas with a small
population, a spike (or greater than
expected cases) may not be observed
for a particular outcome due to natural
statistical variability. Review of all cases with the identified outcome of concern may be appropriate. Or a
case definition based only on the total number of cases (e.g., all ED visits) for a specific vulnerable
demographic group may be used. For instance, during a wildfire event in a rural area, statistically
significant increases in county-specific visits for asthma may not be observed but increased cases of total
ED visits for elementary school aged children may be observed. Additionally, when an increase is
observed for case definitions comprised of all visits within a specific vulnerable population group, the
public health professional may be able to backtrack to a particular event, such as a wildfire, and then
examine outcome specific cases.
Insert 2: Relatedness Example - Hypothermia
It is always critical to be cognizant of the codes and
keywords that you are using in a case definition,
irrespective of your syndromic surveillance system. It is
valuable to define your specific problem and to consult with
subject matter experts.
During January 2017 Portland, Oregon experienced a
prolonged and extreme winter storm. Multnomah County
Health Department partners approached the Oregon
ESSENCE team to inquire about monitoring hypothermia-
related ED and urgent care visits. While there was an
overarching concern about anyone exposed to the winter
weather, a subpopulation of concern was individuals
experiencing homelessness. ESSENCE did not have a pre-
defined syndrome that was appropriate, so a new chief
complaint and discharge diagnosis (CC/DD) query was
drafted for cold exposure.
In the initial draft of the case definition, two ICD-10-CM
codes were included that were later removed: T88.51
(hypothermia following anesthesia) and W93 (exposure to
excessive cold of man-made origin). While both relate to
“cold” or “hypothermia,” neither were actually related to the
problem of monitoring increases in outside, weather-related
hypothermia visits. The final case definition used included
the following codes and terms: T68 (hypothermia), X31
(exposure to excessive natural cold), T33 (superficial
frostbite), T34 (frostbite with tissue necrosis), “cold
exposure,” “hypothermia,” or “frost bit.” [Personal
communication: Amy Zlot, Multnomah County Health
Department, Oregon, April 2017]

17
VALIDATE AND EVALUATE EFFECTIVENESS OF CASE DEFINITION
Components of the syndrome case definition may be evaluated during or after the development process
to assist in refining the definition. After the syndrome case definition has been completed, the
effectiveness of the definition should to be assessed to determine if: 1) the definition identifies cases with
the surveillance outcome and 2) the syndrome will add to the current weather-related surveillance, that is,
the pattern of identified cases is associated with the weather-related exposure or event. This latter
determination refers to the use of syndromic surveillance for situational awareness, tracking trends over
time (either short- or long-term), and retrospective analysis. In other words, will the syndrome provide
information that can be used for situational awareness during an event?
MANUAL REVIEW
The simplest method for evaluating the accuracy of the case definition (or individual components) is to
review the chief complaint or triage notes associated with each identified case. For example, does the
keyword phrase “to hot” pull potential heat-related cases or cases where the individual had a dental
sensitivity, “to hot liquid”? [CSTE 2016]. This evaluation can be done by manually reviewing all or a
Insert 3: Enhanced surveillance example – Mosquito-borne disease surveillance
The changing climate has affected the geographical distribution and life cycle of vector-borne
diseases [Luber 2014; Beard 2016]. The magnitude of the geographical shift in U.S. regions is
unclear as the shift is based on many factors of which climate change is but one. However, it is
suspected that non-endemic diseases may become endemic as mosquito species populate new
areas [Beard 2016]. In Arizona, syndromic surveillance is being used to enhance routine arbovirus
surveillance. Surveillance occurs for both endemic (West Nile and St. Louis Encephalitis) and travel
associated (Dengue, Chikungunya, and Zika) mosquito-borne diseases. Routine surveillance
identifies cases reported by providers and laboratories, in accordance with Arizona Administrative
Code. In order to capture potentially missed cases or to identify cases sooner, the Arizona
Department of Health Services (ADHS) has implemented several enhanced surveillance strategies,
including notification from commercial labs at the time of the order (rather than result) and syndromic
surveillance. ADHS has defined case definitions in the National Syndromic Surveillance Program’s
version of ESSENCE (syndromic surveillance system) to identify any visits with a chief complaint or
diagnosis any of the five mosquito-borne diseases listed above. The query is monitored twice a week
during the peak arboviral season and once a week during the off-season. ADHS notifies the local
public health jurisdiction when potential new cases are identified. The local health department will
determine if the case requires follow-up (e.g., “traveled to Mexico – presenting with dengue” versus
“history of west nile”) or if the case has already been identified via other surveillance mechanisms. If
follow-up is necessary, the local health department can use the patient medical record number to
obtain the required information from the reporting facility. All mosquito-borne disease cases identified
in Arizona, regardless of identification method, are summarized and shared with Arizona’s public
health and vector partners across the state. In this example, data from the syndromic surveillance
system does not trigger action but instead provides a potentially more complete picture of the disease
burden in Arizona. [Personal communication: Arizona Department of Health Services, May 2017]
18
random sample of cases within a particular time frame. Manual review may also be conducted on
potentially false positive cases – cases identified by the syndrome but may not have the outcome of
interest. Potentially false positive cases may be identified by keywords or diagnosis codes. Finally,
calculating the number of visits identified by each keyword or diagnosis code will help determine which
inclusion or exclusion keywords are important (or not necessary) to include in the case definition.
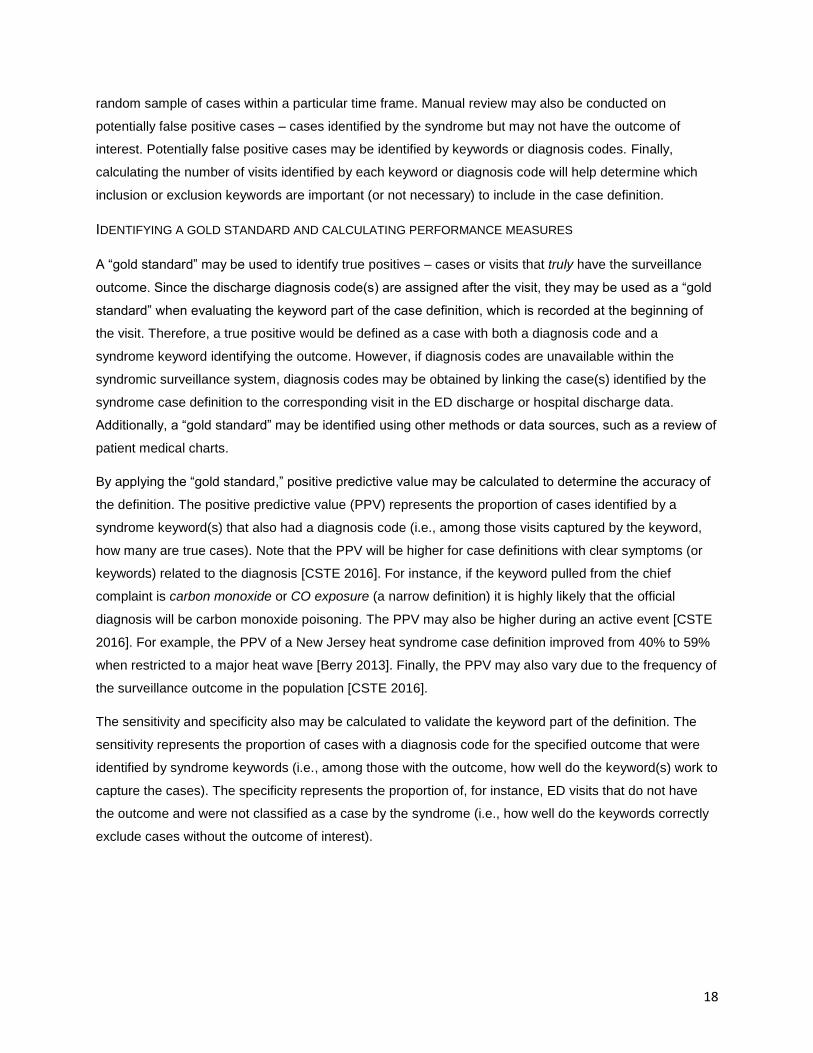
IDENTIFYING A GOLD STANDARD AND CALCULATING PERFORMANCE MEASURES
A “gold standard” may be used to identify true positives – cases or visits that truly have the surveillance
outcome. Since the discharge diagnosis code(s) are assigned after the visit, they may be used as a “gold
standard” when evaluating the keyword part of the case definition, which is recorded at the beginning of
the visit. Therefore, a true positive would be defined as a case with both a diagnosis code and a
syndrome keyword identifying the outcome. However, if diagnosis codes are unavailable within the
syndromic surveillance system, diagnosis codes may be obtained by linking the case(s) identified by the
syndrome case definition to the corresponding visit in the ED discharge or hospital discharge data.
Additionally, a “gold standard” may be identified using other methods or data sources, such as a review of
patient medical charts.
By applying the “gold standard,” positive predictive value may be calculated to determine the accuracy of
the definition. The positive predictive value (PPV) represents the proportion of cases identified by a
syndrome keyword(s) that also had a diagnosis code (i.e., among those visits captured by the keyword,
how many are true cases). Note that the PPV will be higher for case definitions with clear symptoms (or
keywords) related to the diagnosis [CSTE 2016]. For instance, if the keyword pulled from the chief
complaint is carbon monoxide or CO exposure (a narrow definition) it is highly likely that the official
diagnosis will be carbon monoxide poisoning. The PPV may also be higher during an active event [CSTE
2016]. For example, the PPV of a New Jersey heat syndrome case definition improved from 40% to 59%
when restricted to a major heat wave [Berry 2013]. Finally, the PPV may also vary due to the frequency of
the surveillance outcome in the population [CSTE 2016].
The sensitivity and specificity also may be calculated to validate the keyword part of the definition. The
sensitivity represents the proportion of cases with a diagnosis code for the specified outcome that were
identified by syndrome keywords (i.e., among those with the outcome, how well do the keyword(s) work to
capture the cases). The specificity represents the proportion of, for instance, ED visits that do not have
the outcome and were not classified as a case by the syndrome (i.e., how well do the keywords correctly
exclude cases without the outcome of interest).

19
TEMPORALITY COMPARISON AND WEATHER ASSESSMENT
Ideally, conclusions and actions based on near real-time results of the syndromic surveillance system
should be the same (or similar) to the conclusions that would have been made using results from
confirmed case data which may not be available in a timely manner. If the two distributions (i.e.,
syndrome cases and confirmed cases) are similar, then even if the sensitivity and PPV are low, the
syndrome will still be useful. The daily counts of cases identified by the syndrome case definition can be
compared to daily counts of confirmed cases, such as cases identified by diagnosis codes in an
administrative data source (e.g., ED visits or hospital discharge data). The comparison can be done
visually through graphical displays (time-series plots or scatterplots) or through statistical comparison
using, for instance, correlation or times-series analysis [Mathes 2011; Berry 2013; Tsai 2016]. The
relationship between syndromic cases and meteorological/event data may also be compared to the
relationship confirmed cases and meteorological/event data.
Finally, the syndrome case definition may under- or over-estimate cases. An examination of the selected
outcome in other sources of data, such as the ED discharge or hospital discharge data or vital statistics,
should be reviewed after an event or surveillance time period (e.g., summer). The examination will help to
quantify the limitations of the syndromic surveillance system and potentially understand how the identified
syndromic cases fit into the overall surveillance of the outcome.
USING MACHINE LEARNING TECHNIQUES TO IDENTIFY KEYWORDS
The accuracy of a syndrome case definition will vary over time and over space. For example, keywords
that are common in Arizona may be very rare in North Dakota. In addition, new words are introduced
every day in the body of the chief complaints and triage notes of the ED electronic records. Therefore, for
each established case definition there is a need to regularly assess its accuracy and make adjustments to
the query statement, especially to the underlying keywords. Checking a case definition’s accuracy may
not be an easy task given the sheer size of the data involved. Fortunately, the task can be automated by
using machine learning (ML) techniques. The following is a simple example of supervised machine
learning and how this technique can be used to identify keywords that are associated with a syndrome.
For more details on the process, including other techniques, refer to the following book: “Machine
Learning with R”, 2nd Edition [Lantz 2015].
Step 1. Create a learning data set: From the output of an existing query on a recent batch of ED data
select the true positive cases, and create a new data set. For example, for carbon monoxide surveillance
only include true carbon monoxide cases. If not certain about a record, do not include it. Merge the
following fields into one text field: Chief complaint, Triage notes, Diagnosis text, and Diagnosis codes.
Preferably include 100 records or more in this ‘learning’ data set. Assign or use a unique identifier for
each record. Subset the data by keeping two fields: the Unique ID field and the merged text field.

20
Step 2. Create a corpus out of the learning data set: Transform the dataset created in step 1 into a
corpus. A corpus is a collection of text documents specifically designed for text processing during certain
machine learning applications. In this situation, each document of the corpus represents a record from the
learning data set. In R, the text mining package tm can be used to create4 a corpus [Feinerer 2008].
Step 3. Prepare the corpus for analysis: In order to perform any analysis on the words found in the
corpus, the text needs to be standardized. To do that, punctuations, other non-letter characters, and
numbers, if diagnosis codes are not included, need to be removed from the documents. Since this
process is case sensitive, the whole corpus should be converted to lower or upper case to allow for an
accurate count of words. Next, words may need to be truncated or stemmed to allow for the groupings.
Stemming refers to the process of reducing inflected or sometimes derived words to their work stem, base
or root form. Verb tenses and singular and plural nouns are some examples of words that may need to be
stemmed to facilitate grouping. For example, the stem for accident, accidental, and accidents may be
“accid”. By stemming the words in a corpus, one can group several variants of a particular word more
efficiently and thus calculate more accurately the frequency of the word in the corpus. Finally, “stop
words” (i.e., high frequency words that do not add information, such as: the, to, from, and, but, and, etc.),
numbers, and words that are ubiquitous in the corpus (e.g., patient, sick, or pain) are usually removed to
allow more meaningful ones to surface. To perform this step well requires a solid knowledge of the data.
It will take many trials and errors to get this step right, even for experienced users.
Step 4. Split each text document into separate words or groupings: In this step, the standardized text
document will be split into words or strings of words according to a process called tokenization.
Tokenization is very useful in providing context to words or tokens. A token is a sequence of characters or
words that are grouped together for processing [Manning 2008]. For example, in this sentence: “Patient
denied loss of consciousness”. The word “denied” is most likely going to produce a false positive case.
However, by tokenizing the sentence (chopping it into words) and creating n-grams (grouping words in a
sequence of 1, 2, 3 words) it becomes less likely for this sentence to cause a false positive retrieval. In
this context, n-grams are basically a sequence of tokens, where n indicates the number of tokens.
Possible n-grams from the example sentence are (note that during the data preparation the stop word “of”
was removed):
• 1 token or unigram: [patient] [denied] [loss] [consciousness] = 4 unigrams
• 2 tokens or bigram: [patient denied] [denied loss] [loss consciousness] = 3 bigrams
• 3 tokens or trigram [patient denied loss] [denied loss consciousness] 2 trigrams
4 There are several other packages dedicated to text mining, including the caret package in R. Among the other open source languages, Python is another open source language which offers libraries for text mining and machine learning (e.g., scikit-learn). Additionally, commercial software such as SAS can be used to complete all the machine learning steps described in this section. An internet search on “text mining”, “text analysis”, “natural language processing” will provide other resources.

21
N-grams are often more efficient than very complex data mining methods. There are many ways to
tokenize texts5 but all lead to a structure commonly called document term matrix (DTM). When visualized
a DTM looks like a table where, in this case, each row represents a visit record and each column is a
word in the corpus. The value in each cell represents then the frequency of a word in a particular
document or record (Table 3).
Table 3. Example of truncated document text matrix (DTM)
Unique ID breath dizzy found exposur poison monoxid
Rec00067 0 0 0 0 0 0 Rec00068 0 0 0 0 1 2 Rec00069 1 1 0 0 0 0 Rec00011 0 0 0 0 0 0 Rec00099 0 0 1 0 0 0
Step 5. Inspect the text document matrix and select the new words: Using the DTM, calculate the number
of occurrences for each word in the corpus and create a list of words in descending order of frequency
(Table 4).
Table 4. Example of ordered list of word frequencies in a carbon monoxide poisoning corpus
Word carbon monoxid burn Short poison accident car suicid tube Frequency order
154 141 127 83 78 70 62 62 61
Word headach home attempt exposur co2 nausea nbr garag famili Frequency order
56 56 52 52 50 45 43 40 30
This list very frequently will contain words that were not
included in the original case definition. The list can help
decide if new words need to be included or old words need
to be excluded. As part of the inspection of the DTM a word
cloud can be created to visually detect the most important
words.
In summary, the process described above is one of the
simplest machine learning techniques that can be used to
systematically discover new and important keywords that
can be incorporated into syndrome classifications to
increase the sensitivity and specificity of a syndrome case
definition. Of course, machine learning can offer much more
than finding keywords. It can be used to replace the query approach altogether by developing a statistical
model and applying it to the data to predict the diagnosis or syndrome group for each record. If
5 The R packages tm and NLP contain functions that help with tokenization and ‘n-gramming’.
Figure 2. Example of word cloud for a carbon monoxide poisoning corpus

22
implemented correctly, machine learning, compared to query strategy, is faster, more accurate, and more
scalable. However, it requires a higher level of analytic skills and typically more computing resources.
SYNDROMIC SURVEILLANCE OF WORK-RELATED OUTCOMES
According to CDC, workers may be vulnerable to increased injuries, illness, and death due to climate
change and in industries associated with climate adaptation and mitigation efforts (e.g., green jobs/green
technology) [CDC 2009; WHO 2014; Schulte 2016]. Extreme climate conditions can exacerbate existing
health issues and cause previously unknown or unanticipated hazards [Schulte 2016; NIOSH 2016]. For
example, outdoor workers, including oil field and utility workers may have increased exposure to ticks
carrying Lyme disease [Schulte 2016]. Increases in respiratory or gastrointestinal outcomes have been
documented for workers in composting facilities [Hambach 2012]. Injuries and illnesses have also been
documented in rescue and clean-up workers after a hurricane or natural disaster [CDC 2005; Fayard
2009]. Syndromic surveillance can be used to capture work-related injuries due to climate events through
the development of both work-related and weather-related case definitions.
A work-related injury and illness case definition needs to be developed. The definition may be used alone
or in combination with another case definition (e.g., carbon monoxide poisoning). The development and
validation of a work-related case definition follows the processes outlined in the first three parts of Section
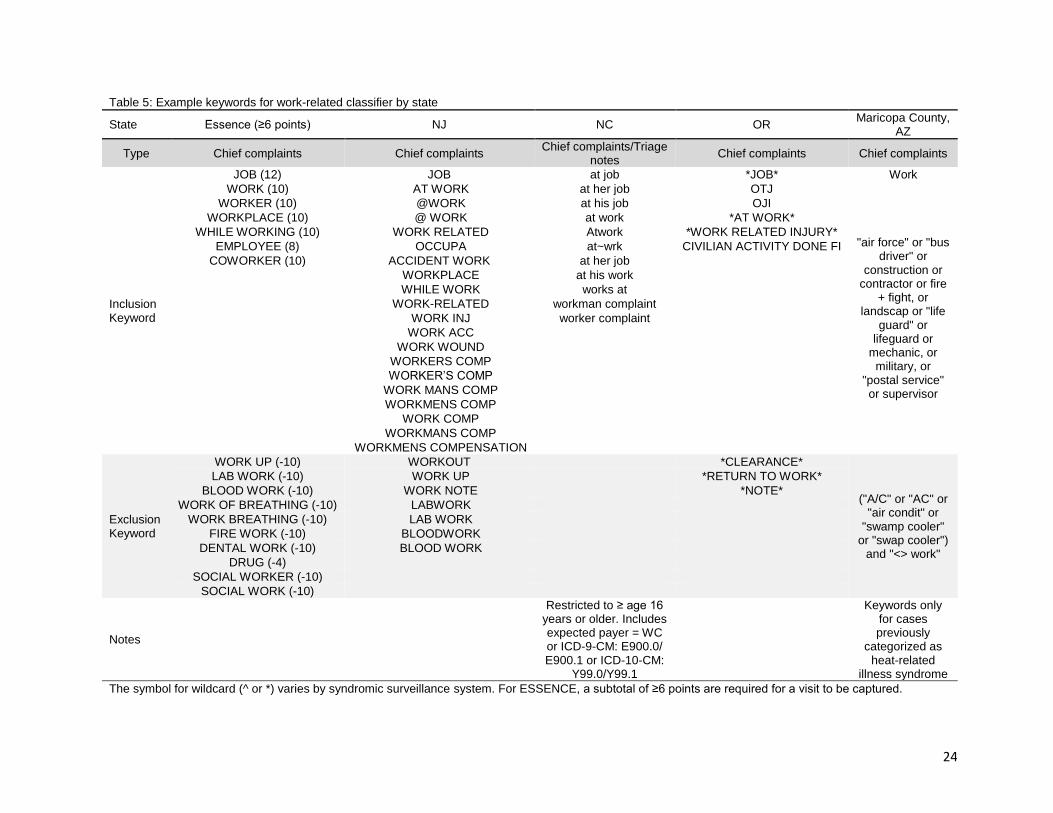
III (see pages 9-15). A collection of keywords and phrases specific to work-related injuries and illnesses
are developed by assessing the free text chief complaint field and triage notes (i.e., preclinical admission
notes), and ICD-10-CM (or ICD-9-CM) codes found in the record for each ED visit to capture the full
range of non-fatal work-related injuries reported to the syndromic surveillance system. Potential keywords
and diagnosis codes are listed in Table 5. Depending on the syndromic surveillance system, worker’s
compensation as expected payer may also be included in the definition. Once an initial case definition is
developed, the definition is refined using keywords or ICD codes from historic data.
The use of ED discharge or hospital discharge data obtained from all acute care general hospitals
through electronic reporting of Uniform Billing (UB) records can be used to help validate the selected
keywords. These data provide standard variables on patient identifiers, diagnosis (i.e., ICD-9/10-CM
codes), nature of injury, external cause (e.g., ICD-9-CM E-codes), place of occurrence, and payment
information. The use of the codes for Supplementary Classification of Factors Influencing Health Status
and Contact with Health Services (ICD-9-CM V-codes, ICD-10-CM Z-codes) and workers’ compensation
as a primary (expected) payer allows for obtaining injuries that occurred specifically in the workplace.
However, this may undercount work-related injuries. These data enable the identification of work-related
injuries that are severe enough to require hospitalization or an ED visit.
The work-related case definition will need to be evaluated to determine if work-related cases (e.g., ED
visits) are being identified. Sensitivity, specificity, and positive predictive value (PPV) can be calculated
for the list of work-related keywords identified through initial methods. Cases are considered “true

23
positives” if keywords matched the identified gold standard, for instance ICD-9-CM E-codes. If cases did
not have keywords that matched the ICD-9-CM E-codes they are considered to be “false positives”
[Borjan 2017]. Once the syndrome case definition is developed and validated, preliminary alert thresholds
for work-related injury events need to be determined. These alert thresholds may be based on absolute
number of ED visits meeting the newly developed occupational syndromes or based on the number of
visits needed for Occupational Safety and Health Administration (OSHA) or other agency response. Alerts
received should be investigated immediately to determine if it is occupationally-related by contacting the
facility (e.g., ED). Additionally, dependent on the outcome, the number of identified visits may be few
enough that each work-related case may be investigated.
24
Table 5: Example keywords for work-related classifier by state
State Essence (≥6 points) NJ NC OR Maricopa County,
AZ
Type Chief complaints Chief complaints Chief complaints/Triage
notes Chief complaints Chief complaints
Inclusion Keyword
JOB (12) JOB at job *JOB* Work
WORK (10) AT WORK at her job OTJ
"air force" or "bus driver" or
construction or contractor or fire
+ fight, or landscap or "life
guard" or lifeguard or
mechanic, or military, or
"postal service" or supervisor
WORKER (10) @WORK at his job OJI
WORKPLACE (10) @ WORK at work *AT WORK*
WHILE WORKING (10) WORK RELATED Atwork *WORK RELATED INJURY*
EMPLOYEE (8) OCCUPA at~wrk CIVILIAN ACTIVITY DONE FI
COWORKER (10) ACCIDENT WORK at her job
WORKPLACE at his work
WHILE WORK works at
WORK-RELATED workman complaint
WORK INJ worker complaint
WORK ACC
WORK WOUND
WORKERS COMP
WORKER’S COMP
WORK MANS COMP
WORKMENS COMP
WORK COMP
WORKMANS COMP
WORKMENS COMPENSATION
Exclusion Keyword
WORK UP (-10) WORKOUT *CLEARANCE*
("A/C" or "AC" or "air condit" or
"swamp cooler" or "swap cooler")
and "<> work"
LAB WORK (-10) WORK UP *RETURN TO WORK*
BLOOD WORK (-10) WORK NOTE *NOTE*
WORK OF BREATHING (-10) LABWORK
WORK BREATHING (-10) LAB WORK
FIRE WORK (-10) BLOODWORK
DENTAL WORK (-10) BLOOD WORK
DRUG (-4)
SOCIAL WORKER (-10)
SOCIAL WORK (-10)
Notes
Restricted to ≥ age 16 years or older. Includes expected payer = WC or ICD-9-CM: E900.0/ E900.1 or ICD-10-CM:
Y99.0/Y99.1
Keywords only for cases previously
categorized as heat-related
illness syndrome
The symbol for wildcard (^ or *) varies by syndromic surveillance system. For ESSENCE, a subtotal of ≥6 points are required for a visit to be captured.

25
IV: USING ENVIRONMENTAL DATA WITH SYNDROMIC SURVEILLANCE
Just as public behavior (e.g., over-the-counter drug sales, complaints to utilities, or school and work
absenteeism) can be early indicators of disease, environmental data are critical for risk assessment and
are a valuable “pre-clinical” sources of information for syndromic surveillance [Berger 2006; May 2009].
The specific data will vary based on health outcomes of interest, local availability, and technical ability to
incorporate data feeds into syndromic surveillance systems. Environmental data that could be used to
improve situational awareness include but are not limited to: traditional meteorological observations like
temperature and precipitation [Leonardi 2006; Josseran 2010; Perry 2011]; daily aeroallergen counts;
monitored air quality observations or AQ index values; drinking water turbidity [Berger 2006]; satellite data
showing vegetative greening or smoke plume optical depth [Rappold 2011; Tinling 2016; Merkord 2017];
National Weather Service (NWS) alerts, watches, and warnings; multi-month drought indexes; or indexes
measuring larger scale phenomena like the El Niño Southern Oscillation (ENSO). While some data
sources would provide general context, such as knowing that there is a storm warning for a specific part
of your jurisdiction, to be most useful, the statistical associations between these indicators and health
outcomes of interest need to be well-understood. Prior to implementing syndromic surveillance, it may be
necessary to review existing health studies and/or to conduct a retrospective analysis of the relationship
between weather metrics and the health outcome.
Practically speaking, using environmental data with syndromic surveillance health data will likely require
the following steps:
1. Identify goal and potential uses of surveillance.
2. Identify the types of data (i.e., variables, time frame, geography) that are appropriate for your
project based on literature, prior work, or consultation with a subject matter expert.
3. Identify a source for those data (i.e., data steward and actual data source, like an FTP site or web
service).
4. Ask permission to use data, if applicable.
5. Temporally (e.g., daily, weekly, or event specific) and geographically (e.g., zip code, county,
state) match the environmental data with the syndromic surveillance health data.
6. Maintain a working relationship with environmental data steward.
7. Demonstrate use.
The steps above are appropriate for using externally-housed data. If you are integrating environmental
data into an existing syndromic surveillance system, there are additional steps which would occur
between steps 5 and 6 listed above:
1. Work with IT staff or syndromic surveillance coordinator to add environmental data as a new data
source in the system.

26
2. Validate environmental data within the syndromic surveillance system (i.e., is the data being
incorporated properly).
EXTERNALLY-HOUSED DATA
Much of the work analyzing associations between syndromic surveillance data and environmental
indicators has been done retrospectively. In response to extreme heat events, several syndromic
surveillance systems have been evaluated for their ability to serve as heat health warning systems6. In
England, as temperatures increased, calls to NHS Direct—a 24/7 nurse helpline—increased moderately
overall and acutely for heat or sun stroke [Leonardi 2006]. Increased temperatures were also correlated
with increased ED visits for diagnoses related to hyperthermia, malaise, dehydration, and hyponatremia
in France [Josseran 2010]. And in Ontario, Canada, several weather predictors (i.e., temperature,
humidity, and wind speed) were used in a retrospective study of heat-related illness ED visits [Perry
2011]. Syndromic surveillance data have also been used in retrospectively assessing cardiovascular-
related ED visits associated with peat bog wildfire smoke exposure in North Carolina, using both satellite-
measured aerosol optical depth to identify smoke-exposed counties [Rappold 2011] and county-level
modeled particulate matter (PM) 2.5 [Tinling 2016].
Externally-housed environmental data, and knowledge of environmental event occurrences, have been
used to inform heightened, real-time monitoring of health effects. During wildfires in San Diego County,
CA in 2007, ED visits were monitored using BioSense [CDC 2008]. Syndromes of interest included
respiratory disease, gastrointestinal disease, burns, and cardiac complaints. Increased visits were seen
for respiratory disease, and additional analysis was done after the event to quantify the magnitude [CDC
2008]. Real-time monitoring was also done in the UK to assess health impacts related to a volcanic ash
plume in 2010, but no increases in general practitioner consultations for syndromes of interest were
observed [Elliot 2010].
INTEGRATING ENVIRONMENTAL DATA INTO SYNDROMIC SURVEILLANCE SYSTEMS
There are circumstances where having both health and environmental data in the same syndromic
surveillance system have demonstrated utility, including heat-related illness and vector-borne diseases.
There may be trade-offs in terms of timeliness and geographic scope, however. For example, weekly
epidemiological data are paired with freely available “remotely-sensed environmental data,” (i.e., rainfall,
temperature, vegetation greening, and surface moisture), in a unified database called EPIDEMIA to
forecast malaria risk in Ethiopia [Merkord 2017]. Mosquito count data have been combined with climate-
related indicators (i.e., tide height, rainfall, and sea surface temperature) to predict Ross River Virus
6 Extreme heat is likely the most studied climate-related hazard. Temperature, and to a lesser extent humidity, are easily accessible weather variables, and some heat-related health effects, such as heat-related illness or all-cause mortality, are relatively easy to understand from a physiological perspective and have strong statistical associations with temperature and extreme heat events.
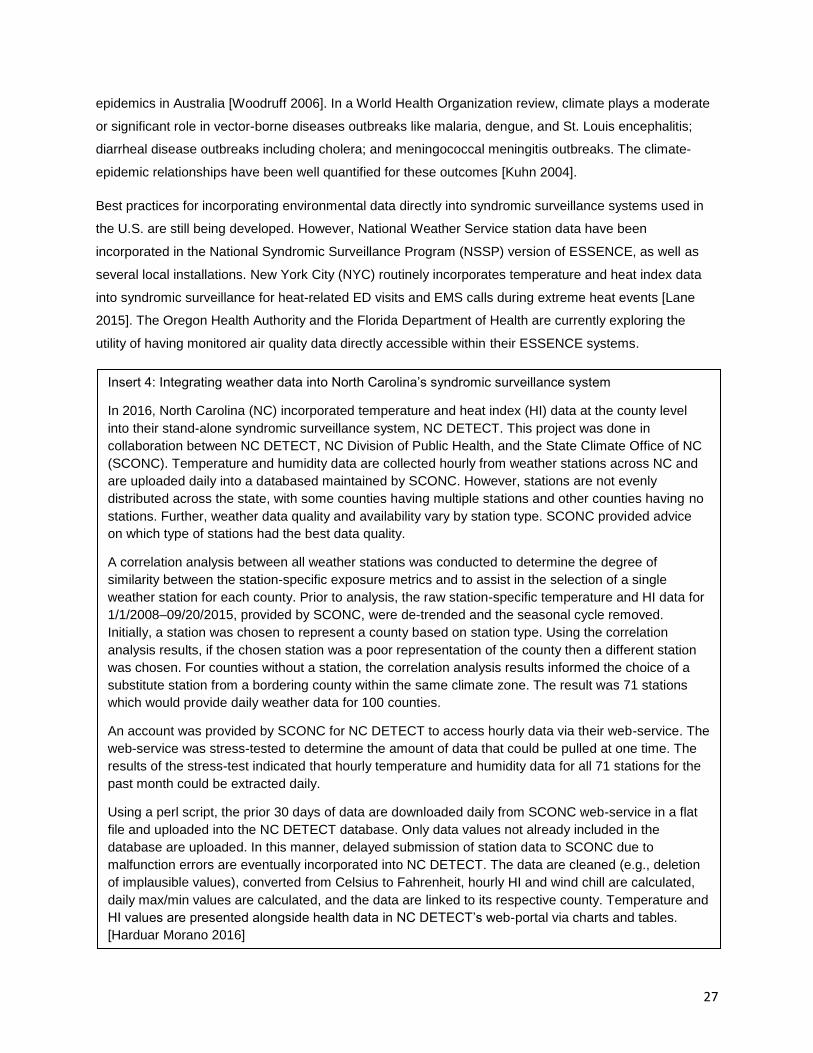
27
epidemics in Australia [Woodruff 2006]. In a World Health Organization review, climate plays a moderate
or significant role in vector-borne diseases outbreaks like malaria, dengue, and St. Louis encephalitis;
diarrheal disease outbreaks including cholera; and meningococcal meningitis outbreaks. The climate-
epidemic relationships have been well quantified for these outcomes [Kuhn 2004].
Best practices for incorporating environmental data directly into syndromic surveillance systems used in
the U.S. are still being developed. However, National Weather Service station data have been
incorporated in the National Syndromic Surveillance Program (NSSP) version of ESSENCE, as well as
several local installations. New York City (NYC) routinely incorporates temperature and heat index data
into syndromic surveillance for heat-related ED visits and EMS calls during extreme heat events [Lane
2015]. The Oregon Health Authority and the Florida Department of Health are currently exploring the
utility of having monitored air quality data directly accessible within their ESSENCE systems.
Insert 4: Integrating weather data into North Carolina’s syndromic surveillance system
In 2016, North Carolina (NC) incorporated temperature and heat index (HI) data at the county level
into their stand-alone syndromic surveillance system, NC DETECT. This project was done in
collaboration between NC DETECT, NC Division of Public Health, and the State Climate Office of NC
(SCONC). Temperature and humidity data are collected hourly from weather stations across NC and
are uploaded daily into a databased maintained by SCONC. However, stations are not evenly
distributed across the state, with some counties having multiple stations and other counties having no
stations. Further, weather data quality and availability vary by station type. SCONC provided advice
on which type of stations had the best data quality.
A correlation analysis between all weather stations was conducted to determine the degree of
similarity between the station-specific exposure metrics and to assist in the selection of a single
weather station for each county. Prior to analysis, the raw station-specific temperature and HI data for
1/1/2008–09/20/2015, provided by SCONC, were de-trended and the seasonal cycle removed.
Initially, a station was chosen to represent a county based on station type. Using the correlation
analysis results, if the chosen station was a poor representation of the county then a different station
was chosen. For counties without a station, the correlation analysis results informed the choice of a
substitute station from a bordering county within the same climate zone. The result was 71 stations
which would provide daily weather data for 100 counties.
An account was provided by SCONC for NC DETECT to access hourly data via their web-service. The
web-service was stress-tested to determine the amount of data that could be pulled at one time. The
results of the stress-test indicated that hourly temperature and humidity data for all 71 stations for the
past month could be extracted daily.
Using a perl script, the prior 30 days of data are downloaded daily from SCONC web-service in a flat
file and uploaded into the NC DETECT database. Only data values not already included in the
database are uploaded. In this manner, delayed submission of station data to SCONC due to
malfunction errors are eventually incorporated into NC DETECT. The data are cleaned (e.g., deletion
of implausible values), converted from Celsius to Fahrenheit, hourly HI and wind chill are calculated,
daily max/min values are calculated, and the data are linked to its respective county. Temperature and
HI values are presented alongside health data in NC DETECT’s web-portal via charts and tables.
[Harduar Morano 2016]

28
THE FUTURE OF ENVIRONMENTAL DATA ENHANCING SYNDROMIC SURVEILLANCE
SYSTEMS
There are several challenges to using environmental data as part of syndromic surveillance. Getting data
at similar geographic and temporal scales is a persistent challenge in public health [Kintziger 2017], not
one limited to climate and health or syndromic surveillance work. However, care should be taken to
consider how station-based data are aggregated (or not) within a system. Similarly, environmental
information that is multi-day (e.g., storm watch) to seasonal (e.g., drought index or ENSO indicator)
should be handled carefully. Before implementing surveillance enhanced with weather metrics, the
relationship between the outcome and the weather variables should be examined. This will also help to
inform display.
The algorithms used to assess increases in events (assumed to be health-related outcomes) are not
necessarily appropriate for most environmental data. While an in-depth discussion of algorithms is
beyond the scope of this guidance document, these limitations are known caveats of many systems,
including ESSENCE. In the ESSENCE system, the default algorithm is Poisson/Regression/EWMA
(exponentially weighted moving average). This algorithm analyzes the last 30 days, minus the last two
days (to account for day-of-week or other anomalies), to determine if there were more than the expected
number of events [Howard 2008]. For a weather variable like temperature, several years of data may be
needed to assess trends. In NYC, counts of heat-related illness are included in statistical models that
include several years of data and control for both time trends (such as day of week, month and year) and
meteorological variables [Lane 2015]. This may help users assess whether counts are higher than
expected for the time of year and weather conditions. It may be important to assess variations in
temperature. For example, looking at the difference between the current day’s temperature compared to
the previous days’, and/or assessing whether the temperature is significantly higher than average for the
day or month (e.g., above the 90th percentile). Additionally, all algorithms in ESSENCE are one-sided,
meaning they look for increases and not decreases in events. While this is usually appropriate for health
data, there are numerous examples where you would want to know if an environmental indicator was
lower than normal (e.g., minimum temperatures or rainfall). There are methods for assessing multiple
data feeds simultaneously using “spatial and temporal data aggregation strategies,” as explored using
multiple clinical data sources [Burkom 2004]. However, assessing multiple data feeds that include one or
more environmental indicator in near-real time is a largely unexplored challenge for syndromic
surveillance system developers.
V: INTERPRETING AND DISPLAYING THE DATA
Climate-related case definitions can be applied to the entire state (or jurisdiction) or may be applied to a
lower geographical area such as a county or a zip code. Applying the case definition to a smaller
geographical area may be especially appropriate when only certain areas of a jurisdiction are affected.

29
For instance, during the response to hurricane Matthew in 2016 Georgia Department of Public Health
reviewed syndrome query results in the four public health districts impacted by hurricane landfall [Borroto
2017].
Surveillance data are best presented and used in aggregate form unless individual cases are being
verified (e.g., active follow-up with facility), additional situation information is being extracted, or case
definitions are being revised. Data from the syndromic surveillance system may be presented in tabular
form, using graphs or bar charts, or maps. This data may be stratified by demographic group, such as sex
or age group (Figure 3). Data display may be available internally as part of the syndromic surveillance
system. For instance, ESSENCE as part of the NSSP allows line graphs of cases with temperature
(Figure 4) or maps by at the zip code level [CDC 2016]. In another example, Oregon’s syndromic
surveillance system displays near real-time data graphically in dashboards that are accessible by
authorized users such as county health officials (Figure 5).
Data may also be summarized externally. External summarization and presentation of data may provide
more flexibility in how the data are displayed and how the data are shared. This may include additional
tables/figures or incorporation of data in weekly or monthly reports (see Appendix A). When creating
external summarization reports, be sure to consider your audience. For instance, when partnering with a
particular entity small numbers may be shared and line listings (i.e., detailed information for each case)
may be presented, depending on the data sharing agreement in place and the situation. On the other
hand, when working with community liaisons a summary report with aggregated results and simple
graphs or figures may be more effective. Data may be presented as counts, percent of total ED visits
(e.g., cases/total ED visits x100), or rates (e.g., cases/person-time). The percent of total ED visits and
rates allows for comparability across regions or sub-populations.
One of the concerns with any public health surveillance system which uses medical information is the
potential breach of confidentiality. This is especially of concern at smaller geographic levels (e.g., county,
city, or zip code specific data) where a single case for an outcome may be present. Or small numbers
may result from multiple demographic stratifications (e.g., Asian males age 5-14 years in county X). Data
suppression guidelines will vary between jurisdictions and data sources/custodians. Additionally, for
statistical analysis or presentation of data, numerators with less than 20 cases may produce unstable
estimates (e.g., rates) [Buescher 2008; Miniño 2011]. Many jurisdictions or data holders will require
suppression of data to discourage misinterpretation or misuse of statistical estimates. The level of
suppression may also depend on with whom the data are being shared (e.g., internal partners,
emergency management, law enforcement, the public). Check with your syndromic surveillance system
coordinator prior to presenting or sharing the data.

30
Figure 3. Figure available to authorized users of North Carolina’s syndromic surveillance system as part of a heat-related illness dashboard.
Figure 4. Example from the ESSENCE dashboard used by Maricopa County Department of Public Health to monitor heat-related illness. The time series include the heat-related illness (HRI) definition form the CSTE guidance document [CSTE 2016] (currently built into the NSSP ESSENCE CC and DD category) and an overlay of maximum and minimum (not shown) temperatures using the National Weather Service data.

31
Figure 5. Asthma-like Visits from Multnomah County Residents and Portland Air Quality, February 2017. This figure provides an example of quickly visualizing a health outcome of interest with environmental data that is integrated into a syndromic surveillance system. The time series graph below shows asthma-like visits made by Multnomah County residents during February 2017 overlaid with 24-hour maximum PM 2.5 measurements (μg/m3) in from a Portland, OR air quality monitoring station. In Oregon ESSENCE, visit information is collected from emergency departments (EDs) and urgent care centers across the state. Currently, all 60 eligible hospitals are sending ED data every day for syndromic surveillance. Some urgent care centers are currently reporting, including several in the Portland metro area. Air quality data are available from monitors statewide.
VI: IDENTIFYING AND ENGAGING POTENTIAL PARTNERS
IDENTIFYING AND WORKING WITH PARTNERS AND STAKEHOLDERS
Working with other organizations and partners increases your credibility, expands the scope of the project
and project reach, potentially provides additional resources and expertise, and expands the support for
your organizations objective. Potential partners and stakeholders for your syndromic surveillance project
should ideally be identified as early on in the process as possible. For some projects, the initial data from
your syndromic surveillance may help to identify potential partners through location information. For
example, you may identify a “hot spot” in your jurisdiction where individuals develop heat-related-illness at
a regularly-held event (e.g., annual marathon, annual fair or county event) that occurs during a historically
warm weekend. Additionally, you may identify a sub-group of your cases that seek care, or service certain
locations within your jurisdiction (e.g., a specific hospital, elderly individuals in a care home, vulnerable
populations such as substance abuse patients in a residential facility). In these instances, partnering with
the stakeholders and leaders of the event, or service locations will help with education campaigns as well
as potential future interventions. This detailed information is often found in the admission notes (chief
complaint or triage note) fields, or by a review of the medical record. Medical record review of all
syndromic surveillance records can be a lengthy process depending on case counts. However, a
systematic review of medical records of even a few cases can provide much needed detail that may not

32
be captured through the fields available in the syndromic surveillance system, such the medical co-
morbidities and circumstances of exposure.
Another potential source of identifying partners and stakeholders is during the first steps of the health
communication process [NIH 2004]. Experts on the outcome (e.g., doctors, treating physicians) and
community members (e.g., advocacy groups, community health workers) knowledgeable about the
populations who most often develop these outcomes are important stakeholders to target. Explore other
channels of communication and activities such as interpersonal channels (e.g., counseling or physician-
patient relationships), organizational and community channels (e.g., workplace campaigns, town hall
meetings), mass media (e.g., newspapers, radio, television), and social media (e.g., websites, Facebook,
targeted ads). Coalitions of stakeholders often develop from the formal and informal working relationships
your partners already have, thereby expanding your pool of potential partners. As your partner group
grows, make sure to formalize and structure aspects of the relationship, ensure involvement in decision-
making and accountability, and be flexible. This will help strengthen long-term associations with your
group and create a greater commitment from your partner.
Working with partners can enhance the credibility and reach of your campaign, but identifying and
working with potential partners is time consuming and may require altering your program. This can result
in a loss of ownership and control of any materials that are developed. As a result, developing partnering
plans and clear guidance on the roles of potential partners are essential tasks. For example, you may
require feedback during gatekeeper7 reviews of developed materials, but may not have the funding to
supplement printing or promotion of the materials in their organization. Additionally, be aware that your
organization may have requirements or restrictions on working with for-profit partners (e.g., local
businesses, social media corporations). However, working with stakeholders has many benefits which
may significantly outweigh the time and effort it may take to engage them.
PRESENTING TO PARTNERS AND STAKEHOLDERS
Regardless of when partners and stakeholders are engaged in the process of syndromic surveillance, it is
important to present key findings. Early in the process of developing a syndromic surveillance approach
to climate-related surveillance, presenting key findings to partners and stakeholders may help with getting
“buy-in” and show the importance of the effort. Partners can also refine the work further by providing
feedback to the health officials particularly on how to present and display data, as well as how to change
the case definitions or keywords as needed to capture better data.
7 Gatekeeper reviews are reviews by individuals who are going to be using the material. [CDC 1994] For example, community health workers might review informational pamphlets created by a health department and provide feedback on how useful the material would be and any changes they would like to see. Gatekeepers may also be county health officials or people “higher up” in administration who require pre-approval before publishing.

33
Jurisdictions may choose to present a snapshot of the syndromic surveillance data in weekly or monthly
reports to the public, or just to certain partners and stakeholders. It is important to engage all potential
partners and stakeholders involved in the work; however, other groups who support or advocate for the
population may also be key stakeholders in sharing and distributing the information. For example, in the
case of heat-related illness and hikers, it would be important to include leaders of parks (e.g., city/county
recreation parks or national parks) where heat-related illness was occurring most frequently. It would be
equally as important to involve rescue associations, local hiking groups, and managers of stores that sell
outdoor gear because they have more face time with potentially impacted populations. Thus, engaging
stakeholders who may help with the display and promotion of your data will help with prevention and
intervention campaigns.
Involving partners in the development of the interpretation and display of the data will help jurisdictions
identify the needs of the communities they serve. For example, some partners may want a synopsis of
the cases, while others would like a one-page report with key messages to distribute to their email lists.
Any report presented to partners should include any limitations of the data, as well as contact information
for individuals who wish to receive more information.
Insert 5: Informing planning and enhancing surveillance for extreme weather
CDC funding helped the New York City (NYC) Climate and Health Program (CHP) improve planning for
weather-related power outages and hurricanes, and helped augment NYC’s internal surveillance
capacity for these events. An assessment of the potential health effects of coastal storms was
conducted, including a review of vulnerable populations, using literature review and mapping of
vulnerability indicators. Superstorm Sandy, the most damaging extreme weather event to strike the city
in recent decades, took place in October 2012 as temperatures were cooling, and just before a
significant temperature drop and a Nor’easter further impacted the City. Hundreds of thousands of
people in coastal communities most affected by the storm surge were without one or more essential
utilities (electricity, heat, or running water) in some cases for several weeks.
NYC had developed and evaluated a syndromic surveillance definition for cold-related illness prior to
the storm that they were quickly able to adapt to monitor for hypothermia and other cold-related illness
such as frostbite. This complemented existing carbon monoxide (CO) surveillance, which tracked
exposures using ED data and Poison Control Center (PCC) calls. The surveillance systems were used
to detect trends and, as increases in cases of cold-related illness and CO poisoning were observed,
information was provided, in near-real time, to inform public messaging about the risks of living in
unheated housing. [Lane 2013]
Since then, NYC CHP has continued to improve the surveillance systems, creating cold-related illness
surveillance regression models that incorporate weather data and control for time trends. [Personal
Communication: NYC Department of Health, March 2017]
34
VII: STRENGTHS AND LIMITATIONS
STRENGTHS
The success of syndromic surveillance can be contributed to several strengths. One is the increasing
completeness of the data. With the expansion of the National Syndromic Surveillance Program (NSSP),
the CDC estimates that as of May of 2017, 65% of the ED visits in the United States are captured in their
surveillance system. NSSP receives data from more than 4,000 facilities. Currently, 47 sites in 40 states
participate in the NSSP. At least 14 sites are working on local data feeds with plans to transmit data to the
BioSense Platform (i.e., will be available in NSSP ESSENCE tool) soon. Many others are scheduled to
onboard later in 2017 [CDC/NSSP 2017]. Additionally, there are many jurisdictions with their own
syndromic surveillance system.
Another strength is timeliness. Most of the ED visits are received by public health within 12 hours of initial
activity [Hope 2006]. This timeliness provides situational awareness for emerging threats, including
weather related events. Many of the surveillance systems in use now are also flexible and allow the user
to create their own queries looking for key words that may identify visits related to rapidly changing
conditions. This flexibility helps users use local or regional terminology most likely to be used in their
event [CSTE 2016]. For example, coastal states are more likely to need the ability to look for visits related
to hurricanes while northern states are more likely to look for visits related to snowstorms.
Syndromic surveillance can also help capture social disparities experienced from climate change.
Patients who rely disproportionately on the ED are also particularly vulnerable to climate change [Hess
2009]. Information from the data can help responders identify the populations most at risk and plan
accordingly in advance of expected events.
LIMITATIONS OF USING SYNDROMIC SURVEILLANCE: IN GENERAL AND FOR CLIMATE-
RELATED EXPOSURES
Although syndromic surveillance represents a timely source of data regarding health outcomes, its use
has a number of limitations. First, because syndromes are not confirmed via clinical criteria or laboratory
testing, they should not be interpreted as definitive case counts. The identified visits are generally8 visits
where the patient has symptoms of the outcome. Records classified into a syndrome based on pre-
clinical information may be misclassified. Due to the nature of categorizing pre-clinical information, it is not
definitive that all ED visits for a certain case definition can be attributed to a climate related event,
particularly when a discharge diagnosis is not available. Furthermore, due to the nature of self-reported
chief complaints, some visits that are associated with the event may not be included because of a vague
8 The exception is cases identified by discharge diagnosis codes, depending on the quality of received discharge diagnosis codes. Before making any assumptions about discharge diagnosis codes – speak with your syndromic surveillance coordinator about data quality.

35
chief complaint. For example, an ED visit for carbon monoxide poisoning with a chief complaint of
dizziness may not be classified as a carbon monoxide syndrome case.
The PPV of syndrome definitions have been shown to vary based on the characteristics of the condition
being monitored, the population being surveilled, and other factors [CSTE 2016]. In the context of intense
media coverage of a health issue, increases in detection of outcomes may reflect changes in healthcare-
seeking behavior rather than actual increases in disease [Elliot 2016]. Moreover, when free text fields are
used to define syndromic surveillance case definitions, typographical errors, misspellings, abbreviations,
and acronyms in electronic health records may lead to undercounting of outcomes [Shapiro 2004;
O'Connell 2010]. The alert algorithms that are a feature of some syndromic surveillance systems may
have a low PPV [Guasticchi 2009] and be insufficiently sensitive for the detection of some types of
disease outbreaks [O'Connell 2010; Balter 2005].
A third limitation is that EDs that contribute data to syndromic surveillance systems are not representative
nationally or in many geographic areas–especially rural areas [Coates 2016]. Further, health outcomes
attended by emergency medical services without transport to a hospital are not typically captured in a
syndromic surveillance system, which may limit the use of syndromic surveillance for certain outcomes of
interest. In addition, while hospital (or ED) participation is increasing generally, not all hospitals in a
jurisdiction may participate in the system. As a result, the captured visits may not represent all syndrome
cases and calculated rates will be biased downward (i.e., underestimated). However, the data can still be
used to describe and inform trends in syndrome presentation within the jurisdiction.
Another limitation of syndromic surveillance is the need for significant staff time to individually review
records and alerts. This is a particularly significant barrier for local health departments (LHDs), although
lack of access to the syndromic surveillance systems themselves [Chugtai 2016] and lack of informatics
skills among LHD staff [DeVore 2016; Massoudi 2016] also inhibit effective use of these systems. Modest
increases in LHD use of syndromic surveillance data have been observed after the implementation of
system improvements including LHD-specific dashboards to facilitate data visualization and increased
distribution of LHD-specific surveillance data by a state public health agency [Samoff 2014; Fangman
2015], but further research is needed to identify system improvements that increase use of syndromic
surveillance data for public health decision-making. Finally, the setting of appropriate thresholds for alerts
that require response may require significant time and expertise.
VIII. CONCLUSION
Climate change impacts a vast array of health outcomes, ranging from chronic diseases to infectious
diseases to injuries. A strong multi-dimensional surveillance system is required to meet the challenge of
protecting the health and well-being of our populations. While syndromic surveillance systems should not
be used as a replacement for traditional epidemiologic surveillance, it can be a valuable part of a
jurisdictions overall surveillance by providing near real-time detection and monitoring of disease

36
outbreaks and public health emergencies, monitoring of disease trends, case finding, seasonal event
response, situational awareness, program management, and development of summary reports.
Historically, much of the weather- and climate-related surveillance has occurred after an event,
sometimes significantly after an event (e.g., a retrospective analysis of all-cause mortality after an
extreme heat event). By leveraging the near real-time functionality of syndromic surveillance, public
health practitioners can assess baseline healthcare burden before a forecast event, in addition to during
or immediately after one.
This guidance document provides the initial steps for jurisdictions to develop and expand their
surveillance of weather- and climate-related health outcomes. The document does not cover all options,
so the workgroup encourages jurisdictions to continue to develop and share new ideas or methods via
workgroups, conferences, and publications. Both the Council of State and Territorial Epidemiologist
(CSTE: www.cste.org) and the International Society for Disease Surveillance (ISDS:
www.healthsurveillance.org) have forums, communities of practice (CoP), and additional resources
available on their websites. Finally, Public Health Reports recently published a syndromic surveillance
supplement which includes numerous articles on weather- and climate-related syndromic surveillance
[Yoon 2017].
REFERENCES
Anderson H, Brown C, Cameron LL, Christenson M, Conlon KC, Dorevitch S, Dumas J, Eidson M,
Ferguson A, Grossman E, Hanson A, Hess JJ, Hoppe B, Horton J, Jagger M, Krueger S, Largo TW,
Losurdo GM, Mack SR, Moran C, Mutnansky C, Raab K, Saha S, Schramm PJ, Shipp-Hilts A, Smith
SJ, Thelen M, Thie L, Walker R. BRACE Midwest and Southeast Community of Practice. 2017.
Climate and Health Intervention Assessment: Evidence on Public Health Interventions to Prevent the
Negative Health Effects of Climate Change. Climate and Health Technical Report Series. available
from: https://www.cdc.gov/climateandhealth/guidance.htm
Balter S, Weiss D, Hanson H, Reddy V, Das D, Heffernan R. Three years of emergency department
gastrointestinal syndromic surveillance in New York City: what have we found? MMWR 2005;Suppl
54:175-80.
Beard CB, Eisen RJ, Barker CM, Garofalo JF, Hahn M, Hayden M, Monaghan AJ, Ogden NH, Schramm
PJ, 2016: Ch. 5: Vectorborne Diseases. In: Crimmins A, Balbus JL, Gamble CB, Bear JE, Bell D, et
al. eds. The Impacts of Climate Change on Human Health in the United States: A Scientific
Assessment. U.S. Global Change Research Program, Washington, DC, 129–156.
http://dx.doi.org/10.7930/J0765C7V
Berger M, Shiau R, Weintraub JM. Review of syndromic surveillance: implications for waterborne disease
detection. Journal of epidemiology and community health. 2006;60(6):543-50. Epub 2006/05/16. doi:
10.1136/jech.2005.038539.

37
Berry M, Fagliano J, Tsai S, McGreevy K, Walsh A, Hamby T. Evaluation of Heat-related Illness
Surveillance Based on Chief Complaint Data from New Jersey Hospital Emergency Rooms. Online
Journal of Public Health Informatics. 04/04 2013;5(1):e125.
Borjan M, Lumia M. Evaluation of a state based syndromic surveillance system for the classification and
capture of non-fatal occupational injuries and illnesses in New Jersey. Am J Ind Med. 2017; May 23.
doi: 10.1002/ajim.22734.
Borjan M. (b) Evaluation of a State Based Syndromic Surveillance System for the Classification and
Capture of Non-Fatal Occupational Injuries and Illnesses. Oral presentation at the Council of State
and Territorial Epidemiologist Annual Conference; June 2017; Boise Idaho
Borroto R, Williamson B, Pitcher P, Ballester L, Smith W, Soetebier K, Drenzek C. Using Syndromic
Surveillance for Situational Awareness During Hurricane Matthew, Georgia October 2016. Poster
presented at: 2017 Counsel of State and Territorial Epidemiologist Annual Conference; June 2017;
Boise, ID
Buescher PA. Problems with Rates Based on Small Numbers. Statistical Primer No. 12. 2008. State
Center for Health Statistics. North Carolina Department of Health and Human Services. Raleigh, NC
Burkom HS, Elbert Y, Feldman A, Lin J. Role of data aggregation in biosurveillance detection strategies
with applications from ESSENCE. MMWR supplements. 2004;53:67-73. Epub 2005/02/18. PubMed
PMID: 15714632.
Burkom HS, Elbert Y, Magruder SF, Najmi AH, Peter W, Michael WT. Developments in the roles,
features, and evaluation of alerting algorithms for disease outbreak monitoring. Johns Hopkins APL
Technical Digest. 2008;27(313).
Center for Disease Control and Prevention (CDC) 2009. Summary of the Making Green Jobs Safe
Workshop. Available at: https://www.cdc.gov/niosh/topics/ptd/workshop.html Accessed May 17, 2017
Center for Disease Control and Prevention (CDC), National Syndromic Surveillance Program (NSSP).
NSSP Participation. NSSP Update. May 2017, Available from: https://www.cdc.gov/nssp/news-
archives.html Accessed on 6/9/2017
Center for Disease Control and Prevention (CDC), PHIN Messaging Guide for Syndromic Surveillance:
Emergency Department, Urgent Care, Inpatient and Ambulatory Care Settings, Release 2.0 (April 21,
2015). https://www.cdc.gov/phin/resources/phinguides.html#SS. Accessed December 2, 2016.
Center for Disease Control and Prevention (CDC). Beyond the Brochure Alternative Approaches to
Effective Health Communication. 1994. Available from:
https://www.cdc.gov/cancer/nbccedp/pdf/amcbeyon.pdf
Center for Disease Control and Prevention (CDC). Infectious disease and dermatologic conditions in
evacuees and rescue workers after hurricane Katrina - multiple states, August-September, 2005.
MMWR. 2005;54:961-4. https://www.cdc.gov/mmwr/preview/mmwrhtml/mm5438a6.htm
Center for Disease Control and Prevention (CDC). Monitoring health effects of wildfires using the
biosense system--San Diego County, California, October 2007. MMWR Morb Mortal Wkly Rep.
2008;57(27):741-4. Epub 2008/07/11. PubMed PMID: 18614992.
38
Center for Disease Control and Prevention (CDC). NSSP ESSENCE In-person training workshop. 2016.
Accessed July 31, 2017: www.cdc.gov/nssp/documents/essence-training-presentation-phi-
conference.pdf (Presented at the 2016 Public Health Informatics Conference)
Centers for Disease Control and Prevention (CDC). 2017. BioSense Platform. Accessed March 22, 2017:
https://www.cdc.gov/nssp/biosense.
Chugtai S, DeVore K, Kan L, Streichert LC. Assessment of local health department utility of syndromic
surveillance: Results of the 2015 biosurveillance needs assessment survey. J Public Health Manag
Pract 2016;22 (6 Supp):S69-S74.
Coates RJ, Perez A, Baer A, Zhou H, English R, Coletta M, Dey A. National and Regional
Representativeness of Hospital Emergency Department Visit Data in the National Syndromic
Surveillance Program, United States, 2014. Disaster Med Public Health Prep 2016;10 (4):562-9. doi:
10.1017/dmp.2015.181.
Council of State and Territorial Epidemiologist (CSTE) Heat Syndrome Workgroup. Heat-related illness
syndrome query: Guidance document for implementing heat-related illness syndromic surveillance in
public health practice. 2016. Available from http://www.cste.org/group/ClimateChange. Accessed
February 27, 2017
Crimmins A, Balbus J, Gamble JL, Beard CB, Bell JE, Dodgen D, Eisen RJ, et al. Eds. The Impacts of
Climate Change on Human Health in the United States: A Scientific Assessment. U.S. Global Change
Research Program, Washington, DC, 312 pp. Available from: http://dx.doi.org/10.7930/J0R49NQX
DeVore K, Chugtai S, Kan L, Streichert LC. Workforce competencies in syndromic surveillance practice at
local health departments. J Public Health Manag Pract 2016;22 (6 Supp):S75-S80.
Elliot AJ, Hughes HE, Astbury J, Nixon G, Brierley K, Vivancos R, Inns T, et al. The potential impact of
media reporting in syndromic surveillance: an example using a possible Cryptosporidium exposure in
North West England, August to September 2015. Euro Surveill 2016;21 (41). doi: 10.2807/1560-
7917.ES.2016.21.41.30368.
Elliot AJ, Singh N, Loveridge P, Harcourt S, Smith S, Pnaiser R, et al. Syndromic surveillance to assess
the potential public health impact of the Icelandic volcanic ash plume across the United Kingdom,
April 2010. Euro surveillance : bulletin Europeen sur les maladies transmissibles = European
communicable disease bulletin. 2010;15(23). Epub 2010/06/16. PubMed PMID: 20546694.
English PB, Sinclair AH, Ross Z, Anderson H, Boothe V, Davis C., et al. Environmental health indicators
of climate change for the United States: findings from the State Environmental Health Indicator
Collaborative. Environ Health Perspect. 2009;117(11):1673-81. PMID: 20049116.
Fangman MT, Samoff E, DiBiase L, MacDonald PD, and Waller A. Routine dissemination of summary
syndromic surveillance data leads to greater usage at local health departments in North Carolina. J
Public Health Epidemiol 2015;7 (1). doi: 10.5897/JPHE2013.0546.
Fayard GM. Fatal Work Injuries Involving Natural Disasters, 1992-2006. Disaster Med Public Health Prep.
2009 Dec;3(4):201-9.
Feinerer I, Hornik K, Meyer D. Text Mining Infrastructure in R. Journal of Statistical Software 2008;25(5):
1-54. URL: http://www.jstatsoft.org/v25/i05/.
39
Frumkin H, Hess J, Luber G, Malilay J, McGeehin M. Climate Change: The Public Health Response.
American Journal of Public Health. 2008;98(3):435-445. doi:10.2105/AJPH.2007.119362.
Guasticchi, G., P. Giorgi Rossi, G. Lori, S. Genio, F. Biagetti, S. Gabriele, P. Pezzotti, and P. Borgia.
2009. Syndromic surveillance: sensitivity and positive predictive value of the case definitions.
Epidemiol Infect 137 (5):662-71. doi: 10.1017/S0950268808001374.
Hall HI, Correa A, Yoon PW, Braden CR; Centers for Disease Control and Prevention. Lexicon,
definitions, and conceptual framework for public health surveillance. MMWR Suppl. 2012 Jul
27;61(3):10-4.
Hambach R, Droste J, François G, et al. Work-related health symptoms among compost facility workers:
a cross-sectional study. Archives of Public Health. 2012;70(1):13.
Harduar Morano L, Waller A. Incorporating Weather Data into a Syndromic Surveillance System. Poster
presented at: 2016 Public Health Informatics Conference; August 2016; Atlanta, GA (Available at
http://www.eventscribe.com/2016/posters/NACCHOInformatics/SplitViewer.asp?PID=Mzg2NDg2MDI
yNA Accessed 6/26/2017)
Heffernan R, Mostashari F, Das D, Karpati A, Kulldorff M, Weiss D. Syndromic Surveillance in Public
Health Practice, New York City. Emerging Infectious Diseases. 2004;10(5):858-864.
Hess JJ, Heilpern KL, Davis TE, Frumkin H. Climate change and emergency medicine: impacts and
opportunities. Acad Emerg Med. 2009 Aug;16(8):782-94.
Hess JJ, McDowell JZ, Luber G. Integrating Climate Change Adaptation into Public Health Practice:
Using Adaptive Management to Increase Adaptive Capacity and Build Resilience. Environmental
Health Perspectives. 2012;120(2):171-179. doi:10.1289/ehp.1103515.
Hess JJ, Saha S, Schramm PJ, Conlon KC, Uejio CK, Luber G. Projecting Climate-Related Disease
Burden: A Guide for Health Departments. 2015. Climate and Health Technical Report Series, Climate
and Health Program, Centers for Disease Control and Prevention. available from:
https://www.cdc.gov/climateandhealth/guidance.htm
Hope K, Durrheim DN, d'Espaignet ET, Dalton C. Syndromic Surveillance: is it a useful tool for local
outbreak detection? J Epidemiol Community Health. 2006 May;60(5):374-5.
Human Impact Partners (HIP). A Health Impact Assessment Toolkit: A Handbook to Conducting HIA, 3rd
Edition. Oakland, CA: Human Impact Partners. February 2011.
ICD-10-CM : international classification of diseases 10th revision : clinical modification diagnosis coding
system, 2014. Los Angles, California: PMIC (Practice Management Information Corporation); 2013.
ISBN-10: 1939852021
International Society for Disease Surveillance (ISDS). Electronic Syndromic Surveillance Using Hospital
Inpatient and Ambulatory Clinical Care Electronic Health Record Data: Recommendations from the
ISDS Meaningful Use Workgroup. 2012. Available online:
http://www.syndromic.org/storage/ISDS_2012-MUse-Recommendations.pdf. Accessed March 22,
2017
Joffe M, Mindell J. Complex Causal Process Diagrams for Analyzing the Health Impacts of Policy
Interventions. American Journal of Public Health. 2006;96(3):473-479.
40
Josseran L, Fouillet A, Caillere N, Brun-Ney D, Ilef D, Brucker G, et al. Assessment of a syndromic
surveillance system based on morbidity data: results from the Oscour network during a heat wave.
PloS one. 2010;5(8):e11984. Epub 2010/08/17. doi: 10.1371/journal.pone.0011984.
Joyce LA, Running SW, Breshears DD, Dale VH, Malmsheimer RW, Sampson RN, Sohngen B, Woodall
CW. Ch. 7: Forests. In: Melillo JM, Richmond TC, Yohe GW, eds. Climate Change Impacts in the
United States: The Third National Climate Assessment, p19-67, U.S. Global Change Research
Program; 2014. p175-194.
Kintziger KW, Jagger MA, Conlon KC, Bush KF, Haggerty B, Harduar-Morano L, Lane K, Roach M, Thie
L, Uejio CK. BRACE Methods Community of Practice. 2017. Technical Documentation on Exposure-
Response Functions for Climate-Sensitive Health Outcomes. Climate and Health Technical Report
Series. Climate and Health Program, Centers for Disease Control and Prevention. available from:
https://www.cdc.gov/climateandhealth/guidance.htm
Kuhn K, Campbell-Lendrum D, Haines A, Cox J. Using Climate to predict infectious disease outbreaks: a
review (WHO/SDE/OEH/04.01). World Health Organization; Geneva, Switzerland. 2004. Available
from: http://www.who.int/globalchange/publications/oeh0401/en/ Accessed on June 9, 2017.
Lane K, Charles-Guzman K, Wheeler K, Abid Z, Graber N, Matte T. Health Effects of Coastal Storms and
Flooding in Urban Areas: A Review and Vulnerability Assessment. Journal of Environmental and
Public Health. 2013; vol. 2013: Article ID 913064 doi:10.1155/2013/913064
Lane K. Syndromic Surveillance of Heat Illness in NYC. Oral presentation at National Heat-Health
Surveillance Expert Workshop; March 17-18, 2015; New York City, NY. Available online:
https://www.nrdc.org/sites/default/files/hea_15050501g.pdf. Accessed on 6/13/2017
Lantz, B. Machine Learning with R: Discover How to Build Machine Learning Algorithms, Prepare Data,
and Dig Deep into Data Prediction Techniques with R. Birmingham: Packt Pub.2015.
Leonardi GS, Hajat S, Kovats RS, Smith GE, Cooper D, Gerard E. Syndromic surveillance use to detect
the early effects of heat-waves: an analysis of NHS direct data in England. Soz Praventiv Med.
2006;51(4):194-201. Epub 2006/12/30. PubMed PMID: 17193781.
Luber G., Knowlton K, Balbus J, Frumkin H, Hayden M, Hess J, McGeehin M, et al. Ch. 9: Human
Health. In: Melillo JM, Richmond TC, Yohe GW, eds. Climate Change Impacts in the United States:
The Third National Climate Assessment, p220-256, U.S. Global Change Research Program; 2014
Manangan AP, Uejio CK, Saha S, Schramm PJ, Marinucci GD, Brown CL, Hess JJ, and Luber G.
Assessing health vulnerability to climate change: A guide for health departments. 2014. Climate and
Health Technical Report Series, Climate and Health Program, Centers for Disease Control and
Prevention. Available from:
http://wwwdev.cdc.gov/climateandhealth/pubs/AssessingHealthVulnerabilitytoClimateChange.pdf
Manning CD, Raghavan P, Schütze H. The term vocabulary and posting lists (Chapter 2) in Introduction
to Information Retrieval, New York, NY: Cambridge University Press, 2008 (The sub-section on
tokenization is available at: https://nlp.stanford.edu/IR-book/html/htmledition/tokenization-1.html
accessed 5/1/2017)

41
Maricopa County Department of Public Health (MC DPH), Heat-Associated Deaths in Maricopa County,
AZ Final Report for 2016. (2016). Retrieved from
http://www.maricopa.gov/ArchiveCenter/ViewFile/Item/3084
Massoudi, B. L., K. Chester, and G. H. Shah. Public Health Staff Development Needs in Informatics:
Findings From a National Survey of Local Health Departments. J Public Health Manag Pract. 2016;
22 Suppl 6, Public Health Informatics:S58-S62. doi: 10.1097/PHH.0000000000000450.
Mathes RW, Ito K, Matte T. Assessing Syndromic Surveillance of Cardiovascular Outcomes from
Emergency Department Chief Complaint Data in New York City. Miranda JJ, ed. PLoS ONE.
2011;6(2):e14677. doi:10.1371/journal.pone.0014677.
May L, Chretien JP, Pavlin JA. Beyond traditional surveillance: applying syndromic surveillance to
developing settings--opportunities and challenges. BMC public health. 2009;9:242. Epub 2009/07/18.
doi: 10.1186/1471-2458-9-242.
Melillo JM, Richmond TC, Yohe GW. Eds., Climate Change Impacts in the United States: The Third
National Climate Assessment. U.S. Global Change Research Program, 841 pp. 2014.
doi:10.7930/J0Z31WJ2. Available at: http://www.globalchange.gov/browse/reports/climate-change-
impacts-united-states-third-national-climate-assessment-0 Accessed: June 9, 2017
Merkord CL, Liu Y, Mihretie A, Gebrehiwot T, Awoke W, Bayabil E, et al. Integrating malaria surveillance
with climate data for outbreak detection and forecasting: the EPIDEMIA system. Malaria journal.
2017;16(1):89. Epub 2017/02/25. doi: 10.1186/s12936-017-1735-x.
Miniño AM, Murphy SL, Xu JQ, Kochanek KD. Deaths: Final data for 2008. National vital statistics reports;
vol 59 no 10. Hyattsville, MD: National Center for Health Statistics. 2011. (See to the Technical Notes
section)
Moulton AD, Schramm PJ. Climate Change and Public Health Surveillance: Toward a Comprehensive
Strategy. J Public Health Manag Pract. 2017 Feb 6.
National Institute for Occupational Safety and Health (NIOSH). Impact of Climate on Workers,
Occupational Safety and Health and Climate, Workplace Safety and Health Topics. Center for
Disease Control website: https://www.cdc.gov/niosh/topics/climate/how.html Updated December 6,
2016. Accessed April 28, 2017
National Institute of Environmental Health Sciences (NIEHS). Climate Change and Human Health. 2016.
Research Triangle Park, NC. Available at:
https://www.niehs.nih.gov/health/materials/climate_change_and_human_health_508.pdf Accessed
June 9, 2017
National Institutes of Health (NIH). Making Health Communication Programs Work. National Cancer
Institute [Internet]. 2004. Available from: https://www.cancer.gov/publications/health-
communication/pink-book.pdf
O'Connell EK, Zhang G, Leguen F, Llau A, Rico E. Innovative uses for syndromic surveillance. Emerg
Infect Dis. 2010;16(4):669-71. doi: 10.3201/eid1604.090688.
Pascal M, Viso AC, Medina S, Delmas MC, Beaudeau P. How can a climate change perspective be
integrated into public health surveillance? Public Health. 2012 Aug;126(8):660-7.

42
Perry AG, Korenberg MJ, Hall GG, Moore KM. Modeling and syndromic surveillance for estimating
weather-induced heat-related illness. Journal of environmental and public health. 2011;2011:750236.
Epub 2011/06/08. doi: 10.1155/2011/750236
Porta M, ed. A Dictionary of Epidemiology. 5th ed. New York, NY: Oxford University Press; 2008.
Pucher J, Dijkstra L. Promoting Safe Walking and Cycling to Improve Public Health: Lessons From The
Netherlands and Germany. American Journal of Public Health. 2003;93(9):1509-1516.
Pucher J, Dill J, Handy S. Infrastructure, programs, and policies to increase bicycling: an international
review. Prev Med. 2010 Jan;50 Suppl 1:S106-25.
Rappold AG, Stone SL, Cascio WE, Neas LM, Kilaru VJ, Carraway MS, et al. Peat bog wildfire smoke
exposure in rural North Carolina is associated with cardiopulmonary emergency department visits
assessed through syndromic surveillance. Environmental health perspectives. 2011;119(10):1415-20.
Epub 2011/06/28. doi: 10.1289/ehp.1003206.
Samoff E, Fangman MT, Hakenewerth A, Ising A, Waller AE. Use of syndromic surveillance at local
health departments: movement toward more effective systems. J Public Health Manag Pract.
2014;20(4):E25-30. doi: 10.1097/PHH.0b013e3182a505ac.
Schulte PA, Bhattacharya A, Butler CR, et al. Advancing the framework for considering the effects of
climate change on worker safety and health. Journal of Occupational and Environmental Hygiene.
2016;13(11):847-865
Schulte PA, Chun H. Climate change and occupational safety and health: establishing a preliminary
framework. J Occup Environ Hyg. 2009;6(9):542–554.
Shapiro AR. Taming variability in free text: application to health surveillance. MMWR 2004;Suppl 53:95-
100.
Tinling MA, West JJ, Cascio WE, Kilaru V, Rappold AG. Repeating cardiopulmonary health effects in rural
North Carolina population during a second large peat wildfire. Environmental Health. 2016;15:12.
doi:10.1186/s12940-016-0093-4.
Travers D, Barnett C, Ising A, Waller A. Timeliness of Emergency Department Diagnoses for Syndromic
Surveillance. AMIA Annual Symposium Proceedings. 2006;2006:769-773.
Tsai S, Hamby T, Chu A, Gleason JA, Goodrow GM, Gu H, Lifshitz E, Fagliano JA. Development and
Application of Syndromic Surveillance for Severe Weather Events Following Hurricane Sandy.
Disaster Med Public Health Prep. 2016 Jun;10(3):463-71.
Walsh J, Wuebbles D, Hayhoe K, Kossin J, Kunkel K, Stephens G, et al. Ch. 2: Our Changing Climate. In:
Melillo JM, Richmond TC, Yohe GW, eds. Climate Change Impacts in the United States: The Third
National Climate Assessment, p19-67, U.S. Global Change Research Program; 2014
Woodruff RE, Guest CS, Garner MG, Becker N, Lindsay M. Early warning of Ross River virus epidemics:
combining surveillance data on climate and mosquitoes. Epidemiology. 2006;17(5):569-75. Epub
2006/07/14. doi: 10.1097/01.ede.0000229467.92742.7b.
World Health Organization. Health in the Green Economy - Occupational Health. 2014. Available at:
http://www.who.int/hia/green_economy/hgebrief_occ.pdf?ua=1. Accessed May 17, 2017.

43
Yoon PW, Ising AI, Gunn JE. Syndromic Surveillance: The value of real-time data for public health action.
Public Health Reports Volume 132, Issue 1 suppl, July/August 2017.
Zegeer CV, Bushell M. Pedestrian crash trends and potential countermeasures from around the world.
Accid Anal Prev. 2012 Jan;44(1):3-11.

44
APPENDIX A
NC Heat Report

| Heat Illness Weekly Report publichealth.nc.gov/chronicdiseaseandinjury/heat.htm
May 2017
Key Points Approximately 43 emergency department visits for heat-related illness were
observed Daily maximum heat indices ranged from 75.9°F to 93.3°F (median =
78.1°F) at Raleigh-Durham International Airport (RDU) Common references in emergency department visit notes were for working
outdoors (e.g., painting, roofing) and recreation (e.g., yard work, going to the beach, outdoor entertainment events).
Season to Date (May 2017)
Approximately 266 heat-related illnesses have been identified in emergency department visit records (figure 1)
79% of illness was among males, mostly aged 25-64 (figure 2) Regional Data
54% of all visits were seen in hospitals in the Piedmont region 13% of all visits were seen in hospitals in the Sandhills sub-region1
Figure 1. Emergency department visits for heat-related illness and daily maximum heat index (RDU airport), 5/1/17 to 5/27/17, North Carolina.
1The Sandhills sub-region is comprised of the following counties from the Piedmont and Coastal regions: Bladen, Cumberland, Harnett, Hoke, Lee, Montgomery, Moore, Richmond, Robeson, and Scotland.
North Carolina Heat Report May 21-27, 2017

| Heat Illness Weekly Report publichealth.nc.gov/chronicdiseaseandinjury/heat.htm
May 2017
Figure 2. Emergency department visits for heat-related illness by age group, 5/1/17 to 5/27/17, North Carolina.
Table 1. Emergency department visits for heat-related illness by age group, 5/21/17 to 5/27/17, North Carolina.
N (%) Sex
Male 34 (79)
Female 9 (21)
Age Group (yrs) 0-14 <5 --
15-18 <5 --
19-24 <5 --
25-44 16 (37)
45-64 14 (33)
65+ 8 (19)
NOTE: Counts and percentages are not reported when the total number of emergency department visits is less than 5
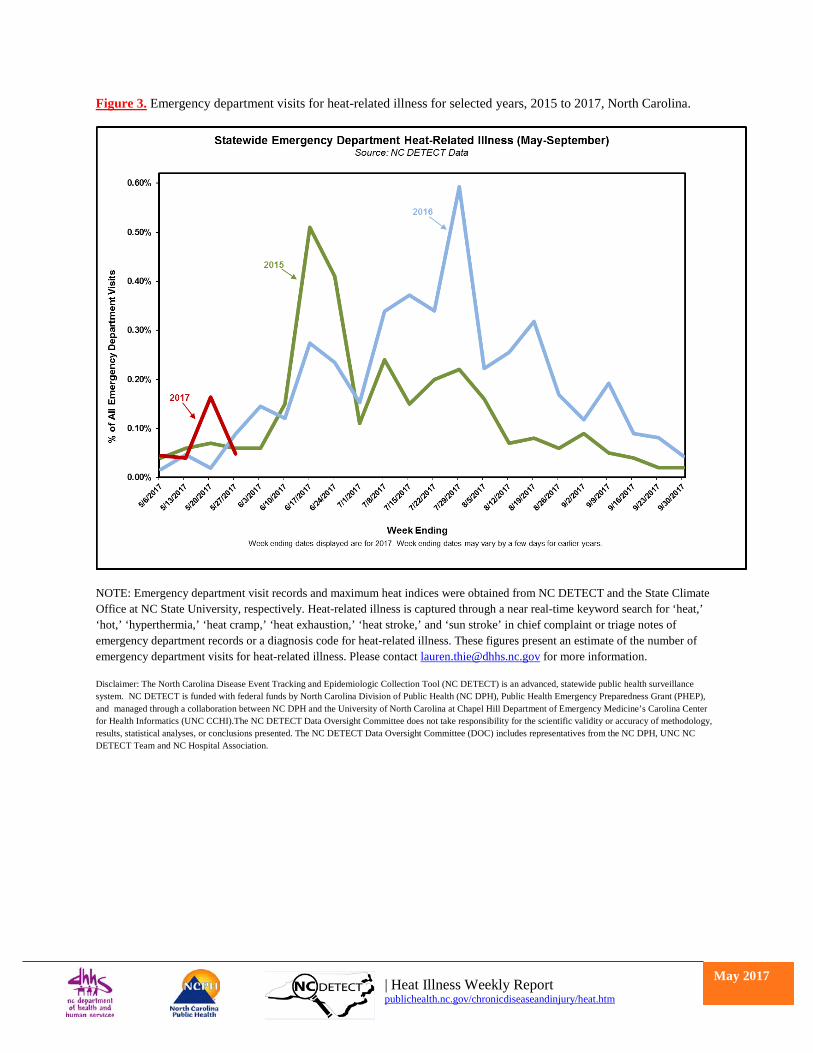
| Heat Illness Weekly Report publichealth.nc.gov/chronicdiseaseandinjury/heat.htm
May 2017
Figure 3. Emergency department visits for heat-related illness for selected years, 2015 to 2017, North Carolina.
NOTE: Emergency department visit records and maximum heat indices were obtained from NC DETECT and the State Climate Office at NC State University, respectively. Heat-related illness is captured through a near real-time keyword search for ‘heat,’ ‘hot,’ ‘hyperthermia,’ ‘heat cramp,’ ‘heat exhaustion,’ ‘heat stroke,’ and ‘sun stroke’ in chief complaint or triage notes of emergency department records or a diagnosis code for heat-related illness. These figures present an estimate of the number of emergency department visits for heat-related illness. Please contact [email protected] for more information.
Disclaimer: The North Carolina Disease Event Tracking and Epidemiologic Collection Tool (NC DETECT) is an advanced, statewide public health surveillance system. NC DETECT is funded with federal funds by North Carolina Division of Public Health (NC DPH), Public Health Emergency Preparedness Grant (PHEP), and managed through a collaboration between NC DPH and the University of North Carolina at Chapel Hill Department of Emergency Medicine’s Carolina Center for Health Informatics (UNC CCHI).The NC DETECT Data Oversight Committee does not take responsibility for the scientific validity or accuracy of methodology, results, statistical analyses, or conclusions presented. The NC DETECT Data Oversight Committee (DOC) includes representatives from the NC DPH, UNC NC DETECT Team and NC Hospital Association.