synchrotron radiation infrared and raman spectroscopy … radiation infrared and raman spectroscopy...
TRANSCRIPT

Synchrotron Radiation Infrared and Raman Spectroscopy for Biomedical Applications
Christian Bortolini1,2 and Mingdong Dong1
1 Interdisciplinary Nanoscience Center (iNANO), Gustav Wieds 14, Building 1590, Aarhus C., Denmark
2 National Center for Nanoscience and Technology (NCNST), No. 11, Beiyitiao Zhongguancun, Beijing, P. R. China
Over the last few decades, infrared (IR) spectroscopy has been recognized as a useful tool to obtain quantitative and qualitative information on IR active materials and bio-materials, with particular emphasis to polymer chemistry and organic chemistry. Nowadays, thanks to technological evolution, the possibilities offered by vibrational spectroscopy (e.g. IR and Raman spectroscopy) are much broader, the most promising being strongly connected to modern medicine demands in clinical and laboratory diagnosis. The scientific base of these techniques relies on measurement of the natural vibrational frequencies of the atomic bonds in molecules, which mainly depends on structural parameters. The aim of this chapter is to describe the state of the art of Synchrotron Radiation Fourier Transform Infrared spectroscopy (SR-FTIR) and Raman micro-spectroscopy applied to biomedical samples (e.g. in-vivo and ex-vivo studies on human tissues and tumor cells). For completeness, sample preparation and other complementary techniques are presented.
Keywords: synchrotron radiation; infrared spectroscopy; Raman micro-spectroscopy; tissue; tumor cells; AFM-IR.
1. Introduction
Spectroscopic methods are based on energy absorption/emission by atoms and molecules that reach an excited state [1]. The resulting excitation mode (e.g. spin, electronic, vibrational) depends on the quantity of energy involved [2]. In particular, Infrared (IR) spectroscopy utilizes the region of electromagnetic spectrum included between 780 nm and 1000 μm. The interaction between molecules and electromagnetic radiation leads to vibrational transitions, i.e. the vibrational energy of two bonded atoms changes. Vibrational energy (frequency) is directly related to the strength of the bond involved in the transition, thus it is convenient to divide the IR region into three regions:
- Near-IR region (NIR): from 780 nm to 2500 nm (2.5 μm) - Mid-IR region (MIR): from 2.5 μm to 25 μm - Far-IR region (FIR): from 25 μm to about 1000 μm
In the IR community, it is customary to employ the reciprocal of the wavelength, called wavenumber (ῦ), instead of the frequency or wavelength. The wavenumber, having cm-1 as unit, is the number of waves in a unit length. Thus, its formula can be expressed as follows: = / = 1/ῦ . For biomedical studies, MIR spectroscopy (4000 to 400 cm-1) is the most relevant, providing precious information about protein secondary structure and composition and identifying specific molecular vibrations. In particular, the portion of the MIR spectrum between 1500 cm-1 and 400 cm-1, known as the fingerprint region, enables to distinguish between vibrational modes arising from quite similar molecules, which ultimately allows to probe, for instance, the polymorphic form, crystallinity and characteristic features of tissues [3, 4] and cells [5-7] (e.g. distinguish tumor cells from healthy ones [8], or keratinized tissue and cancer tissue from the normal one [9-13]). NIR spectroscopy is not as widely used as a molecular characterization tool, since bands are broader and generally the signal is weaker. However, some advantages of NIR compared with MIR, such as higher Signal-to-Noise Ratio (SNR) and easier sample preparation, can be exploited in certain specific areas, for example in the pharmaceutical industry. FIR spectroscopy, thanks to instrumentations working in the frequency range of terahertz (THz), has experienced potential application in security devices [14, 15]. Complementary to IR spectroscopy (especially MIR spectroscopy), Raman spectroscopy is a useful tool to investigate biochemical systems and an especially promising one for clinical diagnostic applications (see Section 4 for details). It is worth to note that IR and Raman spectra are produced as a consequence of transitions between quantized vibrational energy states, which only occur if certain requirements are met (selection rules). In order to produce an IR absorption band there must be a change in the molecule dipole moment during the specific molecular vibration involved in the process. The intensity of the resulting absorption band is directly related and proportional to the magnitude of this dipole moment change. The bands that are theoretically observable in IR spectra are in practice reduced due to several limitations: (1) some fundamental bands are simply too weak to be detected, (2) two bands may be too close to each other, so that it is not possible to identify the individual contributions, (3) the amplitude of some bands might be suppressed because of selection rules (e.g. lack of dipole momentum change). On the other hand, in some cases (e.g. two bands of interest overlap each other) it may be helpful to observe the presence of overtones, i.e. multiples of a specific frequency which in itself might be difficult to detect due to above mentioned limitations.
Microscopy: advances in scientific research and education (A. Méndez-Vilas, Ed.)
© FORMATEX 2014
__________________________________________________________________
545

Summarizing, an IR spectrum is like a fingerprint of a sample, with absorption peaks corresponding to the frequencies of vibrations between the individual atoms in the material. Since each different material is a unique combination of atoms, the production of an exact same IR spectrum is not possible. Thus, IR spectroscopy can be employed for the qualitative analysis of different types of samples. The absorption band amplitudes in the spectrum is also a direct indication of the amount of material present.
2. IR synchrotron radiation
2.1 Introduction: advantages over conventional IR sources
IR spectroscopy and microscopy have some limits in the chemical composition analysis of cells and tissue sections, which are the most widely studied biomedical relevant systems. The main problem concerns the IR beam size which possesses very limited spatial resolution and degraded SNR. In order to improve these parameters, conventional IR sources might be replaced with Synchrotron Radiation (SR) ones. The main advantages of using a synchrotron facility as infrared source instead of a conventional source (e.g. GlobarTM, Nernst lamp) are as follows:
• IR photons are collimated into a narrow transverse area, i.e. divergence is very low, resulting in a much brighter light – thus, a higher brilliance, defined as photon flux density (photons/s/mA/mrad horizontal 0.1% bandwidth) taking into account the electron beam divergence, the opening radiation angle and the electron beam source size (flux/mrad vertical/mm2).
• Despite the synchrotron source being in itself brighter, its intensity is lower in the mid-IR (4000 to 400 cm1), which allows to reduce the aperture and lower radiation damage (crucial for in-vivo studies).
• In the far-IR region (400 to 10 cm-1) light is more intense than conventional sources – useful in many far-IR studies.
Being the SR brilliance at least two orders of magnitude higher than conventional IR sources, spatial resolution is enhanced, whereas the SNR is kept very high. Resulting spectra will thus exhibit a very high lateral resolution, reaching even smaller scales than cell size in a very limited amount of time – this is desirable, in that a lower exposition to radiation corresponds to lower radiation damage to the biological sample. In addition, SR is a continuous radiation source, so that photons of all energies are simultaneously available for time-resolved spectroscopy, from the far-IR to the X-ray region. Another important parameter that needs to be considered is beam collimation. The brilliance of SR is not constant in the entire energy domain of emission, because it is determined by the combined effect of the horizontal and vertical collection angle and the natural beam divergence θnat. In the IR domain, θnat is much larger than in the UV or X regions and depends on the photon wavelength λ through the relation: = 1.66( ⁄ ) (1) where φ is the curvature radius of the electron trajectory [16]. The major aim of Fourier Transform IR (FTIR) microscopy, in particular when using a SR source, is to achieve the best spatial resolution, i.e. reach the micrometric scale. Therefore, the effort to reach the diffraction limit paved the way for several studies, such as single cells [7, 17], complex tissues [18], characterization of physiological status of a sample [19] to sophisticated disease pattern recognition. Moreover, it is worth considering the main advantages of IR spectroscopy compared with other techniques that are able to reach the micrometric scale:
• Non-ionizing radiation is used (vs. X-ray absorption spectroscopy). • Almost negligible damage to samples under analysis (vs. Raman spectro-microscopy). • Unique technique for the aim of microanalysis thanks to its high spatial resolution and the physical-chemical
identification of the molecular components via their vibration fingerprint. • No need of using stains or fluorescent compounds: IR microscopy achieves contrast via the intra-molecular
vibrational modes. However, SR-IR experiences some limitations mainly due to instrumental issues and sample suitability. Samples may be too thick (e.g. teeth, bones, or some soft tissues) [18, 20] or too dense (e.g. hard tissues) which absorption signal is too high and difficult to analyze – combined with lack of sensitivity of detectors.
2.2 Basic properties of SR-IR
Light from a SR source arises from the acceleration of a beam of relativistic charged particles in a synchrotron storage ring. The storage ring role is to bend and focus the beam in a circular orbit by means of magnets. During this process, charged particles lose some energy due to scattering events – the storage ring needs to be regularly replenished. For IR spectroscopy, two kinds of sources are employed: the dipole bend source, in which light is produced by charged
Microscopy: advances in scientific research and education (A. Méndez-Vilas, Ed.)
© FORMATEX 2014
__________________________________________________________________
546
particles being accelerated transversely along their orbit inside magnets, and the edge radiation source, which consists of light emitted in the transition between a straight and a curved trajectory at the entrance of a bending magnet’s field. The major limit to the source beam size is due to the large scattering of a diffraction-limited system, rather than the physical beam sizes. When diffraction-limited, the Root Mean Square (RMS) source dimensions are: ~1.6( ) / (2) ~ (3) where σbend is the bend source, σedge is the edge source, λ is the wavelength of interest, φ is the bend radius in the dipole magnet and γ = 1957E (where E is the electron energy in GeV) is the relativistic mass enhancement factor. The RMS half-angles for emission are: ~0.6( ) / (4) ~1 (5) where θbend is the half-angle of bend source, θedge is the half angle of edge source. It should be noted that the dipole bend emission angle at λ = 10 μm is 11 mrad, while for edge radiation the emission angle is below 0.1 mrad. A typical IR micro-spectrometer is a Fourier interferometer equipped with a microscope and a detector [21]. The latter is usually a Single Element Detector (SED), nonetheless, more sophisticated detectors made of several small detector elements disposed in a 2D grid have recently been developed [22, 23].
2.3 Applications and clinical point of view
The challenging goal of combining vibrational spectroscopies and clinical needs requires a clear understanding of the potential that each vibrational technique carries, in view of its prospective real applications. Therefore, understanding the specific peculiarities of IR and Raman micro-spectroscopies is a critical point. From a biochemical point of view, it is worth to notice that several diseases change the biochemical composition of the region they affect: this fact can be exploited for diagnosis. For biomedical related issues regarding sample preparation and availability, it would be convenient – and much easier – to employ not only tissues and cells, but also fluids (e.g. blood, plasma, saliva, urine) when searching for potential threats with vibrational techniques [24]. Furthermore, the capability of imaging in-vivo is crucially important for clinical diagnosis. What are the clinical needs that vibrational spectroscopy can contribute to?
• Screening – can vibrational techniques provide an inexpensive, reliable and possibly non-invasive way of performing the screening?
• Diagnosis – can the disease be detected through vibrational methods? Can we obtain information about the stage of the disease?
• Intra- and post-operative monitoring – has the cancer been fully removed? Is the treatment working? • Follow-up – has the disease returned?
Further important features of IR spectroscopy involve the fact that chemical reagents or staining are not required during sample preparation. Furthermore, being IR photons low-frequency (i.e. low energy), radiation damage is extremely low, almost negligible, so that in-vivo experiments are possible. The ultimate goal is to establish a protocol for a routine analysis and clinical diagnosis of diseases like tumors. Several investigations concerning the analysis of living cells by FTIR have been performed with SR sources [7, 25-30]. A fascinating perspective is the detection of lung cancer (one of the most difficult tumors to treat and diagnose) through breath analysis – an interesting study reveals that early-stage tumors release volatile biomarkers [31] into the breath at measurable levels [32]. Other similar SR-FTIR studies focused on oral cancer tissues [33] and prostate cancer [34, 35]. Raman micro-spectroscopy showed its potential in the analysis of atheromatous plaques performed in-vivo [36]: the difference between healthy vascular tissues and tissues whose chemical composition had changed could be detected (for instance, by observing the increase in stiffness and the related risk of developing vascular diseases) [37]. On the other hand, the intensity and exposure time of the Raman beam have to be low to avoid any damage to the in-vivo tissues exposed to the laser [38-40]. Another aspect that has to be considered is the not ideal morphology of the bio-samples: single cells and tissues do not possess a flat surface, which results in an enhancement of scattering events (see Section 2.2) [41-45]. Scattered IR photons will not reach the detector and their information will be lost: spectra characterized by large scattering present distortions and their interpretation and reliability may be very challenging [46, 47].
Microscopy: advances in scientific research and education (A. Méndez-Vilas, Ed.)
© FORMATEX 2014
__________________________________________________________________
547
3. Attenuated Total Reflectance: when transmission is no more an option
The need to study samples that are too thick to be analyzed through transmission phenomena – and thus require absorption investigations – or that are in a solution and cannot be diluted – being thus affected by too-high absorption – boosted the research toward more sophisticated, but still reliable, techniques. Introduced in the 1960s [48-50], now widely used, the Attenuated Total Reflectance technique (ATR) provides tools to overcome the above mentioned problems, exploiting internal-reflectance element (IRE) spectroscopy rather than transmission techniques. The IRE element is typically made up of high refractive-index material, e.g. zinc selenide, diamond or germanium. The ATR is a sampling technique used in conjunction with IR that enables samples to be examined directly in the solid or liquid state without further preparation (or with a minimal sample preparation). The IR beam is reflected away from an interface via total internal reflectance – light is introduced into a suitable prism at an angle exceeding the critical angle for internal reflection. An evanescent wave is produced at the reflecting surface – since the information is collected from the surface, the sample must be in optical contact with the crystal (the IRE). From the interaction of this evanescent wave (exponential decay) with the sample, a spectrum can be recorded with little or no sample preparation. Resulting peaks from ATR are very similar, but not identical, in intensity and wavelength to those obtained via transmittance techniques.
Fig. 1 Schematic of the reflection sample technique. 1) The IR beam enters the ATR crystal. 2) The evanescent wave penetrates the surface of the sample, then is attenuated by the mid-IR absorption characteristics of the lower refractive index medium. IR beam penetrates the surface layer of the sample to a depth (typically 1 μm) called dp, provided the angle of incidence, α, of the IR radiation is greater than the critical angle, αc. dp is given by the Harrick equation [51-53], = / . =2 (sin − ) / (6) Thus, the total internal reflection depends on the critical angle – the angle of refraction is equal to 90 degrees and the Snell’s law reduces to: sin = / ( ). When the critical angle is exceeded for a particular light wave, it exhibits total internal reflection back into the medium. The larger the angle to the normal, the smaller is the fraction of light transmitted, up to the point where total internal reflection occurs. An important remark about equation 6 is that dp varies with the wavelength λ of the incoming radiation, so that to increasing wavelengths correspond increasing depth – as a consequence, ATR intensities decrease at higher wavenumbers, compared to spectra obtained in FTIR [54]. However, an easy post-processing is enough to correct this systematic error on the frequency detection. The pros and cons of ATR with respect to FTIR are as follows: pros of ATR over FTIR:
• It requires minimal or no sample preparation • No need for transmission – suitable for surface characterization and opaque samples
cons of ATR over FTIR: • Sensitivity is typically 3-4 orders of magnitude less than transmission – lower quality spectra • Low variety of spectra libraries available • Possible presence of artifacts due to dp dependence on λ
Several ATR studies in material science [55-63] and biologically relevant samples [64-67] have been performed in the past years. In addition, the attractive possibility of analyzing samples in their natural environment (or solutes which can be added to mimic these environments) opened the possibility to observe them over time [68]. For this reason, ATR is commonly employed to investigate thin films, biofilms, and membranes. As in the case of FTIR, the use of synchrotron radiation as a source for ATR-based facilities improves the achievable results. Several studies comparing SR-based IR micro-spectroscopy and ATR have been performed [63, 69-72], but literature on the direct use of SR light as a source for ATR is still lacking.
Microscopy: advances in scientific research and education (A. Méndez-Vilas, Ed.)
© FORMATEX 2014
__________________________________________________________________
548
4. Raman Spectroscopy: getting rid of the water response
An excellent alternative to FTIR and ATR techniques based on IR absorption is Raman scattering. The first observation of this phenomenon is due to Sir. C. V. Raman in a nice study published in several articles in 1928 [73-75]; he was later awarded the Nobel Prize in Physics in 1930. The main finding of such work is a new kind of inelastic scattering in which radiation can be inelastically scattered through a gain or loss of incoming radiation energy to the molecular vibrations of the target material. The radiation commonly employed to give rise to such effects is a laser of visible-light photons (otherwise NIR or near UV), in order to excite the vibro-rotational molecular states of the sample. Generally, the sample is irradiated with monochromatic electromagnetic radiation and the resulting scattered radiation is measured by a detector placed at 90° or 180° with respect to the optical path along the sample. The incoming radiation (hν o) can be scattered in three different ways:
1. Stokes – inelastic hν = hν o − hνvib, the initial energy of the molecule decreases and the missing energy is used to promote a transition to a higher vibrational state
2. Anti-Stokes – inelastic hν = hν o + hνvib, the final vibrational state of the molecule is more energetic than the initial state
3. Rayleigh – elastic hν = hν o, no loss or gain of energy These shifts in energy (Stokes and anti-Stokes) are a direct measure of the vibrational energies of the molecule. Raman spectroscopy is much different from fluorescence spectroscopy, as there are no absorption events in which the initial radiation frequency must match the absorption one and the resulting emitted photon will be at lower frequency, instead, in Raman the scattered photon can shift its energy by decreasing it (i.e. anti-Stokes), by increasing it (i.e. Stokes) or by maintaining the same frequency (i.e. Rayleigh). As opposed to IR active vibrational modes, where a dipole moment change is needed for the transition to take place, curiously, Raman scattering needs a change in the polarizability, i.e. the coupling of induced polarization of scattering molecules with the molecular vibrational modes (nonetheless no absorption or electronic transitions are needed) – as a matter of facts, IR active modes tend to be Raman inactive and vice versa. Therefore, the selection rules require, for instance, that, in a centrosymmetric molecule, symmetric stretching and bending will be Raman active and IR inactive, whereas asymmetric stretching and bending will be Raman inactive and IR active. In general, the mathematical tools of Group Theory allow to predict whether in a molecule the vibrational modes are IR or Raman active. It should be noted at this point that Raman effects can be induced by radiation of any frequency, even though the probability of producing Raman scattering is frequency dependent – the cross-section for an inelastic scattering process is proportional to λin
-4, where λin is the wavelength of the incident photon. Molecular vibrational modes generated by the coupling of individual bonds to incident photons give rise to a vibrational spectrum of both Stokes and anti-Stokes kind. This spectrum may be used to extract the specific molecular vibrational transition energies the same way as IR spectroscopy. Thus, the frequency positioning of a Raman band is characteristic of a molecular bond or group vibration and the combination of bands represents a characteristic fingerprint of that molecule – any changes to the fingerprint can be used to monitor or characterize physical or chemical changes at a molecular level. The advantage of Raman over IR is that the frequency of the incoming radiation is in the visible-light range and not in the IR, so that it is not necessary to adopt IR transparent materials for the spectrometer optics and the sample holder (or sample liquid cell). The Raman source is typically a laser, which ensures a highly monochromatic frequency and a high intensity, both important parameters for the resulting performances.
Fig. 2 Schematic highlighting the main differences in the setup for IR and Raman. In addition to the fact that some compounds are Raman active and not IR active, the main advantage of Raman spectroscopy over IR is the weaker response of water molecules (i.e. minimal interference from the highly-polar water vibrations) with respect to IR. Since most of biomedically relevant samples possess high water content and/or cannot be preserved in non-aqueous media, Raman spectroscopy is extremely well suited for this type of bio-samples (most of human tissues contain around 70-80% water). Moreover, sample preparation for Raman is rather easier than for mid-IR and the laser energy (frequency) can be easily tuned to enhance the response of specific samples (e.g. chromophores) whose Raman signal is very much enhanced (the so-called, resonance Raman spectrum). Indeed, this technique has
Microscopy: advances in scientific research and education (A. Méndez-Vilas, Ed.)
© FORMATEX 2014
__________________________________________________________________
549
several upsides as far as in-vivo experiments [76-79], biomolecules [80, 81], tissues and cells investigations [82, 83] are concerned. Raman spectroscopic microscopy is a very useful diagnostic tool – compared to FTIR microscopy, Raman possesses a better lateral spatial resolution [84], which enables investigation of subcellular compartments [85, 86]. An interesting characteristic of lasers employed for Raman is that their wavelengths are suitable for transmission through optical fibers, opening new scenarios for medical applications. In Section 2.1, the advantages of SR-FTIR over conventional FTIR sources were described. Similarly to Raman micro-spectroscopy, SR-FTIR possesses an excellent resolution by imaging the sub-micrometric features and aiming to help diagnosis of tumor cells and tissues. Both SR-FTIR and Raman techniques are facing the difficult transition between the laboratory and the health care system, becoming an extensively adopted tool for in-vivo diagnostic studies. We highlighted the fact that Raman allows to get rid of the problematic water signal, but there are also some disadvantages over SR-FTIR, for instance the fact that Raman scattering is inherently a weak process and requires laser sources to be set at very high intensity, possibly leading to thermal damage of biological samples [87-90]. Another issue with Raman spectroscopy is the high probability of fluorescence events affecting the spectra background and making them less accurate and reliable. An elegant way of overcoming this problem is to enhance the Raman signal: a technique called Surface Enhanced Raman Spectroscopy (SERS) can provide molecules with specific enhancement of Raman signals by means of other molecules adsorbed on rough noble metal surfaces [91-94]. The first SERS experiment employed pyridine adsorbed on electrochemically roughened silver [95]. The enhancement factor – around 1010 – is outstandingly high, so that even the detection of a single molecule is possible [96-98]. Another interesting study is the delivery of gold nanoparticles (Au NPs) into cells by sonication (rupture of the cell membrane enables an influx of NPs) or fluid-phase uptake (supplementing the culture medium with colloidal Au suspensions) [99, 100]. Several in-vivo studies have been carried out on this subject [99-104]. Another interesting feature of SERS is that some Raman-active vibrational modes might be not present in a SERS spectrum, while others which are IR and/or Raman inactive can be observed: this phenomenon is due to the surface altering the symmetry of the adsorbed molecules, thus modifying the selection rules requirements for specific bonds. Another surface enhanced Raman spectroscopy that extends the possibilities offered by SERS is the Surface Enhanced Resonance Raman Scattering (SERRS) – firstly employed by Van Duyne et al. [105]. These two techniques are often coupled to obtain similar but complementary information [106-110].
5. Sample preparation for IR and Raman: tissues and cells
We present here a few methodologies through which samples may be prepared for subsequent IR or Raman analyses. We stress that the choice of a methodology over the other depends on the specific requirements dictated by the individual tissue or cell type and properties. Generally, for tissues, time-saving and the possibility of analyzing paraffin-free samples points towards flash-freezing or even the employment of fresh tissues whenever possible. However, when the paraffin signal is not an issue or effective deparaffinized (dewaxing) agents are used (e.g. hexane), paraffin-embedded tissue might be the ideal choice for very thin sections or long-term preservation. Flash-freezing and paraffin-embedding are discussed below. As far as cell preparation is concerned, the best choice is to directly utilize living cells, but when this is not possible fixated cells might be employed. In the following, we discuss this matter in more detail.
5.1 Tissues
Tissue samples must be appropriately prepared for IR or Raman study [8-11]. We present here two methodologies for sample preparation, the choice of which depends on which features need to be preserved and which are more expendable.
5.1.1 Paraffin embedding
Paraffin is a very cheap and widely employed material – paraffin embedded samples can resist several years at room temperature. However, prior to embedding, the tissue needs to be fixed, either by perfusion or immersion, immediately after having been extracted from the body: even some tenth of minutes may be enough to compromise tissues’ structure [111]. Typically, the fresh tissue is immersed in an aqueous hydrated formalin solution (methylene glycol, OH-CH-OH) for 4 up to 24 hours (extended time may lead to overfixation). Formalin is a coagulative protein fixative able to preserve lipids by interacting with double bonds of unsaturated hydrocarbon chains; however, primary and secondary protein amine groups have a high change to crosslink. Saturated picric acid (pH 6.9) may be added, as it enhances morphology preservation in some tissues. Since paraffin is not miscible in water and tissues generally possess at least 70% water content, they have to be dehydrated before embedding: the tissue is normally consecutively immersed in increasing amounts of an ethanol-based solution, up to 100% ethanol, so that it is gradually dehydrated (a gradual change in
Microscopy: advances in scientific research and education (A. Méndez-Vilas, Ed.)
© FORMATEX 2014
__________________________________________________________________
550
hydrophobicity helps minimize the cell damage). This procedure is designed so that ethanol molecules substitute the sample’s water ones, thus preserving the protein secondary structure; however, the tertiary structure will not be preserved. In order to remove all ethanol molecules, the sample is then immersed in a xylene (mixed isomers) solution. Usually, at this stage, tissues are too thick to be analyzed in transmission with IR, thus it may be necessary to slice them into thin sections. Since the paraffin embedded tissue is too soft, it must be hardened through heating to 60 °C and laid to rest overnight. A microtome can be employed to section the sample.
5.1.2 Flash-freezing
When long preservation is not crucial, the sample preparation can be considerably speeded up by flash-freezing (also called snap-freezing) the tissue [5-7]. The initial fixation procedure required for paraffin embedding is skipped. Tissues are frozen by immersion in nitrogen cooled isopentane (– 170 °C) or directly in liquid nitrogen – the water contained within the cells acts as supporting medium [16]. The immersion process must be very quick and only vitreous ice should form. It is important to avoid the formation of ice crystal, as the volume increase would otherwise lead to serious tissue damage [17-19]. However, after freezing, fixation is needed, but ethanol may be used instead of paraffin so as to avoid potential damages due to formaldehyde crosslinking. To obtain tissue sections, a cryostat must be employed – sections may be stored at -80 °C for up to 1 year. Flash-freezing is particularly indicated in studies aiming at post-translational modification detection (e.g. phosphorylation) and to investigate enzymes and soluble lipids. Conversely, paraffin-embedded tissue sections are thinner, thus the analysis of frozen tissue sections might be problematic (especially when working in transmission).
5.2 Cells
Cells are generally attached to a solid support and directly grown upon IR transparent surfaces, then removed from the culture medium and subsequently air-dried. When direct air drying leads to an overly quick dehydration, alternative methods such as cyto-spinning [48], centrifugation [45] or gassy-nitrogen drying might be employed [46]. Cells can eventually be chemically fixated [48, 52].
6. Combining infrared spectroscopy with probe microscopy: Infrared Atomic Force Microscopy
6.1 Infrared atomic force microscopy setup
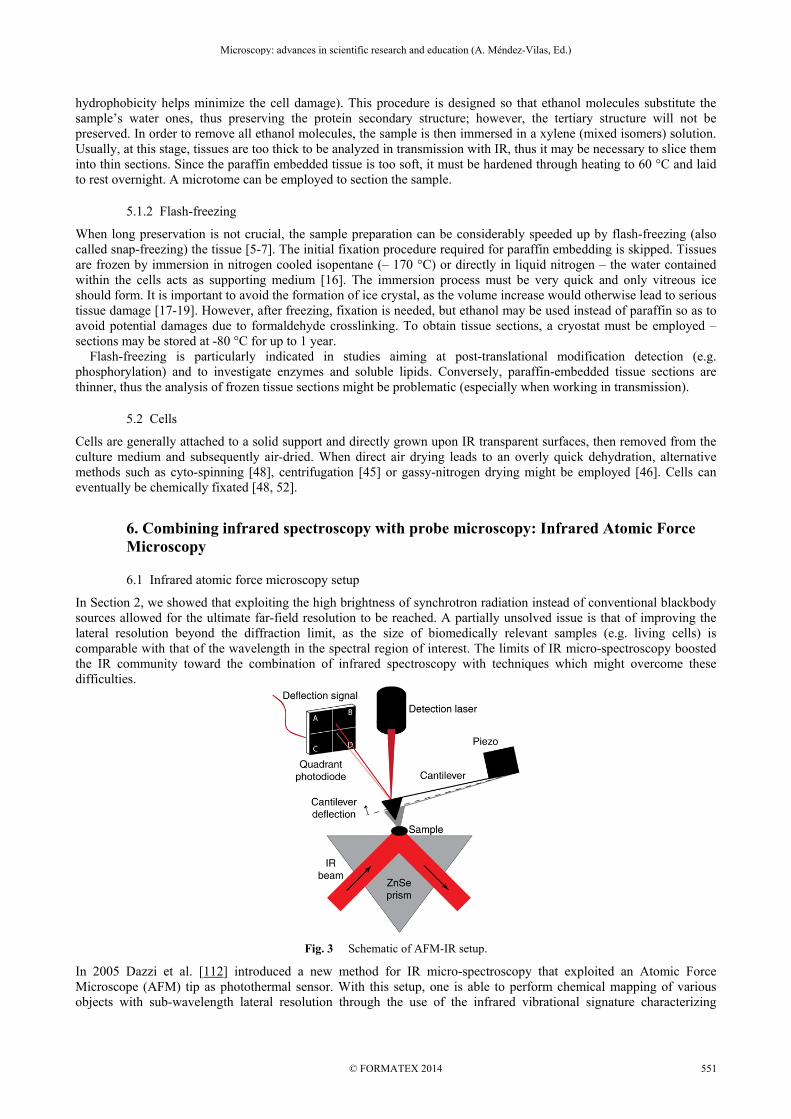
In Section 2, we showed that exploiting the high brightness of synchrotron radiation instead of conventional blackbody sources allowed for the ultimate far-field resolution to be reached. A partially unsolved issue is that of improving the lateral resolution beyond the diffraction limit, as the size of biomedically relevant samples (e.g. living cells) is comparable with that of the wavelength in the spectral region of interest. The limits of IR micro-spectroscopy boosted the IR community toward the combination of infrared spectroscopy with techniques which might overcome these difficulties.
Fig. 3 Schematic of AFM-IR setup.
In 2005 Dazzi et al. [112] introduced a new method for IR micro-spectroscopy that exploited an Atomic Force Microscope (AFM) tip as photothermal sensor. With this setup, one is able to perform chemical mapping of various objects with sub-wavelength lateral resolution through the use of the infrared vibrational signature characterizing
Microscopy: advances in scientific research and education (A. Méndez-Vilas, Ed.)
© FORMATEX 2014
__________________________________________________________________
551

different molecular species. The AFM tip probes the local transient deformation induced by an infrared pulsed laser tuned at a sample absorbing wavelength. The cantilever oscillates at resonant frequencies, whose amplitudes may be correlated with local absorption. This technique, called AFM-IR [113] has rapidly found applications in different scientific areas, such as microbiology [114-116], cellular biology [117] and nanophotonics [118, 119].
6.2 Basic principles and applications
Similar to ATR (see Section 3), the sample is positioned on an IR transparent prism and irradiated with IR beam so as to achieve total internal reflection. In order to obtain a photothermal response in the sample, the IR radiation must be tuned at the right wavelength to be to enable absorption by the sample. The absorbed energy is converted to heat, leading to a thermal expansion in the specific sample region in which absorption occurred. The subsequent heat conduction is described by Fourier’s Law: − ∆ = ( )
where ρ is the material density, C the heat capacity, k the thermal conductivity, V the volume, Q(t) is the absorbed heat as a function of time and Δ the Laplace operator – theoretical treatment and details are described by Dazzi et al. [120]. The precise detection of this thermal expansion is performed by means of an AFM tip – this signal is directly proportional to the sample’s absorption coefficient. Interestingly, there is a strong correlation between conventional FTIR spectroscopy and AFM-IR since the signal measured by AFM-IR is directly proportional to the IR absorption coefficient for a material. Recent studies on biological samples have been successfully performed by means of AFM-IR, for instance, subcellular Au NPs uptake [121], imaging of structural lipids in human stratum corneum [122], bacterial polymer nano-granules [116], single-cell biochemical perturbations upon prion infection [123], structural analysis and mapping of individual protein complexes [124].
7. Summary
In this chapter IR, ATR, SR-IR and Raman (included SERS/SERRS) spectroscopies were described with particular emphasis on biomedical applications. In particular, promising in-vivo studies on tissues and cells were carefully referenced for further reading. A brief protocol for tissue and cell samples preparation was also provided for completeness. A full-of-perspective innovative technique – the AFM-IR – was finally described to provide the reader with basic knowledge about the state-of-the-art technology for what concerns resolution below the diffraction limit.
Acknowledgements This work was supported by grants from the Danish National Research Foundation and the Danish Research Agency through support for the iNANO Center. M.D. acknowledges a STENO Grant for the Danish Research Council and the VKR Young Investigator Program in Denmark. C.B. acknowledges PhD Scholarship from Sino-Danish Center for Education and Research.
References [1] Ball, D.W., Properties of Light Waves. Spectroscopy, 1994. 9(5): p. 24-25. [2] Ball, D.W., Interactions of Light with Matter. Spectroscopy, 1994. 9(6): p. 20-21. [3] Movasaghi, Z., S. Rehman, and I.U. Rehman, Fourier transform infrared (FTIR) spectroscopy of biological tissues. Applied
Spectroscopy Reviews, 2008. 43(2): p. 134-179. [4] Lasch, P., et al., Infrared Spectroscopy of Human Cells and Tissue: Detection of Disease. Technology in Cancer Research &
Treatment, 2002. 1(1): p. 1-7. [5] Salman, A., et al., FTIR spectroscopic method for detection of cells infected with herpes viruses. Biopolymers, 2002. 67(6): p.
406-412. [6] Tanthanucha, W., et al., Neural differentiation of mouse embryonic stem cells studied by FTIR spectroscopy. Journal of
Molecular Structure, 2010. 967(1-3): p. 189-195. [7] Ling, S.J., Z.Z. Shao, and X. Chen, Application of Synchrotron FTIR Imaging for Cells. Progress in Chemistry, 2014. 26(1): p.
178-192. [8] Du, J.K., et al., FTIR spectroscopic study on carcinoma cells. Spectroscopy and Spectral Analysis, 2008. 28(1): p. 51-54. [9] Krishna, C.M., et al., FTIR and Raman microspectroscopy of normal, benign, and malignant formalin-fixed ovarian tissues.
Analytical and Bioanalytical Chemistry, 2007. 387(5): p. 1649-1656. [10] Wang, J.S., et al., FTIR spectroscopic study on normal and cancerous tissues of esophagus. Spectroscopy and Spectral
Analysis, 2003. 23(5): p. 863-865.
Microscopy: advances in scientific research and education (A. Méndez-Vilas, Ed.)
© FORMATEX 2014
__________________________________________________________________
552

[11] Paluszkiewicz, C. and W.M. Kwiatek, Analysis of human cancer prostate tissues using FTIR microspectroscopy and SRIXE techniques. Journal of Molecular Structure, 2001. 565: p. 329-334.
[12] Zhang, L., et al., The difference of FTIR spectroscopic studies on normal and malignant tissues of lung. Chemical Journal of Chinese Universities-Chinese, 2003. 24(12): p. 2173-2176.
[13] Diem, M., et al., IR spectra and IR spectral maps of individual normal and cancerous cells. Biopolymers, 2002. 67(4-5): p. 349-353.
[14] Shen, Y.C., et al., Detection and identification of explosives using terahertz pulsed spectroscopic imaging. Applied Physics Letters, 2005. 86(24).
[15] Kemp, M.C., et al., Security applications of terahertz technology. Terahertz for Military and Security Applications, 2003. 5070: p. 44-52.
[16] Duncan, W.D. and G.P. Williams, Infrared Synchrotron Radiation from Electron Storage-Rings. Applied Optics, 1983. 22(18): p. 2914-2923.
[17] Ami, D., et al., Fourier transform infrared micro spectroscopy as a new tool for nematode studies. Febs Letters, 2004. 576(3): p. 297-300.
[18] Petibois, C., et al., Analytical performances of FT-IR spectrometry and imaging for concentration measurements within biological fluids, cells, and tissues. Analyst, 2006. 131(5): p. 640-647.
[19] Malins, D.C., et al., Antioxidant-induced changes in oxidized DNA. Proceedings of the National Academy of Sciences of the United States of America, 2002. 99(9): p. 5937-5941.
[20] Mendelsohn, R., et al., IR microscopic imaging of pathological states and fracture healing of bone. Applied Spectroscopy, 2000. 54(8): p. 1183-1191.
[21] Ball, D.W., The Spectroscopists Tools .2. Fourier-Transform Spectrometers. Spectroscopy, 1994. 9(8): p. 24-25. [22] Miller, L.M. and R.J. Smith, Synchrotrons versus globars, point-detectors versus focal plane arrays: Selecting the best source
and detector for specific infrared microspectroscopy and imaging applications. Vibrational Spectroscopy, 2005. 38(1-2): p. 237-240.
[23] Moss, D., B. Gasharova, and Y.L. Mathis, Practical tests of a focal plane array detector microscope at the ANKA-IR beamline. Infrared Physics & Technology, 2006. 49(1-2): p. 53-56.
[24] Schmitt, J., et al., Identification of scrapie infection from blood serum by Fourier transform infrared spectroscopy. Analytical Chemistry, 2002. 74(15): p. 3865-3868.
[25] Holman, H.Y.N., et al., Low-dose responses to 2,3,7,8-tetrachlorodibenzo-p-dioxin in single living human cells measured by synchrotron infrared spectromicroscopy. Environmental Science & Technology, 2000. 34(12): p. 2513-2517.
[26] Moss, D.A., M. Keese, and R. Pepperkok, IR micro spectroscopy of live cells. Vibrational Spectroscopy, 2005. 38(1-2): p. 185-191.
[27] Holman, H.Y.N., M.C. Martin, and W.R. McKinney, Tracking chemical changes in a live cell: Biomedical applications of SR-FTIR spectromicroscopy. Spectroscopy-an International Journal, 2003. 17(2-3): p. 139-159.
[28] Holman, H.Y.N., M.C. Martin, and W.R. McKinney, Synchrotron-based FTIR spectromicroscopy: Cytotoxicity and heating considerations. Journal of Biological Physics, 2003. 29(2-3): p. 275-286.
[29] Miljkovic, M., et al., Infrared microspectroscopy of individual human cervical cancer (HeLa) cells suspended in growth medium. Biopolymers, 2004. 74(1-2): p. 172-175.
[30] Romeo, M., et al., Infrared microspectroscopy of individual human cervical cancer (HeLa) cells. Biopolymers, 2004. 74(1-2): p. 168-171.
[31] Sule-Suso, J., et al., Quantification of acetaldehyde and carbon dioxide in the headspace of malignant and non-malignant lung cells in vitro by SIFT-MS. Analyst, 2009. 134(12): p. 2419-2425.
[32] Smith, D., P. Spanel, and J. Sule-Suso, Advantages of breath testing for the early diagnosis of lung cancer. Expert Review of Molecular Diagnostics, 2010. 10(3): p. 255-257.
[33] Tobin, M.J., et al., Infrared microscopy of epithelial cancer cells in whole tissues and in tissue culture, using synchrotron radiation. Faraday Discussions, 2004. 126: p. 27-39.
[34] Baker, M.J., et al., FTIR-based spectroscopic analysis in the identification of clinically aggressive prostate cancer. British Journal of Cancer, 2008. 99(11): p. 1859-1866.
[35] Baker, M.J., et al., Investigating FTIR based histopathology for the diagnosis of prostate cancer. Journal of Biophotonics, 2009. 2(1-2): p. 104-113.
[36] Buschman, H.P., et al., Diagnosis of human coronary atherosclerosis by morphology-based Raman spectroscopy. Cardiovascular Pathology, 2001. 10(2): p. 59-68.
[37] Nogueira, G.V., et al., Raman spectroscopy study of atherosclerosis in human carotid artery. Journal of Biomedical Optics, 2005. 10(3).
[38] Shim, M.G. and B.C. Wilson, Development of an in vivo Raman spectroscopic system for diagnostic applications. Journal of Raman Spectroscopy, 1997. 28(2-3): p. 131-142.
[39] Shim, M.G., et al., Study of fiber-optic probes for in vivo medical Raman spectroscopy. Applied Spectroscopy, 1999. 53(6): p. 619-627.
[40] Utzinger, U. and R.R. Richards-Kortum, Fiber optic probes for biomedical optical spectroscopy. Journal of Biomedical Optics, 2003. 8(1): p. 121-147.
[41] Lee, J., et al., Optical artefacts in transflection mode FTIR microspectroscopic images of single cells on a biological support: the effect of back-scattering into collection optics. Analyst, 2007. 132(8): p. 750-755.
[42] Lasch, P., A. Pacifico, and M. Diem, Spatially resolved IR microspectroscopy of single cells. Biopolymers, 2002. 67(4-5): p. 335-338.
[43] Lasch, P., et al., FT-IR spectroscopic investigations of single cells on the subcellular level. Vibrational Spectroscopy, 2002. 28(1): p. 147-157.
Microscopy: advances in scientific research and education (A. Méndez-Vilas, Ed.)
© FORMATEX 2014
__________________________________________________________________
553
[44] Gazi, E., et al., Fixation protocols for subcellular imaging by synchrotron-based Fourier transform infrared microspectroscopy. Biopolymers, 2005. 77(1): p. 18-30.
[45] Gazi, E., et al., A study of cytokinetic and motile prostate cancer cells using synchrotron-based FTIR micro spectroscopic imaging. Vibrational Spectroscopy, 2005. 38(1-2): p. 193-201.
[46] Sule-Suso, J., et al., FT-IR microspectroscopy as a tool to assess lung cancer cells response to chemotherapy. Vibrational Spectroscopy, 2005. 38(1-2): p. 179-184.
[47] Mohlenhoff, B., et al., Mie-type scattering and non-Beer-Lambert absorption behavior of human cells in infrared microspectroscopy. Biophysical Journal, 2005. 88(5): p. 3635-3640.
[48] Katlafsky, B. and R.E. Keller, ATTENUATED TOTAL REFLECTANCE INFRARED ANALYSIS OF AQUEOUS SOLUTIONS. Analytical Chemistry, 1963. 35(11): p. 1665-&.
[49] Harris, R.L. and G.R. Svoboda, DETERMINATION OF ALKYD AND MONOMER-MODIFIED ALKYD RESINS BY ATTENUATED TOTAL REFLECTANCE INFRARED SPECTROMETRY. Analytical Chemistry, 1962. 34(12): p. 1655-&.
[50] McGowan, R.J., ATTENUATED TOTAL REFLECTANCE VS. TRANSMISSION INFRARED SPECTROMETRY IN QUANTITATIVE EVALUATION OF PAINT VEHICLES. Analytical Chemistry, 1963. 35(11): p. 1664-&.
[51] Harrick, N.J., Double-Beam Internal Reflection Spectrometer. Applied Optics, 1965. 4(12): p. 1664-&. [52] Harrick, N.J., Variable Angle Attachment for Internal Reflection Spectroscopy. Analytical Chemistry, 1965. 37(11): p. 1445-&. [53] Ohta, K. and R. Iwamoto, EXPERIMENTAL PROOF OF THE RELATION BETWEEN THICKNESS OF THE PROBED
SURFACE-LAYER AND ABSORBANCE IN FT-IR ATR SPECTROSCOPY. Applied Spectroscopy, 1985. 39(3): p. 418-425. [54] Koulis, C.V., J.A. Reffner, and A.M. Bibby, Comparison of transmission and internal reflection infrared spectra of cocaine.
Journal of Forensic Sciences, 2001. 46(4): p. 822-829. [55] Cho, L., et al., Single fiber analysis by internal reflection infrared microspectroscopy. Journal of forensic sciences, 2001.
46(6): p. 1309-1314. [56] Enlow, E.M., et al., Discrimination of nylon polymers using attenuated total reflection mid-infrared spectra and multivariate
statistical techniques. Applied spectroscopy, 2005. 59(8): p. 986-992. [57] Kazarian, S.G., et al., Specific intermolecular interaction of carbon dioxide with polymers. Journal of the American Chemical
Society, 1996. 118(7): p. 1729-1736. [58] Goldberg, S. and C.T. Johnston, Mechanisms of arsenic adsorption on amorphous oxides evaluated using macroscopic
measurements, vibrational spectroscopy, and surface complexation modeling. Journal of Colloid and Interface Science, 2001. 234(1): p. 204-216.
[59] Madejova, J., FTIR techniques in clay mineral studies. Vibrational Spectroscopy, 2003. 31(1): p. 1-10. [60] Lomeda, J.R., et al., Diazonium Functionalization of Surfactant-Wrapped Chemically Converted Graphene Sheets. Journal of
the American Chemical Society, 2008. 130(48): p. 16201-16206. [61] Peng, H.Q., et al., Sidewall carboxylic acid functionalization of single-walled carbon nanotubes. Journal of the American
Chemical Society, 2003. 125(49): p. 15174-15182. [62] Kazarian, S.G., B.J. Briscoe, and T. Welton, Combining ionic liquids and supercritical fluids: in situ ATR-IR study of CO2
dissolved in two ionic liquids at high pressures. Chemical Communications, 2000(20): p. 2047-2048. [63] Sankhe, S.Y. and D.E. Hirt, Using synchrotron-based FT-IR microspectroscopy to study erucamide migration in 50-mu m-
thick bilayer linear low-density polyethylene and polyolefin plastomer films. Applied Spectroscopy, 2003. 57(1): p. 37-43. [64] Goormaghtigh, E., et al., Protein secondary structure content in solution, films and tissues: redundancy and complementarity
of the information content in circular dichroism, transmission and ATR FTIR spectra. Biochimica et biophysica acta, 2009. 1794(9): p. 1332-1343.
[65] Haris, P.I. and D. Chapman, THE CONFORMATIONAL-ANALYSIS OF PEPTIDES USING FOURIER-TRANSFORM IR SPECTROSCOPY. Biopolymers, 1995. 37(4): p. 251-263.
[66] Oren, Z., et al., Structure and organization of the human antimicrobial peptide LL-37 in phospholipid membranes: relevance to the molecular basis for its non-cell-selective activity. Biochemical Journal, 1999. 341: p. 501-513.
[67] Degrado, W.F. and J.D. Lear, INDUCTION OF PEPTIDE CONFORMATION AT APOLAR WATER INTERFACES .1. A STUDY WITH MODEL PEPTIDES OF DEFINED HYDROPHOBIC PERIODICITY. Journal of the American Chemical Society, 1985. 107(25): p. 7684-7689.
[68] Heberle, J. and C. Zscherp, ATR/FT-IR difference spectroscopy of biological matter with microsecond time resolution. Applied Spectroscopy, 1996. 50(5): p. 588-596.
[69] Carter, E.A., et al., Infrared Spectroscopy of Microorganisms: Characterization, Identification, and Differentiation, in New Approaches in Biomedical Spectroscopy, K. Kneipp, et al., Editors. 2007, Amer Chemical Soc: Washington. p. 64-84.
[70] Ellis, G., et al., Laser microperforated biodegradable microbial polyhydroxyalkanoate substrates for tissue repair strategies: an infrared microspectroscopy study. Analytical and Bioanalytical Chemistry, 2011. 399(7): p. 2379-2388.
[71] Rodriguez, G., et al., A Unique Bicellar Nanosystem Combining Two Effects on Stratum Corneum Lipids. Molecular Pharmaceutics, 2012. 9(3): p. 482-491.
[72] Kuimova, M.K., K.L.A. Chan, and S.G. Kazarian, Chemical Imaging of Live Cancer Cells in the Natural Aqueous Environment. Applied Spectroscopy, 2009. 63(2): p. 164-171.
[73] Raman, C.V. and K.S. Krishnan, A new type of secondary radiation. Nature, 1928. 121: p. 501-502. [74] Raman, C.V. and K.S. Krishnan, The optical analogue of the Compton effect. Nature, 1928. 121: p. 711-711. [75] Raman, C.V., A change of wave-length in light scattering. Nature, 1928. 121: p. 619-619. [76] Hanlon, E.B., et al., Prospects for in vivo Raman spectroscopy. Physics in Medicine and Biology, 2000. 45(2): p. R1-R59. [77] Utzinger, U., et al., Near-infrared Raman spectroscopy for in vivo detection of cervical precancers. Applied Spectroscopy,
2001. 55(8): p. 955-959. [78] Caspers, P.J., et al., Detection of skin lactate by in vivo Raman spectroscopy. Spectroscopy of Biological Molecules: New
Directions, 1999: p. 485-486.
Microscopy: advances in scientific research and education (A. Méndez-Vilas, Ed.)
© FORMATEX 2014
__________________________________________________________________
554

[79] Caspers, P.J., et al., In vivo Raman spectroscopy of human skin: determination of the composition of natural moisturizing factor. Biomedical Applications of Raman Spectroscopy, Proceedings Of, 1999. 3608: p. 99-102.
[80] Lord, R.C. and N.T. Yu, Laser-Excited Raman Spectroscopy of Biomolecules .2. Native Ribonucuease and Alpha-Chymotrypsin. Journal of Molecular Biology, 1970. 51(2): p. 203-&.
[81] Lord, R.C. and N.T. Yu, Laser-Excited Raman Spectroscopy of Biomolecules .1. Native Lysozyme and Its Constituent Amino Acids. Journal of Molecular Biology, 1970. 50(2): p. 509-&.
[82] Smith, J., et al., Raman spectral mapping in the assessment of axillary lymph nodes in breast cancer. Technology in Cancer Research & Treatment, 2003. 2(4): p. 327-331.
[83] Molckovsky, A., et al., Diagnostic potential of near-infrared Raman spectroscopy in the colon: differentiating adenomatous from hyperplastic polyps. Gastrointestinal Endoscopy, 2003. 57(3): p. 396-402.
[84] Isabelle, M., et al., Lymph node pathology using optical spectroscopy in cancer diagnostics. Spectroscopy-an International Journal, 2008. 22(2-3): p. 97-104.
[85] Draux, F., et al., Raman spectral imaging of single living cancer cells: a preliminary study. Analyst, 2009. 134(3): p. 542-548. [86] Meade, A.D., et al., Studies of chemical fixation effects in human cell lines using Raman microspectroscopy. Analytical and
Bioanalytical Chemistry, 2010. 396(5): p. 1781-1791. [87] Calmettes, P.P. and M.W. Berns, Laser-Induced Multiphoton Processes in Living Cells. Proceedings of the National Academy
of Sciences of the United States of America-Biological Sciences, 1983. 80(23): p. 7197-7199. [88] Liu, Y., et al., Evidence for Localized Cell Heating Induced by Infrared Optical Tweezers. Biophysical Journal, 1995. 68(5): p.
2137-2144. [89] Lapotko, D.O. and V.P. Zharov, Spectral evaluation of laser-induced cell damage with photothermal microscopy. Lasers in
Surgery and Medicine, 2005. 36(1): p. 22-30. [90] Lapotko, D.O. and E.Y. Lukianova, Influence of physiological conditions on laser damage thresholds for blood, heart, and
liver cells. Lasers in Surgery and Medicine, 2005. 36(1): p. 13-21. [91] Zhi Yong, B., et al., In situ SERS monitoring of photocatalytic organic decomposition using recyclable TiO 2-coated Ag
nanowire arrays. Applied Surface Science, 2014. 301: p. 351-357. [92] Fan, W., et al., Graphene oxide and shape-controlled silver nanoparticle hybrids for ultrasensitive single-particle surface-
enhanced Raman scattering (SERS) sensing. Nanoscale, 2014. 6(9). [93] Deng, Y.L. and Y.J. Juang, Black silicon SERS substrate: Effect of surface morphology on SERS detection and application of
single algal cell analysis. Biosensors & Bioelectronics, 2014. 53: p. 37-42. [94] Guarrotxena, N. and G.C. Bazan, Antitags: SERS-Encoded Nanoparticle Assemblies that Enable Single-Spot Multiplex Protein
Detection. Advanced Materials, 2014. 26(12): p. 1941-1946. [95] Fleischmann, M., P.J. Hendra, and Mcquilla.Aj, Raman-Spectra of Pyridine Adsorbed at a Silver Electrode. Chemical Physics
Letters, 1974. 26(2): p. 163-166. [96] Xu, H.X., et al., Spectroscopy of single hemoglobin molecules by surface enhanced Raman scattering. Physical Review
Letters, 1999. 83(21): p. 4357-4360. [97] Kneipp, K., et al., Ultrasensitive chemical analysis by Raman spectroscopy. Chemical Reviews, 1999. 99(10): p. 2957-+. [98] Campion, A. and P. Kambhampati, Surface-enhanced Raman scattering. Chemical Society Reviews, 1998. 27(4): p. 241-250. [99] Kneipp, K., et al., Surface-enhanced Raman Spectroscopy in single living cells using gold nanoparticles. Applied
Spectroscopy, 2002. 56(2): p. 150-154. [100] Kneipp, J., et al., In vivo molecular probing of cellular compartments with gold nanoparticles and nanoaggregates. Nano
Letters, 2006. 6(10): p. 2225-2231. [101] Qian, X.M., et al., In vivo tumor targeting and spectroscopic detection with surface-enhanced Raman nanoparticle tags.
Nature Biotechnology, 2008. 26(1): p. 83-90. [102] Qian, X.M. and S.M. Nie, Single-molecule and single-nanoparticle SERS: from fundamental mechanisms to biomedical
applications. Chemical Society Reviews, 2008. 37(5): p. 912-920. [103] Shafer-Peltier, K.E., et al., Toward a glucose biosensor based on surface-enhanced Raman scattering. Journal of the American
Chemical Society, 2003. 125(2): p. 588-593. [104] Zavaleta, C.L., et al., Multiplexed imaging of surface enhanced Raman scattering nanotags in living mice using noninvasive
Raman spectroscopy. Proceedings of the National Academy of Sciences of the United States of America, 2009. 106(32): p. 13511-13516.
[105] Stacy, A.A. and R.P. Van Duyne, Surface enhanced raman and resonance raman spectroscopy in a non-aqueous electrochemical environment: Tris(2,2′-bipyridine)ruthenium(II) adsorbed on silver from acetonitrile. Chemical Physics Letters, 1983. 102(4): p. 365-370.
[106] Aroca, R., Vibrational spectroscopy (SERS and SERRS). Journal of Molecular Structure, 1993. 292(0): p. 17-27. [107] McNay, G., et al., Surface-Enhanced Raman Scattering (SERS) and Surface-Enhanced Resonance Raman Scattering (SERRS):
A Review of Applications. Applied Spectroscopy, 2011. 65(8): p. 825-837. [108] Graham, D., et al., Control of enhanced Raman scattering using a DNA-based assembly process of dye-coded nanoparticles.
Nature Nanotechnology, 2008. 3(9): p. 548-551. [109] Faulds, K., W.E. Smith, and D. Graham, Evaluation of surface-enhanced resonance Raman scattering for quantitative DNA
analysis. Analytical Chemistry, 2004. 76(2): p. 412-417. [110] Moore, B.D., et al., Rapid and ultra-sensitive determination of enzyme activities using surface-enhanced resonance Raman
scattering. Nature Biotechnology, 2004. 22(9): p. 1133-1138. [111] Berg, D., et al., Use of Formalin-Fixed and Paraffin-Embedded Tissues for Diagnosis and Therapy in Routine Clinical
Settings, in Protein Microarrays, U. Korf, Editor. 2011, Humana Press. p. 109-122. [112] Dazzi, A., et al., Local infrared microspectroscopy with subwavelength spatial resolution with an atomic force microscope tip
used as a photothermal sensor. Optics Letters, 2005. 30(18): p. 2388-2390.
Microscopy: advances in scientific research and education (A. Méndez-Vilas, Ed.)
© FORMATEX 2014
__________________________________________________________________
555
[113] Dazzi, A., et al., Analysis of nano-chemical mapping performed by an AFM-based ("AFMIR") acousto-optic technique. Ultramicroscopy, 2007. 107(12): p. 1194-1200.
[114] Dazzi, A., et al., Chemical mapping of the distribution of viruses into infected bacteria with a photothermal method. Ultramicroscopy, 2008. 108(7): p. 635-641.
[115] Mayet, C., et al., Sub-100 nm IR spectromicroscopy of living cells. Optics Letters, 2008. 33(14): p. 1611-1613. [116] Mayet, C., et al., In situ identification and imaging of bacterial polymer nanogranules by infrared nanospectroscopy. Analyst,
2010. 135(10): p. 2540-2545. [117] Vessieres, A., et al., Metal carbonyl complexes as tracers in non isotopic immunoassay (CMIA) and in subcellular imaging by
photothermal induced resonance infrared spectromicroscopy. Abstracts of Papers of the American Chemical Society, 2010. 239.
[118] Houel, J., et al., Ultraweak-absorption microscopy of a single semiconductor quantum dot in the midinfrared range. Physical Review Letters, 2007. 99(21).
[119] Sauvage, S., et al., Homogeneous broadening of the S to P transition in InGaAs/GaAs quantum dots measured by infrared absorption imaging with nanoscale resolution. Physical Review B, 2011. 83(3).
[120] Dazzi, A., F. Glotin, and R. Carminati, Theory of infrared nanospectroscopy by photothermal induced resonance. Journal of Applied Physics, 2010. 107(12).
[121] Kennedy, E., et al., Nanoscale infrared absorption imaging permits non-destructive intracellular photosensitizer localization for subcellular uptake analysis. Rsc Advances, 2013. 3(33): p. 13789-13795.
[122] Marcott, C., et al., Nanoscale infrared (IR) spectroscopy and imaging of structural lipids in human stratum corneum using an atomic force microscope to directly detect absorbed light from a tunable IR laser source. Experimental Dermatology, 2013. 22(6): p. 419-421.
[123] Didonna, A., et al., Infrared Microspectroscopy: A Multiple-Screening Platform for Investigating Single-Cell Biochemical Perturbations upon Prion Infection. Acs Chemical Neuroscience, 2011. 2(3): p. 160-174.
[124] Amenabar, I., et al., Structural analysis and mapping of individual protein complexes by infrared nanospectroscopy. Nature Communications, 2013. 4.
Microscopy: advances in scientific research and education (A. Méndez-Vilas, Ed.)
© FORMATEX 2014
__________________________________________________________________
556