synchronous and asynchronous online learning of advanced
TRANSCRIPT

Journal of Research and Advances in Mathematics Education
Volume 6, Issue 3, July 2021, pp. 190 - 205 DOI: 10.23917/jramathedu.v6i3.13477 p-ISSN: 2503-3697, e-ISSN: 2541-2590
To cite this article: Mairing, J. P., Sidabutar, R., Lada, E. Y., & Aritonang, H. (2021). Synchronous and asynchronous online learning of Advanced Statistics during Covid-19 pandemic. JRAMathEdu (Journal of Research and Advances in Mathematics Education), 6(3), 191-205. https://doi.org/10.23917/jramathedu.v6i3.13477
Synchronous and asynchronous online learning of advanced statistics during Covid-19 pandemic Jackson Pasini Mairing*, Rhodinus Sidabutar, Elyasib Yunas Lada, Henry Aritonang
Department of Mathematics Education, Palangka Raya University, Indonesia *Corresponding author: [email protected]
ARTICLE INFO ABSTRACT
Online learning could have negative impacts on learning processes and outcomes. The condition needed to be resolved through the implementation of appropriate online learning approaches. The research was aimed at describing the effectiveness of the implementation of asynchronous and synchronous online learning approaches in students’ learning outcomes and skills of using Microsoft Excel on the Advanced Statistics of Mathematics Education Department from one of the universities in Central Kalimantan. The learning approaches were integrated with mathematics problems, Minitab software and Microsoft Excel, and videos. The research design was experimental research using a one-group posttest-only design. The subjects were chosen by clustered random sampling. They were 18 students of the department in the 2020/2021 academic year. The instruments were a lesson plan, several videos, textbooks, e-books, questionnaires, mathematics problems, mid-test, and final-test. The students learned using the textbooks, e-books, and videos and solved the problems independently. Then, they discussed the solutions online in groups through their WhatsApp group (asynchronously). The problem solutions were presented by the students using a class on WhatsApp or video conference platforms (synchronous). The authors collected data by administering the questionnaire and the tests and analyzed the data using a 𝑡-test and a Wilcoxon test. The results showed that the implementation of the approaches was effective in enhancing the learning outcomes and skills of using Microsoft Excel. Furthermore, most students positively responded to learn independently and all the students positively responded to analyze data using the software.
© 2021 Universitas Muhammadiyah Surakarta
Article history: Received: 23 January 2021
Revised: 26 April 2021
Accepted: 27 April 2021 Published online: 29 June 2021 Published regularly: July 2021 Keywords: Asynchronously, synchronously, online learning, software, statistics
Introduction
The Covid-19 pandemic has given a great impact on the implementation of learning at every level of education. The virtual classes suddenly replaced the common face-to-face ones. The sudden replacement could have some negative impacts on the learning processes and outcomes. The previous research result showed that students experienced emotional exhaustion, physical and cognitive fatigue, and lack of motivation during online learning. The condition makes the course materials tend to be more difficult to understand meaningfully. The lack of understanding and many assignments were given by lecturers

192 Journal of Research and Advances in Mathematics Education, 6(3), July 2021, 191-205
http://journals.ums.ac.id/index.php/jramathedu
caused online learning processes tended to be ineffective (Giatman, Siswati, & Bari, 2020; Suryaman, et al., 2020).
The ineffectiveness of learning processes was also caused by an unstable internet connection, especially for students in rural areas (Mulyanti, Purnama, & Pawinanta, 2020; Putra, Witri, & Sari, 2020). The network constraint also occurred when students of the Mathematics Education Department from one of the Universities in Central Kalimantan in the academic year of 2020/2021 experienced online learning. The authors conducted an online survey using a Google Form given to 21 students of the department. The result revealed that 63.6% of the students experienced unstable internet connections. Besides, 72.7% of the students experienced constraints in purchasing large internet quotas for online learning that required video conference platforms.
The constraints of online learning are needed to overcome by implementing independent and mathematics problem-based learning. Independent learning itself was a characteristic of online learning and needed by students when learning from home. The students also needed habits of persistence, curiosity, and self-confidence when they have online classes. The habits could be developed by the students through learning to solve problems (Mairing, 2018). Students could also improve learning outcomes and higher-order thinking skills through the learning (Apriliana, Handayani, & Awalludin, 2019; Chasanah, 2019).
The integration of digital media and computer software was also needed in independent learning of the Advanced Statistics course. The course itself required such integration in which the implementation needed to be well-planned during online learning in the Covid-19 pandemic. The media was lecturer made videos. The software was Microsoft Excel and Minitab. Students could independently learn to analyze data using the software from the videos before attending online meetings repeatedly. The previous research results showed that the integration of the media and the software in the learning of Statistics subjects could improve students’ learning outcomes (Basturk, 2005; Chaamwe & Shumba, 2016; Mairing, 2020). However, the integration needed to be planned well to have positive effects on the learning activities and outcomes.
Furthermore, such integration and internet platforms enabled online learning to be carried out with synchronous and asynchronous approaches. Lectures’ characteristics using the synchronous approach were that lecturer-student interactions were carried out at the same time using internet platforms of a chat room or video conference. A characteristic of the asynchronous approach was that such interactions were carried out flexibly, and did not have to be at the same time by maximizing discussion forums or independent learning (UI, 2020).
However, the lack of technical guidance caused teachers to implement various strategies in online learning. The implementation was mainly influenced by teachers’ abilities to operate ICT, the stability of the internet connection, and the financial support of students. The factors caused 83.9% of the teachers to primarily use WhatsApp or Google Classroom (asynchronous approach) as a favorable online learning platform. Besides, the teachers’ ability to transform face-to-face learning activities into online learning also affected the implementation. The different activities of the two kinds of learning made the teachers find difficulties in implementing online learning and helping the students to understand the learning materials even though the teachers were able to operate ICT (Azhari & Fajri, 2021). The teachers were strongly suggested to apply innovative approaches so that the online learning could help students improve their competencies
Journal of Research and Advances in Mathematics Education, 6(3), July 2021, 191-205 193
http://journals.ums.ac.id/index.php/jramathedu
(Febrianto, Mas'udah, & Megasari, 2020). One of the options to cope with those needs was asynchronous and synchronous approaches.
Based on the description, the research problem was the implementation of asynchronous and synchronous online learning approaches integrated with mathematics problems, Microsoft Excel, Minitab, and videos effective on students’ learning outcomes and skills of using Microsoft Excel during the Covid-19 pandemic. The platforms used in online learning were WhatsApp, Google Classroom (chat room), and Google Meet (video conference). There were two WhatsApp rooms used in the research, namely groups and classes on WhatsApp. The WhatsApp groups were intended for the students to discuss the Advanced Statistics materials or problem solutions in their groups. The WhatsApp class was intended for the lecturer to facilitate discussions for all students. The authors developed the videos and uploaded them to the YouTube channel. The implementation would be said to be effective in the learning outcomes if the results met the desired outcomes that each student should reach 70 (B = good) and the mean of scores should reach more than 75 (scale of 0–100). Furthermore, it was said to be effective to increase the skill if the scale is one level higher than it was before the implementation (scale of 1–5) (Nieveen & Folmer, 2013).
The results of the research can be used in developing online learning integrated asynchronous and synchronous approaches with software, videos, and problems. The learning is intended to improve student's learning outcomes and technological literacy. Furthermore, the learning stages in the research can be used as a reference in developing blended learning. The synchronous approach in the research can be carried out by face-to-face activities in blended learning after the Covid-19 pandemic ends. Research Methods
Research Design The authors implemented the treatment in the forms of asynchronous and
synchronous online learning in the Advanced Statistics to a group of participants to determine the effectiveness of dependent variables, namely learning outcomes and skills of using Microsoft Excel. The effectiveness was measured using two kinds of tests and a questionnaire. The instruments were administered to the participants after the approaches were implemented. The results of the tests and the questionnaire were in the form of numbers in the interval and ordinal scales respectively. Furthermore, the authors implemented the learning to the single subjects since all lectures were carried out online in the Covid-19 pandemic. Therefore, the authors conducted experimental research using a one-group posttest-only design (Hastjarjo, 2019; Lodico, Spaulding, & Voegtle, 2010).
Participants The population of the research was all the students of the Mathematics Education
Department from one of the universities in Central Kalimantan that took the Advanced Statistics course in the 2020/2021 academic year. There were two classes, A and B, in which the number of students for each class was 18 and 22 respectively. The authors took a sample using clustered random sampling since the students were naturally clustered into two classes. The authors randomly chose one from two existing classes (Triola, Goodman, Law, & Labute, 2011). The result was that class A was the sample. The students of the class learned in heterogeneous groups. Each group consisted of 4–5 students. The
194 Journal of Research and Advances in Mathematics Education, 6(3), July 2021, 191-205
http://journals.ums.ac.id/index.php/jramathedu
heterogeneous was in gender and the students' initial ability; however, the data on students’ abilities were obtained from the scores of Calculus III in the previous semester.
Instruments The research instruments were a lesson plan, several e-books, textbook, mathematics
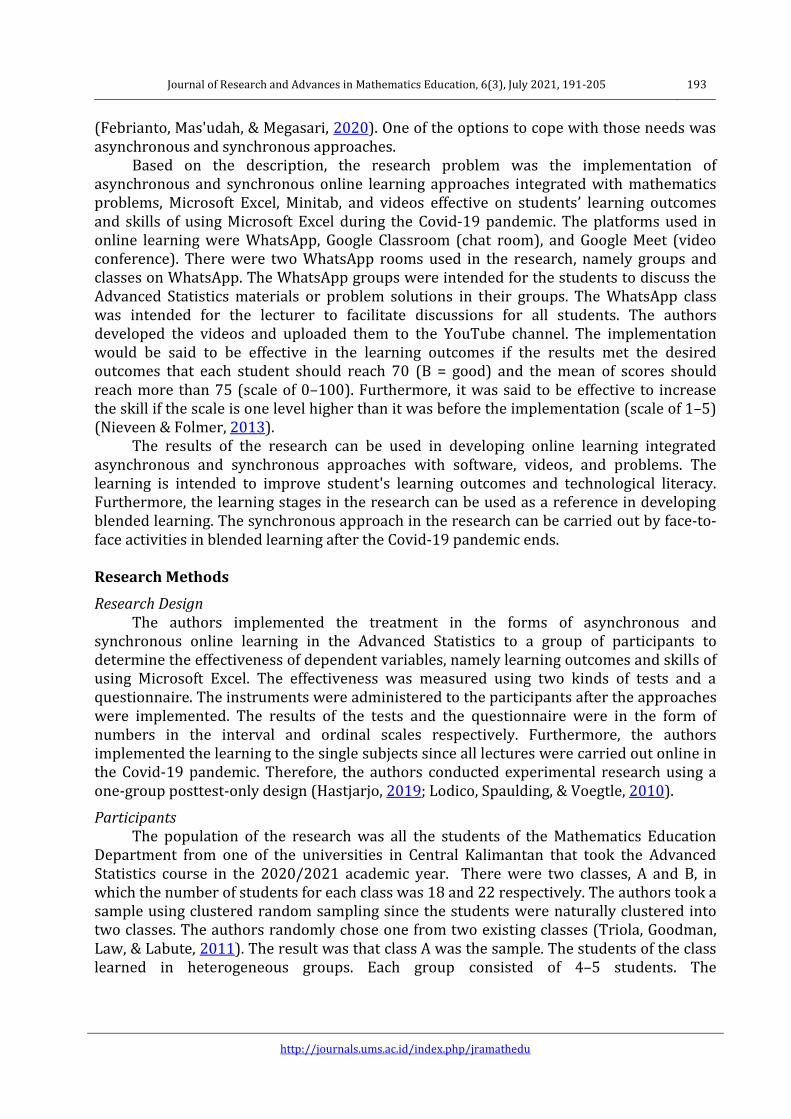
problems, several videos, questionnaire, mid-test, and final-test, and an expert assessment sheet. The videos were uploaded by the authors on the YouTube channel of the lecturer. The plan consisted of sixteen meetings in which six meetings were directed to be video conference meetings on the Google Meet application, eight meetings were on WhatsApp group classes, and the other two meetings were conducted for the tests. The activities of each meeting could be seen in Table 1. The authors created six video conferences due to the constraint in purchasing internet quota, and the campus regulation limited video conferences to 4-6 times. The duration of each video conference was also limited to 60 minutes in maximum.
Table 1 Activities of each meeting
Meeting Activities Applications 1 a. The lecturer explained how the course would be conducted and
presented an introduction. b. The lecturer proposed Problem 1 (the students took a sample from a
given population and justified the sampling technique).
Google Meet
2 a. The students presented the solution to Problem 1 b. The lecturer proposed Problem 2 (the students searched previous
research data and presented it in some tables).
3 a. The students presented the solution to Problem 2. b. The lecturer proposed Problem 3 (the students presented the data in
some graphs and made interpretations from the tables and the graphs).
4 a. The students presented the solution to Problem 3. b. The lecturer proposed Problem 4 (the students summarized the data in
central tendency and dispersion measures, and made interpretations from the measures).
5 a. The students demonstrated how to solve Problem 4 using Ms. Excel and Minitab.
b. The lecturer proposed Problem 5 (the students examined normality distribution of the data using the Chi-square test).
Google Meet
6 a. The students presented the solution to Problem 5. b. The lecturer proposed Problem 6 (the students examined normality
distribution of the data using the Kolmogorov-Smirnov test).
7 The students presented the solution to Problem 6 WhatsApp 8 Mid-test Google Classroom 9 a. The lecturer reviewed the solutions of the mid-test.
b. The lecturer proposed Problem 7 (the students searched previous research data related to two-samples comparison test and made conclusions using the test)
10 a. The students presented the solution to Problem 7. b. The lecturer proposed Problem 8 (the students made conclusions using a
two-sample comparison test from the given data).
11 a. The students presented the solution to Problem 8. b. The lecturer proposed Problem 9 (the students searched previous
research data related to correlation and made conclusions using Pearson correlation)

Journal of Research and Advances in Mathematics Education, 6(3), July 2021, 191-205 195
http://journals.ums.ac.id/index.php/jramathedu
Table 1 (Continued) Meeting Activities Applications
12 a. The students demonstrated how to solve Problem 9 using Ms. Excel and Minitab.
b. The lecturer proposed Problem 10 (the students made conclusions using Pearson correlation of the given data)
Google Meet
13 a. The students presented the solution to Problem 10. b. The lecturer proposed Problem 11 (the students made conclusions from
the data in Problem 10 using simple linear regression)
Google Meet
14 a. The students presented the solution to Problem 11. b. The lecturer proposed Problem 12 (the students made conclusions from
the given data using multiple linear regression)
Google Meet
15 The students presented the solution to Problem 12. Google Meet 16 Final-test Google Classroom
The authors administered the mid-test and final-tests to all students in the 8th and
16th meetings respectively. The tests were developed based on the materials in the lesson plan. Each test only consisted of one question.
Mid-test (duration: 90 minutes) There are data from the previous research in the attachment. The research question was there a relationship between the variables of parental attention (𝑋) to students’ outcomes (𝑌). You should analyze the data using Ms. Excel as follows a. make frequency tables of all data (𝑋and 𝑌), b. make histograms of all data, c. make scatter plots of 𝑌 and 𝑋, d. determine the mean and standard variation of all data, e. examine the normality of all data distribution, f. make descriptive conclusions of the results.
Final-test (duration: 150 minutes) There are data from the previous research in the attachment. The research question was there a relationship between the variables of concepts mastery (𝑋1) and creativity (𝑋2) to students’ learning outcomes (𝑌). You should analyze the data using Excel as follows a. explore the data (𝑋1,𝑋2,and 𝑌) using frequency tables and histograms, b. make scatter plots of 𝑌 to 𝑋1, and 𝑌 to 𝑋2, c. summarize the data in mean and standard deviation, d. test the normality of distribution of 𝑋1, 𝑋2, and 𝑌 using Kolmogorov-Smirnov test, e. determine correlation coefficients of 𝑋1 to 𝑌,𝑋2to 𝑌, and 𝑋1 to 𝑋2, f. determine multiple correlation coefficients of 𝑋1 and 𝑋2 to 𝑌 using formula:
𝑟𝑌(𝑋1.𝑋2) = 𝑟𝑋1𝑌
2 + 𝑟𝑋2𝑌2 − 2𝑟𝑋1𝑌. 𝑟𝑋2𝑌. 𝑟𝑋1𝑋2
1− 𝑟𝑋1𝑋2
2
where 𝑟𝑋1𝑌 = correlation coefficient of 𝑋1 to Y, 𝑟𝑋2𝑌 = correlation coefficient of 𝑋2 to 𝑌,
and 𝑟𝑋1𝑋2= correlation coefficient of 𝑋1 to 𝑋2,
g. Make a descriptive conclusion of the results.
The lecturer gave the formula of multiple correlations in the final test since the students had not learned and discussed the formula in the online meetings. The condition was intended to evaluate the effectiveness of the approaches in increasing students’ ability to use Microsoft Excel.

196 Journal of Research and Advances in Mathematics Education, 6(3), July 2021, 191-205
http://journals.ums.ac.id/index.php/jramathedu
The authors developed the questionnaire to measure students’ responses to the approaches and the software. The statements in the questionnaire used a Likert scale. The score of 1 meant the students were at the lowest level of certain circumstances based on the statement on the Likert scale, and the score of 5 meant the students were at the lowest level of certain circumstances based on the statement on the Likert scale. The questionnaire aspects and indicators could be seen in Table 2.
Table 2
Aspects and indicators of the questionnaire No Aspects Indicators Statements (The Likert scale) 1. Knowledge Student's ability to
understand materials of Advanced Statistics, analyze data, and interpret the results.
a.. The student’s knowledge of Advanced Statistics materials in online learning.
b. The student’s ability to analyze data using Microsoft Excel and Minitab in online learning.
c. The student’s ability to understand the meaning of analyzing data results using Microsoft Excel and Minitab in online learning.
2 Attitude Students’ responses in the online learning
d. The students’ responses when learning independently using the e-books, the textbook, and the videos.
e. The students’ responses when discussing on WhatsApp group and class or Google Meet.
3 Media and platforms
Appropriateness of the media and the platforms used in the online learning
f. Using WhatsApp, Google Classroom, and Google Meet in the online learning.
g. Using Microsoft Excel and Minitab to analyze data. 4 Skills Skills to use Excel before and
after the online learning. h. The students’ skills to use Microsoft Excel before
the online learning. i. The students’ skills to use Microsoft Excel after
the online learning.
The tests and the questionnaire met validity and reliability criteria. The validity and reliability of the instruments were based on reviewing the results by two experts on mathematics education using the expert assessment sheet. The review results showed that correlation coefficients between the scores on the tests, and the questionnaire were 0.61, 𝑝 < .05, and 0.47, 𝑝 < .05 respectively. The Alpha-Cronbach coefficients for the tests and the questionnaire were 0.891 (very high reliability) and 0.56 (medium reliability) respectively (Ghufron & Sutama, 2011).
The procedure of data collection The data collection was done by administering the questionnaire and the tests. The
instruments were given online to all subjects using Google Form and Google Classroom respectively. The learning implementation used asynchronous and synchronous approaches following the designed lesson plan.
Data analysis The data analysis was carried out in four stages. Firstly, the authors represented the
data in tables and graphs. Secondly, the authors summarized the data in measures of central tendency and dispersion. Thirdly, the authors examined the data normality assumption. Finally, the authors concluded the two hypotheses using Minitab 18.
The first hypothesis regarding the effects on the outcomes is as follows Null hypothesis : 𝜇𝑠 ≤ 75 (the implementation was not effective on the outcomes) Alternative hypothesis : 𝜇𝑠 > 75 (the implementation was effective on the outcomes)
Journal of Research and Advances in Mathematics Education, 6(3), July 2021, 191-205 197
http://journals.ums.ac.id/index.php/jramathedu
where 𝜇𝑠 = average of the students’ outcomes. The outcomes were the mean of mid-test and final-test scores. The desired outcomes were requiring the students to get average score of at least 75/100 or B+ in the course. The authors also tested a herding impact of the implementation, namely the increase of students’ skills of using Microsoft Excel before and after the treatment, even though the authors did not develop modules or videos specifically for using Microsoft Excel.
The second hypothesis regarding the impact was Null hypothesis : 𝜂𝑑 ≤ 1 (the implementation was not effective in increasing the
skills to be at an upper level) Alternative hypothesis : 𝜂𝑑 > 1 (the implementation was effective in increasing the skills
to be at an upper level) where 𝜂𝑑 = median of the difference (𝑑) of the skills before and after the implementation. The data of the skills were obtained from a questionnaire stating as follows: 1 = very unskillful, 2 = unskillful, 3 = fair, 4 = skillful, and 5 = very skillful. The skills increased by 2 levels if the skills before and after the implementation were 4 and 2 respectively, or the difference was 2 levels.
Results and Discussion
The online learning activities
The first data collection was conducted on Thursday, 17 September 2020 from 7 to 9 a.m. based on the course schedule. The first meeting was carried out online using Google Meet (synchronous). The lecturer uploaded the lesson plan, the first material (Statistics introduction), groups of the students in the classroom Google. The first material was presented by the lecturer using Microsoft PowerPoint by sharing the screen on Google Meet and the students discussed it in the meeting. At the end of the meeting, the lecturer posed Problem 1 dealing with taking the sample from the population.
The students learned to understand the data analysis independently using the provided e-books, textbook, and videos before the second meeting was conducted. The e-books link was https://bit.ly/3qyN4C4. The videos link in the YouTube channel of the lecturer was https://www.youtube.com/channel/UCnRzAl_CKuvn59dysc65_fA/playlists in STATISTICS playlist. The analysis was performed by the students without even using pens, papers, or calculators in the research. Then, they solved Problem 1 individually. The solutions were discussed by the students in their WhatsApp groups. They uploaded the solutions on Google Classroom (asynchronous).
In the second meeting, the students learned synchronously using the chat room platform on WhatsApp. Learning activities in the room were that the lecturer opened the class, checked students’ attendance, conveyed lecture objectives, and had a brief discussion about the material. Then, one of the groups presented the solution of Problem 1 by typing sentences, uploading files, or taking screenshots in the room. Then, the lecturer facilitated class discussion to interpret the results by typing some sentences to ask “how” or “why”, or asking the students to perform some tasks using Minitab or Microsoft Excel then uploading screenshots of the results in the room. At end of the meeting, the lecturer posed Problem 2 (data presentation). The synchronous learning on WhatsApp was implemented at the 2nd, 3rd, 4th, 6th, 7th, 9th, 11th, and 15th meetings.
At the fifth meeting using Google Meet, the learning was carried out in a similar procedure to WhatsApp class. Before the meeting, the students learned asynchronously to summarize data using Microsoft Excel and Minitab, then they solved Problem 3 (data

198 Journal of Research and Advances in Mathematics Education, 6(3), July 2021, 191-205
http://journals.ums.ac.id/index.php/jramathedu
summary). The difference was at synchronous activities where the students demonstrated data analysis using Minitab or Microsoft Excel by sharing screen directly in Google Meet. The interactions between students-students and lecturer-students on Google Meet were directly done in face-to-face learning. At the end of the meeting, the lecturer posed Problem 4 (chi-square normality test). The platform was used in the 5th, 8th, 10th, 12th, 13th, and 14th meetings.
Note: A. The student’s knowledge of Advanced Statistics materials. B. The student’s ability to analyze data using Excel and Minitab. C. The student’s ability to understand the meaning of analyzing data results using Excel and Minitab. Furthermore, number from 1 to 5 represented the Likert scale: 1 = very not, while 5 = very (understandable/skillful/able).
Figure 1. Students’ responses to knowledge aspect
Note: D. The students’ responses when learning independently using the e-books, the textbook, and the videos, and E. Their responses when discussing in WhatsApp or google meet. Furthermore, numbers from 1 to 5 represented the Likert scale: 1 = very not, while 5 = very (happiness).
Figure 2. The students’ responses to the attitude aspect
The students’ responses
At the end of the implementation, the authors sent the questionnaire to all the students online. They filled it by clicking the Google Form link https://forms.gle/RcXFNcdsEEBeUYbb9. The results of the knowledge aspect showed 94.4% of the students understood and surely understood the materials through the online learning in the research. It also revealed that 72.2% of the students being able or very able to analyze data using Minitab and Microsoft Excel (Figure 1). The attitude aspect showed

Journal of Research and Advances in Mathematics Education, 6(3), July 2021, 191-205 199
http://journals.ums.ac.id/index.php/jramathedu
that 72.2% and 83.3% of the students felt happy or very happy when learning independently or discussing on WhatsApp or Google Meet respectively (Figure 2). Based on the media and platform aspects, all the students stated that it was suitable or very suitable to use WhatsApp and Google Meet as learning platforms and to use Minitab and Microsoft Excel to analyze data (Figure 3). Thus, they had positive responses to the learning implementation in the research.
Note: F. Using WhatsApp, Google Classroom, and Google Meet, and G. Using Microsoft Excel and Minitab to analyze data. Furthermore, numbers from 1 to 5 represented the Likert scale: 1 = very not, while 5 = very (appropriate).
Figure 3. The students’ responses to media and platforms aspect
The students’ learning outcomes and skills of operating Microsoft Excel The students’ learning outcomes were determined based on the mid-test and final-
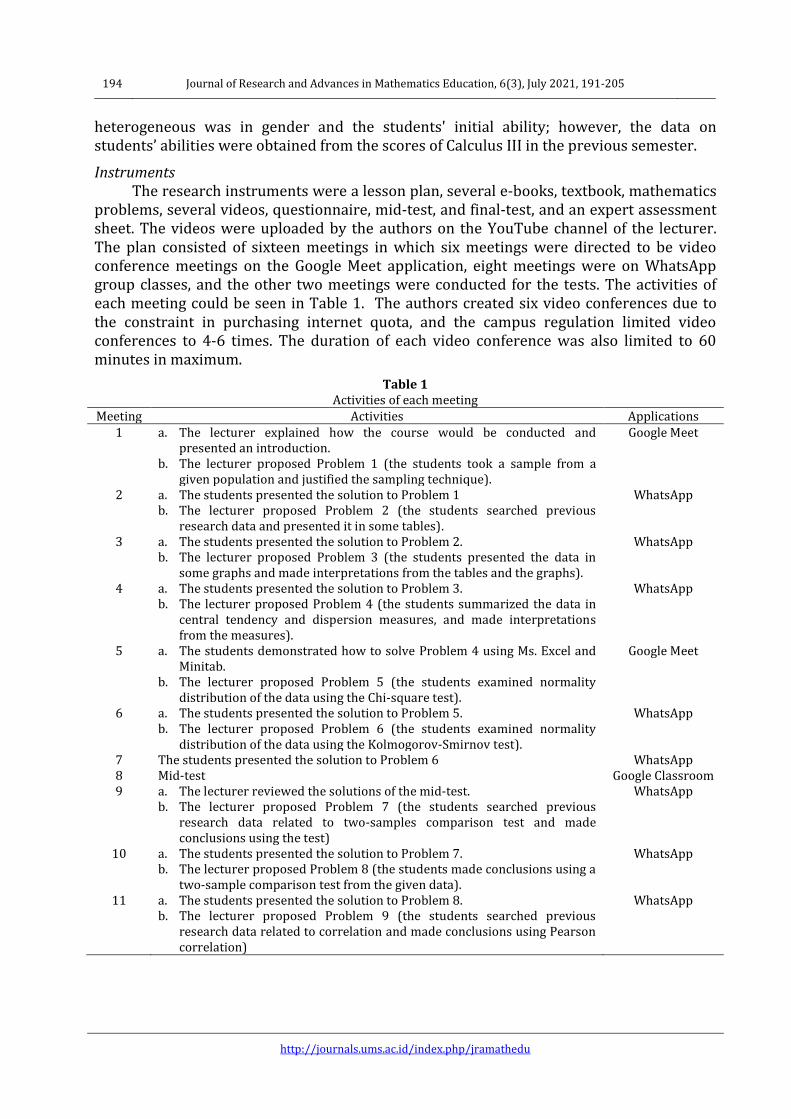
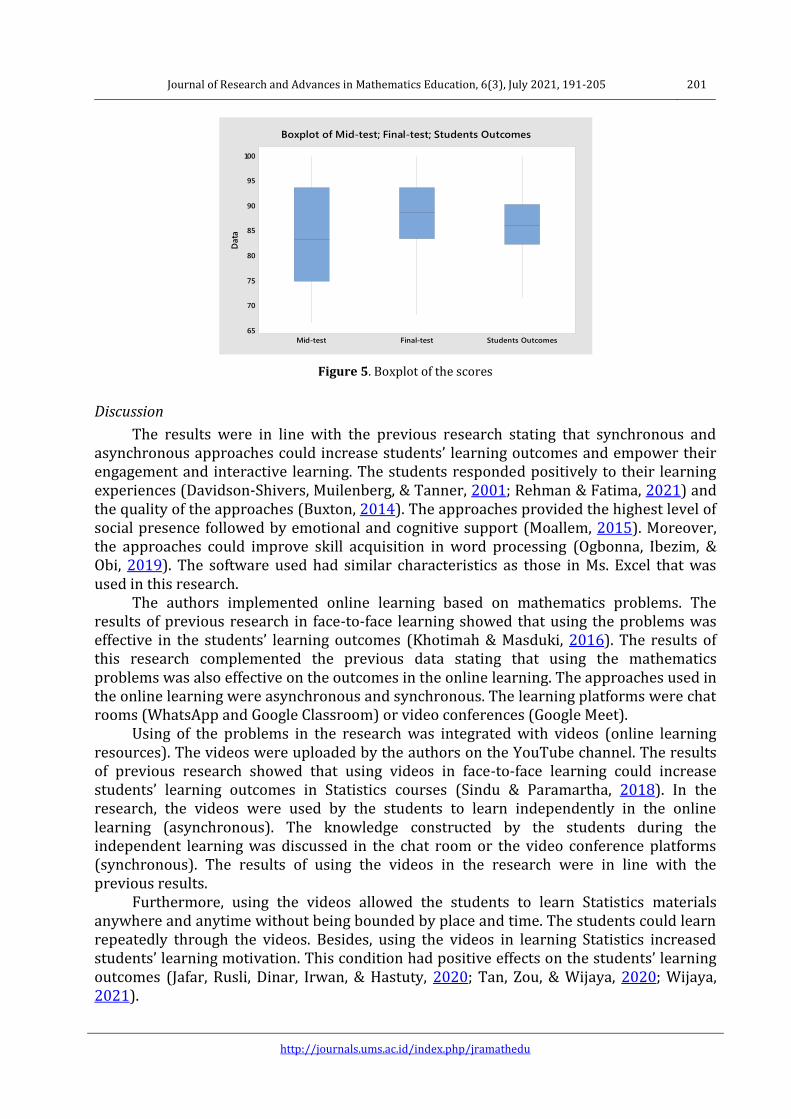
tests scores which were an average of both scores. One of the students’ solutions of mid-test and final-test could be seen in Figure 4. The result showed that the mean of the outcomes was 86.49 (scale of 0–100). The minimum and maximum scores were 71.58 and 100 respectively (Table 3). Also, 75% of the students had scores at least 75 (Q1-first quartile) in the mid-test. The quartile increased in the final test where 75% of their scores were at least 83.52. The increase could be seen in Figure 5 where the bottom line of the boxplot represented Q1.
Table 3 Summarizing students’ outcomes
Variable N Mean StDev Minimum Q1 Median Q3 Maximum
Mid-test 18 84,72 10,40 66,67 75,00 83,33 93,75 100,00
Final-test 18 88,26 8,11 68,18 83,52 88,64 93,75 100,00
Students’ outcomes 18 86,49 6,99 71,59 82,39 86,17 90,34 100,00
The first hypothesis test relating to the outcomes was carried out using 𝑡 −test
because of the normal distribution of the outcomes. The normal distribution was indicated by the result of the Kolmogorov-Smirnov test. The result was 𝑝 > .15 > .05. Furthermore, the 𝑡 −test result was 𝑝 < .05 meaning that the students’ scores were above 75 with a confidence level of 95%. Therefore, the 𝑡 −test result and the minimum score ≥ 70 indicating that the implementation in the research was effective in increasing students’ learning outcomes in the Advanced Statistics course.
The second hypothesis was related to data of increasing skills of using Microsoft Excel. The data were based on the students’ responses to the questionnaire which was
200 Journal of Research and Advances in Mathematics Education, 6(3), July 2021, 191-205
http://journals.ums.ac.id/index.php/jramathedu
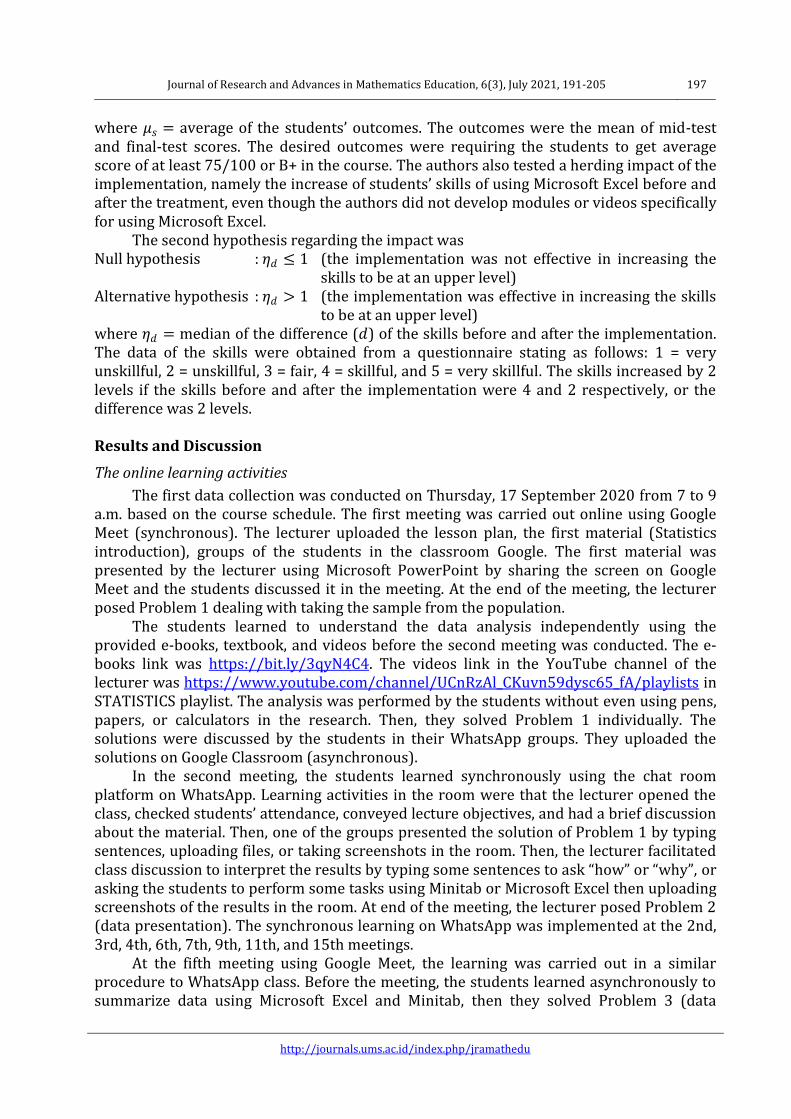
different from the skill before and after the implementation. The result was all the students had increased the skills at least 1 level higher. The percentages of the students’ increasing skills of 1, 2, or 3 levels were 38.9%, 44.4%, or 16.7% respectively. In the final test, the increasing skills also showed that 88.9% of the students were able to determine multiple correlation coefficients in the final-test, even though they had never learned and practiced determining the coefficients using Ms. Excel in the meetings. The lecturer only gave the formula of the coefficient in the problem of the final test. The test of the second hypothesis was carried out using the Wilcoxon test because the data had an ordinal scale. The test result was 𝑝 < .05 which meant that the students' skills increased by more than 1 level significantly with a confidence level of 95%. All the tests were performed using Minitab 18.
(a) Mid-test
(b) Final-test
Figures 4. One of the students’ solutions
Journal of Research and Advances in Mathematics Education, 6(3), July 2021, 191-205 201
http://journals.ums.ac.id/index.php/jramathedu
Figure 5. Boxplot of the scores
Discussion
The results were in line with the previous research stating that synchronous and asynchronous approaches could increase students’ learning outcomes and empower their engagement and interactive learning. The students responded positively to their learning experiences (Davidson-Shivers, Muilenberg, & Tanner, 2001; Rehman & Fatima, 2021) and the quality of the approaches (Buxton, 2014). The approaches provided the highest level of social presence followed by emotional and cognitive support (Moallem, 2015). Moreover, the approaches could improve skill acquisition in word processing (Ogbonna, Ibezim, & Obi, 2019). The software used had similar characteristics as those in Ms. Excel that was used in this research.
The authors implemented online learning based on mathematics problems. The results of previous research in face-to-face learning showed that using the problems was effective in the students’ learning outcomes (Khotimah & Masduki, 2016). The results of this research complemented the previous data stating that using the mathematics problems was also effective on the outcomes in the online learning. The approaches used in the online learning were asynchronous and synchronous. The learning platforms were chat rooms (WhatsApp and Google Classroom) or video conferences (Google Meet).
Using of the problems in the research was integrated with videos (online learning resources). The videos were uploaded by the authors on the YouTube channel. The results of previous research showed that using videos in face-to-face learning could increase students’ learning outcomes in Statistics courses (Sindu & Paramartha, 2018). In the research, the videos were used by the students to learn independently in the online learning (asynchronous). The knowledge constructed by the students during the independent learning was discussed in the chat room or the video conference platforms (synchronous). The results of using the videos in the research were in line with the previous results.
Furthermore, using the videos allowed the students to learn Statistics materials anywhere and anytime without being bounded by place and time. The students could learn repeatedly through the videos. Besides, using the videos in learning Statistics increased students’ learning motivation. This condition had positive effects on the students’ learning outcomes (Jafar, Rusli, Dinar, Irwan, & Hastuty, 2020; Tan, Zou, & Wijaya, 2020; Wijaya, 2021).
Students OutcomesFinal-testMid-test
100
95
90
85
80
75
70
65
Data
Boxplot of Mid-test; Final-test; Students Outcomes

202 Journal of Research and Advances in Mathematics Education, 6(3), July 2021, 191-205
http://journals.ums.ac.id/index.php/jramathedu
The authors also used software of Microsoft Excel and Minitab in the online learning of the Advanced Statistics course. The result of the research indicated that all the students responded positively to the use of the software, and 72.2% of the students stated that they became skillful or very skillful in analyzing data using the software. The students’ learning outcomes were also in line with the responses. Thus, the results of the research complemented the results of previous data on software application for Statistics class through face-to-face learning and stated that the use of software affected students’ learning outcomes (Fajriyah & Rodriguez, 2018; Mairing, 2020).
Using the asynchronous and synchronous approaches in the research could be a solution to learning problems during the Covid-19 pandemic. Firstly, the approaches combined the chatroom (8 meetings) and video conferencing (6 meetings) platforms. The use of the chatroom platform was to minimize the internet cost and connection constraints, while the video conferencing platform was to address the lack of understanding in online learning (Azhari & Fajri, 2021; Fatoni, et al., 2020). Secondly, the approaches encouraged the students to learn independently using videos, e-books, and textbooks and to discuss the materials and the problem solutions in groups. It was conducted before the synchronous meeting to overcome the lack of interaction between students (Suryaman, et al., 2020). Thirdly, the approaches encouraged the students to be active by presenting and discussing the solutions during synchronous meetings. The meeting time was limited to one hour for video conferencing activity, and two hours for discussion on the chatroom platforms. This was done to overcome the problems of concentration difficulties if online learning were carried out for a long time (Fatoni, et al., 2020).
The implication of the results was the lectures in Statistics subjects both online and face-to-face learning can be carried out with the same main activities. Firstly, the students learned to analyze data using software through videos, e-books, or textbooks independently. Secondly, students’ understanding constructed in independent learning was used to solve problems related to contextual data in groups. Thirdly, the solutions to the problems were presented or demonstrated by the students. Fourthly, the lecturer facilitated the students to have class discussions to interpret and justify the solutions. The difference was only in the interactions between students-students or student-lecturers. In traditional classes, learning was carried out face to face, while in online classes, learning was virtually carried out using certain online platforms.
Conclusion
The results showed that the implementation of asynchronous and synchronous online learning approaches integrated with mathematics problems, Microsoft Excel, Minitab, and videos was effective in improving students’ learning outcomes and skills of using Microsoft Excel during the Covid-19 pandemic. The effectiveness as indicated by the average of the outcomes was more than 75 (scale 0-100), and the skills were increased 1 level higher (scale 1-5). Furthermore, the students positively responded to the approaches and software. The questionnaire results showed that most students got more understanding of the materials through the online learning with asynchronous and synchronous approaches, and they felt very happy or happy while learning independently using the videos, e-books, or textbooks. Also, all the students stated that using Minitab and Microsoft Excel was very suitable or suitable in analyzing data to solve the problems.
Further research can be carried out by using blended learning to investigate the effectiveness of the learning. There are some models in blended learning, namely rotation,
Journal of Research and Advances in Mathematics Education, 6(3), July 2021, 191-205 203
http://journals.ums.ac.id/index.php/jramathedu
flex, self-blend, or enrich-virtual models. An example of the research aim is to compare the effectiveness of those activities in face-to-face learning with one or more blended learning methods to students’ outcomes or responses. The outcomes may be focused on the 4C (critical thinking, creativity, communication, and collaboration), competencies needed in the industrial era 4.0.
Acknowledgment
We would thank the Faculty of Teacher Training and Education from one of the Universities in Central Kalimantan for providing grants so the research could be successfully conducted. We also thanked the Mathematics Education department students who had actively participated in the research. Bibliography
Apriliana, L. P., Handayani, I., & Awalludin, S. A. (2019). The effect of a problem centered learning on student's mathematical critical thinking. JRAMathEdu (Journal of Research and Advances in Mathematics Education), 4(2), 124-133. http://doi.org/10.23917/jramathedu.v4i2.8386
Azhari, B., & Fajri, I. (2021). Distance learning during the Covid-19 pademic: School closure in Indonesia. International Journal of Mathematical Education in Science and Technology, 1-22. http://doi.org/10.1080/0020739X.2021.1875072
Basturk, R. (2005). The effectiveness of computer-assisted instruction in teaching Introductory Statistics. Educational Technology & Society, 8(2), 170-178. Retrieved from https://www.jstor.org/stable/pdf/jeductechsoci.8.2.170.pdf?refreqid=excelsior %3A8c3ed227d680b8a7fe4a892902bdccb0
Buxton, E. C. (2014). Pharmacists’ perception of synchronous versus asynchronous distance Learning for continuing education programs. American Journal of Pharmaceutical Education, 78(1), 1-7. http://doi.org/10.5688/ajpe7818
Chaamwe, N., & Shumba, L. (2016). ICT integrated learning: Using spreadsheets as tools for e-learning, a case of Statistics in Microsoft Excel. International Journal of Information and Education Technology, 6(6), 435-440. http://doi.org/10.7763/IJIET.2016.V6.728
Chasanah, A. N. (2019). Cognitive growth learning model to improve the students' critical thinking skills. JRAMathEdu (Journal of Research and Advances in Mathematics Education), 4(2), 112-123. http://doi.org/10.23917/jramathedu.v4i2.8127
Davidson-Shivers, G. V., Muilenberg, L. Y., & Tanner, E. J. (2001). How do students participate in synchronous and asynchronous online discussions? Journal of Educational Computing Research, 25(4), 351-366. http://doi.org/10.2190/6DCH-BEN3-V7CF-QK47
Fajriyah, R., & Rodriguez, P. C. (2018). Implementing the computer-supported collaborative learning and teaching in a statistics class for the engineering students. 2nd International Conference on Statistics, Mathematics, Teaching and Research (pp. 1-9). Makassar, Indonesia: IOPScience Press. http://doi.org/10.1088/1742-6596/1028/1/012233
Fatoni, Arifiati, N., Nurkhayati, E., Nurdiawati, E., Fidziah, Pamungkas, G., . . . Azizi, E. (2020). University online learning system during Covid-19 pandemic: Advantages, constraints and solutions. Sys Rev Pharm, 11(7), 570-576. Retrieved from https://www.sysrevpharm.org/fulltext/196-1602175161.pdf

204 Journal of Research and Advances in Mathematics Education, 6(3), July 2021, 191-205
http://journals.ums.ac.id/index.php/jramathedu
Febrianto, P. T., Mas'udah, S., & Megasari, L. A. (2020). Impementation of online learning during the Covid-19 pandemic on Madura Island, Indonesia. International Journal of Learning, Teaching and Educational Research, 19(8), 233-245. http://doi.org/10.26803/ijlter.19.8.13
Ghufron, A., & Sutama. (2011). Evaluasi pembelajaran matematika [mathematical learning evaluation]. Jakarta, Indonesia: UT Press.
Giatman, M., Siswati, S., & Bari, I. Y. (2020). Online learning quality control in the pandemic Covid-19 era in Indonesia. Jounal of Nonformal Education, 6(2), 168-175. https://doi.org/10.15294/jne.v6i2.25594
Hastjarjo, T. D. (2019). Rancangan eksperimen-quasi. Buletin Psikologi, 27(2), 187-203. http://doi.org/10.22146/buletinpsikologi.38619
Jafar, A. F., Rusli, Dinar, M., Irwan, & Hastuty. (2020). The effectiveness of video-assited flipped classroom learning model mplementation in integral calculus. Journal of Applied Science, Engineering, Technology, and Education, 2(1), 97-103. http://doi.org/10.35877/454RI.asci2144
Khotimah, R. P., & Masduki. (2016). Improving teaching quality and problem solving ability through contextual teaching and learning in differential equations: A lesson study approach. JRAMathEdu (Journal of Research and Advances in Mathematics Education), 1(1), 1-13. http://doi.org/10.23917/jramathedu.v1i1.1791
Lodico, M. G., Spaulding, D. T., & Voegtle, K. H. (2010). Method in educational research: From theory to practice (2nd ed.). San Francisco, CA: John Willey & Sons, Inc.
Mairing, J. P. (2018). Pemecahan masalah matematika: Cara siswa memperoleh jalan untuk berpikir kreatif dan sikap positif [Mathematics problem solving: The way of students to acquire creative thinking and positive attitudes]. Bandung, Indonesia: Alfabeta.
Mairing, J. P. (2020). The effect of advance statistics learning integrated minitab and excel with teaching teams. International Journal of Instruction, 13(2), 139-150. http://doi.org/10.29333/iji.2020.13210a
Moallem, M. (2015). The impact of synchronous and asynchronous communication tools on learner self-regulation, social presence, immediacy, intimacy and satisfaction in collaborative online learning. The Online Journal of Distance Education and e-Learning, 3(3), 55-77. Retrieved from http://www.tojdel.net/journals/tojdel/volumes/tojdel-volume03-i03.pdf#page=62
Mulyanti, B., Purnama, W., & Pawinanta, R. E. (2020). Distance learning in vocational high schools during Covid-19 pandemic in West Java province, Indonesia. Indonesian Journal of Science & Techonology, 5(2), 271-282. http://doi.org/10.17509/ijost.v5i2.24640
Nieveen, N., & Folmer, E. (2013). Formative evaluation in Educational Design Research. In J. v. Akker, B. Bannan, A. E. Kelly, N. Nieveen, T. Plomp, T. Plomp, & N. Neveen (Eds.), Educational design research. Part A: An introduction (pp. 152-169). Enschede, Netherlands: Netherlands Institute for Curriculum Development (SLO).
Ogbonna, C. G., Ibezim, N. E., & Obi, C. A. (2019). Synchronous versus asynchronous e-learning in teaching word processing: An experimental approach. South African Journal of Education, 39(2), 1-15. http://doi.org/10.15700/saje.v39n2a1383
Putra, Z. H., Witri, G., & Sari, I. K. (2020). Prospective elementary teachers' perspective on online mathematics learning during corona virus outbreak. Journal of Physics: Conference Series, 1655(012057), 1-7. Retrieved from https://iopscience.iop.org/article/10.1088/1742-6596/1655/1/012057

Journal of Research and Advances in Mathematics Education, 6(3), July 2021, 191-205 205
http://journals.ums.ac.id/index.php/jramathedu
Rehman, R., & Fatima, S. S. (2021). An innovative in flipped class room: A teaching model to facilitate synchronous and asynchronous learning during a pandemic. Pakitastan Journal of Medical Sciences, 37(1), 131-136. http://doi.org/10.12669%2Fpjms.37.1.3096
Sindu, I. G., & Paramartha, A. A. (2018). The effect of the instructional media based on lecture video and slide synchronization system on statistics learning achievement. Global Conference on Teaching, Assessment, and Learning in Education (GC-TALE 2017). 42, pp. 1-8. Turkey: SHS Web of Conference. http://doi.org/10.1051/shsconf/20184200073
Suryaman, M., Cahyono, Y., Muliansyah, D., Bustani, O., Suryani, P., Fahlevi, M., . . . Harimurti, S. M. (2020). Covid-19 pandemic and home online learning system: Does it affect the quality of pharmacy school learning. Sys Ref Pharm, 11(8), 524-530. http://doi.org/10.31838/srp.2020.8.74
Tan, S., Zou, L., & Wijaya, T. T. (2020). Using video learning to improve students' mathematical ability. Journal of Didactic Mathematics, 1(3), 117-126. http://doi.org/10.34007/jdm.v1i3.364
Triola, M. F., Goodman, W. M., Law, R., & Labute, G. (2011). Elementary statistics (3rd ed.). Toronto, Canada: Pearson Canada Inc.
UI, A. P. (2020, Maret 20). Pendidikan Jarak Jauh Universitas Indonesia. Retrieved November 18, 2020, from Sinkronus atau asinkronus: https://pjj.ui.ac.id/ufaqs/sinkronus-atau-asinkronus
Wijaya, T. T. (2021). How Chinese students learn mathematics during the corona virus pandemic. International Journal of Educational Research and Innovation, 15, 1-16. http://doi.org/10.46661/ijeri.4950