synapsereport.2000 04.vt dept of taxation.valuation of hydroelectric facilities in vt.00 13...
TRANSCRIPT
22 Crescent Street • Cambridge MA, 02138 • (617) 661-3248 • www.synapse-energy.com
Valuation of Hydroelectric Generating Facilities on the Connecticut and Deerfield
Rivers in Vermont (Technical Report)
Prepared for Vermont Department of Taxes Prepared by Bruce Biewald, Daniel Allen, David White, Neil Talbot, Paul Kirshen Synapse Energy Economics, Inc. Lawrence K. Martin MAI Martin Appraisal Services, Inc. Paul Chernick, Rachel Brailove Resource Insight, Inc. April 1, 2000
Table of Contents
1. Introduction & Summary........................................................................................... 1
2. Income Approach........................................................................................................ 3 2.1 Description........................................................................................................ 3 2.2 Discounting....................................................................................................... 3 2.3 Key Inputs for Hydro Facilities ........................................................................ 4 2.4 Energy Market Prices........................................................................................ 5 2.5 Upstream Allocations...................................................................................... 13 2.6 Results............................................................................................................. 16
3. Replacement Cost Approach ................................................................................... 17 3.1 Description...................................................................................................... 17 3.2 Key Inputs for Equivalent Generation Facilities ............................................ 18 3.3 Results............................................................................................................. 19
4. Comparable Sales Approach ................................................................................... 21 4.1 Description...................................................................................................... 21 4.2 Model Construct.............................................................................................. 21 4.4 Consideration of Specific Sales ...................................................................... 23 4.5 Conclusions..................................................................................................... 26
APPENDICES................................................................................................................. 27
List of Tables
Table 1.1 Summary of Appraised Facilities ................................................................... 1
Table 1.2 Summary of Appraised Value......................................................................... 2
Table 2.1 Market Price Forecast ..................................................................................... 6
Table 2.2 Plant Summary Information........................................................................... 7
Table 2.3 Summary of Settlement Adjustments............................................................. 9
Table 2.4 ISO New England Market Prices for 1999 .................................................. 11
Table 2.5 Capacity Credit Calculation.......................................................................... 12

Table 2.6 Upstream Allocation by Facility ................................................................... 15
Table 2.7 Appraised Values (Income Approach) ......................................................... 16
Table 3.1 Summary of Combined Cycle & Combustion Turbine Inputs.................. 17
Table 3.2 Energy Prices for Combined Cycle & Combustion Turbine Plants.......... 19
Table 3.3 Appraised Values (Replacement Cost Approach)....................................... 20
Table 4.1 Generator Sales Database.............................................................................. 22
Table 4.2 Performance Figures for Divested Hydro Generating Assets.................... 24
List of Figures
Figure 2.1 Historic Generation for the Deerfield River ................................................ 8
Figure 2.2 Average Monthly Capacity Factors .............................................................. 8
Figure 3.1 Market Price v. Capacity Value .................................................................. 18
Appendices
Appendix A: Additional Input Data Used in the ELFIN Dispatch Model
Appendix B: Comparison of Forecasts of Electricity Market Prices in New England
Appendix C: Discounting and Financial Considerations
Appendix D: Re-licensing Considerations
Appendix E: Environmental Premium
Appendix F: Cash Flow Detail: Income Approach
Appendix G: Cash Flow Detail: Replacement Cost Approach
Appendix H: Historic Generation by Facility

Page 1
1. Introduction & Summary In accordance with the instructions of the Vermont Department of Taxes, Synapse-Energy Economics, Inc. with subcontractors Resource Insight, Inc. and Martin Appraisal Services, Inc. has prepared an appraisal of selected hydroelectric facilities located on the Connecticut and Deerfield Rivers owned by USGen New England, Inc. (PG&E). This document is the “Technical Report” and is part of the appraisal reports prepared for The Vermont Department of Taxes on nine different facilities. This document should not be considered as a separate appraisal report, but rather as part of the nine individual appraisal reports. Table 1.1 summarizes the characteristics of the facilities appraised.
Table 1.1 Summary of Appraised Facilities USGen New England, Inc. (PG&E) Hydroelectric Facility Overview
Station FERC ID Nominal Capacity
Capacity Factor
Facility Location
Connecticut River Stations Moore Development 2077 191 MW 16.2% Littleton, NH; Waterford, VT Comerford Development 2077 164 MW 21.9% Monroe, NH; Barnet, VT McIndoes Falls Development 2077 13 MW 45.9% Monroe, NH; Barnet, VT Wilder Station 1892 41 MW 41.2% Hartford, VT; Lebanon, NH Bellows Falls Station 1855 48 MW 56.8% Rockingham, VT; Walpole, NH Vernon Station 1904 22 MW 60.7% Vernon, VT; Hinsdale, NH Deerfield River Facilities Somerset Development 2323 Somerset, VT Searsburg Development 2323 5 MW 54.5% Searsburg, VT Harriman Development 2323 40 MW 30.7% Whitingham, VT
In preparing the appraisal of these facilities three different valuation techniques were employed. The first technique employed was the Income Approach, presented in section 2 of this report. The second approach was the Replacement Cost Approach, presented in section 3 of this report, and lastly the Comparable Sales Approach was considered and is presented in section 4 of this report. The results of the Income and Replacement Cost Approaches are summarized in Table 1.2. The Comparable Sales Approach was considered inappropriate for use in this valuation for reasons detailed in section 4.

Page 2
Table 1.2 Summary of Appraised Value Summary of USGen New England, Inc. (PG&E) Connecticut and
Deerfield River Hydropower Facilities Market Valuations ($ 000’s) Station Income Approach Replacement Cost Moore $226,979 $211,737 Comerford $160,471 $152,803 McIndoes $14,639 $15,351 Wilder $50,571 $48,966 Bellows Falls $75,246 $76,273 Vernon $28,088 $26,560 Total Connecticut River: $555,994 $531,690 Somerset $916 $869 Searsburg $5,361 $5,082 Harriman $59,496 $55,266 Total Deerfield River: $65,773 $61,217 Total Value: $621,767 $592,907
Synapse Energy Economics, Inc. and its subcontractors believe that the Income Approach offers the best guide to value in this appraisal. This approach is the most detailed and accurate of the three approaches used in this report and it is the type of analysis that a potential purchaser of the assets would use in determining an offer price. The Income Approach involves a simulation analysis of the entire New England power system in order to project electricity market prices by time period.
The Replacement Cost Approach, as applied here, is similar to the Income approach but rather than simulating the full electricity market, it answers the question: how much would it cost to replace the hydroelectric plants’ capacity and energy using the most cost-effective alternative, i.e., new gas-fired combustion turbine or combined-cycle generation.
Finally, the Comparable Sales Approach considers actual sales of generating plants. Given the lack of maturity in the hydroelectric generation sales market, as well as a lack of sales, which are directly comparable to the facilities considered in this report, it was considered inappropriate to use the Comparable Sales Approach in valuing the hydroelectric assets of PG&E on the Connecticut and Deerfield Rivers.
A Reproduction Cost Analysis has not been conducted since it is not realistic to assume that new hydroelectric facilities could be built in the region due to environmental considerations. The three approaches which have been applied in this report have all provided useful information, and of these the Income Approach offers the best guide to current market value.
Page 3
2. Income Approach
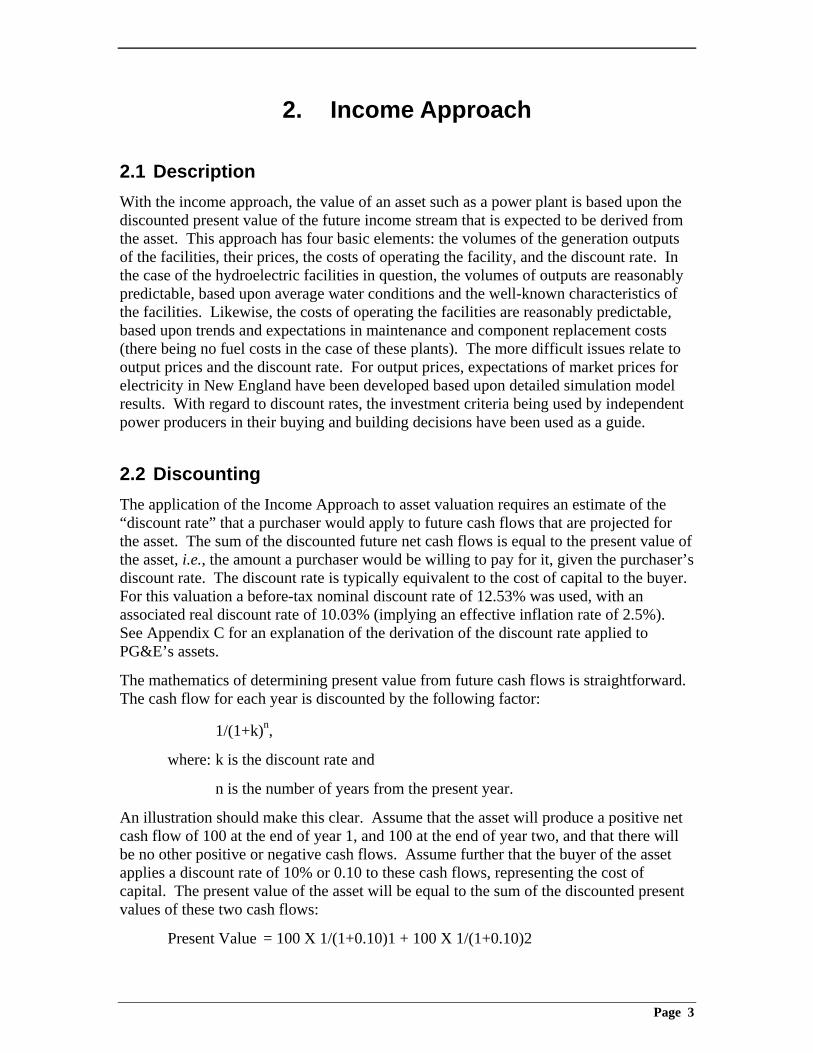
2.1 Description With the income approach, the value of an asset such as a power plant is based upon the discounted present value of the future income stream that is expected to be derived from the asset. This approach has four basic elements: the volumes of the generation outputs of the facilities, their prices, the costs of operating the facility, and the discount rate. In the case of the hydroelectric facilities in question, the volumes of outputs are reasonably predictable, based upon average water conditions and the well-known characteristics of the facilities. Likewise, the costs of operating the facilities are reasonably predictable, based upon trends and expectations in maintenance and component replacement costs (there being no fuel costs in the case of these plants). The more difficult issues relate to output prices and the discount rate. For output prices, expectations of market prices for electricity in New England have been developed based upon detailed simulation model results. With regard to discount rates, the investment criteria being used by independent power producers in their buying and building decisions have been used as a guide.
2.2 Discounting The application of the Income Approach to asset valuation requires an estimate of the “discount rate” that a purchaser would apply to future cash flows that are projected for the asset. The sum of the discounted future net cash flows is equal to the present value of the asset, i.e., the amount a purchaser would be willing to pay for it, given the purchaser’s discount rate. The discount rate is typically equivalent to the cost of capital to the buyer. For this valuation a before-tax nominal discount rate of 12.53% was used, with an associated real discount rate of 10.03% (implying an effective inflation rate of 2.5%). See Appendix C for an explanation of the derivation of the discount rate applied to PG&E’s assets.
The mathematics of determining present value from future cash flows is straightforward. The cash flow for each year is discounted by the following factor:
1/(1+k)n,
where: k is the discount rate and
n is the number of years from the present year.
An illustration should make this clear. Assume that the asset will produce a positive net cash flow of 100 at the end of year 1, and 100 at the end of year two, and that there will be no other positive or negative cash flows. Assume further that the buyer of the asset applies a discount rate of 10% or 0.10 to these cash flows, representing the cost of capital. The present value of the asset will be equal to the sum of the discounted present values of these two cash flows:
Present Value = 100 X 1/(1+0.10)1 + 100 X 1/(1+0.10)2

Page 4
= 100 X 1/(1.1) + 100 X 1/(1.21)
= 90.9 + 82.6
= 173.5
Clearly, discounting has a considerable impact on the estimation process. On an undiscounted basis, the cash flows would sum to 200, but with discounting their present value to the buyer is only 173.5.
It follows that the more distant the cash flows, the greater the impact of the discount rate on the present value of the cash flows to the purchaser today. It follows further that the magnitude of the discount rate is also extremely important: the higher the discount rate, the lower the present value. Again, the impact of an increase in the discount rate is greater on the present value of more distant cash flows than it is on the present value of near-term cash flows.
Once the relevant time horizon, appropriate discount rate and anticipated cash flows are estimated, the analysis described above is carried out. The end result is the estimated value of the asset in question. The Income Approach is the method used in this section to value the nine assets in question held by PG&E on the Connecticut and Deerfield Rivers.
2.3 Key Inputs for Hydro Facilities The income approach relied upon data provided by PG&E, and data from other sources. The data from various other sources that was relied upon included:
• Operating & maintenance (O&M) cost information from FERC Form No. 1 filings,
• electricity market information for the New England region, as described in Appendix A,
• market prices for ancillary services, and
• information on environmental policies and certification, as described in Appendix E.
Information that was relied upon that was provided by PG&E included:
• Monthly generation for each hydro facility for last 20 years of operation, as detailed in Appendix H,
• operating constraints and characteristics of each unit,
• re-licensing applications and estimates,
• historic average reservoir levels for each plant, and
• scheduled maintenance outages.

Page 5
PG&E would not provide certain information that was requested, stating that the information was commercially sensitive and proprietary in nature. The information requested but not provided included:
• Data on the amounts of ancillary services provided in the regional market from the hydro facilities,
• information on the bids and bidding strategies employed by PG&E,
• information on the flow schedules and hourly generation from the hydro facilities, and
• allocations of O&M costs to transformers.
While the information that PG&E would not provide would have been helpful in preparing the valuation analysis, the estimates of value prepared based upon the available information are wholly reliable.
2.4 Energy Market Prices The revenue component to the Income Approach depends on the operation of PG&E’s hydroelectric plants in the New England market, and most importantly upon the market prices. The modeling of the operation and valuation of the PG&E’s hydroelectric plants in the context of the New England electricity market involved the following steps:
1. Identification of key station characteristics (generation capacity, reservoir size, etc.).
2. Determination of normal monthly hydroelectric station generation.
3. Adjustment of historic hydroelectric generation (including minimum generation) to represent new settlement agreements.
4. Calculation of the energy value of the hydroelectric plant generation within NEPOOL using the Elfin simulation model.
5. Use of the energy value from Elfin as well as ancillary, capacity and environmental values from other sources to calculate the facility revenue flows.
6. Upstream allocation of values from downstream facilities (Searsburg to Somerset only).
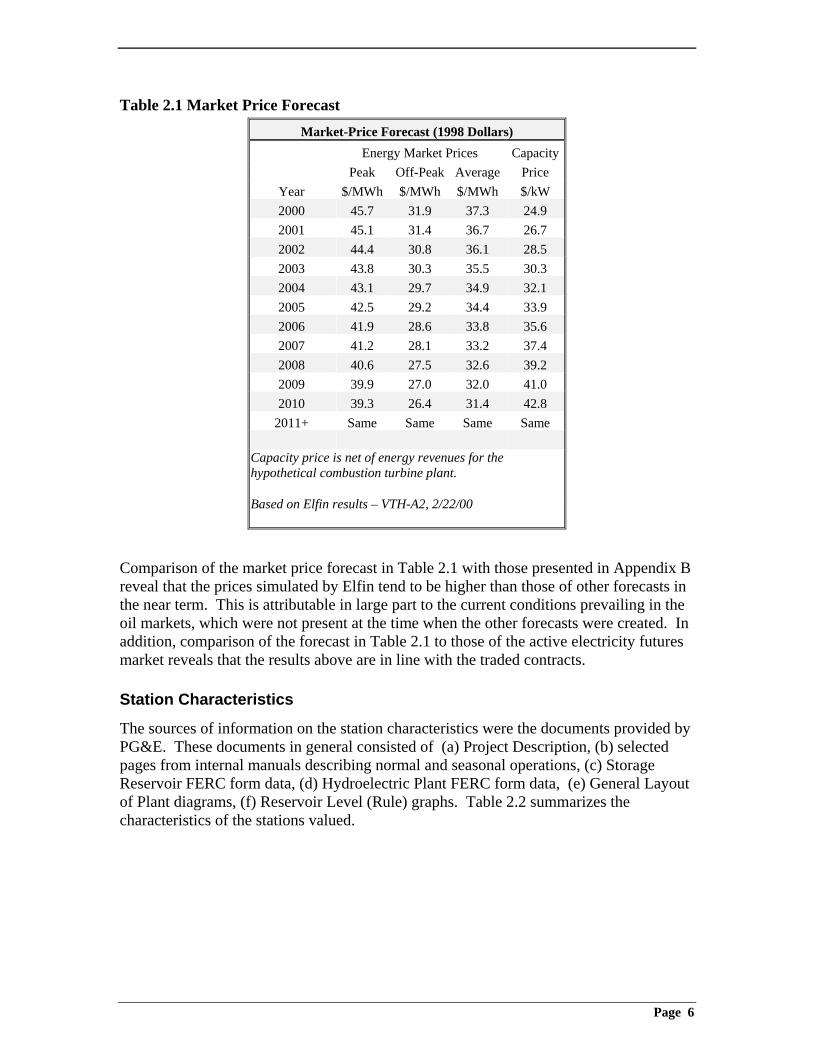
Table 2.1 below summarizes the energy market prices as calculated using ELFIN. For a comparison of various sources of electricity market prices in New England see Appendix B.
Page 6
Table 2.1 Market Price Forecast Market-Price Forecast (1998 Dollars)
Energy Market Prices Capacity Peak Off-Peak Average Price
Year $/MWh $/MWh $/MWh $/kW 2000 45.7 31.9 37.3 24.9 2001 45.1 31.4 36.7 26.7 2002 44.4 30.8 36.1 28.5 2003 43.8 30.3 35.5 30.3 2004 43.1 29.7 34.9 32.1 2005 42.5 29.2 34.4 33.9 2006 41.9 28.6 33.8 35.6 2007 41.2 28.1 33.2 37.4 2008 40.6 27.5 32.6 39.2 2009 39.9 27.0 32.0 41.0 2010 39.3 26.4 31.4 42.8
2011+ Same Same Same Same
Capacity price is net of energy revenues for the hypothetical combustion turbine plant.
Based on Elfin results – VTH-A2, 2/22/00
Comparison of the market price forecast in Table 2.1 with those presented in Appendix B reveal that the prices simulated by Elfin tend to be higher than those of other forecasts in the near term. This is attributable in large part to the current conditions prevailing in the oil markets, which were not present at the time when the other forecasts were created. In addition, comparison of the forecast in Table 2.1 to those of the active electricity futures market reveals that the results above are in line with the traded contracts.
Station Characteristics
The sources of information on the station characteristics were the documents provided by PG&E. These documents in general consisted of (a) Project Description, (b) selected pages from internal manuals describing normal and seasonal operations, (c) Storage Reservoir FERC form data, (d) Hydroelectric Plant FERC form data, (e) General Layout of Plant diagrams, (f) Reservoir Level (Rule) graphs. Table 2.2 summarizes the characteristics of the stations valued.
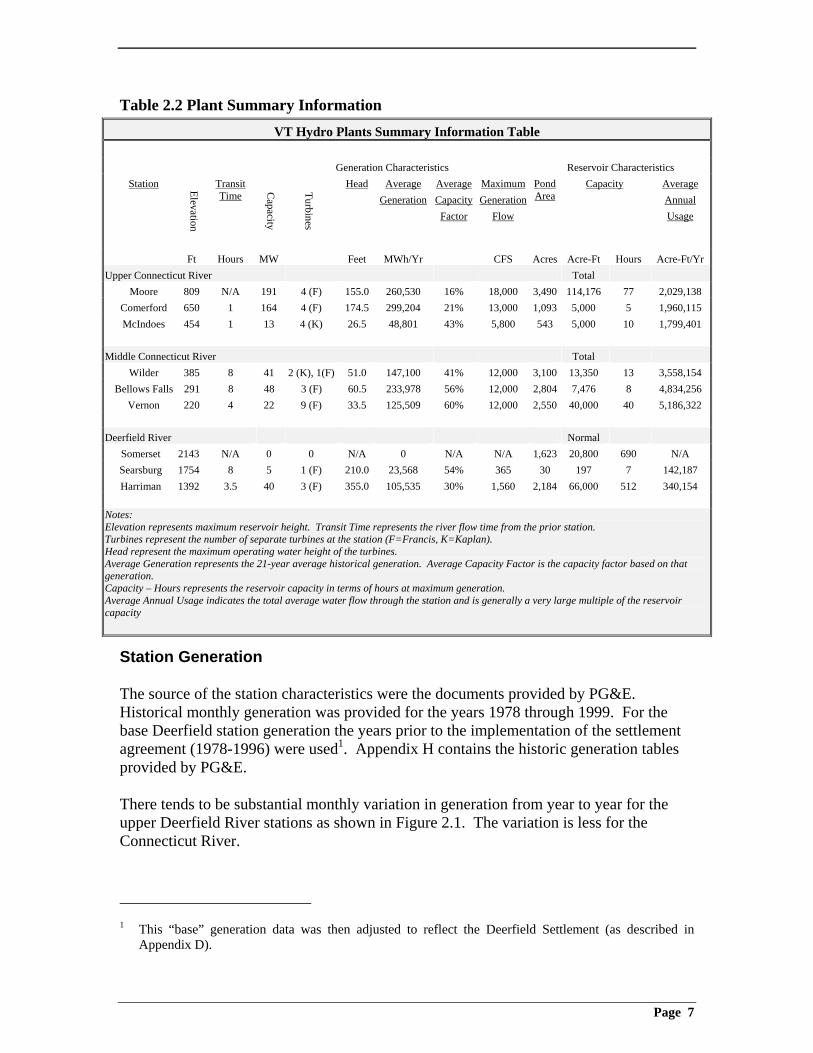
Page 7
Table 2.2 Plant Summary Information VT Hydro Plants Summary Information Table
Generation Characteristics Reservoir Characteristics Station Elevation
Transit Time
Capacity
Turbines
Head Average Generation
AverageCapacityFactor
MaximumGeneration
Flow
Pond Area
Capacity Average Annual Usage
Ft Hours MW Feet MWh/Yr CFS Acres Acre-Ft Hours Acre-Ft/Yr Upper Connecticut River Total Moore 809 N/A 191 4 (F) 155.0 260,530 16% 18,000 3,490 114,176 77 2,029,138 Comerford 650 1 164 4 (F) 174.5 299,204 21% 13,000 1,093 5,000 5 1,960,115 McIndoes 454 1 13 4 (K) 26.5 48,801 43% 5,800 543 5,000 10 1,799,401 Middle Connecticut River Total Wilder 385 8 41 2 (K), 1(F) 51.0 147,100 41% 12,000 3,100 13,350 13 3,558,154 Bellows Falls 291 8 48 3 (F) 60.5 233,978 56% 12,000 2,804 7,476 8 4,834,256 Vernon 220 4 22 9 (F) 33.5 125,509 60% 12,000 2,550 40,000 40 5,186,322 Deerfield River Normal Somerset 2143 N/A 0 0 N/A 0 N/A N/A 1,623 20,800 690 N/A Searsburg 1754 8 5 1 (F) 210.0 23,568 54% 365 30 197 7 142,187 Harriman 1392 3.5 40 3 (F) 355.0 105,535 30% 1,560 2,184 66,000 512 340,154 Notes: Elevation represents maximum reservoir height. Transit Time represents the river flow time from the prior station. Turbines represent the number of separate turbines at the station (F=Francis, K=Kaplan). Head represent the maximum operating water height of the turbines. Average Generation represents the 21-year average historical generation. Average Capacity Factor is the capacity factor based on that generation. Capacity – Hours represents the reservoir capacity in terms of hours at maximum generation. Average Annual Usage indicates the total average water flow through the station and is generally a very large multiple of the reservoir capacity
Station Generation
The source of the station characteristics were the documents provided by PG&E. Historical monthly generation was provided for the years 1978 through 1999. For the base Deerfield station generation the years prior to the implementation of the settlement agreement (1978-1996) were used1. Appendix H contains the historic generation tables provided by PG&E.
There tends to be substantial monthly variation in generation from year to year for the upper Deerfield River stations as shown in Figure 2.1. The variation is less for the Connecticut River.
1 This “base” generation data was then adjusted to reflect the Deerfield Settlement (as described in
Appendix D).

Page 8
Figure 2.1 Historic Generation for the Deerfield River
Harriman & Searsburg Generation
0
5000
10000
15000
20000
25000
30000
JAN
FEB
MARCH
APRIL
MAYJU
NEJU
LY AUG
SEPTOCT
NOVDEC
MW
H1988
1989
1990
1991
1992
1993
1994
1995
1996
1997
1998
Avg
Figure 2.2 shows the monthly average capacity factors for the Deerfield River stations that were valued. Note that the substantial Winter generation is associated with reservoir draw down in anticipation of Spring flows.
Figure 2.2 Average Monthly Capacity Factors
Deerfield Stations Average Monthly CapFac
0%10%20%30%40%50%60%70%80%90%
100%
JAN
FEB
MARCHAPR
ILMAY
JUNE
JULY AUG
SEPT
OCTNOV
DEC
Searsburg
Harriman
Settlement Agreement Representation
Hydroelectric generating stations must undergo licensing by FERC in order to remain in operation. The license agreements may impose restrictions on pondage, flow,
Page 9
environmental conditions and the like. The primary sources of data on the FERC re-licensing Settlement Agreements were the documents provided by PG&E. For the Deerfield river facilities that were relied upon, the Operational Constraints chart supplemented the information from the settlement agreement. For the upper CT River plants, information from the proposed, yet-to-be-implemented, settlement agreement was used.
The agreements modified historic operational patterns in a number of ways: (a) minimum flows, (b) bypass flows, (c) reservoir height restrictions, (d) ramp rates.
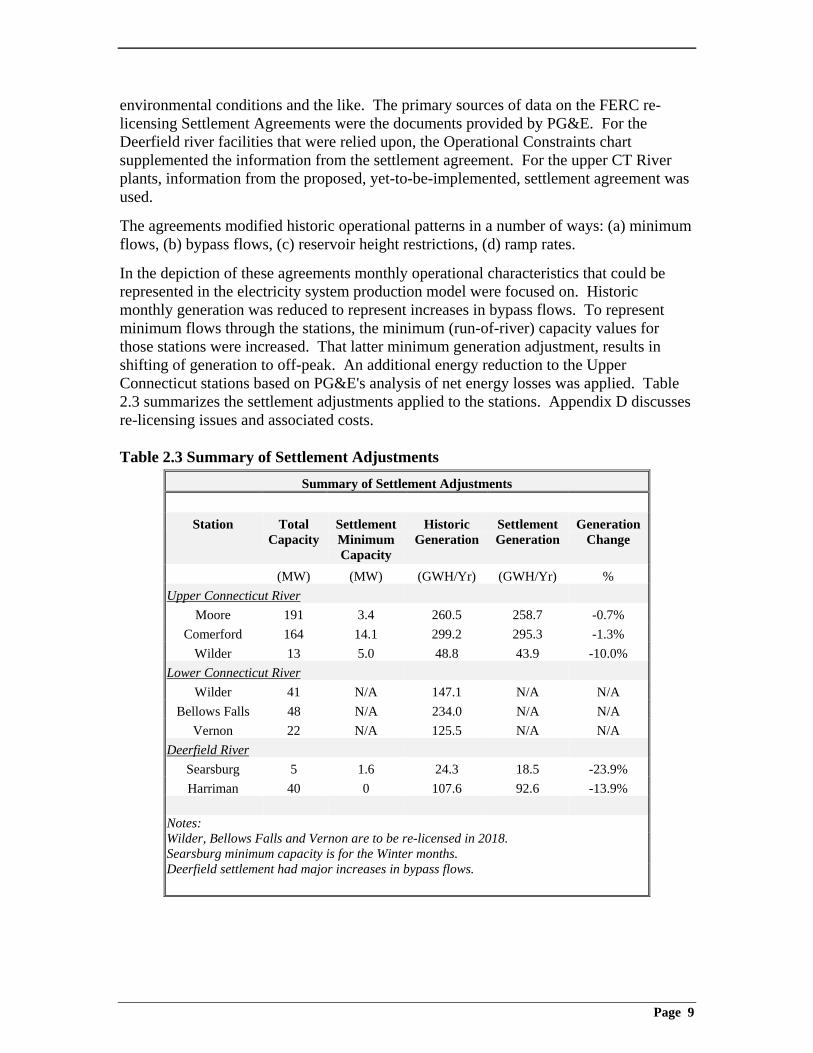
In the depiction of these agreements monthly operational characteristics that could be represented in the electricity system production model were focused on. Historic monthly generation was reduced to represent increases in bypass flows. To represent minimum flows through the stations, the minimum (run-of-river) capacity values for those stations were increased. That latter minimum generation adjustment, results in shifting of generation to off-peak. An additional energy reduction to the Upper Connecticut stations based on PG&E's analysis of net energy losses was applied. Table 2.3 summarizes the settlement adjustments applied to the stations. Appendix D discusses re-licensing issues and associated costs.
Table 2.3 Summary of Settlement Adjustments Summary of Settlement Adjustments
Station Total
Capacity Settlement Minimum Capacity
Historic Generation
Settlement Generation
Generation Change
(MW) (MW) (GWH/Yr) (GWH/Yr) % Upper Connecticut River
Moore 191 3.4 260.5 258.7 -0.7% Comerford 164 14.1 299.2 295.3 -1.3%
Wilder 13 5.0 48.8 43.9 -10.0% Lower Connecticut River
Wilder 41 N/A 147.1 N/A N/A Bellows Falls 48 N/A 234.0 N/A N/A
Vernon 22 N/A 125.5 N/A N/A Deerfield River
Searsburg 5 1.6 24.3 18.5 -23.9% Harriman 40 0 107.6 92.6 -13.9%
Notes: Wilder, Bellows Falls and Vernon are to be re-licensed in 2018. Searsburg minimum capacity is for the Winter months. Deerfield settlement had major increases in bypass flows.

Page 10
For the Lower Connecticut, which are not to be re-licensed until 2018, the recent re-licensing costs of the Upper Connecticut stations were used as the model. For the eventual costs of re-licensing the Lower Connecticut plants, an initial cost of six million dollars in 2018 and an ongoing cost of one million dollars thereafter to represent lost generation value due to the imposition of new operating constraints was incorporated into the analysis. These costs were then allocated to facilities proportionally to the station annual generation.
Electric System Modeling
Monthly station energy, total capacity and minimum capacity values were used as inputs to the electricity production model, Elfin, to calculate energy prices for each hydroelectric plant based on its operating characteristics. More discussion about the other inputs used in the production model can be found in Appendix A.
Energy, Ancillary, Capacity and Environmental Value Determination
Ancillary Value
A primary source for evaluating ancillary services were the 1999 New England market prices. There has been a competitive energy market in New England since May of 1999. During that period prices have been somewhat volatile as the market rules have been refined and as the market participants adjust to new ways of doing business. Table 2.4 summarizes some of the basic market information from the first eight months of operation.
Peak loads were unexpectedly high in June and July at the same time that the market was getting established, consequently market prices took some extreme turns. This is shown in the average energy prices for those months, but even more so by the maximum energy prices which were 15 to 20 times the average. It was these relatively few hours of very high prices that raised the monthly averages. Another measure of the extreme range of prices is given by the standard deviations, which for June is twice the average. The prices for various ancillary services also are very high for those two months.
Since the first two months represent startup and market conditions that are not likely to be common, the analysis of ancillary service prices focuses on the data for the July through December period. This excludes the first two months of market operation, but includes the data for July, recognizing that some price spikes may reasonably be expected to occur in the future.
The ancillary service value for hydro plants was based on the 10-minute reserve price. To be conservative an average of the spinning and non-spinning prices was used giving a value of $4.78/MWh for an equivalent value of $41.9/kW-Yr. In the actual calculations this credit was adjusted downward based on the unused plant capacity (e.g. a plant with a 50% capacity factor only has its capacity available half of the time for the reserve market and thus only gets half the credit).

Page 11
Table 2.4 ISO New England Market Prices for 1999 ISO New England Market Prices for 1999
Data: May June July Aug Sep Oct Nov Dec Jul-DecLoad (MW) Average 12,314 14,576 15,899 14,940 13,985 12,890 13,315 14,728 14,293Standard Deviation 2,269 3,203 3,203 2,932 2,888 2,262 2,455 2,023 2,627 Peak 15,774 21,749 22,544 20,785 20,291 16,510 18,624 19,155 22,544Energy Price ($/MWh)
Average 28.20 49.18 41.14 29.25 28.42 24.81 24.88 24.33 28.81 Standard Deviation 5.46 96.58 56.46 6.90 9.32 9.14 8.75 6.40 16.16 Maximum 72.04 1003.21 572.54 80.39 81.34 188.07 109.04 49.37 572.54Spinning Reserve Price ($/MWh)
Average 0.56 11.48 17.26 3.15 4.03 4.61 4.16 1.84 5.84 Standard Deviation 2.18 59.10 90.86 6.10 6.36 5.31 12.71 1.53 20.48 Maximum 46.44 807.34 986.07 80.39 51.78 52.77 273.08 22.80 986.07Non-Spinning Reserve Price ($/MWh)
Average 0.10 8.03 11.15 1.82 2.32 2.24 3.38 1.42 3.72 Standard Deviation 0.09 29.29 28.81 7.42 8.91 5.36 13.12 5.36 11.50 30-Minute Reserve Price ($/MWh)
Average 0.01 5.76 9.17 1.51 1.93 0.29 6.75 0.01 3.28 Standard Deviation 0.04 22.89 25.85 6.97 8.34 1.14 87.95 0.05 21.72 Automatic Generation Control Price ($/MWh)
Average 3.81 4.19 4.93 5.13 3.74 3.42 3.42 3.37 4.00 Standard Deviation 2.10 3.57 4.62 3.11 3.95 3.61 1.02 0.79 2.85 Maximum 27.22 21.69 71.12 21.29 93.46 72.02 10.78 13.98 93.46
Data in this table was derived from hourly data reported by ISO-NE.
Capacity Value
The computation of the market price for capacity started with the $400/kW construction cost for a Combustion Turbine (CT) plant (see Appendix A). Given the financial assumptions used, the required real-levelized fixed charge rate over the book life of the CT is 11.02% (see Appendix A), resulting in a carrying charge of $44.08/kW-yr. (in 1998 dollars). Including the annual fixed O&M charges of $7.02/kW-yr. (with Administrative & General), the total annual capacity cost is $51.10/kW-yr. (in 1998 dollars). The total CT capacity cost is then reduced by the CT's energy revenues to yield the market capacity price. The energy revenues for a new CT, as determined in the Elfin model, amount to
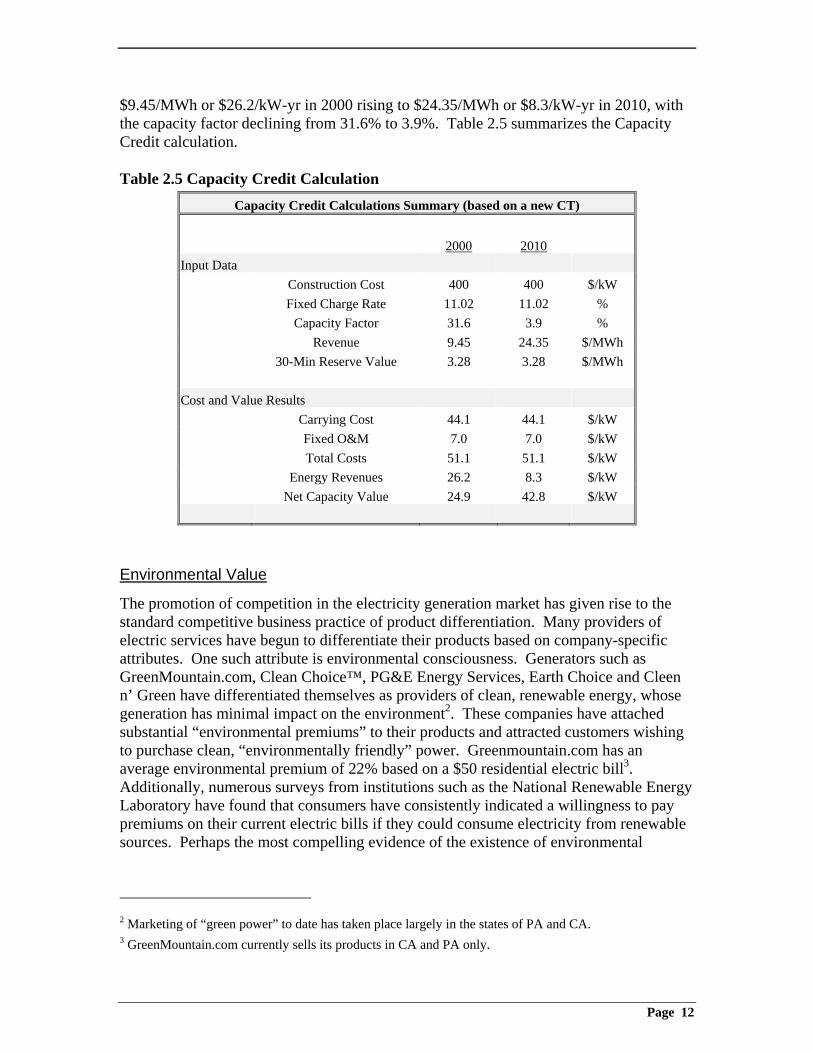
Page 12
$9.45/MWh or $26.2/kW-yr in 2000 rising to $24.35/MWh or $8.3/kW-yr in 2010, with the capacity factor declining from 31.6% to 3.9%. Table 2.5 summarizes the Capacity Credit calculation.
Table 2.5 Capacity Credit Calculation Capacity Credit Calculations Summary (based on a new CT)
2000 2010
Input Data Construction Cost 400 400 $/kW Fixed Charge Rate 11.02 11.02 % Capacity Factor 31.6 3.9 % Revenue 9.45 24.35 $/MWh 30-Min Reserve Value 3.28 3.28 $/MWh
Cost and Value Results Carrying Cost 44.1 44.1 $/kW Fixed O&M 7.0 7.0 $/kW Total Costs 51.1 51.1 $/kW Energy Revenues 26.2 8.3 $/kW Net Capacity Value 24.9 42.8 $/kW
Environmental Value
The promotion of competition in the electricity generation market has given rise to the standard competitive business practice of product differentiation. Many providers of electric services have begun to differentiate their products based on company-specific attributes. One such attribute is environmental consciousness. Generators such as GreenMountain.com, Clean Choice™, PG&E Energy Services, Earth Choice and Cleen n’ Green have differentiated themselves as providers of clean, renewable energy, whose generation has minimal impact on the environment2. These companies have attached substantial “environmental premiums” to their products and attracted customers wishing to purchase clean, “environmentally friendly” power. Greenmountain.com has an average environmental premium of 22% based on a $50 residential electric bill3. Additionally, numerous surveys from institutions such as the National Renewable Energy Laboratory have found that consumers have consistently indicated a willingness to pay premiums on their current electric bills if they could consume electricity from renewable sources. Perhaps the most compelling evidence of the existence of environmental
2 Marketing of “green power” to date has taken place largely in the states of PA and CA. 3 GreenMountain.com currently sells its products in CA and PA only.

Page 13
premiums in the actively traded green power market in California where premiums are seen in daily trading.
Given the evidence of consumer willingness to consume renewable energy and the existence of actively traded green power markets it is likely that PG&E will market its hydroelectric generation as a renewable “green” source of power. Also there are renewable portfolio standards proposed and in place in the New England region, requiring electricity suppliers to have specific amounts of renewable generation in their portfolios. To recognize this in the valuation analysis, an environmental premium of $4/MWh has been added to the energy prices for plants that have (or will soon have) been re-licensed by FERC and are therefore expected to satisfy the independent certification criterion for The Low Impact Hydro guidelines and to be eligible for Green-e certification. For plants that will not be re-licensed for some time (lower CT River plants) an environmental premium of $2/MWh was applied. The premiums of $2/MWh and $4/MWh were estimated based on surveys and studies as well as on current market practices. For a discussion of certification organizations and environmental premium estimation see Appendix E.
2.5 Upstream Allocations
A special problem arises in valuing the Somerset Facility on the Deerfield River, which is just a storage reservoir with no generating capacity, the Harriman Station on the Deerfield River, which is both a storage reservoir and a generating station and the Moore Development on the Connecticut River, which, like Harriman is both a storage reservoir and a generating station. The value of these facilities lies partially in how they affect the generation of the stations downstream of their locations. These three facilities were considered due to their large storage capacity and location along the river system. All stations have some storage capability but none are substantial enough to significantly affect downstream stations with the exception of the three presented. Upstream reservoirs benefit downstream hydroelectric facilities in two ways:
1. They store excess flows to reduce spillage and potential energy loss in the downstream generators.
2. They allow the downstream facilities to better schedule their time of generation to match periods of higher energy prices.
Thus if it were not for upstream storage reservoirs, downstream hydroelectric facilities would have increased spillage and thus generate less energy and also have reduced flexibility in times of generation and thus get lower prices.
In this study a two-part approach was used to calculate these effects.
For calculation of spillage (energy loss) the historic hourly stream flows were collected and compared those with the maximum useable flow to calculate the lost generation.

Page 14
For energy price effects, the current generation mix during peak and off-peak periods was the starting point. The amount of generation that would shift to off-peak periods (and prices) in the absence of the upstream reservoir was then estimated. This effect is moderated by size of the reservoir at the generating facility itself.
Hydro facilities with low capacity factors have a lot of reserve potential for handling greater flows, thus the energy loss will be moderated. However, such low capacity factor plants are currently selling most of their energy at higher prices, thus the energy price effect will be greater as they lose scheduling flexibility.
The combined energy loss and energy price effects produce a total revenue impact on the downstream facility operating without the benefit of the upstream reservoir. Since the reservoir and the generator are interdependent only one-half of that net value to the upstream reservoir is assigned.
Table 2.6 on the following page details the affects of the upstream reservoirs on the appropriate downstream stations. It is seen that the value of Searsburg is significantly affected by the Somerset Reservoir and the value of PG&E’s downstream facilities on the Deerfield River are significantly affected by the Harriman Station. The five PG&E stations on the Connecticut River below the Moore Development are significantly affected by the operation of the Moore Reservoir.
Stations on the Connecticut River below the Vernon Station are owned by companies other than PG&E. It is assumed that PG&E runs the river for their maximum benefit and not for the benefit of those stations below its own. To this affect, the water leaving the Vernon station may then be considered a public good which will provide no private value to PG&E. For this reason the value of plants not owned by PG&E below Moore are assumed to derive no incremental value from Moore.

Page 15
Table 2.6 Upstream Allocation by Facility Downstream Facility
Searsburg Lower Deerfield
Comerford McIndoes Wilder Bellows Falls
Vernon Units
Upstream Facility
Somerset Harriman Moore Moore Moore Moore Moore
Capacity 5.0 40.0 164.0 13.0 41.0 48.0 22.0 MW Generation 18,481 162,700 295,314 43,919 147,100 233,978 125,509 MWh Capacity Factor
42.2% 46.4% 20.6% 38.6% 41.0% 55.6% 65.1%
Maximum Generation Flow
365 1,416 13,000 5,800 12,000 12,000 12,000 CFS
Energy Price 45.2 43.95 48.9 43.0 44.8 42.1 41.6 $/MWh Energy Revenue
909 82 15,622 1,968 6,884 10,318 5,472 %$
Capacity Revenue
189 18 6,985 502 1,560 1,670 719 %$
Total Revenue
1,098 100 22,607 2,469 8,445 11,989 6,191 %$
Total Cost 467 32 5,736 688 2,855 3,579 2,882 %$ Net Revenue 631 68 16,871 1,781 5,590 8,410 3,309 %$ Generation Loss Factor
17.6% 25.2% 2.1% 27.1% 8.1% 11.1% 11.2%
Adjusted Capacity Factor
34.8% 34.7% 20.1% 28.1% 37.6% 49.4% 57.8%
Energy Price Adjustment
-3.2% -9.7% -18.3% -9.6% -6.3% -2.6% -1.6%
New Energy Price
43.7 39.7 40.0 38.9 42.0 41.0 40.9 $/MWh
Adjusted Energy Revenue
725 56 12,501 1,297 5,930 8,931 4,783 %$
Adjusted Net Revenue
447 41 13,750 1,111 4,635 7,022 2,620 %$
Total Upstream Value Credit
29.2% 39.4% 18.5% 37.6% 17.1% 16.5% 20.8%
Share Fraction
50.0% 50.0% 50.0% 50.0% 50.0% 50.0% 50.0%
Notes: Facilities with higher capacity factors have more generation loss but less energy price impact. Net % effects are greater than generation and price effects because of fixed expenses. Uses post-settlement generation and flows.

Page 16
2.6 Results Appendix F contains detailed cash flow tables by facility for each of the PG&E generating stations. The application of the income approach incorporating the information described in this section produced the following results by facility:
Table 2.7 Appraised Values (Income Approach) Appraisal Values (Income Approach)
Station Capacity (MW)
Unadjusted Value (000’s)
Upstream Allocation (000’s)
Adjusted Value (000,s)
Adjusted Value ($/kW)
Moore 191 $192,480 $34,499 $226,979 1,188 Comerford 164 $176,829 ($16,358) $160,471 978 McIndoes 13 $18,031 ($3,392) $14,639 1,126 Wilder 41 $55,293 ($4,722) $50,571 1,233 Bellows Falls 48 $82,010 ($6,764) $75,246 1,568 Vernon 22 $31,351 ($3,263) $28,088 1,277 Total CT River: 479 $555,994 $555,994 1,161 Somerset N/A $0 $916 $916 N/A Searsburg 5 $6,277 ($916) $5,361 1,072 Harriman 40 $48,446 $11,050 $59,496 1,487 Total Deerfield River: 45 $54,723 $65,773 1,462 Total: 524 $610,717 $621,767 1,187
Page 17
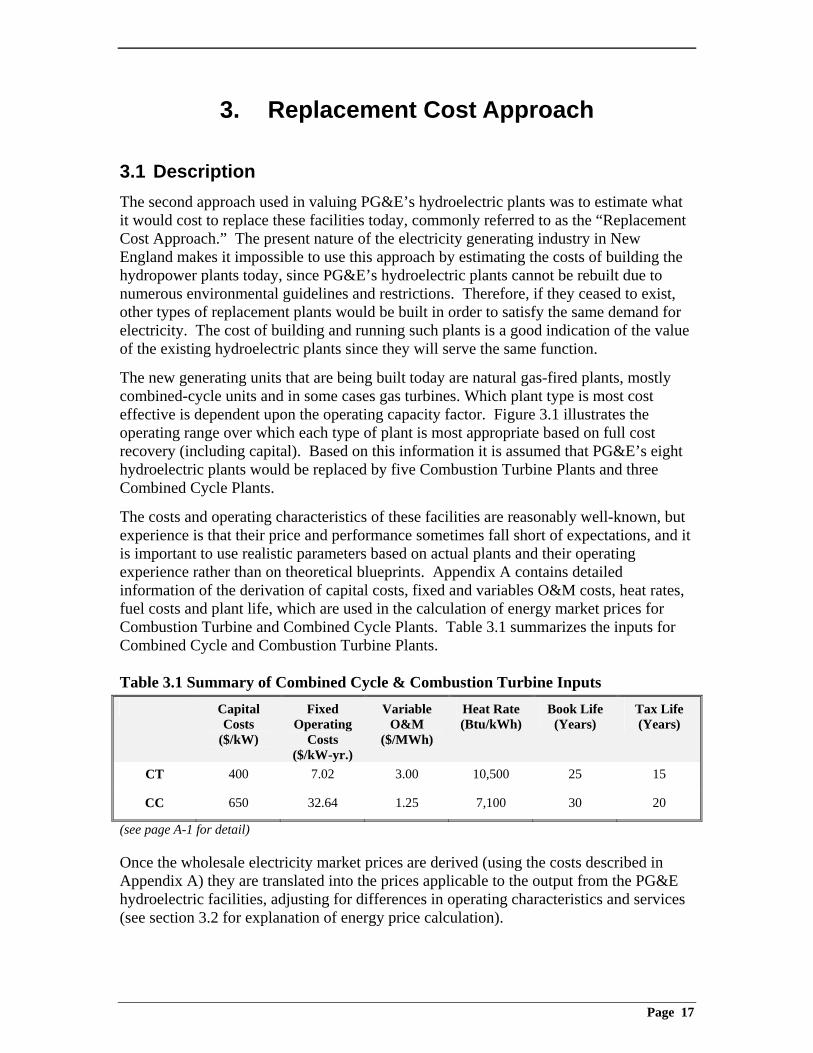
3. Replacement Cost Approach
3.1 Description The second approach used in valuing PG&E’s hydroelectric plants was to estimate what it would cost to replace these facilities today, commonly referred to as the “Replacement Cost Approach.” The present nature of the electricity generating industry in New England makes it impossible to use this approach by estimating the costs of building the hydropower plants today, since PG&E’s hydroelectric plants cannot be rebuilt due to numerous environmental guidelines and restrictions. Therefore, if they ceased to exist, other types of replacement plants would be built in order to satisfy the same demand for electricity. The cost of building and running such plants is a good indication of the value of the existing hydroelectric plants since they will serve the same function.
The new generating units that are being built today are natural gas-fired plants, mostly combined-cycle units and in some cases gas turbines. Which plant type is most cost effective is dependent upon the operating capacity factor. Figure 3.1 illustrates the operating range over which each type of plant is most appropriate based on full cost recovery (including capital). Based on this information it is assumed that PG&E’s eight hydroelectric plants would be replaced by five Combustion Turbine Plants and three Combined Cycle Plants.
The costs and operating characteristics of these facilities are reasonably well-known, but experience is that their price and performance sometimes fall short of expectations, and it is important to use realistic parameters based on actual plants and their operating experience rather than on theoretical blueprints. Appendix A contains detailed information of the derivation of capital costs, fixed and variables O&M costs, heat rates, fuel costs and plant life, which are used in the calculation of energy market prices for Combustion Turbine and Combined Cycle Plants. Table 3.1 summarizes the inputs for Combined Cycle and Combustion Turbine Plants.
Table 3.1 Summary of Combined Cycle & Combustion Turbine Inputs Capital
Costs ($/kW)
Fixed Operating
Costs ($/kW-yr.)
Variable O&M
($/MWh)
Heat Rate (Btu/kWh)
Book Life (Years)
Tax Life (Years)
CT 400 7.02 3.00 10,500 25 15
CC 650 32.64 1.25 7,100 30 20
(see page A-1 for detail)
Once the wholesale electricity market prices are derived (using the costs described in Appendix A) they are translated into the prices applicable to the output from the PG&E hydroelectric facilities, adjusting for differences in operating characteristics and services (see section 3.2 for explanation of energy price calculation).

Page 18
The translated energy prices are then used to calculate annual net revenues based on the assumed level of capacity and generation (equivalent to that of the hydroelectric plants being replaced, see Section 2). The annual cash flows are presented in Appendix G. These cash flows are then discounted in the same fashion as in the Income Method to produce a present value for facility being evaluated.
Since the new plants created assuming the costs structures explained in Appendix A will replace the generation of the hydroelectric plants being appraised, it is reasonable to conclude that the value of the hydroelectric plants is similar to that of the cost of the new plants.
Figure 3.1 Market Price v. Capacity Value
Market Price v. Capacity Value(Range of Relevant Choice)
0
20
40
60
80
100
120
140
160
10% 20% 30% 40% 50% 60% 70% 80% 90%
Gas CC
Gas CT
3.2 Key Inputs for Equivalent Generation Facilities The plant evaluations using the income and equivalent generation approaches were based on discounting the net revenue stream to obtain a present value for each facility (using a real discount rate of 10.03%, see Section 2 and Appendix C for an explanation of the discount rate). Both of these approaches shared many common data inputs. The primary differences were in assigning the energy and ancillary services values.
Key Differences
Energy
The energy price is based on full cost recovery for the “replacement” units. That is, the imputed energy price reflects the revenue needed to recover all fixed and variable costs of

Page 19
the new facilities given the life of the plant4 (as presented in Table 3.1). As such it includes ancillary services values as well as energy per se. Table 3.2 presents the calculated energy costs for Combined Cycle and Combustion Turbine Plants at different capacity factors.
Table 3.2 Energy Prices for Combined Cycle & Combustion Turbine Plants Capacity Factor Gas Combined Cycle Gas Combustion
Turbine Minimum Cost
90% $37.8 $44.8 $37.8 85% $38.5 $44.9 $38.5 80% $39.4 $45.1 $39.4 75% $40.4 $45.3 $40.4 70% $41.5 $45.6 $41.5 65% $42.7 $46.0 $42.7 60% $44.2 $46.5 $44.2 55% $46.0 $47.1 $46.0 50% $48.1 $47.9 $47.9 45% $50.7 $48.9 $48.9 40% $53.9 $50.2 $50.2 35% $58.1 $52.1 $52.1 30% $63.6 $54.6 $54.6 25% $71.4 $58.2 $58.2 20% $83.0 $63.7 $63.7 15% $102.5 $73.2 $73.2 10% $141.3 $92.4 $92.4
(see Tables A-9 & 10 for the derivation of Gas Combined Cycle and Combustion Turbine energy prices respectively)
Ancillary Services
Although the energy price for the equivalent generation units does include ancillary services credits, hydro plants have an operating advantage over these equivalent thermal units in their ability to provide quick response reserve capacity. To represent this additional value for hydro plants the difference between the 10-minute reserve and the 30-minute non-spinning reserve values ($1.50/MWh) was used as the net hydro credit.
3.3 Results Appendix G contains detailed cash flow tables by facility for each of the PG&E generating stations. The same rationale used in the Income Approach in regard to upstream allocations was used in the Replacement Cost Approach. Please see Section 2.5 4 The life of the Combined Cycle and Combustion Turbine plants are reflected in their respective “Capital
Recovery Factors,” contained in Tables A-9 & 10 for Combined Cycle and Combustion Turbine Plants respectively.

Page 20
for details. The application of the Replacement Cost Approach incorporating the information described in this section produced the following results by facility:
Table 3.3 Appraised Values (Replacement Cost Approach) Appraised Values (Replacement Cost Approach)
Station Capacity (MW)
Unadjusted Value (000’s)
Upstream Allocation (000’s)
Adjusted Value (000’s)
Adjusted Value ($/kW)
Moore 191 $178,089 $33,648 $211,737 1,109 Comerford 164 $168,378 ($15,575) $152,803 932 McIndoes 13 $18,905 ($3,554) $15,351 1,181 Wilder 41 $53,544 ($4,578) $48,966 1,194 Bellows Falls 48 $83,131 ($6,858) $76,273 1,589 Vernon 22 $29,643 ($3,083) $26,560 1,207 Total CT River: 479 $531,690 $531,690 1,110 Somerset N/A $0 $869 $869 N/A Searsburg 5 $5,951 ($869) $5,082 1,016 Harriman 40 $44,216 $11,050 $55,266 1,382 Total Deerfield River: 45 $50,167 $61,217 1,360 Total Value: 524 $581,857 $592,907 1,132
Page 21
4. Comparable Sales Approach
4.1 Description With the restructuring of the electricity industry in New England in recent years, there is an ever increasing data base of power plant sales. Typically, groups of power plants of different types have been packaged and sold together. The challenge in using market sales information for present purposes is to disaggregate sale prices into consistent estimates of sales prices of each type of power plant. A statistical analysis has been performed on the aggregated sales and an estimate of the implied valuation being placed by buyers on hydroelectric plants has been attempted.
The Comparable Sales Approach for hydroelectric plants uses econometric and statistical methods to estimate values for the PG&E hydroelectric plants using data from recent transactions involving the sale of non-nuclear power plants.
Data from 31 market sales were collected and analyzed using the Ordinary Least Squares (OLS) method. The OLS technique attempts to fit a line through the scattered data in such a way as to minimize the sum of the squares of the vertical distances from the data point to the line.
The general equation for a line takes the form of y = mx + b, where y is the observed value of the “dependent variable” (in this case sale price) and x is the observed value of the “independent variable” (in this case MW of capacity). It is assumed that the dependent variable is directly influenced by the value of the independent variable. For this model it is assumed that the level of capacity of a plant directly influences the sale price of the plant. The “intercept” of the line with the Y axis on the Cartesian Plane is represented by “b.” (in the specific case presented in this analysis “b” is forced to be zero). The “slope” of the line is represented by “m.”. It is the job of OLS to derive a value for both b and m using given values of y and x.
4.2 Model Construct The first step in using OLS is to form a theoretical economic model and identify the necessary data. For the purposes of this report it was hypothesized that the value of a power generating asset sale was a function of the type of generation being sold (Coal, Oil, Natural Gas, etc.) and the capacity of the generation being sold. The statistical model takes the following form:
Value = CCX1 + CoalAX2 + CoalBX3 + CoalCX4 + CTX5 + HydroX6 + Oil/GasX7 + PSX8 + et
Where:
CC = Combined Cycle Plants
CoalA = Large, New Coal Plants

Page 22
CoalB = Medium Sized Coal Plants CoalC = Small, Old Coal Plants CT = Combustion Turbine Plants Hydro = Conventional Hydroelectric Plants Oil/Gas = Oil and Gas Plants PS = Pumped Storage Hydroelectric Plants
et = residual error
and Xn represents the capacity in Megawatts of the type of plant in question. That is, X1 represents the amount of Combined Cycle capacity involved in the deal, X6 represents the amount of hydroelectric capacity involved in the deal, etc. Notice the exclusion of an intercept term, it was deemed theoretically desirable to exclude an intercept since it follows that if there is no capacity in a deal, there is no value.
The data available was collected and arranged as in Table 4.1 presented below.
Table 4.1 Generator Sales Database Transaction Value
(1998$) (mil $)
CC MW
CoalA MW
CoalB MW
CoalC MW
CT MW
Hydro MW
Oil/Gas MW
PS MW
Total MW
BECo to Sithe 657 0 0 0 0 252 0 1,740 0 1,992 BHE to PPL 89 0 0 0 0 0 37 51 0 88 Cajun Cp to Loui 1,026 0 1,489 0 0 0 0 220 0 1,709 Canal to Southern 476 0 0 0 0 0 0 1,115 0 1,115 CL&P to NGC1 685 0 0 0 0 0 0 0 1,120 1,120 CL&P to NGC2 127 0 0 0 0 17 192 0 0 209 CL&P to NRG 460 0 0 0 0 450 0 1,786 0 2,236 CMP to FP&L 846 0 0 0 0 33 373 761 0 1,167 CommEd to Mission
4,813 0 1,538 2,207 1,831 1,142 0 2,698 0 9,416
Conectiv to NRG 800 0 233 585 546 61 0 448 0 1,873 ConEd to KeySpan 597 0 0 0 0 415 0 1,742 0 2,157 ConEd to NRG 505 0 0 0 0 620 0 826 0 1,446 ConEd to Orion 550 0 0 0 0 765 0 1,075 0 1,840 DQE to Orion 1,705 0 1,158 137 808 262 0 0 0 2,365 EUA to NSP 55 0 0 0 111 40 0 0 0 151 GPU to FirstEnergy 43 0 0 0 0 0 0 0 88 88 GPU-NYSEG to Mission
1,800 0 1,884 0 0 0 0 0 0 1,884
Illinois Power to Revalua
2,900 0 2,179 372 765 329 0 378 0 4,023
MPS to WPS 37 0 0 0 0 12 36 44 0 92 NiMo to Northbrook
23 0 0 0 0 0 37 0 0 37
NiMo to NRG1 355 0 0 0 1,319 0 0 0 0 1,319 NiMo to NRG2 80 0 0 0 0 0 0 1,620 0 1,620 NiMo to Orion 425 0 0 0 0 0 661 0 0 661 NiMo to PSEG 48 0 0 0 0 1 0 378 0 379 NYSEG to AES 950 0 691 318 418 0 0 0 0 1,427 O&R to Southern 278 0 0 205 174 76 44 1,276 0 1,775 Orlando U.C. to Reliant
205 0 0 0 0 0 0 608 0 608
PP&L to WPS 106 0 0 0 362 36 0 0 0 398 Sithe to Reliant 2,100 0 561 840 679 1,597 64 313 0 4,054 UI to WEC 272 0 0 0 385 0 0 607 0 992 WMECo to ConEd 47 0 0 0 0 50 15 107 0 172 Totals 24,735 594 9,733 5,756 7,710 6,158 2,038 18,654 1,781 52,424

Page 23
The analysis results in coefficient values, which represent $/kW values of the plant type being valued. For example, if the CC coefficient value were to be estimated at 100, it would suggest that a Combined Cycle plant is worth approximately $100 per kilowatt of capacity. Therefore if one were to consider buying a Combined Cycle plant with 100 kW of capacity they could expect to pay $10,000.
Multiple regression forms were tested but none were considered suitable for the task of valuing PG&E’s facilities. The theoretical construct presented above produced the highest degree of confidence and was powerful in so far as its functional form, but the market data simply did not allow for a reasonable degree of confidence in the values produced for the hydroelectric plants in question. The relatively large size of the hydroelectric coefficients standard deviation (hence, low degree of confidence) is due in large part to two factors; (1) the size of the sales database (Table 4.1) with only 31 useable observations; and (2) the small number of hydro sales included in recent market activity (9 of the 31 included sales). Sample theory suggests that 30 observations are desirable to produce results with significant characteristics (reliability, robust t-statistics, etc.). While the functional form and output of the regression are considered highly reliable given the information at hand, it is believed that the information at hand is not comprehensive enough to produce results, which may be relied upon to value the PG&E facilities. It is also believed that as more generating plants are sold the standard deviations will narrow and the confidence in the regressions derived from the presented functional form will grow.
4.4 Consideration of Specific Sales The individual sales containing hydroelectric capacity were studied in the hope of finding a specific suitable comparative sale in the market. The intention was to study the details of the sales, which could not be fully represented in the regression, in hopes of identifying a deal for generation reasonably close to the characteristics of the PG&E hydroelectric plants. The implied hydroelectric value (on a $/kW basis) of the comparable market deal could then be extrapolated to the PG&E assets. This method also met with limited success due to a lack of sales involving hydroelectric capacity, which closely resembled the PG&E assets.
The sales ultimately considered were the those by Carolina Light & Power (CL&P), Niagara Mohawk, Central Maine Power (CMP), Bangor Hydro and Maine Public Service (MPS). Sales not considered were excluded due to either a lack of sufficient public information or a lack of similarity.
Key information, including summer and winter capacity, capacity factor, O&M values, and FERC Licensing data for each sale of hydroelectric plants is displayed in Table 4.2. Capacity factor and O&M are obvious considerations in the valuation of any generating asset. Ceteris Paribus, higher capacity factor means more revenues and lower O&M means the plant is less expensive to run. FERC licensing is a consideration specific to hydro plants. Hydro plants regulated by FERC are evaluated for licensing every 30 to 50 years. Re-licensing can be an expensive and somewhat risky process. Often plant owners are required to modify their dams or their operating procedures for environmental

Page 24
purposes. There is also the risk that FERC may require the plant to be decommissioned. With this in mind, a buyer may place higher values on plants that face re-licensing later rather than sooner.
Table 4.2 Performance Figures for Divested Hydro Generating Assets Performance Figures for Divested Hydro Generating Assets
Seller Buyer Summer
Capacity (MW)
Winter Capacity
(MW)
Average O&M $/kW
Average Capacity Factor
Average Re-licensing
Date NEES USGen 579 578 $21 33% 2010 CMP FPL 355 369 $19 57% 2020
Maine PS WPS 36 36 $75 45% 2032 Bangor Hydro
PP&L 33 33 $49 61% 2022
CL&P NGC 124 128 $34 36% 2001 NiMo Orion 554 568 $21 62% 2012
Note: O&M and Capacity factor are averages of 1997 and 1996 figures Average Re-licensing is weighted by capacity
New England Power Company (NEP) Sale (Subject Sale)
This sale was somewhat different from the other transactions that took place in New England. Unlike the other sales which consisted of generating assets only, USGen New England, Inc. (PG&E) also purchased, and subsequently assumed the liability for NEP’s Power Purchase agreements. PG&E also assumed the obligations related to NEP’s above market fuel and fuel-transportation contracts, as well as the responsibility for providing wholesale standard offer service to NEP’s retail distribution companies. These factors may have had the net result of decreasing the total amount paid by the buyer. Such liabilities are difficult to quantify, therefore the actual values of the generating assets are difficult to extract from the sale. The following aspects of the sale added to the difficulty of assessing actual values for generating assets from the sale price.
• The total price does not reflect the payment USGen made to NEPCo for employee benefits. This payment is clearly part of the market value of the plants.
• The allocation of $208 million to “intangibles” is questionable.
• The breakdown does not reflect the negative market value of above-market contracts for coal and natural-gas delivery. Adding these negative items into the tabulation would require that other values be increased.
• The sale was bundled with an obligation for US Gen to sell power back to NEPCo for many years, at below-market prices. This would add another negative line to the break-down, requiring that other valuations be increased.

Page 25
• The sale of the NEPCo assets was bundled with the transfer to USGen of the NEES subsidiary that owned a minority share in the Ocean State Power plant. It is not clear that the allocation properly reflects the net value of this asset, which is heavily laden with debt. Minority ownership shares have generally received lower prices than controlling interests.
• The sale was also bundled with the transfer to USGen of a large amount of above-market (uneconomic) purchased-power contracts. While NEPCo will continue to make some fixed payments to partially offset the operating loss on these contracts, USGen assumes all the market risks from the contracts, and it is not clear whether they have a net positive or negative value. Very few transfers of this type have occurred; for most, the terms are not available for comparison.
The many complex and hard-to-value aspects of this transaction may mean that the actual sale cannot be used to value individual power plants, or even the hydro-electric system as a whole.
Indeed, it is not clear that the price that USGen agreed in 1997 to pay for the bundle of NEPCo assets and obligations is even relevant to determining the value of the generation assets today. The transaction terms were set prior to the opening of competition in New England, or the start of competitive regional wholesale markets. At the time, it was not clear how fast the markets would open up, how the New England markets would operate, what generation services would be required and traded, what costs would be imposed on generators attempting to sell directly to end users, or whether most generation would be owned by utilities (and potentially subsidized in competitive markets by captive regulated customers). USGen accepted considerable risks in its commitment to this immature (indeed, prenatal) market, and it is reasonable to believe that its bid was reduced to reflect those risks. The depression of initial sales prices in markets that have not yet fully opened has been observed in California (where Southern California Edison’s gas plants sold for average of $124/kW in November 1997, before the statewide market started to function, while Pacific G&E and San Diego G&E sold similar plants a year later for $261/kW and $295/kW, respectively), and in the Midwest, (where Duquesne sold an interest in a high-quality coal plant for $600/kW in 1995, and similar plants have sold in 1999 for $1,000/kW). Based on these examples, the plants purchased by USGen might be worth twice as much today as in 1997 (if those values could be separated from the other portions of the deal).
Central Maine Power (CMP) Sale
The CMP divestiture to FPL Group, Inc. consisted of 373 MW of hydro and 782 MW of oil-fired fossil units. The plants have a high capacity factor of 57% and the lowest O&M of the sales, $19/kW. Additionally their is a later average re-licensing date than the PG&E plants. The plants that are not exempt do not face re-licensing on average until 2020. All but three of the PG&E plants considered have either been re-licensed in the past 4 years or are currently undergoing re-licensing. Due to these differences in characteristics it is impossible to produce an acceptably reliable value for the PG&E deal based on this sale.

Page 26
Bangor Hydro
PP&L purchased Bangor Hydro’s minority share (51MW) of Wyman units 4 and 7 small hydro plants. The sale is difficult to evaluate due to the problem of the minority stake it sold in the Wyman 4 unit. Minority shares have generally sold for less than controlling shares as one does not gain control of the unit through the purchase. The capacity factor is quite high at 61% an the average O&M of is also high at $49/kW. The complications of this sale and its differing operational characteristics make it impossible to produce an acceptably reliable value for the PG&E facilities based on this sale.
Maine Public Service
Maine Public Service’s service area is highly isolated. They are not connected at all to NEPOOL but rather to the New Brunswick grid. Additionally, the majority of the hydro capacity lies in the approximately 34 MW Tinker plant, which is located in Canada and therefore not regulated by FERC. The small size of the system also introduces some diseconomies in operations and maintenance. Performance data was not available for Tinker, and the O&M and Capacity factor values are only based on the two units in Maine or only about 6% of total hydro capacity. Additionally, the uncertainty in the valuation of the minority share of Wyman 4 described above for the Bangor Hydro sale, applies to Maine Public Service. All of these factors make it difficult to explain or disaggregate the sale price. Hence, producing an acceptably reliable value for PG&E’s plants based on this sale is not possible.
CL&P Sale
The entire CL&P hydro sale included the Northfield Pumped Storage facility and some associated run-of-river facilities in Massachusetts, as well as 17MW of Combustion Turbine capacity. A reliable breakdown of the sale was not possible. Although the sale is considered similar in nature to the PG&E sale it is not possible to produce acceptably reliable values based on this sale.
Niagara Mohawk Sale
The 72 hydro plants sold for $679/kW. The plants had an average capacity factor of 62%, low O&M of $21/kW, and an average re-licensing date of 2012. This sale is not considered comparable to the PG&E sale due to the fact that energy prices in New York have been lower than in NEPOOL or PJM, the market is not yet fully functioning and the operating characteristics are not directly comparable. Therefore, it is concluded that an acceptably reliable value for the PG&E facilities cannot be derived based on this sale.
4.5 Conclusions Based on the data available and the lack of similar sales information it is the opinion of Synapse Energy Economics, Inc. and its subcontractors that an acceptable value cannot be determined at this time for the PG&E hydroelectric facilities by way of the Comparable Sales Approach.

Page 27
APPENDICES