synaesthetic colour in the brain: beyond colour areas. a - pubman
TRANSCRIPT

Synaesthetic Colour in the Brain: Beyond Colour Areas. AFunctional Magnetic Resonance Imaging Study ofSynaesthetes and Matched ControlsTessa M. van Leeuwen1*, Karl Magnus Petersson1,2, Peter Hagoort1,2
1 Centre for Cognitive Neuroimaging, Donders Institute for Brain, Cognition and Behaviour, Radboud University Nijmegen, Nijmegen, The Netherlands, 2 Max Planck
Institute for Psycholinguistics, Nijmegen, The Netherlands
Abstract
Background: In synaesthesia, sensations in a particular modality cause additional experiences in a second, unstimulatedmodality (e.g., letters elicit colour). Understanding how synaesthesia is mediated in the brain can help to understand normalprocesses of perceptual awareness and multisensory integration. In several neuroimaging studies, enhanced brain activityfor grapheme-colour synaesthesia has been found in ventral-occipital areas that are also involved in real colour processing.Our question was whether the neural correlates of synaesthetically induced colour and real colour experience are trulyshared.
Methodology/Principal Findings: First, in a free viewing functional magnetic resonance imaging (fMRI) experiment, welocated main effects of synaesthesia in left superior parietal lobule and in colour related areas. In the left superior parietallobe, individual differences between synaesthetes (projector-associator distinction) also influenced brain activity, confirmingthe importance of the left superior parietal lobe for synaesthesia. Next, we applied a repetition suppression paradigm infMRI, in which a decrease in the BOLD (blood-oxygenated-level-dependent) response is generally observed for repeatedstimuli. We hypothesized that synaesthetically induced colours would lead to a reduction in BOLD response forsubsequently presented real colours, if the neural correlates were overlapping. We did find BOLD suppression effectsinduced by synaesthesia, but not within the colour areas.
Conclusions/Significance: Because synaesthetically induced colours were not able to suppress BOLD effects for real colour,we conclude that the neural correlates of synaesthetic colour experience and real colour experience are not fully shared. Wepropose that synaesthetic colour experiences are mediated by higher-order visual pathways that lie beyond the scope ofclassical, ventral-occipital visual areas. Feedback from these areas, in which the left parietal cortex is likely to play animportant role, may induce V4 activation and the percept of synaesthetic colour.
Citation: van Leeuwen TM, Petersson KM, Hagoort P (2010) Synaesthetic Colour in the Brain: Beyond Colour Areas. A Functional Magnetic Resonance ImagingStudy of Synaesthetes and Matched Controls. PLoS ONE 5(8): e12074. doi:10.1371/journal.pone.0012074
Editor: Mark W. Greenlee, University of Regensburg, Germany
Received January 8, 2010; Accepted March 15, 2010; Published August 10, 2010
Copyright: � 2010 van Leeuwen et al. This is an open-access article distributed under the terms of the Creative Commons Attribution License, which permitsunrestricted use, distribution, and reproduction in any medium, provided the original author and source are credited.
Funding: This study was supported by a research grant from the Volkswagen-Foundation [grant number I/80 743]. URL: http://www.volkswagen-stiftung.de/.The funders had no role in study design, data collection and analysis, decision to publish, or preparation of the manuscript.
Competing Interests: The authors have declared that no competing interests exist.
* E-mail: [email protected]
Introduction
If you would have digit-colour synaesthesia, every phone
number would have its own unique colour-code – very helpful
for memorisation. You would not know what it is like to see digits
without an associated colour; to you, it would be completely
natural to see that 2 is yellow and 3 is green, and it would have
been that way for as long as you could have remembered [1].
Moreover, you would not be able to ignore the colours, or not see
them. The colours would always be there, and always remain the
same [1]. In people with synaesthesia, sensations in one sensory or
cognitive modality lead to additional experiences in a second,
unstimulated modality. A common form is grapheme-colour
synaesthesia, in which letters and/or digits involuntarily [2,3]
elicit a specific, idiosyncratic colour (e.g. A elicits red). In this
study, we investigate the neural correlates of grapheme-colour
synaesthesia.
Neural explanations for synaesthesia include (local) anatomical
hyperconnectivity [4–6], as well as disinhibited feedback mecha-
nisms with an associated increase in functional connectivity [7,8].
In neuroimaging studies, deploying various different methods (e.g.
functional magnetic resonance imaging, positron emission tomog-
raphy, source localisation of electroencephalography data),
enhanced brain activity for synaesthesia has been reported in
ventral-occipital colour areas [9–13] and in left parietal cortex
[10,11,13–15]. Anatomical differences have also been found in
these regions [16–18]. Recently, Hubbard [19,20] has put forward
a two-stage (or integrated) model of grapheme-colour synaesthesia.
In the model, perception of the synaesthetic colour and binding of
the colour to the grapheme are modelled as separate processes; for
the former, colour areas in fusiform gyrus are deemed crucial, for
the latter the parietal cortex. Parietal cortex is involved in spatial
feature binding [21,22] and inhibition of right parietal cortex with
transcranial magnetic stimulation can disrupt synaesthesia [23,24].
PLoS ONE | www.plosone.org 1 August 2010 | Volume 5 | Issue 8 | e12074

In spite of the neuroimaging findings and existing theories, the
exact neuronal mechanisms underlying synaesthesia are still not
well understood. The neural correlates of synaesthesia are of
interest because people with synaesthesia experience sensations
without receiving direct sensory input to warrant these sensations;
still, their experience is very real and salient. Synaesthesia can
provide insight into mechanisms of perceptual awareness, and
inform us about how sensory inputs are combined in our brain.
Here, our aim was to find out whether the experience of
synaesthetically induced colour recruits exactly the same colour
sensitive regions in the brain as real colour experience. Although
synaesthesia related activity has been reported in colour processing
areas [9,10], we explicitly tested whether synaesthetic colours can
affect real colour processing in the brain. This would imply truly
shared neural machinery. The outcomes would inform us about
the level of visual processing at which colour experience induced
by synaesthesia is mediated.
Behavioural studies show that synaesthetic colour experiences
can influence the reaction times of judgments on real colour
[7,25,26]. Synaesthetically induced colour also resembles real
colour perception in a wide range of perceptual tasks, for example
perceptual crowding, visual grouping and visual search, apparent
motion, and the watercolour effect [4,27–29]. Synaesthetic colours
may even adhere to early visual colour-opponency mechanisms
[30]. In a study by Nicolic, Lichti, and Singer [31], incongruent
Stroop colours were chosen to be maximally opponent to the
colours that were induced by synaesthesia; larger interference
effects were found for opponent colours than for non-opponent
incongruent colours.
Together these findings suggest that synaesthetic colour
perception shares at least several neural processing steps with real
colour perception, possibly also in early visual areas. On the other
hand, synaesthetes subjectively report that synaesthetic and real
colours do not mix [32], and that synaesthetically induced colours
are difficult to express in real colour terms. Similarly, perceptual
resemblance to real colour has not always been reproduced (e.g.,
in visual search, [33,34]). Hong and Blake [35] have shown that
synaesthetic colours are not influenced by brightness contrast, do
not induce hue cancellation, and do not affect real colour
perception in equilibrium yellow settings. The authors therefore
argued that the earliest neural correlates of synaesthetic colour
perception must lie beyond primary visual cortex, an issue that we
investigated further in the current study.
Our experiment was conducted on the basis of a previous study
(van Leeuwen, Petersson, Langner, Rijpkema, and Hagoort,
submitted) in which we demonstrated that the repetition of real
colour induces repetition suppression effects in functional
magnetic resonance imaging (fMRI): we found a decrease in the
blood-oxygenated-level-dependent (BOLD) response for repeated
stimuli [36,37]. Repetition suppression (RS) can be regarded as a
priming effect in the brain, and occurs when there is sufficient
overlap in neuronal processing between the first (prime) and the
second (target) stimulus. Given this assumption, RS is a sensitive
method that allows for precise localisation of the representation of
specific stimulus features. Please note that repetition suppression
for stimulus features in sensory cortex can be completely
independent from observable measures like reaction times [38].
We have shown RS effects for real colour in visual area V4a (van
Leeuwen, Petersson, Langner, Rijpkema, and Hagoort, submit-
ted), in which colour processing is already past the first, colour-
opponent stages [39]. V4a can be regarded as a higher-order
colour processing area. For the repetition of real colour, we found
stronger RS effects for the condition in which the colour of the
target square was congruent with the colour of the prime, than for
the condition in which the prime and target colours were
incongruent. In the current experiment (including the same
subjects as the real colour study) we used graphemes as primes
instead of coloured squares. The graphemes elicited a vivid
synaesthetic colour for the synaesthetes, which could either be the
same (congruent) or different (incongruent) from the physical
colour of the subsequent target square. We predicted more RS
effects for the congruent colour condition than for the incongruent
colour condition in those brain areas where the neuronal
processing of synaesthetically induced colours and real colours is
(partly) shared. We compared the neural correlates of synaesthesia-
colour priming to the effects obtained for real colour, to see
whether synaesthetically induced colour led to similar RS effects as
real colour.
To optimise our sensitivity we included a large cohort of
synaesthetes (N = 21) and matched controls. Apart from the
congruent synaesthetic colour (CC) and incongruent synaesthetic
colour (IC) conditions, a control condition was included in which
the primes did not elicit a colour at all (non-inducing condition
(NC)). No repetition suppression was predicted for NC trials,
because in colour sensitive regions [40,41] the responses to
achromatic stimuli (all stimuli were presented in black) are typically
much weaker than responses to chromatic stimuli. The control
participants did not experience synaesthesia for any of the prime
stimuli; hence for the controls we did not predict any modulation of
the BOLD response due to the manipulations in the primes.
Participants indicated the colour of the target square with a button
press, and reaction times were measured to compare the effects to
previous behavioural findings for synaesthetic priming [25,26].
We specifically predicted RS effects in ventral-occipital parts of
the brain, in which grapheme and colour processing areas are
located in close proximity [4]. To help with the interpretation of
our effects, we performed a functional localiser experiment
(Experiment 1) in which we mapped grapheme and colour
sensitive areas, and localised the main effects of synaesthesia.
Graphemes that were inducing vivid synaesthetic colours were
contrasted against non-inducing control graphemes to localise
synaesthesia related activity (stimuli from both conditions were
presented in black). False font stimuli (also presented in black),
which resembled well known graphemes in visual complexity but
did not have any meaning, were compared to the non-inducing
control graphemes to help identify the neural correlates of
grapheme processing. To map colour responses, we included a
condition in which the non-inducing control stimuli were
presented in colour instead of black. We also compared
synaesthetic colour experience to real colour experience to capture
the added quality of synaesthesia. The resulting activation patterns
for graphemes and colours were used as volumes of interest (VOI)
to restrict our search for colour-specific RS effects in the
synaesthetic priming experiment (Experiment 2).
Synaesthesia also has a spatial component: projector synaesthetes
report seeing the colours ‘on’ the grapheme, while associators do not
and experience the colours in their ‘mind’s eye’ [32]. In both
Experiment 1 and 2, we investigated the influence of the
synaesthetes’ projector-associator status on synaesthesia related
brain activity: these individual differences can influence experi-
mental results [10,17,32].
Materials and Methods: Experiment 1
Localising Synaesthesia, Grapheme, and Colour AreasIn Experiment 1 we identified grapheme areas, colour areas and
synaesthesia-related areas in the brain, and investigated the effect
of projector-associator status on synaesthesia-related activity.
Neuronal Basis of Synaesthesia
PLoS ONE | www.plosone.org 2 August 2010 | Volume 5 | Issue 8 | e12074

ParticipantsSynaesthetes. Twenty-one synaesthetes aged 18–37 (mean
age 26 years, SD = 4.9 years, 2 men, 2 left-handed, 1
ambidextrous) participated. Selection was performed on the
basis of a questionnaire that assessed synaesthetic experiences,
medical history, and handedness (self-reported hand preference).
From the general part of the questionnaire (30 questions on
synaesthesia, comprising questions like ‘‘How long have you
experienced synaesthesia?’’ and ‘‘Did the experience change over
time?’’), it was determined whether the participants fitted the
profile for developmental synaesthesia. All synaesthetes
experienced grapheme-colour synaesthesia since early childhood;
20 reported additional synaesthesias, for example time units
inducing colour (n = 18) and/or shapes (n = 15), and sound-colour
synaesthesias (n = 8).
In the questionnaire synaesthetes reported the colour and
intensity of their synaesthesia for 26 letters of the alphabet, digits
0–9, 15 familiar non-alphanumeric symbols (e.g. #, %) and 13
‘false font’ stimuli (unfamiliar symbols derived from Cyrillic,
Greek, and Arabic, not resembling Latin letters or numbers in
shape). We tested the consistency of the synaesthetic experiences
over time to verify genuine synaesthesia [2,42]. A surprise re-test
on 20 graphemes, taking place by phone 8–13 months (mean 11.0
months) after the initial study yielded an average consistency score
of 91% (SD = 7.5%), similar to previously reported consistency
scores (e.g., [25,42]).
We characterised the synaesthetes on the basis of the spatial
location of their colour experiences [21,32]. As classification
criteria we used the participants’ detailed descriptions of the
appearance of their synaesthesia, in which we explicitly asked
them to describe the spatial location of their experiences. For
clarity, we added 9 specific questions on the location and shape of
the synaesthetic colours. Synaesthetes indicated how much they
agreed (on a 5-point scale) to sentences that fitted either best with a
projector, mental screen projector, or an associator viewpoint
(similar to the procedure in [17]). The scores on this scale
determined how they were characterised. Seven synaesthetes were
classified as ‘projectors’, who experience the colour as an overlay
projection on the graphemes themselves; 8 as ‘mental screen
projectors’, whom experience the colours in external space but not
on the graphemes (in some papers, these synaesthetes are referred
to as associators, e.g. Ward et al. [21]); and 6 as ‘associators’, who
experience synaesthesia as a strong association between the
grapheme and the colour.
Controls. Nineteen control participants aged 19–38 (mean
age 26 years, SD = 4.7 years) who did not report synaesthesia were
individually matched to the synaesthetes on sex, age (63 years),
handedness, and educational level. Mean ages did not differ
between the groups: t(18) = 21.46, n.s. Controls completed a pre-
screening questionnaire to assess their medical history and
handedness and were asked to associate a colour with 20
graphemes. Unannounced re-testing of the colour associations
after 5–9 months (mean 6.6 months) yielded a consistency score of
32% (SD = 18%), which was significantly lower than the
synaesthetes’ score; t(38) = 13.4, P,.001.
All participants had normal or corrected to normal vision,
reported no colour blindness and were able to discriminate the
experimental colours. None reported a neurological or psychiatric
disease. One participant was excluded prior to analysis after
reassessment of her medical history, leaving 20 synaesthetes.
Written informed consent was obtained from all participants prior
to scanning and the study was approved by the local ethics
committee of the Radboud University Nijmegen, in accordance
with the Declaration of Helsinki.
MaterialsUpon arrival each synaesthete indicated (with Microsoft
Powerpoint) the synaesthetic colours for 10 customised graphemes
selected from the questionnaire. Eight synaesthesia-inducing
graphemes for which the chosen colours matched well to the
experienced synaesthesia, and that elicited vivid colours, were
chosen for the synaesthesia condition. For the non-inducing control
condition we selected 8 graphemes that elicited no synaesthesia (as
indicated in the questionnaire). For 14 synaesthetes, several (3.6
(SD = 1.4) on average) familiar non-alphanumeric symbols (e.g. #,
%) were included in the non-inducing control condition because
there were not enough non-inducing alphanumeric graphemes.
Stimuli from the synaesthesia and the non-inducing conditions
were presented in black. To create the colour condition, the non-
inducing graphemes were displayed in random colours unrelated
to synaesthetic experiences. Finally, 8 non-inducing, unfamiliar
symbols with a visual complexity comparable to regular alphanu-
meric characters were chosen to constitute the false font condition
(also presented in black). These symbols did not have any
meaning, in contrast to frequently used alphanumeric symbols.
For one grapheme-gender synaesthete, genders of the stimuli were
divided equally across experimental conditions.
Stimulus PresentationStimuli were presented against a light grey (full screen, 9.1 cd/
m2) background, using Presentation (version 10.2, Neurobehavioral
Systems Inc., www.neurobs.com). Non-colour stimuli were present-
ed in black to ensure high contrast with the background, which
may influence the strength of synaesthetic experiences [43].
Bright, distinct colours were used for the colour condition (not
luminance-matched to the other conditions). All alphanumeric
graphemes were 2.0u tall while non-alphanumeric symbols ranged
from 1.3u–2.7u tall. Stimuli were presented in the centre of a
44.5633.5 cm display screen in the scanner tunnel, placed at a
viewing distance of 60 cm (controlled by a Dell Pentium IV
Windows XP computer, display mode 8006600 pixels, 60 Hz,
projected by a EIKI X986 beamer).
ProcedureParticipants passively viewed pseudorandom blocks of A) 8
synaesthesia-inducing graphemes; B) 8 non-inducing control
graphemes; C) 8 coloured non-inducing graphemes and D) 8
false font stimuli. Stimulus order within the blocks was
randomised. Control participants viewed the same stimulus list
as the synaesthete to whom they were matched. Each stimulus was
presented for 1500 ms with a 500 ms inter-stimulus interval;
between blocks, a central black fixation cross was presented for
10 seconds. Six blocks for each condition yielded a total runtime of
11 minutes (350 MR images). In addition to the standard sound-
attenuating headphones, two synaesthetes who reported synaes-
thesia for the scanner sounds wore earplugs.
Image AcquisitionMR data were acquired with a 3.0 Tesla Siemens TrioTim MR
scanner and an 8-channel head array (Invivo). First, a high-
resolution T1-weighted structural image was acquired for each
participant (MPRAGE, TE = 2.96 ms, TR = 2300 ms, 256 mm
FOV, 2566256 matrix, 1 mm3 resolution) with an acquisition time
of 5 minutes, accelerated with factor 2 by GRAPPA parallel imaging
[44]. A single shot gradient echo-planar imaging (EPI) sequence was
used to acquire functional MR images (29 slices, TE = 30 ms,
TR = 1840 ms, flip angle = 80u, 224 mm FOV, 64664 matrix,
3.563.5 mm voxel size, 3.0 mm slice thickness, 0.5 mm slice gap).
Neuronal Basis of Synaesthesia
PLoS ONE | www.plosone.org 3 August 2010 | Volume 5 | Issue 8 | e12074

Data AnalysisMR data were preprocessed and analysed with SPM5 (Well-
come Department of Imaging Neuroscience, www.fil.ion.ucl.ac.
uk/spm/software/spm5). Prior to analysis, the first 5 volumes of
each subject were discarded to avoid transient T1 effects. To
correct for head motion, images of each subject were spatially
realigned to the first image using a six parameter rigid body
transformation for each image. Slice timing correction was applied
and the images were normalised to the standard EPI template of
SPM5 to allow for group inference. Finally all images were
spatially filtered using a 10 mm FWHM isotropic Gaussian filter.
Statistical analyses were performed on the basis of the General
Linear Model (GLM) framework. For each subject the design
matrix was constructed and the BOLD signal was modelled by the
canonical haemodynamic response function (HRF). A high-pass
filter (128 s cut-off) was used to remove low-frequency effects and
global scaling was applied to remove various global effects of no
interest. The effects of interest were modelled with boxcar
responses (synaesthesia, non-inducing, colour, and false font
blocks) and included in the design matrix in a blocked design.
The six realignment parameters, obtained during preprocessing,
were included in the model as covariates of no interest. Parameter
estimates were obtained for each condition and each participant to
generate relevant contrast images and allow for second-level
random effects analysis. Coordinates of peak activity are reported
in MNI coordinates in the order (x, y, z) and the initial threshold
was P,.001uncorrected at the whole brain level, with a cluster-level
statistic of P,.05FWEcorrected. Corresponding brain regions and
Brodmann areas were retrieved from the Talairach Daemon
database server [45] and verified with the SPM5 Anatomy toolbox
[46]. Mean parameter estimates for Region of Interest (ROI)
analyses were extracted using MarsBaR [47].
Results and Discussion: Experiment 1
Nineteen synaesthetes and nineteen matched controls were
included in the analysis of Experiment 1. One synaesthete was
excluded because this participant was excluded from the analysis
of Experiment 2 (see below); we preferred to keep the number of
subjects identical across the two experiments.
Localising Grapheme AreasNon-inducing control stimuli (graphemes) were contrasted to
the false font stimuli to localise grapheme areas. In the absence
of interaction effects between the groups (at whole brain
P,.001uncorrected) the data were collapsed across synaesthetes and
controls, and thresholded more stringently at whole brain
P,.05FWEcorrected (N = 38). An effect was found only in the right
superior parietal lobe (Table 1), but no clusters were found in
ventral-occipital cortex as was hypothesised. Several previous
studies have reported enhanced activity for unfamiliar symbols
(e.g. Korean letters) compared to letters (or pseudowords compared
to words) in visual areas [48–51]. We therefore computed the
reverse contrast of false fonts compared to non-inducing control
graphemes (N = 38, whole brain P,.05FWEcorrected): we found
bilateral clusters of activation in the inferior occipital gyrus
(Brodmann areas 18/19) and in the anterior section (BA 37) of
the fusiform gyrus (Table 1 and Figure 1A).
The effects for false font symbols corresponded to previous
findings for written words [48] and letter and symbols [49,51] that
are contrasted against baseline activity. However, our obtained
activation pattern did not include the anterior left fusiform gyrus
which is proposed to mediate sublexical properties of letters and
words [52,53] and is influenced by word frequency [54] and related
to task accuracy [55]. Our results suggest that the increased activity
for the false font symbols was largely caused by familiarity effects:
Table 1. Graphemes, colour, and synaesthesia in the brain.
Contrast Brain region k p MNI (x,y,z) T-value
Non-inducing.False fonts (P,.05FWEcorrected, N = 38) R Supramarginal gyrus/Inf parietal lobule (BA 40) 68 0.001 50, 246, 36 6.15
False fonts.Non-inducing (P,.05FWEcorrected, N = 38) R Fusiform gyrus (BA 37) 1914 0.000 44, 260, 214 11.06
R Middle/Inf occipital gyrus (BA 18/19) 38, 284, 24 8.16
R Fusiform gyrus (BA 37) 34, 248, 222 8.11
L Inferior occipital gyrus (BA 18/19) 913 0.000 238, 280, 28 8.30
L Fusiform/Inf occipital gyrus (BA 19) 240, 270, 214 7.38
L Cerebellum/L Fusiform gyrus (BA 37) 60 0.001 234, 242, 230 5.95
L Fusiform gyrus (BA 37) 234, 252, 222 5.53
Coloured.Non-inducing (P,.05FWEcorrected, N = 38) R Fusiform gyrus (BA 37) 1294 0.000 34, 250, 222 10.11
R Fusiform gyrus (BA 19) 32, 276, 216 8.66
R Middle/Inf occipital gyrus (BA 18) 34, 286, 26 7.77
L Fusiform gyrus (BA 19) 1175 0.000 230, 276, 216 8.89
L Fusiform gyrus (BA 37) 234, 254, 220 7.30
Interaction Synaesthetes.Controls forSynaesthesia.Non-inducing (P,.001uncorrected, SVC)
R Fusiform gyrus (BA 19) 21 0.052 36, 276, 226 4.45
Interaction Synaesthetes.Controls forSynaesthesia.Coloured (P,.001uncorrected)
L Superior parietal lobule (BA 7) 712 0.001 224, 258, 46 5.03
L Superior Occipital gyrus/Precuneus 222, 270, 38 4.11
L Inferior parietal lobule (BA 40) 242, 244, 48 4.02
fMRI results of localiser Experiment 1 (N = 38 (synaesthetes N = 19, controls N = 19), random effects analyses, extent threshold $20 voxels, whole brain threshold: seetable). Cluster size (k), corrected P-values at cluster-level (p), MNI coordinates of local maxima and T-values are listed. Brodmann areas (BA) are in parentheses. R = right,L = left, Inf = Inferior, SVC = Small Volume Correction.doi:10.1371/journal.pone.0012074.t001
Neuronal Basis of Synaesthesia
PLoS ONE | www.plosone.org 4 August 2010 | Volume 5 | Issue 8 | e12074

although matched in visual complexity, the control graphemes were
more frequent in written language. Free viewing conditions and the
long stimulus exposure (1500 ms) may have induced additional
processing for the unfamiliar symbols. The activation pattern for
false fonts compared to control graphemes was used as a volume of
interest (VOI) in our subsequent analyses, with the explicit note that
we cannot claim that this VOI includes areas involved in processing
of graphemes per se; rather, the VOI is capturing visual areas that
are especially recruited during the complex and abstract visual
analyses that underlie symbol and grapheme processing.
Localising Colour AreasTo localise colour areas we contrasted coloured graphemes with
the (black) non-inducing control graphemes. Again, no interaction
effects were found at whole brain P,.001uncorrected, meaning the
effects were similar across both groups of participants, and the data
were analysed across all 38 subjects (at whole brain P,.05FWEcorrected).
Note that in this contrast, the effect of the graphemes themselves is
cancelled out (identical stimuli in both conditions), leaving only the
effect of colour. Bilateral clusters were obtained in the fusiform gyrus,
located medially and ventrally from the areas involved in grapheme
processing (Table 1 and Figure 1B), although there was partial overlap
(Figure 1C). Although the coloured graphemes were not luminance-
matched to the black non-inducing graphemes, our results (Table 1)
corresponded very well to previous reports on colour sensitive areas
[39,40]. The local maxima in the anterior fusiform gyri (BA 37) were
within 5 mm of the reported anatomical location of anterior visual
area V4a; the more posterior maxima in fusiform gyrus (BA 19) were
within 5 mm of the location of V4 ([39] Table 1). We concluded that
the obtained activation pattern for colour (at P,.05FWEcorrected) could
be used as a representative subset of colour sensitive areas (VOI)
during further analyses.
Localising Synaesthesia AreasTo localise the effects of synaesthesia we identified brain regions
with a positive interaction for synaesthetes compared to controls,
for the contrast of synaesthetic graphemes compared to non-
inducing control graphemes. This contrast represents the phe-
nomenal experience of synaesthetic colour for synaesthetes that is
additive over the stimulus effects for the controls. Note that any
possible perceptual effects of the stimuli are cancelled out in this
interaction test, because those effects are expected to be present for
both groups. An interaction effect for synaesthetes was present
within the ventral-occipital colour VOI (used as Small Volume
Correction), located at (36, 276, 226) in the right posterior
fusiform gyrus (see Table 1 and Figure 1D). The location of the
effect is within the extent of colour area V4 as defined by Bartels
and Zeki ([39], Table 1). The results confirm the role of ventral-
occipital colour areas in synaesthetic colour experience [9–11].
Additionally we compared synaesthetic colour perception
(synaesthesia condition) to real colour perception (colour condi-
Figure 1. Localising graphemes, colour, and synaesthesia inthe brain. fMRI results of localiser Experiment 1. A–C. Coronal (left) andaxial (right) slices (N = 38 at whole brain P,.05FWEcorrected, extentthreshold 20 voxels). A. Grapheme areas (false fonts . non-inducinggraphemes). B. Colour areas (coloured graphemes . non-inducinggraphemes). C. Grapheme (blue) and colour areas (yellow) overlaid. D–E.Effects of synaesthesia, showing positive interactions for synaesthetes(N = 19 synaesthetes, N = 19 controls), at whole brain P,.001uncorrected,extent threshold 20 voxels. D. Synaesthesia . non-inducing graphemes(red), axial (left) and sagittal (right) slices showing right fusiform gyrusactivation. E. Synaesthesia . coloured graphemes (blue-purple), axial(left) and sagittal (right) slices, showing left superior parietal lobeactivation. Left is depicted on the left.doi:10.1371/journal.pone.0012074.g001
Neuronal Basis of Synaesthesia
PLoS ONE | www.plosone.org 5 August 2010 | Volume 5 | Issue 8 | e12074

tion) to investigate possible differences between the neural
correlates. Here, it is the added synaesthetic quality of the
experienced colour that would cause any additional effects for the
synaesthesia condition for synaesthetes. A significant (whole brain
P,.001uncorrected) positive interaction for synaesthetes compared to
controls was found at (224, 258, 46) in the left superior parietal
lobule (see Table 1 and Figure 1E for details). No effects were
found in ventral-occipital areas, also not within the colour VOI.
Note that in the interaction test, possible perceptual effects of the
stimuli (expected for both groups) are cancelled out. Increased
BOLD fMRI effects for synaesthesia in the left parietal cortex were
found previously by Weiss et al. [14], while diffusion tensor
imaging (DTI) and voxel-based morphometry (VBM) studies have
shown increased structural connectivity [17] and increased grey
matter density [18] in synaesthetes in this region. The cluster in
the superior parietal lobule is located within a 5 mm radius of the
main effect of synaesthesia in the fMRI study of Weiss et al. [14].
In our data, the two contrasts involving synaesthesia led to
different effects in the brain. The perception of synaesthetic colour
led to increased activation in colour area V4. When contrasted
against real colour perception, however, the added quality of the
synaesthetic colour experience led to more activity in the left
superior parietal lobe. Our results support the two-stage or
integrated model of Hubbard [19,20], in which fusiform gyrus
(V4) is proposed to underlie the perception of the synaesthetic
colour, while parietal cortex is hypothesised to induce a type of
‘hyperbinding’ that binds the colour and the grapheme. In our
view, both regions are equally crucial for synaesthetic experience
and we therefore prefer the term ‘integrated’ model. The ongoing
processes in synaesthetic experience are likely to be based on a
dynamic interplay between brain areas, and do not involve two
clearly separate processing stages. Our parietal effect can be
explained in terms of binding of the synaesthetic colour to the
grapheme: in the colour condition, synaesthetes and controls
needed to bind the physical colour of the non-synaesthetic
grapheme to its spatial location [24]. But in the synaesthetic
condition, no physical colour was present and hence for controls,
no binding was necessary. Synaesthetes however did integrate the
synaesthetic colour with the grapheme, leading to increased left
parietal cortex activity for synaesthetes. We cannot exclude that
the parietal effects we observe are due to other processes than
binding, but previous findings concerning spatial feature binding
in the parietal lobe make our interpretation very likely [22–24].
Importantly, no task requirements were present in our experi-
ment which means no special focus was placed on any particular
feature of the graphemes (e.g. shape, physical or synaesthetic
colour). Cohen Kadosh et al. [56] have shown that task demands
can influence fMRI effects of synaesthesia, an insight which can help
to explain differential results of previous studies. In Hubbard et al.
[10], for example, an italic versus upright discrimination task on the
(synaesthesia inducing) graphemes may have enhanced the focus on
low-level shape features; effects were predominant in visual areas
(V4). In Weiss et al. [14], participants actively reported synaesthetic
experiences, enhancing attention to the synaesthetic quality of the
colours; effects were found in left parietal cortex only. In our data we
found both colour related (V4) and parietal effects, which illustrates
that not only task demands, but also the specific aspect of
synaesthesia that is under investigation can influence the outcome
of neuroimaging experiments.
Effect of Projector-Associator TypeAs the spatial location of the synaesthetic colours can influence
experimental outcomes [32], we tested whether the BOLD effects
for the synaesthetic condition differed between the projector-
associator (PA) subgroups of the synaesthetes (projectors (N = 7),
mental screen projectors (N = 7), and associators (N = 5)). The
clusters with effects of synaesthesia in right fusiform gyrus and the
left superior parietal lobe (SPL) were used as regions of interest
(ROIs). Please note that the ROIs were selected completely
independent from subgroup status. Mean parameter estimates of
each subject (synaesthesia condition) were calculated for each
ROI; for neither ROI did we find a main effect of PA-subgroup
(ANOVA, all n.s.), although the associator group showed
marginally more activity in the left SPL than the mental screen
projectors (F(1,11) = 3.435, P,.094).
Materials and Methods: Experiment 2
Priming ExperimentIn Experiment 2, we analysed repetition suppression effects for
colour induced by synaesthesia, and investigated the effect of
projector-associator status on synaesthesia-related activity.
ParticipantsAll participants of Experiment 1 participated in Experiment 2.
Written informed consent was obtained from all participants prior
to scanning and the study was approved by the local ethics
committee of the Radboud University Nijmegen, in accordance
with the Declaration of Helsinki.
Experimental DesignThe priming task contained three synaesthetic priming
conditions in which the primes induced a synaesthetic colour that
was either congruent (CC) or incongruent (IC) compared to the
target, or the primes did not induce a synaesthetic colour (NC). We
hypothesised the largest BOLD repetition suppression effects (and
hence the lowest BOLD response) would occur for the CC
condition. The design also contained real colour priming
conditions (CC, IC, and NC), of which the prime and target
consisted of physically coloured (or achromatic, not coloured)
squares; these trials were intermixed with the synaesthetic priming
trials. The colour priming results were reported elsewhere (van
Leeuwen, Petersson, Langner, Rijpkema, and Hagoort, submit-
ted).
MaterialsFor each synaesthete, 4 graphemes that elicited distinct, vivid
synaesthetic colours (mainly red, green, blue, and yellow) were
selected from the stimuli of Experiment 1 and used as synaesthesia
inducing primes in the CC and IC conditions. Four non-inducing
graphemes (no synaesthesia) were selected as primes for the NC
condition. For 13 synaesthetes, non-alphanumeric symbols (e.g. &,
#) were included as non-inducing primes (2.2 (SD = 1.2) on
average). Targets consisted of coloured squares in one of the 4
idiosyncratic synaesthetic colours. Control participants received
the same stimulus lists as the synaesthete to whom they were
matched.
Stimulus PresentationAll grapheme and symbol stimuli were presented in the same
manner as the non-coloured stimuli of Experiment 1. The
coloured target squares measured 2.1u62.1u of visual angle and
had a mean luminance of 8.4 cd/m2 (SD = 10.3 cd/m2). Colours
were not isoluminant due to their idiosyncratic synaesthetic
nature; however, all colours appeared equally often in CC, IC,
and NC conditions, ruling out any BOLD effects due to overall
luminance differences. Stimuli were presented with the same
computer set-up as Experiment 1.
Neuronal Basis of Synaesthesia
PLoS ONE | www.plosone.org 6 August 2010 | Volume 5 | Issue 8 | e12074

ProcedureCongruent, incongruent, and non-inducing trials appeared in a
ratio of 1:2:1 (48:96:48), yielding 192 trials (and 192 colour
condition trials). The 1:2:1 ratio was chosen such that the
expectancy of a congruent trial closely matched the expectancy of
any target colour (25%), to minimise behavioural strategy effects.
Four identical runs were created, each containing 12 CC, 24 IC,
and 12 NC trials from both the synaesthetic priming and the
colour priming conditions (96 trials per run). Twenty-four null-
events (20%, fixation only) were included in each run to avoid
BOLD saturation. Stimuli were pseudo-randomised per run, with
maximally 2 repetitions of prime type (CC, IC, or NC) and prime
identity, maximally 3 repetitions of the target colour, and
maximally 5 repetitions of overall condition (synaesthesia or
colour).
In the fMRI experiment, one trial consisted of a prime
(displayed for 500 ms), followed by a blank screen (100 ms, light
grey background colour) and the target (duration 800 ms), and
finally a jittered inter-trial-interval of 4–6 seconds (fixation cross).
Participants were instructed to indicate the target colour fast but
accurately by responding with the associated finger of their right
hand; each colour corresponded to one response button. First,
participants completed an offline practice set of 16 items
(representing all conditions). Response devices were the keyboard
for the practice session and an MR-scanner compatible Lumitouch
response box for the fMRI experiment. The fMRI session began
with the scans from Experiment 1, followed by two runs of the
priming experiment (12 minutes each, 380 images). The final 2
priming runs were completed after a 10 minute break outside of
the scanner. Participants wore sound-attenuating headphones and
two synaesthetes wore additional earplugs to minimise scanner-
induced synaesthesias.
Computer VersionFollowing the fMRI session, participants completed a computer
version of the priming experiment, to verify the behavioural effects
obtained in the scanner and to compare the reaction times to the
existing literature on synaesthetic priming. Materials and condi-
tions were identical to the fMRI version, but null-events were
excluded and the target squares remained on the screen until a
response was given (up to a maximum of 4 seconds). Responses
were followed by a 1000 ms fixation cross, and then the next trial.
Randomisation criteria were unchanged. Four runs of ,5 minutes
each were created. Stimuli were presented on a 15 inch iiyama
LCD monitor at a viewing distance of 60 cm. The keyboard was
used as response device.
Image Acquisition ParametersMR data were collected on the same scanner as the data of
Experiment 1. A single shot gradient echo-planar imaging (EPI)
sequence was used to acquire functional MR images (33 slices,
TE = 30 ms, TR = 2090 ms, flip angle = 80u, 224 mm FOV,
64664 matrix, 3.563.5 mm voxel size, 3.0 mm slice thickness,
0.5 mm slice gap). Atlas-based registration (AutoAlign, Siemens
[57]) was applied for all EPI runs to ensure the same slice positions
across all functional runs (before and after the break) of one
subject. The T1 images from Experiment 1 were used as structural
scans.
Data AnalysisBehavioural data. Reaction time (RT) data were analysed in
a mixed design ANOVA. Incorrect trials and outliers (62 SD from
the subject and condition mean) were excluded from analysis.
Where the assumption of non-sphericity was violated,
Greenhouse-Geisser correction was applied (uncorrected degrees
of freedom are reported).
Imaging data. Functional MR data were preprocessed and
analysed according to the same procedure as Experiment 1. The
design matrix consisted of six regressors for the experimental
conditions (CC, IC, and NC in both conditions), one regressor to
model all incorrect trials, and six regressors of no interest for the
motion parameters. Events were modelled by the onset of the
target squares (event related). Analyses were performed at the
whole brain level and the initial threshold for significance was a
cluster-level statistic of P,.05FWEcorrected at the whole brain
threshold of P,.001uncorrected. We used the grapheme and colour
volumes of interest (VOIs) from Experiment 1 to aid in the
interpretation of the whole brain effects.
Our research question explicitly addressed whether synaesthetic
colour perception takes place in exactly the same brain areas as real
colour perception. We therefore also performed region of interest
(ROI) analyses in the same ROIs in which we found RS effects for
real colour in our previous study (van Leeuwen, Petersson,
Langner, Rijpkema, and Hagoort, submitted). ROI analyses are
typically more sensitive than whole brain analyses. The three
ROIs were located in left anterior fusiform gyrus, BA 37priming
(232,250,222), left posterior fusiform BA 19priming
(230,266,222), and right anterior fusiform BA 37priming
(32,250,224). We included three additional ROIs, on the basis
of the local maxima of the colour localiser of Experiment 1
(Table 1: coloured.non-synaesthetic graphemes); these ROIs also
showed a main effect of real colour priming across the three
conditions, and were located in left anterior fusiform BA 37localiser
(234,254,220), and right fusiform gyrus BA 37localiser
(34,250,222) and BA 19localiser (32,276,216). ROIs (5 mm
radius) were created with MarsBaR [47]. For each ROI, the mean
parameter estimates for each subject and condition were extracted
and subjected to statistical analysis.
Results: Experiment 2
One participant was excluded from analysis of Experiment 2
because she did not complete the task according to instructions.
The remaining 19 synaesthetes and their 19 matched controls
were included.
Behavioural ResultsRTs were analysed in an ANOVA with the between-subjects
factor group (synaesthetes and controls), and the within-subjects
factors place (fMRI and computer) and prime type (congruent,
incongruent, and non-inducing). Incorrect responses (for percent-
ages see Figure 2) and outliers (fMRI: synaesthetes 5.6%, controls
5.8%; computer: synaesthetes 4.6%, controls 4.7%) were removed
prior to analysis. We found a main effect of place (F(1,36) = 27.8,
P,.001), caused by longer RTs in the scanner, but no main effect
of group (F(1,36) = 2.33, n.s.), thus the overall RTs were
comparable across groups. Because no interactions with place
were found for either group, data were collapsed across fMRI and
computer sessions.
The collapsed data revealed a highly significant group6prime
type interaction (F(2,148) = 23.9, P,.001). We found a significant
effect of prime type for synaesthetes (F(2,74) = 27.5, P,.001), but
not for controls (F(2,74) = 1.83, n.s.). For synaesthetes the RTs in
the congruent colour condition were 79 ms faster than those in the
incongruent colour condition (F(1,37) = 32.3, P,.001), and 69 ms
faster than in the non-inducing condition (F(1,37) = 33.2, P,.001).
There were no other effects; the data are summarised in Figure 2.
Neuronal Basis of Synaesthesia
PLoS ONE | www.plosone.org 7 August 2010 | Volume 5 | Issue 8 | e12074
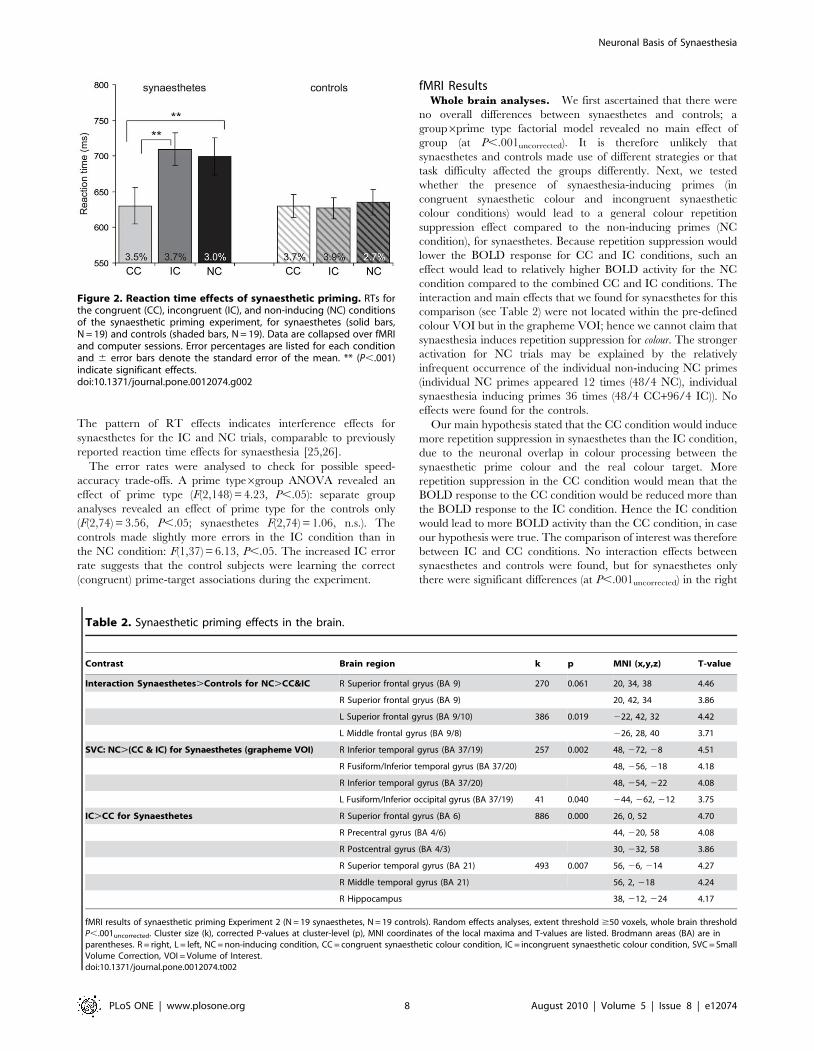
The pattern of RT effects indicates interference effects for
synaesthetes for the IC and NC trials, comparable to previously
reported reaction time effects for synaesthesia [25,26].
The error rates were analysed to check for possible speed-
accuracy trade-offs. A prime type6group ANOVA revealed an
effect of prime type (F(2,148) = 4.23, P,.05): separate group
analyses revealed an effect of prime type for the controls only
(F(2,74) = 3.56, P,.05; synaesthetes F(2,74) = 1.06, n.s.). The
controls made slightly more errors in the IC condition than in
the NC condition: F(1,37) = 6.13, P,.05. The increased IC error
rate suggests that the control subjects were learning the correct
(congruent) prime-target associations during the experiment.
fMRI ResultsWhole brain analyses. We first ascertained that there were
no overall differences between synaesthetes and controls; a
group6prime type factorial model revealed no main effect of
group (at P,.001uncorrected). It is therefore unlikely that
synaesthetes and controls made use of different strategies or that
task difficulty affected the groups differently. Next, we tested
whether the presence of synaesthesia-inducing primes (in
congruent synaesthetic colour and incongruent synaesthetic
colour conditions) would lead to a general colour repetition
suppression effect compared to the non-inducing primes (NC
condition), for synaesthetes. Because repetition suppression would
lower the BOLD response for CC and IC conditions, such an
effect would lead to relatively higher BOLD activity for the NC
condition compared to the combined CC and IC conditions. The
interaction and main effects that we found for synaesthetes for this
comparison (see Table 2) were not located within the pre-defined
colour VOI but in the grapheme VOI; hence we cannot claim that
synaesthesia induces repetition suppression for colour. The stronger
activation for NC trials may be explained by the relatively
infrequent occurrence of the individual non-inducing NC primes
(individual NC primes appeared 12 times (48/4 NC), individual
synaesthesia inducing primes 36 times (48/4 CC+96/4 IC)). No
effects were found for the controls.
Our main hypothesis stated that the CC condition would induce
more repetition suppression in synaesthetes than the IC condition,
due to the neuronal overlap in colour processing between the
synaesthetic prime colour and the real colour target. More
repetition suppression in the CC condition would mean that the
BOLD response to the CC condition would be reduced more than
the BOLD response to the IC condition. Hence the IC condition
would lead to more BOLD activity than the CC condition, in case
our hypothesis were true. The comparison of interest was therefore
between IC and CC conditions. No interaction effects between
synaesthetes and controls were found, but for synaesthetes only
there were significant differences (at P,.001uncorrected) in the right
Figure 2. Reaction time effects of synaesthetic priming. RTs forthe congruent (CC), incongruent (IC), and non-inducing (NC) conditionsof the synaesthetic priming experiment, for synaesthetes (solid bars,N = 19) and controls (shaded bars, N = 19). Data are collapsed over fMRIand computer sessions. Error percentages are listed for each conditionand 6 error bars denote the standard error of the mean. ** (P,.001)indicate significant effects.doi:10.1371/journal.pone.0012074.g002
Table 2. Synaesthetic priming effects in the brain.
Contrast Brain region k p MNI (x,y,z) T-value
Interaction Synaesthetes.Controls for NC.CC&IC R Superior frontal gryus (BA 9) 270 0.061 20, 34, 38 4.46
R Superior frontal gryus (BA 9) 20, 42, 34 3.86
L Superior frontal gyrus (BA 9/10) 386 0.019 222, 42, 32 4.42
L Middle frontal gyrus (BA 9/8) 226, 28, 40 3.71
SVC: NC.(CC & IC) for Synaesthetes (grapheme VOI) R Inferior temporal gyrus (BA 37/19) 257 0.002 48, 272, 28 4.51
R Fusiform/Inferior temporal gyrus (BA 37/20) 48, 256, 218 4.18
R Inferior temporal gyrus (BA 37/20) 48, 254, 222 4.08
L Fusiform/Inferior occipital gyrus (BA 37/19) 41 0.040 244, 262, 212 3.75
IC.CC for Synaesthetes R Superior frontal gyrus (BA 6) 886 0.000 26, 0, 52 4.70
R Precentral gyrus (BA 4/6) 44, 220, 58 4.08
R Postcentral gyrus (BA 4/3) 30, 232, 58 3.86
R Superior temporal gyrus (BA 21) 493 0.007 56, 26, 214 4.27
R Middle temporal gyrus (BA 21) 56, 2, 218 4.24
R Hippocampus 38, 212, 224 4.17
fMRI results of synaesthetic priming Experiment 2 (N = 19 synaesthetes, N = 19 controls). Random effects analyses, extent threshold $50 voxels, whole brain thresholdP,.001uncorrected. Cluster size (k), corrected P-values at cluster-level (p), MNI coordinates of the local maxima and T-values are listed. Brodmann areas (BA) are inparentheses. R = right, L = left, NC = non-inducing condition, CC = congruent synaesthetic colour condition, IC = incongruent synaesthetic colour condition, SVC = SmallVolume Correction, VOI = Volume of Interest.doi:10.1371/journal.pone.0012074.t002
Neuronal Basis of Synaesthesia
PLoS ONE | www.plosone.org 8 August 2010 | Volume 5 | Issue 8 | e12074
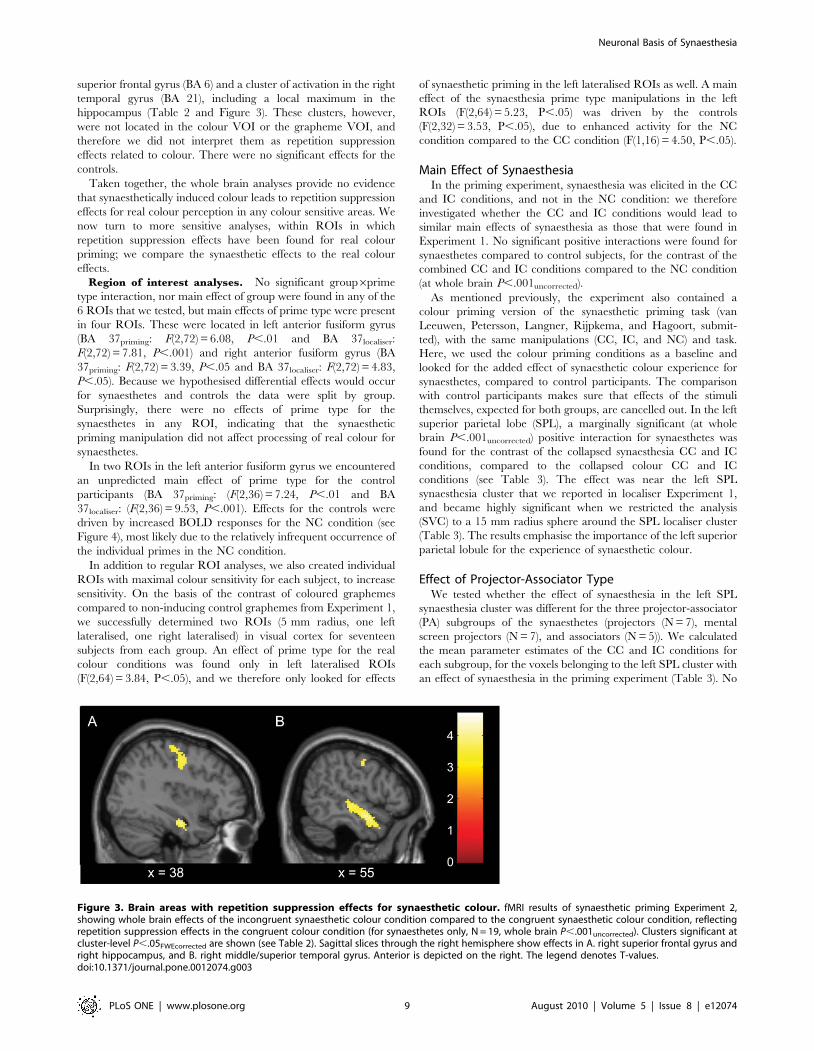
superior frontal gyrus (BA 6) and a cluster of activation in the right
temporal gyrus (BA 21), including a local maximum in the
hippocampus (Table 2 and Figure 3). These clusters, however,
were not located in the colour VOI or the grapheme VOI, and
therefore we did not interpret them as repetition suppression
effects related to colour. There were no significant effects for the
controls.
Taken together, the whole brain analyses provide no evidence
that synaesthetically induced colour leads to repetition suppression
effects for real colour perception in any colour sensitive areas. We
now turn to more sensitive analyses, within ROIs in which
repetition suppression effects have been found for real colour
priming; we compare the synaesthetic effects to the real colour
effects.
Region of interest analyses. No significant group6prime
type interaction, nor main effect of group were found in any of the
6 ROIs that we tested, but main effects of prime type were present
in four ROIs. These were located in left anterior fusiform gyrus
(BA 37priming: F(2,72) = 6.08, P,.01 and BA 37localiser:
F(2,72) = 7.81, P,.001) and right anterior fusiform gyrus (BA
37priming: F(2,72) = 3.39, P,.05 and BA 37localiser: F(2,72) = 4.83,
P,.05). Because we hypothesised differential effects would occur
for synaesthetes and controls the data were split by group.
Surprisingly, there were no effects of prime type for the
synaesthetes in any ROI, indicating that the synaesthetic
priming manipulation did not affect processing of real colour for
synaesthetes.
In two ROIs in the left anterior fusiform gyrus we encountered
an unpredicted main effect of prime type for the control
participants (BA 37priming: (F(2,36) = 7.24, P,.01 and BA
37localiser: (F(2,36) = 9.53, P,.001). Effects for the controls were
driven by increased BOLD responses for the NC condition (see
Figure 4), most likely due to the relatively infrequent occurrence of
the individual primes in the NC condition.
In addition to regular ROI analyses, we also created individual
ROIs with maximal colour sensitivity for each subject, to increase
sensitivity. On the basis of the contrast of coloured graphemes
compared to non-inducing control graphemes from Experiment 1,
we successfully determined two ROIs (5 mm radius, one left
lateralised, one right lateralised) in visual cortex for seventeen
subjects from each group. An effect of prime type for the real
colour conditions was found only in left lateralised ROIs
(F(2,64) = 3.84, P,.05), and we therefore only looked for effects
of synaesthetic priming in the left lateralised ROIs as well. A main
effect of the synaesthesia prime type manipulations in the left
ROIs (F(2,64) = 5.23, P,.05) was driven by the controls
(F(2,32) = 3.53, P,.05), due to enhanced activity for the NC
condition compared to the CC condition (F(1,16) = 4.50, P,.05).
Main Effect of SynaesthesiaIn the priming experiment, synaesthesia was elicited in the CC
and IC conditions, and not in the NC condition: we therefore
investigated whether the CC and IC conditions would lead to
similar main effects of synaesthesia as those that were found in
Experiment 1. No significant positive interactions were found for
synaesthetes compared to control subjects, for the contrast of the
combined CC and IC conditions compared to the NC condition
(at whole brain P,.001uncorrected).
As mentioned previously, the experiment also contained a
colour priming version of the synaesthetic priming task (van
Leeuwen, Petersson, Langner, Rijpkema, and Hagoort, submit-
ted), with the same manipulations (CC, IC, and NC) and task.
Here, we used the colour priming conditions as a baseline and
looked for the added effect of synaesthetic colour experience for
synaesthetes, compared to control participants. The comparison
with control participants makes sure that effects of the stimuli
themselves, expected for both groups, are cancelled out. In the left
superior parietal lobe (SPL), a marginally significant (at whole
brain P,.001uncorrected) positive interaction for synaesthetes was
found for the contrast of the collapsed synaesthesia CC and IC
conditions, compared to the collapsed colour CC and IC
conditions (see Table 3). The effect was near the left SPL
synaesthesia cluster that we reported in localiser Experiment 1,
and became highly significant when we restricted the analysis
(SVC) to a 15 mm radius sphere around the SPL localiser cluster
(Table 3). The results emphasise the importance of the left superior
parietal lobule for the experience of synaesthetic colour.
Effect of Projector-Associator TypeWe tested whether the effect of synaesthesia in the left SPL
synaesthesia cluster was different for the three projector-associator
(PA) subgroups of the synaesthetes (projectors (N = 7), mental
screen projectors (N = 7), and associators (N = 5)). We calculated
the mean parameter estimates of the CC and IC conditions for
each subgroup, for the voxels belonging to the left SPL cluster with
an effect of synaesthesia in the priming experiment (Table 3). No
Figure 3. Brain areas with repetition suppression effects for synaesthetic colour. fMRI results of synaesthetic priming Experiment 2,showing whole brain effects of the incongruent synaesthetic colour condition compared to the congruent synaesthetic colour condition, reflectingrepetition suppression effects in the congruent colour condition (for synaesthetes only, N = 19, whole brain P,.001uncorrected). Clusters significant atcluster-level P,.05FWEcorrected are shown (see Table 2). Sagittal slices through the right hemisphere show effects in A. right superior frontal gyrus andright hippocampus, and B. right middle/superior temporal gyrus. Anterior is depicted on the right. The legend denotes T-values.doi:10.1371/journal.pone.0012074.g003
Neuronal Basis of Synaesthesia
PLoS ONE | www.plosone.org 9 August 2010 | Volume 5 | Issue 8 | e12074

other ROIs were tested because we constrained our analyses to
areas that were positively involved in synaesthesia (but selected
independent from subgroup status). A marginal main effect of PA-
subgroup was found: F(2,37) = 2.60, P,.09. Planned comparisons
revealed that the associators showed significantly more activation
in the left SPL than the mental screen projectors (F(1,23) = 5.29,
P,.05), see Figure 5. This finding is comparable to the trend that
was found in the left SPL cluster in the localiser experiment.
Discussion—General
The aim of our study was to determine whether synaesthetically
induced colour perception recruits the same brain areas as real
colour perception. Although we know from neuroimaging studies
that ventral-occipital colour areas are involved in synaesthetic
experiences (e.g.,[9,10]), to our knowledge it has not been shown
that synaesthetically induced colours can affect real colour
processing in the brain. Such an influence would imply the neural
machinery is truly shared between synaesthetic and real colours. In
our synaesthetic priming experiment we applied a sensitive,
repetition suppression fMRI paradigm; we hypothesised that
synaesthetic colours would reduce the subsequent BOLD response
for real colours. We found no effects, and therefore no evidence for
shared neural correlates between synaesthetically induced colour
and real colour perception.
Behaviourally, the reaction time effects we obtained for
synaesthetic priming were of the same order of magnitude (colour:
56 ms, synaesthesia: 79 ms) as previously established colour
priming effects in the same subjects (van Leeuwen, Petersson,
Langner, Rijpkema, and Hagoort, submitted). It follows that the
physical colours of our target stimuli were matched closely enough
to the idiosyncratic prime colours induced by synaesthesia to elicit
strong behavioural interference. In the brain however, real colour
priming induced repetition suppression effects in visual area V4a(van Leeuwen, Petersson, Langner, Rijpkema, and Hagoort,
submitted), whereas we did not find any effects for synaesthetic
priming, tested with the same number of stimuli and identical task.
For synaesthetic priming we performed additional region of
interest analyses, but to no avail. In our free viewing localiser
experiment (Experiment 1) we did find an effect of synaesthesia in
colour area V4. This indicates that V4 was positively involved in
Figure 4. Region of interest analysis of repetition suppressioneffects for synaesthetic priming. The mean parameter estimates forROIs in left anterior fusiform gyrus are plotted for synaesthetes (N = 19,solid bars) and controls (N = 19, shaded bars). Error bars depict 6 thestandard error of the mean and * (P,.05) and ** (P,.001) denotesignificant differences between conditions. CC = congruent synaestheticcolour condition, IC = incongruent synaesthetic colour condition,NC = non-inducing condition, L = left, fus = fusiform gyrus.doi:10.1371/journal.pone.0012074.g004
Table 3. Main effects of synaesthesia in the synaesthetic priming experiment.
Contrast Brain region k p MNI (x,y,z) T-value
Interaction Synaesthetes.Controls forSynaesthetic (CC & IC).Colour (CC & IC)
L Superior parietal lobule/Prec (BA 7) 252 0.077 226, 260, 38 4.16
L Superior parietal lobule (BA 7) 230, 254, 56 3.47
SVC: 15 mm sphere at SPL (224, 258, 46) L Superior parietal lobule/Prec (BA 7) 238 0.002 226, 60, 38 4.16
L Superior parietal lobule (BA 7) 226, 260, 44 3.95
L Superior parietal lobule (BA 7) 230, 254, 56 3.47
fMRI results for the interaction of synaesthetes compared to controls, for the synaesthetic CC and IC conditions compared to the real colour CC and IC conditions (N = 19synaesthetes, N = 19 controls) of Experiment 2. Random effects analyses, extent threshold $50 voxels, whole brain threshold P,.001uncorrected. Listed are cluster size (k),corrected P-values at cluster-level (p), MNI coordinates of local maxima and T-values. Brodmann areas (BA) are in parentheses. R = right, L = left, CC = congruent(synaesthetic) colour condition, IC = incongruent (synaesthetic) colour condition, SVC = Small Volume Correction, Prec = Precuneus.doi:10.1371/journal.pone.0012074.t003
Figure 5. Projector-associator differences in the superiorparietal lobe. Mean parameter estimates (Experiment 2) for projector,mental screen projector, and associator synaesthetes in the left superiorparietal lobule cluster at (226, 260, 38) (Table 2). Error bars depict 6
standard error of the mean. * (P,.05) denotes significant differencebetween groups.doi:10.1371/journal.pone.0012074.g005
Neuronal Basis of Synaesthesia
PLoS ONE | www.plosone.org 10 August 2010 | Volume 5 | Issue 8 | e12074

synaesthesia in our synaesthetes, and repetition suppression effects
could in principle have been induced in the priming experiment.
The number of stimuli in the localiser experiment and priming
experiment were comparable; a difference in experimental power
can therefore not explain the absence of effects in the priming
study. The effect that we found for the non-inducing condition in
control subjects (due only to frequency effects of the stimuli) also
makes a lack of sensitivity unlikely. We therefore accept that
synaesthetic colour processing indeed does not influence real
colour processing in ventral-occipital areas in the brain.
In the reaction times, we found a priming effect for the congruent
synaesthetic colour condition, in accordance with previous findings
for synaesthetic priming (e.g., [26]). The reaction times were faster
when the synaesthetically induced colour of the prime matches with
the colour of the target. The fact that we did not find repetition
suppression effects in visual cortex for this comparison, suggests that
the conflict that is induced by the non-matching colours in the
incongruent condition is resolved elsewhere in the brain. In this
sense, our fMRI data complement earlier behavioural studies that
have only assessed reaction times without looking at the neural
correlates. In the contrast of the incongruent versus the congruent
condition in the brain (see Table 2) we observed activations in right
superior frontal gyrus (motor-related areas) and right temporal
gyrus, areas in which this conflict is possibly resolved. The finding
that repetition suppression for stimulus features in sensory cortex
can be independent from observable measures like reaction times
and response learning has previously been demonstrated by Horner
and Henson [38].
In our localiser experiment (Exp. 1), we found increased BOLD
activity for synaesthetic colour perception in the fusiform gyrus and
increased activity for synaesthetic colour binding processes in left
parietal cortex. These results are in line with the proposed neural
correlates of synaesthesia in the integrated model put forward by
Hubbard [19,20]. We can infer at which level of visual processing
the neural correlates of synaesthetically induced colour could be
encountered. Although behavioural studies show that synaestheti-
cally induced colours can ‘behave’ like real colour (e.g., [31]), many
of these studies were case studies, including participants who
exhibited very strong, low-level synaesthesia (e.g., [4]). This may
have resulted in potential overestimation of the perceptual effects of
synaesthesia, and therefore of the earliest level of visual processing at
which neural correlates of synaesthesia can be identified. In our
study, the most low-level neural correlate of synaesthesia that we
encountered was extrastriate visual area V4. Even in V4 and V4a,
synaesthetically induced colours did not affect BOLD activity in the
same way real colours did, implying that the neural machinery that
is underlying synaesthetic colour experience is not organised in the
same way as the neural machinery underlying real colour
perception. Our results suggest that synaesthetic colours are
mediated by higher-order (visual) processes, taking place beyond
the realm of well-defined visual areas in ventral-occipital cortex.
Feedback from these areas may induce V4 activation and the
percept of synaesthetic colour, and the left superior parietal lobe
most likely has an important role in this process. We propose that
the pathways by which synaesthetically induced colour and real
colour are processed by the brain are different in nature, even
though both may result in V4 activation. Studies of functional and
effective connectivity, in which the dynamic interplay between brain
areas is modelled, may help to advance our understanding of the
nature of the connections between brain areas that are involved in
synaesthetic colour experiences. Electroencephalography (EEG)
and magnetoencephalography (MEG) may provide valuable
information about the time course with which synaesthesia-inducing
stimuli are processed, considering that these methods have a very
high time resolution. If it is possible to spatially localise the sources of
EEG and MEG activity, these methods may also assist in
determining the order in which brain regions are recruited during
the experience of synaesthesia.
Several of our synaesthetes experienced the colours induced by
synaesthesia in a specific spatial location (projectors), whereas for
others they resembled strong associations (associators). In the left
superior parietal lobule (SPL), we found significantly more activity
for associator synaesthetes than for mental screen projectors. This
finding is unexpected if one interpreted the spatial component of
synaesthesia as reflecting the underlying binding processes to spatial
reference frames [21,23,24]; for projector synaesthetes, the spatial
reference frame of the colour is more explicit and hence may lead to
increased BOLD responses. Alternatively, if associator synaesthetes
build a spatial reference frame for their synaesthetic colours that
differs largely from the way graphemes are presented on the
experimental computer screen, the switching between spatial
reference frames and increased difficulty in spatial binding may
lead to increased SPL activity [21]. Our data do imply that activity in
the left superior parietal lobe is related to these individual differences.
In summary, our data support an integrated model of
synaesthesia, and suggest the specific aspect of synaesthesia that is
under investigation (colour perception or the specific synaesthetic
aspect of the colour) can influence experimental outcomes. The left
superior parietal cortex is implied in the spatial reference frame of
synaesthesia. Synaesthetically induced colours do not coincide with
real colour perception in the brain, which suggests that synaesthetic
colour perception is mediated in higher-order (visual) areas.
Feedback, caused by either anatomical or functional connectivity,
may induce activation of visual area V4. In the future, functional and
effective connectivity methods and models may further elucidate the
neural underpinnings of synaesthetic colour experiences.
Acknowledgments
We thank all participants for their time and effort in participating, and
Cretien van Campen and Tanja Nijboer for assistance with subject
recruitment.
Author Contributions
Conceived and designed the experiments: TMvL KMP PH. Performed the
experiments: TMvL. Analyzed the data: TMvL. Wrote the paper: TMvL.
Provided feedback on the data and paper: KMP. Contributed extensively
to discussion and interpretation of the data: PH. Edited the paper: PH.
References
1. Hochel M, Milan EG (2008) Synaesthesia: The existing state of affairs. CognNeuropsychol 25: 93–117.
2. Baron-Cohen S, Wyke MA, Binnie C (1987) Hearing words and seeing colours:an experimental investigation of a case of synaesthesia. Perception 16: 761–767.
3. Wollen KA, Ruggiero FT (1983) Colored-letter synesthesia. J Ment Imagery 7:83–86.
4. Ramachandran VS, Hubbard EM (2001) Psychophysical investigations into the
neural basis of synaesthesia. Proc R Soc London B 268: 979–983.
5. Bargary G, Mitchell KJ (2008) Synaesthesia and cortical connectivity. Trends
Neurosci 31: 335–342.
6. Maurer D (1996) Neonatal synaesthesia: implications for the processing of
speech and faces. In: Harrison J, Baron-Cohen S, eds. Synaesthesia: Classic and
Contemporary Readings. Oxford: Blackwell Publishers. pp 224–242.
7. Smilek D, Dixon MJ, Cudahy C, Merikle PM (2001) Synaesthetic photisms
influence visual perception. J Cogn Neurosci 13: 930–936.
8. Grossenbacher PG, Lovelace CT (2001) Mechanisms of synesthesia: cognitive
and physiological constraints. Trends Cogn Sci 5: 36–41.
9. Sperling JM, Prvulovic D, Linden DEJ, Singer W, Stirn A (2006) Neuronal
correlates of colour-graphemic synaesthesia: a fMRI study. Cortex 42: 295–
303.
Neuronal Basis of Synaesthesia
PLoS ONE | www.plosone.org 11 August 2010 | Volume 5 | Issue 8 | e12074
10. Hubbard EM, Arman AC, Ramachandran VS, Boynton GM (2005) Individual
differences among grapheme-color synesthetes: Brain-behavior correlations.Neuron 45: 975–985.
11. Nunn JA, Gregory LJ, Brammer MJ, Williams SCR, Parslow DM, et al. (2002)
Functional magnetic resonance imaging of synesthesia: activation of V4/V8 byspoken words. Nat Neurosci 5: 371–375.
12. Rich AN, Williams MA, Puce A, Syngeniotis A, Howard MA, et al. (2006)Neural correlates of imagined and synaesthetic colours. Neuropsychologia 44:
2918–2925.
13. Beeli G, Esslen M, Jancke L (2008) Time course of neural activity correlated withcolored-hearing synesthesia. Cereb Cortex 18: 379–385.
14. Weiss PH, Zilles K, Fink GR (2005) When visual perception causes feeling:enhanced cross-modal processing in grapheme-color synesthesia. NeuroImage
28: 859–868.15. Paulesu E, Harrison J, Baron-Cohen S, Watson JD, Goldstein L, et al. (1995)
The physiology of coloured hearing. A PET activation study of colour-word
synaesthesia. Brain 118: 661–676.16. Jancke L, Beeli G, Eulig C, Hanggi J (2009) The neuroanatomy of grapheme-
color synesthesia. Eur J Neurosci 29: 1287–1293.17. Rouw R, Scholte HS (2007) Increased structural connectivity in grapheme-color
synesthesia. Nat Neurosci 10: 792–797.
18. Weiss PH, Fink GR (2009) Grapheme-colour synaesthetes show increased greymatter volumes of parietal and fusiform cortex. Brain 132: 65–70.
19. Hubbard EM (2007) Neurophysiology of synesthesia. Current PsychiatryReports 9: 193–199.
20. Hubbard EM (2007) A real red-letter day. Nat Neurosci 10: 671–672.21. Ward J, Li R, Salih S, Sagiv N (2007) Varieties of grapheme-colour synaesthesia:
a new theory of phenomenological and behavioural differences. Conscious Cogn
16: 913–931.22. Robertson LC (2003) Binding, spatial attention and perceptual awareness. Nat
Rev Neurosci 4: 93–102.23. Muggleton N, Tsakanikos E, Walsh V, Ward J (2007) Disruption of synaesthesia
following TMS of the right posterior parietal cortex. Neuropsychologia 45:
1582–1585.24. Esterman M, Verstynen T, Ivry RB, Robertson LC (2006) Coming unbound:
disrupting automatic integration of synesthetic color and graphemes bytranscranial magnetic stimulation of the right parietal lobe. J Cogn Neurosci
18: 1570–1576.25. Mattingley JB, Rich AN, Yelland G, Bradshaw JL (2001) Unconscious priming
eliminates automatic binding of colour and alphanumeric form in synaesthesia.
Nature 410: 580–582.26. Dixon MJ, Smilek D, Cudahy C, Merikle PM (2000) Five plus two equals yellow.
Nature 406: 365.27. Palmeri TJ, Blake R, Marois R, Flanery MA, Whetsell WJ (2002) The
perceptual reality of synesthetic colors. Proc Natl Acad Sci U S A 99:
4127–4131.28. Kim C-Y, Blake R (2005) Watercolor illusion induced by synesthetic colors.
Perception 34: 1501–1507.29. Kim C-Y, Blake R, Palmeri TJ (2006) Perceptual interaction between real and
synesthetic colors. Cortex 42: 195–203.30. Solomon SG, Lennie P (2007) The machinery of colour vision. Nat Rev
Neurosci 8: 276–286.
31. Nikolic D, Lichti P, Singer W (2007) Color opponency in synaestheticexperiences. Psychol Sci 18: 481–486.
32. Dixon MJ, Smilek D, Merikle PM (2004) Not all synaesthetes are created equal:Projector versus associator synaesthetes. Cogn Affect Behav Neurosci 4:
335–343.
33. Edquist J, Rich AN, Brinkman C, Mattingley JB (2006) Do synaesthetic coloursact as unique features in visual search? Cortex 42: 222–231.
34. Sagiv N, Heer J, Robertson L (2006) Does binding of synesthetic color to theevoking grapheme require attention? Cortex 42: 232–242.
35. Hong SW, Blake R (2008) Early visual mechanisms do not contribute to
synesthetic color experience. Vision Res 48: 1018–1026.
36. Henson RNA (2003) Neuroimaging studies of priming. Prog Neurobiol 70:
53–81.
37. Grill-Spector K, Henson RNA, Martin A (2006) Repetition and the brain:
neural models of stimulus-specific effects. Trends Cogn Sci 10: 15–23.
38. Horner AJ, Henson RN (2008) Priming, response learning and repetition
suppression. Neuropsychologia 46: 1979–1991.
39. Bartels A, Zeki S (2000) The architecture of the colour centre in the human
visual brain: new results and a review. Eur J Neurosci 12: 172–190.
40. McKeefry D, Zeki S (1997) The position and topography of the human colour
centre as revealed by functional magnetic resonance imaging. Brain 120:
2229–2242.
41. Beauchamp MS, Haxby JV, Jennings JE, DeYoe EA (1999) An fMRI version of
the Farnsworth-Munsell 100-Hue test reveals multiple color-selective areas in
human ventral occipitotemporal cortex. Cereb Cortex 9: 257–263.
42. Baron-Cohen S, Harrison J, Goldstein LH, Wyke M (1993) Coloured speech
perception: is synaesthesia what happens when modularity breaks down?
Perception 22: 419–426.
43. Hubbard EM, Manohar S, Ramachandran VS (2006) Contrast affects the
strength of synesthetic colors. Cortex 42: 184–194.
44. Griswold MA, Jakob PM, Heidemann RM, Nittka M, Jellus V, et al. (2002)
Generalized autocalibrating partially parallel acquisitions (GRAPPA). Magn
Reson Med 47: 1202–1210.
45. Lancaster JL, Rainey LH, Summerlin JL, Freitas CS, Fox PT, et al. (1997)
Automated labeling of the human brain: A preliminary report on the
development and evaluation of a forward-transform method. Hum Brain Mapp
5: 238–242.
46. Eickhoff SB, Stephan KE, Mohlberg H, Grefkes C, Fink GR, et al. (2005) A new
SPM toolbox for combining probabilistic cytoarchitectonic maps and functional
imaging data. NeuroImage 25: 1325–1335.
47. Brett M, Anton J-L, Valabregue R, Poline J-B Region of interest analysis using
an SPM toolbox [Abstract]; 2002; Sendai, Japan.
48. Dehaene S, Le Clec HG, Poline JB, Le Bihan D, Cohen L (2002) The visual
word form area: a prelexical representation of visual words in the fusiform gyrus.
Neuroreport 13: 321–325.
49. Pernet C, Celsis P, Demonet JF (2005) Selective response to letter categorization
within the left fusiform gyrus. NeuroImage 28: 738–744.
50. Mechelli A, Gorno-Tempini ML, Price CJ (2003) Neuroimaging studies of word
and pseudoword reading: Consistencies, inconsistencies, and limitations. J Cogn
Neurosci 15: 260–271.
51. Flowers DL, Jones K, Noble K, VanMeter J, Zeffiro TA, et al. (2004) Attention
to single letters activates left extrastriate cortex. NeuroImage 21: 829–839.
52. Dehaene S, Cohen L, Sigman M, Vinckier F (2005) The neural code for written
words: a proposal. Trends Cogn Sci 9: 335–341.
53. Levy J, Pernet C, Treserras S, Boulanouar K, Berry I, et al. (2008) Piecemeal
recruitment of left-lateralized brain areas during reading: A spatio-functional
account. NeuroImage 43: 581–591.
54. Kronbichler M, Hutzler F, Wimmer H, Mair A, Staffen W, et al. (2004) The
visual word form area and the frequency with which words are encountered:
evidence from a parametric fMRI study. NeuroImage 21: 946–953.
55. Garrett AS, Flowers DL, Absher JR, Fahey FH, Gage HD, et al. (2000) Cortical
activity related to accuracy of letter recognition. NeuroImage 11: 111–123.
56. Cohen Kadosh R, Cohen Kadosh K, Henik A (2007) The neuronal correlate of
bidirectional synesthesia: A combined event-related potential and functional
magnetic resonance imaging study. J Cogn Neurosci 19: 2050–2059.
57. Van der Kouwe AJ, Benner T, Fischl B, Schmitt F, Salat DH, et al. (2005) On-
line automatic slice positioning for brain MR imaging. Neuroimage 27:
222–230.
Neuronal Basis of Synaesthesia
PLoS ONE | www.plosone.org 12 August 2010 | Volume 5 | Issue 8 | e12074