symbian os system event log and postmortem software fault ......symbian os evolved from psion...
TRANSCRIPT
Symbian OS system event log and postmortem software fault analysis
Zhigang Yang
University of Tampere Department of Computer Sciences Computer Science M.Sc. thesis Supervisor: Jyrki.Nummenmaa, Erkki.J Salonen June 2008

ii
University of Tampere Department of Computer Sciences Computer Science Zhigang Yang: Symbian OS system event log and postmortem software fault analysis M.Sc. thesis, 62 pages, 4 index and appendix pages June 2008
This thesis introduces a postmortem software failure analysis system named MobileCrash. The system is to catch Symbian OS panics and exceptions, to collect related information and to transmit crash logs to a central database for analysis. The basics of software failure analysis and similar systems on other operation systems are presented in the thesis. After revealing the system design of the MobileCrash, the system event log as a supplementary of the MobileCrash is introduced. The thesis also introduces the core of crash analysis together with real case studies in Symbian OS. Software developers can benefit from this thesis by learning about software failure analysis on Symbian OS. Project managers can get basic information on software failure analysis from this thesis to better control projects based on Symbian OS.
Key words and terms: Symbian OS, crash analysis, MobileCrash, system event log

iii
Table of Contents 1. Introduction ............................................................................................................... 1
2. Symbian OS based Smartphone software development............................................ 4
2.1 Smartphone overview................................................................................................ 4
2.2 Symbian OS design overview ................................................................................... 5
3. Basics of software fault analysis ............................................................................... 9
3.1 Automated support for software failure report.......................................................... 9
3.2 Postmortem Symbolic Evaluation and crash analysis ............................................. 10
4. MobileCrash system in general ............................................................................... 13
4.1 MobileCrash developing requirements ................................................................... 13
4.2 MobileCrash general design and implementation ................................................... 16
5. MobileCrash system event log ................................................................................ 21
5.1 Background information.......................................................................................... 21
5.2 System event log architect....................................................................................... 23
5.3 System event log design .......................................................................................... 24
5.4 System event log improvement ............................................................................... 28
6. Crash analysis on Symbian OS ............................................................................... 31
6.1 Symbian OS crash analysis in general .................................................................... 31
6.2 User side panic ........................................................................................................ 33
6.3 Kernel side panic ..................................................................................................... 35
6.4 Exceptions ............................................................................................................... 38
7. Case studies ............................................................................................................. 43
7.1 Analyze the stack heuristically................................................................................ 45
7.2 Analyze application panic ....................................................................................... 47
7.3 Analyze application crash (exception) .................................................................... 49
7.4 Analyze application crashes group by call stack..................................................... 50
7.5 Summary.................................................................................................................. 52
8. Conclusions ............................................................................................................. 54 Appendix: Glossary
1
1. Introduction
Nowadays, smartphones are very popular and widely used in people’s everyday life. Symbian OS based smartphones have the largest market share in this big family. By the end of the third quarter of 2007, there were 165 million Symbian smartphones cumulatively shipped and 134 different models in the global market [Symbian press releases, 2007]. Since large amount of smartphones shipped to the market, people are significantly changing the way to use and think over mobile phones.
Smartphones are phones which combine mobility, a complete operating system with the ability to add applications, and information access. Smartphones have more features than traditional phones and are used as mobile personal computers giving access to the information world which keeps on expanding and growing rapidly. Smartphones provide a web browser to facilitate information access. However the information world can also be accessed through dedicated smartphone interfaces that make the experience more intuitive, more visual, and more valuable. Moreover just as the information world is steering the evolution of smartphones, the increasing popularity of smartphones will steer the next phase of the evolution of the information world [Wood, 2005].
The software used in smartphones is becoming ubiquitous. The powerful software, previously found only in desktop computers, now serves inside all kinds of smartphones. Without the support from thousands of third-party software, smartphones would not be as successful as in nowadays. Any computer software developers can write smartphone software, either to meet their own needs or to sell for a profit. Most smartphone software can be developed by standard programming languages and application interfaces provided by smartphone operation systems.
However, debugging and analysing software faults in a smartphone development environment is not as easy as that in a computer desktop development environment. There are many runtime debuggers and source code level debuggers used in the computer desktop environment. In a smartphone development environment, tracing systems can be used in the early phase to find out problematic functions while there is no completed system service provided, for example this may be the case with device driver development. Emulators and run time debuggers for smartphones can be used to debug software faults when the smartphone operation system is in a relatively mature level. Nevertheless the development process becomes harder after the software has been deployed into the smartphone. It is difficult to check when, how and why a software fault has happened, and the fault information is difficult to collect as well. In Symbian

2
OS, MobileCrash is such a system which catches software faults, transmits fault logs, and helps analyzing software fault information from smartphones.
In Wang’s master thesis, the MobileCrash system was firstly introduced and it is still undergoing development. There are two main functions of MobileCrash. Firstly, it provides a way to collect Symbian OS software fault data during the period when the software has been developed and deployed into the smartphone. Secondly, it provides a set of statistic data which can evaluate the product maturity. MobileCrash includes several software components installed on both smartphones and PCs. The system development includes techniques such as Symbian C++ development, Windows C++ development, Relationship Database and Web UI development [Wang, 2007].
In general, MobileCrash catches Symbian OS software faults by components called kernel agent and user agent. These MobileCrash agents installed on the smartphone can catch software faults, and collect useful data of the panicked software. The data includes panicked time call stack, a list of run time loaded binary modules, CPU registers, panic reason and category, CPU exception registers, the system event log and so on. Then MobileCrash transfers crash data via its SMS sender component through the GSM network into a crash log gateway which includes PC software components decoding and storing crash data into a database. Another option is to retrieve data from the smartphone via a USB connection to a PC workstation and forward them to the same server as the SMS sender component does. Software developers can check the decoded data through the MobileCrash web UI, and analyze that data to point out where the bug location might be in the panicked software component. The web UI also provides statistical data to help to analyze the software maturity level against software releases (Figure 1).

3
Figure 1. MobileCrash overview
This paper will present new features and software fault analysis which are not presented in detail in Wang’s master thesis. To better understand the MobileCrash system and Symbian OS software fault analysis, the Symbian OS based smartphone design overview will be introduced in Chapter 2. Chapter 3 explains the software fault analysis as background knowledge. The MobileCrash system design in general is presented in Chapter 4. Chapter 5 is about the MobileCrash system event log. Chapter 6 presents software fault analysis in Symbian OS. In Chapter 7, case studies present how software faults are analyzed with the help of the MobileCrash system. In the Conclusions, I will summarize salient points brought up in this thesis, on the basis of which I will present and discuss the further development of the system.

4
2. Symbian OS based Smartphone software development
2.1 Smartphone overview
Unlike a general-purpose personal computer, an embedded system is a purpose-built personal computer, having specific requirements and performing pre-defined tasks. Embedded systems are becoming more and more popular and bring great improvement to people's everyday life, including telecommunication, entertainment and industrial control systems. Smartphones are combined with embedded system and general purpose computer system.
Smartphone is a cellular telephone with information access. It provides a basic voice service by a signal processor as well as many other functionalities such as multimedia messages, e-mail, Web access, voice recognition, photo and/or video camera, music player, digital TV or video player, GPS, and so on.
The first smartphone was introduced in 1993 by IBM and BellSouth. It was a mobile phone combined with a Personal Digital Assistant (PDA) and called ‘Simon Personal Communicator’ [Smartphone, 2008]. The Simon was costly and heavy. Although often mentioned as the first smartphone, it took another decade before smartphones became widely used.
Compared to standard phones, smartphones usually have larger displays and more powerful processors. Smartphones run complete operating system software that provides standardized interfaces and platforms for application developers. The major smartphone operation systems are Symbian, Linux, Windows Mobile, Blackberry, Palm OS and OS X. [Smartphone, 2008]. Normally, applications written for a given smartphone platform can run on any other smartphones with that platform, regardless of manufacturers. Compared to Java applications, native smartphone applications usually run faster and integrate more tightly with the phone's features and user interface.
Symbian OS based smartphones have the largest market share in the world [Smartphone, 2008]. For this reason, discussions in this thesis work are mainly based on the Symbian OS software development.

5
2.2 Symbian OS design overview
Psion’s Organiser, launched in 1984, was based on an 8-bit processor and supported only built-in applications [Sales, 2005]. This system only had a bootstrap loader and a small collection of system services as the kernel. The 16-bit EPOC kernel was tied to the Intel 8086 architecture and supported expansion. This meant that the OS opened itself up to any number of software developers. This openness makes a risk that a poorly developed application could crash other applications or even the whole system. A sophisticated memory management could solve this problem to some degree. The 16-bit EPOC kernel had to address many of the requirements which are met by EKA2 today.
EPOC32, the 32-bit EPOC kernel was released in Psion’s Series 5 PDA in 1997 [Sales, 2005]. Its kernel called ‘EPOC32 Kernel Architecture 1’ (EKA1) carried over the best features of the 16-bit EPOC kernel and fixed many significant issues. EKA1 was thoroughly 32-bit and did not have EPOC’ 8086 style segmented memory architecture. Furthermore, the EKA1 kernel was designed from the beginning with hardware variety and evolution.
EKA1 supports event-driven programming very well, but there is no real-time guarantee in the kernel. The kernel itself was designed with robustness to hold a user’s personal data as the primary goal. Since Symbian OS began to process needs of mobile phones, it could apparently provide real-time guarantees. However, EKA1’s module boundaries were not always drawn in the right place to make the hardware porting easy [Sales, 2005]. For example, some hardware ports only need a device driver change rather than the whole kernel needs to be rebuilt.
The EPOC Kernel Architecture 2 (EKA2) was introduced in 1998 to solve this problem. EKA2 is the second edition of Symbian’s 32-bit kernel architecture [Sales, 2005]. EKA2 also supports sufficiently-fast real time response making it possible to build a single core phone around it. The single core phone is a single processor core executing both user applications and the signaling stack.
Symbian OS evolved from Psion Software's EPOC. Like many other desktop operation systems, it has features such as multithreading, pre-emptive multitasking, and memory management [Symbian OS, 2008]. Symbian OS is one of the global industry standard operating systems for smartphones, and is licensed to the world's leading handset manufacturers. Symbian OS supports a wide range of device categories with several different user interfaces, including Nokia series 40, Nokia series 60, Nokia Series 80, UIQ etc.

6
Symbian OS is built specifically for devices with limited resources running for months or years. In order to achieve this target, Symbian OS has a very strong emphasis on memory management by using Symbian C++ specific programming idioms such as descriptors and a cleanup call stack. Other techniques are also used to keep memory usage at a relatively low level and to prevent memory leaks [Symbian OS, 2008]. In addition, Symbian OS provides the programming idiom called Active Objects (AO) to achieve a longer battery life. Almost all Symbian OS programming is based on event handling. The CPU is activated only when an application is directly dealing with an event. In idle time, the CPU runs at a very low power consuming level.
Symbian OS has a microkernel architecture, which means that the kernel only has the minimum OS services such as a scheduler and memory management, but no networking or file system support. These functions are provided by user side servers. The user library allows user side programs to request resources of the kernel. The base layer includes the file server, which provides a DOS-like view of the file systems on the device. Symbian OS supports various file system types including FAT32 and Symbian OS specified NOR flash filing systems. The file system is generally not exposed to the user through the phone user interface.
Symbian OS is more modular than many other operating systems. For example, the file server performs disk services, and the window server provides screen and user input services. EKA2 has elements that are responsible for memory management, task management and task scheduling. Modules of Symbian OS and EKA2 are presented in Figure 2. EKA2 is a single user system unlike Windows, UNIX, Mac OS X and Linux, which are multiple users system. EKA2 is a priority based multi tasking OS with priority inheritance. It switches CPU time between multiple threads, gives the user of the mobile phone the feeling that multiple applications are running at the same time. Based on the thread’s priority, EKA2 switches CPU time and minimizes the delays to a higher priority thread when a lower priority thread holds a needed resource. EKA2 provides real time services, and completes them in a known amount of time. EKA2 can be a ROM based OS. This means that all system services and applications can be run directly from the ROM. EKA2 is suitable for open but resource-constrained environments. It is designed for mobile phones, and so it needs fewer key resources such as memory, power and hard disk than desktop operating systems such as Windows or Linux [Sales, 2005].

7
Figure 2. Symbian OS Overview [Sales, 2005]
From the privilege point of view, the Symbian OS is divided into user and kernel parts. The EUSER is the basic user library and provides basic functions such as class library methods which execute entirely user-side, access to kernel functions which on the user thread requires privileged accesses, and manipulate the memory from the kernel. The window server (EWSRV) and file server (EFILE) are user mode servers which allow user side threads to access the file system and the shared screen, the keypad and the pointer among all Symbian applications. ESTART completes the file server initialization process, and performs operations such as loading and mounting the file systems. Hardware Abstraction Layer (HAL) provides a set of static functions to get and set hardware attributes.
The Symbian OS kernel layer provides kernel functionalities through the EKERN library. The nano-kernel provides building on simple threads and services. Based on this, the kernel layer provides more complex objects, such as user-mode threads, processes, reference counted objects and handles, dynamically loaded libraries, and inter-thread communications. The memory model provides low level memory management services, such as per-process address space and memory mapping, and encapsulates significant Memory Management Unit (MMU) differences. It performs the context switch when asked to do so by the scheduler and is involved in inter-process data transfer. Logical Device Driver (LDD, hardware-independent) and Physical Device Driver (PDD, hardware-dependent) provide the interface between hardware peripherals and the Symbian OS. Extensions are device drivers which are automatically started by the kernel at boot time. The variant extension and the Application-Specific

8
Standard Product (ASSP) are loaded by the kernel very early in the boot process. The ASSP and the variant extension provide hardware dependent services required by the kernel, for example, Programmable Interrupt Controller (PIC) and real-time clock access. The Real Time Operation System (RTOS) personality layer provides the real time API to the client software, and translates a RTOS call into a call (or calls) to the Symbian nano-kernel to achieve the same function.
From the physical point of view, the kernel provides a software interface to encapsulate the physical differences in the hardware layer. The Board Support Package (BSP) contains software layers that control the hardware, including the bootstrap, kernel port and device drivers.

9
3. Basics of software fault analysis
In software development process, debugging software is an expensive, time consuming and mostly manual process. Software fault localization is the most expensive one of all debugging activities [Jones and Harrold, 2005]. Because of the high expense on both time and cost to find the fault, any improvement to the process of finding faults can greatly decrease the cost of debugging. The high cost of locating faults in programs has motivated the development of techniques that assist in fault localization by automating a part of the process of collecting and searching for faults.
3.1 Automated support for software failure report
Some software products, such as Mozilla and Microsoft Visual Studio.NET, have the ability to detect their own runtime failures. Many operation systems, such as Microsoft windows, also provide software failure detecting and reporting instruments. With the permission from a user, these reports are sent to developers via the Internet [Podgurski et al., 2003]. A transmitted failure report helps developers to analyze the cause of the failure. A typical report includes characterized information of the state at the time when the software failure was detected.
Although software failures can be reported by users via email or telephone in the traditional way, developers are unable to get adequate information about software conditions from users when a software failure occurs [Podgurski et al., 2003]. The automated support for collecting and reporting failures information is a great advance in software development technology. However, automated failure collecting and reporting also make troubles to software developers. The case is they often receive too many failure reports to have time to investigate in detail. Developers have to classify and prioritize failure reports they have received, so the most significant ones can be handled in time. There must be automated support for classifying and prioritizing increasing failure reports otherwise these reports will be nightmares for developers.
Classification strategies and techniques are presented in the paper [Podgurski et al., 2003] which includes the use of supervised and unsupervised pattern classification. Supervised pattern classification techniques require using a training set with positive and negative instances of a pattern, and unsupervised techniques do not have such requirement. These techniques are applied in order to group together reported failures with closely related causes and to initially classify them before manual cause investigation. Nevertheless, manual investigation is still needed to confirm or to refine the initial automatic classification. Afterwards, developers can use these classified
10
results to assess the operational frequency and severity of failures caused by particular defects, and to do further diagnosing on those defects.
Software failure analysis becomes easier when information about the program state just before each failure is provided. This information includes call stack, CPU registers etc. For example, in postings on the Mozilla project the fact that multiple crashes occurred at the same instruction and with the same call stack are used as evidence that crashes have the same cause [Podgurski et al., 2003].
Besides these failure scenes, whole execution traces can be also collected at runtime with the cooperative debugging framework. This data is sent back to developers with low overhead and it helps significantly in failure analysis [Liu and Han, 2006]. In theory, developers can prioritize and diagnose software failures with these collected failing traces. However, it has never been as straightforward method as expected. Developers have to group failures, manually investigate them and guess about fault locations. Then these grouped failures are assigned to developers who are responsible for the corresponding software component.
While system crashes result from software bugs, addressing occurred failure is the initial focus of software failure analysis. Since crash data was captured and stored in the crash dump file and generated at the point of failure, dump files can contain any contents of the system memory. Processing the dump file is often necessary to extract only the most relevant data. Privacy is another important factor against identifying what kind of data needs to be collected [Murphy, 2006]. We must keep in mind that collecting personal data without user’s permission is illegal although the privacy law varies greatly around the world.
3.2 Postmortem Symbolic Evaluation and crash analysis
Postmortem Symbolic Evaluation (PSE) is a software failure diagnosing method which uses a static analysis algorithm to analyze the failure location. PSE tracks the flow of a single value of interest from the failure point in the program to the point in the program where the value has originally been assigned [Manevich et al., 2004].
The automated support for failure collection and reporting is available in many software systems to software developers. The failure report contains minimal information about the failure including failure location and call stack dump. Unfortunately, the large amount of reported software failures make the manual effort involved in analyzing these failures so high that support teams are unable to deal them. The paper by Manevich et al. [2004] presents a tool that helps developers quickly diagnose program failures. It provides minimal information and could significantly

11
decrease cost and effort while addressing the number of failure. With the minimal information of the failure, PSE can automatically diagnose bug reports produced by deployed software.
Many operating systems have solutions developed for collecting software fault information from deployed systems. The collected information can be used for postmortem crash analysis to improve long term reliability [Heander and Malmborn, 2007]. The software fault analysis can be very difficult after the system has been deployed and with limited access to developers. With the user permission to report software failures while they occur, it is easier to solve this difficult problem.
In Microsoft Windows system environment, there is an application for collecting crashes. It is called Windows Error Reporting for Developers. When OS terminates a crashed application, a limited core dump called mini dump is generated and the user is asked the permission to send it to Microsoft. The dumped information contains the stack segment and status information. Developers can fetch their crash reports from the Microsoft’s website.
Mac OS X has a similar crash debugging system to Windows, called CrashReporter with some additional limitations [Apple technical note, 2008]. When an application crashes, a crash log is generated on disk. For GUI applications, a dialog box is also shown that lets the user send the report to Apple with a text description of what has happened. Developers can also configure CrashReporter to give the option of connecting the crashed program with GNU Project debugger (GDB). The log contains error codes, thread states with register contents and a call trace, but no memory dumps. However, it is not yet possible for third party developers to get access to reports which have been sent to Apple.
Linux has Linux Kernel Crash Dump (LKCD) to copy kernel memory to a predefined dump area when a kernel crash happens. The dump device is configured as primary swap by default. There is enough functionality to copy memory to disk while kernel crashes. When the process of dumping memory to disk is finished, the system re-boots. After the system boots back up, it checks for a new crash dump. If a new crash dump is found, it is copied from the dump location to the file system, "/var/log/dump" directory by default. Afterwards, the system continues to boot normally and the dumped data can be analyzed at later time [Patten, 2002].
Based on existed software crash analysis systems available in different operation systems, there are three essential features summarized here. Faults data collecting is the most important feature of a software crash analysis system. The automation support of

12
the fault data transmitting makes software crash analysis easier. A central server storing software faults provides a way to developer for fetching their crash reports.
Nokia has developed the MobileCrash system to collect system and application crash data on Symbian OS based smartphones. Afterwards, crash data is automatically sent to a crash file server where developers can fetch crash reports. This system will be presented in following chapters.

13
4. MobileCrash system in general
In practice, there are several development tool sets and techniques used in the Symbian software development process. Tracing is used in the very beginning of the smartphone development. There are only few limited operation system services provided during this development phase. Tracing is the most used but not the most efficient way to debug software when developers are developing software. The emulator is very convenient on developing Symbian applications after the whole system is mature enough to be released. However, the R&D phase is only a small part of the product’s life cycle. There are the so called true testing and product maintenance following the R&D phase.
In the laboratory environment, many bugs are found and fixed by performing well defined test cases. Nevertheless, these test cases can only find some of bugs. Before the smartphone is going to be released to the market, it is necessary to organize a group of end users to use the smartphone for a certain period. End users use the smartphone as their personal mobile phone. There are many bugs found during the true testing period which can not be found in the laboratory environment. This true testing process significantly helps to reduce potential software bugs and improve the product quality.
It is difficult for the end user to remember or record exact steps which resulted in a software failure or panic. The developer has to communicate with the true tester to ask about how to reproduce the bug and then try to fix it. In many cases, bugs have happened while true testers did not notice them. For this reason, the smartphone needs to have an instrument to record and collect the related information when a software failure happens. This is the idea why the MobileCrash system was implemented and taken into R&D use. Some extra features, such as data transfer, are introduced in order to make the Symbian OS software failure analyzing easier.
4.1 MobileCrash developing requirements
The software failure collecting and reporting cover the software development process from the implementation to the test. Both developers and testers need an easy way to achieve this job. This means that the developer can retrieve software failure data with the maximum information and analyze the data easily. The tester needs the tool easy to use, highly automatic, and keeping notified when software failure happens [Wang, 2007]. In addition, the tool will be hardware independent and works on all Symbian OS based smartphone platforms.

14
Well designed software architecture can fulfill those requirements which are asked for hardware dependency, easy installation method, and customer usability. Besides, the software implementation is still the key issue. Since the way how the software implemented will affect the software compatibility along with different hardwares, and even the installation on different products [Wang, 2007]. The software implementation shall work among all products based on Symbian OS and shall catch both user side panics and kernel side faults.
For analyzing software faults, the necessary data must be defined to design the software architecture. Basic information of the panicked software must be provided: the panicked software module, the panic category and ID. In addition, more data is needed for analyzing and locating the bug. The panicking time call stack dump is used to analyze software failures by checking pushed function calls. Panic time loaded libraries are used for checking and decoding function calls by the memory address. CPU exception information can be used for investigating the bug by checking the exception type and value. The Table 1 lists the data which shall be collected after or before a software failure happened.
Data fields Description of purpose
Timestamp The timestamp when panic happens
Panicked Module The panicked component thread name
Panicked Process The panicked component process name
UID Unified Symbian application identity
Panic Category Symbian OS or user defined panic category
Panic ID Symbian OS or user defined panic identity
ROM ID Rom image checksum identity
SW Info The smartphone SW information
Language The smartphone language setting
IMEI code The smartphone International Mobile Equipment Identity
Program Counter A CPU register indicates where the CPU is in its instruction
sequence
CPU Registers A set of CPU registers’ values
Stack Pointer A CPU register used to access call stack and points to the
current top of the call stack
Stack Base The bottom address of the call stack

15
Stack Top The top address of the call stack
Call Stack dump The content of the call stack
Loaded DLLs The lists of linked libraries loaded to memory
Reset Reason The software reset reason if the panic causes system reboots
Test Set A name for tester to do a group of tests. It is used to identify
panics came from a certain test purpose
Available memory the available system memory while the process crashed
Up running time The phone up running time from phone boot up to crash, or
between two crashes
Phone alive time The phone up running time regardless of crashes and reboot
Exception information
ARM CPU exception information. It includes the exception
code, the fault PC, the current program status registers
(CPSR), and the fault address registers (FAR), the fault
status register (FSR, the R13 in SVC (R13SVC), the R14 in
SVC (R14Svc) and the saved program status register
(SPSR) while the process crashed
IMSI code International Mobile Subscriber Identity
Disk info Available free user disk space in bytes
System event log data Includes key events, window events and so on (context
awareness data)
GPS status GPS on and off status
Bluetooth status Bluetooth on and off status
IrDA status IrDA on and off status
MMC status Multimedia card inserted or not status
WLAN status WLAN on and off status
Phone mode Active phone mode or profile (offline, 2G, 3G, HSPDA
(3.5G))
Battery charging status Battery charging on and off status
Battery level Battery level
USB cable connected USB cable connected or not status
Accessory lists Headset or accessory connected (physical connection, and
possibly accessory id list)
ETB ARM CPU Embedded Tracing Buffer

16
Table 1. MobileCrash collected data
4.2 MobileCrash general design and implementation
Data items defined in the previous section (Table 1) are not only used for analyzing software failures but also for evaluating the product maturity. As mentioned before, call stacks, CPU registers, panic category, panic ID, exception information and so on are used for analyzing a software failure. Other items are used for evaluating the product maturity. Uptime and phone alive time indicate how long the phone has been used and what is the mean time between failures. A specific smartphone is identified by the IMEI code while the software info is used to check which smartphone firmware is used while the software failure happens. The software info can also be used for doing various comparisons between software releases. For example, the panicked module is used to calculate software crash counts against software releases or certain time periods (weeks, months).
MobileCrash has a well defined file format for collecting and storing data into a crash log file in the smartphone storage. After developers get this data, they can easily decode the data against the file format. The crash data validity is important. There is extra benefit during the data validation and transmission. For example, for each crash log file there is a head including the number of collected items and a CRC (Cyclic Redundancy Check) value at the end of the crash log. The CRC is used to validate the data when the crash log is transmitted via SMS. The file format is used to reduce the size of a crash log, so the crash log can be sent via limited numbers of SMS. Since data items and types are well defined, a standardized method can be used for reading and writing data against the file format.

17
Figure 3. MobileCrash Module design
The MobileCrash system has several components in both devices (Symbian OS applications) and the PC environment. Figure 3 presents the MobileCrash module design. In the device side, there are three key components called MobileCrash kernel agent, MobileCrash user agent and crash log sender. In the work station side, Selge tool decodes crash data into human readable crash reports. Hoover tool delivers crash data from the device side to work station or server side via an USB connection. In server side, a SMS/GPRS crash log gateway is responsible for receiving crash data and submits crash data into MobileCrash server where developers can fetch human readable crash reports.
The kernel agent is used for catching Symbian kernel side crashes and implemented by the Symbian crash debugger framework (detailed information in the chapter 6.3). The kernel agent registers itself to the Symbian crash monitor. When any kernel side crash happens, the kernel agent is invoked to collect needed crash data formatted in the MobileCrash file format. Afterwards, the crash data can be either dumped to Symbian traces or stored into reserved NAND memory via the MobileCrash data store component. The data store is a common interface and provides hardware independent storage media accessibility. Basically, when the kernel has panicked, there are no particular OS services assumed to be working properly, and it finally results in a system soft reset subsequently.

18
The MobileCrash user agent is for catching Symbian user side application crashes and implemented from Minimum Kernel debug agent (MinKda) (detailed information in Chapter 6.2). The MinKda is a logical device driver and registered to the Symbian OS kernel to check kernel events. When a user side crash happens, the MinKda collects the needed crash data and notifies the user agent to receive crash data. Then the user agent collects the crash data and appends device specific data, for example IMEI, SW Info, ROM image ID and so on. This data is written as a crash log file into the reserved NAND memory, the file system or dumped as Symbian traces. System event log data is also appended as a part of the crash log. The user agent also checks the NAND partition whether there is a kernel crash log after system booting up. If there is a kernel crash log in place, the user agent will retrieve it via the data store interface and write it as a crash log file into the file system.
The Sender is for transmitting crash logs to a particular MobileCrash crash log gateway via SMS or GPRS. This process must be automatic and as simple as possible. Although testers may not necessary stay in the laboratory environment and they have limited access to the internet, crash logs still need to be sent back for bug analysis. This requires another means than relaying on the intranet, and there is a need to send crash logs at any time. Considering the real life, the true testing is held by different randomly selected volunteers and they might not have enough knowledge to do complex crash log transmitting operations. In addition, the true testing before the product releasing has a very tight schedule and it needs to minimize the delay to get test results. All these needs are fulfilled by the Sender which automatically and immediately transmits the data right after a crash has been collected. However, the SMS Sender has limited capacity because the data load of one SMS message is fairly small. This requires a concatenating protocol for both the sending and receiving process. The Sender will reduce the call stack size and minimize the loaded DLL list so one crash file can be divided into less than five SMS messages. The SMS crash log gateway will concatenate all received SMS messages into corresponding crash logs.
Nevertheless, the content and the amount of data load are not limited by means of a USB transmission. Crash logs collected by the USB transmission are eventually forwarded to the MobileCrash server via ftp or the MobileCrash Hoover tool through the intranet. Although all crash logs can be sent to the MobileCrash server automatically, the usage of MobileCrash is not only limited in this way. Developers can use it alone to analyze Symbian OS software failures by retrieving crash logs directly from the device file system or Symbian OS traces. In order to decode the crash log by PC software installed on the workstation, a USB connection or a blue tooth connection is a preferred data transmission way for developers. As an option, developers can

19
retrieve crash logs from the memory card used by the smartphone. Crash logs written into the memory card can be easily retrieved by using a memory card reader.
An elementary rule for data transmission is that crash logs are sent to the server during the testing period and transferred to a local PC workstation for the developer doing software failure analysis during R&D period. Both ways need a decoding tool to get crash log files decoded. For this, there is a windows console application, the so called Selge tool, developed. According to the crash file format, the Selge can decode a crash log file into a crash report or a crash information file which is used for submitting crash data into the database. In order to decode call stack dump into human readable function calls sequence, the ROM symbol file and binary map files are needed. In Wang’s thesis paper [Wang, 2007], the method of decoding Symbian OS call stack is presented in detail.
In general, crash logs need to be decoded no matter what underneath devices have generated them, although devices are developed based on Symbian OS. The Symbian OS base porting is affected by hardware differences and the memory layout for the core Symbian OS libraries as well [Wang, 2007]. The decoding tool Selge is configurable and can decode the crash log according to its original platform which raised the crash. The Selge tool decodes the call stack binary dump, which includes function return addresses mapped to different binary modules on the device, into function names in text format.
In addition to the crash analysis, MobileCrash provides a server to store decoded crash information and to view results via web services. The server implementation includes a relationship database, a web service server and a crash information submission tool called CrashFileDBMover. The web based UI provides statistical analysis based on the name of a product, or the specified software release of a product. The idea is that the crash count against software components could point out which module has been crashed more often than others on a certain software release. Based on this result, developers shall prioritize the time and effort on fixing those modules with the higher total crash count on the software release. The software modules total crash count by time sequence is also provided for indicating whether a specific software component is stable or not.
Figure 4 presents the analysis of crash ratio (the amount of crashes is divided by the amount of unique devices) on software components for a certain product ordered by months. The analysis is made on subsequent months of a selected product. In the diagram, each column represents one month, and each row represents one software component. The number in the table indicates the crash ratio of the selected component among different months. The table provides the information, for example, that the

20
component Standby mode had more crashes during June and July 2007, and had less crashes until October 2007. The reason behind it might be that bugs had been fixed.
Figure 4. Crash ratio on software components by months
Although the MobileCrash system provides the crash report for analyzing the fault
reason, what happened before the crash is still unclear. The MobileCrash system event log is a supplementary to the MobileCrash system. It logs Symbian system events. When crash happens, logged events are collected as part of the crash log. The events log provides a way to reproduce or study the cause of a fault. The next chapter will present the MobileCrash system event log in detail.

21
5. MobileCrash system event log
5.1 Background information
The smartphone is not only a mobile phone but also an information access device. The Symbian OS based smartphone provides many applications such as calendar, web browser, GPS. These software applications need to be well developed and tested before they go to the market with the smartphone. The true testing is part of the testing process and its purpose is to find more bugs, to fix them and to improve the software quality. The MobileCrash system catches and collects crash information. However, how to record and report the context before a crash is never an easy task. Here is a use case which happens every now and then in the smartphone development process.
After a phone application crashed, what have been done before it crashed? Let’s consider a scenario.
Manager: The latest software build is very stable. We can start thinking about production…
True Tester: I flashed the latest software to my phone yesterday and it crashed a couple of times when I was playing with the phone on the way home in the evening. I was doing this and that, and the phones crashed.
Manager: Can you tell how to reproduce the problem step by step?
True Tester: Well… Not exactly, I can not remember the detail…
In this case, a system event logger is helpful on avoiding such a situation. The idea is to collect not only the normal crash data (such as CPU states and registers, and the call stack) but also extra information about the precondition of a crash. The system event log includes a number of user actions before a crash happens. This may include simple key press events or more sophisticated log items of started applications and active application during the crash. In addition, it can include internal system events as well, such as an incoming phone call, the packet data connection status, and the available memory.
Enhanced MobileCrash system crash data is presented in Figure 5. It provides the high-level information in addition to low-level crash dumps about crashes and helps on analyzing and understanding crashes in shorter time.

22
Figure 5. MobileCrash crash log with event log
There is one thing that makes this system very useful, since it automatically
provides the input for analyzing with the extended context of crashes. Such information may speed up analyzing, error fixing, revealing unexpected behaviors of some components and the whole system, and finally shortening development phases of a product. A very strong motivation to have this system developed comes from the fact that the system will allow to study so called hard-to-reproduce cases, since everything what happened before the crash will be recorded (of course, the set of events should be sufficient) and sent to the central database. The database is easy to access anywhere inside Nokia and provides the information in a human readable and user friendly way.
The idea of the enhanced crash log is somewhat similar to tracing. However the device will store the record of events inside itself in a circular buffer. So new coming events will erase the most obsolete ones. The implementation has to be as efficient as possible to meet the real-time requirement. Thus, the most preferable implementation will be based on Kernel executive calls, such as software interrupts, and would be alike the existing tracing system.
Visualized information will give a lot of knowledge to a developer. And the dialog presented in the beginning would have ended more promisingly: “Let’s check what has happened...” Such a system will make the true testing more systematic and it will be possible to analyze recorded user actions. However, it is just a top of an iceberg - the reality is behind the curtains, i.e. we would be very interested to know what happens inside the system and how it reacts to user inputs. That is why we need the system to produce some events also to have the best possible crash history. Another post-processing includes automatic finding patterns of events eventually resulted in crashes. Basically, it is close to lexical analysis and conditional probabilities calculations. It will
Crash data
Pre-condition
User
System
Crash
Crash data

23
indicate where the system has a bottleneck and should get the most attention. Finally, classic statistical processing may be also applied in order to find out statistical measures for tests and different components.
The system, or internal events, can be produced by different levels of software, for instance:
• The Kernel can notify about the memory status, file I/O, resets, process or thread creation termination, library loaded or unloaded and etc.
• Hardware adaptation software can notify about critical situations, temperature raising, low battery level
• Telephony software can notify about incoming/outgoing calls and their statuses, network field strength and network type, handovers and 2G/3G network changes
• Messaging software can notify about incoming/outgoing messages and phases of creation/sending/receiving/displaying
• Multimedia software can notify about multimedia resources and hardware, status changes and progresses of playing media formats
Events provide information to reconstruct the situation and possibly see where the problem is. Experts and specialists from different software areas can provide the information of what needs to be logged and events can be defined.
As we can see, the idea here is that we keep track of user actions and we may know the background of a possible crash much better and have more details about it. In its turn such information may provide useful hints and better understanding about a crash, rather than just call stack dump. It will be possible to see which application the user has started, which was active and which were in the background; what functions were invoked by the user and in which order.
The information security and privacy shall be kept in mind while developing such a system, since it would possibly collect private information. Therefore, the system shall also notify the user when it is active and possible can be switched off by the user to preserve the privacy. Nevertheless, it may be used for R&D and true testing purposes efficiently and produces valuable information.
5.2 System event log architect
System event log records various events into a circular RAM buffer. Those various events include user actions (key events, started application, active application), and internal system events (incoming phone call, packet data connection status, available

24
memory and etc.). Logged events can be accessed by MobileCrash kernel agent and user agent in both kernel side and user side when a crash or a panic happens. The events log will be sent to a MobileCrash server, decoded by Selge and presented in the MobileCrash web UI.
Figure 6. System event log overview
5.3 System event log design
The system event log is an extension of the MobileCrash system. This section describes the high-level structure of the system event log and how the previous MobileCrash system will be extended to collect, transmit, and decode logged system events. Software can be divided into several sub-components. See Figure 7.
The current version while doing this thesis work is only for key events and active tasks logging. More events logging will be added to the system in a later version.

25
Figure 7. System event log components division
When a key event happens, the key events logger will be notified by Symbian
window server. The key events logger sends a key event recording request to the events log manager server. The events log manager server checks the request, encodes the event and calls the general memory device driver to save the event into a circular RAM memory buffer. When a crash happens, MobileCrash kernel or user agent will read the

26
events log from the RAM memory through the event log manager, the general memory device driver, and assemble together with the crash data into a crash file.
Other events rather than key events will be implemented in separated components which send event logging requests to the MobileCrash event log manager server. The pending events from event loggers will be written to the circular buffer through the general event logging memory device driver.
A crash file including events is decoded and presented by PC software, which includes Selge, CrashfileDBMover, and web UI. The data coding and file format of events log are parts of the crash file format. In the MobileCrash server, the web UI presents the decoded events log which helps on analyzing the cause of a crash.
The class diagram of the system event log design for Symbian side components is presented in Figure 8.
Figure 8. System event log class diagram
The system event logger is the client side of the system event log manager server.
There will be more than one event logger in the future. In the current version, only the key pressing events and active task activation events were designed and implemented.
The key events logger is a window server animation plug-in. The key events logger is registered to the window server, which passes window server events (if required) so that the animation plug-in can handle them before other applications. When any key

27
event happens, the key events logger will send key events logging request to the event log manager server.
The task activation events logger is an active object which is derived from CActive class. The task activation events logger registers demanded window group focus changing events from the window server through the member function RWindowGroup::EnableFocusChangeEvents(). Afterwards, the registered event will be handled by the task activation events logger in the callback function CActive::RunL(). As soon as the window group focus change event happens, the task activation events logger will send the event logging request to the event log manager server.
The system event log manager server collects subscribed events, and performs processing before writing event data into the data buffer through the general memory device driver. The design of this module obeys the rule or the restriction of the Symbian Client-server framework. The Event log manager server has the capability to adapt to recording other events, such as kernel events, OS services (time, memory), and S60 phone components notifications. In addition, both user and kernel side event logging clients can connect to the server to log events.
The system event log manager server has an internal event data buffer, which stores incoming events and processes those events before writing them into the circular RAM buffer through the general memory device driver. This internal buffer can reduce the processing delay for those time-critical events, such as kernel events or UI redraw events. The internal event buffer is a FIFO list of event data ordered by receiving time.
The general memory driver can be used for accessing the event circular RAM buffer. It provides read and write operations for other components to put and fetch events log data.

28
Figure 9. MobileCrash crash report with system event log
In Figure 9, the crash report descripers a very typical user side panic that happened when one of the menu item of an application was selected. In this case, the application ErrorTool was started and it panicked after some operations. Developers can reproduce this error by opening the ErrorTool application and following the event log by pushing corresponding keys on the mobile phone. The sequence of the event log is the latest event on the top. If the error can be reproduced, the developer could inspect suspected source codes and do debugging on it. However, it is hard to reproduce bugs of background applications or system services even when we have collected enough event logs. The crash might be caused by many reasons which can not be tracked by the system event log, for example function call sequences, access violation and so on. Besides the detailed event log, crash analyzing is still based on analyzing the call stack, the panic reason, and exception values and so on. In Chapter 6, crash analysis in Symbian OS will be presented and used for real case studies.
5.4 System event log improvement
Since the system event log significantly increases the size of a crash log, a substitution of the current SMS Sender must be applied to the MobileCrash system. The crash log without the system event log is only about few hundred bytes, and it can be sent out in

29
four to five SMS messages. The system event log itself will be more than a few kilo bytes or tens of kilo bytes even there are only one thousand latest system events logged. In this case, the SMS Sender is not suitable for transmitting big crash logs anymore, because there might be over ten messages only for delivering one crash log. A TCP/IP based data Sender and crash log gateway are proposed in Figure 10. With the internet access library, the Sender can connect to the gateway by a secured connection over the internet and send a hundred kilo bytes crash log in few seconds. The advantage of the new solution is not only for event log but also for the MobileCrash crash related information collection. More crash related information can be collected and transmitted for crash analysis. The data can be a memory dump, a full call stack dump, and OS or application traces.
The system event log is designed and implemented in client-server architecture. More system events rather than key pressing can be logged and saved as part of the crash log. These events refer to the section 5.1.

30
Internet & Cellular network (GPRS, 3G, WIFI)
Network access library
Corporation intranet
TCP/IP access library
MobileCrash sender
SMS access library
Mobilecrash data handle code
UI
Config reading
code
Mobilecrash IP Gateway
https access
Statistics Output handlers
Output directory
Mobilecrash WEB service
Mobile symbol data
Output directory
Service x
Device SW
Figure 10. GPRS crash log gateway
Although the system event log provides pre-condition information for us to
analyze the software fault, how we analyze those faults is still one of the most important aspects of this thesis. In Chapter 6, I will present crash analysis on Symbian OS.
31
6. Crash analysis on Symbian OS
Possibly the most difficult software failures are those that occur on target devices, rather than those who run on the emulator environment. This chapter begins with discussing common reasons of software failures on Symbian OS, and then goes into detail about various reasons which are captured and analyzed with the help of the MobileCrash system.
Full interactive debugging on reference hardwares and some real phones is available through the Codewarrior IDE. Lauterbach Trace32 also provides interactive debugging on reference hardware. Where these tools are not available, there are a number of tools and utilities that can provide system logs and error reports to assist the debugging process.
Specific crashed software needs to be analyzed by the call stack. From the decoded symbolic call stack, we will find the clue about the possible location where the code caused the fault. Those logged system events also provide information for better understanding about the crash. One of the most important features of the MobileCrash system is to analyze crashes or panics by statistical data. Currently, the MobileCrash system has a web based tool to get statistical data such as the amount of similar crashed software’s call stacks, different software with a similar call stack and their runtime loaded DLLs. With the help of the data, we could classify the huge amount of crashes into different crash categories. After we analyze these different categories, we might find implicit relationships between different crashes and different software. Anyhow, our purpose is to point out the software component which caused the fault.
By using the MobileCrash system, we also collect some other useful information which helps us to analyze the crash. They are ARM CPU exception registers, Symbian panic reason and category. How to use the information will be presented in following sections.
6.1 Symbian OS crash analysis in general
The application running in the Symbian OS environment can fail in many different ways. Symbian has defensive programming mechanisms to panic those threads which might cause troubles to the system. These mechanisms include checking methods of CleanupStack::Pop() and CleanupStack::PopAndDestroy(); using the assertion macro liberally to detect programming errors or to catch invalid runtime input. In addition, Symbian OS provides a protected environment which can halt an application or the

32
system if a process acts improperly. These are not software failures in the Symbian operation system, but a kind of opportunity to get more information about the context of the software problem and help to analyze the state of the running system.
There are about six categories of software failures on Symbian OS. Application panic is the current application being halted, usually with a “Program closed” dialog; the application is killed and the system keeps running. System reset is the device reboot, usually caused by kernel side system fault; when kernel has fault, no stable system services are guaranteed and the system must be rebooted. System error is a run time exception, such as disk full, will result in a “System error” dialog. Application jam happens when the foreground application becomes unresponsive and eventually is closed by the system. In system jam, the device is unresponsive to key pressing, task switching and screen updating. Unexpected behavior is the action which does not perform the expected result.
Design by contract is a computer software designing approach [Design by contract, 2008]. Software designers should define precise verifiable interface specifications for software components based upon the theory of abstract data types and the conceptual metaphor of a business contract. Design by contract is extensively used by Symbian and a technique for guaranteeing correctness in code. On Symbian OS, a panic will be raised if an API is called with an incorrect parameter or in an unexpected way. It can indicate a violation of a precondition or an invariant. The precondition is the value of a parameter passed into a function in an incorrect way, and the invariant is the calling of a function causeing the object or data structure to enter a invalid or inconsistent state.
The Panic is a Symbian term used to represent an early termination of a thread (process). A panic can be caused by a severe coding error. For example, the caller of a function has violated an API convention (calling function with invalid parameters) or an object (or memory structure) has changed into a bad internal state. A panic can also be an exception occurring while executing the thread. For instance, the USER 22 exception occurs when the position value passed to eight bits variant descriptor member function is out of bounds. In fact, panics are very helpful on bug locating, since they denote the exact nature of the problem in the software development.
The panic can emphasize the programming error rather than just return an error code. The purpose of panic is trying to fix the code error rather than let it be. For example, a class has two phases of initialization and some methods are required before the second phase of initialization. Then we say that a precondition of the phase two initialization is calling those methods. This suggests that there is an order in which functions must be called. If the order is not considered, the condition will be highlighted by asserting the order and the developer can fix it in the right way.
33
On Symbian OS, a thread usually does not panic explicitly by calling the function User::Panic(). A thread can be panicked from another thread. The kernel will panic a thread which might cause an exception by accessing memory outside its privilege. This typically means that the kernel panics the thread with a KERN-EXC 3 code. The client-server architecture on Symbian also has the defensive mechanism which servers sometimes panic a client thread if the server was passed an invalid handle or operation code. In the case, the server will terminate a user thread by using the handle of the client’s thread to call function RThread::Panic(). For example, the window server will panic a thread by the code WSERV 1 when the client thread passes an invalid operation code.
Symbian OS provides a dynamic link library (DLL) and plug-ins for reusing codes and extending system functionalities. The static DLL is library code which is executed within the context of a thread. If the function is called by the application through the DLL then we say the function is called in the context of the application thread. For this reason, the fault in the DLL code may cause many severe problems depending on the context in which it runs and whether the thread is a system critical one or not. Even a small change to a common system DLL can impact the system stability. A plug-in is a dynamically loaded DLL which has a known interface and means to provide a specific implementation or to extend the functionality of a system service. The plug-in framework of EKA2 extends the support to provide a generic mechanism for finding, registering and loading libraries. Plug-ins are either standard ECOM (the Symbian generic plug-in architecture) plug-ins or polymorphic DLLs (normally loaded by RLibrary class). The Symbian platform security capability check can protect a server when it is calling a function on a plug-in. If the plug-in causes a panic then the calling thread will panic or results in a system reset if the thread is system critical one.
Although panics can cause unreliable issues to the system, they are still good things. They highlight an incorrect behavior or a bad system state. It is easier to find a problem if the code fails with an error rather than just fails silently. Following sections will present various panics and how they can be captured by the MobileCrash system.
6.2 User side panic
Symbian OS kernel exposes an API allowing debug agents to trap hardware exceptions, software exceptions, panic events (and threads killed for other reasons), and system event notifications. The Symbian OS provides a class DKernelEventHandler which constructs a kernel event handler by installing a call-back function. Objects that are derived from the class DKernelEventHandler can be added to the kernels event handler queue. The object has to provide a call-back function which is invoked when any of

34
events listed in the TKernelEvent enumeration occurs. The call-back function has two arguments whose meanings are determined by the event. The kernel will pass on an event until a handler deals with the event. If no handler deals with the event the kernel will take its default action (i.e. killing the thread, or rebooting).
In general, a crash dump of the user side panic shall occur given the unexpected termination of a thread signaled by the following set of triggers. These triggers include: EEventSwExc, the debug event handler for software exceptions is called as a result of user code executing User::RaiseException (or RThread::RaiseException which calls User::Raise Exception). The EEventKillThread event is delivered when a user or kernel thread terminates (will also be delivered following by User::Panic() or RThread::RaiseException() function call ). The EEventHwExc event is delivered when a hardware exception occurs (e.g. Pre-fetch Abort, Data Abort or Undefined Instruction). [Symbian reference guides, 2007]
The MobileCrash user agent is responsible for collecting call stack, CPU registers and other information from a panic thread. While an exiting thread causes multiple events, the MobileCrash user agent only handles the event EEventKillThread or EEventHwExc. The event is sent before the thread finally terminates, so the user agent can collect enough thread context information according to the MobileCrash requirements.
Figure 11 shows principal run-time behaviors of the system.
Figure 11. MobileCrash user side panic

35
Figure 11 shows interactions among the debug device driver, the MobileCrash user agent and the “crashed” application. Some notes to the figure:
1. The device driver registers itself to the kernel event handler queue. It checks the kernel events and notifies the MobileCrash user agent. When the kernel event is EEventKillThread, the thread exit type will be checked whether it is caused by panic exit or not. Since the user agent only handles those user side crashes, the device driver will check whether the thread death is going to cause a reboot, or its death is going to kill the process causing a reboot. All kernel threads are critical, and we don't want to debug those critical threads, e.g. the thread DfcThread0.
2. After a crash occurs and the system context is accessed, the crash log is output to the selected media (SDRAM, NAND partition, or crash log etc.) in the MobileCrash crash file format.
3. The suspend thread(s) action after the crash does not necessarily have to be performed by the device driver directly after the crash. The Symbian OS will take care of the thread clean up.
6.3 Kernel side panic
Symbian OS provides support for both Application (user side) and System (kernel side) crash dump. During a system crash, the kernel becomes a single threaded application without access to OS services, such as file system and network connectivity, which are not available. For kernel side crash, a two-stage approach is required to store and recover the crash dump data.
In general, system crashes are the result of the function call Kern::Fault while threads are executing with supervisor privilege. For example, Panics and ASSERT handle those predicted exceptions, such as:
1. File opening failure
2. System server dies
3. Security failure from the thread and process rename
4. Serial overwrite failures
5. Negative initial heap size
6. Cache initialization failures
7. Memory management address failures, page table assignments
As shown in Figure 12 the device driver calls Kernel::Fault() which passes the control to the Kernel debug monitor controller. The debug monitor controller then calls

36
each of the registered monitor extensions to process the crash event. For the crash debugger, it stores the following information into NAND flash memory by using the specific NAND driver access methods in the MobileCrash crash file format:
1. ROM ID, the ROM image checksum
2. Exception stacks
3. Fault information (Category, reason, exception ID))
4. Current thread and process info
5. CPU registers
6. Code segments, loaded DLLs
7. Threads stacks
Figure 12. MobileCrash kernel fault Control Flow

37
The MobileCrash kernel agent writes the crash data to the flash memory. After storing the crash data and once the kernel monitor has called all registered monitors, the system is rebooted.
Following the system reboot, the MobileCrash user agent will check the flash memory and complete the information of the kernel temporary crash log. The saved crash log is located in a NAND partition and read out by the MobileCrash data store component. Afterwards, the crash log will be written into the file system, e.g. e:\ or c:\data. Once the crash log data has been extracted, it is overwritten by the signature to the NAND partition, the device is then ready to capture and store any subsequent crash context.
Figure 13 shows the operation of the crash logger in the current architecture by using a device driver crash event as an example. The system executes in the same manner for all system crash events.
As the system crash scenario requires a two-stage solution, it is appropriate for the configuration and output mechanisms to be reused to provide a generic crash log dump solution for both application and system crash events.
Kernel (system) fault handling happens in such a way that Kernel::Fault() passes control to the Kernel crash debug monitor. The debug monitor calls each of registered monitor extensions to process the crash event. The MobileCrash kernel agent is one of those registered monitor extension and stores information to NAND flash by using the data store interface via a raw NAND driver. If the data store discovers that the flash partition already holds crash logs but has enough free space to hold a new log it stores the log. If there is not enough free space based on the configuration system, the kernel agent will delete the oldest ones to free enough space. After storing the crash log and calling all registered monitors the system executes a software system restart.
The second stage processing is quite straightforward. The user agent reads the reserved flash partition via the data store interface and if it finds outstanding crash log information which is used as a data source for creating a crash log with completed devices variant information.
The overall architecture is shown below:

38
Figure 13. MobileCrash crash dump architecture
The MobileCrash user agent supports checking system crash logs at its start-up time.
User mode access to the reserved flash partition holding system crash data will be enabled via the MobileCrash data store interface.
6.4 Exceptions
An exception is the happening of a condition that changes the normal flow of a program execution. Besides the implicit function call to User::Panic() or Kern::Fault(), Symbian OS also handles processor exceptions. Symbian processor exceptions are different from C++ exceptions. Common exceptions include memory access violation which means accessing memory which is not mapped to the process, e.g. setting a value to a null pointer; page fault which means accessing virtual memory that is mapped to the memory address space but not loaded into the physical memory; and data alignment fault which means trying to access a data structure which is not on a word boundary. In the context of ARM CPU, there are distinguished exceptions including pre-fetch abort, data abort and undefined instructions.

39
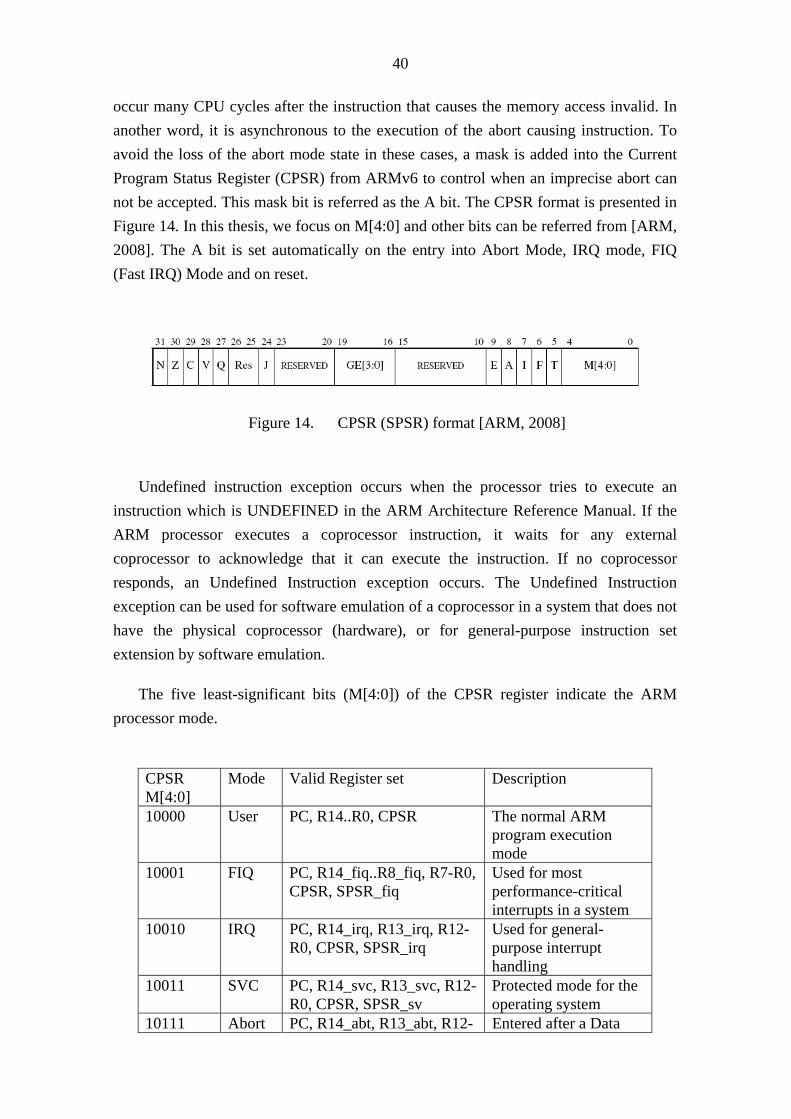
The understanding of exceptions handling in Symbian OS can significantly help to analyze the crash reason and the possible crash location. When the panic category is empty and the panic reason is zero, developers need to check ARM exception registers. In the following example, the fault is caused by an unhandled processor data abort. The further information on the type of exception can be looked at the exception information of the generated crash log, for example:
Fault PC 788d00e4, Exc Code 00000001, CPSR 20000010, FAR 00000000, FSR 00000005, R13Svc c9208000, R14Svc 8009878c, SPSRSvc 20000010
The Fault PC field shows the address of the instruction that caused the exception. The Exception Code (Exc Code) shows the type of exception. Depending on the type of exception and instruction, Fault Address Register (FAR) field shows the address of the data which the instruction was trying to access. The number after Exc Code is the type of exception, in hexadecimal, and is one of ARM exception types (Table 2). The meaning of the numbers depends on the type of processor.
Value Meaning 00000000 Prefetch abort 00000001 Data abort 00000002 Undefined instruction
Table 2. ARM exception types
• If the exception is a prefetch abort, then the code address is invalid.
• A data abort means that the code address is invalid.
ARM exception types are divided into three categories. Here we have the explanation from the ARM Technical Documentation [ARM, 2008].
Prefetch Abort is a memory abort which is signaled by the memory system. The Prefetch Abort in response to an instruction fetching marks the fetched instruction as invalid. If the processor tries to execute the instruction marked as invalid, a Prefetch Abort exception is raised. If the instruction is not executed (for example, as a result of a branch being taken while it is in the pipeline), there is no Prefetch Abort occurred.
Data Abort is a data access memory abort. It is signaled by the memory system as well. Data Abort in respond to a data access (e.g. load data and store data) marks the data as invalid. A Data Abort exception has a higher priority than any following instructions or exceptions which have altered the state of the processor, this means it will occurs before them. There is an imprecise data abort caused, for example, by an external error on a write operation which has been held in a write buffer. This might
40
occur many CPU cycles after the instruction that causes the memory access invalid. In another word, it is asynchronous to the execution of the abort causing instruction. To avoid the loss of the abort mode state in these cases, a mask is added into the Current Program Status Register (CPSR) from ARMv6 to control when an imprecise abort can not be accepted. This mask bit is referred as the A bit. The CPSR format is presented in Figure 14. In this thesis, we focus on M[4:0] and other bits can be referred from [ARM, 2008]. The A bit is set automatically on the entry into Abort Mode, IRQ mode, FIQ (Fast IRQ) Mode and on reset.
Figure 14. CPSR (SPSR) format [ARM, 2008]
Undefined instruction exception occurs when the processor tries to execute an instruction which is UNDEFINED in the ARM Architecture Reference Manual. If the ARM processor executes a coprocessor instruction, it waits for any external coprocessor to acknowledge that it can execute the instruction. If no coprocessor responds, an Undefined Instruction exception occurs. The Undefined Instruction exception can be used for software emulation of a coprocessor in a system that does not have the physical coprocessor (hardware), or for general-purpose instruction set extension by software emulation.
The five least-significant bits (M[4:0]) of the CPSR register indicate the ARM processor mode.
CPSR M[4:0]
Mode Valid Register set Description
10000 User PC, R14..R0, CPSR The normal ARM program execution mode
10001 FIQ PC, R14_fiq..R8_fiq, R7-R0, CPSR, SPSR_fiq
Used for most performance-critical interrupts in a system
10010 IRQ PC, R14_irq, R13_irq, R12-R0, CPSR, SPSR_irq
Used for general-purpose interrupt handling
10011 SVC PC, R14_svc, R13_svc, R12-R0, CPSR, SPSR_sv
Protected mode for the operating system
10111 Abort PC, R14_abt, R13_abt, R12- Entered after a Data

41
R0, CPSR, SPSR_abt Abort or instruction Prefetch Abort
11011 Undef PC, R14_und, R13_und, R12-R0, CPSR, SPSR_und
Entered when an Undefined Instruction is executed
11111 System PC, R14-R0, CPSR A privileged User mode for the operating system
Table 3. ARM processor mode [ARM, 2008] Not all combinations of mode bits define a valid processor mode. Only those
combinations explicitly described can be used. If any other value is programmed into mode bits M[4:0], the result is unpredictable.
The Fault Status Register (FSR) field indicates the fault generated by the MMU. The lowest four bits of the FSR value indicate fault reasons in Table 4 .
Value Meaning 0000 Vector exception 0001 Alignment fault 0010 Terminal exception 0011 Alignment fault 0100 External abort on linefetch for section translation 0101 Section translation fault (unmapped virtual address) 0110 External abort on linefetch for page translation 0111 Page translation fault (unmapped virtual address) 1000 External abort on non-linefetch for section translation 1001 Domain fault on section translation (i.e. accessing invalid domain) 1010 External abort on non-linefetch for page translation 1011 Domain fault on page translation (i.e. accessing invalid domain) 1100 External abort on first level translation 1101 Permission fault on section (i.e. no permission to access virtual
address) 1110 External abort on second level translation 1111 Permission fault on page (i.e. no permission to access virtual address)
Table 4. FSR fault category [Symbian reference guides, 2007] The Processor supervisor mode register R13 (R13svc) indicates the program
counter. The Processor supervisor mode register R14 (R14svc) indicates the link register. The Saved Processor Status Register (SPSRsvc) holds a copy of the CPSR when processor enters a new mode.

42
Until now, we have learnt all necessary knowledge about Symbian OS crash analysis. The following chapter will present case studies with the help of the MobileCrash system.

43
7. Case studies
In this chapter, I will present several crash analysis cases. They include heuristic stack analysis, application panic analysis, application crash analysis and a crash analysis method by using MobileCrash web tool. The objective of case studies is to provide guidance for developers to analyze and locate software faults. All cases presented in this chapter are based on results from a MobileCrash web server. Developers can easily fetch the similar data from a MobileCrash web server.
In order to have a clear understanding on case studies, the Symbian OS code segment and call stack are introduced firstly. On Symbian OS, when a process is created, a memory chunk is allocated to hold the process executable's .data section (initialized data) and .bss section (zero filled data). Sufficient space (default 2Mb) is also reserved as user-side stack space for threads that run in that process [Symbian reference guides, 2007].
Figure 15. Symbian OS code segment and Callstack
By default, each thread is allocated 8KB user-side stack space. A guard of 8KB is also allocated. The stack area follows the .data and .bss sections. On ARM processor the stack is descending, so that as items are added to the stack, the stack pointer is decremented. This means that when the stack overflows, the stack pointer points into the guard area and causes a processor exception, with the result that the kernel panics the thread.

44
Return addresses are stored by pushing them on to the stack, so at any point we can trace through the stack by looking at the saved return addresses to see the chain of function calls up to the present function.
The size of the user-side stack space has an indirect effect on the number of threads that a process can have. There are other factors involved, but this is an important one. The limit is a consequence of the fact that a process can have a maximum of 16 chunks. This means that if threads within a process can share a heap (allocated from a single chunk), then it is possible to have a maximum of 128 threads per process (2M/(8K + 8K)). More threads may be possible if we allow only 4K of stack per thread.
Besides the kernel stack attached to each thread, the kernel also maintains stacks that are used during processing of interrupts, exceptions and certain CPU states. Interrupts and exceptions can occur at any time, with the system in any state, and it would be dangerous to allow them to use the current stack which may not even be valid or may overflow and panic the kernel. The kernel stacks are guaranteed to be large enough for all interrupt and exception processing.
Every time a function is called, the return address is automatically saved into the register R14 (Link Register). In addition, the return address is generally pushed onto the call stack, it is always pushed in debug builds but the push operation is sometimes optimized out in release builds. This allows us to trace back through the value of R14 and these saved addresses to see the sequence of function calls. Unfortunately this is quite boring to do because the stack is also used for automatic variables and other data. The developer needs to work out which values on the stack refer to return addresses.
When the developer is debugging ROM-based code, it is relatively easy to identify the pushed return addresses because all code addresses will be in the ROM range: 0xF8000000 to 0xFFEFFFFF for the moving model. However, there is also data in the ROM, which means that an address on the stack that is in the ROM range could point to data instead of code. If developers want to debug applications loaded into RAM, i.e. anything not run from drive Z:, then stack tracing is more difficult because the code can move about and RAM-loaded code is given an address assigned at loading time.
To trace back through a thread’s kernel or user stack, developers firstly need to find the stack pointer value. On ARM, R13 always points to the stack, but there are different R13 registers for each processor mode:
• In thread context:
o R13usr points to the thread’s user stack,

45
o R13svc points to the thread’s kernel stack.
• When handling interrupts, dedicated stacks are used:
o R13Fiq points to the stack used when processing fast interrupts (FIQ).
o R13Irq points to the stack used when processing general purpose interrupts (IRQ).
• To find out which stack to inspect, developers need to know what mode the CPU was in when the fault occurred. The processor mode (Table 3) is identified by the five least-significant bits of the CPSR register.
7.1 Analyze the stack heuristically
One of the easiest ways to analyze the call stack is to assume that every word (four bytes) on the stack which looks like a ROM code address is a saved return address. However this is just a heuristic method because some data words may look like code addresses in ROM and there may be saved return addresses left over from previous function calls. For these reasons, developers have the responsibility to recognize valid addresses.
The MobileCrash system also can trace applications which are loaded into RAM. When crash happened, the crashed module loaded DLLs are also collected. The function call address in the RAM can be located in the loaded DLL address. The Selge decodes those addresses by using a map file (image symbol table built in compiling time).
For example, part of the content of D_ERRORTOOL.LDD.map: _E32Dll 0x00008000 ARM Code 20 d_entry_.o(.emb_text)
DoArmRegisters() 0x00008014 ARM Code 56 D_ERRORTOOL.in(.emb_text)
DoTestHitNullTrap() 0x0000807c ARM Code 8 D_ERRORTOOL.in(.emb_text)
DoPrefetchAbort() 0x00008084 ARM Code 12 D_ERRORTOOL.in(.emb_text)
DoUndefinedInstruction() 0x00008090 ARM Code 24 D_ERRORTOOL.in(.emb_text)
DoCallstackPrefetchAbort() 0x000080a8 ARM Code 40 D_ERRORTOOL.in(.emb_text)
DoDataAlignmentAbort() 0x000080d0 ARM Code 24 D_ERRORTOOL.in(.emb_text)
DoZero() 0x000080e8 ARM Code 8 D_ERRORTOOL.in(.emb_text)
__cpp_initialize__aeabi_ 0x000080f0 ARM Code 52 ucppinit_aeabi.o(.emb_text)
DoStackOverflow(int) 0x00008124 ARM Code 20 D_ERRORTOOL.in(.text)
std::nothrow 0x00008124 ARM Code 0 ucppinit_aeabi.o(.emb_text)

46
On ARM, the stack pointer starts at the higher address end and moves 'down' towards the lower address end. This means that values at the top of the memory dump are more recent. Developers need to look back through this for code addresses. For ROM code this will be words with most significant byte in the range 0xF8 to 0xFF, remembering that they are little-endian.
The heuristic method is quick but produces lots of false positives. Another option is to manually reconstitute the call stack from the memory dump. This is relatively easy for debug builds because GCC uses R11 as a frame pointer (FP) and generates the same prologue/epilogue for every function [Symbian reference guides, 2007]. For release builds, there is no generic solution. It is necessary to check the generated assembler code as there is no standard prologue/epilogue and R11 is not used as frame pointer.
Software normally uses R13 as a Stack Pointer (SP). R13 is used by the PUSH and POP instructions in T variants, and by the SRS and RFE instructions from ARMv6.
The register 14 is the Link Register (LR). This register holds the address of the next instruction after a Branch and Link (BL or BLX) instruction, which is the instruction used to make a subroutine call. It is also used for returning address information on entry to exception modes. At all other times, R14 can be used as a general-purpose register.
The register 15 is the Program Counter (PC). It can be used in most instructions as a pointer to the instruction which is two instructions after the instruction being executed. In ARM state, all ARM instructions are four bytes long (one 32-bit word) and are always aligned on a word boundary. This means that the bottom two bits of the PC are always zero, and therefore the PC contains only 30 non-constant bits.
The flow of function calling functions might result in a panic. The call stack shows history of the current operation. This often gives a pretty good idea of the chain of events leading to a panic. It is essential for tracking down problems and knowing where to put breakpoints. Checking the call stack is also a good way of identifying defects.
To get a useful call stack, two things are always needed. The hex dump of the memory is used by the stack of the thread which panicked. The ROM symbol file for the software flashed onto the device. With this information the MobileCrash Selge tool can decode a crash binary dump file into human readable call stack (similar to the call stack seen in the emulator). The symbol file must match the software in the ROM. If you built the ROM yourself, you already have the symbol file. If it is a release ROM or built by any other developer, you must ask for the symbol file.
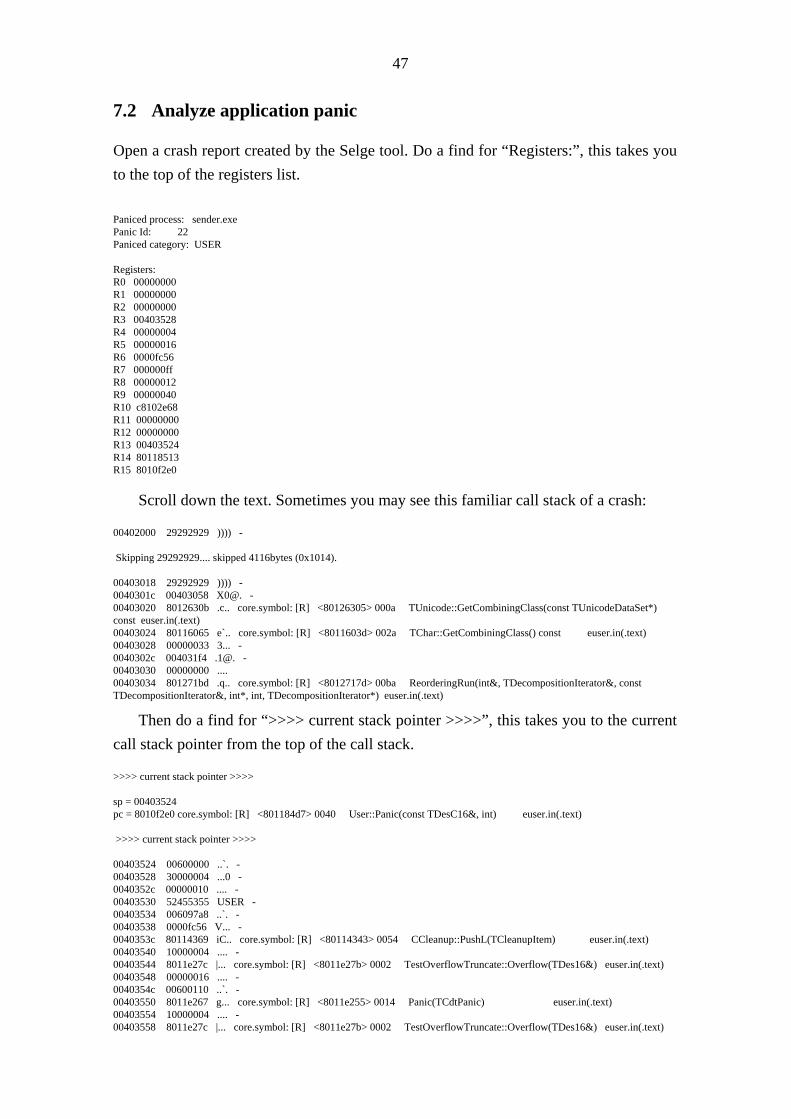
47
7.2 Analyze application panic
Open a crash report created by the Selge tool. Do a find for “Registers:”, this takes you to the top of the registers list.
Paniced process: sender.exe Panic Id: 22 Paniced category: USER Registers: R0 00000000 R1 00000000 R2 00000000 R3 00403528 R4 00000004 R5 00000016 R6 0000fc56 R7 000000ff R8 00000012 R9 00000040 R10 c8102e68 R11 00000000 R12 00000000 R13 00403524 R14 80118513 R15 8010f2e0
Scroll down the text. Sometimes you may see this familiar call stack of a crash:
00402000 29292929 )))) - Skipping 29292929.... skipped 4116bytes (0x1014). 00403018 29292929 )))) - 0040301c 00403058 X0@. - 00403020 8012630b .c.. core.symbol: [R] <80126305> 000a TUnicode::GetCombiningClass(const TUnicodeDataSet*) const euser.in(.text) 00403024 80116065 e`.. core.symbol: [R] <8011603d> 002a TChar::GetCombiningClass() const euser.in(.text) 00403028 00000033 3... - 0040302c 004031f4 .1@. - 00403030 00000000 .... 00403034 801271bd .q.. core.symbol: [R] <8012717d> 00ba ReorderingRun(int&, TDecompositionIterator&, const TDecompositionIterator&, int*, int, TDecompositionIterator*) euser.in(.text)
Then do a find for “>>>> current stack pointer >>>>”, this takes you to the current call stack pointer from the top of the call stack.
>>>> current stack pointer >>>> sp = 00403524 pc = 8010f2e0 core.symbol: [R] <801184d7> 0040 User::Panic(const TDesC16&, int) euser.in(.text) >>>> current stack pointer >>>> 00403524 00600000 ..`. - 00403528 30000004 ...0 - 0040352c 00000010 .... - 00403530 52455355 USER - 00403534 006097a8 ..`. - 00403538 0000fc56 V... - 0040353c 80114369 iC.. core.symbol: [R] <80114343> 0054 CCleanup::PushL(TCleanupItem) euser.in(.text) 00403540 10000004 .... - 00403544 8011e27c |... core.symbol: [R] <8011e27b> 0002 TestOverflowTruncate::Overflow(TDes16&) euser.in(.text) 00403548 00000016 .... - 0040354c 00600110 ..`. - 00403550 8011e267 g... core.symbol: [R] <8011e255> 0014 Panic(TCdtPanic) euser.in(.text) 00403554 10000004 .... - 00403558 8011e27c |... core.symbol: [R] <8011e27b> 0002 TestOverflowTruncate::Overflow(TDes16&) euser.in(.text)

48
0040355c 00600374 t.`. - 00403560 8011fd0b .... core.symbol: [R] <8011fd03> 000a Des8PanicPosOutOfRange() euser.in(.text) 00403564 00600374 t.`. - 00403568 7b090e09 ...{ sender.exe.map: CSender::DoSendMessageL(const TDesC16&) 0040356c 00600210 ..`. -
Look at all functions that follow in this case, after cutting out the lines that looked garbled. I got:
0040353c 80114369 iC.. core.symbol: [R] <80114343> 0054 CCleanup::PushL(TCleanupItem) euser.in(.text) 00403544 8011e27c |... core.symbol: [R] <8011e27b> 0002 TestOverflowTruncate::Overflow(TDes16&) euser.in(.text) 00403550 8011e267 g... core.symbol: [R] <8011e255> 0014 Panic(TCdtPanic) euser.in(.text) 00403558 8011e27c |... core.symbol: [R] <8011e27b> 0002 TestOverflowTruncate::Overflow(TDes16&) euser.in(.text) 00403560 8011fd0b .... core.symbol: [R] <8011fd03> 000a Des8PanicPosOutOfRange() euser.in(.text) 00403568 7b090e09 ...{ sender.exe.map: CSender::DoSendMessageL(const TDesC16&)
This is enough to tell us to check the code in the function CSender::DoSendMessageL (), and to put trace in the function to see what has happened there. Related to the Panic ID of this crash, USER 22, we get the information from [Symbian reference guides, 2007], “This panic is raised when the position value passed to an 8 bit variant descriptor member function is out of bounds. It may be raised by the Left(), Right(), Mid(), Insert(), Delete() and Replace() descriptor member functions.”. We need to focus on checking the code in DoSendMessageL() which can cause accessing descriptor out of bounds error.
The System panic reference is very useful when the crash type is Panic rather than exception. Panics are characterized by two pieces of information: category, a sixteen-character string which defines the context of a panic; the panic number, a number that, in the context of a category, identifies the specific cause of the panic.
Some types of errors are due to bad program code, such as passing an illegal parameter value. When this type of error is discovered, the thread associated with the erroneous program should be terminated. In Symbian OS, this is referred as a panic. The only proper response to a panic is to fix the program code.
Typically, a panic is not discovered by the program that made the error, but by the library code which operated on behalf of that program. If the library code is in a DLL running in the same thread as the program, it calls User::Panic() to panic the thread. If the library code is in a server executing on behalf of another program, the server panics the client thread by calling RMessagePtr2::Panic(), where RMessagePtr2 is the handle to the message sent by the client to the server.

49
7.3 Analyze application crash (exception)
Gallery application crashed after we have done some operations. The panic ID is zero and there is no panic category. This is mostly an exception.
Paniced Process: Gallery Panic Id: 0 Panic Category:
Let us check the exception values:
Exception registers (Data abort) Fault PC 801ccf44 core.symbol [R] <801ccf3d> 0022 User::RequestComplete(TRequestStatus*&, int) _rapido_euser.in(.text) Exc Code 00000001 CPSR 20000030 FAR 00000004 FSR 00000005 R13Svc c9282000 R14Svc 8006a160 SPSRSvc 20000010
This is a normal data abort (Exc Code) exception (CPSR). The exception is caused by Section translation fault (unmapped virtual address) (FSR) and the fault program counter is User::RequestComplete(). Let’s check the call stack for more information.
core.symbol[R] <801ccf3d> 0022 User::RequestComplete(TRequestStatus*&, int) _rapido_euser.in(.text) core.symbol[R] <8275f75c> 0820 CTNEProcessorImpl::MNotifyThumbnailReady(int) TNEEngine.in(.text) core.symbol CCoeScheduler::WaitForAnyRequest() cone.in(.text) core.symbol[R] <801c4a8b> 00f4 CActiveScheduler::Start(CActiveScheduler::TLoop**) _rapido_euser.in(.text) core.symbol[R] <80570b67> 0052 CCoeEnv::Execute() cone.in(.text) core.symbol[R] <80c218fd> 0198 EikStart::RunApplication(const TApaApplicationFactory&, CApaCommandLine*) eikcore.in(.text)
It seems we could add more traces to the function CTNEProcessorImpl::MNotifyThumbnailReady(), so we might find the bug. The system event log could also help us on reproducing the error. Here is part of the events log of this crash:
OK key Down arrow key Right selection key OK key Gallery[101f8599]0007::Gallery OK key
We need to read the log from the bottom to up, since the latest event is on the top of the events list. After the Gallery application was started by pressing OK key, the first item was selected by pressing OK key and followed by right selection key which selected the back button. Then the application was navigated by down key to “Tracks” item, and started it by OK key. These operations resulted in an application crash and we could check the traces to get idea on finding what the exact cause of the crash is. (Figure 16)

50
Gallery[101f8599]0007::Gallery OK key Right selection key
Down arrow key OK key Crashed here Figure 16. System event log example
Registers: R0 00637a18 R1 00000000 R2 ffffffff R3 00000000 R4 00637478 R5 00000002 R6 80000001 R7 00000280 R8 00000074 R9 008dda40 R10 000001e0 R11 00000000 R12 00974ffc R13 00406b78 R14 8275ff04 core.symbol [R] <8275f75c> 0820 CTNEProcessorImpl::MNotifyThumbnailReady(int) TNEEngine.in(.text) R15 801ccf44 core.symbol [R] <801ccf3d> 0022 User::RequestComplete(TRequestStatus*&, int) _rapido_euser.in(.text)
7.4 Analyze application crashes group by call stack
The MobileCrash system provides a useful functionality, grouping crash logs by call stacks. This helps on analyzing crashes and doing bug report. When call stack symbols of crashed applications are similar to each other, we could assume these crashes were caused from a similar reason. The MobileCrash system assigns a unique defect name to those crashes with a similar call stack, so crashes can be grouped into different

51
categories. We can prioritize different defects by the count of crashes. In practice, we start checking crashes from the one which has the largest crash count number. Techniques presented in the previous sections are used to do analyzing crash causes and help to locate bug location.
Here we got the top ten defects list of the crashed sender.exe application from the MobileCrash Web UI.
Crashed module Defect Users having
Crash count
sender.exe Erkki 70 8 129 sender.exe Aslak 25 16 70 sender.exe Eine 2 12 60 sender.exe Virve 32 3 58 sender.exe Lauha 207 5 31 sender.exe Irene 16 3 14 sender.exe Orvo 39 6 13 sender.exe Oiva 41 1 12 sender.exe Outi 34 2 12 sender.exe Raija 45 10 12
Table 5. Top ten crashed application’s defects
The defect Erkki 70 is a USER 22 type panic. It is panicked from eight bits variant descriptor member function out of bounds. And the panicked code start from CSender:: DoSendMessageL().
Panic Id: 22 Panic Category: USER sp = 0040352 cpc = 801427e4 [R] <8014278c> 0060 User::Panic(const TDesC16&, int) _teflon_euser.in(.text) core.symbol[R] <8014ecf0> 0034 Panic(TCdtPanic) _teflon_euser.in(.text) sender.exe CSender::DoSendMessageL(const TDesC16&)
The defect Aslak 25 is a USER 130 type panic. “This panic is raised when an index value passed to a member function of a RArray or a RPointerArray identifying an array element, is out of bounds.” [Symbian reference guides, 2007]. Then we need carefully check those arrays used in the code.
Panic Id: 130 Panic Category: USER sp = 004034a0 pc = 8012444b [R] <8012440f> 0040 User::Panic(const TDesC16&, int) euser.in(.text) core.symbol[R] <8012a19b> 0002 TestOverflowTruncate::Overflow(TDes16&) euser.in(.text) core.symbol[R] <8012a175> 0014 Panic(TCdtPanic) euser.in(.text) core.symbol[R] <8012a19b> 0002 TestOverflowTruncate::Overflow(TDes16&) euser.in(.text) core.symbol[R] <8012b275> 000a PanicBadArrayIndex() euser.in(.text) core.symbol[R] <8010232c> 0100 TQwertyKeyboard::ReadMessageReady(void*) _keyboard.in(.text) core.symbol[R] <8012e57d> 0082 RHeap::Alloc(int) euser.in(.text) core.symbol[R] <8012e401> 0014 RAllocator::ReAllocL(void*, int, int) euser.in(.text) core.symbol[R] <80123189> 0018 User::ReAllocL(void*, int, int) euser.in(.text) core.symbol[R] <8011f88b> 0036 CBufFlat::SetReserveL(int) euser.in(.text) core.symbol[R] <8011f95b> 0068 CBufFlat::DoInsertL(int, const void*, int) euser.in(.text) core.symbol[R] <8011f903> 002e CBufFlat::Ptr(int)

52
The defect Eine 2 and Virve 32 are similar to the defect Erkki 70, but they contain a more detailed call stack.
Panic Id: 22 Panic Category: USER sp = 00403524pc = 80124efb [R] <80124ebf> 0040 User::Panic(const TDesC16&, int) euser.in(.text) core.symbol[R] <80120d43> 0054 CCleanup::PushL(TCleanupItem) euser.in(.text) core.symbol[R] <8012ac4b> 0002 TestOverflowTruncate::Overflow(TDes16&) euser.in(.text) core.symbol[R] <8012ac25> 0014 Panic(TCdtPanic) euser.in(.text) core.symbol[R] <8012ac4b> 0002 TestOverflowTruncate::Overflow(TDes16&) euser.in(.text) core.symbol[R] <8012c6d3> 000a Des8PanicPosOutOfRange() euser.in(.text) sender.exe CSender::DoSendMessageL(const TDesC16&)
Virve 32
Panic Id: 22 Panic Category: USER sp = 00403514 pc = 80163329 [R] <801632db> 0052 User::Panic(const TDesC16&, int) euser.in(.text) core.symbol[R] <8017171d> 0024 RHeap::GetAddress(const void*) const euser.in(.text) core.symbol[R] <80171a85> 0016 RHeap::AllocLen(const void*) const euser.in(.text) core.symbol[R] <8016b2a1> 0016 Panic(TCdtPanic) euser.in(.text) core.symbol[R] <8016d7d7> 000a Des8PanicPosOutOfRange() euser.in(.text) sender.exe CSender::DoSendMessageL(const TDesC16&)
The defect Lauha 207 is a Data abort exception. The type is “Page translation fault (unmapped virtual address)” from Table 3. When the CSender::ParseFile() was doing some operations, the exception happened.
Exception registers (Data abort) Fault PC 80014120 014c __ArmVectorSwi _teflon_ekern.in(.emb_text) Exc Code 00000001 CPSR 20000030 FAR 006136e2 FSR 00000007 R13Svc c9164000 R14Svc 80014160 core.symbol [R] <80014120> 014c __ArmVectorSwi _teflon_ekern.in(.emb_text)SPSRSvc 00000010 sp = 004034dc pc = 80014120__ArmVectorSwi _teflon_ekern.in(.emb_text) core.symbol[R] <80014120> 014c __ArmVectorSwi _teflon_ekern.in(.emb_text) sender.exe CSender::ParseFile(TDes8&, unsigned short&, unsigned short&, unsigned short&, unsigned short&, unsigned short&) sender.exe CSender::DoSendMessageL(const TDesC16&)
The defect Irene 16 is similar to the defect Aslak 25. And this defect indicates that the panic has happened in CSender::MapDllList() when it was accessing an array by using operator [].
Panic Id: 130 Panic Category: USER core.symbol[R] <8012ac4b> 0002 TestOverflowTruncate::Overflow(TDes16&) euser.in(.text) core.symbol[R] <8012ac25> 0014 Panic(TCdtPanic) euser.in(.text) core.symbol[R] <8012ac4b> 0002 TestOverflowTruncate::Overflow(TDes16&) euser.in(.text) core.symbol[R] <8012bd25> 000a PanicBadArrayIndex() euser.in(.text) sender.exe RArray::operator [](int) sender.exe CSender::MapDllList(TDes8&, unsigned short, unsigned short, int, unsigned short) core.symbol[R] <80039170> 0194 DThread::Exit() _teflon_ekern.in(.text) sender.exe CSender::ReduceCallStack(TDes8&, TDes8&, unsigned short, unsigned short, unsigned short) sender.exe CSender::DoSendMessageL(const TDesC16&)
7.5 Summary
To analyze a binary crash log is a complicated process. Developers have to collect crash data, decode crash logs by using corresponding symbolic files and check through

53
human readable crash reports carefully for bug location. The MobileCrash system integrates crash data collecting, transferring, decoding and friendly user interfaces for crash data representing. The automation support makes crash analysis process easier and more straightforward. With the help of the MobileCrash system, developers can focus on crash analysis and bug locating work.
The heuristic call stack analysis method provides the easiest but not the simplest way for crash analysis. However, combined with other techniques and information, such as system event log, the heuristic method will be very efficient when the call stack or system event log provides a clue to locate the bug or reproduce the bug. To find out the cause of a crash, it is necessary to find what C++ function, and ideally what source code line, to which address corresponds. Once the names of the problem executable and function are found there are a few ways of figuring out the source line. The easiest way is to add traces to suspicious codes in the function or just do interactively debug by using a runtime debugger if it is available. One note for developers is to write function as short as possible, so it is easier to find exact bug location by checking through the call stack.
Group crashes by call stack is an advance comparing to the heuristic method. It is possible to reduce the human efforts when we have a group of categorized crashes with priority (crash count). Developers can focus on analyzing those crashes with the most crashes count number. This method significantly increases the error correction speed and provides a way to manage errors and corresponding crash reports. From the error management point of view, an error can be easily reported and related to categorized crash reports. So developers can use the MobileCrash system to analyze an error and fix it. Afterwards, a fixed error can help to analyze upcoming crash reports.

54
8. Conclusions
The Symbian operation system based smartphones are the most popular ones in the world. Since smartphones are significantly changing the way people living with and accessing the information world, the huge amount of smartphone users want to have a ubiquitous information processor and a steady communicator as well. The software development based on smartphone operation system is becoming more and more popular. There are many ways to improve the software quality by debugging, making system tracing and even do run time debugging on the emulator before the software is delivered to the end user. However, it is hard to get error reports from end users because they do not have enough information technology knowledge to collect and record information needed by developers.
In the Symbian operation system, the MobileCrash system is used in the software R&D process to collect, deliver, and help on software failure analysis. It can be configured as a fully automatic software failures report system. The software failures are directly delivered to the MobileCrash crash log server and decoded into human readable crash logs. Developers and managers can find what they are interested via the web based MobileCrash services. And the MobileCrash system also can be configured as a R&D crash collecting tool which can be used by software developers for analyzing software failures.
Although the automated support for software failure reports has improved the software failure analysis process, the question about what happened before the software failure is still unclear. The MobileCrash system event log is a supplementary of the MobileCrash system. It automatically provides the input for analyzing with the extended context of crashes. Such information may speed up the analysis, error fixing, revealing unexpected behaviors of some components and the whole system, and finally shortening the development phase of a product. The system will allow to study so-called “hard to reproduce” cases, since everything what happened before the crash will be recorded (of course, the set of events should be sufficient) and sent to the central database. Developers can get the precondition of a crash and might find a way to reproduce the error and subsequently fix it.
With the help of the MobileCrash system, crash logs are collected and stored in a central database. Crash logs could come from Symbian OS panics or exceptions. The collected data provides valuable information to locate suspicious code in the panicked software component. The data together with a brief explanation of what operations have

55
been carried out before the failure help developers to reproduce the error and debug the suspicious code. From problem solving point of view, the benefit of applying MobileCrash effectively limits the size of code developers would need to investigate to identify the bug. However, MobileCrash is only a crash analysis system, not a debugging system. It cannot be expected to always precisely point out the problematic code. Developers should combine the use of MobileCrash with other debugging methods, e.g. software tracing, to solve software failures in Symbian OS.
In practice, the postmortem software failure analysis in Symbian OS is principally based on the failure’s reason and call stack analysis. Application panics and unhandled exceptions will result in halting the current application, usually with a “Program closed” dialog. If the panic and exception happened in the system privilege mode, it will result in a system reset. The panic and exception reason can give hints on analyzing a specific software failure. Specific crashed software needs to be further analyzed by the call stack. From a decoded symbolic call stack, developers will find clues about the possible place where the code caused the fault. Logged system events also provide more information and better understanding about the crash. One of the most important features of the MobileCrash system is to analyze the crash or panic by statistical data.
In the future, the further development of MobileCrash can focus on increasing the information of the crash log which can help developers to better understand the software failure cause and precondition. There is a lot of information that can be logged before crash happening. Developers can use the information to rebuild a software running picture ahead of crashes and try to reproduce the error. Kernel information can help to check system behavior, includes memory status, file I/O, resets, process or thread creation or termination, library loaded or unloaded and etc. Hardware adaptation software includes critical situations, temperature raising, low battery level. Telephony software includes incoming/outgoing calls and their statuses, network field strength and network type, handovers and 2G/3G network changes. Messaging software includes incoming/outgoing messages and phases of creation/sending/receiving/displaying. Multimedia software includes multimedia resources and hardware, status changes and progresses of playing media formats. ETB is Embed Trace Buffer resident in ARM CPU [ARM, 2008]. It stores a real-time trace stream corresponding to the operation of the processor. Developers can use this tracing buffer to understand the behavior of the processor. The crash log from signal processing unit (cell phone operation system) can be collected and delivered by MobileCrash system as well. Such crash log can help to analyze the software failure resulted by the consequence of multi processor and OS collaboration.

56
Since extra information significantly increases the size of a crash log, a substitution of the current SMS Sender must be applied to the MobileCrash system. A MobileCrash crash log without extra information is only about a few hundred bytes, and it can be sent by four to five SMS messages. The SMS Sender will not be suitable for transmitting the crash log larger than one kilobyte, since there might be over ten messages only for one crash log. An IP protocol based Sender and crash log gateway are proposed in Figure 10. With the internet access library, the Sender could connect to the gateway by a secured connection over the internet via GPRS, 3G or WLAN network, and send even one hundred kilo bytes crash log in few seconds. More crash data can be collected and transmitted for doing analysis.

57
References [Apple technical note, 2008] Technical note number TN2123, CrashReporter,
http://developer.apple.com/technotes/tn2004/tn2123.html (checked on February, 2008)
[ARM, 2008] ARM, ARM Technical Documentation, Available as http://www.arm.com/documentation/
[Design by contract, 2008] design by contract on Wikipedia, http://en.wikipedia.org/wiki/Design_by_contract (Checked on February, 2008)
[Heander and Malmborn, 2007] Johan Heander and Magnus Malmborn, Post Mortem Crash Analysis, Department of Computer Science Lund University, January 2007
[Jones and Harrold, 2005] James A. Jones, Mary Jean Harrold, Testing II: Empirical evaluation of the tarantula automatic fault-localization technique, Proceedings of the 20th IEEE/ACM international Conference on Automated software engineering ASE '05, November 2005
[Liu and Han, 2006] Chao Liu, Jiawei Han, Mining failures and bugs: Failure proximity: a fault localization-based approach, Proceedings of the 14th ACM SIGSOFT international symposium on Foundations of software engineering SIGSOFT '06/FSE-14, November 2006
[Manevich et al., 2004] Roman Manevich, Manu Sridharan, Stephen Adams, Manuvir Das, Zhe Yang, PSE: explaining program failures via postmortem static analysis, Proceedings of the 12th ACM SIGSOFT twelfth international symposium on Foundations of software engineering SIGSOFT '04/FSE-12, October 2004
[Murphy, 2004] Brendan Murphy, Error recovery: Automating software failure reporting, Queue: volume 2 issue 8, ACM Press, November 2004
[Patten, 2002] Norman Patten, Linux Crash HOWTO, http://www.linux.org/docs/ldp/howto/Linux-Crash-HOWTO/index.html, 2002
[Podgurski et al., 2003] Andy Podgurski, David Leon, Patrick Francis, Wes Masri, Melinda Minch, Jiayang Sun, Bin Wang, Automated support for classifying software failure reports, Proceedings of the 25th International Conference on Software Engineering ICSE '03, May 2003
[Sales, 2005] Jane Sales, Symbian OS Internals Real-Time Kernel Programming, John Wiley & Sons Ltd, 2005.
[Smartphone, 2008] Smartphone from online Wikipedia, http://en.wikipedia.org/wiki/Smart_phone (checked on February, 2008)
[Symbian OS, 2008] Symbian OS from online Wikipedia, http://en.wikipedia.org/wiki/Symbian_OS (checked on February, 2008)

58
[Symbian press releases, 2007] 20.4m Symbian smartphones shipped in Q3 2007, http://www.symbian.com/news/pr/2007/pr20079552.html (checked on November 20th, 2007)
[Symbian reference guides, 2007] Online resources, reference guides and documentation for Symbian OS v9.3, Symbian Software Ltd. June 2007
[Wang, 2007] Kui Wang, Post-mortem Debug and Software Failure Analysis on Symbian OS, University of Tampere, 2007
[Wood, 2005] David Wood, Symbian For Software Leaders Principles Of Successful Smartphone Development Projects, John Wiley & Sons, ltd, 2005
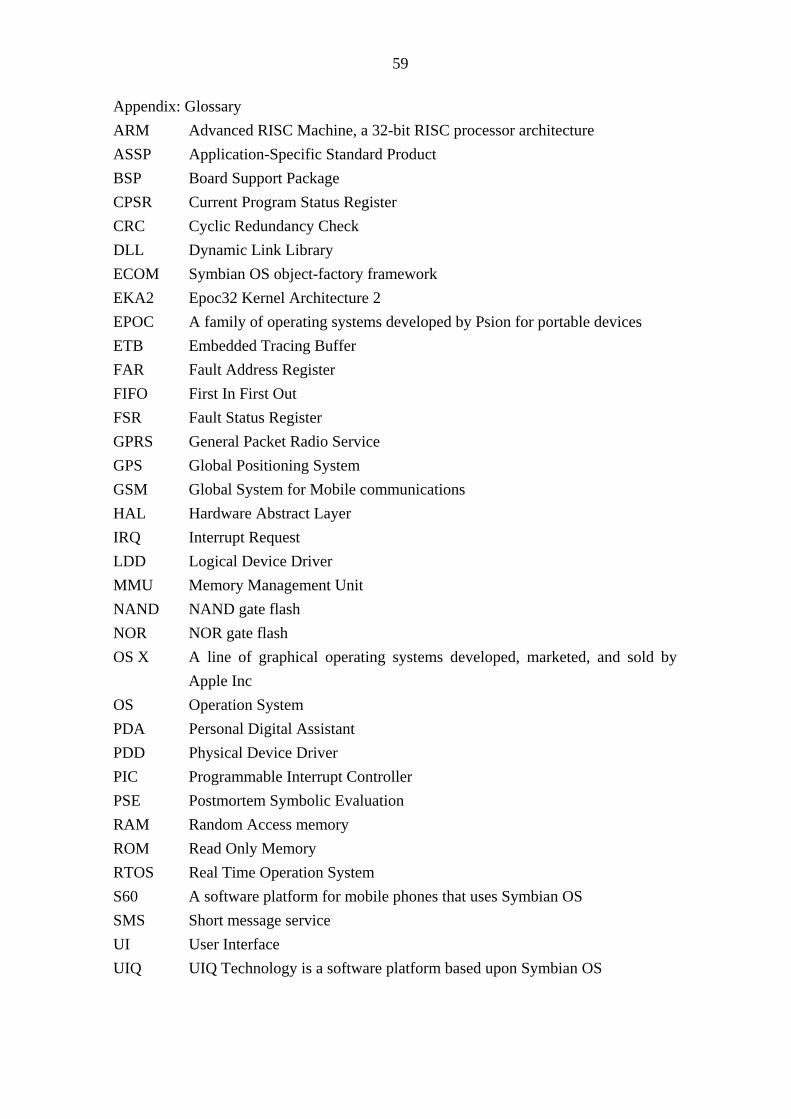
59
Appendix: Glossary ARM Advanced RISC Machine, a 32-bit RISC processor architecture ASSP Application-Specific Standard Product BSP Board Support Package CPSR Current Program Status Register CRC Cyclic Redundancy Check DLL Dynamic Link Library ECOM Symbian OS object-factory framework EKA2 Epoc32 Kernel Architecture 2 EPOC A family of operating systems developed by Psion for portable devices ETB Embedded Tracing Buffer FAR Fault Address Register FIFO First In First Out FSR Fault Status Register GPRS General Packet Radio Service GPS Global Positioning System GSM Global System for Mobile communications HAL Hardware Abstract Layer IRQ Interrupt Request LDD Logical Device Driver MMU Memory Management Unit NAND NAND gate flash NOR NOR gate flash OS X A line of graphical operating systems developed, marketed, and sold by
Apple Inc OS Operation System PDA Personal Digital Assistant PDD Physical Device Driver PIC Programmable Interrupt Controller PSE Postmortem Symbolic Evaluation RAM Random Access memory ROM Read Only Memory RTOS Real Time Operation System S60 A software platform for mobile phones that uses Symbian OS SMS Short message service UI User Interface UIQ UIQ Technology is a software platform based upon Symbian OS