sydney (kingsford smith) airport - airservices australia · sydney airport n504 – 3 month anei 1...
TRANSCRIPT
• • a1rserv1ces
Sydney Airport
N504 Australian Noise Exposure Index
1 July to 30 September 2017
February 2018
Sydney Airport N504 – 3 Month ANEI 1 Jul– 30 Sep 2017
DISCLAIMER
The aircraft noise contours on this chart have been calculated using the best currently available modelling process. The data input to that process are derived from external sources, and Airservices cannot warrant their accuracy. Airservices accepts no liabilities for any reliance placed on any data on this chart by any third party. Airservices accepts no responsibility for any interpretation of this data by third parties.
CONDITIONS OF SUPPLY OF REPORT N504, Dated February 2018
The information contained in this report is the intellectual property of, or licensed to, Airservices Australia and is provided solely for non-commercial use within your organisation. The information may be printed, reproduced and transmitted within your organisation provided that any reproduction is unaltered, shows the date of first publication, and attributes Airservices Australia as its source. The information may not be reproduced or exploited in any other manner whatsoever without the express written permission of Airservices Australia, Environment Branch.
Airservices Australia - All rights reserved
Airservices Australia Head Office 25 Constitution Avenue
Canberra City ACT 2601 Australia
GPO Box 367 Canberra ACT 2601
Phone 1300 301 120 Fax 02 6268 5683
Environmental Services Page i February 2018
Report N504
Sydney Airport N504 – 3 Month ANEI 1 Jul– 30 Sep 2017
Contents 1. Introduction ................................................................................................................................. 1
1.1 Background......................................................................................................................... 1
1.2 Airport Layout...................................................................................................................... 1
2. The Integrated Noise Model (INM)............................................................................................. 2 2.1 Development of INM Model ................................................................................................ 2
3. Methodology Used in the Development of the ANEI ............................................................... 3 3.1 Introduction ......................................................................................................................... 3
3.2 Collection and verification of the required NFPMS data ..................................................... 3
3.3 Preparation of INM input file ............................................................................................... 3
3.4 Running of the Model.......................................................................................................... 6
3.5 Preparation and verification of the model output ................................................................ 6
4. Comparison of the 2017 ANEI (N504) with the 2016 ANEI (N499) .......................................... 6 4.1 Comparison of Movement Numbers................................................................................... 6
4.2 Comparison of Runway Use ............................................................................................... 8
4.3 Comparison of Population Counts .................................................................................... 10
5. Number of Aircraft Noise Events Above 70dB(A) Noise Map............................................... 11 5.1 Introduction ....................................................................................................................... 11
5.2 Methodology used in the Development of the N70 Aircraft Noise Map ............................ 11
5.3 Analysis of the N70 Aircraft Noise Map ............................................................................ 11
Attachment A ....................................................................................................................................... 12 ANEI N504 Average Daily Aircraft Movements by Runway ........................................................ 12
Attachment B ....................................................................................................................................... 19 ANEI N504 Estimated Population within each ANEI Contour by Suburb.................................... 19
Attachment C ....................................................................................................................................... 25 ANEI N504 Contours with INM Terrain Contours ....................................................................... 25
Attachment D ....................................................................................................................................... 27 ANEI N504 Contours................................................................................................................... 27
Attachment E ....................................................................................................................................... 29 ANEI N499 Contours................................................................................................................... 29
Attachment F ....................................................................................................................................... 31 N504 N70 Chart .......................................................................................................................... 31
Environmental Services Page ii February 2018
Report N504
Sydney Airport N504 – 3 Month ANEI 1 Jul– 30 Sep 2017
List of Tables Table 1.1 Sydney Airport Runway Data ........................................................................... 1 Table 1.2 Sydney Airport Meteorological Data................................................................. 1 Table 3.1 NFPMS Aircraft Movements............................................................................. 3 Table 3.3 Aircraft Types Used by INM for ANEI N504 ..................................................... 4 Table 3.4 Comparison of Average Daily Movements ....................................................... 6 Table 4.1 Comparison of Average Daily Runway Movement ........................................... 7 Table 4.2 Difference of Average Daily Runway Movement .............................................. 7 Table 4.3 Comparison of Average Daily Long Haul Departures from Runway 34L .......... 7 Table 4.4 Runway Use Comparison ................................................................................ 8 Table 4.5 Runway End Impact Comparison..................................................................... 9 Table A1 Average Daily Movements by Runway.............................................................. 13 Table B1 Estimated Population within each ANEI Contour by Suburb ............................. 20
List of Figures Figure 4.1a Runway Use Comparison – Arrivals ............................................................ 8 Figure 4.1b Runway Use Comparison - Departures ........................................................ 9
Environmental Services Page iii February 2018
Report N504
Sydney Airport N504 – 3 Month ANEI 1 Jul– 30 Sep 2017
Sydney Airport N504 Australian Noise Exposure Index 1 July 2017 to 30 September 2017
1. Introduction
1.1 Background In accordance with recommendation 21 of the Proponent’s Statement for the Long Term Operating Plan (LTOP) at Sydney Airport and under Section 7.1 of the Ministerial Direction N94/97 (F2009B00158) – Direction concerning the Sydney Airport Long Term Operating Plan, Airservices has prepared an Australian Noise Exposure Index (ANEI) for the period 1 July 2017 to 30 September 2017 inclusive (Reference Number N504). Moreover, the ANEI contour reports were previously prepared by Airservices for the Sydney Noise Insulation Programmes (https://infrastructure.gov.au/aviation/environmental/insulation/index.aspx). The Sydney initiative commenced in 1994 and was completed in 2000 with all eligible residential properties having had the opportunity to be insulated.
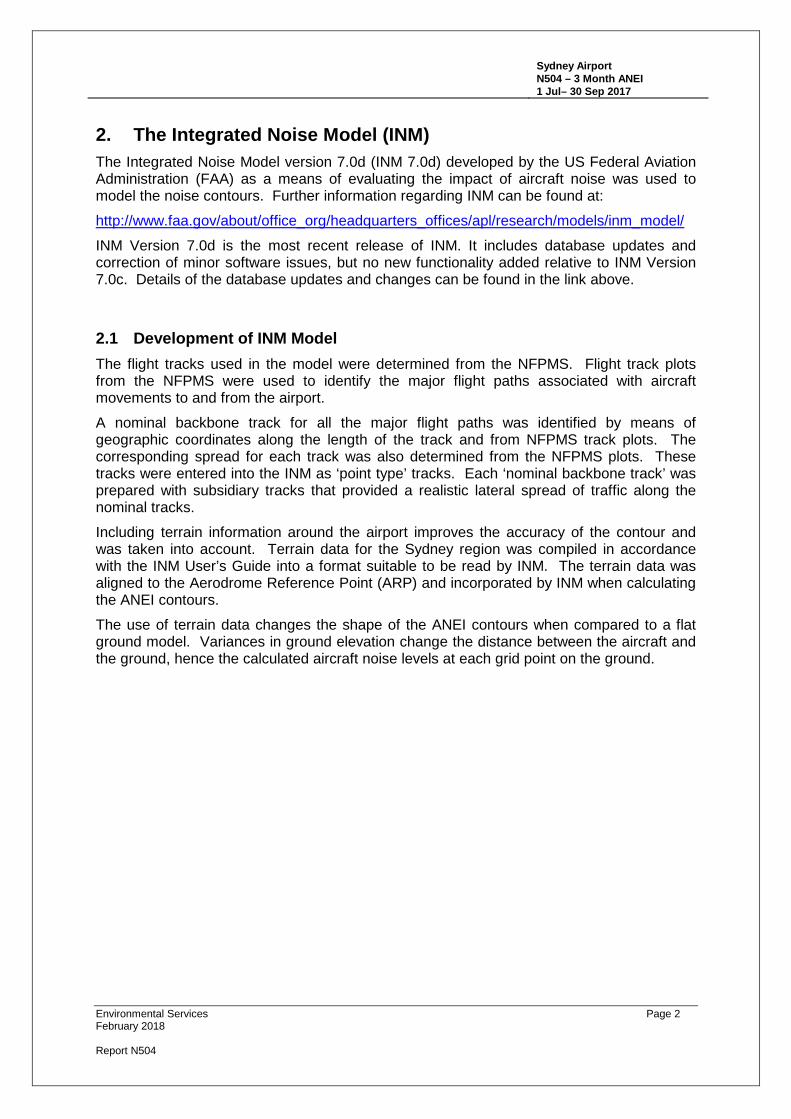
1.2 Airport Layout Sydney Airport has three runways. Runway 07/25 (2529m long and 45m wide), Runway 16R/34L (3962m long and 45m wide) and Runway 16L/34R (2438m long and 45m wide). The runway end coordinates and elevations, Aerodrome Reference Point coordinates, elevation data and displaced threshold information for Sydney Airport were obtained from airport data held by Airservices and are shown in Table 1.1.
Table 1.1 Sydney Airport Runway Data Location Latitude
(WGS84) Longitude (WGS84)
Elevation AHD (m)
Displaced Landing
Threshold (m) Aerodrome Reference Point 33 56 45.6S 151 10 37.6E 6.4 Runway End 07 33 56 37.5S 151 09 49.1E 5.3 0m Runway End 25 33 56 15.1S 151 11 23.8E 6.0 340m Runway End 16R 33 55 45.7S 151 10 17.8E 2.1 85m Runway End 34L 33 57 51.4S 151 10 50.4E 4.1 0m Runway End 16L 33 56 58.6S 151 11 17.9E 4.5 230m Runway End 34R 33 58 19.0S 151 11 38.1E 3.1 38m Helipad 33 56 20.4S 151 11 27.2E 6.0
The airport average temperature and humidity were obtained from Bureau of Meteorology (BOM) data. The temperature and humidity shown in Table 1.2 are taken from the BOM data over the study period.
Table 1.2 Sydney Airport Meteorological Data
Airport Average Temperature 15.3°C Airport Average Humidity 45.5%
Environmental Services Page 1 February 2018
Report N504
Sydney Airport N504 – 3 Month ANEI 1 Jul– 30 Sep 2017
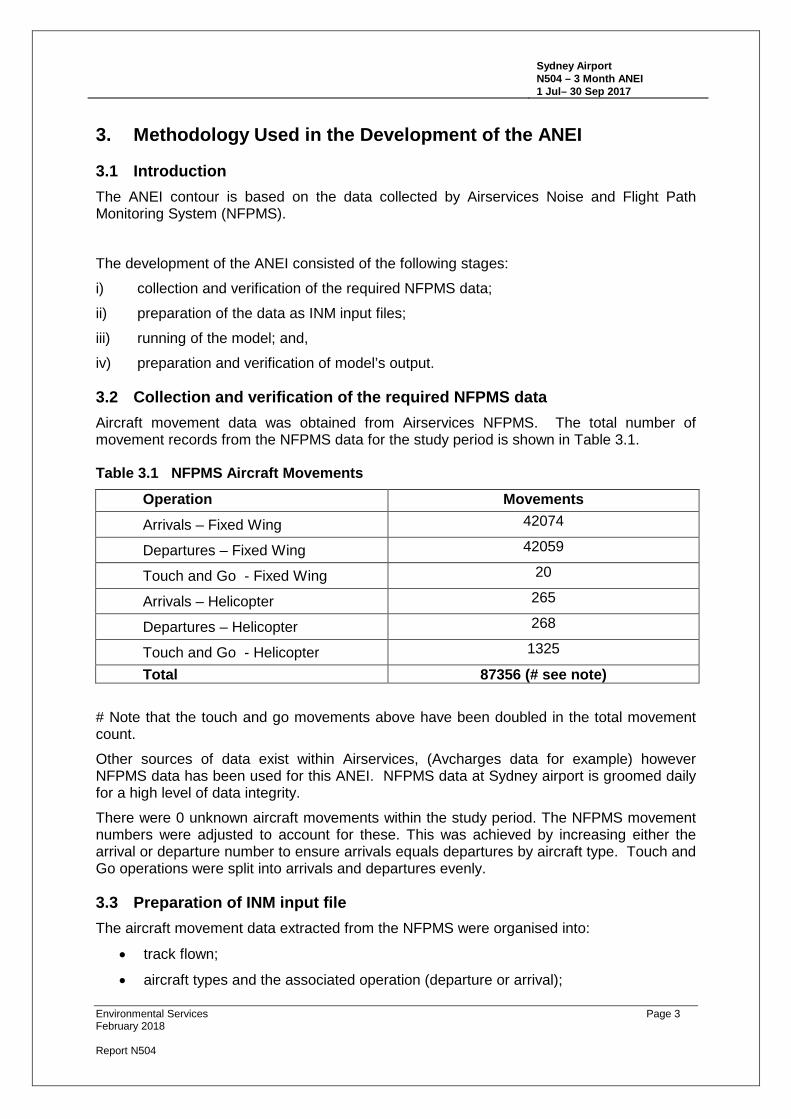
2. The Integrated Noise Model (INM)The Integrated Noise Model version 7.0d (INM 7.0d) developed by the US Federal Aviation Administration (FAA) as a means of evaluating the impact of aircraft noise was used to model the noise contours. Further information regarding INM can be found at: http://www.faa.gov/about/office_org/headquarters_offices/apl/research/models/inm_model/ INM Version 7.0d is the most recent release of INM. It includes database updates and correction of minor software issues, but no new functionality added relative to INM Version 7.0c. Details of the database updates and changes can be found in the link above.
2.1 Development of INM Model The flight tracks used in the model were determined from the NFPMS. Flight track plots from the NFPMS were used to identify the major flight paths associated with aircraft movements to and from the airport. A nominal backbone track for all the major flight paths was identified by means of geographic coordinates along the length of the track and from NFPMS track plots. The corresponding spread for each track was also determined from the NFPMS plots. These tracks were entered into the INM as ‘point type’ tracks. Each ‘nominal backbone track’ was prepared with subsidiary tracks that provided a realistic lateral spread of traffic along the nominal tracks. Including terrain information around the airport improves the accuracy of the contour and was taken into account. Terrain data for the Sydney region was compiled in accordance with the INM User’s Guide into a format suitable to be read by INM. The terrain data was aligned to the Aerodrome Reference Point (ARP) and incorporated by INM when calculating the ANEI contours. The use of terrain data changes the shape of the ANEI contours when compared to a flat ground model. Variances in ground elevation change the distance between the aircraft and the ground, hence the calculated aircraft noise levels at each grid point on the ground.
Environmental Services Page 2 February 2018
Report N504
Sydney Airport N504 – 3 Month ANEI 1 Jul– 30 Sep 2017
3. Methodology Used in the Development of the ANEI
3.1 Introduction The ANEI contour is based on the data collected by Airservices Noise and Flight Path Monitoring System (NFPMS).
The development of the ANEI consisted of the following stages: i) collection and verification of the required NFPMS data; ii) preparation of the data as INM input files; iii) running of the model; and, iv) preparation and verification of model’s output.
3.2 Collection and verification of the required NFPMS data Aircraft movement data was obtained from Airservices NFPMS. The total number of movement records from the NFPMS data for the study period is shown in Table 3.1.
Table 3.1 NFPMS Aircraft Movements Operation Movements Arrivals – Fixed Wing 42074
Departures – Fixed Wing 42059
Touch and Go - Fixed Wing 20
Arrivals – Helicopter 265
Departures – Helicopter 268
Touch and Go - Helicopter 1325
Total 87356 (# see note)
# Note that the touch and go movements above have been doubled in the total movement count. Other sources of data exist within Airservices, (Avcharges data for example) however NFPMS data has been used for this ANEI. NFPMS data at Sydney airport is groomed daily for a high level of data integrity. There were 0 unknown aircraft movements within the study period. The NFPMS movement numbers were adjusted to account for these. This was achieved by increasing either the arrival or departure number to ensure arrivals equals departures by aircraft type. Touch and Go operations were split into arrivals and departures evenly.
3.3 Preparation of INM input file The aircraft movement data extracted from the NFPMS were organised into:
• track flown;
• aircraft types and the associated operation (departure or arrival);
Environmental Services Page 3 February 2018
Report N504
Sydney Airport N504 – 3 Month ANEI 1 Jul– 30 Sep 2017
• the runway used; and,
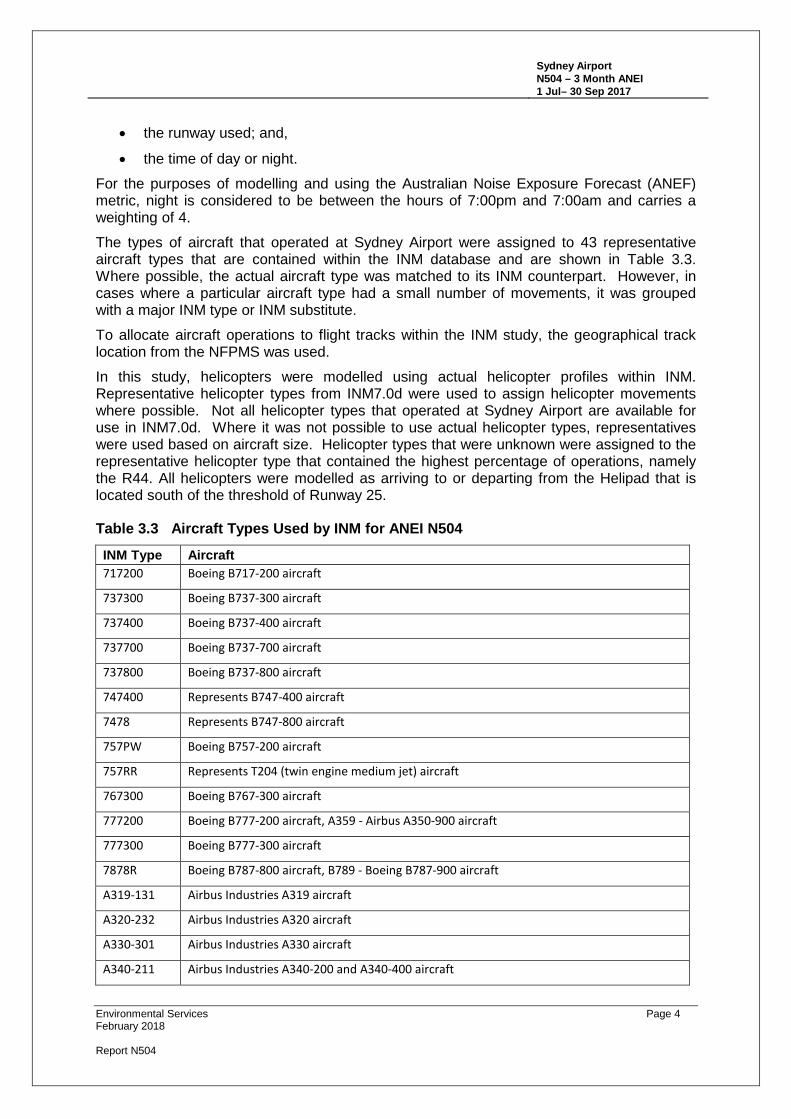
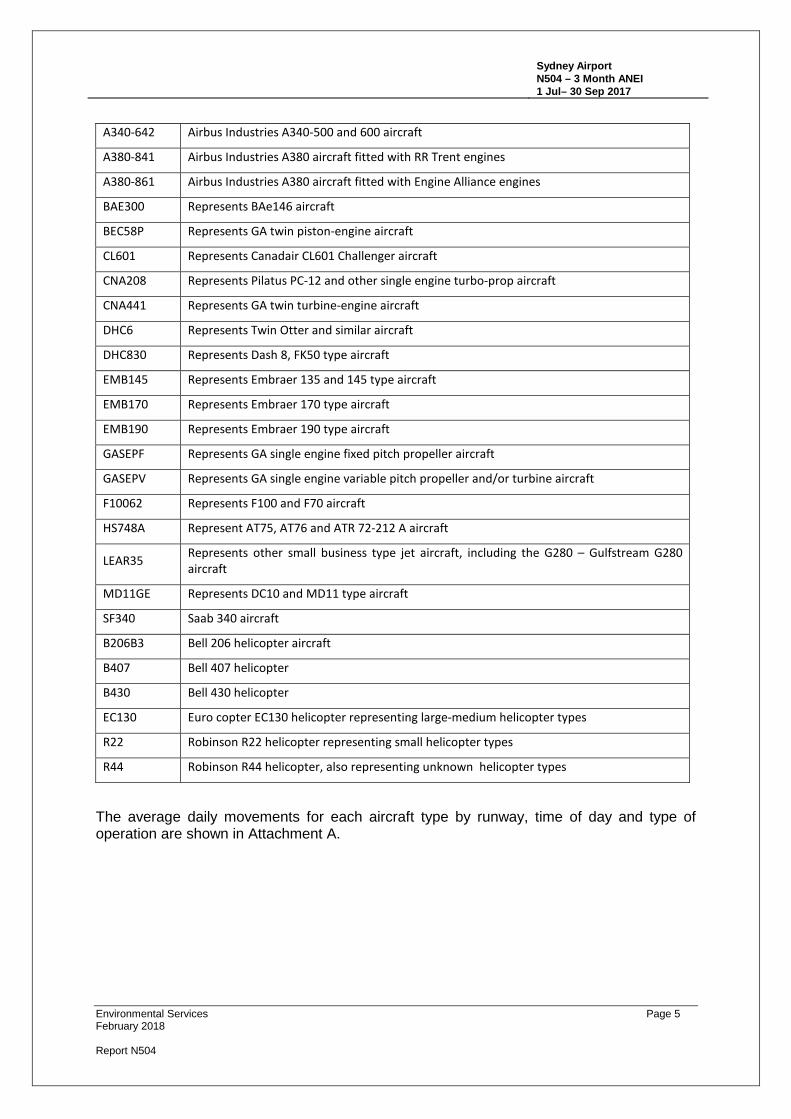
• the time of day or night. For the purposes of modelling and using the Australian Noise Exposure Forecast (ANEF) metric, night is considered to be between the hours of 7:00pm and 7:00am and carries a weighting of 4. The types of aircraft that operated at Sydney Airport were assigned to 43 representative aircraft types that are contained within the INM database and are shown in Table 3.3. Where possible, the actual aircraft type was matched to its INM counterpart. However, in cases where a particular aircraft type had a small number of movements, it was grouped with a major INM type or INM substitute. To allocate aircraft operations to flight tracks within the INM study, the geographical track location from the NFPMS was used. In this study, helicopters were modelled using actual helicopter profiles within INM. Representative helicopter types from INM7.0d were used to assign helicopter movements where possible. Not all helicopter types that operated at Sydney Airport are available for use in INM7.0d. Where it was not possible to use actual helicopter types, representatives were used based on aircraft size. Helicopter types that were unknown were assigned to the representative helicopter type that contained the highest percentage of operations, namely the R44. All helicopters were modelled as arriving to or departing from the Helipad that is located south of the threshold of Runway 25.
Table 3.3 Aircraft Types Used by INM for ANEI N504 INM Type Aircraft 717200 Boeing B717-200 aircraft
737300 Boeing B737-300 aircraft
737400 Boeing B737-400 aircraft
737700 Boeing B737-700 aircraft
737800 Boeing B737-800 aircraft
747400 Represents B747-400 aircraft
7478 Represents B747-800 aircraft
757PW Boeing B757-200 aircraft
757RR Represents T204 (twin engine medium jet) aircraft
767300 Boeing B767-300 aircraft
777200 Boeing B777-200 aircraft, A359 - Airbus A350-900 aircraft
777300 Boeing B777-300 aircraft
7878R Boeing B787-800 aircraft, B789 - Boeing B787-900 aircraft
A319-131 Airbus Industries A319 aircraft
A320-232 Airbus Industries A320 aircraft
A330-301 Airbus Industries A330 aircraft
A340-211 Airbus Industries A340-200 and A340-400 aircraft
Environmental Services Page 4 February 2018
Report N504
Sydney Airport N504 – 3 Month ANEI 1 Jul– 30 Sep 2017
A340-642 Airbus Industries A340-500 and 600 aircraft
A380-841 Airbus Industries A380 aircraft fitted with RR Trent engines
A380-861 Airbus Industries A380 aircraft fitted with Engine Alliance engines
BAE300 Represents BAe146 aircraft
BEC58P Represents GA twin piston-engine aircraft
CL601 Represents Canadair CL601 Challenger aircraft
CNA208 Represents Pilatus PC-12 and other single engine turbo-prop aircraft
CNA441 Represents GA twin turbine-engine aircraft
DHC6 Represents Twin Otter and similar aircraft
DHC830 Represents Dash 8, FK50 type aircraft
EMB145 Represents Embraer 135 and 145 type aircraft
EMB170 Represents Embraer 170 type aircraft
EMB190 Represents Embraer 190 type aircraft
GASEPF Represents GA single engine fixed pitch propeller aircraft
GASEPV Represents GA single engine variable pitch propeller and/or turbine aircraft
F10062 Represents F100 and F70 aircraft
HS748A Represent AT75, AT76 and ATR 72-212 A aircraft
LEAR35 Represents other small business type jet aircraft, including the G280 – Gulfstream G280 aircraft
MD11GE Represents DC10 and MD11 type aircraft
SF340 Saab 340 aircraft
B206B3 Bell 206 helicopter aircraft
B407 Bell 407 helicopter
B430 Bell 430 helicopter
EC130 Euro copter EC130 helicopter representing large-medium helicopter types
R22 Robinson R22 helicopter representing small helicopter types
R44 Robinson R44 helicopter, also representing unknown helicopter types
The average daily movements for each aircraft type by runway, time of day and type of operation are shown in Attachment A.
Environmental Services Page 5 February 2018
Report N504
Sydney Airport N504 – 3 Month ANEI 1 Jul– 30 Sep 2017
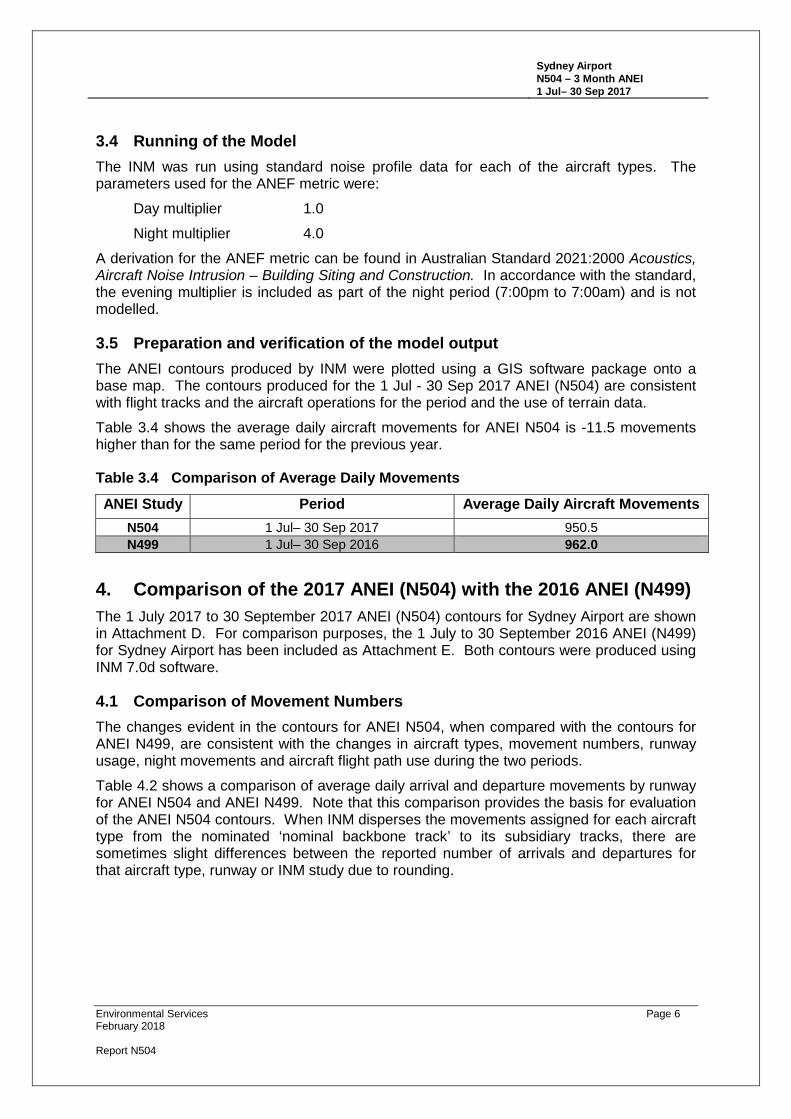
3.4 Running of the Model The INM was run using standard noise profile data for each of the aircraft types. The parameters used for the ANEF metric were:
Day multiplier 1.0 Night multiplier 4.0
A derivation for the ANEF metric can be found in Australian Standard 2021:2000 Acoustics, Aircraft Noise Intrusion – Building Siting and Construction. In accordance with the standard, the evening multiplier is included as part of the night period (7:00pm to 7:00am) and is not modelled.
3.5 Preparation and verification of the model output The ANEI contours produced by INM were plotted using a GIS software package onto a base map. The contours produced for the 1 Jul - 30 Sep 2017 ANEI (N504) are consistent with flight tracks and the aircraft operations for the period and the use of terrain data. Table 3.4 shows the average daily aircraft movements for ANEI N504 is -11.5 movements higher than for the same period for the previous year.
Table 3.4 Comparison of Average Daily Movements ANEI Study Period Average Daily Aircraft Movements
N504 1 Jul– 30 Sep 2017 950.5 N499 1 Jul– 30 Sep 2016 962.0
4. Comparison of the 2017 ANEI (N504) with the 2016 ANEI (N499) The 1 July 2017 to 30 September 2017 ANEI (N504) contours for Sydney Airport are shown in Attachment D. For comparison purposes, the 1 July to 30 September 2016 ANEI (N499) for Sydney Airport has been included as Attachment E. Both contours were produced using INM 7.0d software.
4.1 Comparison of Movement Numbers The changes evident in the contours for ANEI N504, when compared with the contours for ANEI N499, are consistent with the changes in aircraft types, movement numbers, runway usage, night movements and aircraft flight path use during the two periods. Table 4.2 shows a comparison of average daily arrival and departure movements by runway for ANEI N504 and ANEI N499. Note that this comparison provides the basis for evaluation of the ANEI N504 contours. When INM disperses the movements assigned for each aircraft type from the nominated ‘nominal backbone track’ to its subsidiary tracks, there are sometimes slight differences between the reported number of arrivals and departures for that aircraft type, runway or INM study due to rounding.
Environmental Services Page 6 February 2018
Report N504
Sydney Airport N504 – 3 Month ANEI 1 Jul– 30 Sep 2017
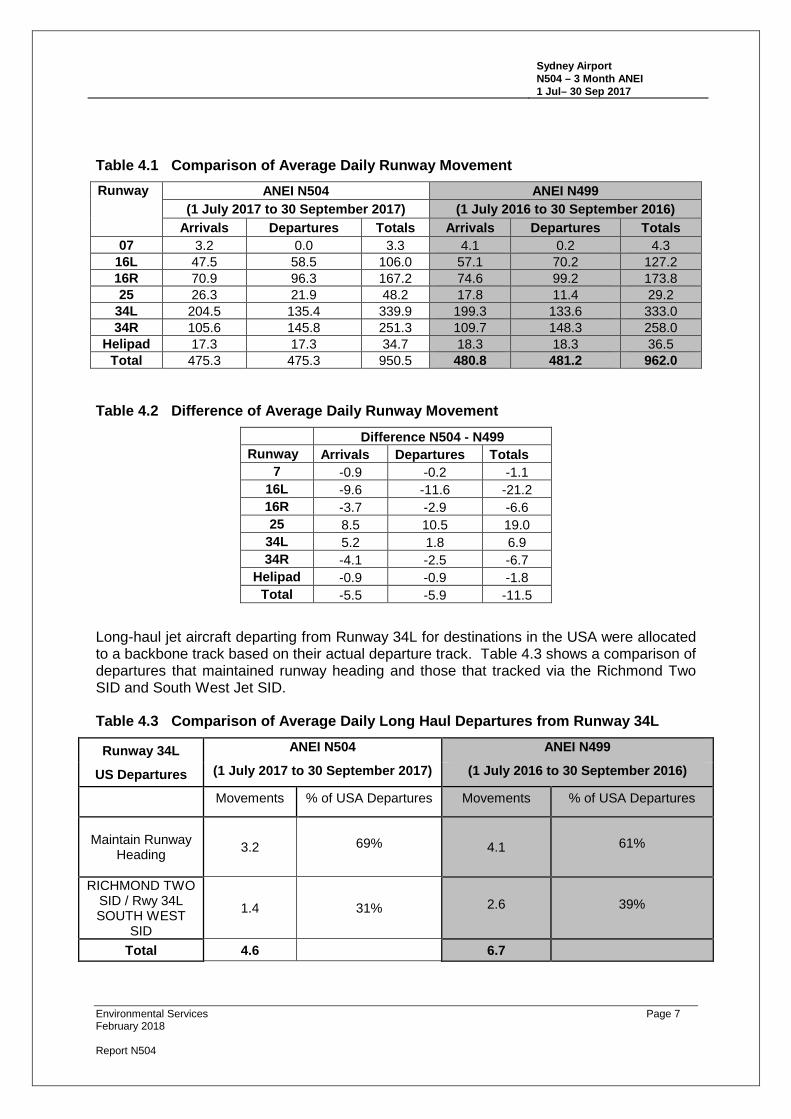
Table 4.1 Comparison of Average Daily Runway Movement Runway ANEI N504 ANEI N499
(1 July 2017 to 30 September 2017) (1 July 2016 to 30 September 2016) Arrivals Departures Totals Arrivals Departures Totals
07 3.2 0.0 3.3 4.1 0.2 4.3 16L 47.5 58.5 106.0 57.1 70.2 127.2 16R 70.9 96.3 167.2 74.6 99.2 173.8 25 26.3 21.9 48.2 17.8 11.4 29.2 34L 204.5 135.4 339.9 199.3 133.6 333.0 34R 105.6 145.8 251.3 109.7 148.3 258.0
Helipad 17.3 17.3 34.7 18.3 18.3 36.5 Total 475.3 475.3 950.5 480.8 481.2 962.0
Table 4.2 Difference of Average Daily Runway Movement Difference N504 - N499
Runway Arrivals Departures Totals 7 -0.9 -0.2 -1.1 16L -9.6 -11.6 -21.2 16R -3.7 -2.9 -6.6 25 8.5 10.5 19.0 34L 5.2 1.8 6.9 34R -4.1 -2.5 -6.7
Helipad -0.9 -0.9 -1.8 Total -5.5 -5.9 -11.5
Long-haul jet aircraft departing from Runway 34L for destinations in the USA were allocated to a backbone track based on their actual departure track. Table 4.3 shows a comparison of departures that maintained runway heading and those that tracked via the Richmond Two SID and South West Jet SID.
Table 4.3 Comparison of Average Daily Long Haul Departures from Runway 34L
Runway 34L
US Departures
ANEI N504
(1 July 2017 to 30 September 2017)
ANEI N499
(1 July 2016 to 30 September 2016)
Movements % of USA Departures Movements % of USA Departures
Maintain Runway Heading 3.2 69% 4.1 61%
RICHMOND TWO SID / Rwy 34L SOUTH WEST
SID
1.4 31% 2.6 39%
Total 4.6 6.7
Environmental Services Page 7 February 2018
Report N504
"' -C: a, E 15.0 +-------------------1 a, > 0 E ! 10.0 -+-------------------1 0 -~ 0 ~ 0 5.0 +-------.---
07 16L 16R 25 34L 34R Helipad
D N504
• N499
Sydney Airport N504 – 3 Month ANEI 1 Jul– 30 Sep 2017
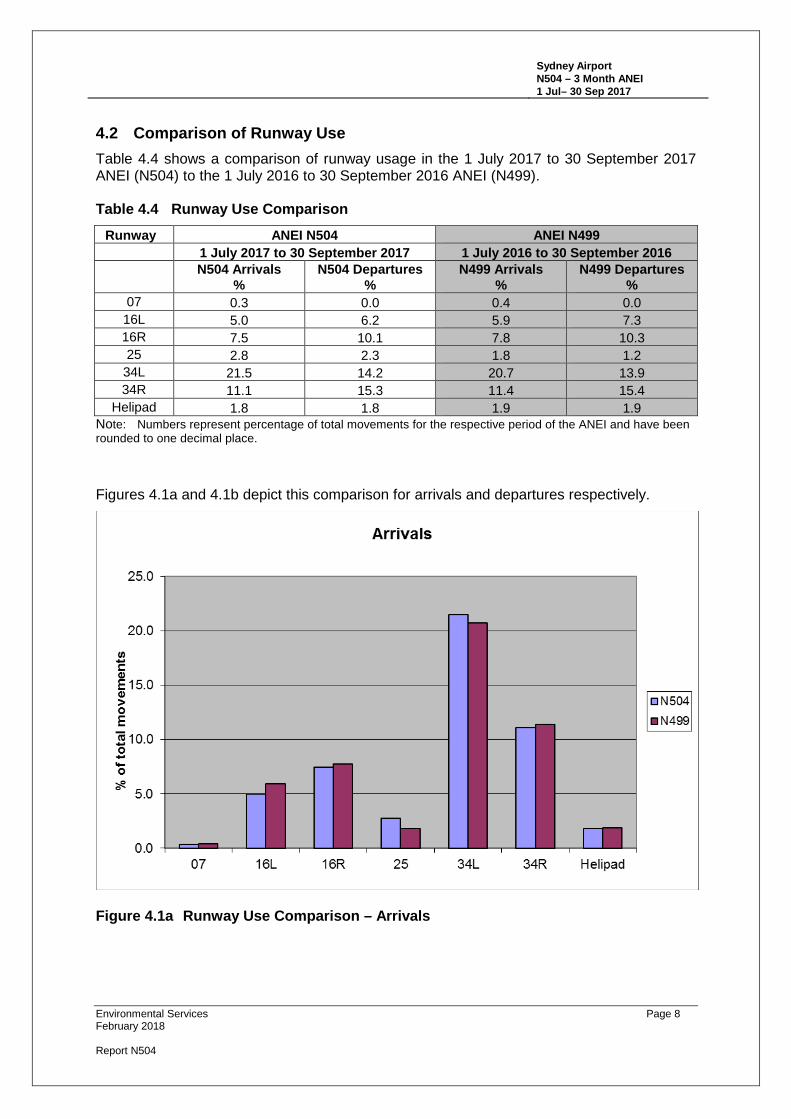
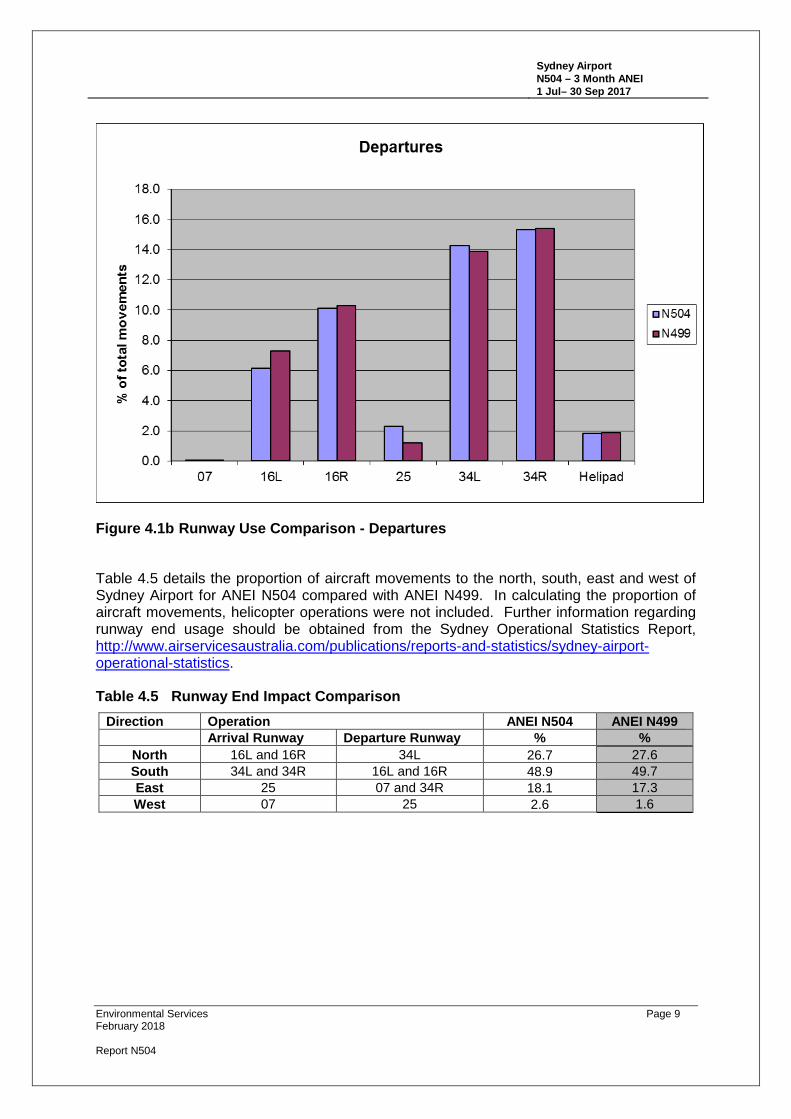
4.2 Comparison of Runway Use Table 4.4 shows a comparison of runway usage in the 1 July 2017 to 30 September 2017 ANEI (N504) to the 1 July 2016 to 30 September 2016 ANEI (N499).
Table 4.4 Runway Use Comparison Runway ANEI N504 ANEI N499
1 July 2017 to 30 September 2017 1 July 2016 to 30 September 2016 N504 Arrivals
% N504 Departures
% N499 Arrivals
% N499 Departures
% 07 0.3 0.0 0.4 0.0 16L 5.0 6.2 5.9 7.3 16R 7.5 10.1 7.8 10.3 25 2.8 2.3 1.8 1.2 34L 21.5 14.2 20.7 13.9 34R 11.1 15.3 11.4 15.4
Helipad 1.8 1.8 1.9 1.9 Note: Numbers represent percentage of total movements for the respective period of the ANEI and have been rounded to one decimal place.
Figures 4.1a and 4.1b depict this comparison for arrivals and departures respectively.
Figure 4.1a Runway Use Comparison – Arrivals
Environmental Services Page 8 February 2018
Report N504
18.0
16.0
14.0 fJI - 12.0 C: Q.I
E Q.I 10.0 > oN504 0 E iii
8.0 •N499
-0 6.0 -.... 0 ~ 0 4.0
2.0
0.0 07 16L 16R 25 34L 34R Helipad
Sydney Airport N504 – 3 Month ANEI 1 Jul– 30 Sep 2017
Figure 4.1b Runway Use Comparison - Departures
Table 4.5 details the proportion of aircraft movements to the north, south, east and west of Sydney Airport for ANEI N504 compared with ANEI N499. In calculating the proportion of aircraft movements, helicopter operations were not included. Further information regarding runway end usage should be obtained from the Sydney Operational Statistics Report, http://www.airservicesaustralia.com/publications/reports-and-statistics/sydney-airport-operational-statistics.
Table 4.5 Runway End Impact Comparison Direction Operation ANEI N504 ANEI N499
Arrival Runway Departure Runway % % North 16L and 16R 34L 26.7 27.6 South 34L and 34R 16L and 16R 48.9 49.7 East 25 07 and 34R 18.1 17.3 West 07 25 2.6 1.6
Environmental Services Page 9 February 2018
Report N504
Sydney Airport N504 – 3 Month ANEI 1 Jul– 30 Sep 2017
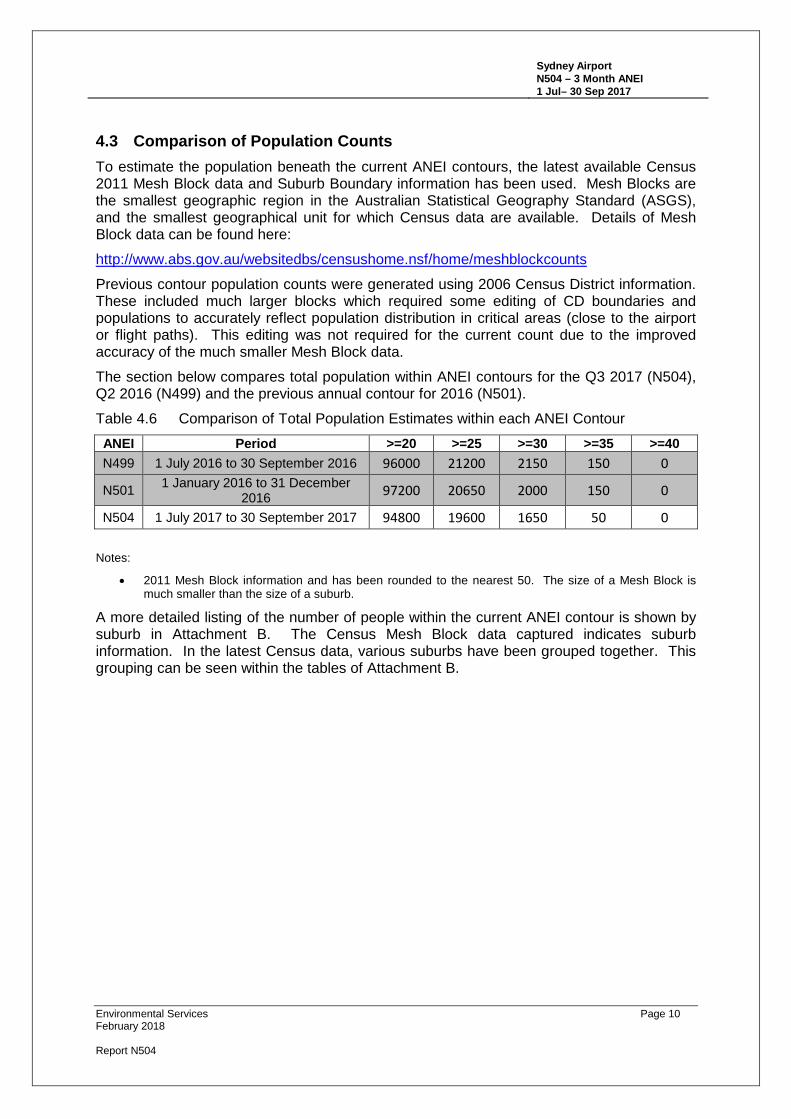
4.3 Comparison of Population Counts To estimate the population beneath the current ANEI contours, the latest available Census 2011 Mesh Block data and Suburb Boundary information has been used. Mesh Blocks are the smallest geographic region in the Australian Statistical Geography Standard (ASGS), and the smallest geographical unit for which Census data are available. Details of Mesh Block data can be found here: http://www.abs.gov.au/websitedbs/censushome.nsf/home/meshblockcounts Previous contour population counts were generated using 2006 Census District information. These included much larger blocks which required some editing of CD boundaries and populations to accurately reflect population distribution in critical areas (close to the airport or flight paths). This editing was not required for the current count due to the improved accuracy of the much smaller Mesh Block data. The section below compares total population within ANEI contours for the Q3 2017 (N504), Q2 2016 (N499) and the previous annual contour for 2016 (N501). Table 4.6 Comparison of Total Population Estimates within each ANEI Contour ANEI Period >=20 >=25 >=30 >=35 >=40 N499 1 July 2016 to 30 September 2016 96000 21200 2150 150 0
N501 1 January 2016 to 31 December 2016 97200 20650 2000 150 0
N504 1 July 2017 to 30 September 2017 94800 19600 1650 50 0
Notes:
• 2011 Mesh Block information and has been rounded to the nearest 50. The size of a Mesh Block is much smaller than the size of a suburb.
A more detailed listing of the number of people within the current ANEI contour is shown by suburb in Attachment B. The Census Mesh Block data captured indicates suburb information. In the latest Census data, various suburbs have been grouped together. This grouping can be seen within the tables of Attachment B.
Environmental Services Page 10 February 2018
Report N504
Sydney Airport N504 – 3 Month ANEI 1 Jul– 30 Sep 2017
5. Number of Aircraft Noise Events Above 70dB(A) Noise Map
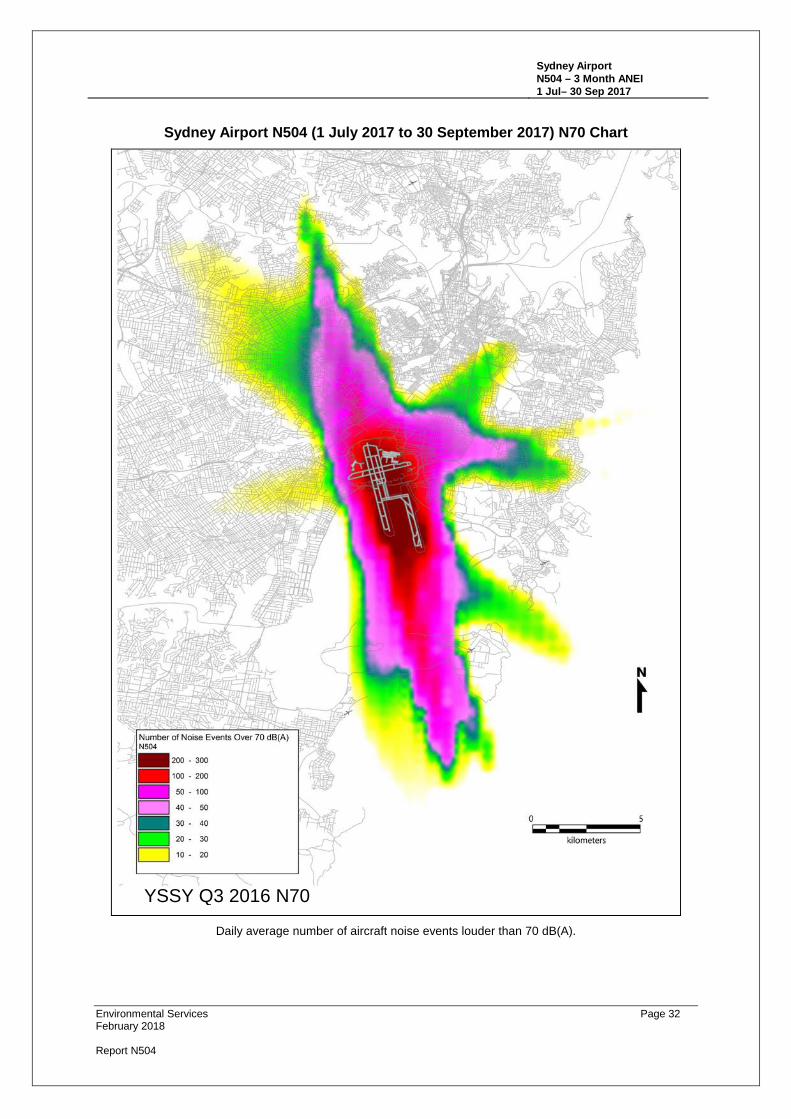
5.1 Introduction ‘Number Above’ (Nxx) noise maps are an approach which provides additional information on aircraft noise in a form that is more easily understood by the community. The contours provide a visual depiction that shows the number of noise events during a given period that are louder than a selected threshold level. The N70 Aircraft Noise Map for Sydney Airport shows for all areas around the airport how many aircraft noise events louder than 70 dB(A) there were, on a daily average, during the period from 1 July 2017 to 30 September 2017. 70 dB(A) is generally considered to be the external sound level below which no difficulty with reliable communication from radio, television or conversational speech in a typical room with windows open is expected. (Reference - Department of Transport and Regional Services, 2000, Expanding Ways to Describe and Assess Aircraft Noise, pp23-35).
5.2 Methodology used in the Development of the N70 Aircraft Noise Map The N70 aircraft noise map was prepared using the same input files as those for the ANEI contours and was prepared by running the Time-Above (TA) metric, which is a standard metric within INM 7.0d, to produce a detailed grid output file. It is important to note that the TA metric, unlike the ANEF metric, does not use any night weighting in the calculations. The detailed grid output file was then modified using propriety software and then imported into a GIS software package for plotting onto a base map.
5.3 Analysis of the N70 Aircraft Noise Map The N70 map prepared for Sydney Airport is shown in Attachment F – Sydney Airport N504 N70 Aircraft Noise Map - 1 July 2017 to 30 September 2017. The map output is consistent with the patterns that would be expected given the position of the flight paths and the number and types of aircraft using the flight paths modelled in the ANEI (N504). The N70 aircraft noise map provides information on the total number of aircraft noise events that exceeded 70 dB(A) in a grid area that were likely to have interfered with conversation, sleeping and listening to the radio or television inside a house with the windows open. However, it is important to note the limitations with the N70 aircraft noise maps. The INM does not provide users with a direct way of computing a ‘Number Above’ chart, unlike the ANEI and TA contours. It is only possible to derive ‘Number Above’ values on a rectangular grid, which is then processed for importing into the GIS software package. The accuracy of the N70 contours shown in Attachment F is therefore at best plus or minus 500 metres, the distance between grid points used by INM in the calculations. In addition, the superimposed contours may have incurred errors in the transformation from INM coordinates to the map coordinates that were used in the preparation of the N70 chart.
Environmental Services Page 11 February 2018
Report N504
Sydney Airport N504 – 3 Month ANEI 1 Jul– 30 Sep 2017
Attachment A
ANEI N504 Average Daily Aircraft Movements by
Runway
Environmental Services Page 12 February 2018
Report N504
Sydney Airport N504 – 3 Month ANEI 1 Jul– 30 Sep 2017
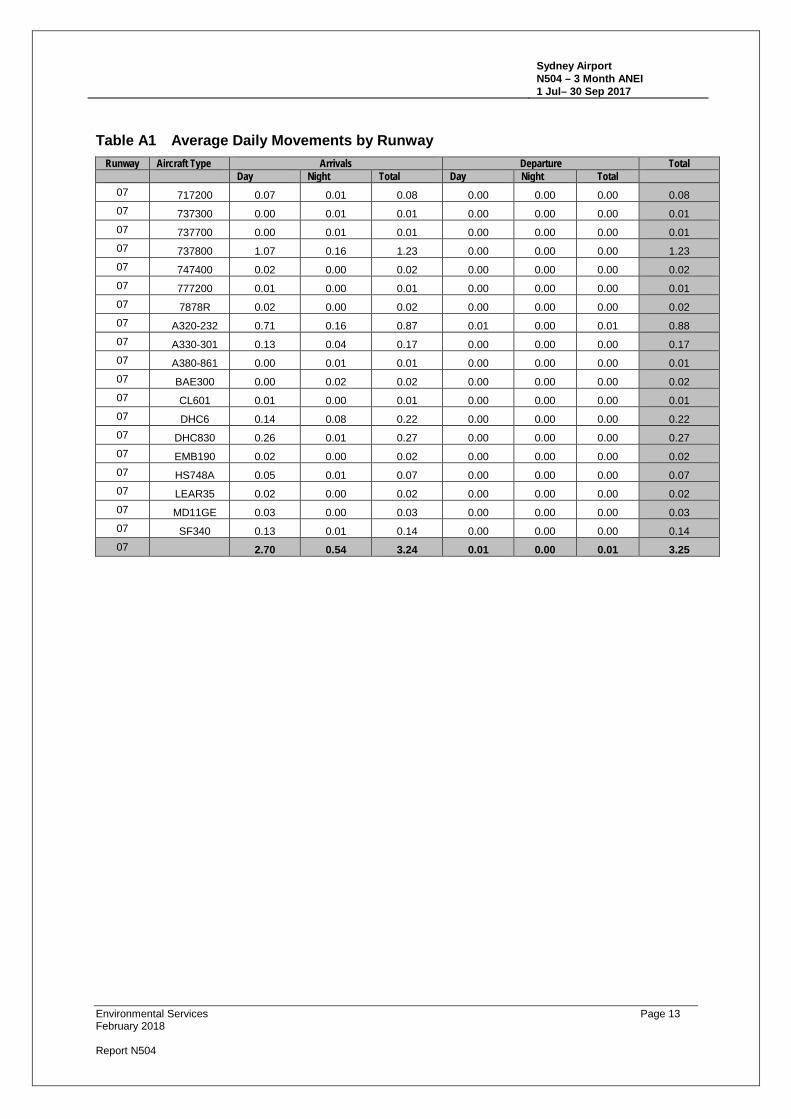
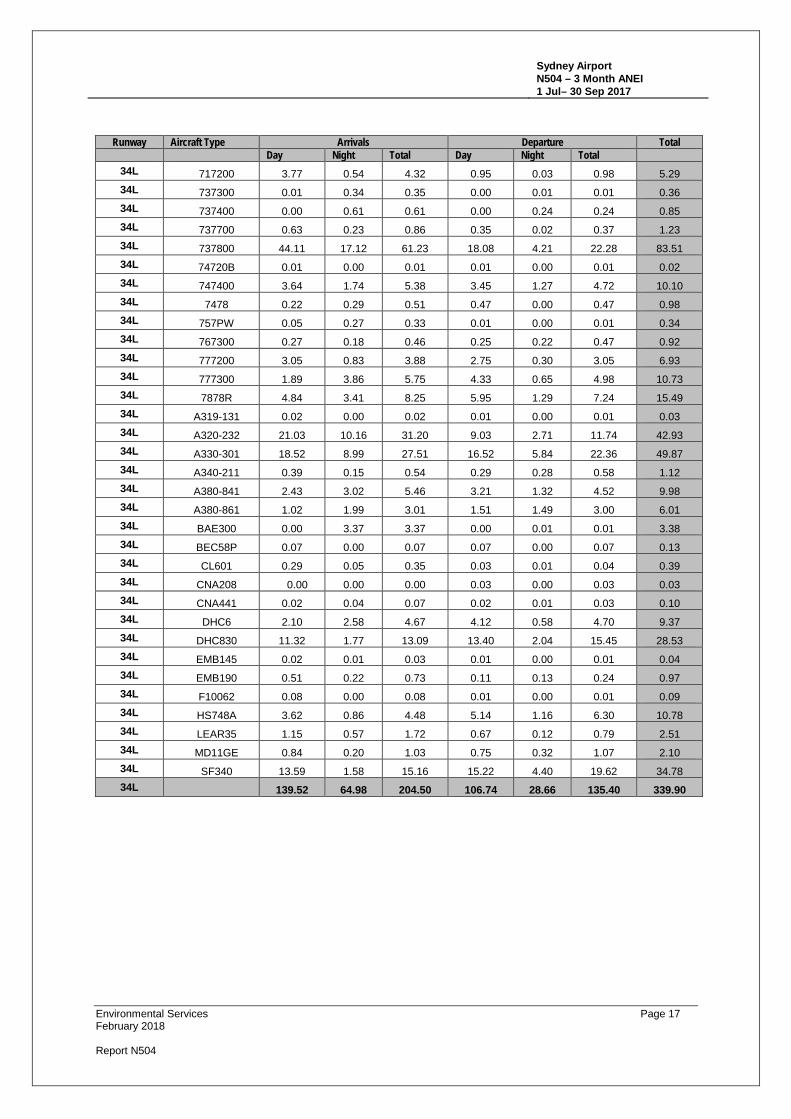
Table A1 Average Daily Movements by Runway Runway Aircraft Type Arrivals Departure Total
Day Night Total Day Night Total 07 717200 0.07 0.01 0.08 0.00 0.00 0.00 0.08 07 737300 0.00 0.01 0.01 0.00 0.00 0.00 0.01 07 737700 0.00 0.01 0.01 0.00 0.00 0.00 0.01 07 737800 1.07 0.16 1.23 0.00 0.00 0.00 1.23 07 747400 0.02 0.00 0.02 0.00 0.00 0.00 0.02 07 777200 0.01 0.00 0.01 0.00 0.00 0.00 0.01 07 7878R 0.02 0.00 0.02 0.00 0.00 0.00 0.02 07 A320-232 0.71 0.16 0.87 0.01 0.00 0.01 0.88 07 A330-301 0.13 0.04 0.17 0.00 0.00 0.00 0.17 07 A380-861 0.00 0.01 0.01 0.00 0.00 0.00 0.01 07 BAE300 0.00 0.02 0.02 0.00 0.00 0.00 0.02 07 CL601 0.01 0.00 0.01 0.00 0.00 0.00 0.01 07 DHC6 0.14 0.08 0.22 0.00 0.00 0.00 0.22 07 DHC830 0.26 0.01 0.27 0.00 0.00 0.00 0.27 07 EMB190 0.02 0.00 0.02 0.00 0.00 0.00 0.02 07 HS748A 0.05 0.01 0.07 0.00 0.00 0.00 0.07 07 LEAR35 0.02 0.00 0.02 0.00 0.00 0.00 0.02 07 MD11GE 0.03 0.00 0.03 0.00 0.00 0.00 0.03 07 SF340 0.13 0.01 0.14 0.00 0.00 0.00 0.14 07 2.70 0.54 3.24 0.01 0.00 0.01 3.25
Environmental Services Page 13 February 2018
Report N504
Sydney Airport N504 – 3 Month ANEI 1 Jul– 30 Sep 2017
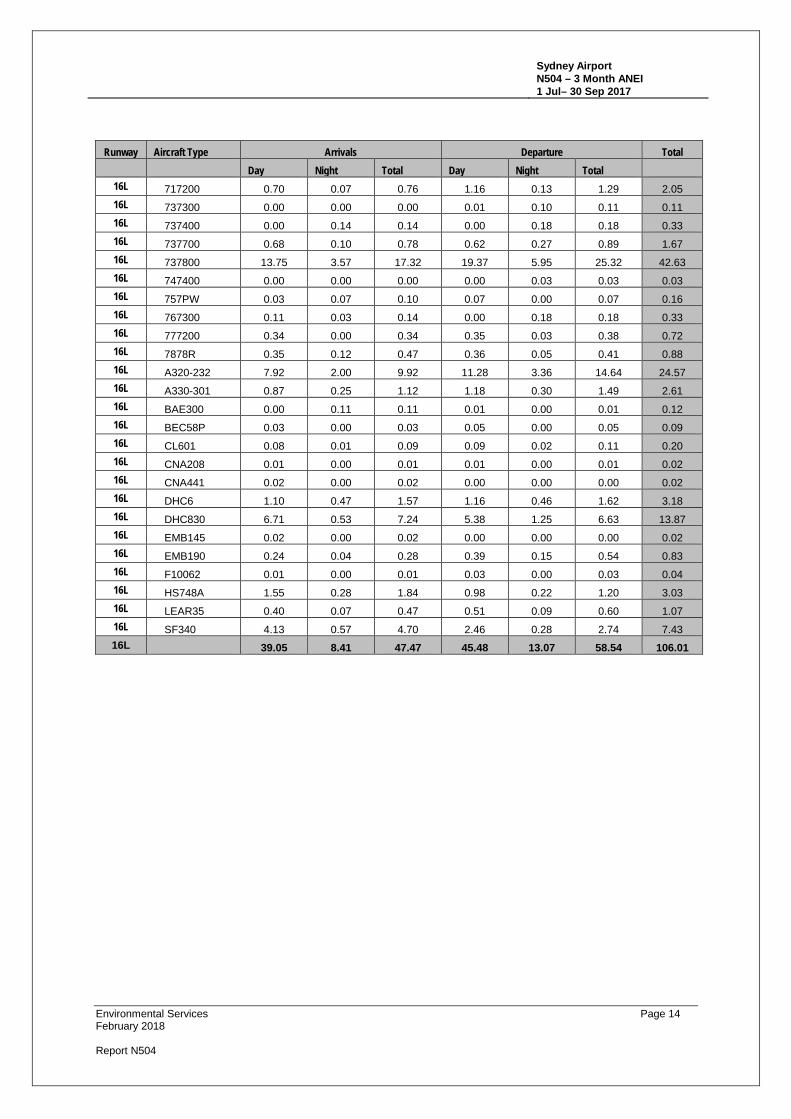
Runway Aircraft Type Arrivals Departure Total Day Night Total Day Night Total
16L 717200 0.70 0.07 0.76 1.16 0.13 1.29 2.05 16L 737300 0.00 0.00 0.00 0.01 0.10 0.11 0.11 16L 737400 0.00 0.14 0.14 0.00 0.18 0.18 0.33 16L 737700 0.68 0.10 0.78 0.62 0.27 0.89 1.67 16L 737800 13.75 3.57 17.32 19.37 5.95 25.32 42.63 16L 747400 0.00 0.00 0.00 0.00 0.03 0.03 0.03 16L 757PW 0.03 0.07 0.10 0.07 0.00 0.07 0.16 16L 767300 0.11 0.03 0.14 0.00 0.18 0.18 0.33 16L 777200 0.34 0.00 0.34 0.35 0.03 0.38 0.72 16L 7878R 0.35 0.12 0.47 0.36 0.05 0.41 0.88 16L A320-232 7.92 2.00 9.92 11.28 3.36 14.64 24.57 16L A330-301 0.87 0.25 1.12 1.18 0.30 1.49 2.61 16L BAE300 0.00 0.11 0.11 0.01 0.00 0.01 0.12 16L BEC58P 0.03 0.00 0.03 0.05 0.00 0.05 0.09 16L CL601 0.08 0.01 0.09 0.09 0.02 0.11 0.20 16L CNA208 0.01 0.00 0.01 0.01 0.00 0.01 0.02 16L CNA441 0.02 0.00 0.02 0.00 0.00 0.00 0.02 16L DHC6 1.10 0.47 1.57 1.16 0.46 1.62 3.18 16L DHC830 6.71 0.53 7.24 5.38 1.25 6.63 13.87 16L EMB145 0.02 0.00 0.02 0.00 0.00 0.00 0.02 16L EMB190 0.24 0.04 0.28 0.39 0.15 0.54 0.83 16L F10062 0.01 0.00 0.01 0.03 0.00 0.03 0.04 16L HS748A 1.55 0.28 1.84 0.98 0.22 1.20 3.03 16L LEAR35 0.40 0.07 0.47 0.51 0.09 0.60 1.07 16L SF340 4.13 0.57 4.70 2.46 0.28 2.74 7.43 16L 39.05 8.41 47.47 45.48 13.07 58.54 106.01
Environmental Services Page 14 February 2018
Report N504
Sydney Airport N504 – 3 Month ANEI 1 Jul– 30 Sep 2017
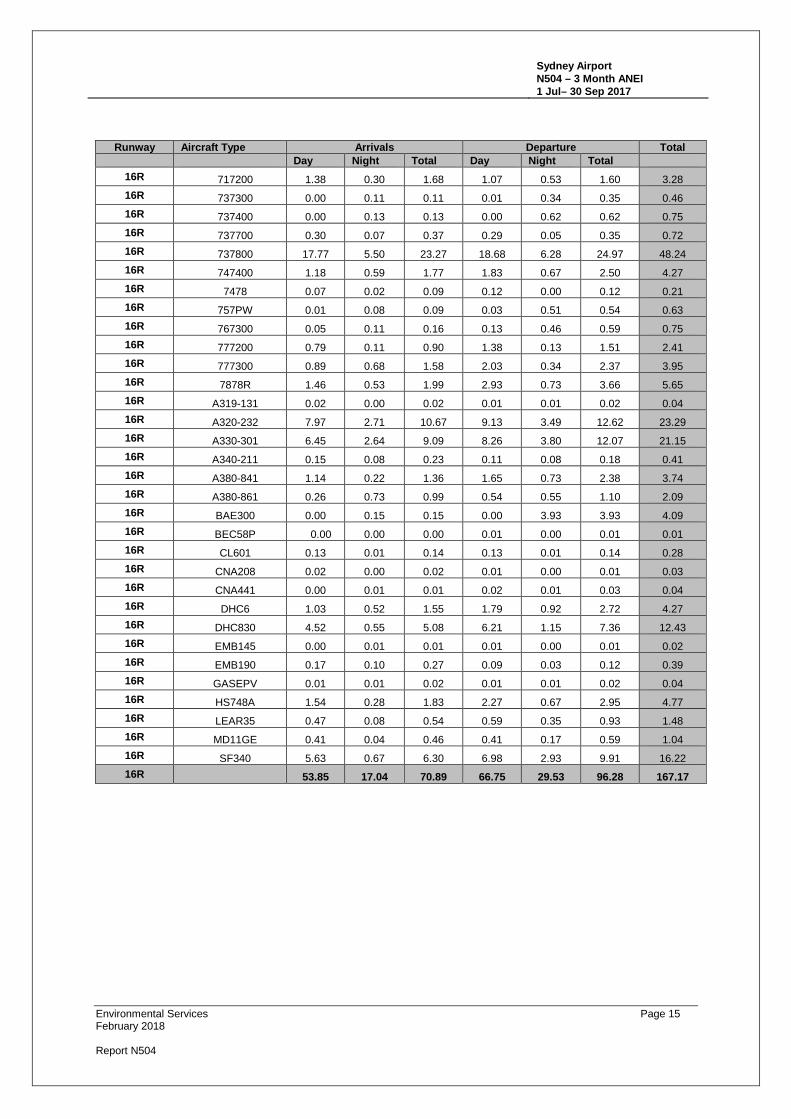
Runway Aircraft Type Arrivals Departure Total Day Night Total Day Night Total
16R 717200 1.38 0.30 1.68 1.07 0.53 1.60 3.28 16R 737300 0.00 0.11 0.11 0.01 0.34 0.35 0.46 16R 737400 0.00 0.13 0.13 0.00 0.62 0.62 0.75 16R 737700 0.30 0.07 0.37 0.29 0.05 0.35 0.72 16R 737800 17.77 5.50 23.27 18.68 6.28 24.97 48.24 16R 747400 1.18 0.59 1.77 1.83 0.67 2.50 4.27 16R 7478 0.07 0.02 0.09 0.12 0.00 0.12 0.21 16R 757PW 0.01 0.08 0.09 0.03 0.51 0.54 0.63 16R 767300 0.05 0.11 0.16 0.13 0.46 0.59 0.75 16R 777200 0.79 0.11 0.90 1.38 0.13 1.51 2.41 16R 777300 0.89 0.68 1.58 2.03 0.34 2.37 3.95 16R 7878R 1.46 0.53 1.99 2.93 0.73 3.66 5.65 16R A319-131 0.02 0.00 0.02 0.01 0.01 0.02 0.04 16R A320-232 7.97 2.71 10.67 9.13 3.49 12.62 23.29 16R A330-301 6.45 2.64 9.09 8.26 3.80 12.07 21.15 16R A340-211 0.15 0.08 0.23 0.11 0.08 0.18 0.41 16R A380-841 1.14 0.22 1.36 1.65 0.73 2.38 3.74 16R A380-861 0.26 0.73 0.99 0.54 0.55 1.10 2.09 16R BAE300 0.00 0.15 0.15 0.00 3.93 3.93 4.09 16R BEC58P 0.00 0.00 0.00 0.01 0.00 0.01 0.01 16R CL601 0.13 0.01 0.14 0.13 0.01 0.14 0.28 16R CNA208 0.02 0.00 0.02 0.01 0.00 0.01 0.03 16R CNA441 0.00 0.01 0.01 0.02 0.01 0.03 0.04 16R DHC6 1.03 0.52 1.55 1.79 0.92 2.72 4.27 16R DHC830 4.52 0.55 5.08 6.21 1.15 7.36 12.43 16R EMB145 0.00 0.01 0.01 0.01 0.00 0.01 0.02 16R EMB190 0.17 0.10 0.27 0.09 0.03 0.12 0.39 16R GASEPV 0.01 0.01 0.02 0.01 0.01 0.02 0.04 16R HS748A 1.54 0.28 1.83 2.27 0.67 2.95 4.77 16R LEAR35 0.47 0.08 0.54 0.59 0.35 0.93 1.48 16R MD11GE 0.41 0.04 0.46 0.41 0.17 0.59 1.04 16R SF340 5.63 0.67 6.30 6.98 2.93 9.91 16.22 16R 53.85 17.04 70.89 66.75 29.53 96.28 167.17
Environmental Services Page 15 February 2018
Report N504
Sydney Airport N504 – 3 Month ANEI 1 Jul– 30 Sep 2017
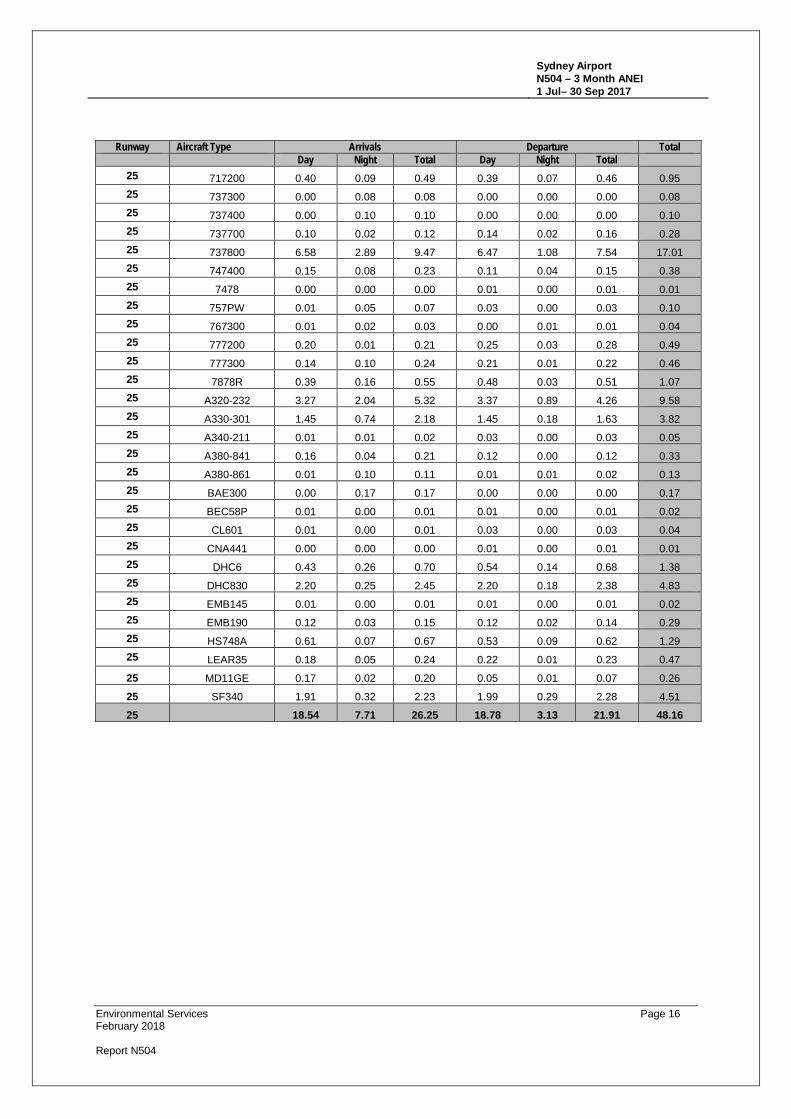
Runway Aircraft Type Arrivals Departure Total Day Night Total Day Night Total
25 717200 0.40 0.09 0.49 0.39 0.07 0.46 0.95 25 737300 0.00 0.08 0.08 0.00 0.00 0.00 0.08 25 737400 0.00 0.10 0.10 0.00 0.00 0.00 0.10 25 737700 0.10 0.02 0.12 0.14 0.02 0.16 0.28 25 737800 6.58 2.89 9.47 6.47 1.08 7.54 17.01 25 747400 0.15 0.08 0.23 0.11 0.04 0.15 0.38 25 7478 0.00 0.00 0.00 0.01 0.00 0.01 0.01 25 757PW 0.01 0.05 0.07 0.03 0.00 0.03 0.10 25 767300 0.01 0.02 0.03 0.00 0.01 0.01 0.04 25 777200 0.20 0.01 0.21 0.25 0.03 0.28 0.49 25 777300 0.14 0.10 0.24 0.21 0.01 0.22 0.46 25 7878R 0.39 0.16 0.55 0.48 0.03 0.51 1.07 25 A320-232 3.27 2.04 5.32 3.37 0.89 4.26 9.58 25 A330-301 1.45 0.74 2.18 1.45 0.18 1.63 3.82 25 A340-211 0.01 0.01 0.02 0.03 0.00 0.03 0.05 25 A380-841 0.16 0.04 0.21 0.12 0.00 0.12 0.33 25 A380-861 0.01 0.10 0.11 0.01 0.01 0.02 0.13 25 BAE300 0.00 0.17 0.17 0.00 0.00 0.00 0.17 25 BEC58P 0.01 0.00 0.01 0.01 0.00 0.01 0.02 25 CL601 0.01 0.00 0.01 0.03 0.00 0.03 0.04 25 CNA441 0.00 0.00 0.00 0.01 0.00 0.01 0.01 25 DHC6 0.43 0.26 0.70 0.54 0.14 0.68 1.38 25 DHC830 2.20 0.25 2.45 2.20 0.18 2.38 4.83 25 EMB145 0.01 0.00 0.01 0.01 0.00 0.01 0.02 25 EMB190 0.12 0.03 0.15 0.12 0.02 0.14 0.29 25 HS748A 0.61 0.07 0.67 0.53 0.09 0.62 1.29 25 LEAR35 0.18 0.05 0.24 0.22 0.01 0.23 0.47
25 MD11GE 0.17 0.02 0.20 0.05 0.01 0.07 0.26
25 SF340 1.91 0.32 2.23 1.99 0.29 2.28 4.51
25 18.54 7.71 26.25 18.78 3.13 21.91 48.16
Environmental Services Page 16 February 2018
Report N504
Sydney Airport N504 – 3 Month ANEI 1 Jul– 30 Sep 2017
Runway Aircraft Type Arrivals Departure Total Day Night Total Day Night Total
34L 717200 3.77 0.54 4.32 0.95 0.03 0.98 5.29 34L 737300 0.01 0.34 0.35 0.00 0.01 0.01 0.36 34L 737400 0.00 0.61 0.61 0.00 0.24 0.24 0.85 34L 737700 0.63 0.23 0.86 0.35 0.02 0.37 1.23 34L 737800 44.11 17.12 61.23 18.08 4.21 22.28 83.51 34L 74720B 0.01 0.00 0.01 0.01 0.00 0.01 0.02 34L 747400 3.64 1.74 5.38 3.45 1.27 4.72 10.10 34L 7478 0.22 0.29 0.51 0.47 0.00 0.47 0.98 34L 757PW 0.05 0.27 0.33 0.01 0.00 0.01 0.34 34L 767300 0.27 0.18 0.46 0.25 0.22 0.47 0.92 34L 777200 3.05 0.83 3.88 2.75 0.30 3.05 6.93 34L 777300 1.89 3.86 5.75 4.33 0.65 4.98 10.73 34L 7878R 4.84 3.41 8.25 5.95 1.29 7.24 15.49 34L A319-131 0.02 0.00 0.02 0.01 0.00 0.01 0.03 34L A320-232 21.03 10.16 31.20 9.03 2.71 11.74 42.93 34L A330-301 18.52 8.99 27.51 16.52 5.84 22.36 49.87 34L A340-211 0.39 0.15 0.54 0.29 0.28 0.58 1.12 34L A380-841 2.43 3.02 5.46 3.21 1.32 4.52 9.98 34L A380-861 1.02 1.99 3.01 1.51 1.49 3.00 6.01 34L BAE300 0.00 3.37 3.37 0.00 0.01 0.01 3.38 34L BEC58P 0.07 0.00 0.07 0.07 0.00 0.07 0.13 34L CL601 0.29 0.05 0.35 0.03 0.01 0.04 0.39 34L CNA208 0.00 0.00 0.00 0.03 0.00 0.03 0.03 34L CNA441 0.02 0.04 0.07 0.02 0.01 0.03 0.10 34L DHC6 2.10 2.58 4.67 4.12 0.58 4.70 9.37 34L DHC830 11.32 1.77 13.09 13.40 2.04 15.45 28.53 34L EMB145 0.02 0.01 0.03 0.01 0.00 0.01 0.04 34L EMB190 0.51 0.22 0.73 0.11 0.13 0.24 0.97 34L F10062 0.08 0.00 0.08 0.01 0.00 0.01 0.09 34L HS748A 3.62 0.86 4.48 5.14 1.16 6.30 10.78 34L LEAR35 1.15 0.57 1.72 0.67 0.12 0.79 2.51 34L MD11GE 0.84 0.20 1.03 0.75 0.32 1.07 2.10 34L SF340 13.59 1.58 15.16 15.22 4.40 19.62 34.78 34L 139.52 64.98 204.50 106.74 28.66 135.40 339.90
Environmental Services Page 17 February 2018
Report N504
Sydney Airport N504 – 3 Month ANEI 1 Jul– 30 Sep 2017
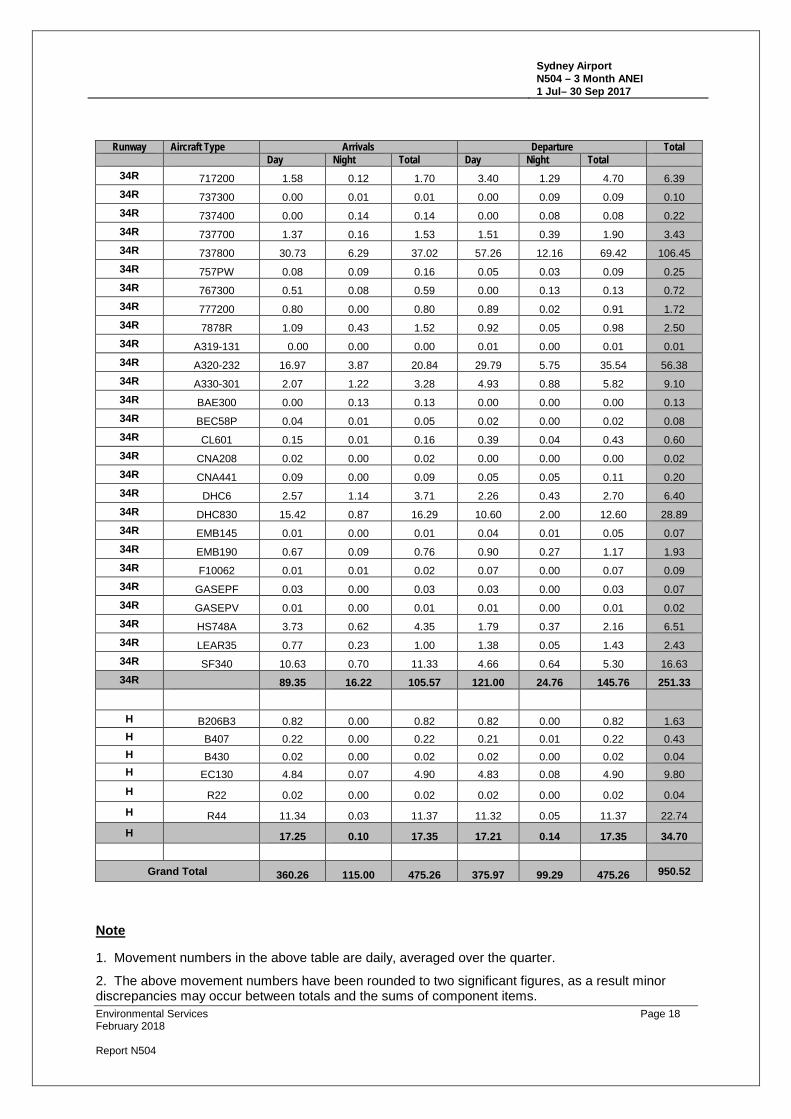
Runway Aircraft Type Arrivals Departure Total Day Night Total Day Night Total
34R 717200 1.58 0.12 1.70 3.40 1.29 4.70 6.39 34R 737300 0.00 0.01 0.01 0.00 0.09 0.09 0.10 34R 737400 0.00 0.14 0.14 0.00 0.08 0.08 0.22 34R 737700 1.37 0.16 1.53 1.51 0.39 1.90 3.43 34R 737800 30.73 6.29 37.02 57.26 12.16 69.42 106.45 34R 757PW 0.08 0.09 0.16 0.05 0.03 0.09 0.25 34R 767300 0.51 0.08 0.59 0.00 0.13 0.13 0.72 34R 777200 0.80 0.00 0.80 0.89 0.02 0.91 1.72 34R 7878R 1.09 0.43 1.52 0.92 0.05 0.98 2.50 34R A319-131 0.00 0.00 0.00 0.01 0.00 0.01 0.01 34R A320-232 16.97 3.87 20.84 29.79 5.75 35.54 56.38 34R A330-301 2.07 1.22 3.28 4.93 0.88 5.82 9.10 34R BAE300 0.00 0.13 0.13 0.00 0.00 0.00 0.13 34R BEC58P 0.04 0.01 0.05 0.02 0.00 0.02 0.08 34R CL601 0.15 0.01 0.16 0.39 0.04 0.43 0.60 34R CNA208 0.02 0.00 0.02 0.00 0.00 0.00 0.02 34R CNA441 0.09 0.00 0.09 0.05 0.05 0.11 0.20 34R DHC6 2.57 1.14 3.71 2.26 0.43 2.70 6.40 34R DHC830 15.42 0.87 16.29 10.60 2.00 12.60 28.89 34R EMB145 0.01 0.00 0.01 0.04 0.01 0.05 0.07 34R EMB190 0.67 0.09 0.76 0.90 0.27 1.17 1.93 34R F10062 0.01 0.01 0.02 0.07 0.00 0.07 0.09 34R GASEPF 0.03 0.00 0.03 0.03 0.00 0.03 0.07 34R GASEPV 0.01 0.00 0.01 0.01 0.00 0.01 0.02 34R HS748A 3.73 0.62 4.35 1.79 0.37 2.16 6.51 34R LEAR35 0.77 0.23 1.00 1.38 0.05 1.43 2.43 34R SF340 10.63 0.70 11.33 4.66 0.64 5.30 16.63 34R 89.35 16.22 105.57 121.00 24.76 145.76 251.33
H B206B3 0.82 0.00 0.82 0.82 0.00 0.82 1.63 H B407 0.22 0.00 0.22 0.21 0.01 0.22 0.43 H B430 0.02 0.00 0.02 0.02 0.00 0.02 0.04 H EC130 4.84 0.07 4.90 4.83 0.08 4.90 9.80 H R22 0.02 0.00 0.02 0.02 0.00 0.02 0.04 H R44 11.34 0.03 11.37 11.32 0.05 11.37 22.74 H 17.25 0.10 17.35 17.21 0.14 17.35 34.70
Grand Total 360.26 115.00 475.26 375.97 99.29 475.26 950.52
Note
1. Movement numbers in the above table are daily, averaged over the quarter.
2. The above movement numbers have been rounded to two significant figures, as a result minor discrepancies may occur between totals and the sums of component items. Environmental Services Page 18 February 2018
Report N504
Sydney Airport N504 – 3 Month ANEI 1 Jul– 30 Sep 2017
Attachment B
ANEI N504 Estimated Population within each ANEI Contour by Suburb
Environmental Services Page 19 February 2018
Report N504
Sydney Airport N504 – 3 Month ANEI 1 Jul– 30 Sep 2017
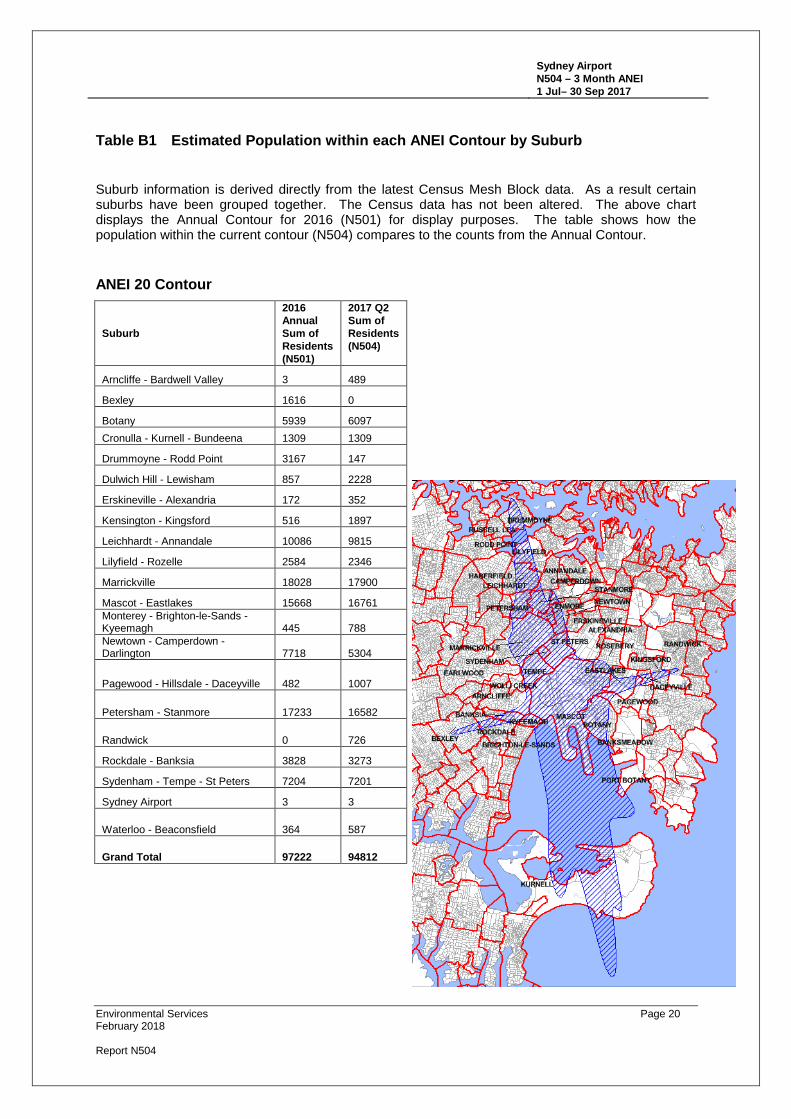
Table B1 Estimated Population within each ANEI Contour by Suburb
Suburb information is derived directly from the latest Census Mesh Block data. As a result certain suburbs have been grouped together. The Census data has not been altered. The above chart displays the Annual Contour for 2016 (N501) for display purposes. The table shows how the population within the current contour (N504) compares to the counts from the Annual Contour.
ANEI 20 Contour
Suburb
2016 Annual Sum of Residents (N501)
2017 Q2 Sum of Residents (N504)
Arncliffe - Bardwell Valley 3 489
Bexley 1616 0
Botany 5939 6097 Cronulla - Kurnell - Bundeena 1309 1309
Drummoyne - Rodd Point 3167 147
Dulwich Hill - Lewisham 857 2228
Erskineville - Alexandria 172 352
Kensington - Kingsford 516 1897
Leichhardt - Annandale 10086 9815
Lilyfield - Rozelle 2584 2346
Marrickville 18028 17900
Mascot - Eastlakes 15668 16761 Monterey - Brighton-le-Sands -Kyeemagh 445 788 Newtown - Camperdown -Darlington 7718 5304
Pagewood - Hillsdale - Daceyville 482 1007
Petersham - Stanmore 17233 16582
Randwick 0 726
Rockdale - Banksia 3828 3273
Sydenham - Tempe - St Peters 7204 7201
Sydney Airport 3 3
Waterloo - Beaconsfield 364 587
Grand Total 97222 94812
Environmental Services Page 20 February 2018
Report N504
Sydney Airport N504 – 3 Month ANEI 1 Jul– 30 Sep 2017
ANEI 25 Contour
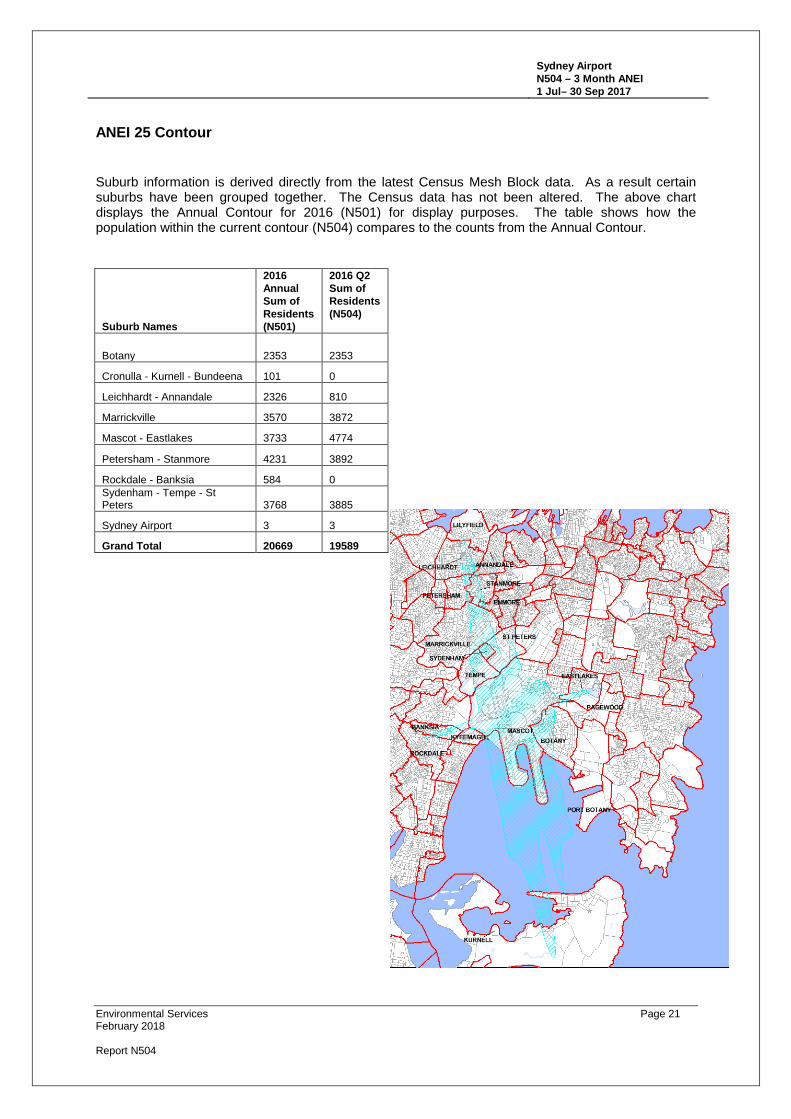
Suburb information is derived directly from the latest Census Mesh Block data. As a result certain suburbs have been grouped together. The Census data has not been altered. The above chart displays the Annual Contour for 2016 (N501) for display purposes. The table shows how the population within the current contour (N504) compares to the counts from the Annual Contour.
Suburb Names
2016 Annual Sum of Residents (N501)
2016 Q2 Sum of Residents (N504)
Botany 2353 2353
Cronulla - Kurnell - Bundeena 101 0
Leichhardt - Annandale 2326 810
Marrickville 3570 3872
Mascot - Eastlakes 3733 4774
Petersham - Stanmore 4231 3892
Rockdale - Banksia 584 0 Sydenham - Tempe - St Peters 3768 3885
Sydney Airport 3 3
Grand Total 20669 19589
Environmental Services Page 21 February 2018
Report N504
Sydney Airport N504 – 3 Month ANEI 1 Jul– 30 Sep 2017
ANEI 30 Contour
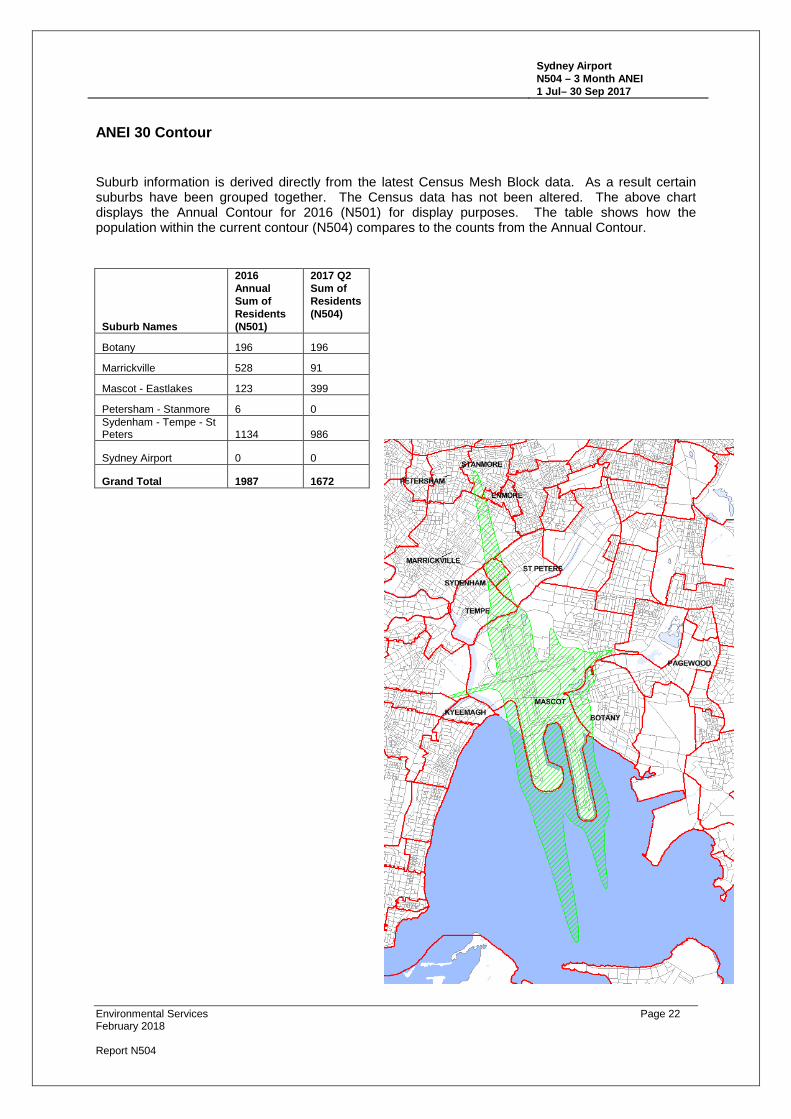
Suburb information is derived directly from the latest Census Mesh Block data. As a result certain suburbs have been grouped together. The Census data has not been altered. The above chart displays the Annual Contour for 2016 (N501) for display purposes. The table shows how the population within the current contour (N504) compares to the counts from the Annual Contour.
Suburb Names
2016 Annual Sum of Residents (N501)
2017 Q2 Sum of Residents (N504)
Botany 196 196
Marrickville 528 91
Mascot - Eastlakes 123 399
Petersham - Stanmore 6 0 Sydenham - Tempe - St Peters 1134 986
Sydney Airport 0 0
Grand Total 1987 1672
Environmental Services Page 22 February 2018
Report N504
Sydney Airport N504 – 3 Month ANEI 1 Jul– 30 Sep 2017
ANEI 35 Contour
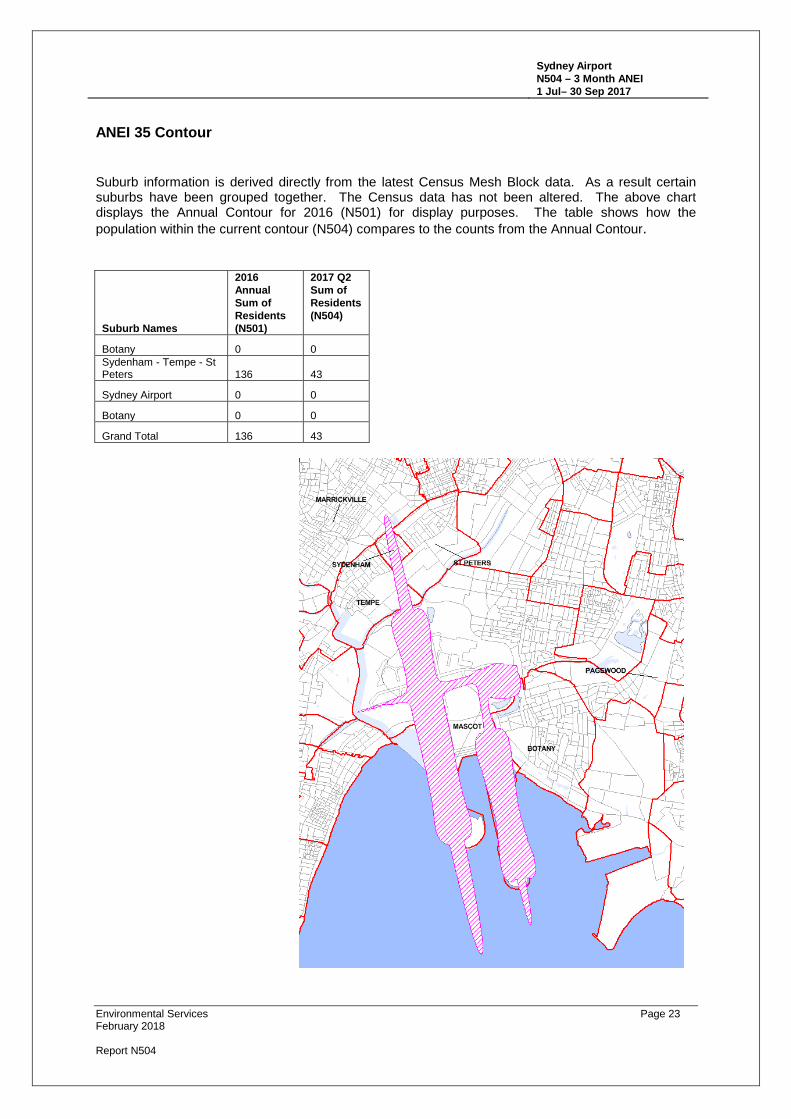
Suburb information is derived directly from the latest Census Mesh Block data. As a result certain suburbs have been grouped together. The Census data has not been altered. The above chart displays the Annual Contour for 2016 (N501) for display purposes. The table shows how the population within the current contour (N504) compares to the counts from the Annual Contour.
Suburb Names
2016 Annual Sum of Residents (N501)
2017 Q2 Sum of Residents (N504)
Botany 0 0 Sydenham - Tempe - St Peters 136 43
Sydney Airport 0 0
Botany 0 0
Grand Total 136 43
Environmental Services Page 23 February 2018
Report N504
Sydney Airport N504 – 3 Month ANEI 1 Jul– 30 Sep 2017
ANEI 40 Contour
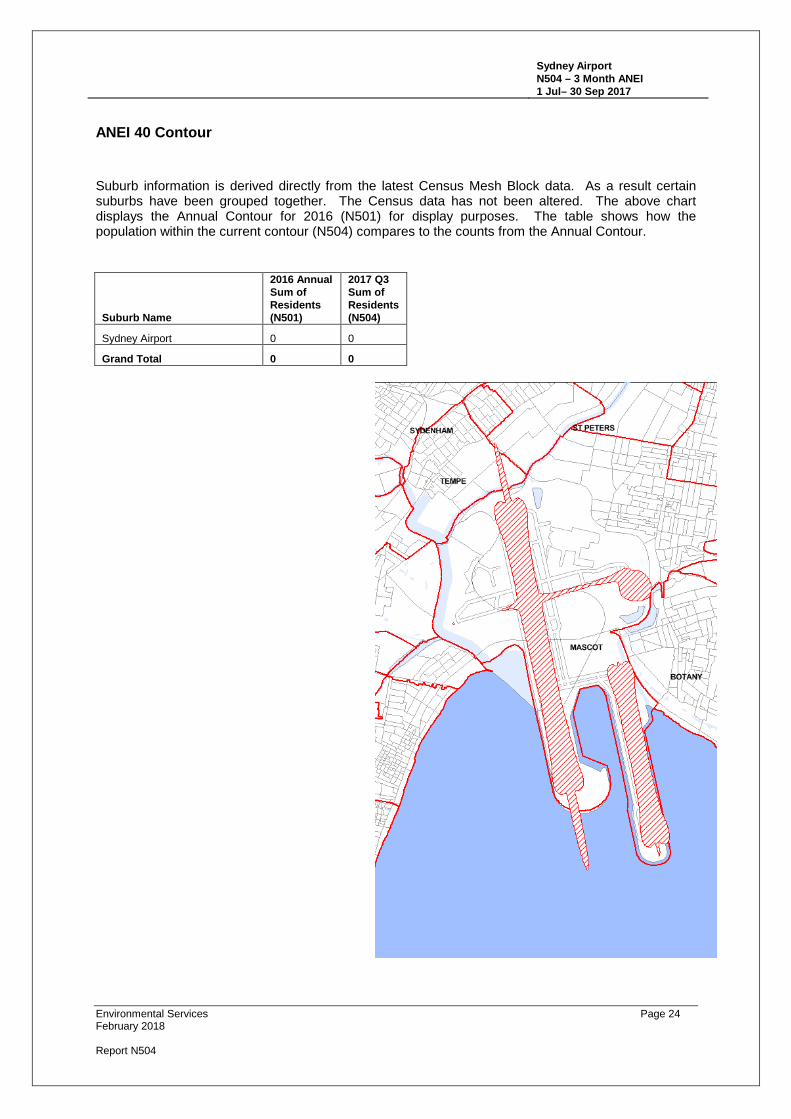
Suburb information is derived directly from the latest Census Mesh Block data. As a result certain suburbs have been grouped together. The Census data has not been altered. The above chart displays the Annual Contour for 2016 (N501) for display purposes. The table shows how the population within the current contour (N504) compares to the counts from the Annual Contour.
2016 Annual Sum of
2017 Q3 Sum of
Residents Residents Suburb Name (N501) (N504)
Sydney Airport 0 0
Grand Total 0 0
Environmental Services Page 24 February 2018
Report N504
Sydney Airport N504 – 3 Month ANEI 1 Jul– 30 Sep 2017
Attachment C
ANEI N504 Contours with INM Terrain Contours
Sydney Airport 1 July 2017 to 30 September 2017
Environmental Services Page 25 February 2018
Report N504
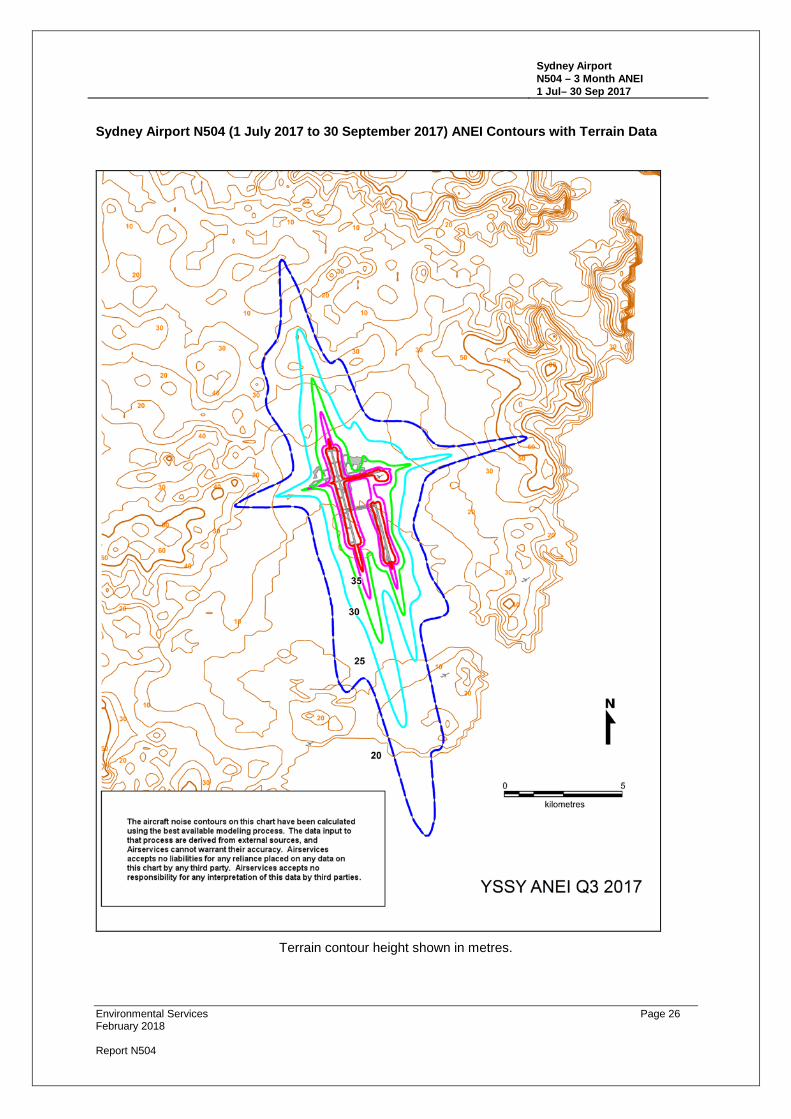
The aircraft noise contours on this chart have been calculated using the best available modellng process. The data Input to that process are derived from external sources, and Airserv ices cannot warrant their accuracy. Airservices accepts no llablllt les for any reliance placed on any data on this chart by any third party. Airservlces accepts no responsibility for any Interpretation of this data by third parties .
N
t 0 5
kilometres
YSSY ANEI Q3 2017
Sydney Airport N504 – 3 Month ANEI 1 Jul– 30 Sep 2017
Sydney Airport N504 (1 July 2017 to 30 September 2017) ANEI Contours with Terrain Data
Terrain contour height shown in metres.
Environmental Services Page 26 February 2018
Report N504
Sydney Airport N504 – 3 Month ANEI 1 Jul– 30 Sep 2017
Attachment D
ANEI N504 Contours
Sydney Airport 1 July 2017 to 30 September 2017
The contours for ANEI N504 have been prepared using terrain data.
Environmental Services Page 27 February 2018
Report N504
t
The aircraft noise contours on this chart have been calculated using the best available modeling process. The data Input to that process are derived from external sources 1 a.nd Afrservices cannot warrant their accuracy. Airservices accepts no llabllltles for any reliance placed on any data on this chart by any third party. Alrservlces accepts no responsibility tor any interpretation of this data by third parties.
20
N
t 0 5
kilometres
YSSY ANEI Q3 2017
Sydney Airport N504 – 3 Month ANEI 1 Jul– 30 Sep 2017
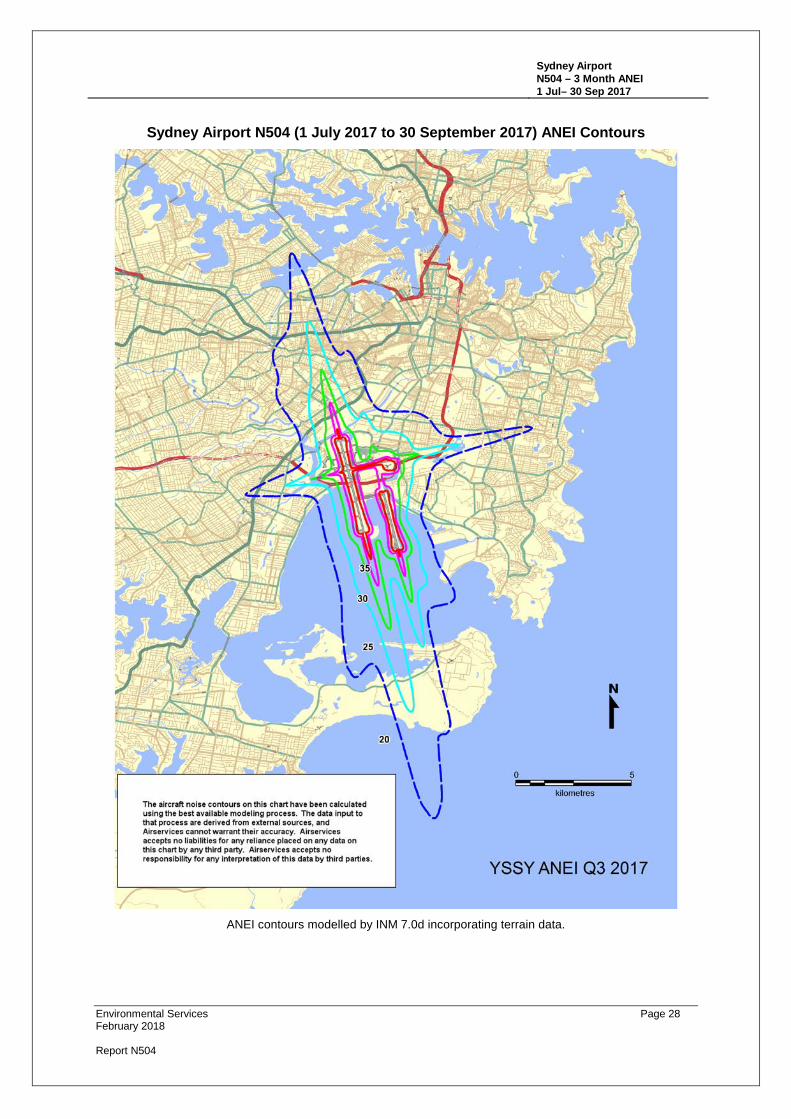
Sydney Airport N504 (1 July 2017 to 30 September 2017) ANEI Contours
ANEI contours modelled by INM 7.0d incorporating terrain data.
Environmental Services Page 28 February 2018
Report N504
Sydney Airport N504 – 3 Month ANEI 1 Jul– 30 Sep 2017
Attachment E
ANEI N499 Contours
Sydney Airport 1 July 2016 to 30 September 2016
The contours for ANEI N499 have been prepared using terrain data.
Environmental Services Page 29 February 2018
Report N504
The aircraft noise contours on this chart have been calculated using the best available modellng process. The data Input to that process are derived rrom external sources, and Alrserv lces ca.nnotwarrant thei r accuracy. Alrservlces acce pts no liabilities for any reliance placed on any data on this chart by any third party. Alrserv lces accepts no responsibility for any Interpretation of th is data by third parties.
I I I I I I I I _,
I I I I I I I
\ I \ I , ....
0 5
kilometres
YSSY ANEI Q3 2016
Sydney Airport N504 – 3 Month ANEI 1 Jul– 30 Sep 2017
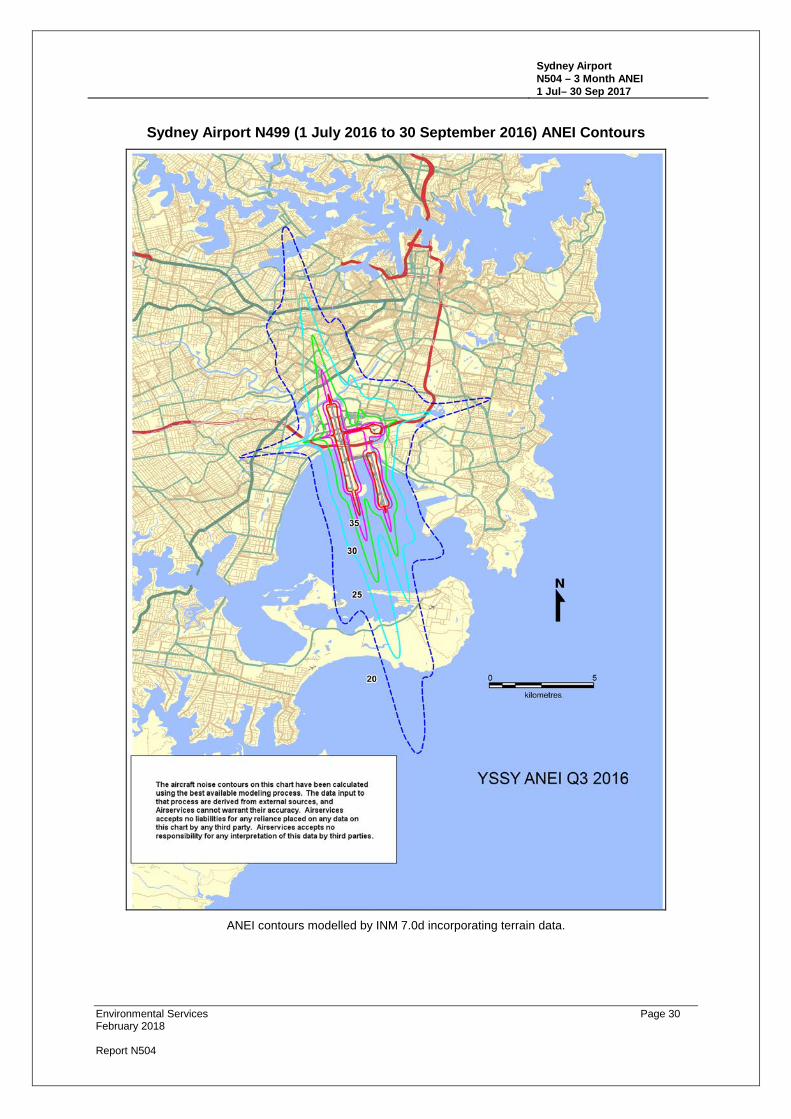
Sydney Airport N499 (1 July 2016 to 30 September 2016) ANEI Contours
ANEI contours modelled by INM 7.0d incorporating terrain data.
Environmental Services Page 30 February 2018
Report N504
Sydney Airport N504 – 3 Month ANEI 1 Jul– 30 Sep 2017
Attachment F
N504 N70 Chart
Sydney Airport 1 July 2017 to 30 September 2017
Environmental Services Page 31 February 2018
Report N504
Number of Noise Events Over 70 dB(A) N504 - 200 -300 - 100 · 200
- 50 -100
~ 40- 50
- 30 - 40 20 - 30
~ 10 - 20
0 i-
kilo meters
Sydney Airport N504 – 3 Month ANEI 1 Jul– 30 Sep 2017
Sydney Airport N504 (1 July 2017 to 30 September 2017) N70 Chart
YSSY Q3 2016 N70
Daily average number of aircraft noise events louder than 70 dB(A).
Environmental Services Page 32 February 2018
Report N504