sydney airport advises that on 18 january 2018 foreign financial circumstances and consult an...
TRANSCRIPT


This presentation has been prepared by Sydney Airport
Limited (ACN 165 056 360) (“SAL”) in respect of ASX-
listed Sydney Airport (“SYD”). SYD is comprised of the
stapled entities SAL and Sydney Airport Trust 1 (ARSN
099 597 921) (“SAT1”). The Trust Company (Sydney
Airport) Limited (ACN 115 967 087/AFSL 301162)
(“TTCSAL”) is the responsible entity of SAT1.
This presentation is not an offer or invitation for
subscription or purchase of or a recommendation
of securities. It does not take into account the
investment objectives, financial situation and particular
needs of the investor. Before making an investment in
SYD, the investor or prospective investor should
consider whether such an investment is appropriate
to their particular investment needs, objectives and
financial circumstances and consult an investment
adviser if necessary.
Information, including forecast financial information,
in this presentation should not be considered as a
recommendation in relation to holding, purchasing or
selling shares, securities or other instruments in SYD or
any other entity. Due care and attention has been used
in the preparation of forecast information. However,
actual results may vary from forecasts and any variation
may be materially positive or negative. Forecasts by
their very nature are subject to uncertainty and
contingencies, many of which are outside the control of
SAL and TTCSAL. Past performance is not a reliable
indication of future performance.
Sydney Airport advises that on 18 January 2018 foreign
ownership was 28.4%.
Disclaimer
General securities warning

Highlights
3
Results at a glance
SYDNEY AIRPORT | FULL YEAR RESULTS 2017 * Excluding WSA and business acquisition costs.

Strong growth across the business
Our strategy is delivering sustainable results across all businesses
4SYDNEY AIRPORT | FULL YEAR RESULTS 2017

Initial thoughts after first five weeks
5
Initial observations
SYDNEY AIRPORT | FULL YEAR RESULTS 2017

Strong passenger growth
6
Sydney Airport has successfully competed internationally to attract airlines and
grow inbound tourism, driving significant economic growth for NSW and Australia
PASSENGERS BY GEOGRAPHY
6SYDNEY AIRPORT | FULL YEAR RESULTS 2017

Significant capacity additions sustaining
international traffic growth
7
Substantial additional capacity and high load factors delivering sustained growth
0
50,000
100,000
150,000
0.0%
2.0%
4.0%
6.0%
8.0%
10.0%
12.0%
14.0%
Jan Feb Mar Apr May Jun Jul Aug Sep Oct Nov Dec
Incre
menta
l m
onth
ly c
apacity
Month
ly p
assenger
gro
wth
2017 monthly international passenger growth 2017 monthly international passenger growth
75.5%
76.2%76.5%
77.7%78.3%
79.1%
2012 2013 2014 2015 2016 2017
375
245
52
48
47
30
28
26
24
18
0 50 100 150 200 250 300 350 400
Australia
China
India
USA
South Korea
Philippines
Vietnam
United Kingdom
New Zealand
Indonesia
Thousand passengers
2017 international passenger growth and capacity additions Load factors across domestic and international have increased over
the past 5 years
Largest nationality growth in 2017 by absolute passenger numbers (‘000)*
7SYDNEY AIRPORT | FULL YEAR RESULTS 2017
* Includes the period 1 January 2017 to 22 December 2017 as PCP data not available
37%
19%
17%
16%
12%
10%
6%
6%
5%
5%
0% 5% 10% 15% 20% 25% 30% 35% 40%
Vietnam
Philippines
China
India
South Korea
Indonesia
USA
Australia
Thailand
Germany
Fastest growing nationalities in 2017*

60% of our growth in 2017 was off-peak*
40%
60%
Seats commenced in 2017
Peak growth Off peak growth
8
Increasingly our shoulder periods are filling out and airlines are filling the off-peak slots
Off-peak growth
• Beijing, Qantas
• Hanoi, Vietnam Airlines
• Dubai, Emirates
• Taipei, China Airlines
• Auckland, Qantas
• Apia, Samoa Airways
• Doha, Qatar Airways (Departure)
• Ho Chi Minh, Jetstar (Departure)
• Abu Dhabi, Etihad (Departure)
• Denpasar Bali, Qantas (Arrival)
Peak growth
• Wuhan, China Eastern
• Hong Kong, Cathay Pacific
• Qingdao, Beijing Capital
• Seoul, Asiana
• Doha, Qatar Airways (Arrival)
• Ho Chi Minh, Jetstar (Arrival)
• Abu Dhabi, Etihad (Arrival)
• Denpasar Bali, Qantas
(Departure)
• Jakarta, Garuda
• Manila, Cebu Pacific
• Seoul, Korean Air
• Osaka, Qantas
*International peak is defined as 6am to 12pm
SYDNEY AIRPORT | FULL YEAR RESULTS 2017
Off peak growth Peak growth

Next generation aircraft at Sydney Airport
In 2017, SYD was the 11th busiest airport in the world for next generation
aircraft movements, and 9th in terms of seats
* Includes Airbus A380, Boeing 787 and Airbus A350 (including variants)
International next generation operations at
Sydney Airport
Currently, 21 airlines are operating next generation
aircraft
• 25% of all scheduled international movements
• 452 next generation movements per week
• average seat configuration of 383 seats – 33% higher
than the overall international average
Since 2010, legacy four engine aircraft (B747/A340)
numbers have reduced 68%, from an average 38
movements per day to under 15 movements per day
In 2017, SYD was the 11th busiest airport in the world
for next generation aircraft movements, and 9th in
terms of seats*
3 3 3
67
14
17
21
5%7% 7%
9%
11%
15%
19%
25%
0%
5%
10%
15%
20%
25%
0
5
10
15
20
25
2010 2011 2012 2013 2014 2015 2016 2017
% o
f In
tern
ational
movem
ents
on n
ext
genera
tion a
ircra
ft
Airlin
es
Sydney Airport next generation aircraft operations
Noise profile of legacy and new generation aircraft
9SYDNEY AIRPORT | FULL YEAR RESULTS 2017
Source:OAG

Distribution
2018 distribution guidance provided of 37.5 cents, an 8.7% increase on 2017
2012 2013 2014 2015 2016 2017 2018
First half Second half Guidance
Distributions Consistent distribution growth
2017 distribution of 34.5 cents per stapled security
• Final distribution of 18.0 cents paid 14 February 2018
• 100% covered by Net Operating Receipts
2018 guidance of 37.5 cents per stapled security
• 8.7% growth on the 2017 distribution
• Expected to be fully covered by Net Operating Receipts
• Guidance subject to aviation industry shocks and
material forecast changes
Distribution per stapled security
10SYDNEY AIRPORT | FULL YEAR RESULTS 2017
31.0¢
25.5¢23.5¢
22.5¢21.0¢
34.5¢
37.5¢

Financial results

BUSINESS 2017 HIGHLIGHTSREVENUE
$M
REVENUE
CONTRIBUTION
REVENUE
GROWTH
• 3.6% total passenger growth and 7.2% international
• Opening new and underserved markets
• Strong international capacity and load factor growth continuing
• Significant capital investment program supporting passenger experience, airline
operating efficiencies and capacity expansion to meet demand
761.91
• Duty free delivering strong growth with standout performance in core categories
liquor, perfume and cosmetics
• All three terminals fully leased with continued strong retailer demand for space
• Delivering a superior passenger experience with continued focus on value,
range and choice, proven via strong retail sales, passenger satisfaction scores
and positive sentiment
• Completion of The T1 Marketplace precinct and Pier C food offering
333.1
• Approximately 220 leasing transactions completed in 2017; Property portfolio
has over 650 leases and continues to grow providing increasing facilities for our
passengers and airline customers
• Mantra Hotel opened, Ibis Budget acquired in July 2017 with both performing
strongly
• Property portfolio occupancy 99%
221.4
• Five year ground transport works very close to completion, nine months ahead
of schedule, delivering reduced congestion and improved circulation
• New car parking products performing well; Priority pick-up and ride sharing
areas delivering improved circulation and revenue growth
• 1000 new international car park spaces delivered in Q4 2017
159.5
Aeronautical
services
Retail
Property, hotels and
car rental
Parking and
ground transport
8.6%
12.7%
8.4%
2.2%
51%
11%
15%
23%
Operational growth
1. Includes aeronautical security recovery
All business units delivering strong performance. Total revenue up 8.7% year
on year
12SYDNEY AIRPORT | FULL YEAR RESULTS 2017

$ MILLIONS 2017 2016
Total revenue and other income 1,483.4 1,364.6
Total operating expenses (284.5) (257.8)
WSA project costs expensed and business acquisition costs (2.5) (21.1)
EBITDA 1,196.4 1,085.7
Depreciation and amortisation (385.7) (356.5)
Profit before net finance costs and income tax (EBIT) 810.7 729.2
Net finance costs (421.6) (409.0)
Profit before income tax expense 389.1 320.2
Income tax expense (40.5) (0.6)
Profit after income tax expense 348.6 319.6
Add back: Profit attributable to non-controlling interests 1.2 1.3
Net profit attributable to security holders 349.8 320.9
Statutory income statement
Strong EBITDA growth and finance cost management
driving statutory income
13SYDNEY AIRPORT | FULL YEAR RESULTS 2017

Profit to net operating receipts reconciliation
Distribution is fully covered by Net Operating Receipts
$ MILLIONS 2017 2016
Profit before income tax expense 389.1 320.2
Add back: depreciation and amortisation 385.7 356.5
Profit before tax, depreciation and amortisation 774.8 676.7
Add/(subtract) non-cash expenses - Capital indexed bonds capitalised 24.0 10.5
- Amortisation of debt establishment costs 16.0 27.4
- WSA costs expensed and business acquisition costs 2.5 21.0
- Borrowing costs capitalised (9.3) (9.6)
- Change in fair value of swaps 0.2 (22.0)
Total non-cash expenses 33.4 27.3
Add/(subtract) other cash movements - Movement in cash balance with restricted use 13.6 12.3
- Other (32.0) (20.3)
Total other cash movements (18.4) (8.0)
Net operating receipts 787.3 675.0
Net operating receipts (excluding WSA and business acquisition costs) 789.8 696.0
Average stapled securities on issue (m) 2,250.5 2,237.4
Net operating receipts per stapled security (cents) 35.0 30.2
Net operating receipts per stapled security (excluding WSA) (cents) 35.1 31.1
Distributions declared per stapled security (cents) 34.5 31.0
14SYDNEY AIRPORT | FULL YEAR RESULTS 2017

5.6x
6.0x
6.4x
6.8x
7.2x
7.6x
2.0x
2.4x
2.8x
3.2x
3.6x
4.0x
2013 2014 2015 2016 2017
Capital management update
Strong interest coverage and credit metrics improving
1. Debt metrics and ratios calculated for SCACH in line with finance documents
2. Includes SAL bilateral debt facility and Sydney Airport Group cash
3. Excludes EBITDA in relation to the Ibis Budget hotel for 3Q 2017 given transitional
treatment as an Excluded Subsidiary under finance documents (2017)
4. Excludes WSA project costs expensed (2016)
5. Excludes capitalised interest, fair value of swaps and amortisation of debt establishment and other costs
Net debt2 $8.0b
CFCR3 3.0x
Net debt / EBITDA3 6.7x
Credit rating BBB (positive) / Baa1 (stable)
Next drawn maturity Mid-2018
Average maturity Early-2024
Average cash interest rate5 4.9%
Spot interest rate hedge position 93% (incl. bank debt)
6.7x
3.0x
Temporary increase due to T3 drawdown
Net debt / EBITDACFCR
31 December 2017 Metrics1
Debt Maturity Profile
CFCR1,3,4 and Net debt / EBITDA1,3,4
Average Maturity$m
15
548
100
7
380 450
742
200
750
100 -
217
519
317
1,2971,199 1,200
802
1,033
643
1,163
659
438
136
390
0
250
500
750
1,000
1,250
1,500
2018 2019 2020 2021 2022 2023 2024 2025 2026 2027 2028 2029 2030
Drawn Bank Undrawn Bank Domestic Wrapped Bonds Domestic Unwrapped Bonds Offshore Bonds

100% 100% 100% 100% 100% 100% 100% 100% 100% 100%
79%
100% 100%
0%
20%
40%
60%
80%
100%
2017 2018 2019 2020 2021 2022 2023 2024 2025 2026 2027 2028 2029 2030
Capital market interest rate hedging1
Interest rate and currency risk management
Proactive approach in managing interest rate and currency risk
Interest rate and currency risk management
• Proactive approach in managing interest rate and currency risk
• Interest rate hedging profile right-sized with $3.3b of swap executions over 2017
• 93% of interest rate risk on all debt hedged as at 31 December 2017
• 98% of interest rate risk on all capital markets debt hedged on average to 31 December 2030
• 100% of currency risk on all debt hedged
16
1. Existing capital markets debt hedged at the end of each calendar year
SYDNEY AIRPORT | FULL YEAR RESULTS 2017

Investing for growth, $428.5m invested in 2017
Invested more than $1 million per day on aviation infrastructure and customer facilities
17SYDNEY AIRPORT | FULL YEAR RESULTS 2017

Capex outlook
Investing for future growth and expected strong international passenger numbers.
Capex guidance for 2018-2021 $1.3-1.5b
Capex
• Capex guidance expected to be $1.3-1.5 billion over
four years 2018-2021
• Capex guidance for 2018 expected to be between
$380-420 million
• Capex guidance includes the additional $500 million,
contemplated for additional international aeronautical
growth projects
• Continued strong international passenger growth
requires additional aeronautical facilities to
accommodate new and existing services
18SYDNEY AIRPORT | FULL YEAR RESULTS 2017
Capex projects included in 2018
• New flyover entry into International precinct
• New exit road from International
• Widening of road from M5 to International
• New digital wayfinding gantries to improve
traffic flow
• T2 Pier B retail stores
• T1 Pier C expansion
• Gate lounge improvements
• Baggage carousel replacement/refurbishment
program
• Check-in counter and auto bag-drop development
• Resurfacing runways
• Apron expansion
• New airfield lighting
• Gate expansion commencement
• IBIS Budget expansion
• Expression of interest for new potential 430 room
Domestic hotel
• New solar panels
Strategic initiatives driving our growth

Our partnership approach drives international
passenger growth
20
Using an analytical approach to identify and target underserved markets,
while collaborating with our tourism partners has been successful in
delivering new passenger growth to the Airport, Sydney and NSW
Factors considered when analysing potential new
markets
1. Current passenger movements
2. Economic conditions in country of origin
3. Existing networks and timing
4. Fleet deliveries
5. Will the Australian market support the destination
with tourism, business, visiting friends and
relatives and education
Identify target markets, carriers, and then prioritise
targets by the opportunity
Target markets
Asia
• India
• Vietnam
• South Korea
• China
The Americas
• Secondary
US cities
• Canada
• Brazil
• Argentina
• ChileSYDNEY AIRPORT | FULL YEAR RESULTS 2017

Investing in efficient infrastructure, driving cost
reduction and improved passenger experience
Our biometrics process has the potential to revolutionise the passenger journey
through our airport
2121SYDNEY AIRPORT | FULL YEAR RESULTS 2017

Customers responding positively to initiatives
and investment
22
On a regular basis, our customers are asked what they thought of their airport
experience and how we can improve
Customers tell us that some of the key drivers of
satisfaction are ambience, cleanliness and wayfinding
22SYDNEY AIRPORT | FULL YEAR RESULTS 2017
Expanded terminal areas and facilities
• Self check-in and auto bag-drop
• Gate lounge refurbishment
• Increased retail with focus on value and choice
• Improved dwell spaces and terminal ambience
• Improved seating and facilities
• Increased natural light
Digital solutions
• More personalised flight information to your
device
• Baggage carousel wait times
• Smart airport - connectivity and real-time
reactivity, informing landside and airside
operations

Improving access to the airport is one of our
core priorities
Access to and from the airport is of paramount importance to the experience of
our passengers and stakeholders
Enhancing airport access for our customers
• All projects in five year Ground Transport plan will be
delivered in April, 9 months ahead of schedule
• Five lanes in/out of Domestic
• New exit and entry roads to/from International
• Elevated pedestrian and cycle path at International
• Five lane entry and exit to/from Domestic
• New state-of-the-art gantry signage at Domestic and
International
• New flyover entry to International will be delivered by
Q2 2018
NSW government works will have a staged completion
over 2018-2019
Continue to advocate for more public transport choice
and value
Next five year Ground Transport plan will be delivered
in August 2018
23SYDNEY AIRPORT | FULL YEAR RESULTS 2017

Hotels represent a potential growth opportunity,
we see significant demand for on airport rooms
Opportunity for an extra 1,000 rooms today and growing to a potential 1,500
rooms at the point we reach 48 million passengers
Based on forecast modelling of 100 rooms per 1 million passengers, assumes number of rooms in the surrounding area remains constant
24SYDNEY AIRPORT | FULL YEAR RESULTS 2017
2,602 2,602 2,602 2,602 2,602 2,602
655 655 655 655 655 655
1,043 1,143 1,243 1,343 1,443 1,543
2,000
2,500
3,000
3,500
4,000
4,500
5,000
RoomsHotel room opportunities
for each additional million passenger
Off-airport hotel On-airport hotel Room opportunity

Sustainability leadership
Sydney Airport rated a global sustainability leader. Sustainability is driving
positive outcomes for the business and our stakeholders
25SYDNEY AIRPORT | FULL YEAR RESULTS 2017

Deepened commitment to Sydney
and our community
26
A strengthened commitment to and investment in the community,
the environment, sport and the arts
Keeping local communities
connected, healthy, vibrant
and thriving
Be the best you can be
in your field. Supporting the
leaders of tomorrow
An airport that embraces
and showcases Sydney’s best.
Instilling pride in Sydney's airport
SYDNEY AIRPORT | FULL YEAR RESULTS 2017

Outlook

Outlook
Excellent traffic growth, strong business performance and positive macro
tailwinds underpin a positive outlook
Key 2018 focus areas
• Continue to maximise our core business
• Grow new business opportunities
• Enhance the culture including strengthening our
focus on the customer
Guidance
• 2018 distribution guidance of 37.5c per stapled
security
• Four year investment guidance of $1.3-1.5b
supported by aeronautical charges and strong
international passenger growth
• 2018 capex guidance $380-$420m
28SYDNEY AIRPORT | FULL YEAR RESULTS 2017

Questions

Appendix

Investment merits
99 year leasehold • Lease until 2097
Catchment area • 7.5m Sydney and NSW catchment population
Strong passenger
growth profile• Sydney is both a business and tourism hub, in a growing NSW economy
• Strong visiting friends and relatives, education and tourism market
• Strong Asian connections – increasing urbanisation
International passengers • Account for ~70% of passenger driven revenues
• Represent 15% of slots
Commercial opportunities • Substantial growth opportunities
• Minimum guarantees offer downside protections
• Strict hurdle rates of return apply to all investment
Light handed
regulatory framework• Commercially negotiated charges agreements with all airlines include investment, price and service levels
• Light handed regulatory framework supports dual till principle
Outsourced model • Controllable operating costs contracted and traffic relatively inelastic
Consistent growth and downside
protections• Long term contracts with airlines and tenants
• CPI or higher escalation on commercial revenues
• Growth initiatives across all businesses
Sydney Airport is one of the world’s highest quality
airport investments
31SYDNEY AIRPORT | FULL YEAR RESULTS 2017

Sydney Airport’s contribution
Economic activity $38.0 billion contributed in economic activity per annum, equivalent to 6.8% of the NSW economy
Jobs generated 338,500 jobs generated or facilitated, equivalent to 10% of NSW employment
Freight $17.6 billion of freight exports facilitated
Visitor nights International visitors arriving in Sydney spent 108 million nights in Australia in 2017
Trip expenditure for average
international visitor$2,778 per visitor
Household income $19.9 billion contributed to household incomes
Average airport wages Average FTE wage of an employee working in the Sydney Airport precinct is 12% higher than NSW average
Typical daily international flight
service$122 million contributed to the Australian economy from a typical daily international service to Sydney
Source: Deloitte Access Economic (2017)
Sydney Airport is a major generator of economic activity and jobs
32SYDNEY AIRPORT | FULL YEAR RESULTS 2017
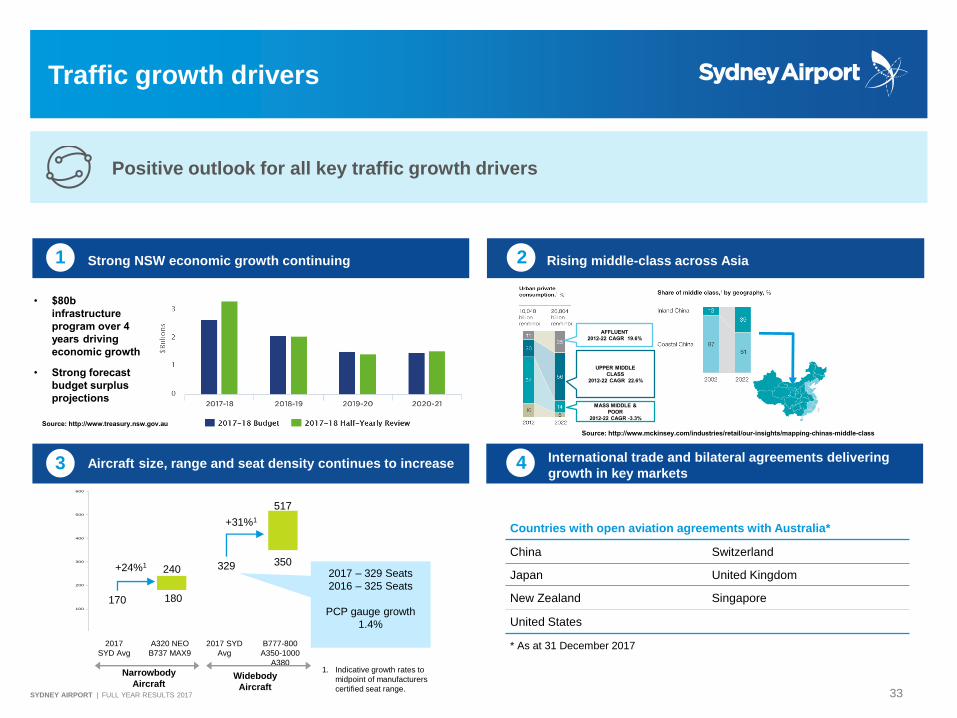
Traffic growth drivers
Positive outlook for all key traffic growth drivers
Strong NSW economic growth continuing1
Aircraft size, range and seat density continues to increase3 International trade and bilateral agreements delivering
growth in key markets4
2 Rising middle-class across Asia
1. Indicative growth rates to
midpoint of manufacturers
certified seat range.
0
100
200
300
400
500
600
B777-800
A350-1000
A380
2017 SYD
Avg
A320 NEO
B737 MAX9
2017
SYD Avg
Narrowbody
AircraftWidebody
Aircraft
240
180170
329 350
517
+24%1
+31%1
2017 – 329 Seats
2016 – 325 Seats
PCP gauge growth
1.4%
• $80b
infrastructure
program over 4
years driving
economic growth
• Strong forecast
budget surplus
projections
AFFLUENT
2012-22 CAGR 19.6%
UPPER MIDDLE
CLASS
2012-22 CAGR 22.6%
MASS MIDDLE &
POOR
2012-22 CAGR -3.3%
Source: http://www.mckinsey.com/industries/retail/our-insights/mapping-chinas-middle-class
Source: http://www.treasury.nsw.gov.au
3333SYDNEY AIRPORT | FULL YEAR RESULTS 2017
Countries with open aviation agreements with Australia*
China Switzerland
Japan United Kingdom
New Zealand Singapore
United States
* As at 31 December 2017

Long term traffic growth
0
5
10
15
20
25
30
35
40
45
1990 1991 1992 1992 1993 1994 1995 1996 1997 1998 1999 2000 2001 2002 2003 2004 2005 2006 2007 2008 2009 2010 2011 2012 2013 2014 2015 2016 2017
Annual P
ax (
Mill
ions)
International Domestic & Regional Total
Resilient passenger growth across all economic cycles and events
34SYDNEY AIRPORT | FULL YEAR RESULTS 2017

Passenger mix and capacity are
the important growth drivers
International passenger growth is forecast to continue to outpace domestic growth
20
27
10
16
0
10
20
30
40
50
60
2006 2017 2026
Passengers (m pax)
Domestic International
~60%
International
growth
+35%
domestic
growth
2039
Master Plan
forecasts
based on
latest views
on int’l and
domestic
growth
Domestic/
int’l pax
mix will
reflect the
two-airport
system
post-2026
International now 37% of total passengers; expected to continue to
outpace domestic growth; delivering high value to Sydney Airport
and the economy
High value international aircraft utilise just 15% of slots but
international passengers drive 70% of our passenger related
revenues (aero and retail)
* Includes General Aviation movements without slot tenure (2-3% of slots).
35SYDNEY AIRPORT | FULL YEAR RESULTS 2017

Highly diversified passenger and destination mix
Diverse purpose of travel of Sydney
Airport’s international visitors (%)
OtherChinaNew ZealandUSAUKKoreaJapanSingaporeHong KongIndiaCanadaGermanyMalaysiaIndonesiaFrance
OtherUSANew ZealandIndonesiaChinaUKFijiThailandJapanSingaporeIndiaHong KongPhilippinesVietnamCanadaItaly
Foreign residency
breakdown (%)
Australian destination
breakdown (%)
1. Source: DIAC, data recorded by residency and final destination – 12 Months to May 2017
(9)
(8)
(6)
(6)
(4)
(3)
(2)
(2)
(1)
(2)
(1)
(1)
(1)
(1)
(1)
(23)
(15)
(13)
(7)
(6)
(6)
(5)
(5)
(3)
(3)
(3)
(3)
(2)
(3)
(2)
(2)
Significant diversity in airlines, passengers and
destinations served by Sydney Airport
36SYDNEY AIRPORT | FULL YEAR RESULTS 2017
(1)
48%
52%
48%
23%
4
16
9
Holiday
VFR (visiting friends & relatives)
Other
Business
Education
%
%
%
India (2)
Hong Kong (1)
Other China New Zealand USA UK Korea Japan Singapore
Canada Germany Malaysia Indonesia France Philippines
(9)
(8)
(6)
(6)
(4)
(3)
(2)
(2)
(1)
(1)
(1)
(1)
(1)
(1)
India (2)
Hong Kong (1)
Other USA New Zealand Indonesia China UK Fiji Thailand Japan Singapore India Hong Kong Philippines Vietnam Canada Italy
(23)
(15)
(13)
(7)
(6)
(6)
(5)
(5)
(3)
(3)
(3)
(3)
(2)
(3)
(2)
(2)
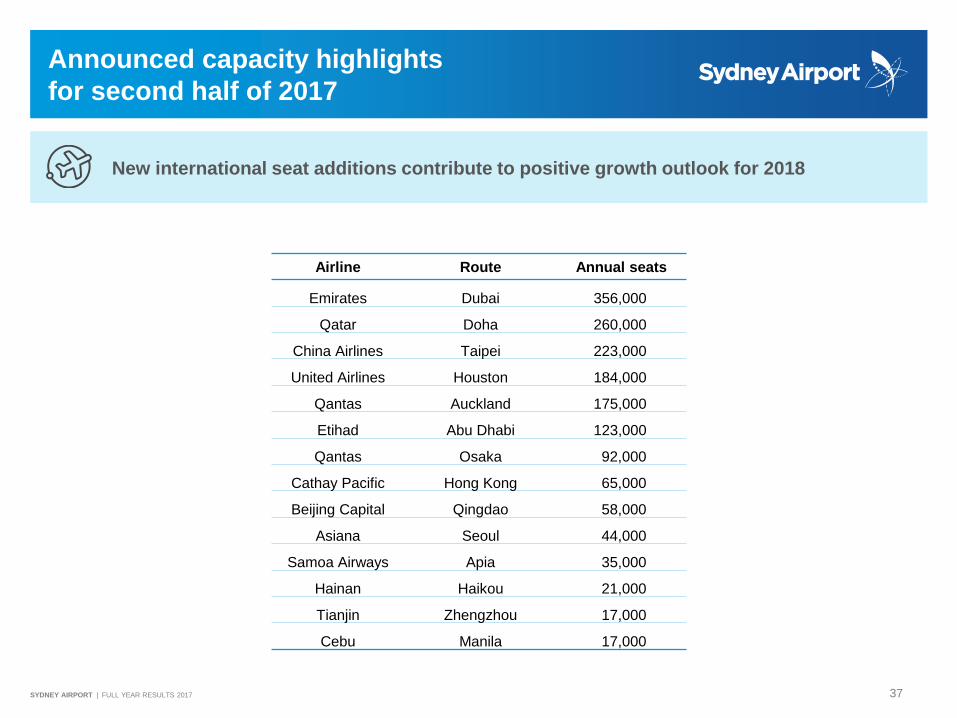
Announced capacity highlights
for second half of 2017
New international seat additions contribute to positive growth outlook for 2018
Airline Route Annual seats
Emirates Dubai 356,000
Qatar Doha 260,000
China Airlines Taipei 223,000
United Airlines Houston 184,000
Qantas Auckland 175,000
Etihad Abu Dhabi 123,000
Qantas Osaka 92,000
Cathay Pacific Hong Kong 65,000
Beijing Capital Qingdao 58,000
Asiana Seoul 44,000
Samoa Airways Apia 35,000
Hainan Haikou 21,000
Tianjin Zhengzhou 17,000
Cebu Manila 17,000
37SYDNEY AIRPORT | FULL YEAR RESULTS 2017

Thank you