swri_fuelcompositiontestingusingseries50gnaturalgasengines
DESCRIPTION
fuel compositionTRANSCRIPT

SwRI® 11657
FUEL COMPOSITION TESTING USING DDC SERIES 50G NATURAL GAS ENGINES
Prepared By
Michael D. Feist
Final Report
Prepared For
Southern California Gas Company 555 West Fifth Street
Los Angeles, CA 90013
August 2006

SOUTHWEST RESEARCH INSTITUTE® P.O. Drawer 28510 6220 Culebra Road
San Antonio, Texas 78228-0510
FUEL COMPOSITION TESTING USING DDC SERIES
50G NATURAL GAS ENGINES
Prepared By
Michael Feist
Final Report
Prepared for
Southern California Gas Company 555 West Fifth Street
Los Angeles, CA 90013
August 2006
Prepared by: Reviewed by: ______________________________ _________________________________ Michael D. Feist, Terry L. Ullman, Research Engineer Assistant Director of Research Department of Engine and Emissions Department of Engine and Emissions Research Research Approved by: ______________________________ Daniel W. Stewart, Director of Research Department of Engine and Emissions Research
DEPARTMENT OF ENGINE AND EMISSIONS RESEARCH ENGINE, VEHICLE, AND EMISSIONS RESEARCH DIVISION
This report shall not be reproduced, except in full, without the written approval of Southwest Research Institute®. Results and
discussion given in this report relate only to the test items described in this report.

Report 11657 ii
FOREWORD The work covered by this final report was performed for Southern California Gas Company (So Cal Gas) in response to SwRI Proposal 03-43390A, dated July 5, 2005. The purpose of this project was to evaluate engine performance and emission levels of Detroit Diesel Corporation (DDC) Series 50G MK and Series 50G TK engines when operated on natural gas blends of varying methane number (MN). The testing process for this project included determining the presence of engine knock, as well as characterizing emission levels using transient emission measurement procedures developed by the EPA for heavy-duty highway engines. The methane number of the natural gas blends ranged from MN 65 to MN 89. When possible, both high and low Wobbe Index blends were tested at each methane number. This project was performed by the Department of Engine and Emissions Research in the Engine, Vehicle, and Emissions Research Division of SwRI, under the supervision of Mr. Christopher A. Sharp, Manager of the Diesel Technology Section. The SwRI project leader, Mr. Michael D. Feist, Research Engineer, was supported by Mr. Kevin Hohn, Engine Operator, and Mr. Keith Echtle, Laboratory Supervisor. The So Cal Gas point of contact for this work was Mr. Mike Landau.

Report 11657 iii
TABLE OF CONTENTS
Page
FOREWORD ................................................................................................................................. ii LIST OF FIGURES ...................................................................................................................... iv LIST OF TABLES ..........................................................................................................................v 1.0 INTRODUCTION ....................................................................................................................1 2.0 TECHNICAL APPROACH ....................................................................................................2
2.1 Test Engines ...................................................................................................................... 2 2.2 Fuel ................................................................................................................................... 3 2.3 Test Procedure .................................................................................................................. 5
3.0 RESULTS .................................................................................................................................8
3.1 Knock Testing ................................................................................................................... 8 3.2 Emission and Performance Results ................................................................................... 8
4.0 SUMMARY............................................................................................................................22 Appendix No. of Pages A Torque and Power Maps for DDC Series 50G TK and MK Engines........................... 2 B Summarized Emission Results for a DDC Series 50G TK Engine .............................. 3 C Summarized Emission Results for a DDC Series 50G MK Engine ............................. 2 D Detailed Emission Results for a DDC Series 50G TK Engine ................................. 120 E Detailed Emission Results for a DDC Series 50G MK Engine .................................. 64

Report 11657 iv
LIST OF FIGURES
Figure Page
1 TK Engine Installed in a Transient Test Cell .....................................................................3
2 MK Engine Installed in a Durability Test Cell ..................................................................3 3 MK Engine Installed in a Transient Test Cell ...................................................................3 4 MK Engine and Oxidation Catalyst ...................................................................................3 5 Emissions Measurement Sampling System Schematic ......................................................7 6 Average Lambda for a DDC Series 50G TK Engine what Operated over a Hot-
Start Transient Test Cycle Using Various Fuel Blends .....................................................9 7 Average Lambda for a DDC Series 50G MK Engine when operated over a Hot-
Start Transient Test Cycle Using Various Fuel Blends ....................................................11 8 Continuous Lambda and torque Trace for a DDC Series 50G TK and MK Engine
when Operated During a Hot-Start Transient Test Cycle .................................................11 9 Non-Motoring Lambda for a DDC Series 50G MK Engine When Operated
During a Hot-Start Transient Test Cycle ...........................................................................12 10 Integrated Cycle and Reference Work for a DDC Series 50G TK Engine when
Operated over a Hot-Start Transient Test Cycle Using Various Fuel Blends ..................12 11 Integrated Cycle and Reference Work for a DDC Series 50G MK Engine when
operated over a Hot-Start Transient Test Cycle Using Various Fuel Blends ...................13 12 Average Hot-Start Brake-Specific NOx Emissions from a DDC Series 50G TK
Engine when Operated when Operated on Various Fuel Blends.......................................15 13 Average Hot-Start Brake-Specific NOx Emissions Versus Lambda for a DDC
Series 50G TK Engine when Operated on Various Fuel Blends ......................................16 14 Average Hot-Start Brake-Specific NOx Emissions for a DDC Series 50G MK
Engine when Operated on Various Fuel Blends ...............................................................17 15 Average Hot-Start Brake-Specific THC Emissions for a DDC Series 50G TK
Engine when Operated on Various Fuel Blends ...............................................................18 16 Average Hot-Start Brake-Specific THC Emissions for a DDC Series 50G MK
Engine when Operated on Various Fuel Blends ...............................................................18 17 Average Hot-Start Brake-Specific NMHC Emissions for a DDC Series 50G TK
Engine when Operated on Various Fuel Blends ...............................................................19 18 Average Hot-Start Brake-Specific NMHC Emissions for a DDC Series 50G MK
Engine when Operated on Various Fuel Blends ...............................................................20 19 Composite Brake-Specific NOx + NMHC Emissions for a DDC Series 50G TK
Engine when Operated on Various Fuel Blends ...............................................................21 20 Composite Brake-Specific NOx + NMHC Emissions for a DDC Series 50G MK
Engine when Operated on Various Fuel Blends ...............................................................21

Report 11657 v
LIST OF TABLES
Table Page 1 Natural Gas Fuel Blends Tested Using a DDC Series 50G TK Engine ...........................4 2 Natural Gas Fuel Blends Tested Using a DDC Series 50G MK Engine ..........................5 3 Scope of Testing to Evaluate Low Methane Number Natural Gas Using DDC
Series 50G Engines ..........................................................................................................6 4 FTP Transient Composite Emission Results for a DDC Series 50G TK Engine
Using Various Natural Gas Fuel Blends ........................................................................14 5 FTP Transient Composite Emission Results for a DDC Series 50G MK Engine
Using Various Natural Gas Fuel Blends ........................................................................14

REPORT 11657 1 of 22
1.0 INTRODUCTION
This report summarizes engine performance and emission levels of Detroit Diesel Corporation (DDC) Series 50G MK and TK engines run on various low methane number (MN) natural gas blends. Engine knock was evaluated with each blend prior to performing transient emission tests. This evaluation was performed by operating the engine at various high load points and monitoring the electronic knock detection system of the engine as well as the torque feedback signal from the dynamometer system.
Emissions testing adhered to the Code of Federal Regulations (CFR), Title 40, Part 89. For each blend, one cold-start and three hot-start heavy-duty transient FTP cycles were run. Measurements for each transient cycle included oxides of nitrogen (NOx), carbon monoxide (CO), carbon dioxide (CO2), total hydrocarbon (HC), exhaust particulate matter (PM), methane (CH4), and non-methane hydrocarbon (NMHC). Fifteen natural gas blends were tested with the DDC Series 50G TK engine, while eight fuel blends were tested with the Series 50G MK engine. Blends for both engines ranged from MN 65 to MN 89, both high and low Wobbe Index.

REPORT 11657 2 of 22
2.0 TECHNICAL APPROACH
This section of the report contains a description of the test articles, fuel blends, and measurement procedures used in this program to characterize performance and emission levels of the engines. 2.1 Test Engines The Detroit Diesel Corporation Series 50G TK engine shown in Figure 1, which was tested during this program, was supplied by So Cal Gas. This engine required several parts and repairs before it was operational. These included an exhaust oxygen sensor, a knock sensor, an ignition module, an exhaust manifold, and a fuel temperature sensor. Also, the TK engine control module (ECM) was not retaining the air fuel ratio (AFR) learn table when the engine was shut down. This caused the incorrect AFR table to be used when the engine was restarted. SwRI supplied an ECM that was reprogrammed with the correct program and calibration files. A Series 50G MK engine, shown in Figures 2 through Figure 4, was loaned to SwRI for use during this project by Detroit Diesel Corporation. This engine is designed to operate with an oxidation catalyst, which was supplied by So Cal Gas. The unused catalyst was de-greened by operating the MK engine at maximum power for 10 hours. At the completion of the de-greening process, it was evident the engine was using oil. Stewart and Stevenson was contracted to rebuild the MK engine, replacing the worn cylinder liners and pistons.
After being rebuilt, the MK engine was installed at SwRI in a durability test cell for a 125-hour break-in procedure. The engine was run through a series of steady-state points recommended by DDC for the first two hours of operation. The oil was then changed and the remaining 123 hours of operation was performed at maximum power. At the completion of the break-in procedure, the MK engine was installed in a transient capable test cell for knock and emission testing.
Typically used in bus applications, both of these inline 4-cylinder natural gas engines had a rated maximum power output of 275 hp, and a peak torque of 890 lb-ft. Both spark ignited engines had a displacement of 8.5 L and were turbocharged, intercooled, and electronically controlled.

REPORT 11657 3 of 22
FIGURE 1. TK ENGINE INSTALLED IN A FIGURE 2. MK ENGINE INSTALLED IN A TRANSIENT TEST CELL DURABILITY TEST CELL
FIGURE 3. MK ENGINE INSTALLED IN A FIGURE 4. MK ENGINE AND OXIDATION TRANSIENT TEST CELL CATALYST 2.2 Fuel The fuel for initial engine run-in and diagnostic efforts was natural gas from a commercial pipeline. The pipeline gas was approximately 95 percent methane by volume, with the balance being ethane, propane, nitrogen, and carbon dioxide. SwRI transported this gas to the dynamometer test cell in a pressure vessel containing approximately 13,000 scf of gas at 3,000 psig. During the 125-hour break-in procedure for the Series 50G MK engine, pipeline natural gas was available at the durability test cell and supplied directly to the engine.
REPORT 11657 4 of 22
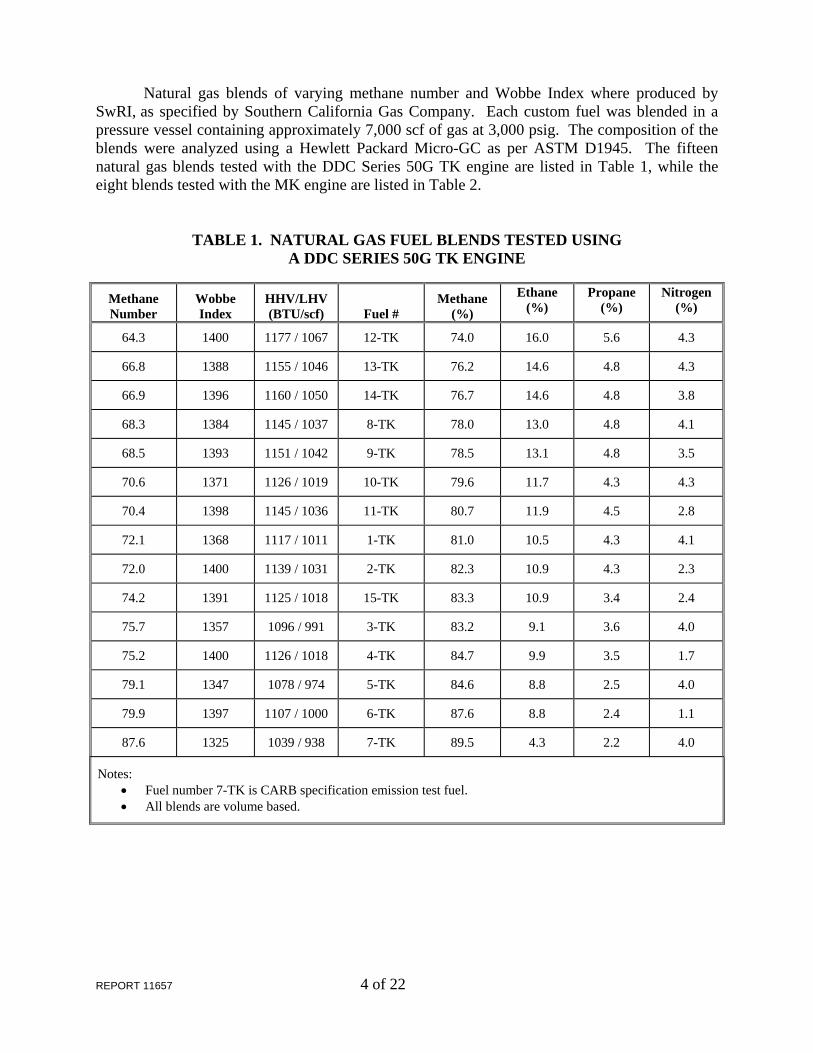
Natural gas blends of varying methane number and Wobbe Index where produced by SwRI, as specified by Southern California Gas Company. Each custom fuel was blended in a pressure vessel containing approximately 7,000 scf of gas at 3,000 psig. The composition of the blends were analyzed using a Hewlett Packard Micro-GC as per ASTM D1945. The fifteen natural gas blends tested with the DDC Series 50G TK engine are listed in Table 1, while the eight blends tested with the MK engine are listed in Table 2.
TABLE 1. NATURAL GAS FUEL BLENDS TESTED USING A DDC SERIES 50G TK ENGINE
Methane Number
Wobbe Index
HHV/LHV (BTU/scf) Fuel #
Methane (%)
Ethane (%)
Propane (%)
Nitrogen (%)
64.3 1400 1177 / 1067 12-TK 74.0 16.0 5.6 4.3
66.8 1388 1155 / 1046 13-TK 76.2 14.6 4.8 4.3
66.9 1396 1160 / 1050 14-TK 76.7 14.6 4.8 3.8
68.3 1384 1145 / 1037 8-TK 78.0 13.0 4.8 4.1
68.5 1393 1151 / 1042 9-TK 78.5 13.1 4.8 3.5
70.6 1371 1126 / 1019 10-TK 79.6 11.7 4.3 4.3
70.4 1398 1145 / 1036 11-TK 80.7 11.9 4.5 2.8
72.1 1368 1117 / 1011 1-TK 81.0 10.5 4.3 4.1
72.0 1400 1139 / 1031 2-TK 82.3 10.9 4.3 2.3
74.2 1391 1125 / 1018 15-TK 83.3 10.9 3.4 2.4
75.7 1357 1096 / 991 3-TK 83.2 9.1 3.6 4.0
75.2 1400 1126 / 1018 4-TK 84.7 9.9 3.5 1.7
79.1 1347 1078 / 974 5-TK 84.6 8.8 2.5 4.0
79.9 1397 1107 / 1000 6-TK 87.6 8.8 2.4 1.1
87.6 1325 1039 / 938 7-TK 89.5 4.3 2.2 4.0
Notes: • Fuel number 7-TK is CARB specification emission test fuel. • All blends are volume based.

REPORT 11657 5 of 22
TABLE 2. NATURAL GAS FUEL BLENDS TESTED USING A DDC SERIES 50G MK ENGINE
Methane Number
Wobbe Index
HHV/LHV (BTU/scf) Fuel #
Methane (%)
Ethane (%)
Propane (%)
Nitrogen (%)
64.8 1399 1173 / 1063 1-MK 74.4 16.1 5.2 4.2
68.9 1385 1143 / 1035 2-MK 78.5 13.0 4.6 3.9
69.8 1390 1143 / 1035 3-MK 79.4 13.1 4.1 3.4
72.4 1367 1116 / 1010 4-MK 81.3 10.3 4.3 4.1
73.4 1395 1131 / 1023 5-MK 83.1 10.7 3.8 2.3
79.2 1349 1079 / 975 6-MK 84.7 8.8 2.4 3.9
78.4 1403 1116 / 1008 7-MK 86.7 9.7 2.5 1.0
88.1 1332 1042 / 940 8-MK 90.0 4.3 2.1 3.6
Notes: • Fuel number 8-MK is CARB specification emission test fuel. • All blends are volume based.
The knock resistance of the fuel blends was expressed by the MN of the natural gas. The methane number of the fuel blends was calculated using the California Air Resources Board (ARB) mathematical method. The Wobbe Index is a measure of the interchangeability of the fuel and was calculated by dividing the higher heating value by the relative density of the fuel. 2.3 Test Procedure Table 3 outlines the test procedure followed for each fuel blend. Prior to testing a new blend, the AFR table was cleared and repopulated by operating the engine over a matrix of steady-state speed and load points. The next step was to operate the engine at wide open throttle (WOT) over a series of steady-state speeds to look for the occurrence of engine knock, or auto ignition. During this operation, several knock detection signals from the engine control unit (ECU) were monitored to determine the presence of knock. In addition, the feedback torque signal from the dynamometer torque meter was monitored for noticeable perturbations from the mean torque value. This process was repeated while varying the engine inlet air temperature from 65 to 90°F and maintaining the inlet air dew point at approximately 58°F.

REPORT 11657 6 of 22
TABLE 3. SCOPE OF TESTING TO EVALUATE LOW METHANE NUMBER NATURAL GAS USING DDC SERIES 50G ENGINES
Step Test Procedure for Each Fuel and Each Engine
1
• After switching to a new gas supply, clear the AFR learn table, warm the engine, run AFR learn-cycle, and perform a two-point power validation.
o Monitor knock detection signal from engine, engine power levels, and torque meter trace for signs of auto ignition.
2
• Operate engine at WOT and nominal SET speeds A, B, and C. Vary the inlet air temperature from 65 to 90 degF.
o Monitor knock detection signal from engine, engine power levels, and torque meter trace for signs of auto ignition.
3 • Generate an engine torque map.
o Monitor knock detection signal from engine, engine power levels, and torque meter trace for signs of auto ignition.
4 • Perform practice transient cycles to obtain transient statistics and condition the sampling systems.
5 • Following an overnight soak, perform one cold-start and three hot-start heavy duty transient FTP tests measuring HC, NMHC, CO, NOx, and PM.
Notes: • If the engine produces noticeable knock during any step, discontinue testing and move
on to the next fuel blend.
Provided the engine produced no noticeable sign of knock, transient emission tests were
performed. Emissions testing included one cold-start and three hot-start heavy-duty transient FTP cycles for each fuel blend. Using dilute measurement techniques, the emission of total hydrocarbons (HC), carbon monoxide (CO), oxides of nitrogen (NOx), and particulate matter (PM) were measured for each test. The experimental setup shown schematically in Figure 5 was used to measure full-flow dilute exhaust emissions over the transient tests. Methane (CH4) levels were measured by analyzing proportional bag samples of the CVS-diluted exhaust using a Gas Chromatograph (GC) FID analyzer. Non-methane hydrocarbon (NMHC) was expressed as the difference between measured HC and CH4 levels. NMHC levels were adjusted for FID response as appropriate.
The total hydrocarbons were measured using continuous sampling techniques with a
heated flame ionization detector (HFID). The NOx levels were measured continuously using a chemiluminescent analyzer. The PM level for each test was determined using dilute sampling techniques that collected particulate matter on T60A20 Pallflex™ filter media. Each filter was weighed before and after sampling to establish the mass accumulated for the given emissions test.

REPORT 11657 7 of 22
Filter Pack
Engine
Gas Meter
Pump
Bag Sample
Gas Analyzer
Sample Line
Heated Line
90mm PM Filters
SampleZone
Heat Exchanger
CO, CO2, HC, and NOx Background Bag Sample PM
ExhaustPipe
CO, CO2Sample Bag
Exhaust Aftertreatment
NOxAnalyzer
HCAnalyzer Positive Displacement
Pump (PDP)
DilutionAir
10 DiametersMixingOrifice
FIGURE 5. EMISSIONS MEASUREMENT SAMPLING SYSTEM SCHEMATIC

REPORT 11657 8 of 22
3.0 RESULTS
This section of the report summarizes knock and emission results for the project. Summary tables of the emission results for each blend can be found in Appendix B for the TK engine and Appendix C for the MK engine. Detailed emission results for each test can be found in Appendix D for the TK engine and Appendix E for the MK engine.
3.1 Knock Testing
The MK engine showed no sign of knock when tested with the fuels listed in Table 2. The TK engine showed no sign of knock with any fuel blend listed in Table 1 except for Blend 2-TK (methane number 73, high Wobbe). The knock signals from the engine showed slight activity when the TK engine was run at maximum power with Blend 2-TK; however, the knock signal was intermittent, and it did not cause the performance of the engine to deteriorate.
After testing Blends 1-TK through 14-TK, So Cal Gas elected to re-blend and retest MN
73, high Wobbe fuel (Blend 15-TK). The second blend of MN 73, high Wobbe fuel showed no sign of knock.
The absence of knock behavior during this screening indicates that it is likely that these
fuels might be used without resulting in damage to the engine. However, actual test stand durability tests or in use testing would need to be performed to verify the durability of the engine when operated on the various fuel blends. For example, due to the laboratory water-to-air intercooler system, varying the inlet temperature of the intake air had little affect on the intake manifold air temperature. The intake manifold temperature remained close to the 112°F set point regardless of the set point of the intake air temperature. Also, the absolute intake air humidity level was held constant throughout the test process. Therefore, the knock evaluation was performed under a narrow range of engine operating conditions.
3.2 Emission and Performance Results
The DDC Series 50G engines are designed and calibrated to run lean. Running an air-to-fuel ratio (AFR) significantly leaner than stoichiometric reduces peak combustion temperatures, and therefore, reduces the emission of nitrogen oxides (NOx). Another method used to lower combustion temperature is delayed or retarded ignition timing. A drawback to running lean and with delayed ignition timing is that the power output of the engine can be compromised.
The DDC TK engine has an active AFR learning process based on feedback from a wide-
ranging oxygen sensor. The purpose of this learning process is to compensate for varying gas compositions and different engine operating conditions, and to continually correct the AFR of the engine to maintain the desired lambda. Lambda is the ratio of the measured AFR over the stoichiometric AFR. Values less than one indicate the engine is running rich, while values greater than one indicate the engine is running lean. However, the AFR learning process is limited, and only able to correct lambda in a lean direction by a limited amount. This is done to prevent lean misfire which would result in poor engine operation.

REPORT 11657 9 of 22
The AFR learn table for the TK engine was generally saturated at the maximum lean offset for each fuel blend, indicating the TK engine was not able to correct the AFR to the desired value. Therefore, the AFR of the TK engine was driven by the composition of the different gas blends. The MK engine AFR learn table had a mix of both positive and negative values, none of which were at the maximum lean or rich offset values. This indicated the MK engine was able to maintain the desired AFR for each fuel blend, based on feedback from the oxygen sensor.
When run on low methane number and high Wobbe gas blends, the AFR of the DDC
Series 50G TK engine decreased and the engine operated with a slightly richer combustion mixture than intended. Shown in Figure 6 is the average lambda value for the second hot-start transient test for each fuel blend tested with the TK engine. With low Wobbe gas blends, lambda decreased as the methane number decreased, indicating the TK engine ran richer with lower methane number fuels. All high Wobbe gas blends showed a substantial decrease in lambda regardless of methane number with the TK engine.
1325
Wob
be
1388
Wob
be
1384
Wob
be
1371
Wob
be
1368
Wob
be
1357
Wob
be
1347
Wob
be
1397
Wob
be
1400
Wob
be
1396
Wob
be
1393
Wob
be
1398
Wob
be
1400
Wob
be
1400
Wob
be
1.2
1.22
1.24
1.26
1.28
1.3
1.32
1.34
1.36
1.38
1.4
65 67 69 71 73 76 80 89
Methane Number
Lam
bda
Low Wobbe High Wobbe
FIGURE 6. AVERAGE LAMBDA FOR A DDC SERIES 50G TK ENGINE
WHEN OPERATED OVER A HOT-START TRANSIENT TEST CYCLE USING VARIOUS FUEL BLENDS

REPORT 11657 10 of 22
As shown in Figure 7, the MK engine did not show an obvious trend when lambda was compared to the methane number or Wobbe Index of the fuel. This is another indication the MK engine was able to maintain the desired AFR with each fuel blend. The calculated average lambda value for the MK engine was greater then the average value for the TK engine during the transient test. The MK engine closes the gas valve and stops fuel delivery to the engine during a motoring event, causing the AFR of the MK combustion mixture to increase dramatically. As seen in Figure 8, the lambda value for the TK engine remained relatively constant during positive torque operation, as well as for negative torque operation (motoring). The MK engine, on the other hand, saturated the lambda sensor to a value of 5.6 during motoring events, indicating the combustion mixture was mostly air.
Shown in Figure 9 is the average lambda values for the MK engine when recalculated using only values less then 1.8. Lambda was recalculated to insure an AFR trend was not being overlooked using the complete lambda data set. The average MK engine lambda of 1.28 indicates the MK engine may have been operating slightly richer then the TK engine during non-motoring events throughout the project.
As lambda decreases and the AFR of the engine is closer to stoichiometric, the power
output of the engine increases. This is due to the oxidation of more fuel, higher combustion temperatures, and increased cylinder pressures. Figure 10 shows the actual work performed by the TK engine during the second hot-start transient test for each gas blend as well as the reference work for the cycle. It is evident in Figure 6 and Figure 10, that the AFR of the engine directly affects engine performance. As lambda decreases, the power output of the engine increases. As shown in Figure 11, the MK engine did not show a trend when cycle work or reference work was compared with MN or Wobbe Index. The MK engine produced slightly more power than the TK engine on all gas blends. Torque and power maps for each blend can be found in Appendix A, while the actual and reference work for each test can be found in Appendix B and C.

REPORT 11657 11 of 22
1332
Wob
be
1349
Wob
be
1367
Wob
be
1385
Wob
be
1403
Wob
be
1395
Wob
be
1390
Wob
be
1399
Wob
be
1.6
1.65
1.7
1.75
1.8
1.85
1.9
1.95
65 69 73 80 89
Methane Number
Lam
bda
Low Wobbe High Wobbe
FIGURE 7. AVERAGE LAMBDA FOR A DDC SERIES 50G MK ENGINE
WHEN OPERATED OVER A HOT-START TRANSIENT TEST CYCLE USING VARIOUS FUEL BLENDS
-200
0
200
400
600
800
1000
60 62 64 66 68 70 72 74 76 78 80
Time (s)
Torq
ue (l
b-ft)
0
1
2
3
4
5
6
Lam
bda
Torque (feedback) TK Lambda MK Lambda
FIGURE 8. CONTINUOUS LAMBDA AND TORQUE TRACE FOR A DDC
SERIES 50G TK AND MK ENGINE WHEN OPERATED DURING A HOT-START TRANSIENT TEST CYCLE

REPORT 11657 12 of 22
1332
Wob
be
1349
Wob
be
1367
Wob
be
1385
Wob
be
1403
Wob
be
1395
Wob
be
1390
Wob
be
1399
Wob
be
0.8
0.9
1
1.1
1.2
1.3
1.4
1.5
1.6
65 69 73 80 89
Methane Number
Lam
bda
Low Wobbe High Wobbe
FIGURE 9. NON-MOTORING LAMBDA FOR A DDC SERIES 50G MK ENGINE WHEN OPERATED DURING
A HOT-START TRANSIENT TEST CYCLE
18.0
18.5
19.0
19.5
20.0
20.5
21.0
21.5
22.0
MN 65 MN 67 MN 69 MN 71 MN 73 MN 76 MN 80 MN 89
Methane Number
Cyc
le W
ork
(hp-
hr)
Actual Low Wobbe Reference Low Wobbe Actual High Wobbe Reference High Wobbe
FIGURE 10. INTEGRATED CYCLE AND REFERENCE WORK FOR A DDC
SERIES 50G TK ENGINE WHEN OPERATED OVER A HOT-START TRANSIENT TEST CYCLE USING VARIOUS FUEL BLENDS

REPORT 11657 13 of 22
20.5
21.0
21.5
22.0
22.5
23.0
23.5
24.0
24.5
MN 65 MN 69 MN 73 MN 80 MN 89
Methane Number
Cyc
le W
ork
(hp-
hr)
Actual Low Wobbe Reference Low Wobbe Actual High Wobbe Reference High Wobbe
FIGURE 11. INTEGRATED CYCLE AND REFERENCE WORK FOR A DDC
SERIES 50G MK ENGINE WHEN OPERATED OVER A HOT-START TRANSIENT TEST CYCLE USING VARIOUS FUEL BLENDS
Another factor that may have impacted engine performance was the flame speed of the
fuel blend. Fuels with faster burn rates effectively advance the ignition timing of the engine. This causes higher in-cylinder pressures and temperatures. The flame speed is dependant on both the composition of the natural gas fuel, and the amount of dilution in the combustion mixture. Fuels with higher concentrations of ethane and propane have higher flame speeds. As the methane number of the fuel decreases, the concentrations of ethane and propane increase. Dilution of the combustion mixture is dependant on the amount of inert material in the fuel as well as the inert material from the excess air. Fuels with more inert material have slower burn rates, as do leaner combustion mixtures, due to increased dilution. High Wobbe Index fuel blends have less inert material than low Wobbe blends.
Tables 4 and 5 show the composite brake-specific emission results for one cold-start and
one hot-start heavy-duty transient FTP cycles for each fuel blend. The composite results combine the results from the cold-start test and the first hot-start test, using the one-seventh cold-start and six-sevenths hot-start weighting specified in the CFR. Additional hot-start tests were run to determine the repeatability of the test process. Results from each test can be seen in Appendix B through E.

REPORT 11657 14 of 22
TABLE 4. FTP TRANSIENT COMPOSITE EMISSION RESULTS FOR A DDC SERIES 50G TK ENGINE USING VARIOUS NATURAL GAS FUEL BLENDS
Methane Wobbe BlendNumber Index ID BSHC BSCH4 BSNMHC BSCO BSNOx BSPM BSCO2
65 High 12-TK 1.59 1.04 0.54 2.09 4.48 0.001 51067 Low 13-TK 1.65 1.16 0.49 2.02 3.90 0.000 51367 High 14-TK 1.70 1.16 0.54 2.09 4.01 0.004 51369 Low 8-TK 1.76 1.27 0.50 2.00 3.23 0.001 50569 High 9-TK 1.66 1.18 0.48 2.11 3.89 0.001 51571 Low 10-TK 1.86 1.39 0.47 1.99 2.77 0.001 51971 High 11-TK 1.64 1.26 0.38 2.09 4.08 0.001 51473 Low 1-TK 2.15 1.59 0.57 2.05 2.27 0.001 53273 High 2-TK 1.68 1.19 0.49 2.28 4.91 0.002 51676 Low 3-TK 2.37 1.88 0.49 2.00 1.93 0.002 53676 High 4-TK 1.81 1.41 0.40 2.10 3.81 0.001 52380 Low 5-TK 2.56 2.08 0.48 1.96 1.55 0.003 55280 High 6-TK 1.77 1.50 0.27 2.09 3.33 0.001 50889 Low 7-TK 2.92 2.70 0.22 1.86 1.11 0.001 528
Composite Brake-Specific Emissions, g/hp-hr
TABLE 5. FTP TRANSIENT COMPOSITE EMISSION RESULTS FOR A DDC SERIES 50G MK ENGINE USING VARIOUS NATURAL GAS FUEL BLENDS
Methane Wobbe BlendNumber Index ID BSHC BSCH4 BSNMHC BSCO BSNOx BSPM BSCO2
65 High 1-MK 1.03 1.00 0.02 0.00 5.15 0.002 53669 Low 2-MK 1.12 1.11 0.01 0.00 4.39 0.002 52869 High 3-MK 1.18 1.11 0.07 0.03 4.25 0.003 49773 Low 4-MK 1.35 1.32 0.02 0.00 3.83 0.004 51273 High 5-MK 1.25 1.24 0.00 0.01 4.31 0.005 52380 Low 6-MK 1.66 1.66 0.01 0.01 3.31 0.004 52480 High 7-MK 1.39 1.38 0.00 0.01 4.57 0.002 51589 Low 8-MK 2.05 2.05 0.00 0.01 2.73 0.002 520
Composite Brake-Specific Emissions, g/hp-hr
Particulate and carbon monoxide (CO) emissions with the TK and MK natural gas
engines were low, as expected. Due to the use of an oxidation catalyst with the MK engine, the emission of CO was near zero with all fuel blends. Emission of CO and PM showed little variation with the different gas blends for both the TK and MK engines.
With the TK engine, the emission of CO2 decreased with high Wobbe and low MN gas
blends. The MK engine, however, showed little change in CO2 with regard to Wobbe Index and slightly increased with lower MN gas blends.
NOx emission levels for both engines were similarly affected by the compositions of the
different gas blends. Figure 12 shows the MK engine average hot-start brake-specific NOx emission results for the various gas blends. With low Wobbe gas blends, NOx levels increased as methane number decreased. The high Wobbe gas blends had high NOx emission regardless of the methane number of the fuel. NOx levels are highly dependant on combustion temperature, which is driven by the AFR and flame speed of the mixture. In comparing Figure 6, the average

REPORT 11657 15 of 22
TK engine lambda value during a hot-start test, with Figure 12, it is evident that the AFR of the engine notably affected NOx emission from the TK engine. All high Wobbe TK gas blends caused lambda to decrease and NOx levels to increase. Low Wobbe TK gas blends showed a trend of decreasing lambda with decreasing methane number. A similar trend was observed with the TK engine as NOx levels showed an increasing trend with decreasing methane number. As shown in Figure 13, NOx levels decreased as lambda increased.
0
1
2
3
4
5
6
MN 65 MN 67 MN 69 MN 71 MN 73 MN 76 MN 80 MN 89
Methane Number
NO
x (g
/hp-
hr)
Low Wobbe High Wobbe
FIGURE 12. AVERAGE HOT-START BRAKE-SPECIFIC NOx EMISSIONS
FOR A DDC SERIES 50G TK ENGINE WHEN OPERATED ON VARIOUS FUEL BLENDS

REPORT 11657 16 of 22
0.00
0.50
1.00
1.50
2.00
2.50
3.00
3.50
4.00
4.50
1.29 1.3 1.31 1.32 1.33 1.34 1.35 1.36 1.37Lambda
NO
x (g
/hp-
hr)
FIGURE 13. AVERAGE HOT-START BRAKE-SPECIFIC NOx EMISSIONS VERSUS
LAMBDA FOR A DDC SERIES 50G TK ENGINE WHEN OPERATED ON VARIOUS FUEL BLENDS
Curiously, the MK engine showed no noticeable trend when lambda was compared to the MN and Wobbe Index of the gas blends, however, the emission of NOx from the MK engine showed trends similar to the TK engine. As seen in Figure 14, high Wobbe blends caused an increase in NOx emission. Low Wobbe blends progressed toward increased NOx emission as the methane number of the fuel decreased. A possible explanation for this behavior is the increased flame speed of the high Wobbe and low MN blends and subsequent increase in cylinder pressure and temperature.

REPORT 11657 17 of 22
0
1
2
3
4
5
6
MN 65 MN 69 MN 73 MN 80 MN 89
Methane Number
NO
x (g
/hp-
hr)
Low Wobbe High Wobbe
FIGURE 14. AVERAGE HOT-START BRAKE-SPECIFIC NOx EMISSIONS
FOR A DDC SERIES 50G MK ENGINE WHEN OPERATED ON VARIOUS FUEL BLENDS
Figures 15 and 16 show the average hot-start emission results for total hydrocarbon
(THC) for the TK and MK engines. Again, the TK and MK engines produced a similar trend when THC was compared with the MN and Wobbe Index of the gas blends. With low Wobbe fuel blends, THC levels decreased as methane number decreased. High Wobbe blends showed lower THC levels regardless of methane number. Again, this trend may be explained by the combustion temperature of the engines. When running increasing lean, lambda greater then one, the combustion mixture is further diluted and combustion temperatures are reduced. Because the air and fuel mixture is not completely homogeneous, pockets of the mixture may be too lean to burn effectively. This contributes to higher total hydrocarbon emission, as not all of the fuel is oxidized. As lambda approaches one, combustion temperatures increase and combustion is more complete. It is important to note that although lambda decreased with high Wobbe and low methane number fuel blends, the mixture was still lean of stoichiometric. This indicates the mixture had excess oxygen and allowed more complete combustion of the air and fuel mixture at lower lambda conditions.

REPORT 11657 18 of 22
0.0
0.5
1.0
1.5
2.0
2.5
3.0
MN 65 MN 67 MN 69 MN 71 MN 73 MN 76 MN 80 MN 89
Methane Number
THC
(g/h
p-hr
)
Low Wobbe High Wobbe
FIGURE 15. AVERAGE HOT-START BRAKE-SPECIFIC THC EMISSIONS
FOR A DDC SERIES 50G TK ENGINE WHEN OPERATED ON VARIOUS FUEL BLENDS
0.0
0.5
1.0
1.5
2.0
2.5
MN 65 MN 69 MN 73 MN 80 MN 89
Methane Number
THC
(g/h
p-hr
)
Low Wobbe High Wobbe
FIGURE 16. AVERAGE HOT-START BRAKE-SPECIFIC THC EMISSIONS
FOR A DDC SERIES 50G MK ENGINE WHEN OPERATED ON VARIOUS FUEL BLENDS

REPORT 11657 19 of 22
Another factor that may have increased combustion temperatures and aided in more complete oxidation of the fuel was the gas composition. Low Wobbe Index fuels have increased diluents, causing slower, cooler combustion. Low methane number fuels have increased concentrations of ethane and propane, causing increased flame speed and subsequent combustion temperature increases.
Shown in Figures 17 and 18 are the average hot-start non-methane hydrocarbon (NMHC) results for the TK and MK engines. Although THC emission levels decreased as methane number decreased, NMHC increased as methane number decreased with the TK engine. Typically, the NMHC percentage of THC is similar to the percentage of non-methane material in the gas blend. As the methane number of the fuel is decreased, the methane concentration is decreased. Therefore, low methane concentration blends are expected to produce higher NMHC emission levels.
With oxidation catalyst, the MK engine produced near zero NMHC emission. This indicates that nearly all of the hydrocarbon emission was methane, which is a non-regulated emission. Penetration of methane through the oxidation catalyst is expected as methane is not easily catalytically oxidized, but the catalyst was effective at eliminating non-methane hydrocarbon as seen in Figure 18.
0.0
0.1
0.2
0.3
0.4
0.5
0.6
MN 65 MN 67 MN 69 MN 71 MN 73 MN 76 MN 80 MN 89
Methane Number
NM
HC
(g/h
p-hr
)
Low Wobbe High Wobbe
FIGURE 17. AVERAGE HOT-START BRAKE-SPECIFIC NMHC EMISSIONS
FOR A DDC SERIES 50G TK ENGINE WHEN OPERATED ON VARIOUS FUEL BLENDS

REPORT 11657 20 of 22
0.00
0.02
0.04
0.06
0.08
0.10
MN 65 MN 69 MN 73 MN 80 MN 89
Methane Number
NM
HC
(g/h
p-hr
)
Low Wobbe High Wobbe
FIGURE 18. AVERAGE HOT-START BRAKE-SPECIFIC NMHC EMISSIONS FOR A DDC SERIES 50G MK ENGINE WHEN OPERATED ON VARIOUS FUEL BLENDS
Figures 19 and 20 show the composite brake-specific emission results for each fuel blend.
The composite results were largely driven by NOx emission for both engines. All high Wobbe gas blends produced higher NOx emission for both the TK and MK engines. With low Wobbe blends, NOx increased as methane number decreased.

REPORT 11657 21 of 22
0
0.5
1
1.5
2
2.5
3
3.5
4
4.5
5
5.5
6
MN 65 MN 67 MN 69 MN 71 MN 73 MN 76 MN 80 MN 89
Methane Number
NO
x+N
MC
H (g
/hp-
hr)
Low Wobbe High Wobbe
FIGURE 19. COMPOSITE BRAKE-SPECIFIC NOx + NMHC EMISSIONS FOR A DDC
SERIES 50G TK ENGINE WHEN OPERATED ON VARIOUS FUEL BLENDS
0
0.5
1
1.5
2
2.5
3
3.5
4
4.5
5
5.5
MN 65 MN 69 MN 73 MN 80 MN 89
Methane Number
NO
x+N
MC
H (g
/hp-
hr)
Low Wobbe High Wobbe
FIGURE 20. COMPOSITE BRAKE-SPECIFIC NOx + NMHC EMISSIONS FOR A DDC
SERIES 50G MK ENGINE WHEN OPERATED ON VARIOUS FUEL BLENDS

REPORT 11657 22 of 22
4.0 SUMMARY
DDC Series 50G TK and Series 50G MK engine were tested for engines performance and emission levels using natural gas blends of various methane number (MN) and Wobbe Index. The engines showed no sign of knock with any fuel except fuel Blend 2-TK (MN 73, high Wobbe) with the TK engine. This gas composition was re-blended as fuel Blend 15-TK and retested with the TK engine. Blend 15-TK showed no sign of knock.
The TK and MK engines showed emission differences when run on the various gas
blends. High Wobbe gas blends produced increased NOx emission with both engines. Low Wobbe blends showed increased NOx emission as the methane number of the fuel blend decreased. A possible explanation for these trends include the richening of the combustion mixture, as the TK engine was not able to maintain the desired AFR with high Wobbe and lower MN gas blends. Other possible explanations for the increased NOx emission include effectively advanced ignition timing from higher concentrations of ethane and propane and lower concentrations of diluents. Each of these factors likely caused increased combustion temperatures and NOx emission.
With the TK engine, non-methane hydrocarbon emission increased as the MN of the fuel
decreased. The emission of CO showed little variation with the different gas blends. Carbon dioxide emission decreased with high Wobbe Index and low MN blends with the TK engine.
The MK engine showed near zero emission of NMHC and CO for all fuel blends, while
carbon dioxide emission increased slightly with low MN fuels.
SwRI appreciates the opportunity to perform this testing, and looks forward to meeting your future emission research needs.

APPENDIX A
Torque and Power Maps for DDC Series 50G TK and MK Engines

A-1
0
100
200
300
400
500
600
700
800
900
1000
500 700 900 1100 1300 1500 1700 1900 2100 2300 2500
Speed (rpm)
Torq
ue (l
b-ft)
12-TK 13-TK 14-TK 8-TK 9-TK 10-TK 11-TK 1-TK
2-TK 15-TK 3-TK 4-TK 5-TK 6-TK 7-TK
TORQUE MAPS FOR A DDC SERIES 50G TK ENGINE WHEN
OPERATED ON VARIOUS FUEL BLENDS
0
50
100
150
200
250
300
350
500 700 900 1100 1300 1500 1700 1900 2100 2300 2500
Speed (rpm)
Pow
er (h
p)
12-TK 13-TK 14-TK 8-TK 9-TK 10-TK 11-TK 1-TK
2-TK 15-TK 3-TK 4-TK 5-TK 6-TK 7-TK
POWER MAPS FOR A DDC SERIES 50G TK ENGINE WHEN
OPERATED ON VARIOUS FUEL BLENDS

A-2
0
200
400
600
800
1000
1200
500 700 900 1100 1300 1500 1700 1900 2100 2300 2500
Speed (rpm)
Torq
ue (l
b-ft)
1-MK 2-MK 3-MK 4-MK 5-MK 6-MK 7-MK 8-MK
TORQUE MAPS FOR A DDC SERIES 50G MK ENGINE WHEN
OPERATED ON VARIOUS FUEL BLENDS
0
50
100
150
200
250
300
350
500 700 900 1100 1300 1500 1700 1900 2100 2300 2500
Speed (rpm)
Pow
er (h
p)
1-MK 2-MK 3-MK 4-MK 5-MK 6-MK 7-MK 8-MK
POWER MAPS FOR A DDC SERIES 50G MK ENGINE WHEN
OPERATED ON VARIOUS FUEL BLENDS

APPENDIX B
Summarized Emission Results for A DDC Series 50G TK Engine

B-1
Actual, Ref,Fuel Test Name BSHC BSCH4 BSNMHC BSCO BSNOx BSPM BSCO2 hp·hr hp·hr
Cold Start 1 1.98 1.28 0.70 2.11 3.43 0.001 553 20.69 21.22Fuel 12-TK Hot Start 1 1.52 1.01 0.52 2.09 4.65 0.001 503 21.72 21.22
MN 65 Composite 1.59 1.04 0.54 2.09 4.48 0.001 510 21.57 21.22High Wobbe Hot Start 2 1.51 1.01 0.51 2.07 4.86 0.0005 508 21.51 21.22
29-Sep Hot Start 3 1.48 0.96 0.53 2.09 4.89 0.001 507 21.81 21.22Hot Start Ave. 1.51 0.99 0.52 2.08 4.80 0.001 506 21.68 21.22Hot Start COV 1% 3% 2% 0.3% 3% 15% 1% N/A N/A
Brake-Specific Emissions, g/hp-hr
Actual, Ref,Fuel Test Name BSHC BSCH4 BSNMHC BSCO BSNOx BSPM BSCO2 hp·hr hp·hr
Cold Start 1 1.98 1.41 0.58 2.08 2.98 0.001 542 20.54 21.01Fuel 13-TK Hot Start 1 1.60 1.12 0.48 2.01 4.05 0.0002 509 21.25 21.01
MN 67 Composite 1.65 1.16 0.49 2.02 3.90 0.000 513 21.15 21.01Low Wobbe Hot Start 2 1.61 1.14 0.47 2.04 4.24 0.001 506 21.11 21.01
30-Sep Hot Start 3 1.58 1.12 0.46 2.06 4.26 0.0003 506 21.20 21.01Hot Start Ave. 1.60 1.13 0.47 2.04 4.18 0.001 507 21.19 21.01Hot Start COV 1% 1% 2% 1% 3% 84% 0.3% N/A N/A
Cold Start 1 2.08 1.44 0.64 2.11 2.88 0.004 566 20.62 20.95Fuel 14-TK Hot Start 1 1.64 1.12 0.52 2.09 4.19 0.004 504 21.24 20.95
MN 67 Composite 1.70 1.16 0.54 2.09 4.01 0.004 513 21.15 20.95High Wobbe Hot Start 2 1.59 1.09 0.50 2.08 4.38 0.005 508 21.17 20.95
3-Oct Hot Start 3 1.54 1.05 0.49 2.00 4.60 0.004 498 21.48 20.95Hot Start Ave. 1.59 1.09 0.50 2.06 4.39 0.004 503 21.30 20.95Hot Start COV 3% 3% 4% 2.4% 5% 19% 1% N/A N/A
Brake-Specific Emissions, g/hp-hr
Actual, Ref,Fuel Test Name BSHC BSCH4 BSNMHC BSCO BSNOx BSPM BSCO2 hp·hr hp·hr
Cold Start 1 2.20 1.52 0.67 2.06 2.31 0.001 544 20.47 21.05Fuel 8-TK Hot Start 1 1.69 1.23 0.47 1.98 3.37 0.001 498 21.18 21.05
MN 69 Composite 1.76 1.27 0.50 2.00 3.23 0.001 505 21.08 21.05Low Wobbe Hot Start 2 1.62 1.15 0.46 2.01 3.58 0.001 499 21.42 21.05
23-Sep Hot Start 3 1.52 1.16 0.35 2.02 3.51 0.0004 496 21.18 21.05Hot Start Ave. 1.61 1.18 0.43 2.00 3.49 0.001 498 21.26 21.05Hot Start COV 5% 3% 15% 1% 3% 46% 0.2% N/A N/A
Cold Start 1 2.05 1.46 0.59 2.11 2.83 0.001 542 20.62 21.04Fuel 9-TK Hot Start 1 1.60 1.13 0.47 2.11 4.06 0.001 511 21.25 21.04
MN 69 Composite 1.66 1.18 0.48 2.11 3.89 0.001 515 21.16 21.04High Wobbe Hot Start 2 1.55 1.13 0.42 2.06 4.19 0.0001 505 21.56 21.04
26-Sep Hot Start 3 1.53 1.13 0.40 2.04 4.25 0.0001 501 21.53 21.04Hot Start Ave. 1.56 1.13 0.43 2.07 4.17 0.0004 506 21.45 21.04Hot Start COV 2% 0.1% 8% 2% 2% 148% 1% N/A N/A
Brake-Specific Emissions, g/hp-hr

B-2
Actual, Ref,Fuel Test Name BSHC BSCH4 BSNMHC BSCO BSNOx BSPM BSCO2 hp·hr hp·hr
Cold Start 1 2.39 1.78 0.61 2.05 1.96 0.001 558 20.05 20.59Fuel 10-TK Hot Start 1 1.78 1.33 0.45 1.98 2.90 0.001 513 20.94 20.59
MN 71 Composite 1.86 1.39 0.47 1.99 2.77 0.001 519 20.81 20.59Low Wobbe Hot Start 2 1.75 1.31 0.44 1.97 3.23 0.002 504 20.85 20.59
27-Sep Hot Start 3 1.72 1.30 0.42 1.99 3.14 0.002 504 20.81 20.59Hot Start Ave. 1.75 1.31 0.44 1.98 3.09 0.001 507 20.87 20.59Hot Start COV 2% 1% 3% 0.5% 5% 41% 1% N/A N/A
Cold Start 1 2.18 1.64 0.54 2.24 2.87 0.002 560 20.35 20.98Fuel 11-TK Hot Start 1 1.56 1.20 0.36 2.07 4.27 0.001 506 21.48 20.98
MN 71 Composite 1.64 1.26 0.38 2.09 4.08 0.001 514 21.32 20.98High Wobbe Hot Start 2 1.58 1.22 0.36 2.11 4.41 0.001 507 21.23 20.98
28-Sep Hot Start 3 1.56 1.21 0.35 2.11 4.56 0.002 507 21.07 20.98Hot Start Ave. 1.57 1.21 0.36 2.10 4.42 0.001 507 21.26 20.98Hot Start COV 1% 1% 1% 1% 3% 22% 0.1% N/A N/A
Brake-Specific Emissions, g/hp-hr
Actual, Ref,Fuel Test Name BSHC BSCH4 BSNMHC BSCO BSNOx BSPM BSCO2 hp·hr hp·hr
Cold Start 1 2.75 2.01 0.75 2.14 1.64 0.002 579 19.34 20.30Fuel 1-TK Hot Start 1 2.06 1.52 0.54 2.04 2.37 0.0003 525 20.48 20.30
MN 73 Composite 2.15 1.59 0.57 2.05 2.27 0.001 532 20.32 20.30Low Wobbe Hot Start 2 2.02 1.48 0.53 2.05 2.48 0.001 525 20.41 20.30
15-Sep Hot Start 3 2.01 1.49 0.52 2.04 2.48 0.001 525 20.40 20.30Hot Start Ave. 2.03 1.50 0.53 2.04 2.44 0.001 525 20.43 20.30Hot Start COV 1% 1% 2% 0.3% 2% 52% 0.04% N/A N/A
Cold Start 1 2.04 1.60 0.44 2.38 3.80 0.001 559 20.50 21.40Fuel 2-TK Hot Start 1 1.63 1.13 0.50 2.26 5.09 0.002 510 21.38 21.40
MN 73 Composite 1.68 1.19 0.49 2.28 4.91 0.002 516 21.25 21.40High Wobbe Hot Start 2 1.52 1.23 0.29 2.21 5.52 0.001 509 21.62 21.40
8-Sep Hot Start 3 1.51 1.17 0.34 2.19 5.45 0.002 504 21.59 21.40Hot Start Ave. 1.55 1.18 0.38 2.22 5.35 0.002 507 21.53 21.40Hot Start COV 4% 4% 29% 2% 4% 30% 1% N/A N/A
Cold Start 1 2.18 1.64 0.54 2.20 2.78 0.009 554 21.11 21.32Fuel 15-TK Hot Start 1 1.77 1.34 0.43 2.21 3.72 0.007 508 22.03 21.32
MN 73 Composite 1.83 1.38 0.45 2.21 3.59 0.008 514 21.90 21.32High Wobbe Hot Start 2 1.71 1.32 0.39 2.15 3.84 0.005 504 22.15 21.32
31-Oct Hot Start 3 1.72 1.32 0.40 2.09 3.75 0.003 503 22.11 21.32Hot Start Ave. 1.73 1.33 0.41 2.15 3.77 0.005 505 22.10 21.32Hot Start COV 2% 1% 6% 3% 2% 45% 0.5% N/A N/A
Brake-Specific Emissions, g/hp-hr
Actual, Ref,Fuel Test Name BSHC BSCH4 BSNMHC BSCO BSNOx BSPM BSCO2 hp·hr hp·hr
Cold Start 1 2.99 2.36 0.63 2.07 1.48 0.001 585 19.25 20.10Fuel 3-TK Hot Start 1 2.27 1.80 0.46 1.99 2.01 0.002 529 20.06 20.10
MN 76 Composite 2.37 1.88 0.49 2.00 1.93 0.002 536 19.94 20.10Low Wobbe Hot Start 2 2.13 1.72 0.41 1.97 2.20 0.001 526 20.15 20.10
14-Sep Hot Start 3 2.11 1.70 0.42 1.93 2.25 0.0001 525 20.14 20.10Hot Start Ave. 2.17 1.74 0.43 1.96 2.15 0.001 526 20.12 20.10Hot Start COV 4% 3% 7% 2% 6% 105% 0.4% N/A N/A
Cold Start 1 2.27 1.71 0.56 2.11 2.74 0.001 553 20.07 20.72Fuel 4-TK Hot Start 1 1.74 1.36 0.38 2.10 3.98 0.001 518 21.00 20.72
MN 76 Composite 1.81 1.41 0.40 2.10 3.81 0.001 523 20.87 20.72High Wobbe Hot Start 2 1.64 1.32 0.32 2.08 3.95 0.001 513 21.35 20.72
19-Sep Hot Start 3 1.66 1.32 0.34 2.02 3.86 0.001 511 21.11 20.72Hot Start Ave. 1.68 1.33 0.35 2.07 3.93 0.001 514 21.15 20.72Hot Start COV 3% 2% 8% 2% 2% 29% 1% N/A N/A
Brake-Specific Emissions, g/hp-hr

B-3
Actual, Ref,Fuel Test Name BSHC BSCH4 BSNMHC BSCO BSNOx BSPM BSCO2 hp·hr hp·hr
Cold Start 1 3.37 2.71 0.66 2.06 1.10 0.004 597 18.87 19.71Fuel 5-TK Hot Start 1 2.43 1.98 0.45 1.95 1.63 0.002 545 19.22 19.71
MN 80 Composite 2.56 2.08 0.48 1.96 1.55 0.003 552 19.17 19.71Low Wobbe Hot Start 2 2.29 1.87 0.42 1.93 1.70 0.002 534 19.77 19.71
20-Sep Hot Start 3 2.20 1.82 0.38 1.91 1.71 0.003 526 20.00 19.71Hot Start Ave. 2.31 1.89 0.42 1.93 1.68 0.002 535 19.66 19.71Hot Start COV 5% 4% 9% 1% 3% 10% 2% N/A N/A
Cold Start 1 2.29 1.92 0.37 2.09 2.39 0.001 546 20.45 20.97Fuel 6-TK Hot Start 1 1.68 1.43 0.25 2.08 3.48 0.001 502 21.27 20.97
MN 80 Composite 1.77 1.50 0.27 2.09 3.33 0.001 508 21.15 20.97High Wobbe Hot Start 2 1.56 1.34 0.22 2.00 3.88 0.001 492 21.58 20.97
21-Sep Hot Start 3 1.55 1.34 0.21 2.03 4.11 0.001 494 21.56 20.97Hot Start Ave. 1.60 1.37 0.23 2.04 3.82 0.001 496 21.47 20.97Hot Start COV 5% 4% 10% 2% 8% 16% 1% N/A N/A
Brake-Specific Emissions, g/hp-hr
Actual, Ref,Fuel Test Name BSHC BSCH4 BSNMHC BSCO BSNOx BSPM BSCO2 hp·hr hp·hr
Cold Start 1 4.54 4.49 0.05 2.18 0.83 0.001 599 18.20 19.56Fuel 7-TK Hot Start 1 2.67 2.42 0.25 1.81 1.16 0.001 517 19.45 19.56
MN 89 Composite 2.92 2.70 0.22 1.86 1.11 0.001 528 19.27 19.56Cert. Blend Hot Start 2 2.62 2.42 0.20 1.79 1.24 0.001 522 19.34 19.56
22-Sep Hot Start 3 2.54 2.32 0.22 1.77 1.26 0.0004 519 19.56 19.56Hot Start Ave. 2.61 2.39 0.22 1.79 1.22 0.001 519 19.45 19.56Hot Start COV 3% 3% 11% 1% 4% 55% 1% N/A N/A
Brake-Specific Emissions, g/hp-hr

APPENDIX C
Summarized Emission Results for A DDC Series 50G MK Engine

C-1
Actual, Ref,Fuel Test Name BSHC BSCH4 BSNMHC BSCO BSNOx BSPM BSCO2 hp·hr hp·hr
Cold Start 1 1.25 1.13 0.12 0.03 5.16 0.006 558 22.39 22.27Fuel 1-MK Hot Start 1 0.99 0.98 0.01 0.00 5.15 0.002 533 22.60 22.27
MN 65 Composite 1.03 1.00 0.02 0.00 5.15 0.002 536 22.57 22.27High Wobbe Hot Start 2 0.97 0.96 0.01 0.00 5.04 0.003 538 22.58 22.27
10-Mar Hot Start 3 1.01 0.99 0.02 0.00 4.96 0.001 530 22.66 22.27Hot Start Ave. 0.99 0.98 0.01 0.00 5.05 0.002 534 22.61 22.27Hot Start COV 2% 2% 56% 173% 2% 63% 1% N/A N/A
Brake-Specific Emissions, g/hp-hr
Actual, Ref,Fuel Test Name BSHC BSCH4 BSNMHC BSCO BSNOx BSPM BSCO2 hp·hr hp·hr
Cold Start 1 1.28 1.23 0.05 0.03 4.84 0.005 544 22.95 22.08Fuel 2-MK Hot Start 1 1.09 1.09 0.00 0.00 4.31 0.002 525 22.96 22.08
MN 69 Composite 1.12 1.11 0.01 0.00 4.39 0.002 528 22.96 22.08Low Wobbe Hot Start 2 1.08 1.08 0.00 0.04 4.62 0.002 521 23.07 22.08
13-Mar Hot Start 3 1.13 0.99 0.13 0.04 4.48 0.001 538 23.02 22.08Hot Start Ave. 1.10 1.05 0.04 0.02 4.47 0.002 528 23.02 22.08Hot Start COV 2% 5% 173% 81% 3% 19% 2% N/A N/A
Cold Start 1 1.29 1.23 0.06 0.06 4.56 0.004 536 23.54 22.93Fuel 3-MK Hot Start 1 1.16 1.09 0.07 0.02 4.20 0.002 490 23.73 22.93
MN 69 Composite 1.18 1.11 0.07 0.03 4.25 0.003 497 23.70 22.93High Wobbe Hot Start 2 1.21 0.83 0.38 0.06 4.36 0.003 N/A 23.82 22.93
15-Mar Hot Start 3 1.16 1.16 0.00 0.05 4.43 0.002 514 23.79 22.93Hot Start Ave. 1.18 1.03 0.15 0.04 4.33 0.002 502 23.78 22.93Hot Start COV 2% 17% 134% 41% 3% 11% 3% N/A N/A
Brake-Specific Emissions, g/hp-hr
Actual, Ref,Fuel Test Name BSHC BSCH4 BSNMHC BSCO BSNOx BSPM BSCO2 hp·hr hp·hr
Cold Start 1 1.62 1.54 0.07 0.00 3.51 0.009 546 23.02 22.81Fuel 4-MK Hot Start 1 1.30 1.29 0.02 0.00 3.88 0.003 507 23.44 22.81
MN 73 Composite 1.35 1.32 0.02 0.00 3.83 0.004 512 23.38 22.81Low Wobbe Hot Start 2 1.32 1.32 0.00 0.01 3.85 0.003 514 23.38 22.81
21-Mar Hot Start 3 1.34 1.34 0.00 0.01 3.91 0.004 515 23.54 22.81Hot Start Ave. 1.32 1.32 0.01 0.01 3.88 0.003 512 23.45 22.81Hot Start COV 2% 2% 173% 66% 1% 8% 1% N/A N/A
Cold Start 1 1.42 1.40 0.02 0.04 4.39 0.008 538 22.49 22.13Fuel 5-MK Hot Start 1 1.22 1.22 0.00 0.01 4.29 0.004 520 22.61 22.13
MN 73 Composite 1.25 1.24 0.00 0.01 4.31 0.005 523 22.59 22.13High Wobbe Hot Start 2 1.21 1.21 0.00 0.00 4.26 0.001 523 22.59 22.13
9-Mar Hot Start 3 1.20 1.20 0.00 0.00 4.54 0.003 531 22.72 22.13Hot Start Ave. 1.21 1.21 0.00 0.00 4.36 0.003 525 22.64 22.13Hot Start COV 1% 1% N/A 140% 4% 57% 1% N/A N/A
Brake-Specific Emissions, g/hp-hr

C-2
Actual, Ref,Fuel Test Name BSHC BSCH4 BSNMHC BSCO BSNOx BSPM BSCO2 hp·hr hp·hr
Cold Start 1 1.79 1.73 0.05 0.01 3.39 0.005 549 22.57 22.27Fuel 6-MK Hot Start 1 1.64 1.64 0.00 0.01 3.29 0.004 520 22.72 22.27
MN 80 Composite 1.66 1.66 0.01 0.01 3.31 0.004 524 22.70 22.27Low Wobbe Hot Start 2 1.62 1.62 0.00 0.01 3.33 0.002 518 22.78 22.27
22-Mar Hot Start 3 1.63 1.59 0.04 0.00 3.44 0.001 506 22.82 22.27Hot Start Ave. 1.63 1.62 0.01 0.01 3.36 0.002 514 22.77 22.27Hot Start COV 1% 2% 173% 73% 2% 70% 1% N/A N/A
Cold Start 1 1.46 1.44 0.02 0.01 4.80 0.005 533 23.37 22.95Fuel 7-MK Hot Start 1 1.37 1.37 0.00 0.01 4.53 0.002 512 23.70 22.95
MN 80 Composite 1.39 1.38 0.00 0.01 4.57 0.002 515 23.65 22.95High Wobbe Hot Start 2 1.35 1.35 0.00 0.01 4.66 0.003 514 23.66 22.95
24-Mar Hot Start 3 1.41 1.41 0.00 0.01 4.44 0.006 513 23.59 22.95Hot Start Ave. 1.38 1.38 0.00 0.01 4.54 0.004 513 23.65 22.95Hot Start COV 2% 2% N/A 28% 2% 54% 0.2% N/A N/A
Brake-Specific Emissions, g/hp-hr
Actual, Ref,Fuel Test Name BSHC BSCH4 BSNMHC BSCO BSNOx BSPM BSCO2 hp·hr hp·hr
Cold Start 1 2.16 2.16 0.00 0.01 2.90 0.000 547 22.18 22.14Fuel 8-MK Hot Start 1 2.04 2.04 0.00 0.01 2.70 0.003 516 22.47 22.14
MN 89 Composite 2.05 2.05 0.00 0.01 2.73 0.002 520 22.43 22.14Low Wobbe Hot Start 2 2.12 2.12 0.00 0.03 2.79 0.003 512 22.42 22.14
Hot Start 3 2.06 2.06 0.00 0.01 2.96 0.003 517 22.57 22.14Hot Start Ave. 2.07 2.07 0.00 0.02 2.82 0.003 515 22.49 22.14Hot Start COV 2% 2% N/A 90% 5% 5% 0.5% N/A N/A
Brake-Specific Emissions, g/hp-hr