swiss software industry survey · survey (ssis), we began closing this gap. starting in 2015, the...
TRANSCRIPT
Report
THOMAS L. HUBER, THOMAS HURNI & JENS DIBBERN
INSTITUTE OF INFORMATION SYSTEMS
INFORMATION ENGINEERING
October 2015
Swiss Software Industry Survey
SWISS SOFTWARE INDUSTRY SURVEY
We kindly acknowledge the support of our partners. Without their unwavering com-
mitment this report would have not been possible.
Methodological, substantial and editorial support:
Promotion & Statistical Support
Swiss Software Industry Survey 2015 3
Preface
The software industry is an important engine of growth and
serves as an innovative backbone for many other sectors. In fact,
the Helvetic ICT sector generates an overall turnover of more
than 20 billion Swiss francs, which makes it one of the most im-
portant industry sectors for Switzerland. With a share of roughly
4.5 % of the Swiss GDP*, the ICT sector is nearly as important
as the entire insurance sector—but growing at a significantly
faster pace. However, the current knowledge about the local
software industry is scarce. Therefore, we are happy to an-
nounce that with the first round of the Swiss Software Industry
Survey (SSIS), we began closing this gap.
Starting in 2015, the SSIS will be issued yearly for the entire
Swiss software industry, and is tailored to account for the unique
characteristics of Switzerland. The SSIS provides information
about the current state, emerging trends, and the long-term
developments of the Swiss software industry. Every year, we will
gather information about the economic state and growth pro-
spects of the Swiss software industry and shed light on a yearly
alternating special theme reflecting the latest trends driving the
Swiss software industry. This year’s special theme is partnerships
between platform vendors and small-and-medium-sized comple-
mentors – a type of partnership that is particularly abundant in
Switzerland but that we know only little about.
This report summarizes the key results of the SSIS 2015. We
hope you find the information presented in this report insightful.
We took several measures to make it the best study of its kind:
We have created a contact database with approximately 5000
contacts, we have translated the survey into three different lan-
guages to draw a complete picture of the software industry in all
Swiss regions, and we have developed a robust and reliable sur-
vey instrument following state-of-the-art procedures. Of course
all this work would have been useless without the participation
of more than 400 companies who completed the survey. Our
deepest gratitude goes to those companies – and we are happy
to announce that those companies will be provided with exclu-
sive access to a special benchmarking website to compare key
indicators of their own company against the industry average.
The report starts with a brief executive summary and then con-
tinues with more detailed analyses of revenue, profitability and
growth of the Swiss software industry as well as a special section
on partnerships within this industry. We hope that you will enjoy
reading this report.
Dr. Thomas Huber
Thomas Hurni
Prof. Jens Dibbern
Welcome Address
Dr. Thomas Huber
Thomas Hurni
Prof. Dr. Jens Dibbern
*Source: ICT Switzerland, http://ictswitzerland.ch/themen/wirtschaftskraft/

4 Swiss Software Industry Survey 2015
Content
6 The SSIS and Official Statistics
10 Industry Revenue, Profitability &
Future Growth
18 Sources of Revenue
22 Internationalization
26 Software Workers
30 Partnerships
Swiss Software Industry Survey 2015 5
Executive Summary
402 Responses
22 Cantons
8.5 % EBIT Margin
12 % Growth
16 % Export Share
50 % Germany
No. 1 Microsoft
50 % 10 Years+
80 % Loyal Partners
To meet highest research standards, we developed and refined a new survey
instrument following state-of-the-art procedures of construct development.
With this year’s SSIS, the new instrument has been applied for the first time.
The SSIS was very well received in the Swiss software industry resulting in a
total of 402 complete responses from 22 cantons covering all four language
regions. Methodological rigor and high response rate add to the quality of the
SSIS and enable the provision of reliable knowledge about the current state,
latest trends and long-term developments of the Swiss software industry.
The SSIS 2015 – Methodological Rigor & High Response Rate
The Swiss Software Industry is highly profitable. The EBIT margin averaged
8.5 % in 2014. The Swiss Software Industry is also positive about the future,
expecting their revenue and their workforce to grow at an average rate of
12 %. This optimistic outlook also manifests in high investments for research
and development averaging 14 % of total revenue.
Robust Profitability and an Optimistic View of the Future, Steady
Growth Prospects
The Swiss software industry is not very internationalized with software exports
accounting for only 16 % of revenue. Exports are also not geographically di-
versified—with Germany accounting for almost half of all software exports
and France following well behind in second place (13 %). Thus, the Swiss
software industry exports more to Germany and France than to the rest of the
world.
Low Internationalization
Due to their limited size and resource endowments Swiss software companies
increasingly partner with large international platform vendors such as Mi-
crosoft, Apple, and SAP. Microsoft is by far the most important platform ven-
dor—42 % of the surveyed companies consider Microsoft to be their most
important partner. Oracle (9%), Apple (6%), SAP (6%) und IBM (4%) follow
at considerable distance.
Even though partnerships with large platform vendors are frequently de-
scribed as superficial and ad-hoc, these partnerships are surprisingly stable
and long-lasting in Switzerland. More than 50 % of the partnerships are older
than 10 years, and younger partnerships—e.g., with Apple or Google - rather
reflect new technological trends than disloyal partners. Generally, Swiss soft-
ware companies plan to remain loyal: 80 % plan to continue their partnership
with their most important platform owner—and switching to another plat-
form owner is rejected by almost all companies.
Loyal Partners
6 Swiss Software Industry Survey 2015
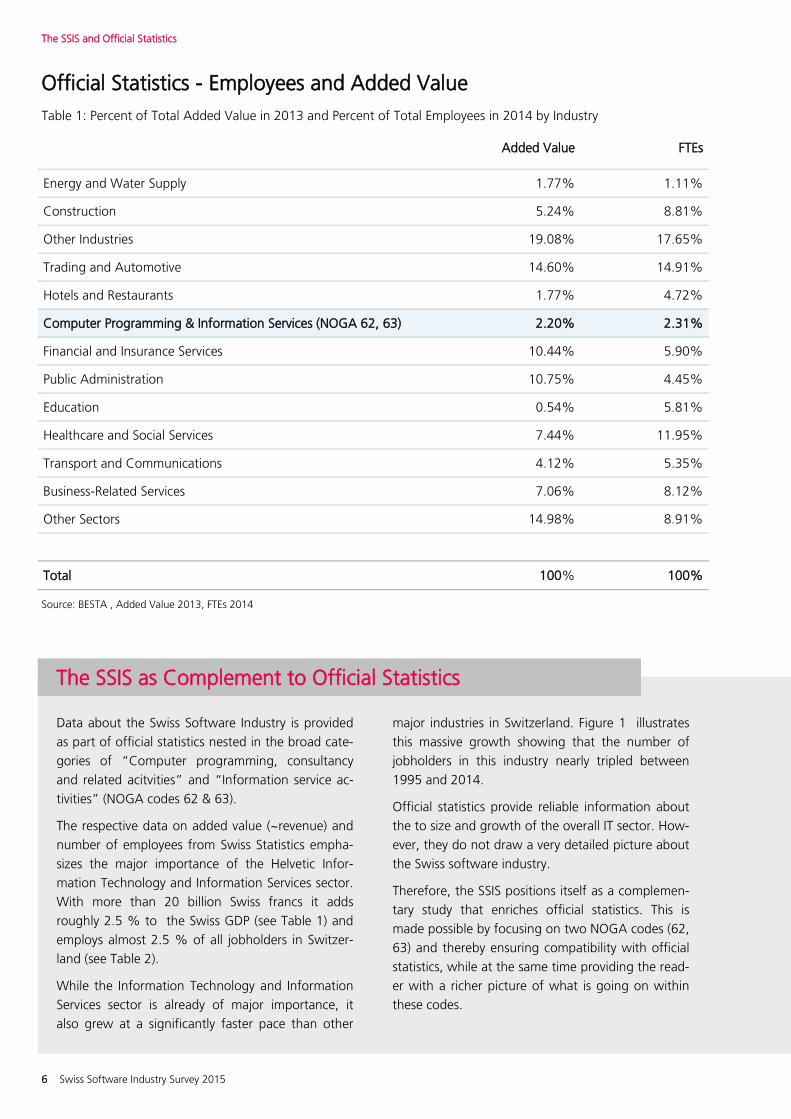
Official Statistics - Employees and Added Value
Table 1: Percent of Total Added Value in 2013 and Percent of Total Employees in 2014 by Industry
Source: BESTA , Added Value 2013, FTEs 2014
The SSIS and Official Statistics
Added Value FTEs
Energy and Water Supply 1.77% 1.11%
Construction 5.24% 8.81%
Other Industries 19.08% 17.65%
Trading and Automotive 14.60% 14.91%
Hotels and Restaurants 1.77% 4.72%
Computer Programming & Information Services (NOGA 62, 63) 2.20% 2.31%
Financial and Insurance Services 10.44% 5.90%
Public Administration 10.75% 4.45%
Education 0.54% 5.81%
Healthcare and Social Services 7.44% 11.95%
Transport and Communications 4.12% 5.35%
Business-Related Services 7.06% 8.12%
Other Sectors 14.98% 8.91%
Total 100% 100%
Data about the Swiss Software Industry is provided
as part of official statistics nested in the broad cate-
gories of “Computer programming, consultancy
and related acitvities” and “Information service ac-
tivities” (NOGA codes 62 & 63).
The respective data on added value (~revenue) and
number of employees from Swiss Statistics empha-
sizes the major importance of the Helvetic Infor-
mation Technology and Information Services sector.
With more than 20 billion Swiss francs it adds
roughly 2.5 % to the Swiss GDP (see Table 1) and
employs almost 2.5 % of all jobholders in Switzer-
land (see Table 2).
While the Information Technology and Information
Services sector is already of major importance, it
also grew at a significantly faster pace than other
major industries in Switzerland. Figure 1 illustrates
this massive growth showing that the number of
jobholders in this industry nearly tripled between
1995 and 2014.
Official statistics provide reliable information about
the to size and growth of the overall IT sector. How-
ever, they do not draw a very detailed picture about
the Swiss software industry.
Therefore, the SSIS positions itself as a complemen-
tary study that enriches official statistics. This is
made possible by focusing on two NOGA codes (62,
63) and thereby ensuring compatibility with official
statistics, while at the same time providing the read-
er with a richer picture of what is going on within
these codes.
The SSIS as Complement to Official Statistics

Swiss Software Industry Survey 2015 7
The SSIS and Official Statistics
Employees in the Swiss ICT Sector
Figure 1: Number of FTEs in NOGA 62 & 63 from 1995 - 2014
This report provides you with a more detailed pic-
ture of the Swiss Software Industry. In particular,
the SSIS enables the following additional insights:
Lagging indicators about employees and rev-
enue constructed from latest data collected
in 2015
Leading indicators to forecast employees and
revenue.
Novel indicators about the industries profita-
bility and R&D investments.
Analyses along practically relevant categories
(e.g., standard vs. individual software, perma-
nent employees vs. freelancers).
First look at internationalization
First look at tasks of software workers
First look at partnerships with platform own-
ers
Drawing a Richer Picture of the Swiss Software Industry
0.00
10'000.00
20'000.00
30'000.00
40'000.00
50'000.00
60'000.00
70'000.00
80'000.00
90'000.00
1995 1997 1999 2001 2003 2005 2007 2009 2011 2013 2015
Fu
ll T
ime
Equ
ivale
nts
Years
Source: BESTA 2014
8 Swiss Software Industry Survey 2015
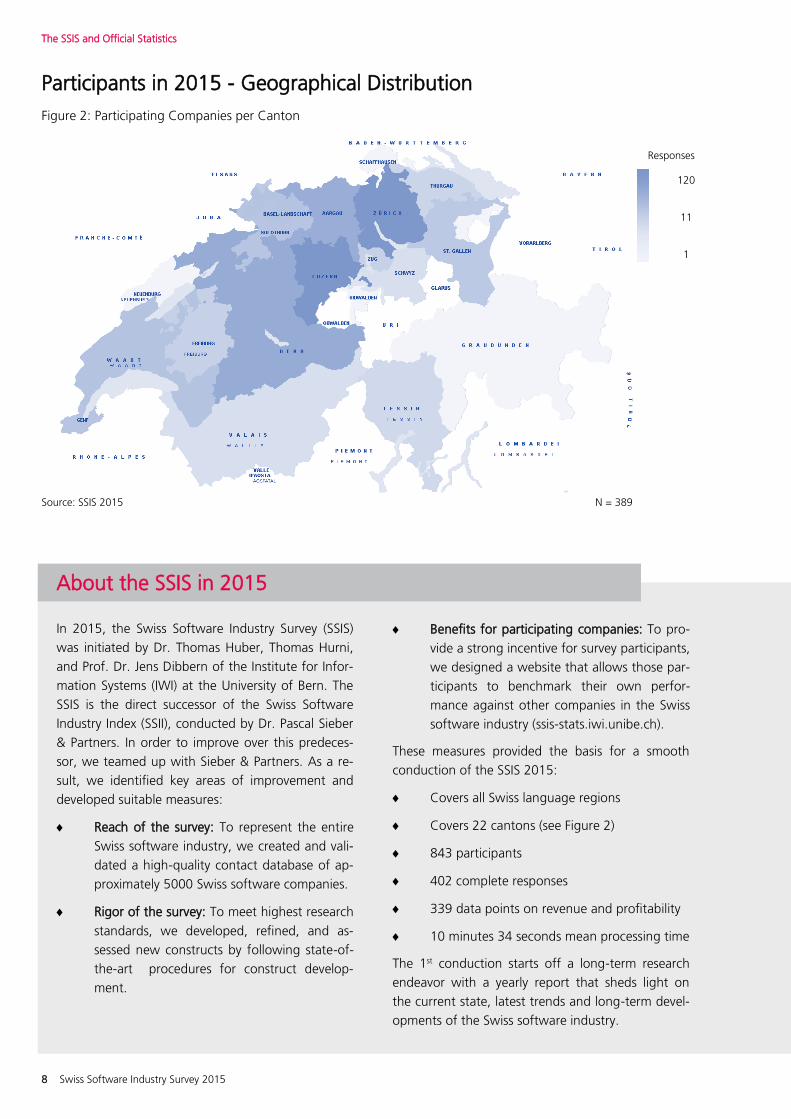
Participants in 2015 - Geographical Distribution
Figure 2: Participating Companies per Canton
The SSIS and Official Statistics
Responses
120
11
1
Source: SSIS 2015 N = 389
In 2015, the Swiss Software Industry Survey (SSIS)
was initiated by Dr. Thomas Huber, Thomas Hurni,
and Prof. Dr. Jens Dibbern of the Institute for Infor-
mation Systems (IWI) at the University of Bern. The
SSIS is the direct successor of the Swiss Software
Industry Index (SSII), conducted by Dr. Pascal Sieber
& Partners. In order to improve over this predeces-
sor, we teamed up with Sieber & Partners. As a re-
sult, we identified key areas of improvement and
developed suitable measures:
Reach of the survey: To represent the entire
Swiss software industry, we created and vali-
dated a high-quality contact database of ap-
proximately 5000 Swiss software companies.
Rigor of the survey: To meet highest research
standards, we developed, refined, and as-
sessed new constructs by following state-of-
the-art procedures for construct develop-
ment.
Benefits for participating companies: To pro-
vide a strong incentive for survey participants,
we designed a website that allows those par-
ticipants to benchmark their own perfor-
mance against other companies in the Swiss
software industry (ssis-stats.iwi.unibe.ch).
These measures provided the basis for a smooth
conduction of the SSIS 2015:
Covers all Swiss language regions
Covers 22 cantons (see Figure 2)
843 participants
402 complete responses
339 data points on revenue and profitability
10 minutes 34 seconds mean processing time
The 1st conduction starts off a long-term research
endeavor with a yearly report that sheds light on
the current state, latest trends and long-term devel-
opments of the Swiss software industry.
About the SSIS in 2015

Swiss Software Industry Survey 2015 9
The SSIS and Official Statistics
22% of the companys generate
of the revenue
80%
Concentration of Revenue in Our Sample
Figure 3: Distribution of Revenue Among the Participating Companies
Source: SSIS 2015 N = 340
The Swiss Software Industry is not very concentrat-
ed. The largest 20% of the companies in our sam-
ple are responsible for around 80% of the industry
revenue (see Figure 3) . Compared to other indus-
tries this is a rather low degree of concentration.
Accordingly, the Swiss Software Industry stretches
far beyond the ubiquitous heavy-weights of the
international software market and many small and
medium-sized companies make considerably reve-
nue as well and employ thousands of software
workers.
To reflect this low degree of concentration in our
survey, it was important to contact a large number
of companies so that the study would not be biased
by the responses of a few heavy-weights.
Accordingly, we have contacted 4955 companies
and were able gather 402 complete responses,
amongst them 340 that indicated their revenue.
This represents a considerable improvement over
predecessor studies with fewer contacts and fewer
responses.
The SSIS is not designed as a fixed-panel study, in-
stead, software companies are invited to join the
survey next year to further improve its reach. If you
want your company to become part of the SSIS
2016 and benefit from personal benchmarking,
please register here: registration.iwi.unibe.ch
SME Structure and the Importance of Reach
0%
10%
20%
30%
40%
50%
60%
70%
80%
90%
100%
0% 10% 20% 30% 40% 50% 60% 70% 80% 90% 100%
Reve
nue
Companies

10 Swiss Software Industry Survey 2015
Swiss Software Industry Survey 2015 11
Spotlight on
Revenue, Profitability & Future Growth

12 Swiss Software Industry Survey 2015
Distribution of Participating Companys
Figure 4: Number of Companies per Field of Activity as % of Total Responses
Source: SSIS 2015
Spotlight on latest Developments and the Future
Individual and standard software companies domi-
nate our sample—each accounting for about one
third of responses. Consulting follows with roughly
12 %. Software integrators and technology and
service providers follow at some distance (6 %) (see
Figure 4).
This picture changes only slightly when looking at
revenues (see Figure 5): Individual software manu-
facturers account for 37 %, standard software man-
ufacturers for 27 %, and consultancies for 15 % of
the industry revenue.
Looking at employee distribution (see Figure 6),
standard software manufacturers employ 39 % of
software workers. Standard software manufacturers
follow with 29 %, and consulting with 13 %.
Comparing these numbers provides two interesting
insights. First, our data shows that the average reve-
nue of software companies varies between the dif-
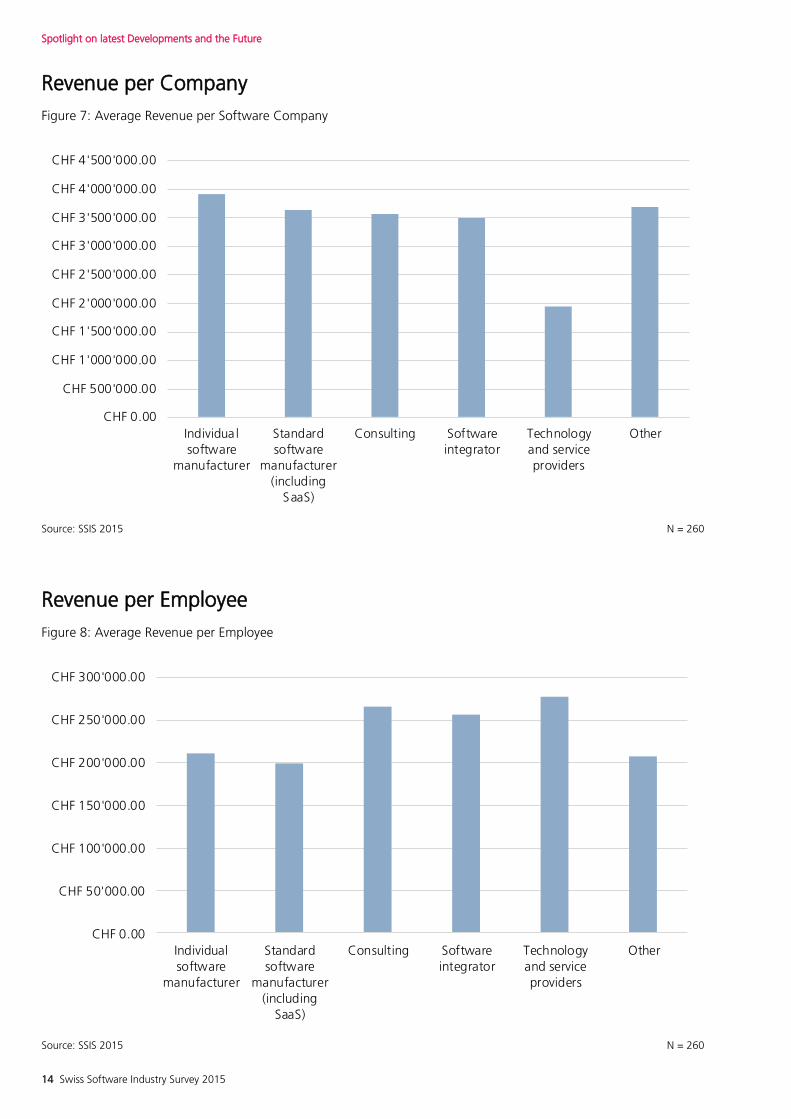
ferent fields of activity (see Figure 7): Individual soft-
ware manufactures are on average the largest com-
panies in terms of revenue (3.9 Mio CHF), followed
by standard software manufactures (3.6 Mio CHF),
consultancies (3.5 Mio. CHF) and software Integra-
tors (3.5 Mio CHF). Technology and service provid-
ers are far behind with 1.9 Mio CHF.
The second interesting insight emanates from a
comparison of average revenue per employee (see
Figure 8). In this category, technology and service
providers rise to the top with 277 kCHF, closely fol-
lowed by consultancies (265 kCHF) and software
integrators (255 kCHF). Individual software manu-
facturers (210 kCHF) and standard software manu-
facturers (199 kCHF) follow at some distance.
Thus, individual and standard software manufactur-
ers make disproportionally high revenue per compa-
ny but disproportionally low revenjue per employee.
In contrast, technology and service providers make
disproportionally low revenue per company but dis-
proportionally high revenue per employee.
Manufacturers of Individual and Standard Software Dominate
N = 705
Individual software manufacturer31.77%
Standard software manufacturer (including SaaS)30.92%
Consulting12.77%
Software integrator6.67%
Technology and service providers6.38%
Other11.49%
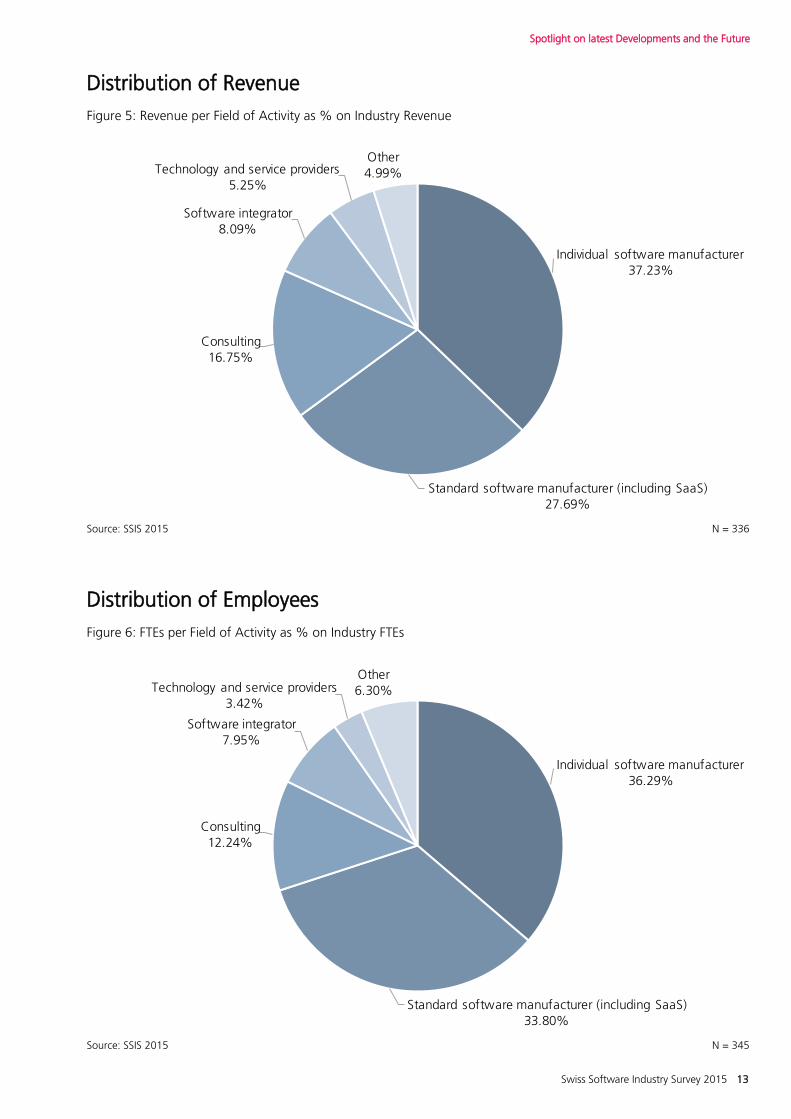
Swiss Software Industry Survey 2015 13
Distribution of Revenue
Figure 5: Revenue per Field of Activity as % on Industry Revenue
Spotlight on latest Developments and the Future
Distribution of Employees
Figure 6: FTEs per Field of Activity as % on Industry FTEs
Source: SSIS 2015 N = 336
Source: SSIS 2015 N = 345
Individual software manufacturer37.23%
Standard software manufacturer (including SaaS)27.69%
Consulting16.75%
Software integrator8.09%
Technology and service providers5.25%
Other4.99%
Individual software manufacturer36.29%
Standard software manufacturer (including SaaS)33.80%
Consulting12.24%
Software integrator7.95%
Technology and service providers3.42%
Other6.30%
14 Swiss Software Industry Survey 2015
Spotlight on latest Developments and the Future
Revenue per Company
Figure 7: Average Revenue per Software Company
Source: SSIS 2015 N = 260
Revenue per Employee
Figure 8: Average Revenue per Employee
CHF 0.00
CHF 50'000.00
CHF 100'000.00
CHF 150'000.00
CHF 200'000.00
CHF 250'000.00
CHF 300'000.00
Individualsoftware
manufacturer
Standardsoftware
manufacturer(including
SaaS)
Consulting Softwareintegrator
Technologyand serviceproviders
Other
CHF 0.00
CHF 500'000.00
CHF 1'000'000.00
CHF 1'500'000.00
CHF 2'000'000.00
CHF 2'500'000.00
CHF 3'000'000.00
CHF 3'500'000.00
CHF 4'000'000.00
CHF 4'500'000.00
Individua lsoftware
manufacturer
Standardsoftware
manufacturer(including
SaaS)
Consulting Softwareintegrator
Technologyand serviceproviders
Other
Source: SSIS 2015 N = 260
Swiss Software Industry Survey 2015 15
Spotlight on latest Developments and the Future
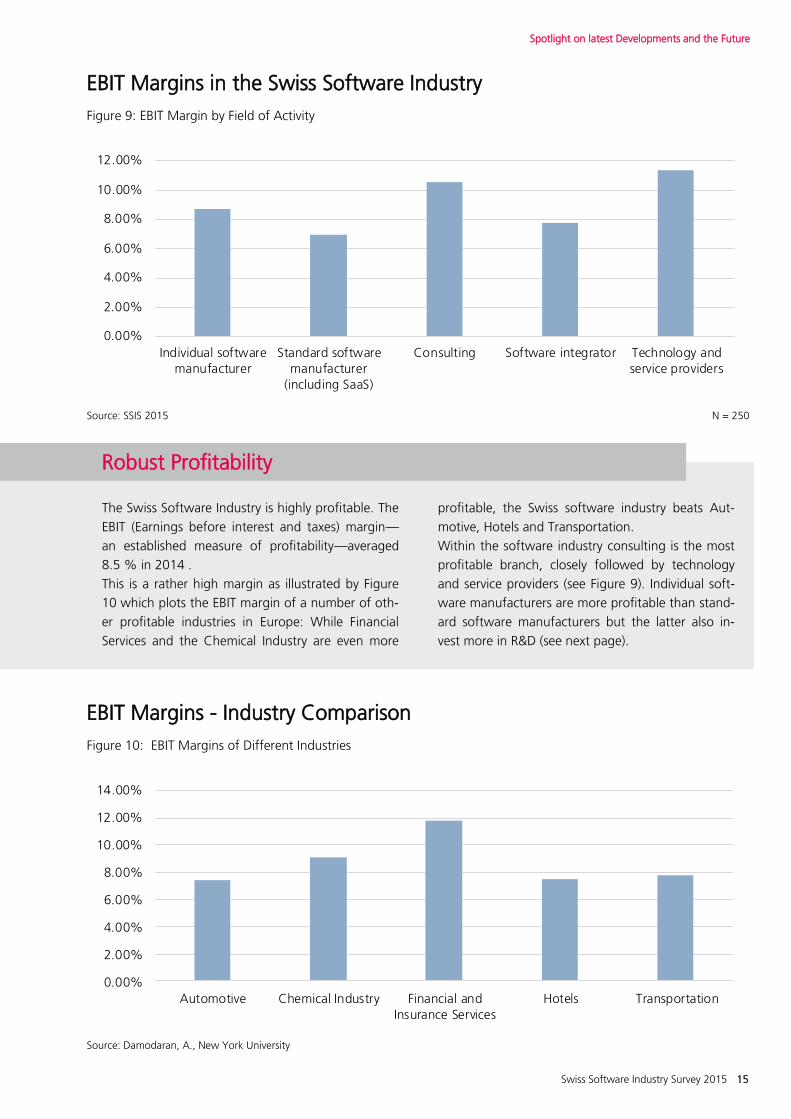
The Swiss Software Industry is highly profitable. The
EBIT (Earnings before interest and taxes) margin—
an established measure of profitability—averaged
8.5 % in 2014 .
This is a rather high margin as illustrated by Figure
10 which plots the EBIT margin of a number of oth-
er profitable industries in Europe: While Financial
Services and the Chemical Industry are even more
profitable, the Swiss software industry beats Aut-
motive, Hotels and Transportation.
Within the software industry consulting is the most
profitable branch, closely followed by technology
and service providers (see Figure 9). Individual soft-
ware manufacturers are more profitable than stand-
ard software manufacturers but the latter also in-
vest more in R&D (see next page).
Robust Profitability
EBIT Margins in the Swiss Software Industry
Figure 9: EBIT Margin by Field of Activity
Source: SSIS 2015 N = 250
Source: Damodaran, A., New York University
EBIT Margins - Industry Comparison
Figure 10: EBIT Margins of Different Industries
0.00%
2.00%
4.00%
6.00%
8.00%
10.00%
12.00%
Individual softwaremanufacturer
Standard softwaremanufacturer
(including SaaS)
Consulting Software integrator Technology andservice providers
0.00%
2.00%
4.00%
6.00%
8.00%
10.00%
12.00%
14.00%
Automotive Chemical Industry Financial andInsurance Services
Hotels Transportation
16 Swiss Software Industry Survey 2015
Expected Growth in Revenue
Figure 12: Expected Year Over Year Revenue Growth 2014 - 2015
Spotlight on latest Developments and the Future
Source: SSIS 2015 N = 336
R&D Investments
Figure 13: R&D Investments in 2014 as Percentage of Revenue
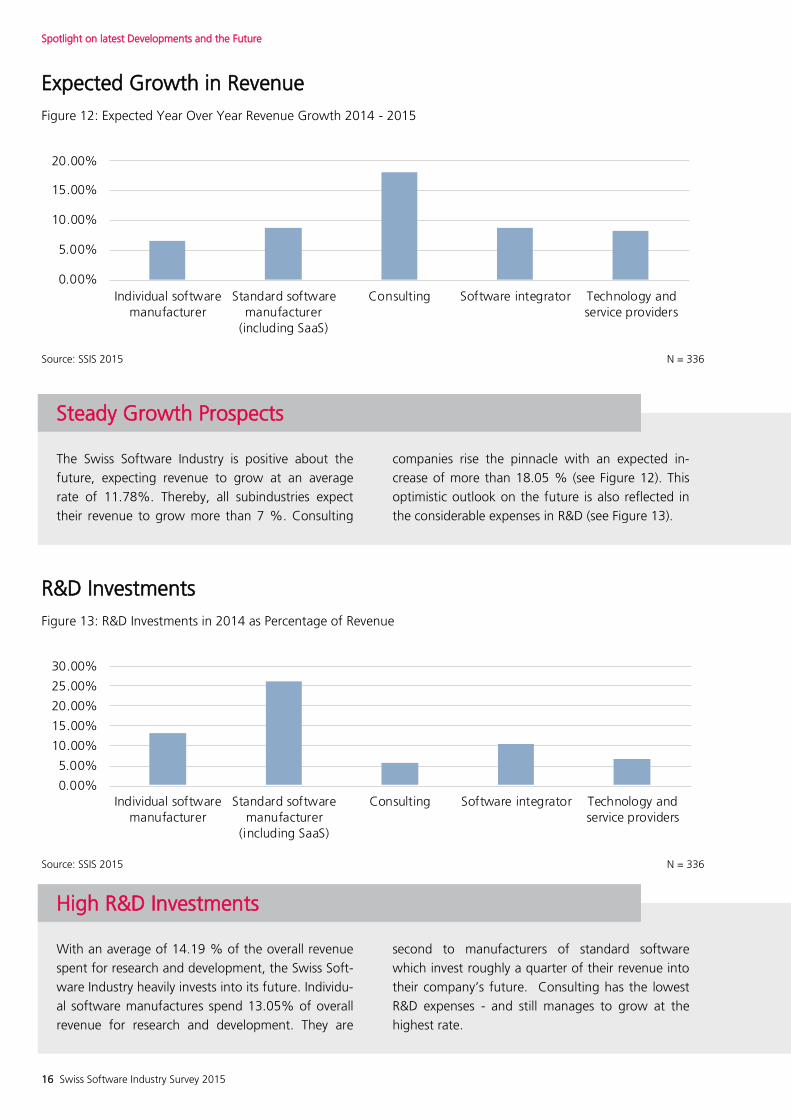
The Swiss Software Industry is positive about the
future, expecting revenue to grow at an average
rate of 11.78%. Thereby, all subindustries expect
their revenue to grow more than 7 %. Consulting
companies rise the pinnacle with an expected in-
crease of more than 18.05 % (see Figure 12). This
optimistic outlook on the future is also reflected in
the considerable expenses in R&D (see Figure 13).
Steady Growth Prospects
With an average of 14.19 % of the overall revenue
spent for research and development, the Swiss Soft-
ware Industry heavily invests into its future. Individu-
al software manufactures spend 13.05% of overall
revenue for research and development. They are
second to manufacturers of standard software
which invest roughly a quarter of their revenue into
their company’s future. Consulting has the lowest
R&D expenses - and still manages to grow at the
highest rate.
High R&D Investments
0.00%
5.00%
10.00%
15.00%
20.00%
Individual softwaremanufacturer
Standard softwaremanufacturer
(including SaaS)
Consulting Software integrator Technology andservice providers
0.00%
5.00%
10.00%
15.00%
20.00%
25.00%
30.00%
Individual softwaremanufacturer
Standard softwaremanufacturer
(including SaaS)
Consulting Software integrator Technology andservice providers
Source: SSIS 2015 N = 336
Swiss Software Industry Survey 2015 17
Employee Growth Prospects
Figure 14: Expected Year Over Year Growth of Workforce
Source: SSIS 2015 N = 345
Employee Growth Prospects
Figure 15: Expected Year Over Year Growth - Permanent Employees vs. Freelancers
Source: SSIS 2015 N = 345
Spotlight on latest Developments and the Future
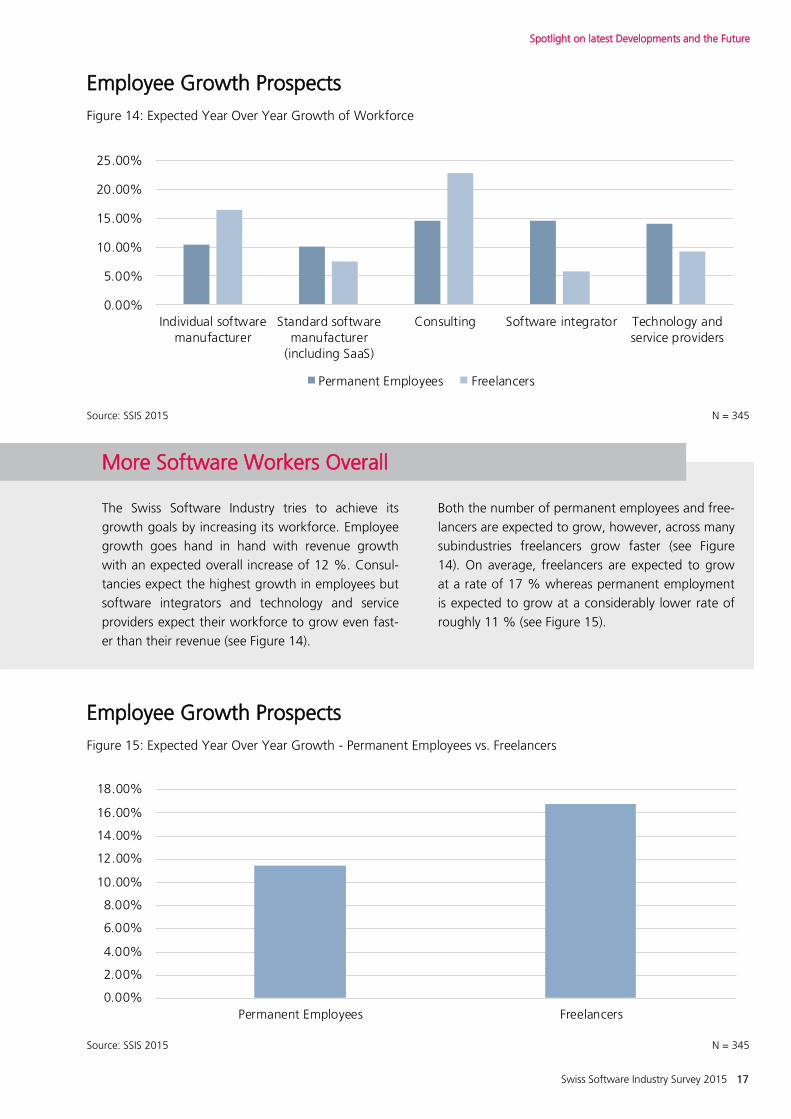
The Swiss Software Industry tries to achieve its
growth goals by increasing its workforce. Employee
growth goes hand in hand with revenue growth
with an expected overall increase of 12 %. Consul-
tancies expect the highest growth in employees but
software integrators and technology and service
providers expect their workforce to grow even fast-
er than their revenue (see Figure 14).
Both the number of permanent employees and free-
lancers are expected to grow, however, across many
subindustries freelancers grow faster (see Figure
14). On average, freelancers are expected to grow
at a rate of 17 % whereas permanent employment
is expected to grow at a considerably lower rate of
roughly 11 % (see Figure 15).
More Software Workers Overall
0.00%
5.00%
10.00%
15.00%
20.00%
25.00%
Individual softwaremanufacturer
Standard softwaremanufacturer
(including SaaS)
Consulting Software integrator Technology andservice providers
Permanent Employees Freelancers
0.00%
2.00%
4.00%
6.00%
8.00%
10.00%
12.00%
14.00%
16.00%
18.00%
Permanent Employees Freelancers
18 Swiss Software Industry Survey 2015
Spotlight on
Sources of Revenue

Swiss Software Industry Survey 2015 19
Spotlight on Sources of Revenue
Sources of Revenue - by Software Task
Figure 16: Revenue from Different Software Tasks as % of Industry Revenue
Source: SSIS 2015 N = 293
Development of custom-made software22.79%
Maintenance and support19.53%
Customization (3rd-party standard software)12.85%
Royalties (own software licenses)11.97%
Customization (self-developed standard software)
10.68%
Royalties (resale)12.91%
Cloud solutions 3.10%
Embedded software 2.03% Other4.14%
The Swiss Software Industry’s main source of reve-
nue is service. The Development of custom-made
software and Maintenance and support accounts
for more than 40 % of the industry revenue. Cus-
tomization of 3rd-party software and Customization
of self-developed software together account for
roughly a quarter of the industry revenue. Only after
that comes revenue from royalties for software li-
censes (resale, own licenses) with another quarter
(see Figure 16).
With roughly 95 % almost all the revenue of the
Swiss software industry comes from corporate in
contrast to private customers. Thus, private custom-
ers account for the tiny proportion of 5 % of indus-
try revenue. While it is not surprising that corporate
customers account for a large proportion of reve-
nue, the sharp focus on professional services for
corporate customers sets the Swiss Software Indus-
try apart from the US software industry in which
consumer-focused companies such as Google and
Apple have become dominant players.
The strong focus on professional services also al-
ludes to the importance of partnerships with plat-
form owners which are often leveraged to provide
specialized professional services and products that
serve as complements to an established platform
(see special section on Partnerships, p. 30).
Main Source of Revenue: Professional Services
Among the participants,
develop custom software
22.73 %

20 Swiss Software Industry Survey 2015
Sources of Revenue - Cross-Industry vs. Specialized Solutions
Figure 17: Percentage of Companies Providing Solutions for...
Source: SSIS 2015
Spotlight on Sources of Revenue
More than 80 % of the companies in the Swiss
Software Industry generate their revenue with offer-
ings, specialized on distinct industries. 40 % of the
Swiss software companies even generate all of their
revenue by occupying specific industry niches (see
Figure 17).
Yet, on which industries do Swiss software compa-
nies focus? The three most frequently mentioned
industry specializations were Industry and manufac-
turing, Public administration as well as Trade and
transportation (see Figure 18). Notably, the Financial
services industry did not reach the Top 3—despite
its great importance for Switzerland. However, com-
bined with the insurance activities, it would further
forge ahead.
Yet, if the revenue of the software companies is
factored in, the picture changes dramatically (see
Figure 19). Software companies focusing on the
Financial services industry account for more than 20
% of total revenue and are thus far ahead of any
other industry specialization. Public administration
remains the second most important industry, fol-
lowed by Manufacturing.
Overall, this suggests that more software companies
focus on Industry and manufacturing than on Finan-
cial services. But the fewer software companies that
focus on financial services are bigger and overall
generate nearly twice as much revenue.
Strong Industry Specialization
N = 290
Solutions for specific industrial sectors40.35%
Solutions applicable to different industrial sectors17.08%
Both42.56%
In the sample,
focus on specific industries
40.35 %

Swiss Software Industry Survey 2015 21
Industry Specialization of Swiss Software Companies
Figure 18: Percentage of Companies Stating to Focus on...
Spotlight on Sources of Revenue
Sources of Revenue - Revenue by Industry Specialization
Figure 19: Revenue of Software Companies Focusing on the Following Industries as % of Industry Revenue
Source: SSIS 2015 N = 290
Source: SSIS 2015 N = 209
0% 2% 4% 6% 8% 10% 12% 14% 16%
Industry and manufacturing
Public administration and defense; compulsory social security
Trade, transportation and storage
Financial activities
IT services
Telecommunications
Insurance activities
Construction
Publishing, audiovisual and broadcasting activities
Real estate activities
0% 5% 10% 15% 20% 25%
Financial activities
Public administration and defense; compulsory social security
Insurance activities
Industry and manufacturing
Trade, transportation and storage
Telecommunications
IT services
Construction
Real estate activities
Publishing, audiovisual and broadcasting activities

22 Swiss Software Industry Survey 2015

Swiss Software Industry Survey 2015 23
Spotlight on
Internationalization

24 Swiss Software Industry Survey 2015
Internationalization - Export Revenue by Country
Figure 20: Revenue from Different Countries as % of Industry Revenue
Source: SSIS 2015
Spotlight on Internationalization
N = 293
84.41%Switzerland
49.21%Germany
12.75%France
7.71%Rest of Europe
7.59%North America
5.95%Asia and Middle East
5.70%United Kingdom
3.81%Benelux
3.61%Austria
2.22%Italy
1.46%Other
Only 16 % of the revenue of the Swiss Software
industry comes from countries other than Switzer-
land; and nearly half of that revenue comes from a
single country - Germany. France follows at great
distance (13 %). Switzerland has higher software
exports to Germany and France than to the rest of
the world (see Figure 20).
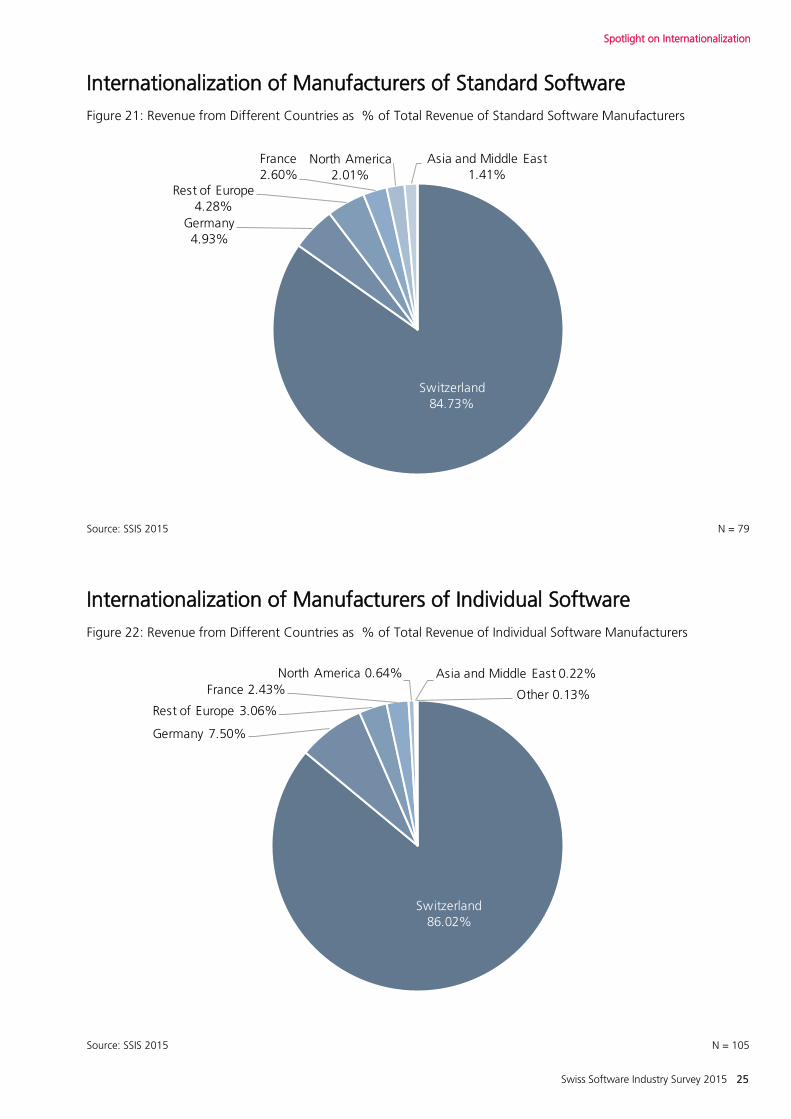
If you split the sample between manufacturers of
standard software and manufacturers of individual
software the picture only changes slightly (see Fig-
ure 21 and Figure 22). The geographic diversion of
exports remains low. Nonetheless, manufactures of
standard software are more internationalized (15.27
%) than manufacturers of individual software
(13.98 %).
The low degree of internationalization even for
manufacturers of standard software is surprising,
given that once standard software is developed, it
can be sold to non-Swiss customers without exten-
sive internationalizing efforts. Thus, internationaliza-
tion provides ample growth opportunities for Swiss
manufactures of standard software.
In contrast, the business model of individual soft-
ware manufacturers does not scale as easily and is
likely to be more limited by high labor cost.
The Low Internationalization of Swiss Software Companies
Only,
Revenue from exports
15.59 %
Swiss Software Industry Survey 2015 25
Internationalization of Manufacturers of Standard Software
Figure 21: Revenue from Different Countries as % of Total Revenue of Standard Software Manufacturers
Spotlight on Internationalization
Internationalization of Manufacturers of Individual Software
Figure 22: Revenue from Different Countries as % of Total Revenue of Individual Software Manufacturers
Source: SSIS 2015 N = 79
Source: SSIS 2015 N = 105
Switzerland84.73%
Germany4.93%
Rest of Europe4.28%
France2.60%
North America2.01%
Asia and Middle East1.41%
Switzerland86.02%
Germany 7.50%
Rest of Europe 3.06%
France 2.43%
North America 0.64% Asia and Middle East 0.22%
Other 0.13%

26 Swiss Software Industry Survey 2015

Swiss Software Industry Survey 2015 27
Spotlight on
Software Workers

28 Swiss Software Industry Survey 2015
Job Roles of Swiss Software Workers
Figure 23: Percentage of Employees in Respective Role
Source: SSIS 2015
Spotlight on Software Workers
N = 419
Development41.92%
PM11.96%
Operation11.89%
Management9.79%
Planning9.18%
Research & Development6.18%
Organisation4.81%
Other4.27%
Software work is multi-faceted. It ranges from more
technical roles such as Development and Operations
to more managerial tasks such as Project Manage-
ment and Planning. So, in which roles do Swiss soft-
ware workers actually work?
Figure 23 answers this question: Software develop-
ers are by far the largest fraction inside Swiss soft-
ware companies accounting for roughly 42 % of
the workforce. Project management, Operations,
Higher Management and Planning all account for
roughly 10 % of the workforce.
Swiss software workers seem to be hardly involved
in other value-generating activities such as market-
ing and sales or internationalization strategies—
maybe this is another explanation for the low export
share of Swiss software companies (see Figure 20,
p. 24) .
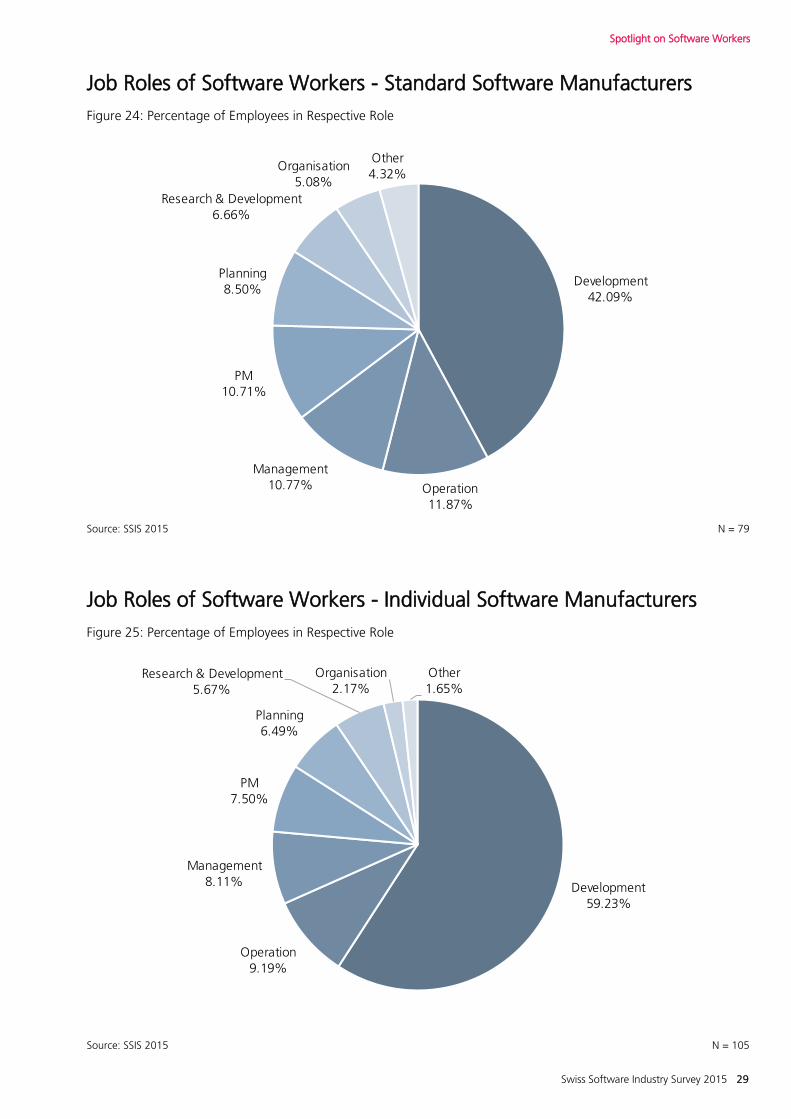
Comparing job roles of Manufacturers of individual
software and Manufactures of standard software
shows that the first has a much higher proportion
of Development workers than the latter. The latter
instead employ more software workers focusing on
Operations and Management (see Figure 24 and
Figure 25).
Focus on Development
Amongst the employees,
are software developers
41.92 %
Swiss Software Industry Survey 2015 29
Job Roles of Software Workers - Standard Software Manufacturers
Figure 24: Percentage of Employees in Respective Role
Spotlight on Software Workers
Job Roles of Software Workers - Individual Software Manufacturers
Figure 25: Percentage of Employees in Respective Role
Source: SSIS 2015 N = 79
Source: SSIS 2015 N = 105
Development42.09%
Operation11.87%
Management10.77%
PM10.71%
Planning8.50%
Research & Development6.66%
Organisation5.08%
Other4.32%
Development59.23%
Operation9.19%
Management8.11%
PM7.50%
Planning6.49%
Research & Development5.67%
Organisation2.17%
Other1.65%

30 Swiss Software Industry Survey 2015

Swiss Software Industry Survey 2015 31
Spotlight on
Partnerships

32 Swiss Software Industry Survey 2015
Software Partnerships - Development vs. Implementation Partners
Figure 26: Percentage of Software Companies that are Official Development vs. Implementation Partners
Source: SSIS 2015
Spotlight on Partnerships
N = 214
Software Developers75.07%
Software Configurators8.20%
Others 16.73%
Due to their small size and their focus on niche solu-
tions, most Swiss IT companies have limited re-
source endowments. One way to deal with this is by
collaborating with large multi-national companies
like Google or IBM in so-called platform ecosystems
to access external resources. Such partnerships are
indeed very important in the Swiss software indus-
try: 214 companies in our sample stated to maintain
at least one partnership. 75 % of those partnerships
are development partnerships, 8 % are configura-
tion partnerships, and the remaining 17 % are part-
ners with another status (see Figure 26).
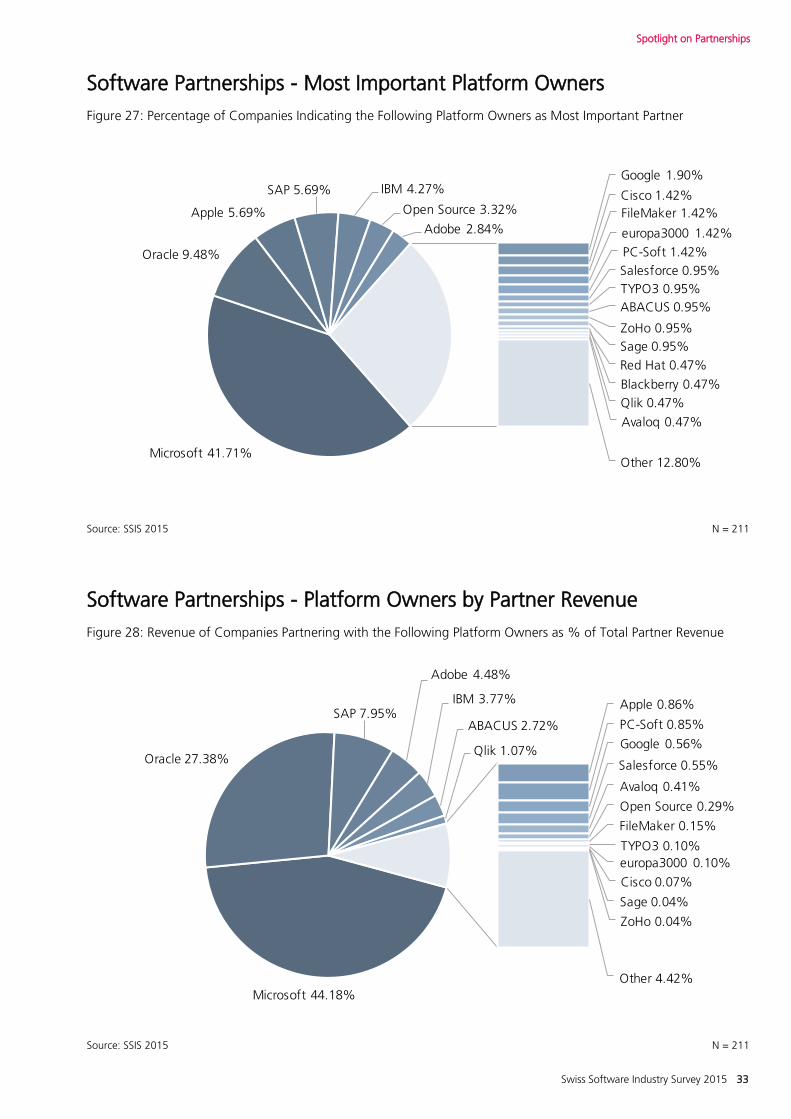
The platform owner with by far the most partners in
our sample is Microsoft—a third of all partnerships
are with this company. Apple and Oracle the num-
ber two and three respectively lag far behind ac-
counting for roughly 10% of partnerships in our
sample (see Figure 27). The importance of Mi-
crosoft as a partner for the Swiss software compa-
nies is even more evident when asked about the
most important partnership (see Figure 28): Roughly
42 % indicated Microsoft to be their most im-
portant partner, followed by Oracle (10 %). Inter-
estingly, only 5 % of the companies indicate Apple,
SAP, or IBM as their most important partner.
The picture essentially stays the same if revenue of
partners is factored (see Figure 28)—with two no-
table exception: The Swiss platform owner ABACUS
advances to the 6th place, and Oracle gains consid-
erably in importance.
Partnerships are important - particularly with Microsoft
Amongst the participants,
maintain partnerships
214
Swiss Software Industry Survey 2015 33
Software Partnerships - Platform Owners by Partner Revenue
Figure 28: Revenue of Companies Partnering with the Following Platform Owners as % of Total Partner Revenue
Spotlight on Partnerships
Software Partnerships - Most Important Platform Owners
Figure 27: Percentage of Companies Indicating the Following Platform Owners as Most Important Partner
Source: SSIS 2015 N = 211
Source: SSIS 2015 N = 211
Microsoft 41.71%
Oracle 9.48%
Apple 5.69%
SAP 5.69% IBM 4.27%
Open Source 3.32%
Adobe 2.84%
Google 1.90%
Cisco 1.42%
FileMaker 1.42%
europa3000 1.42%
PC-Soft 1.42%
Salesforce 0.95%
TYPO3 0.95%
ABACUS 0.95%
ZoHo 0.95%
Sage 0.95%
Blackberry 0.47%
Red Hat 0.47%
Qlik 0.47%
Avaloq 0.47%
Other 12.80%
Microsoft 44.18%
Oracle 27.38%
SAP 7.95%
Adobe 4.48%
IBM 3.77%
ABACUS 2.72%
Qlik 1.07%
Apple 0.86%
PC-Soft 0.85%
Google 0.56%
Salesforce 0.55%
Avaloq 0.41%
Open Source 0.29%
FileMaker 0.15%
TYPO3 0.10%
europa3000 0.10%
Cisco 0.07%
Sage 0.04%
ZoHo 0.04%
Other 4.42%
34 Swiss Software Industry Survey 2015
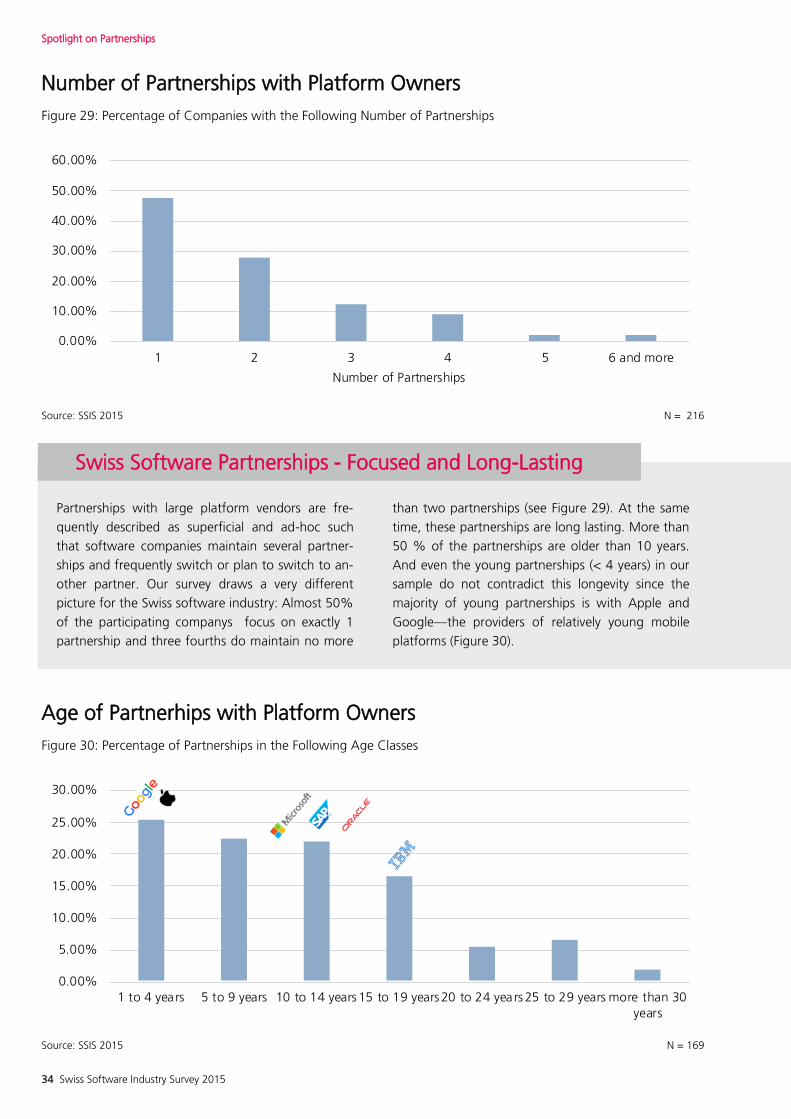
Number of Partnerships with Platform Owners
Figure 29: Percentage of Companies with the Following Number of Partnerships
Source: SSIS 2015 N = 216
Age of Partnerhips with Platform Owners
Figure 30: Percentage of Partnerships in the Following Age Classes
Source: SSIS 2015 N = 169
Spotlight on Partnerships
Partnerships with large platform vendors are fre-
quently described as superficial and ad-hoc such
that software companies maintain several partner-
ships and frequently switch or plan to switch to an-
other partner. Our survey draws a very different
picture for the Swiss software industry: Almost 50%
of the participating companys focus on exactly 1
partnership and three fourths do maintain no more
than two partnerships (see Figure 29). At the same
time, these partnerships are long lasting. More than
50 % of the partnerships are older than 10 years.
And even the young partnerships (< 4 years) in our
sample do not contradict this longevity since the
majority of young partnerships is with Apple and
Google—the providers of relatively young mobile
platforms (Figure 30).
Swiss Software Partnerships - Focused and Long-Lasting
0.00%
5.00%
10.00%
15.00%
20.00%
25.00%
30.00%
1 to 4 years 5 to 9 years 10 to 14 years 15 to 19 years 20 to 24 years 25 to 29 years more than 30years
0.00%
10.00%
20.00%
30.00%
40.00%
50.00%
60.00%
1 2 3 4 5 6 and more
Number of Partnerships
Swiss Software Industry Survey 2015 35
Spotlight on Partnerships
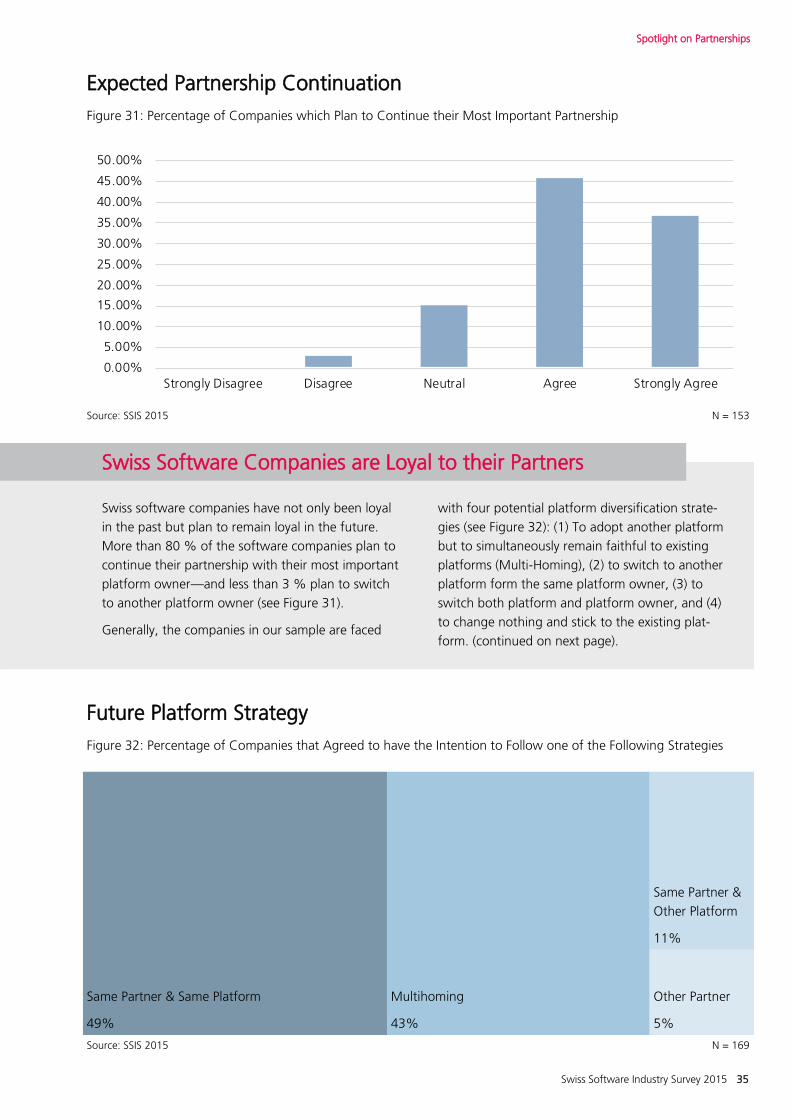
Expected Partnership Continuation
Figure 31: Percentage of Companies which Plan to Continue their Most Important Partnership
Source: SSIS 2015 N = 153
0.00%
5.00%
10.00%
15.00%
20.00%
25.00%
30.00%
35.00%
40.00%
45.00%
50.00%
Strongly Disagree Disagree Neutral Agree Strongly Agree
Swiss software companies have not only been loyal
in the past but plan to remain loyal in the future.
More than 80 % of the software companies plan to
continue their partnership with their most important
platform owner—and less than 3 % plan to switch
to another platform owner (see Figure 31).
Generally, the companies in our sample are faced
with four potential platform diversification strate-
gies (see Figure 32): (1) To adopt another platform
but to simultaneously remain faithful to existing
platforms (Multi-Homing), (2) to switch to another
platform form the same platform owner, (3) to
switch both platform and platform owner, and (4)
to change nothing and stick to the existing plat-
form. (continued on next page).
Swiss Software Companies are Loyal to their Partners
Future Platform Strategy
Figure 32: Percentage of Companies that Agreed to have the Intention to Follow one of the Following Strategies
Source: SSIS 2015 N = 169
Same Partner & Same Platform
49%
Multihoming
43%
Same Partner &
Other Platform
11%
Other Partner
5%
36 Swiss Software Industry Survey 2015
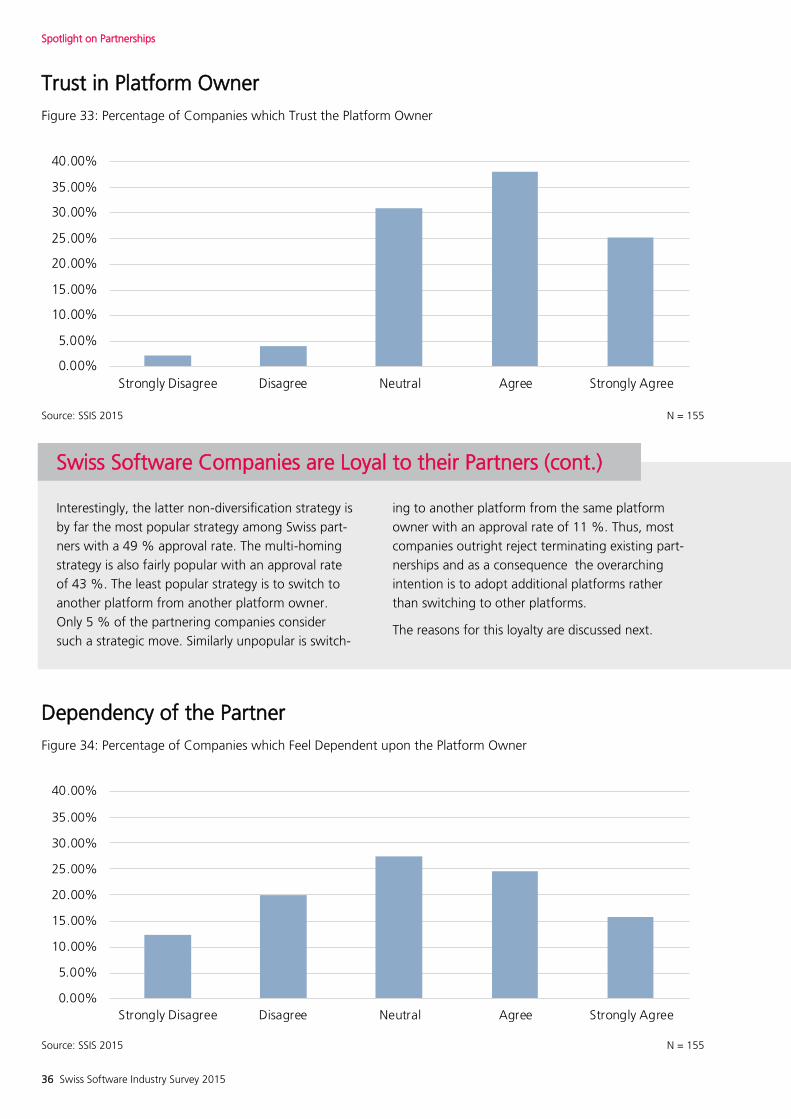
Trust in Platform Owner
Figure 33: Percentage of Companies which Trust the Platform Owner
Spotlight on Partnerships
Source: SSIS 2015 N = 155
Interestingly, the latter non-diversification strategy is
by far the most popular strategy among Swiss part-
ners with a 49 % approval rate. The multi-homing
strategy is also fairly popular with an approval rate
of 43 %. The least popular strategy is to switch to
another platform from another platform owner.
Only 5 % of the partnering companies consider
such a strategic move. Similarly unpopular is switch-
ing to another platform from the same platform
owner with an approval rate of 11 %. Thus, most
companies outright reject terminating existing part-
nerships and as a consequence the overarching
intention is to adopt additional platforms rather
than switching to other platforms.
The reasons for this loyalty are discussed next.
Swiss Software Companies are Loyal to their Partners (cont.)
Dependency of the Partner
Figure 34: Percentage of Companies which Feel Dependent upon the Platform Owner
Source: SSIS 2015 N = 155
0.00%
5.00%
10.00%
15.00%
20.00%
25.00%
30.00%
35.00%
40.00%
Strongly Disagree Disagree Neutral Agree Strongly Agree
0.00%
5.00%
10.00%
15.00%
20.00%
25.00%
30.00%
35.00%
40.00%
Strongly Disagree Disagree Neutral Agree Strongly Agree
Swiss Software Industry Survey 2015 37
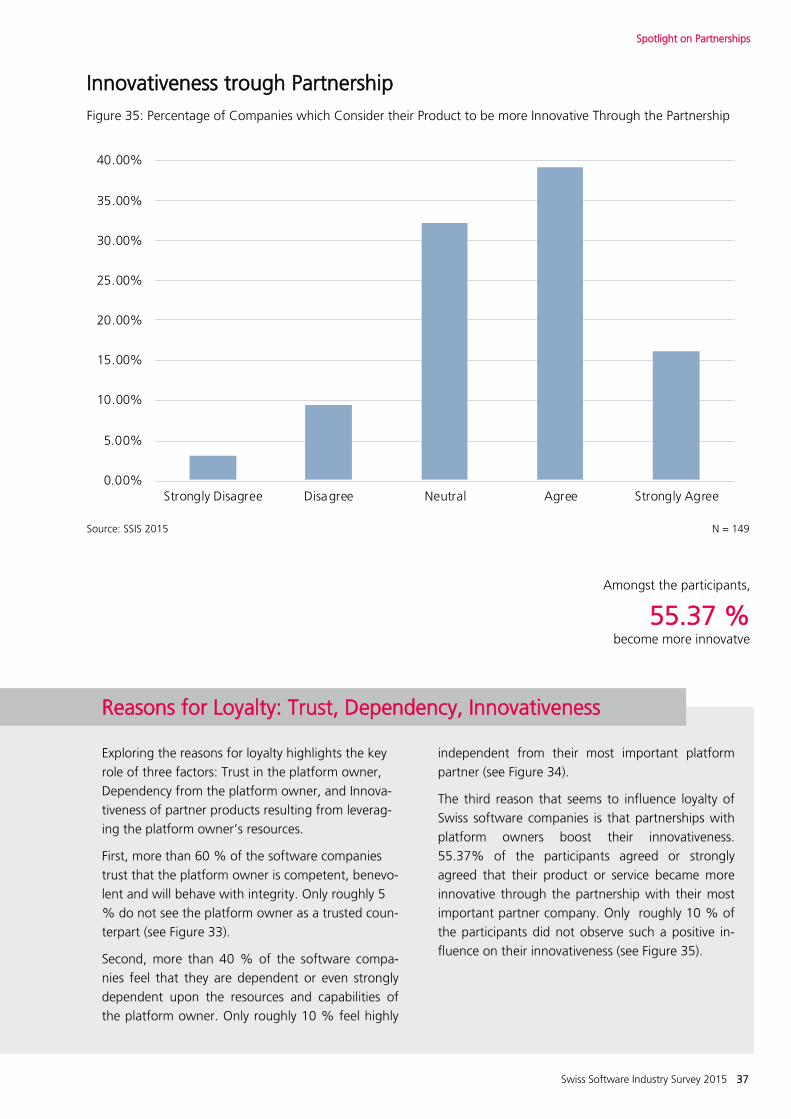
Innovativeness trough Partnership
Figure 35: Percentage of Companies which Consider their Product to be more Innovative Through the Partnership
Spotlight on Partnerships
Source: SSIS 2015 N = 149
Exploring the reasons for loyalty highlights the key
role of three factors: Trust in the platform owner,
Dependency from the platform owner, and Innova-
tiveness of partner products resulting from leverag-
ing the platform owner’s resources.
First, more than 60 % of the software companies
trust that the platform owner is competent, benevo-
lent and will behave with integrity. Only roughly 5
% do not see the platform owner as a trusted coun-
terpart (see Figure 33).
Second, more than 40 % of the software compa-
nies feel that they are dependent or even strongly
dependent upon the resources and capabilities of
the platform owner. Only roughly 10 % feel highly
independent from their most important platform
partner (see Figure 34).
The third reason that seems to influence loyalty of
Swiss software companies is that partnerships with
platform owners boost their innovativeness.
55.37% of the participants agreed or strongly
agreed that their product or service became more
innovative through the partnership with their most
important partner company. Only roughly 10 % of
the participants did not observe such a positive in-
fluence on their innovativeness (see Figure 35).
Reasons for Loyalty: Trust, Dependency, Innovativeness
0.00%
5.00%
10.00%
15.00%
20.00%
25.00%
30.00%
35.00%
40.00%
Strongly Disagree Disagree Neutral Agree Strongly Agree
Amongst the participants,
become more innovatve
55.37 %
38 Swiss Software Industry Survey 2015
Imprint
Publisher:
Institut für Wirtschaftsinformatik
Abteilung Information Engineering
Authors:
Thomas L. Huber, Thomas Hurni, Jens Dibbern
Design & Implementation:
Thomas Hurni, Dr. Thomas Huber
Feedback on Concept Development & Statistics:
Philipp Beck, Michael Jakob, Dr. Oliver Krancher, Dr.
Thomas Kude, Dr. Thomas Widjaja, Dr. Daniel Beimborn
Support:
Hermine Lacour, Alisa Petrova, Neena Kalayamthanam,
David Bucher, Fabio Isler, Jann Bangerter, Jan Pichler,
Ramed Wakil
Picture Credits:
Cover page: negativespace.com;4: StockSnap.io; 10/11:
StockSnap.io; 18: StockSnap.io; 22/23: StockSnap.io;
26/27: StockSnap.io; 30/31: StockSnap.io
Address:
Institut für Wirtschaftsinformatik
Engehaldenstrasse 8
CH - 3012 Bern Aktuelle Informationen:
http://www.iwi.unibe.ch
About