swiss public health conference basel, august 25-26, 2011...
TRANSCRIPT

IUMSPInstitut universitaire de médecine sociale et préventive, Lausanne
Trends in food availability in
Switzerland, 1961-2007
Pedro Marques-Vidal, Filipa Guerra and Fred Paccaud
Swiss Public Health Conference
Basel, August 25-26, 2011

IUMSPInstitut universitaire de médecine sociale et préventive, Lausanne
2
Background and aims
Background
� There is little if no information regarding dietary trends
in Switzerland in the long term.
Aims
� Assess trends in food availability in Switzerland, in
comparison with its immediate neighbors (Austria,
France, Germany, Italy), for the period 1961-2007.

IUMSPInstitut universitaire de médecine sociale et préventive, Lausanne
3
Methods
� Food and Agricultural Organization food balance
sheets from Austria, France, Germany, Italy and
Switzerland (http://www.fao.org/).
� Food commodities supply for a given country is
estimated taking into account total production,
imports, exports and stocks of food as well as its non-
food use. The resulting yearly supply is then divided
by the average population and the number of days of
the corresponding year to obtain an estimate of the
daily food available per capita.
Chen et al. Eur J Nutr. 2007 Oct;46(7):418-27

IUMSPInstitut universitaire de médecine sociale et préventive, Lausanne
4
Daily calories availability per capita
Switzerland
1961: 3545 kcal/d
2007: 3465 kcal/d
IUMSPInstitut universitaire de médecine sociale et préventive, Lausanne
5
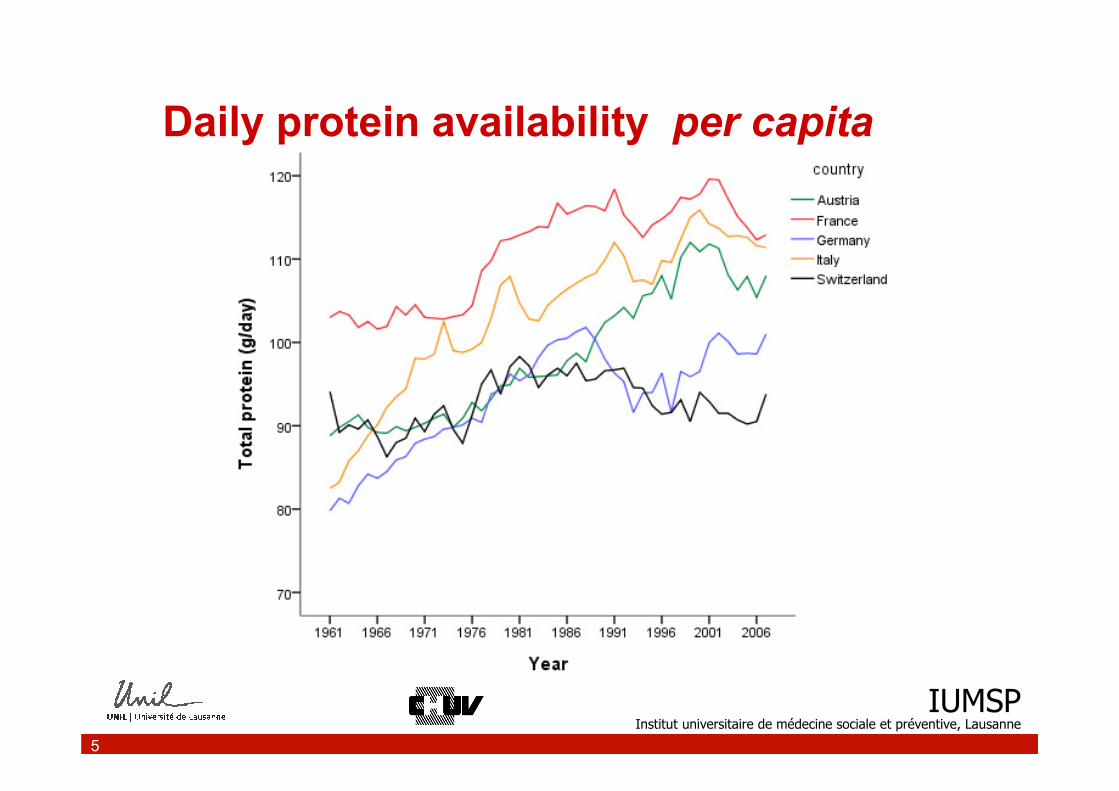
Daily protein availability per capita
IUMSPInstitut universitaire de médecine sociale et préventive, Lausanne
6
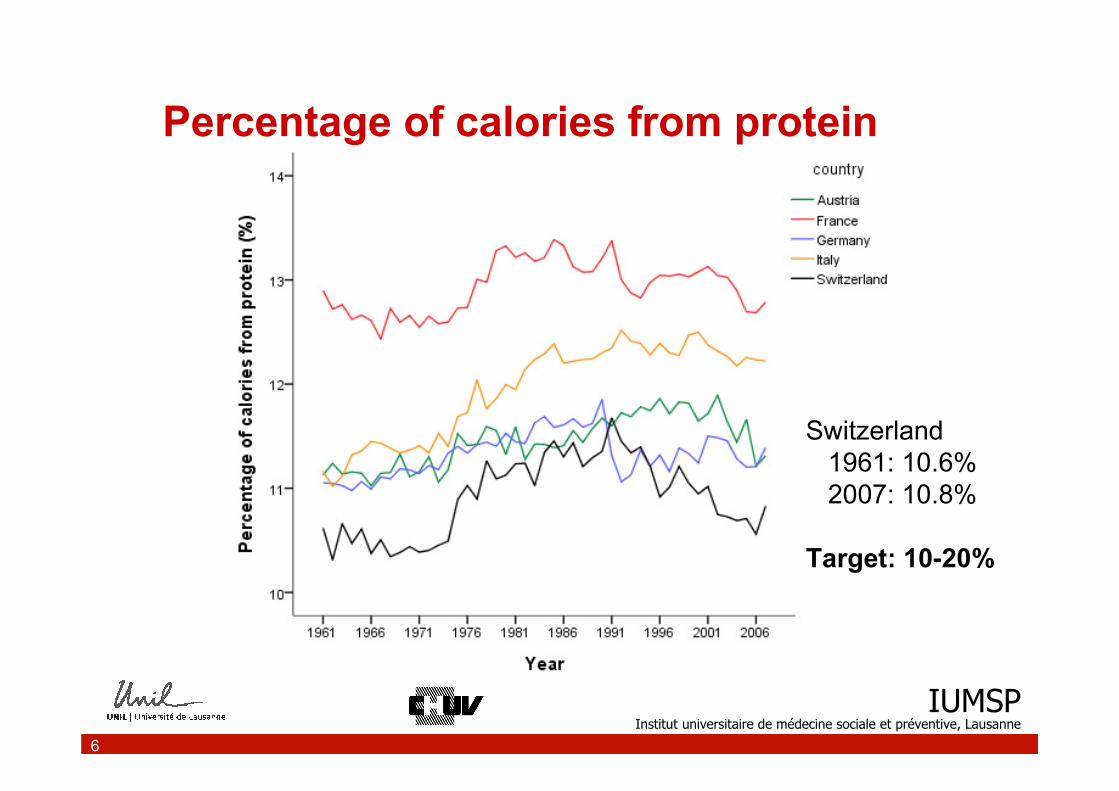
Percentage of calories from protein
Switzerland
1961: 10.6%
2007: 10.8%
Target: 10-20%

IUMSPInstitut universitaire de médecine sociale et préventive, Lausanne
7
Daily fat availability per capita

IUMSPInstitut universitaire de médecine sociale et préventive, Lausanne
8
Percentage of calories from fat
Switzerland
1961: 34%
2007: 40%
Target: 30%
IUMSPInstitut universitaire de médecine sociale et préventive, Lausanne
9
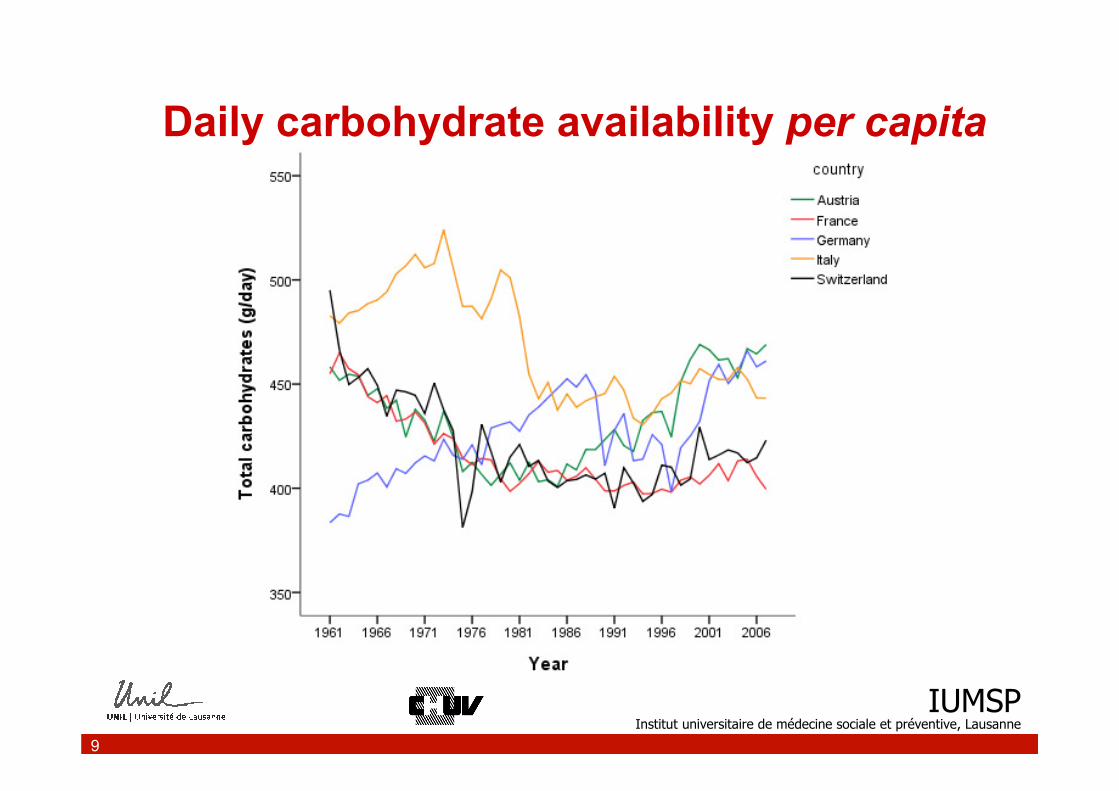
Daily carbohydrate availability per capita

IUMSPInstitut universitaire de médecine sociale et préventive, Lausanne
10
Percentage of calories from carbohydrate
Switzerland
1961: 56% (50%)
2007: 49% (44%)
Target: 45-55%

IUMSPInstitut universitaire de médecine sociale et préventive, Lausanne
11
Daily calories from alcoholic beverages

IUMSPInstitut universitaire de médecine sociale et préventive, Lausanne
12
Types of fat available, Switzerland

IUMSPInstitut universitaire de médecine sociale et préventive, Lausanne
13
Types of fruit available, Switzerland
IUMSPInstitut universitaire de médecine sociale et préventive, Lausanne
14
Conclusion
During the period 1961-2007:
� Changes in food availability in Switzerland were less
pronounced than in their neighboring countries (EU
agricultural policy?)
� Total caloric availability declined slightly.
� Fat content in the diet increased.
� The types of fat available changed (food industry?).
� The types of fruit available changed (globalization?).
The Public Health impact of these changes remain to be
evaluated → next step.

IUMSPInstitut universitaire de médecine sociale et préventive, Lausanne
15
THANK YOU FOR YOUR ATTENTION
Institute of Preventive Medicine, Lisbon
Filipa Guerra
Institute of Social and Preventive Medicine, Lausanne
Pedro Marques-Vidal
Fred Paccaud

IUMSPInstitut universitaire de médecine sociale et préventive, Lausanne
16
Daily calories from sugar and sweeteners
IUMSPInstitut universitaire de médecine sociale et préventive, Lausanne
17
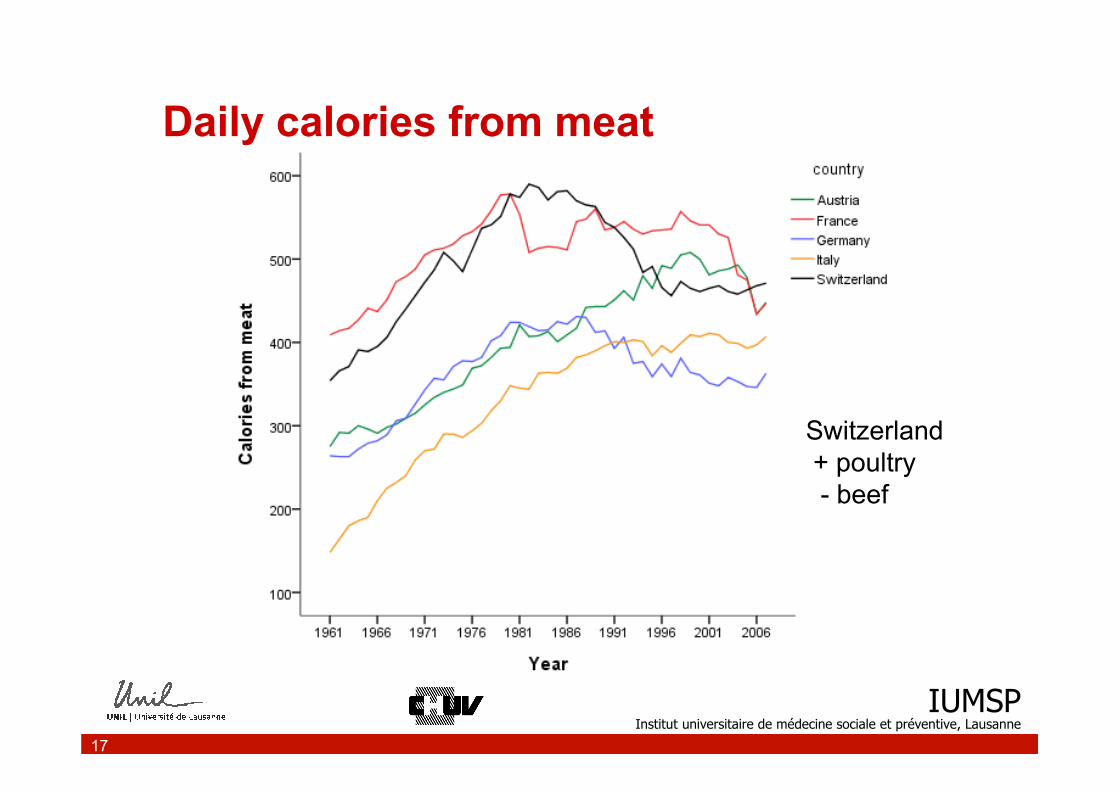
Daily calories from meat
Switzerland
+ poultry
- beef

IUMSPInstitut universitaire de médecine sociale et préventive, Lausanne
18
Daily calories from milk