swimmable, fishable, fixable? what we've learned so far
TRANSCRIPT

Swimmable, fishable, fixable?What we’ve learned so far about Minnesota waters
Minnesota Pollution Control Agency
April 2015

Minnesota Pollution Control Agency
520 Lafayette Road North | Saint Paul, MN 55155-4194 | www.pca.state.mn.us | 651-296-6300 Toll free 800-657-3864 | TTY 651-282-5332
This report is available in alternative formats upon request, and online at www.pca.state.mn.us
Document number: wq-ws1-07
Authors
Minnesota Pollution Control Agency
Thanks
The MPCA thanks all of the partners who participate in the state’s comprehensive exam of Minnesota watersheds: soil and water conservation districts, nonprofit groups, watershed districts, cities, counties, citizens, and many more help collect data, analyze it, develop strategies, and implement projects continuously to restore and protect our lakes and streams.
Project dollars provided by the Clean Water Fund (from the Clean Water, Land and Legacy Amendment)
Cover photo: The confluence of the St. Croix and Mississippi rivers south of the Twin Cities – after the Minnesota River flows into the Mississippi – shows the contrast between Minnesota’s river systems in urban and ag-dominated areas and more natural areas. Water quality is exceptionally good in northeast Minnesota – as shown by the blue St. Croix – and worsens as you go to the southwest – as shown by the brown Mississippi. (MPCA photo)
The MPCA is reducing printing and mailing costs by using the Internet to distribute reports and information to wider audience. Visit our website for more information: www.pca.state.mn.us
MPCA reports are printed on 100% post- consumer recycled content paper manufactured without chlorine or chlorine derivatives.

Executive summary . . . . . . . . . . . . . . . . . . . . . . . . . . . . . . . . . . . . . . . . . . . . . . . . . . . . . . . . . . . . . 4
Minnesota's watersheds . . . . . . . . . . . . . . . . . . . . . . . . . . . . . . . . . . . . . . . . . . . . . . . . . . . . . . . . 6
The watershed approach: a 10-year cycle . . . . . . . . . . . . . . . . . . . . . . . . . . . . . . . . . . . . . . . . 7
Swimmable? . . . . . . . . . . . . . . . . . . . . . . . . . . . . . . . . . . . . . . . . . . . . . . . . . . . . . . . . . . . . . . . . . . . 8
Lakes – swimming and recreation . . . . . . . . . . . . . . . . . . . . . . . . . . . . . . . . . . . . . . . . . . . . . . . . 9
Streams and rivers – swimming and recreation . . . . . . . . . . . . . . . . . . . . . . . . . . . . . . . . . .10
Network of pollutant load monitoring stations . . . . . . . . . . . . . . . . . . . . . . . . . . . . . . . . . .11
Fishable? . . . . . . . . . . . . . . . . . . . . . . . . . . . . . . . . . . . . . . . . . . . . . . . . . . . . . . . . . . . . . . . . . . . . . .12
Northern and central region . . . . . . . . . . . . . . . . . . . . . . . . . . . . . . . . . . . . . . . . . . . . . . . . . . . .12
Southern region . . . . . . . . . . . . . . . . . . . . . . . . . . . . . . . . . . . . . . . . . . . . . . . . . . . . . . . . . . . . . . . .13
Metro region . . . . . . . . . . . . . . . . . . . . . . . . . . . . . . . . . . . . . . . . . . . . . . . . . . . . . . . . . . . . . . . . . . .13
Northwest region . . . . . . . . . . . . . . . . . . . . . . . . . . . . . . . . . . . . . . . . . . . . . . . . . . . . . . . . . . . . . .13
Streams and rivers – fish and other aquatic life . . . . . . . . . . . . . . . . . . . . . . . . . . . . . . . . . .14
Lakes, streams, and rivers – eating fish . . . . . . . . . . . . . . . . . . . . . . . . . . . . . . . . . . . . . . . . . .15
Fixable? Strategies to help our waters . . . . . . . . . . . . . . . . . . . . . . . . . . . . . . . . . . . . . . . . . .16
What needs to be done . . . . . . . . . . . . . . . . . . . . . . . . . . . . . . . . . . . . . . . . . . . . . . . . . . . . . . . . .16
Who needs to do it . . . . . . . . . . . . . . . . . . . . . . . . . . . . . . . . . . . . . . . . . . . . . . . . . . . . . . . . . . . . .16
When . . . . . . . . . . . . . . . . . . . . . . . . . . . . . . . . . . . . . . . . . . . . . . . . . . . . . . . . . . . . . . . . . . . . . . . . . .17
Where and how much . . . . . . . . . . . . . . . . . . . . . . . . . . . . . . . . . . . . . . . . . . . . . . . . . . . . . . . . . .17
Bottom line — we're in it for the long haul . . . . . . . . . . . . . . . . . . . . . . . . . . . . . . . . . . . . . .20
Appendix A: Monitoring and assessment reports to date . . . . . . . . . . . . . . . . . . . . . . . .21
Appendix B: Stressor identification reports to date . . . . . . . . . . . . . . . . . . . . . . . . . . . . . .23
Appendix C: WRAPS documents to date . . . . . . . . . . . . . . . . . . . . . . . . . . . . . . . . . . . . . . . . .24
Additional resources . . . . . . . . . . . . . . . . . . . . . . . . . . . . . . . . . . . . . . . . . . . . . . . . . . . . . . . . . . .25
Contents

4 April 2015 | Swimmable, fishable, fixable? What we’ve learned so far about Minnesota waters
Executive summary
The Minnesota Pollution Control Agency (MPCA) has reached the midpoint of its first comprehensive look at water quality – and what is needed to protect and restore it – throughout the state. The agency and its partners have used a watershed approach to take an in-depth look at the lakes and streams in half of the state’s 81 major watersheds.
Swimmable?
How are our watersheds? Water quality is a reflection of what happens on the surrounding land. So far, MPCA's monitoring and assessment work highlights the following themes:
• In watersheds dominated by agricultural and urban land, half or fewer of the lakes fully support the standard for swimming because of phosphorus. Excess phosphorus is the main driver of harmful algae in lakes.
• Watersheds that are heavily farmed tend to have high levels of nitrogen, phosphorus, and suspended solids in their waters. These pollutants hurt aquatic life and recreational opportunities.
• Bacteria levels in streams are also a problem. Watersheds where fewer than half the streams fully support swimming because of bacteria levels are generally in areas with a higher density of people and livestock – the developed and agricultural portions of the state.
• More lakes fully support the swimming standard in the more forested and wetland-rich areas of north-central and northern Minnesota. The same goes for streams in areas with lower populations and little animal agriculture.
• The general pattern is that water quality is exceptionally good in the northeast part of the state and declines moving toward the southwest.
Fishable?
Once we've monitored and assessed a watershed, our next step is to identify conditions stressing water quality, fish, and aquatic life. The MPCA and its partners have identified stressors in about one-third of Minnesota’s watersheds so far. These interrelated stressors include:
• Stream connections, such as culverts and dams
• Hydrology, including stream flow and runoff
• Stream biology, such as fish and bugs
What is a watershed?A watershed is an area of land that drains to the same body of water, usually a river.

April 2015 | Swimmable, fishable, fixable? What we’ve learned so far about Minnesota waters 5
• Water chemistry, including oxygen levels, nutrient levels, and temperature
• Eroding stream channels
Themes by region include:
• The southern region of Minnesota has the highest numbers of stressors related to excess nutrients, excess sediment, lack of habitat, lack of connectivity, altered hydrology, and impaired biological communities.
• In the northern-central and northwest regions, low dissolved oxygen was the most common stressor found.
• In the Twin Cities, excess sediment and altered hydrology were common stressors.
• Throughout the state, the vast majority of streams and lakes examined – 97% of 490 stream sections and 95% of 1,214 lakes studied – contain fish tainted by mercury.
Fixable? Strategies to help our water
The third step in our watershed approach is to develop Watershed Restoration and Protection Strategies that the state, local partners, landowners, and citizens will implement. While each watershed is different, some general themes have emerged for the 11 watersheds that have completed this step:
• In watersheds where agriculture dominates the landscape, prominent strategies include stream buffers, nutrient and manure management, wetland restorations and other forms of water storage, and stream channel stabilization.
• For more urbanized areas, strategies focus on stormwater runoff controls ranging from site planning and rain gardens, to the construction of stormwater ponds and wetlands.
• Not all strategies relate to traditional water pollutants. Throughout Minnesota, common strategies include improving habitat and reducing barriers (connectivity) for fish and other aquatic life.
• Some strategies call for stronger and more targeted application of state and local laws on feedlots, shoreland, and septic systems. The MPCA leads the permitting of stormwater controls and wastewater discharges.
Bottom line – we’re in it for the long haul
A long-term commitment is needed to restore and protect Minnesota’s waters. Implementing the strategies identified so far will take 20 or 30 years – or more – with interim milestones to measure and motivate progress.
It took decades to pollute lakes and streams, and it will take many years to restore impaired waters while working to protect healthy waters as new threats emerge.

6 April 2015 | Swimmable, fishable, fixable? What we’ve learned so far about Minnesota waters
Minnesota’s watersheds

April 2015 | Swimmable, fishable, fixable? What we’ve learned so far about Minnesota waters 7
The watershed approach: a 10-year cycle
The Minnesota Pollution Control Agency uses a watershed approach to evaluate Minnesota’s 12,000 lakes and 69,200 miles of streams. Instead of focusing on individual lakes and river sections, we look at each of the 81 watersheds every 10 years, identifying waters in good condition that need protection as well as polluted waters that need restoration.
The watershed approach creates a common framework for our water quality work and is an efficient, cost-effective way to address impairments.
Cycles are staggered – 8 to 10 watersheds begin a new cycle each year. By 2017, all watersheds will have at least begun their first cycle, and those that began in 2008 will enter their next cycle.
Each “check up” includes four steps outlined in this graphic.
Engage citizens
Engage citizens
Engage citizens
Engage citizens
Step 4: ImplementImplement projects and activities to restore and protect waters.
Ongoing in all watersheds
Step 3: Develop strategies Develop Watershed Restoration and Protection Strategies and local water plans to restore and protect water bodies.
One-tenth of watersheds completed
Step 2: Identify stressorsStudy data and identify conditions stressing water quality as well as those fostering healthy waters.
One-third of watersheds completed
Step 1 : Monitor and assessCollect data on water chemistry, biology, and fish contaminants. Assess whether the water meets standards.
Half completed

8 April 2015 | Swimmable, fishable, fixable? What we’ve learned so far about Minnesota waters
Swimmable?
To date, the MPCA and its partners have systematically monitored and assessed a large number of the streams, rivers, and lakes in half of Minnesota’s 81 major watersheds.
When the MPCA and partners monitor a lake or stream, it means we study:
• Levels of nutrients, sediment, and bacteria
• Communities of fish and macroinvertebrates such as aquatic bugs
• Flow of rivers and streams
• Contaminants in fish
In the second part of this step, assessment, we take a look at what the data is telling us. Then we determine whether the condition of water bodies meet water quality standards. Water quality standards are the benchmarks used to determine the suitability of waters for swimming and fishing, and their overall biological health. Water quality standards are not “one size fits all.” In many cases they are regionalized for different parts of the state, and tailored to different types of water bodies.
The maps on the following pages show where the MPCA and partners have studied watersheds and the results so far.
Why are nutrients a pollutant?
Excess nutrients cause blooms of algae that hurt aquatic life and recreation.
Why is sediment a pollutant?
Sediment – particles of soil and other matter – clouds the water, making it hard for fish and other aquatic life to find food, breathe, and reproduce.
Why are bacteria a pollutant?
Bacteria may make a lake or stream unsafe for swimming and other recreation.

April 2015 | Swimmable, fishable, fixable? What we’ve learned so far about Minnesota waters 9
Lakes – swimming and recreation
The MPCA and partners have assessed a total of 1,211 lakes under the watershed approach. Patterns in the color shading in the map below say a lot about what influences water quality in Minnesota.
Watersheds with just half or fewer of the lakes fully supporting swimming tend to be dominated by agricultural land that is known to contribute excessive phosphorus to water bodies. Phosphorus is the primary driver of algae in lakes.
The fact that a lake does not fully support swimming doesn't mean no one ever swims there. However, during at least part of the summer, the lake is green and slimy with algae – to the point where swimming is not desirable. In some cases, the algae growth is so bad that a "bloom" forms that can release toxins harmful to pets and people.
Higher percentages of lakes fully support swimming in the more forested and wetland-rich landscape of the north-central and northeastern part of the state. Natural watershed characteristics such as soil type also play a role in lake phosphorus levels.
Lakes that fully support swimming and recreation

10 April 2015 | Swimmable, fishable, fixable? What we’ve learned so far about Minnesota waters
Streams and rivers – swimming and recreation
The MPCA and partners have assessed a total of 576 stream and river sections statewide under the watershed approach.
Streams and rivers that fail to support swimming and recreation show episodic, and often ongoing, elevated levels of E. coli bacteria. Certain strains of E. coli can cause illness in people, and they indicate the likely presence of other bacteria and viruses that may also cause illness.
Watersheds where fewer than half of the rivers and streams fully support swimming are generally in areas where there is a higher density of people and livestock – the developed and agricultural portions of the state. This makes sense, as E. coli is mainly associated with untreated human sewage and animal manure. Swimming and other water recreation still occur in areas where few or no streams and rivers fully support this use. The risk of contracting stomach or other illness in these areas is higher than in other parts of the state, and exceeds state and federal guidelines.
Areas with lower population density and little animal agriculture have a higher percentage of streams and rivers fully supporting swimming use, even though these areas may be rich in wildlife. While wildlife can contribute bacteria to water bodies, their impact appears to be generally limited.
Streams and rivers that fully support swimming and recreation

April 2015 | Swimmable, fishable, fixable? What we’ve learned so far about Minnesota waters 11
Network of pollutant load monitoring stations
Intensive watershed monitoring is designed primarily to determine the condition of large numbers of water bodies on a rotating basis. In 2007, the MPCA and Department of Natural Resources (DNR) began to build a permanent network of monitoring stations where both flow and water quality data are collected. The combination of flow and water quality allows us to calculate pollutant quantities, hence the name “pollutant load.”
By collaborating with the DNR and many local partner agencies, the network is now fully operational at 200 stations statewide. The information provided by the network helps us:
• Identify sources of pollutants
• Determine Total Maximum Daily Loads (TMDLs), which are the maximum amount of a pollutant that a water can receive and still fully support uses like swimming and fishing
• Decide on requirements for permitted discharges of treated wastewater to water bodies
• Analyze trends to detect if pollutant levels are increasing, decreasing, or remaining the same over time
The maps below clearly depict potential priority areas for pollutant source reductions. Watersheds that are heavily farmed tend to have high levels of nitrogen, phosphorus, and suspended solids in their waters, while watersheds that are heavily developed tend to have medium levels of these pollutants.
Pollutant levels
Nitrogen Phosphorus Suspended solids
low high

12 April 2015 | Swimmable, fishable, fixable? What we’ve learned so far about Minnesota waters
Fishable?
A healthy water system will sustain a variety of life. By looking at fish and macroinvertebrate (bug) communities, we can detect problems that other monitoring may miss or underestimate. Identifying stream stressors (factors that harm fish and other stream life) is a key step in identifying the cause of impairments and to finding solutions. Stressors include:
• Stream connections, such as culverts and dams
• Hydrology, including stream flow and runoff
• Stream biology, such as fish and bugs
• Water chemistry, including oxygen levels, nutrient levels, and temperature
• Eroding stream channels
Water quality is a reflection of how people use the land draining to a lake or river. Pollutants flow with water through drainage tiles and ditches, stormwater and wastewater pipes, and run off from developed and agricultural areas. Techniques, such as buffers along streams, controlled drainage, and rain gardens can reduce the flow of pollutants to streams and lakes.
Stressor identification is complete for 27 watersheds across the state. Different stressors are more prevalent in various regions of the state. Many of these differences can be attributed to the dominant land use practices and disturbances in the respective regions.
Regional stressors
Regions
Number of stream sections with these stressors and pollutants
Low dissolved oxygen
Excess nutrients
Excess sediment
Altered hydrology
Lack of habitat
Lack of connectivity
Other Total bug and fish impairments*
North/Central
49 23 33 28 38 24 9 81
South 40 108 73 46 116 13 7 154
Metro 14 11 17 16 16 - 4 22
Northwest 18 4 14 24 17 9 - 24
* Impairments: Number, variety, and quality of aquatic life are lower than expected for these waters
North and central region
Under the watershed approach, 10 watersheds in this heavily forested region have gone through the stressor identification process. Low dissolved oxygen was the most commonly found stressor to the fish and/or macroinvertebrate communities; it affected 49 of 81 (60%) of impaired stream sections. Other common stressors found in this region were lack of habitat (47% of impaired streams), altered hydrology (35%), excess sediment (41%), lack of connectivity (30%), and high
nutrient levels (28%).

April 2015 | Swimmable, fishable, fixable? What we’ve learned so far about Minnesota waters 13
South region
This region varies from land heavily used for agriculture to areas with abundant coldwater trout streams in southeastern Minnesota. Presently, 13 watersheds with numerous biological impairments – 154 – have undergone stressor identification. Stressors most commonly found in the southern region are lack of habitat (75% of impaired streams), excess nutrients (70%), excess sediment (47%), and low dissolved oxygen conditions (26%).
Metro region
The seven-county metropolitan area of Minneapolis and St. Paul is home to more than 1.8 million people with many lakes and streams that provide recreational value and enjoyment. Local partners identified stressors for 22 biologically impaired stream sections, including excess sediment (77%), altered hydrology (73%), lack of habitat (73%), low dissolved oxygen (64%), and excess nutrients (50%).
Northwest region
The northwest region contains many prairie pothole-type wetlands that can be excellent places to hunt waterfowl and features some of the most fertile soil in Minnesota.
The MPCA and partners examined five watersheds and 24 biologically impaired stream sections. In all of the impaired streams, altered hydrology was a cause of stress to the fish and macroinvertebrate communities. Other commonly found stressors were low dissolved oxygen (75%), lack of habitat (71%), high amounts of suspended and bedded sediment (58%), and lack of connectivity (38%).
Minnesota regions Minnesota land use

14 April 2015 | Swimmable, fishable, fixable? What we’ve learned so far about Minnesota waters
Streams and rivers – fish and other aquatic life
The MPCA and partners have assessed a total of 1,054 stream and river sections statewide for fish and other aquatic life under the watershed approach.
The patterns in this map show some similarity to the previous maps because nutrients, sediment, and manure impact biological conditions as well as recreational suitability. There are also some contrasts, most notably between the northwest and southeast parts of the state.
The northwest exhibits somewhat better conditions for recreation, while showing poor stream life. The southeast on the other hand shows somewhat better stream life, with poor conditions for recreation. This may be due to the steeper landscape of southeastern Minnesota, which facilitates runoff of bacteria and other pollutants, but results in better habitat for aquatic life.
Streams and rivers that fully support fish and other aquatic life
April 2015 | Swimmable, fishable, fixable? What we’ve learned so far about Minnesota waters 15
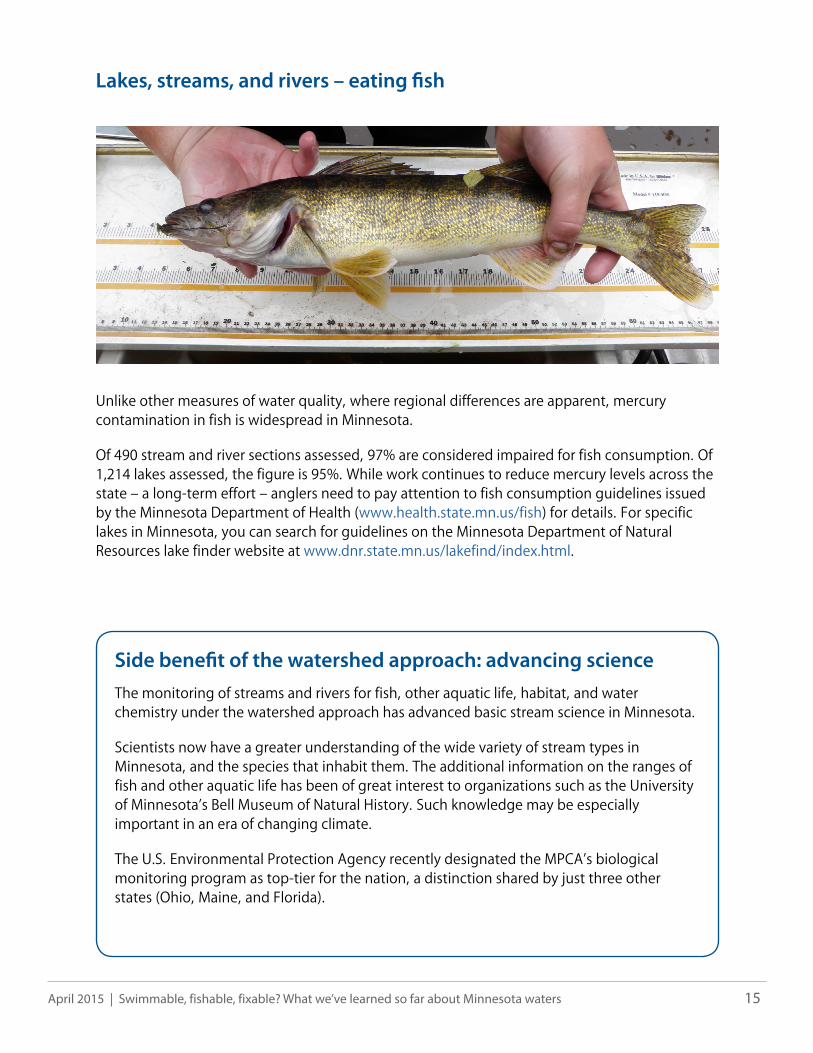
Lakes, streams, and rivers – eating fish
Unlike other measures of water quality, where regional differences are apparent, mercury contamination in fish is widespread in Minnesota.
Of 490 stream and river sections assessed, 97% are considered impaired for fish consumption. Of 1,214 lakes assessed, the figure is 95%. While work continues to reduce mercury levels across the state – a long-term effort – anglers need to pay attention to fish consumption guidelines issued by the Minnesota Department of Health (www.health.state.mn.us/fish) for details. For specific lakes in Minnesota, you can search for guidelines on the Minnesota Department of Natural Resources lake finder website at www.dnr.state.mn.us/lakefind/index.html.
Side benefit of the watershed approach: advancing science
The monitoring of streams and rivers for fish, other aquatic life, habitat, and water chemistry under the watershed approach has advanced basic stream science in Minnesota.
Scientists now have a greater understanding of the wide variety of stream types in Minnesota, and the species that inhabit them. The additional information on the ranges of fish and other aquatic life has been of great interest to organizations such as the University of Minnesota’s Bell Museum of Natural History. Such knowledge may be especially important in an era of changing climate.
The U.S. Environmental Protection Agency recently designated the MPCA’s biological monitoring program as top-tier for the nation, a distinction shared by just three other states (Ohio, Maine, and Florida).

16 April 2015 | Swimmable, fishable, fixable? What we’ve learned so far about Minnesota waters
Fixable? Strategies to help our waters
So far, nine watersheds and portions of two others have progressed through public review of Watershed Restoration and Protection Strategies, with 13 more watersheds scheduled to finalize restoration and protection strategies in 2015.
For the 11 watersheds that have completed the process, restoration and protection strategies have been developed for 353 lakes and 225 streams. Many of these strategies can be applied
watershed-wide to help water bodies that are not specifically identified.
What needs to be done
In watersheds dominated by farming, strategies include planting stream buffers, managing nutrients and manure, restoring wetlands and other forms of water storage, and stabilizing stream channels.
In urbanized areas, strategies focus on stormwater runoff controls such as site planning, planting rain gardens, and constructing stormwater ponds and wetlands.
For lakes, strategies include treating sediments to control phosphorus recycling, supporting fish and plant communities, and protecting the lakeshore.
Not all strategies relate to traditional water pollutants. Strategies to improve habitat conditions for fish and other aquatic life, including addressing connectivity (how waters are linked to each other), are common.
Who needs to do it
Most strategies involve voluntary actions on the part of citizens, landowners, and communities. Some strategies, however, call for for stronger and more targeted application of state-level regulations and local ordinances that apply to feedlots, shoreland, and septic systems, stormwater, and industrial and municipal point source discharges.
All of the watersheds except one have strategies to address both agricultural and urban stressors, pollutant sources, and threats. The exception is a portion of the Mississippi River–Twin Cites major watershed, where strategies focus on lake restoration.
When
Strategies for achieving water quality targets are often relatively long – 20 or 30 years or more – and interim milestones are sometimes modest (100 feet of streambank restored). This reflects

April 2015 | Swimmable, fishable, fixable? What we’ve learned so far about Minnesota waters 17
the severity of water quality impairments and watershed disturbance, the voluntary nature and substantial cost of many solutions, and a need for landowner willingness and external funding to implement many of the strategies.
Where and how much
A key component of watershed restoration and protection strategies is to define the level of effort needed to address pollutant sources and stressors to achieve specific water quality goals. Any impaired lake or stream likely suffers from several stressors and pollutant sources.
There is more restoration and protection work needed than Minnesota has money to support. We will continue to prioritize the most disturbed portions of watersheds, and the most significant sources of pollution.
It is important to remember, however, that cleaning up an impaired water is much more expensive than protecting those lakes and streams that still meet water quality standards. It is also important to note that there is a large range of scale in the work that's needed, as the following examples show.
Minnesota regions
Deerhorn Creek Buffalo Watershed
Le Sueur River Le Sueur Watershed
Mayo Lake Crow Wing Watershed
Thompson Lake Lower Mississippi

18 April 2015 | Swimmable, fishable, fixable? What we’ve learned so far about Minnesota waters
North and central region
WatershedCrow Wing – 1,245,214 acres
Water bodyMayo Lake
Stressor or pollutantExcess nutrients – phosphorus
Major causes or sources of stressPoor shoreland conditions, internal phosphorus loading, failing septic systems, phosphorus loading from upstream lakes
Goal to restore/protect waterGreater than 17% reduction in lake phosphorus levels
Strategies and level of effort needed to achieve goal
• 50% of land owners implement improved shoreland practices• in-lake management to reduce internal loading by 45%• upgrade all failing septic systems• reduce upstream phosphorus loads by 20%
Metro region
WatershedLower Mississippi – 656,990 acres
Water bodyThompson Lake
Stressor or pollutantExcess nutrients – phosphorus
Major causes or sources of stressPhosphorus inputs from stormwater systems, internal phosphorus loading
Goal to restore/protect water22% reduction in lake phosphorus levels
Strategies and level of effort needed to achieve goal
• construct pond or other practices to treat stormwater entering the north end of lake• evaluation of internal load
Thompson Lake has a watershed area of 180 acres (just over ¼ square mile) that is made up of commercial, institutional, low-density residential, and park land use. A single constructed pond to treat incoming stormwater might be enough to achieve the 22% phosphorus reduction goal. Although phosphorus already in the lake might still be a factor needing attention.
To achieve the phosphorus reduction goal for Mayo Lake, which has a watershed of 36,000 acres, some 25 lakeshore landowners may need to improve the condition of their shoreland, the septic systems of 50 lakeshore cabins/home will need to be evaluated and possibly upgraded, and hundreds of acres of upstream land will need some type of conservation practice.

April 2015 | Swimmable, fishable, fixable? What we’ve learned so far about Minnesota waters 19
Northwest region
WatershedBuffalo – 709,400 acres
Water bodyDeerhorn Creek
Stressor or pollutantExcess sediment – suspended solids
Major causes or sources of stressSoil erosion, watershed runoff, poor condition of farmed-through waterways
Goal to restore/protect waterUp to 62% reduction in suspended solids
Strategies and level of effort needed to achieve goal
• riparian and ditch system buffers• engineered hydrologic control structures• regional retention projects• field wind breaks• increase in cover crops/perennial vegetation• crop residue management• NPDES (point-source) permit compliance
South region
WatershedLe Sueur – 712,000 acres
Water bodyLe Sueur River
Stressor or pollutantAltered hydrology
Major causes or sources of stressDecreased evapo-transpiration due to vegetation, land use, and drainage changes
Goal to restore/protect water25% reduction in annual flow
Strategies and level of effort needed to achieve goal
• conservation tillage on 71,000 acres
To achieve the reduction in suspended solids for Deerhorn Creek, which has a watershed of 23,000 acres, many miles of waterways, ditches, and stream channels will require buffers, and thousands of acres of the watershed will need to be treated with new or different conservation practices.
To achieve the flow reduction goal for the Le Sueur River, which has a watershed area of over 700,000 acres, tens of thousands of acres of land will need to have new or different conservation practices put into place.

20 April 2015 | Swimmable, fishable, fixable? What we’ve learned so far about Minnesota waters
• cover crops on 28,000 acres• water and sediment basins and terraces to treat 18,000 acres• in/near ditch retention and treatment to treat 18,000 acres• conservation cover on 17,000 acres• grassed waterway to treat 14,000 acres• saturated buffers to treat 11,000 acres• tile system design and use for controlled/less drainage on 7,100 acres• treatment wetlands to treat 7,100 acres• restored wetlands on 1,400 acres
Bottom line – we’re in it for the long haul
A long-term commitment is needed to restore and protect Minnesota’s waters. Implementing the strategies identified so far will take 20 or 30 years – or more – with interim milestones to measure and motivate progress.
It took decades to pollute lakes and streams, and it will take many years to restore impaired waters while working to protect healthy waters as new threats emerge.

April 2015 | Swimmable, fishable, fixable? What we’ve learned so far about Minnesota waters 21
Appendix A: Monitoring and assessment reports to date
Monitoring and Assessment reports for watersheds are available on the MPCA website at: www.pca.state.mn.us/sbiz8cc
• Big Fork River Watershed Monitoring and Assessment Report (wq-ws3-09030006b)
• Bois de Sioux River Watershed Monitoring and Assessment Report (wq-ws3-09020101b)
• Buffalo River Watershed Monitoring and Assessment Report (wq-ws3-09020106b)
• Cannon River Watershed Monitoring and Assessment Report (wq-ws3-0704002b)
• Cedar River Watershed Monitoring and Assessment Report (wq-ws3-07080201b)
• Chippewa River Watershed Monitoring and Assessment Report (wq-ws3-07020005b)
• Crow Wing River Watershed Monitoring and Assessment Report (wq-ws3-07010106c)
• Lake Superior South Watershed Monitoring and Assessment Report (wq-ws3-07040001b)
• Le Sueur River Watershed Monitoring and Assessment Report (wq-ws3-07020011b)
• Little Fork River Watershed Monitoring and Assessment Report (wq-ws3-09030005b)
• Long Prairie Watershed Monitoring and Assessment Report (wq-ws3-07010108b)
• Lower Red River of the North Watershed Monitoring and Assessment Report (wq-ws3-09020311b)
• Lower St. Croix River Watershed Monitoring and Assessment Report (wq-ws3-07030005b)
• Minnesota River - Granite Falls Watershed Monitoring and Assessment Report (wq-ws3-07020004b)
• Mississippi River - Lake Pepin Watershed Monitoring and Assessment Report (wq-ws3-07040001b)
• Mississippi River - St. Cloud Watershed Monitoring and Assessment Report (wq-ws3-07010203b)
• Mississippi River Twin Cities Watershed Monitoring and Assessment Report (wq-ws3-07010206b)
• Mississippi River - Winona Watershed Monitoring and Assessment Report (wq-ws3-07040003b)
• Missouri River Basin Monitoring and Assessment Report (wq-ws3-10170204b)
• Nemadji River Watershed Monitoring and Assessment Report (wq-ws3-04010301b)
• Mustinka River Watershed Monitoring and Assessment Report (wq-ws3-09020102b)
• North Fork Crow River Watershed Monitoring and Assessment Report (wq-ws3-07010204b)
• Pomme de Terre River Watershed Report (wq-ws4-01)
• Redeye River Watershed Monitoring and Assessment Report (wq-ws3-07010107b)

22 April 2015 | Swimmable, fishable, fixable? What we’ve learned so far about Minnesota waters
• Root River Watershed Monitoring and Assessment Report (wq-ws3-07040008b)
• Sand Hill River Watershed Monitoring and Assessment Report (wq-ws3-09020301b)
• Sauk River Watershed Monitoring and Assessment Report (wq-ws3-07010202b)
• Shell Rock River Monitoring and Assessment Report (wq-ws3-07080202b)
• St. Louis Watershed Monitoring and Assessment Report (wq-ws3-04010201b)
• Thief River Watershed Monitoring and Assessment Report (wq-ws3-09020304b)
• Upper Red River of the North Watershed Monitoring and Assessment Report (wq-ws3-09020104b)
• Vermillion River Watershed Monitoring and Assessment Report (wq-ws3-07040001c)

April 2015 | Swimmable, fishable, fixable? What we’ve learned so far about Minnesota waters 23
Appendix B: Stressor identification reports to date
Stressor identification reports for watersheds are available on the MPCA website at: www.pca.state.mn.us/rprk9fa
• Anne River TMDL Project Stressor Identification Report (wq-iw6-07m)
• Bluff Creek TMDL Biological Stressor Identification (wq-iw7-28n)
• Brown’s Creek Impaired Biota TMDL - Stressor Identification (wq-iw6-05m)
• Buffalo River Watershed Biotic Stressor Identification Report (wq-ws5-09020106)
• Crow Wing River Watershed Stressor Identification Report (wq-ws5-07010106)
• Groundhouse River Stressor Identification Report (wq-iw6-02h)
• Grove Creek Stressor Identification Report (wq-ws5-07010204a)
• Hawk Creek Watershed Biotic Stressor Identification (wq-iw7-14b)
• Le Sueur River Watershed Biotic Stressor Identification Report (wq-ws5-07020011)
• Little Rock Creek Stressor ID Report (wq-iw8-09m)
• Little Sioux River Watershed Biotic Stressor Identification Report (wq-ws5-10230003a)
• Lower Big Sioux River Watershed Biotic Stressor Identification Report (wq-ws5-10170203a)
• Mississippi River-Lake Pepin Tributaries Biotic Stressor Identification (wq-ws3-07040001d)
• Mississippi River-St. Cloud Stressor Identification Report (wq-ws3-07010203c)
• Mississippi River-Winona Watershed Biotic Stressor Identification Report (wq-ws5-07040003a)
• Nemadji River Watershed Stressor Identification Report (wq-ws5-04010301a )
• Mud Creek Stressor Identification Report (wq-iw6-11n)
• North Fork Crow River Watershed Biotic Stressor Identification Report (wq-ws5-07010204b)
• Pomme de Terre River Watershed Biotic Stressor Identification Study (wq-iw7-36n)
• Redeye River Watershed Stressor Identification Report (wq-ws5-07010107)
• Root River Watershed Stressor Identification Report (wq-ws5-07040008)
• Sand Hill River Watershed Biotic Stressor Identification Report (wq-ws5-09020301)
• Sauk River Watershed Stressor Identification Report (wq-iw8-38n)
• Shell Rock River Watershed Biotic Stressor Identification Report (wq-ws5-7080202)
• Shingle Creek and Bass Creek Biotic Integrity Stressor ID (wq-iw11-11n)
• Upper Big Sioux River Watershed Biotic Stressor Identification Report (wq-ws5-10170202a)
• Vermillion River Watershed Stressor Identification Report (wq-ws5-07040001)
• Yellow Medicine River Watershed Biotic Stressor Identification (wq-ws5-07020004)

24 April 2015 | Swimmable, fishable, fixable? What we’ve learned so far about Minnesota waters
Appendix C: WRAPS documents to date
• Crow Wing (wq-ws4-09a)
• North Fork Crow ( wq-ws4-06a)
• Mississippi River – Lake Pepin (wq-iw9-15n)
• Mississippi River St. Cloud (wq-ws4-07a)
• Pomme de Terre (wq-ws4-01 )
• Sauk River (wq-ws4-08a)
• Snake - St. Croix River Basin (wq-ws4-04 )
• Lower St. Croix (Sunrise) (wq-ws4-05a )
• Lower Mississippi River WMO ((wq-iw8-43e )
• Buffalo RIver Watershed (public comment closes April 29)
• Le Sueur (wq-ws4-10a) (public comment closes April 29)

April 2015 | Swimmable, fishable, fixable? What we’ve learned so far about Minnesota waters 25
Additional resources
How’s the Water? www.pca.state.mn.us/index.php/water/hows-the-water/hows-the-water.html
Biological monitoring www.pca.state.mn.us/sbiz8cc
Minnesota watersheds www.pca.state.mn.us/jsrie74
Waterfront Bulletin, an email newsletter about watershed funding, projects, events, and research www.pca.state.mn.us/waterfront
Clean Water Accountability Act www.pca.state.mn.us/8udx3k3
MPCA videos relating to watershed monitoring
Stream gets a check-up: MPCA staff check the health of a small stream by surveying its inhabitants. The types of creatures they find or don't find living in a water body, can tell a lot about the state of the water in which they are living.
Spring storms and erosion: Intense storms of late spring can throw open a door to large scale erosion when those storms arrive before spring plantings have taken root. This story shows how one hydrologist in the Watonwan River area in southern Minnesota captured such an example with his i-Phone. It's clear that the combination of high intensity storms that start in late April and early May, combined with deep tillage and no groundcover can and does lead to significant erosion.
Watershed monitoring - Whitewater River: Staff from the MPCA and the Department of Natural Resources use many tools to monitor the Whitewater River Watershed. Some of them are funded by the Clean Water Land and Legacy Amendment.
Water stories: Taking the pulse of rivers: Jennifer Ender, a pollution control specialist with the MPCA, has her hand on the pulse of rivers in southeast Minnesota. She checks the health of several rivers and contributing streams twice a month. Ender is responsible for an incredible amount of data that will flow to several projects. By studying the data, the MPCA and partners identify healthy waters that need protection and problem areas that need restoration.