swedish interconnectors - svenska kraftnät · swedish interconnectors comp case n0 39351...
TRANSCRIPT

February 8th, 2017 2017/273
Swedish Interconnectors
COMP Case N0 39351
Monitoring Report No 13

2/56

3/56
Table of Contents
1 Svenska kraftnät’s commitment ............................................................................... 4
2 Period January 1 – March 31, Q1 2016 ..................................................................... 5
2.1 Allocation of trading capacity .................................................................... 6
2.2 Comments on each interconnector ............................................................. 9
Appendix A – 2016 Q1 ...................................................................................................... 12
3 Period April 1 – June 30, Q2 2016 ......................................................................... 18
3.1 Allocation of trading capacity .................................................................. 19
3.2 Comments on each interconnector ........................................................... 23
Appendix A – 2016 Q2...................................................................................................... 25
4 Period July 1 – September 30, Q3 2016 ................................................................. 31
4.1 Allocation of trading capacity .................................................................. 32
4.2 Comments on each interconnector ........................................................... 36
Appendix A – 2016 Q3..................................................................................................... 38
5 Period October 1 – December 31, Q4 2016 ............................................................ 44
5.1 Allocation of trading capacity .................................................................. 45
5.2 Comments on each interconnector ...........................................................49
Appendix A – 2016 Q4 ..................................................................................................... 51

4/56
1 Svenska kraftnät’s commitment
As committed, Svenska kraftnät has subdivided the Swedish part of the Nordic electricity market into several bidding zones
and the Swedish Transmission System is operated on this basis since November 1, 2011. Congestion in the Swedish
Transmission System, with exception of Congestion in the West Coast Corridor, is generally managed without limiting
Trading Capacity on Interconnectors. This can be seen in subsequent chapters, and is particularly evident in Table 3 in each
chapter (there is one chapter per quarter).
5/56
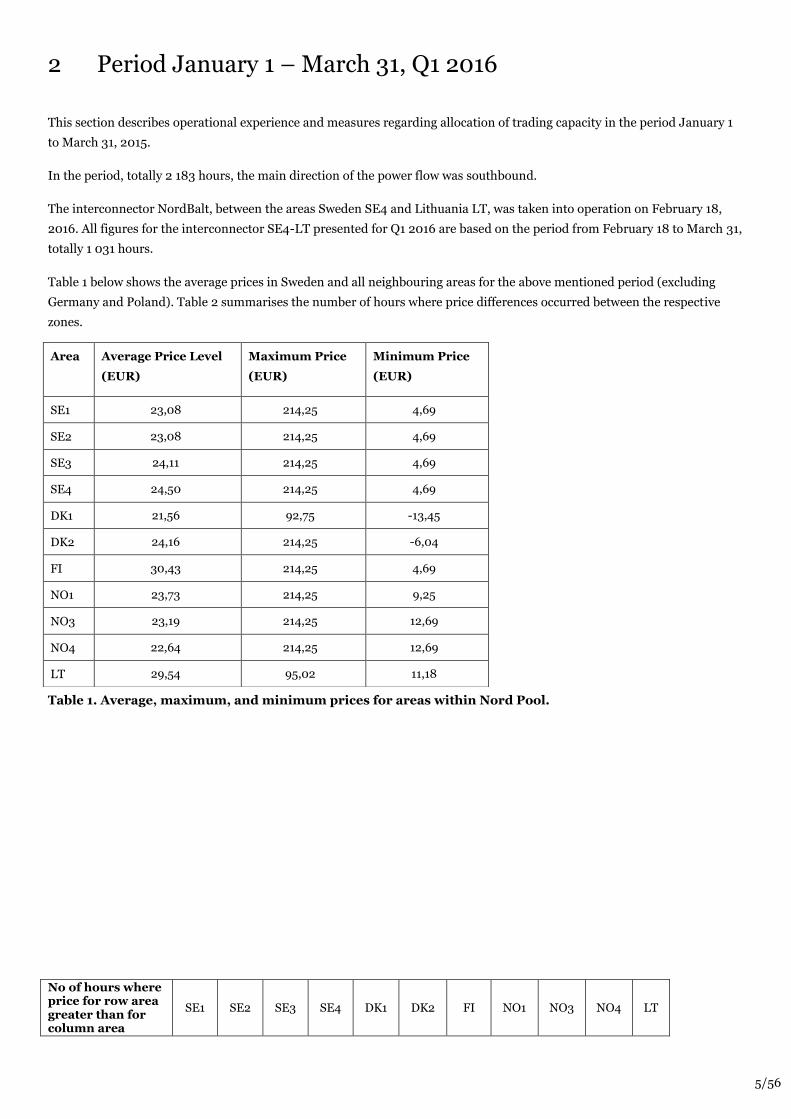
2 Period January 1 – March 31, Q1 2016
This section describes operational experience and measures regarding allocation of trading capacity in the period January 1
to March 31, 2015.
In the period, totally 2 183 hours, the main direction of the power flow was southbound.
The interconnector NordBalt, between the areas Sweden SE4 and Lithuania LT, was taken into operation on February 18,
2016. All figures for the interconnector SE4-LT presented for Q1 2016 are based on the period from February 18 to March 31,
totally 1 031 hours.
Table 1 below shows the average prices in Sweden and all neighbouring areas for the above mentioned period (excluding
Germany and Poland). Table 2 summarises the number of hours where price differences occurred between the respective
zones.
Table 1. Average, maximum, and minimum prices for areas within Nord Pool.
No of hours where price for row area greater than for column area
SE1 SE2 SE3 SE4 DK1 DK2 FI NO1 NO3 NO4 LT
Area Average Price Level
(EUR)
Maximum Price
(EUR)
Minimum Price
(EUR)
SE1 23,08 214,25 4,69
SE2 23,08 214,25 4,69
SE3 24,11 214,25 4,69
SE4 24,50 214,25 4,69
DK1 21,56 92,75 -13,45
DK2 24,16 214,25 -6,04
FI 30,43 214,25 4,69
NO1 23,73 214,25 9,25
NO3 23,19 214,25 12,69
NO4 22,64 214,25 12,69
LT 29,54 95,02 11,18

6/56
SE1 - 0 0 0 449 86 0 165 10 416 0
SE2 0 - 0 0 449 86 0 165 10 416 0
SE3 139 139 - 0 482 86 0 175 149 554 0
SE4 299 299 177 - 645 86 37 308 309 650 0
DK1 190 190 62 42 - 31 16 187 198 588 3
DK2 314 314 196 20 584 - 45 317 324 663 0
FI 1 268 1 268 1 206 1 178 1 478 1 242 - 1 249 1 270 1 453 4
NO1 178 178 42 42 452 112 39 - 175 578 3
NO3 141 141 141 141 497 194 98 301 - 491 37
NO4 108 108 108 108 452 161 83 212 0 - 30
LT 736 736 736 706 784 723 398 746 735 847 -
Table 2. Number of hours where the price for the area in the row was higher than for the area in the
column.
Summary of table 1 and 2:
LT had the highest average price, followed by FI, SE4, DK2, SE3, NO1, NO3, SE1, SE2, NO4, DK1 respectively.
SE1 and SE2 had a common price during all hours.
2.1 Allocation of trading capacity Table 3 below summarises how often Svenska kraftnät have allocated less trading capacity than maximum NTC for
interconnectors and corridors between internal areas in the period.

7/56
Interconnectors/
corridors between
internal areas
No of limited hours No of days with
limitation
Average reduction
Export/
South-
bound
Import/
North-
bound
Export/
South-
bound
Import/
North-
bound
Export/
South-
bound
Import/
North-
bound
SE1-SE2 94 0 5 0 0 % 0 %
SE2-SE3 1 319 0 55 0 4 % 0 %
SE3-SE4 1 115 0 48 0 3 % 0 %
SE1-FI 1 274 228 56 13 1 % -2 %
SE1-NO4 0 0 0 0 0 % 0 %
SE2-NO3 0 0 0 0 0 % 0 %
SE2-NO4 0 0 0 0 0 % 0 %
SE3-DK1 4 541 1 62 0 % 7 %
SE3-FI 2 2 1 1 0 % 0 %
SE3-NO1 519 12 62 2 5 % 0 %
SE4-DE 0 481 0 60 0 % 4 %
SE4-DK2 6 482 1 59 0 % 4 %
SE4-PL 40 451 3 57 1 % 5 %
SE4-LT 266 266 13 13 26 % 26 %
Table 3. Limitations in trading capacity on interconnectors and corridors between internal areas as
enforced by Svenska kraftnät. The columns with average reductions shows the average NTC divided by
maximum NTC.
The majority of the limitations of export capacity on the interconnector SE1-FI, enforced by Svenska kraftnät during the
period, are because of that the NTC depends on forecasted transfer between Kalix - Ossauskoski and Ivalo - Varangerbotn.
The forecasted transfer can both increase and decrease the NTC. The interconnector Kalix – Ossauskoski was dismantled on
January 25, 2016.
Table 4 below summarises the time during which neighbouring TSOs have allocated less trading capacity than maximum
NTC to interconnectors in the period.

8/56
Interconnectors/
corridors between
internal areas
No of limited hours No of days with
limitation
Average reduction
Export/
South-
bound
Import/
North-
bound
Export/
South-
bound
Import/
North-
bound
Export/
South-
bound
Import/
North-
bound
SE1-SE2 - - - - - -
SE2-SE3 - - - - - -
SE3-SE4 - - - - - -
SE1-FI 1 302 58 1 302 235 2 % -2 %
SE1-NO4 2 183 91 2 183 2 183 27 % 18 %
SE2-NO3 763 36 763 0 10 % 0 %
SE2-NO4 2 183 91 2 183 2 183 28 % 44 %
SE3-DK1 198 9 198 0 2 % 0 %
SE3-FI 10 2 10 10 0 % 0 %
SE3-NO1 15 2 15 2 088 0 % 7 %
SE4-DE 977 64 977 1 646 32 % 45 %
SE4-DK2 45 5 45 45 1 % 1 %
SE4-PL 1 195 91 1 195 2 183 41 % 86 %
SE4-LT 266 266 13 13 26 % 26 %
Table 4. Limitations in trading capacity on interconnectors as enforced by neighbouring TSOs. The
columns with average reductions shows the average NTC divided by maximum NTC.
Table 5 below summarises the time during which capacities on interconnectors and corridors between internal areas have
been reduced, taking into account reductions by both Svenska kraftnät and neighbouring TSOs.

9/56
Interconnectors/
corridors between
internal areas
No of limited hours No of days with
limitation
Average reduction
Export/
South-
bound
Import/
North-
bound
Export/
South-
bound
Import/
North-
bound
Export/
South-
bound
Import/
North-
bound
SE1-SE2 94 0 5 0 0 % 0 %
SE2-SE3 1 319 0 55 0 4 % 0 %
SE3-SE4 1 115 0 48 0 3 % 0 %
SE1-FI 1 302 235 58 15 2 % -2 %
SE1-NO4 2 183 2 183 91 91 27 % 18 %
SE2-NO3 763 0 36 0 10 % 0 %
SE2-NO4 2 183 2 183 91 91 28 % 44 %
SE3-DK1 202 545 10 63 3 % 7 %
SE3-FI 10 10 2 2 0 % 0 %
SE3-NO1 537 2 088 64 87 5 % 7 %
SE4-DE 979 1 795 64 91 32 % 46 %
SE4-DK2 51 529 6 60 1 % 5 %
SE4-PL 1 218 2 183 91 91 42 % 86 %
SE4-LT 266 266 13 13 26 % 26 %
Table 5. Final limitations in trading capacity on interconnectors and corridors between internal areas as
enforced by both Svenska kraftnät and neighbouring TSOs. The columns with average reductions shows
the average NTC divided by maximum NTC.
Detailed information for each limitation is provided in the attached tables A2 to A5 in appendix A and in the attachment.
This information includes the reason for each limitation.
2.2 Comments on each interconnector
2.2.1 SE1-FI, North Finland
Svenska kraftnät has reduced the export and import capacity for 1 274 and 228 hours, respectively, on the interconnector
between SE1 and FI, because the NTC depends on forecasted transfer between Kalix – Ossauskoski and Ivalo –
Varangerbotn. The interconnector Kalix – Ossauskoski was dismantled on January 25, 2016.

10/56
2.2.2 SE1-NO4, North Norway
Svenska kraftnät has not reduced the capacity on the interconnector between SE1 and NO4. In total, the export and import
on the interconnector have been reduced during all hours.
2.2.3 SE2-NO3, Central Norway
Svenska kraftnät has not reduced the capacity on the interconnector between SE2 and NO3. In total, the export and import
on the interconnector have been reduced for 765 and 0 hours, respectively.
2.2.4 SE2-NO4, North Norway
Svenska kraftnät has not reduced the capacity on the interconnector between SE2 and NO4. In total, the export and import
on the interconnector have been reduced during all hours.
2.2.5 SE3-DK1, Western Denmark
Svenska kraftnät has reduced the export and import capacity for 4 and 541 hours, respectively, on the interconnector
between SE3 and DK1. The reason for reductions set by Svenska kraftnät was mainly congestion in the West Coast Corridor.
In total, the export and import on the interconnector have been reduced for 202 and 545 hours, respectively.
2.2.6 SE3-FI, Southern Finland
Svenska kraftnät has reduced the export and import capacity for 2 and 2 hours, respectively, on the interconnector between
SE3 and FI. The reason for reductions set by Svenska kraftnät was planned maintenance. In total, the export and import on
the interconnector have been reduced for 10 and 10 hours, respectively.
2.2.7 SE3-NO1, Southern Norway
Svenska kraftnät has reduced the export and import capacity for 519 and 12 hours, respectively, on the interconnector
between SE3 and NO1. The reason for export reductions set by Svenska kraftnät was mainly congestion in the West Coast
Corridor. In total, the export and import on the interconnector have been reduced for 537 and 2 088 hours, respectively.
2.2.8 SE4-DE, Germany
Svenska kraftnät has reduced the export and import capacity for 0 and 481 hours, respectively, on the interconnector
between SE4 and DE. The main reason for reductions set by Svenska kraftnät was congestion in the West Coast Corridor. In
total, the export and import on the interconnector have been reduced for 979 and 1 795 hours, respectively.
2.2.9 SE4-DK2, Eastern Denmark
Svenska kraftnät has reduced the export and import capacity for 6 and 482 hours, respectively, on the interconnector
between SE4 and DK2. The main reason for reductions set by Svenska kraftnät was congestion in the West Coast Corridor,
but also due to planned excavation work close to interconnector. In total, the export and import on the interconnector have
been reduced for 51 and 529 hours, respectively.
2.2.10 SE4-PL, Poland
Svenska kraftnät has reduced the export and import capacity for 40 and 451 hours, respectively, on the interconnector
between SE4 and PL. The main reason for reductions set by Svenska kraftnät was congestion in the West Coast Corridor, and
the reason for the other reductions were planned maintenance. In total, the export and import on the interconnector have
been reduced for 1 218 and 2 183 hours, respectively.
2.2.11 SE4-LT, Lithuania
Svenska kraftnät has reduced the export and import capacity for 266 and 266 hours, respectively, on the interconnector
between SE4 and LT. The main reason for reductions set by Svenska kraftnät were cable faults. In total, the export and
import on the interconnector have been reduced for 266 and 266 hours, respectively.

11/56

12/56
Appendix A – 2016 Q1
The attached spreadsheet contains data for each hour during the period. Each value in the spreadsheet is explained in the
table below.
Value Explanation
Maximum NTC export/southbound (MW)
Maximum NTC import/northbound (MW)
Maximum NTC for export/import, as
agreed by TSOs on both sides, and
maximum NTC for corridors between
internal areas in south/north direction.
These values normally only change after
the network has been reinforced.
Svk NTC export (MW)
Svk NTC import (MW)
Svenska kraftnät’s view of NTC for
export/import.
Svk Reduction export (Y/N)
Svk Reduction import (Y/N)
Yes (Y), if Svenska kraftnät’s view of NTC
for export/import is lower than
maximum NTC, otherwise No (N).
Svk Reduction export (MW)
Svk Reduction import (MW)
Difference between maximum NTC and
Svenska kraftnät’s view of NTC.
Svk Reason for export reduction
Svk Reason for import reduction
Reason codes for Svenska kraftnät’s
reduction of capacities. Reduction codes
are according Nord Pool’s instructions
only reported when the reduction is
greater than 100 MW. Because of this
principle, there might be mismatches
between the figures shown in table 3 and
5 and tables A2 to A5. See separate sheet
in spreadsheet file for explanation of the
codes.
Neighbouring TSO NTC export (MW)
Neighbouring TSO NTC import (MW)
Neighbouring TSO’s view of NTC for
export/import.
Final NTC export/southbound (MW)
Final NTC import/northbound (MW)
Final NTC for corridors between internal
areas in south/north direction, and the
minimum of Svenska kraftnät’s view and
the neighbouring TSO’s view of the
export/import NTC on interconnectors.
Final Reduction export/southbound (Y/N)
Final Reduction import/northbound (Y/N)
Yes (Y), if the final NTC is lower than the
maximum NTC, otherwise No (N).
Final Reduction export/southbound (MW)
Final Reduction import/northbound (MW)
Difference between maximum NTC and
final NTC.

13/56
Final Reason for export/southbound reduction
Final Reason for import/northbound reduction
Reason codes for reduction of the final
capacities. Reduction codes are
according Nord Pool’s instructions only
reported when the reduction is greater
than 100 MW. Because of this principle,
there might be mismatches between the
figures shown in table 3 and 5 and tables
A2 to A5. See separate sheet in
spreadsheet file for explanation of the
codes.
Registered physical flow (positive for imports and
negative for exports/positive for southbound and
negative for northbound)
Measured flow on interconnectors and
corridors between internal areas.
Electricity price level
SE1/SE2/SE3/SE4/DK1/DK2/NO1/NO3/NO4/FI/LT
(EUR)
Price level in SE1, SE2, SE3, SE4, DK1,
DK2, NO1, NO3, NO4, FI, and LT. Prices
for DE and PL are not available, since
they are not part of Nord Pool. Red
figures indicate a higher price than
neighbouring SE-area, and blue indicates
a lower price.
Price difference (Y/N) Yes (Y), if there is a price difference
between neighbouring SE-area and
current area, otherwise No (N). Blank for
DE and PL.
Table A1. Explanation of data in the attached spreadsheet.
Tables A2 to A5 shows how of many hours the capacities have been reduced per type of reduction for each interconnector
and corridor between internal areas. The reason codes are explained in the attached spreadsheet.

14/56
1010 1162 1267 1421 1422 1433 1462 1563 1567 1621 1622 1623 1624 2214 2223 2523 2524 9967 9999
SE1-SE2 2 113 18 11 41
SE2-SE3 864 29 2 1 288
SE3-SE4 1 410 4 576 2 191
SE1-FI 2 183
SE1-NO4 2 183
SE2-NO3 2 183
SE2-NO4 2 183
SE3-DK1 2 179 4
SE3-FI 2 181 2
SE3-NO1 1 708 4 7 407 4 53
SE4-DE 2 183
SE4-DK2 2 179 4
SE4-PL 2 143 26 14
SE4-LT 765 215 24 24 3
Table A2. Number of hours per type of export reduction (for interconnectors) and per type of southbound reduction (for corridors between internal areas)
enforced by Svenska kraftnät.
15/56
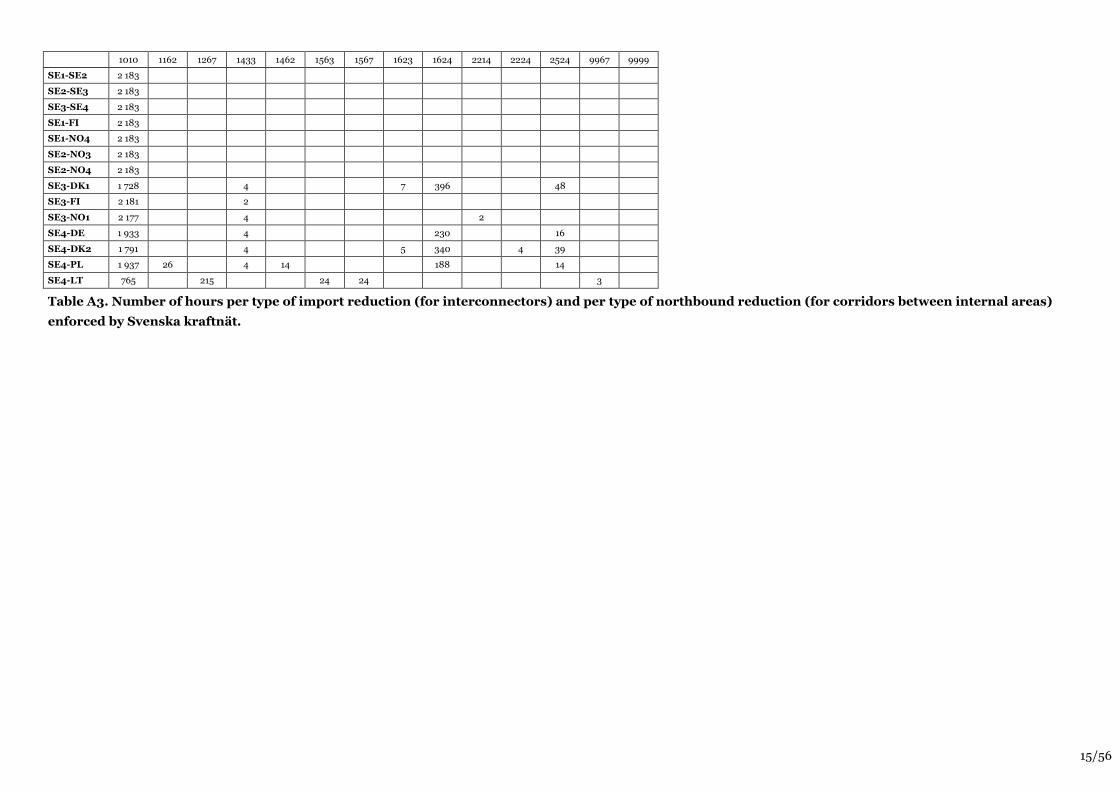
1010 1162 1267 1433 1462 1563 1567 1623 1624 2214 2224 2524 9967 9999
SE1-SE2 2 183
SE2-SE3 2 183
SE3-SE4 2 183
SE1-FI 2 183
SE1-NO4 2 183
SE2-NO3 2 183
SE2-NO4 2 183
SE3-DK1 1 728 4 7 396 48
SE3-FI 2 181 2
SE3-NO1 2 177 4 2
SE4-DE 1 933 4 230 16
SE4-DK2 1 791 4 5 340 4 39
SE4-PL 1 937 26 4 14 188 14
SE4-LT 765 215 24 24 3
Table A3. Number of hours per type of import reduction (for interconnectors) and per type of northbound reduction (for corridors between internal areas)
enforced by Svenska kraftnät.

16/56
1010 1126 1158 1162 1414 1420 1421 1422 1431 1433 1442 1445 1447 1450 1462 1515 1550 1621 1622 1623 1624 1915
SE1-SE2 2 113 18 11 41
SE2-SE3 864 29 2 1 288
SE3-SE4 1 410 4 576
SE1-FI 2 111 4 68
SE1-NO4 1 751 30 384 18
SE2-NO3 1 701 30 384 24 18 26
SE2-NO4 1 751 30 384 18
SE3-DK1 1 981 4 198
SE3-FI 2 173 8 2
SE3-NO1 1 689 9 4 5 7 409
SE4-DE 1 291
SE4-DK2 2 134 45 4
SE4-PL 975 13 12
SE4-LT 765
2214 2223 2523 2524 9967 9999
SE1-SE2
SE2-SE3
SE3-SE4 2 191
SE1-FI
SE1-NO4
SE2-NO3
SE2-NO4
SE3-DK1
SE3-FI
SE3-NO1 6 54
SE4-DE 892
SE4-DK2
SE4-PL 1 183
SE4-LT 3 263
Table A4. Number of hours per type of export reduction as enforced by Svenska kraftnät and neighbouring TSOs (for interconnectors) and per type of
southbound reduction (for corridors between internal areas) enforced by Svenska kraftnät.

17/56
1010 1126 1158 1162 1414 1420 1431 1433 1445 1447 1450 1515 1550 1623 1624 1714 1955 2214 2224 2524 9967 9999
SE1-SE2 2 183
SE2-SE3 2 183
SE3-SE4 2 183
SE1-FI 2 176 4 3
SE1-NO4 1 701 30 384 24 18 26
SE2-NO3 2 183
SE2-NO4 1 953 30 182 18
SE3-DK1 1 728 4 7 396 48
SE3-FI 2 173 8 2
SE3-NO1 1 810 9 4 12 342 6
SE4-DE 678 76 7 1 422
SE4-DK2 1 747 45 4 5 340 4 38
SE4-PL 24 2 7 2 150
SE4-LT 3 263
Table A5. Number of hours per type of import reduction as enforced by Svenska kraftnät and neighbouring TSOs (for interconnectors) and per type of
northbound reduction (for corridors between internal areas) enforced by Svenska kraftnät.
18/56
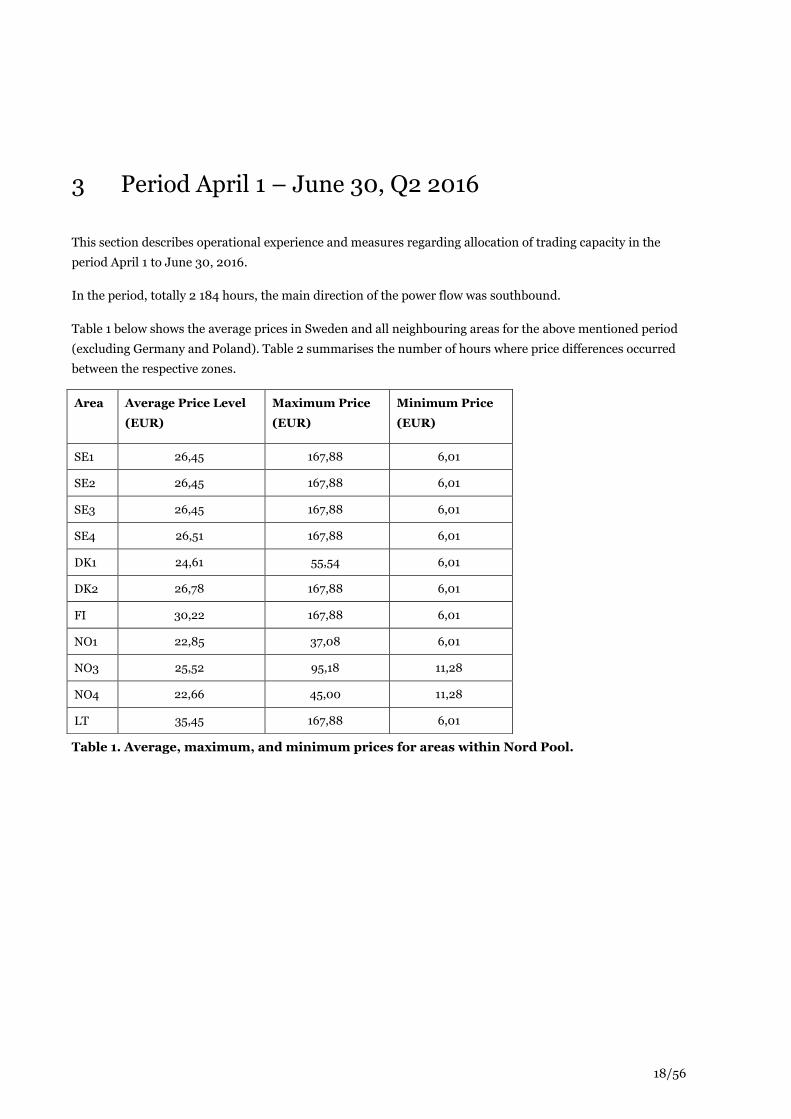
3 Period April 1 – June 30, Q2 2016
This section describes operational experience and measures regarding allocation of trading capacity in the
period April 1 to June 30, 2016.
In the period, totally 2 184 hours, the main direction of the power flow was southbound.
Table 1 below shows the average prices in Sweden and all neighbouring areas for the above mentioned period
(excluding Germany and Poland). Table 2 summarises the number of hours where price differences occurred
between the respective zones.
Table 1. Average, maximum, and minimum prices for areas within Nord Pool.
Area Average Price Level
(EUR)
Maximum Price
(EUR)
Minimum Price
(EUR)
SE1 26,45 167,88 6,01
SE2 26,45 167,88 6,01
SE3 26,45 167,88 6,01
SE4 26,51 167,88 6,01
DK1 24,61 55,54 6,01
DK2 26,78 167,88 6,01
FI 30,22 167,88 6,01
NO1 22,85 37,08 6,01
NO3 25,52 95,18 11,28
NO4 22,66 45,00 11,28
LT 35,45 167,88 6,01

19/56
No of hours where price for row area greater than for column area
SE1 SE2 SE3 SE4 DK1 DK2 FI NO1 NO3 NO4 LT
SE1 - 0 0 0 599 5 0 931 222 1 328 0
SE2 0 - 0 0 599 5 0 931 222 1 328 0
SE3 7 7 - 0 599 5 0 931 225 1 328 0
SE4 38 38 31 - 627 5 8 941 245 1 343 0
DK1 56 56 50 44 - 29 22 735 205 1 186 4
DK2 176 176 170 143 716 - 83 987 368 1 372 13
FI 816 816 816 815 1 211 801 - 1 366 922 1 539 3
NO1 12 12 9 9 148 12 9 - 4 847 6
NO3 204 204 204 204 726 204 137 1 120 - 1 460 83
NO4 73 73 73 73 358 73 54 670 14 - 36
LT 1 601 1 601 1 601 1 597 1 797 1 585 1 178 1 847 1 666 1 877 -
Table 2. Number of hours where the price for the area in the row was higher than for the area
in the column.
Summary of table 1 and 2:
LT had the highest average price, followed by FI, DK2, SE4, SE1, SE2, SE3, NO3, DK1, NO1, and NO4 respectively.
SE1 and SE2 had a common price during all hours.
3.1 Allocation of trading capacity Table 3 below summarises how often Svenska kraftnät have allocated less trading capacity than maximum
NTC for interconnectors and corridors between internal areas in the period.

20/56
Interconnectors/
corridors between
internal areas
No of limited hours No of days with
limitation
Average reduction
Export/
South-
bound
Import/
North-
bound
Export/
South-
bound
Import/
North-
bound
Export/
South-
bound
Import/
North-
bound
SE1-SE2 416 0 24 0 4 % 0 %
SE2-SE3 2 002 0 84 0 6 % 0 %
SE3-SE4 1 776 0 74 0 6 % 0 %
SE1-FI 435 1 573 24 69 8 % 11 %
SE1-NO4 47 108 2 10 2 % 4 %
SE2-NO3 0 0 0 0 0 % 0 %
SE2-NO4 0 47 0 2 0 % 1 %
SE3-DK1 81 396 4 40 2 % 6 %
SE3-FI 25 25 4 4 1 % 1 %
SE3-NO1 387 66 37 5 4 % 1 %
SE4-DE 0 297 0 33 0 % 3 %
SE4-DK2 9 299 1 32 0 % 3 %
SE4-PL 79 358 4 34 4 % 7 %
SE4-LT 1 134 1 143 48 49 46 % 46 %
Table 3. Limitations in trading capacity on interconnectors and corridors between internal
areas as enforced by Svenska kraftnät. The columns with average reductions shows the
average NTC divided by maximum NTC.
The majority of the limitations of export capacity on the interconnector SE1-FI, enforced by Svenska kraftnät
during the period, are because of that the NTC depends on forecasted transfer between Ivalo - Varangerbotn.
The forecasted transfer can both increase and decrease the NTC.
Table 4 below summarises the time during which neighbouring TSOs have allocated less trading capacity than
maximum NTC to interconnectors in the period.

21/56
Interconnectors/
corridors between
internal areas
No of limited hours No of days with
limitation
Average reduction
Export/
South-
bound
Import/
North-
bound
Export/
South-
bound
Import/
North-
bound
Export/
South-
bound
Import/
North-
bound
SE1-SE2 - - - - - -
SE2-SE3 - - - - - -
SE3-SE4 - - - - - -
SE1-FI 516 1 562 24 68 9 % 10 %
SE1-NO4 2 184 2 184 91 91 56 % 55 %
SE2-NO3 2 023 81 85 4 31 % 2 %
SE2-NO4 2 184 2 104 91 88 54 % 58 %
SE3-DK1 110 119 7 9 3 % 3 %
SE3-FI 9 9 2 2 0 % 0 %
SE3-NO1 175 1 650 12 70 1 % 13 %
SE4-DE 1 189 1 539 72 88 29 % 38 %
SE4-DK2 49 32 5 4 0 % 1 %
SE4-PL 863 2 184 91 91 33 % 86 %
SE4-LT 1 094 1 094 48 48 44 % 44 %
Table 4. Limitations in trading capacity on interconnectors as enforced by neighbouring TSOs.
The columns with average reductions shows the average NTC divided by maximum NTC.
Table 5 below summarises the time during which capacities on interconnectors and corridors between
internal areas have been reduced, taking into account reductions by both Svenska kraftnät and neighbouring
TSOs.

22/56
Interconnectors/
corridors between
internal areas
No of limited hours No of days with
limitation
Average reduction
Export/
South-
bound
Import/
North-
bound
Export/
South-
bound
Import/
North-
bound
Export/
South-
bound
Import/
North-
bound
SE1-SE2 416 0 24 0 4 % 0 %
SE2-SE3 2 002 0 84 0 6 % 0 %
SE3-SE4 1 776 0 74 0 6 % 0 %
SE1-FI 588 1 573 31 69 10 % 11 %
SE1-NO4 2 184 2 184 91 91 56 % 55 %
SE2-NO3 2 023 81 85 4 31 % 2 %
SE2-NO4 2 184 2 104 91 88 54 % 58 %
SE3-DK1 119 443 8 46 3 % 7 %
SE3-FI 25 25 4 4 1 % 1 %
SE3-NO1 476 1 663 42 71 5 % 14 %
SE4-DE 1 189 1 606 72 88 29 % 39 %
SE4-DK2 58 331 6 36 1 % 4 %
SE4-PL 911 2 184 91 91 35 % 87 %
SE4-LT 1 142 1 151 50 51 46 % 46 %
Table 5. Final limitations in trading capacity on interconnectors and corridors between
internal areas as enforced by both Svenska kraftnät and neighbouring TSOs. The columns with
average reductions shows the average NTC divided by maximum NTC.
Detailed information for each limitation is provided in the attached tables A2 to A5 in appendix A and in the
attachment. This information includes the reason for each limitation.

23/56
3.2 Comments on each interconnector
3.2.1 SE1-FI, North Finland
Svenska kraftnät has reduced the export and import capacity for 435 and 1 573 hours, respectively, on the
interconnector between SE1 and FI, mainly because the NTC depends on forecasted transfer between Ivalo –
Varangerbotn, but also due to planned maintenance on the interconnector. In total, the export and import on
the interconnector have been reduced for 588 and 1 573 hours, respectively.
3.2.2 SE1-NO4, North Norway
Svenska kraftnät has reduced the export and import capacity for 47 and 108 hours, respectively, on the
interconnector between SE1 and NO4 because of planned maintenance close to the interconnector. In total,
the export and import on the interconnector have been reduced during all hours.
3.2.3 SE2-NO3, Central Norway
Svenska kraftnät has not reduced the capacity on the interconnector between SE2 and NO3. In total, the
export and import on the interconnector have been reduced for 2 023 and 81 hours, respectively.
3.2.4 SE2-NO4, North Norway
Svenska kraftnät has not reduced the capacity on the interconnector between SE2 and NO4. In total, the
export and import on the interconnector have been reduced during all hours.
3.2.5 SE3-DK1, Western Denmark
Svenska kraftnät has reduced the export and import capacity for 81 and 396 hours, respectively, on the
interconnector between SE3 and DK1. The main reasons for reductions set by Svenska kraftnät was
congestion in the West Coast Corridor and planned maintenance on the interconnector. In total, the export
and import on the interconnector have been reduced for 119 and 443 hours, respectively.
3.2.6 SE3-FI, Southern Finland
Svenska kraftnät has reduced the export and import capacity for 25 and 25 hours, respectively, on the
interconnector between SE3 and FI. The reason for reductions set by Svenska kraftnät was outage of the
interconnector because of planned maintenance on the interconnector. In total, the export and import on the
interconnector have been reduced for 25 and 25 hours, respectively.
3.2.7 SE3-NO1, Southern Norway
Svenska kraftnät has reduced the export and import capacity for 387 and 66 hours, respectively, on the
interconnector between SE3 and NO1. The reason for reductions set by Svenska kraftnät was mainly
congestion in the West Coast Corridor. In total, the export and import on the interconnector have been
reduced for 476 and 1 663 hours, respectively.
3.2.8 SE4-DE, Germany
Svenska kraftnät has reduced the export and import capacity for 0 and 297 hours, respectively, on the
interconnector between SE4 and DE. The reason for reductions set by Svenska kraftnät was mainly congestion
in the West Coast Corridor. In total, the export and import on the interconnector have been reduced for 1 189
and 1 606 hours, respectively.
24/56
3.2.9 SE4-DK2, Eastern Denmark
Svenska kraftnät has reduced the export and import capacity for 9 and 299 hours, respectively, on the
interconnector between SE4 and DK2. The reason for reductions set by Svenska kraftnät was mainly
congestion in the West Coast Corridor. In total, the export and import on the interconnector have been
reduced for 58 and 331 hours, respectively.
3.2.10 SE4-PL, Poland
Svenska kraftnät has reduced the export and import capacity for 79 and 358 hours, respectively, on the
interconnector between SE4 and PL. The reason for reductions set by Svenska kraftnät was mainly congestion
in the West Coast Corridor, in addition the capacity was reduced because of planned maintenance. In total,
the export and import on the interconnector have been reduced for 911 and 2 184 (all) hours, respectively.
3.2.11 SE4-LT, Lithuania
Svenska kraftnät has reduced the export and import capacity for 1 134 and 1 143 hours, respectively, on the
interconnector between SE4 and LT. The main reasons for reductions set by Svenska kraftnät were cable
faults. In total, the export and import on the interconnector have been reduced for 1 142 and 1 151 hours,
respectively.

25/56
Appendix A – 2016 Q2
The attached spreadsheet contains data for each hour during the period. Each value in the spreadsheet is
explained in the table below.
Value Explanation
Maximum NTC export/southbound (MW)
Maximum NTC import/northbound (MW)
Maximum NTC for export/import, as
agreed by TSOs on both sides, and
maximum NTC for corridors between
internal areas in south/north direction.
These values normally only change after
the network has been reinforced.
Svk NTC export (MW)
Svk NTC import (MW)
Svenska kraftnät’s view of NTC for
export/import.
Svk Reduction export (Y/N)
Svk Reduction import (Y/N)
Yes (Y), if Svenska kraftnät’s view of NTC
for export/import is lower than
maximum NTC, otherwise No (N).
Svk Reduction export (MW)
Svk Reduction import (MW)
Difference between maximum NTC and
Svenska kraftnät’s view of NTC.
Svk Reason for export reduction
Svk Reason for import reduction
Reason codes for Svenska kraftnät’s
reduction of capacities. Reduction codes
are according Nord Pool’s instructions
only reported when the reduction is
greater than 100 MW. Because of this
principle, there might be mismatches
between the figures shown in table 3 and
5 and tables A2 to A5. See separate sheet
in spreadsheet file for explanation of the
codes.
Neighbouring TSO NTC export (MW)
Neighbouring TSO NTC import (MW)
Neighbouring TSO’s view of NTC for
export/import.
Final NTC export/southbound (MW)
Final NTC import/northbound (MW)
Final NTC for corridors between internal
areas in south/north direction, and the
minimum of Svenska kraftnät’s view and
the neighbouring TSO’s view of the
export/import NTC on interconnectors.

26/56
Final Reduction export/southbound (Y/N)
Final Reduction import/northbound (Y/N)
Yes (Y), if the final NTC is lower than the
maximum NTC, otherwise No (N).
Final Reduction export/southbound (MW)
Final Reduction import/northbound (MW)
Difference between maximum NTC and
final NTC.
Final Reason for export/southbound reduction
Final Reason for import/northbound reduction
Reason codes for reduction of the final
capacities. Reduction codes are
according Nord Pool’s instructions only
reported when the reduction is greater
than 100 MW. Because of this principle,
there might be mismatches between the
figures shown in table 3 and 5 and tables
A2 to A5. See separate sheet in
spreadsheet file for explanation of the
codes.
Registered physical flow (positive for imports and
negative for exports/positive for southbound and
negative for northbound)
Measured flow on interconnectors and
corridors between internal areas.
Electricity price level
SE1/SE2/SE3/SE4/DK1/DK2/NO1/NO3/NO4/FI/LT
(EUR)
Price level in SE1, SE2, SE3, SE4, DK1,
DK2, NO1, NO3, NO4, FI, and LT. Prices
for DE and PL are not available, since
they are not part of Nord Pool. Red
figures indicate a higher price than
neighbouring SE-area, and blue indicates
a lower price.
Price difference (Y/N) Yes (Y), if there is a price difference
between neighbouring SE-area and
current area, otherwise No (N). Blank for
DE and PL.
Table A1. Explanation of data in the attached spreadsheet.
Tables A2 to A5 shows how of many hours the capacities have been reduced per type of reduction for each
interconnector and corridor between internal areas. The reason codes are explained in the attached
spreadsheet.

27/56
1010 1114 1125 1157 1162 1167 1267 1414 1421 1422 1423 1425 1426 1431 1432 1433 1457 1458 1467 1499
SE1-SE2 1 778 183 35 3
SE2-SE3 240 57 17 11 12 3
SE3-SE4 1 497 66 10
SE1-FI 1 885 234 29 17 10
SE1-NO4 2 137 24 23
SE2-NO3 2 184
SE2-NO4 2 184
SE3-DK1 2 103 72 9
SE3-FI 2 159 14 10
SE3-NO1 1 867 12 9
SE4-DE 2 184
SE4-DK2 2 175 9
SE4-PL 2 105 79
SE4-LT 1 050 235 470 189
1521 1522 1567 1621 1622 1623 1624 2199 2214 2221 2222 2223 2257 2299 2522 2524 2531 9967 9999
SE1-SE2 48 94 18 7 9 2 7
SE2-SE3 48 1 341 7 4 2 442
SE3-SE4 601 10
SE1-FI 1 1 7
SE1-NO4
SE2-NO3
SE2-NO4
SE3-DK1
SE3-FI 1
SE3-NO1 217 8 71
SE4-DE
SE4-DK2
SE4-PL
SE4-LT 72 144 24
Table A2. Number of hours per type of export reduction (for interconnectors) and per type of southbound reduction (for corridors
between internal areas) enforced by Svenska kraftnät.

28/56
1010 1114 1125 1157 1162 1167 1267 1414 1421 1425 1426 1431 1457 1458 1462 1463 1467 1499 1567 1610
SE1-SE2 2 184
SE2-SE3 2 160
SE3-SE4 2 184
SE1-FI 1 911 234 11 17 10
SE1-NO4 2 095 59 23
SE2-NO3 2 184
SE2-NO4 2 137 24 23
SE3-DK1 1 823 72 9
SE3-FI 2 159 14 10
SE3-NO1 2 155 12 9
SE4-DE 1 983 9 1
SE4-DK2 1 911 9
SE4-PL 1 928 79 9
SE4-LT 1 041 235 470 198 72
1624 2214 2226 2299 2522 2524 2531 9967 9999
SE1-SE2
SE2-SE3 24
SE3-SE4
SE1-FI 1
SE1-NO4 7
SE2-NO3
SE2-NO4
SE3-DK1 211 69
SE3-FI 1
SE3-NO1 8
SE4-DE 137 54
SE4-DK2 196 2 66
SE4-PL 116 52
SE4-LT 144 24
Table A3. Number of hours per type of import reduction (for interconnectors) and per type of northbound reduction (for corridors
between internal areas) enforced by Svenska kraftnät.
29/56
1010 1114 1125 1126 1151 1157 1162 1167 1263 1267 1413 1414 1417 1421 1422 1423 1425 1426 1431 1432 1433 1442 1443 1450 1457 1458
SE1-SE2 1 778 183 35
SE2-SE3 240 57 17 11 12
SE3-SE4 1 497 66
SE1-FI 1 629 243 29 240 24
SE1-NO4 161 6 2 017
SE2-NO3 161 2 023
SE2-NO4 161 2 023
SE3-DK1 2 065 101 9 9
SE3-FI 2 159 14
SE3-NO1 1 775 13 4 2 9 81
SE4-DE 1 153 139
SE4-DK2 2 125 32 9 18
SE4-PL 1 275 67
SE4-LT 1 042 235 216
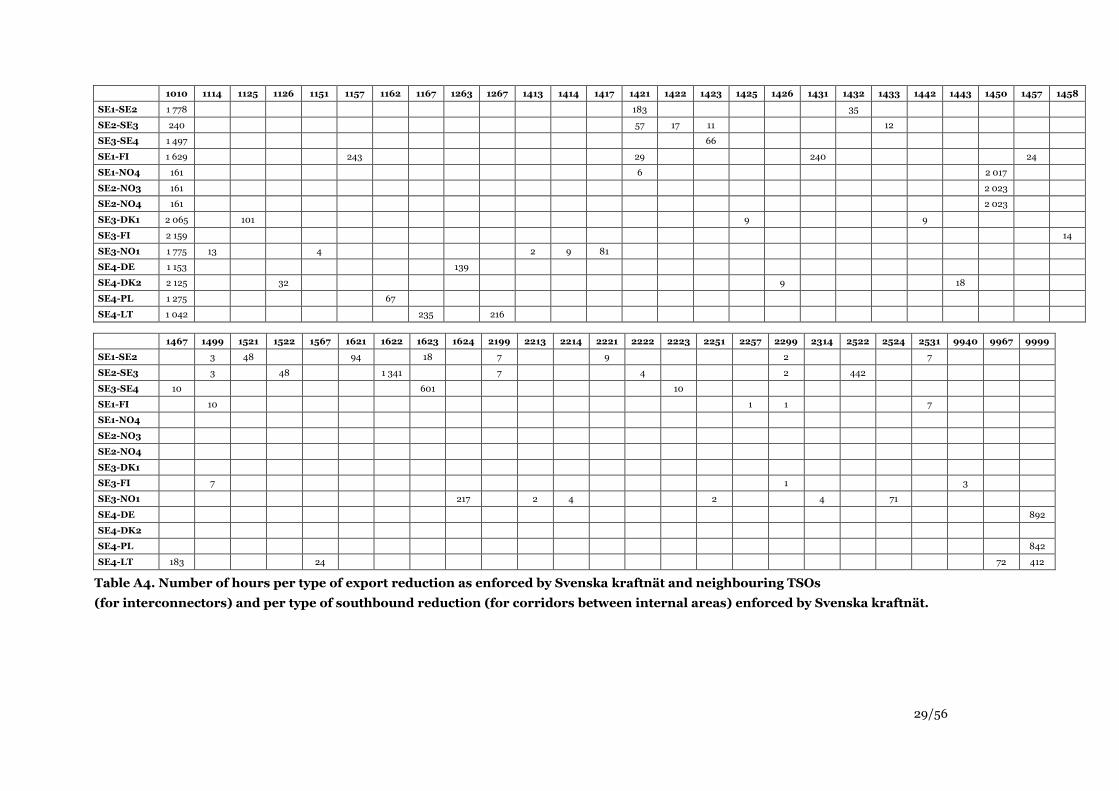
1467 1499 1521 1522 1567 1621 1622 1623 1624 2199 2213 2214 2221 2222 2223 2251 2257 2299 2314 2522 2524 2531 9940 9967 9999
SE1-SE2 3 48 94 18 7 9 2 7
SE2-SE3 3 48 1 341 7 4 2 442
SE3-SE4 10 601 10
SE1-FI 10 1 1 7
SE1-NO4
SE2-NO3
SE2-NO4
SE3-DK1
SE3-FI 7 1 3
SE3-NO1 217 2 4 2 4 71
SE4-DE 892
SE4-DK2
SE4-PL 842
SE4-LT 183 24 72 412
Table A4. Number of hours per type of export reduction as enforced by Svenska kraftnät and neighbouring TSOs
(for interconnectors) and per type of southbound reduction (for corridors between internal areas) enforced by Svenska kraftnät.

30/56
1010 1114 1125 1126 1151 1157 1162 1167 1263 1267 1414 1417 1421 1425 1426 1442 1445 1450 1457
SE1-SE2 2 184
SE2-SE3 2 160
SE3-SE4 2 184
SE1-FI 1 903 234 11 24
SE1-NO4 161 6 2 010
SE2-NO3 2 103 81
SE2-NO4 161 2 023
SE3-DK1 1 776 101 9 14
SE3-FI 2 159
SE3-NO1 1 413 13 4 9 569
SE4-DE 794 139
SE4-DK2 1 879 32 9
SE4-PL 17
SE4-LT 1 033 235 216
1458 1467 1499 1545 1567 1624 1642 2214 2226 2257 2299 2314 2522 2524 2531 9940 9967 9999
SE1-SE2
SE2-SE3 24
SE3-SE4
SE1-FI 10 1 1
SE1-NO4 7
SE2-NO3
SE2-NO4
SE3-DK1 211 4 69
SE3-FI 14 7 1 3
SE3-NO1 168 4 4
SE4-DE 37 41 1 173
SE4-DK2 196 2 66
SE4-PL 1 4 2 162
SE4-LT 192 24 72 412
Table A5. Number of hours per type of import reduction as enforced by Svenska kraftnät and neighbouring TSOs
(for interconnectors) and per type of northbound reduction (for corridors between internal areas) enforced by Svenska kraftnät.

31/56
4 Period July 1 – September 30, Q3 2016
This section describes operational experience and measures regarding allocation of trading capacity in the
period July 1 to September 30, 2016.
In the period, totally 2 208 hours, the main direction of the power flow was southbound.
Table 1 below shows the average prices in Sweden and all neighbouring areas for the above mentioned period
(excluding Germany and Poland). Table 2 summarises the number of hours where price differences occurred
between the respective zones.
Table 1. Average, maximum, and minimum prices for areas within Nord Pool.
Area Average Price Level
(EUR)
Maximum Price
(EUR)
Minimum Price
(EUR)
SE1 29,49 49,4 8,12
SE2 29,49 49,4 8,12
SE3 29,56 49,4 8,12
SE4 29,72 55,45 8,12
DK1 27,61 54,12 6,97
DK2 30,21 81,29 8,12
FI 31,62 72,04 8,12
NO1 22,9 43,81 8,12
NO3 29,13 44,78 12,14
NO4 25,55 28,58 12,14
LT 35,70 202,04 14,46

32/56
No of hours where price for row area greater than for column area
SE1 SE2 SE3 SE4 DK1 DK2 FI NO1 NO3 NO4 LT
SE1 - 0 0 0 1 078 10 0 2 041 387 1 648 0
SE2 0 - 0 0 1 078 10 0 2 041 387 1 648 0
SE3 29 29 - 0 1 079 10 0 2 041 387 1 648 0
SE4 106 106 79 - 1 124 10 26 2 043 448 1 648 0
DK1 132 132 103 84 - 2 84 1 504 391 1 188 59
DK2 235 235 218 171 1 156 - 148 2 064 550 1 658 103
FI 621 621 610 593 1 331 572 - 2 074 864 1 679 9
NO1 2 2 0 0 125 1 0 - 3 98 0
NO3 231 231 231 231 1 139 237 208 2 115 - 1 712 168
NO4 101 101 101 101 819 107 97 2 025 12 - 75
LT 1 215 1 215 1 208 1 184 1 582 1 147 758 2 117 1 357 1 814 -
Table 2. Number of hours where the price for the area in the row was higher than for the area
in the column.
Summary of table 1 and 2:
LT had the highest average price, followed by FI, DK2, SE4, SE3, SE2, SE1, NO3, DK1, NO4, and NO1.
SE1 and SE2 had a common price during all hours.
4.1 Allocation of trading capacity Table 3 below summarises how often Svenska kraftnät have allocated less trading capacity than maximum
NTC for interconnectors and corridors between internal areas in the period.

33/56
Interconnectors/
corridors between
internal areas
No of limited hours No of days with
limitation
Average reduction
Export/
South-
bound
Import/
North-
bound
Export/
South-
bound
Import/
North-
bound
Export/
South-
bound
Import/
North-
bound
SE1-SE2 1 521 0 64 0 2 % 0 %
SE2-SE3 2 208 0 92 0 18 % 0 %
SE3-SE4 1 962 0 82 0 9 % 0 %
SE1-FI 0 1 948 0 82 -3 % 4 %
SE1-NO4 0 213 0 14 0 % 1 %
SE2-NO3 26 11 2 1 1 % 0 %
SE2-NO4 41 17 4 1 1 % 1 %
SE3-DK1 537 767 25 48 16 % 20 %
SE3-FI 24 24 1 1 0 % 0 %
SE3-NO1 430 331 33 17 6 % 6 %
SE4-DE 396 329 17 28 16 % 9 %
SE4-DK2 251 196 12 22 9 % 3 %
SE4-PL 426 447 18 30 17 % 15 %
SE4-LT 552 568 23 25 25 % 25 %
Table 3. Limitations in trading capacity on interconnectors and corridors between internal
areas as enforced by Svenska kraftnät. The columns with average reductions shows the
average NTC divided by maximum NTC.
The majority of the limitations of export capacity on the interconnector SE1-FI, enforced by Svenska kraftnät
during the period, are because of that the NTC depends on forecasted transfer between Ivalo - Varangerbotn.
The forecasted transfer can both increase and decrease the NTC.
Table 4 below summarises the time during which neighbouring TSOs have allocated less trading capacity than
maximum NTC to interconnectors in the period.

34/56
Interconnectors/
corridors between
internal areas
No of limited hours No of days with
limitation
Average reduction
Export/
South-
bound
Import/
North-
bound
Export/
South-
bound
Import/
North-
bound
Export/
South-
bound
Import/
North-
bound
SE1-SE2 - - - - - -
SE2-SE3 - - - - - -
SE3-SE4 - - - - - -
SE1-FI 613 1 963 28 83 8 % 4 %
SE1-NO4 2 208 2 208 92 92 71 % 47 %
SE2-NO3 2 134 327 90 15 33 % 5 %
SE2-NO4 2 208 2 208 92 92 53 % 76 %
SE3-DK1 744 536 33 24 24 % 16 %
SE3-FI 74 74 4 4 1 % 1 %
SE3-NO1 1 464 2 208 63 92 25 % 62 %
SE4-DE 1 138 1 656 70 90 24 % 36 %
SE4-DK2 99 27 6 3 1 % 1 %
SE4-PL 976 2 208 92 92 38 % 83 %
SE4-LT 562 562 24 24 25 % 25 %
Table 4. Limitations in trading capacity on interconnectors as enforced by neighbouring TSOs.
The columns with average reductions shows the average NTC divided by maximum NTC.
Table 5 below summarises the time during which capacities on interconnectors and corridors between
internal areas have been reduced, taking into account reductions by both Svenska kraftnät and neighbouring
TSOs.

35/56
Interconnectors/
corridors between
internal areas
No of limited hours No of days with
limitation
Average reduction
Export/
South-
bound
Import/
North-
bound
Export/
South-
bound
Import/
North-
bound
Export/
South-
bound
Import/
North-
bound
SE1-SE2 1 521 0 64 0 2 % 0 %
SE2-SE3 2 208 0 92 0 18 % 0 %
SE3-SE4 1 962 0 82 0 9 % 0 %
SE1-FI 613 1 963 28 83 8 % 4 %
SE1-NO4 2 208 2 208 92 92 71 % 47 %
SE2-NO3 2 134 327 90 15 33 % 5 %
SE2-NO4 2 208 2 208 92 92 53 % 76 %
SE3-DK1 806 783 37 48 26 % 21 %
SE3-FI 74 74 4 4 1 % 1 %
SE3-NO1 1 602 2 208 74 92 28 % 63 %
SE4-DE 1 298 1 763 73 91 32 % 39 %
SE4-DK2 323 223 15 24 10 % 3 %
SE4-PL 1 090 2 208 92 92 42 % 83 %
SE4-LT 562 578 24 26 25 % 26 %
Table 5. Final limitations in trading capacity on interconnectors and corridors between
internal areas as enforced by both Svenska kraftnät and neighbouring TSOs. The columns with
average reductions shows the average NTC divided by maximum NTC.
Detailed information for each limitation is provided in the attached tables A2 to A5 in appendix A and in the
attachment. This information includes the reason for each limitation.
36/56
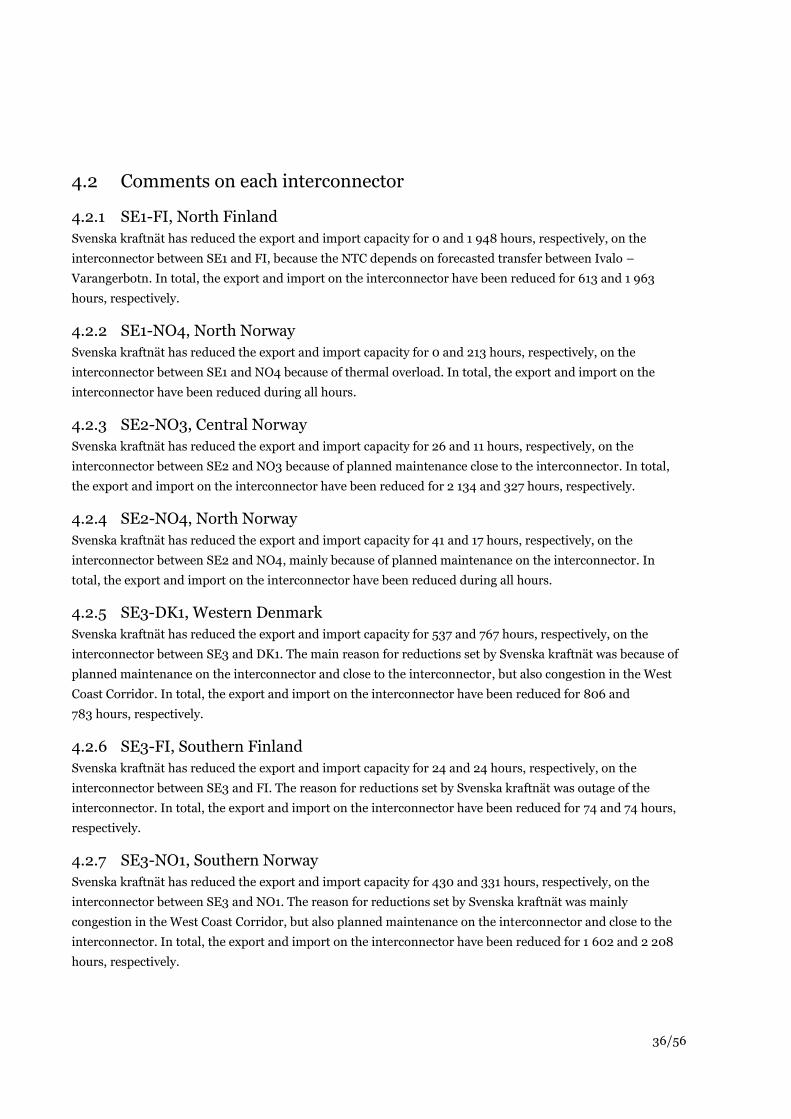
4.2 Comments on each interconnector
4.2.1 SE1-FI, North Finland
Svenska kraftnät has reduced the export and import capacity for 0 and 1 948 hours, respectively, on the
interconnector between SE1 and FI, because the NTC depends on forecasted transfer between Ivalo –
Varangerbotn. In total, the export and import on the interconnector have been reduced for 613 and 1 963
hours, respectively.
4.2.2 SE1-NO4, North Norway
Svenska kraftnät has reduced the export and import capacity for 0 and 213 hours, respectively, on the
interconnector between SE1 and NO4 because of thermal overload. In total, the export and import on the
interconnector have been reduced during all hours.
4.2.3 SE2-NO3, Central Norway
Svenska kraftnät has reduced the export and import capacity for 26 and 11 hours, respectively, on the
interconnector between SE2 and NO3 because of planned maintenance close to the interconnector. In total,
the export and import on the interconnector have been reduced for 2 134 and 327 hours, respectively.
4.2.4 SE2-NO4, North Norway
Svenska kraftnät has reduced the export and import capacity for 41 and 17 hours, respectively, on the
interconnector between SE2 and NO4, mainly because of planned maintenance on the interconnector. In
total, the export and import on the interconnector have been reduced during all hours.
4.2.5 SE3-DK1, Western Denmark
Svenska kraftnät has reduced the export and import capacity for 537 and 767 hours, respectively, on the
interconnector between SE3 and DK1. The main reason for reductions set by Svenska kraftnät was because of
planned maintenance on the interconnector and close to the interconnector, but also congestion in the West
Coast Corridor. In total, the export and import on the interconnector have been reduced for 806 and
783 hours, respectively.
4.2.6 SE3-FI, Southern Finland
Svenska kraftnät has reduced the export and import capacity for 24 and 24 hours, respectively, on the
interconnector between SE3 and FI. The reason for reductions set by Svenska kraftnät was outage of the
interconnector. In total, the export and import on the interconnector have been reduced for 74 and 74 hours,
respectively.
4.2.7 SE3-NO1, Southern Norway
Svenska kraftnät has reduced the export and import capacity for 430 and 331 hours, respectively, on the
interconnector between SE3 and NO1. The reason for reductions set by Svenska kraftnät was mainly
congestion in the West Coast Corridor, but also planned maintenance on the interconnector and close to the
interconnector. In total, the export and import on the interconnector have been reduced for 1 602 and 2 208
hours, respectively.

37/56
4.2.8 SE4-DE, Germany
Svenska kraftnät has reduced the export and import capacity for 396 and 329 hours, respectively, on the
interconnector between SE4 and DE. The main reasons for reductions set by Svenska kraftnät was because of
planned maintenance on the interconnector and congestion in the West Coast Corridor. In total, the export
and import on the interconnector have been reduced for 1 298 and 1 763 hours, respectively.
4.2.9 SE4-DK2, Eastern Denmark
Svenska kraftnät has reduced the export and import capacity for 251 and 196 hours, respectively, on the
interconnector between SE4 and DK2. The main reason for reductions set by Svenska kraftnät was congestion
in the West Coast Corridor, but also planned maintenance close to the intreconnector. In total, the export and
import on the interconnector have been reduced for 323 and 223 hours, respectively.
4.2.10 SE4-PL, Poland
Svenska kraftnät has reduced the export and import capacity for 426 and 447 hours, respectively, on the
interconnector between SE4 and PL. The main reasons for reductions set by Svenska kraftnät was because
planned maintenance on the interconnector and congestion in the West Coast Corridor. In total, the export
and import on the interconnector have been reduced for 1 090 and 2 208 hours, respectively.
4.2.11 SE4-LT, Lithuania
Svenska kraftnät has reduced the export and import capacity for 552 and 568 hours, respectively, on the
interconnector between SE4 and LT. The main reasons for reductions set by Svenska kraftnät was because of
maintenance on the interconnector. In total, the export and import on the interconnector have been reduced
for 562 and 578 hours, respectively.

38/56
Appendix A – 2016 Q3
The attached spreadsheet contains data for each hour during the period. Each value in the spreadsheet is
explained in the table below.
Value Explanation
Maximum NTC export/southbound (MW)
Maximum NTC import/northbound (MW)
Maximum NTC for export/import, as
agreed by TSOs on both sides, and
maximum NTC for corridors between
internal areas in south/north direction.
These values normally only change after
the network has been reinforced.
Svk NTC export (MW)
Svk NTC import (MW)
Svenska kraftnät’s view of NTC for
export/import.
Svk Reduction export (Y/N)
Svk Reduction import (Y/N)
Yes (Y), if Svenska kraftnät’s view of NTC
for export/import is lower than
maximum NTC, otherwise No (N).
Svk Reduction export (MW)
Svk Reduction import (MW)
Difference between maximum NTC and
Svenska kraftnät’s view of NTC.
Svk Reason for export reduction
Svk Reason for import reduction
Reason codes for Svenska kraftnät’s
reduction of capacities. Reduction codes
are according Nord Pool’s instructions
only reported when the reduction is
greater than 100 MW. Because of this
principle, there might be mismatches
between the figures shown in table 3 and
5 and tables A2 to A5. See separate sheet
in spreadsheet file for explanation of the
codes.
Neighbouring TSO NTC export (MW)
Neighbouring TSO NTC import (MW)
Neighbouring TSO’s view of NTC for
export/import.
Final NTC export/southbound (MW)
Final NTC import/northbound (MW)
Final NTC for corridors between internal
areas in south/north direction, and the
minimum of Svenska kraftnät’s view and
the neighbouring TSO’s view of the
export/import NTC on interconnectors.

39/56
Final Reduction export/southbound (Y/N)
Final Reduction import/northbound (Y/N)
Yes (Y), if the final NTC is lower than the
maximum NTC, otherwise No (N).
Final Reduction export/southbound (MW)
Final Reduction import/northbound (MW)
Difference between maximum NTC and
final NTC.
Final Reason for export/southbound reduction
Final Reason for import/northbound reduction
Reason codes for reduction of the final
capacities. Reduction codes are
according Nord Pool’s instructions only
reported when the reduction is greater
than 100 MW. Because of this principle,
there might be mismatches between the
figures shown in table 3 and 5 and tables
A2 to A5. See separate sheet in
spreadsheet file for explanation of the
codes.
Registered physical flow (positive for imports and
negative for exports/positive for southbound and
negative for northbound)
Measured flow on interconnectors and
corridors between internal areas.
Electricity price level
SE1/SE2/SE3/SE4/DK1/DK2/NO1/NO3/NO4/FI/LT
(EUR)
Price level in SE1, SE2, SE3, SE4, DK1,
DK2, NO1, NO3, NO4, FI, and LT. Prices
for DE and PL are not available, since
they are not part of Nord Pool. Red
figures indicate a higher price than
neighbouring SE-area, and blue indicates
a lower price.
Price difference (Y/N) Yes (Y), if there is a price difference
between neighbouring SE-area and
current area, otherwise No (N). Blank for
DE and PL.
Table A1. Explanation of data in the attached spreadsheet.
Tables A2 to A5 shows how of many hours the capacities have been reduced per type of reduction for each
interconnector and corridor between internal areas. The reason codes are explained in the attached
spreadsheet.

40/56
1010 1114 1125 1156 1158 1162 1163 1225 1267 1414 1415 1422 1423 1432 1433 1434 1462 1463 1567 1622
SE1-SE2 2 169 39
SE2-SE3 1 396 53 307
SE3-SE4 397 35 48 157
SE1-FI 2 208
SE1-NO4 2 208
SE2-NO3 2 184 11 11
SE2-NO4 2 191 17
SE3-DK1 1 673 456 24 55
SE3-FI 2 184 24
SE3-NO1 1 910 58 11 11 47
SE4-DE 1 819 83 282 24
SE4-DK2 1 957 16 234
SE4-PL 1 806 234 120 48
SE4-LT 1 656 360 120
1623 1624 2214 2215 2223 2233 2234 2522 2523 9999
SE1-SE2
SE2-SE3 452
SE3-SE4 763 20 788
SE1-FI
SE1-NO4
SE2-NO3 2
SE2-NO4
SE3-DK1
SE3-FI
SE3-NO1 141 26 4
SE4-DE
SE4-DK2 1
SE4-PL
SE4-LT 72
Table A2. Number of hours per type of export reduction (for interconnectors) and per type of southbound reduction (for corridors between internal areas)
enforced by Svenska kraftnät.
41/56
1010 1114 1125 1156 1158 1162 1163 1225 1267 1355 1414 1415 1433 1434 1462 1463 1567 1624 2214 2226 2233 9999
SE1-SE2 2 208
SE2-SE3 2 208
SE3-SE4 2 208
SE1-FI 2 208
SE1-NO4 2 189 19
SE2-NO3 2 197 11
SE2-NO4 2 191 17
SE3-DK1 1 469 434 24 29 120 132
SE3-FI 2 184 24
SE3-NO1 2 009 58 30 85 22 4
SE4-DE 1 945 83 24 56 24 76
SE4-DK2 2 038 37 8 117 6 2
SE4-PL 1 850 234 16 48 60
SE4-LT 1 640 360 16 120 72
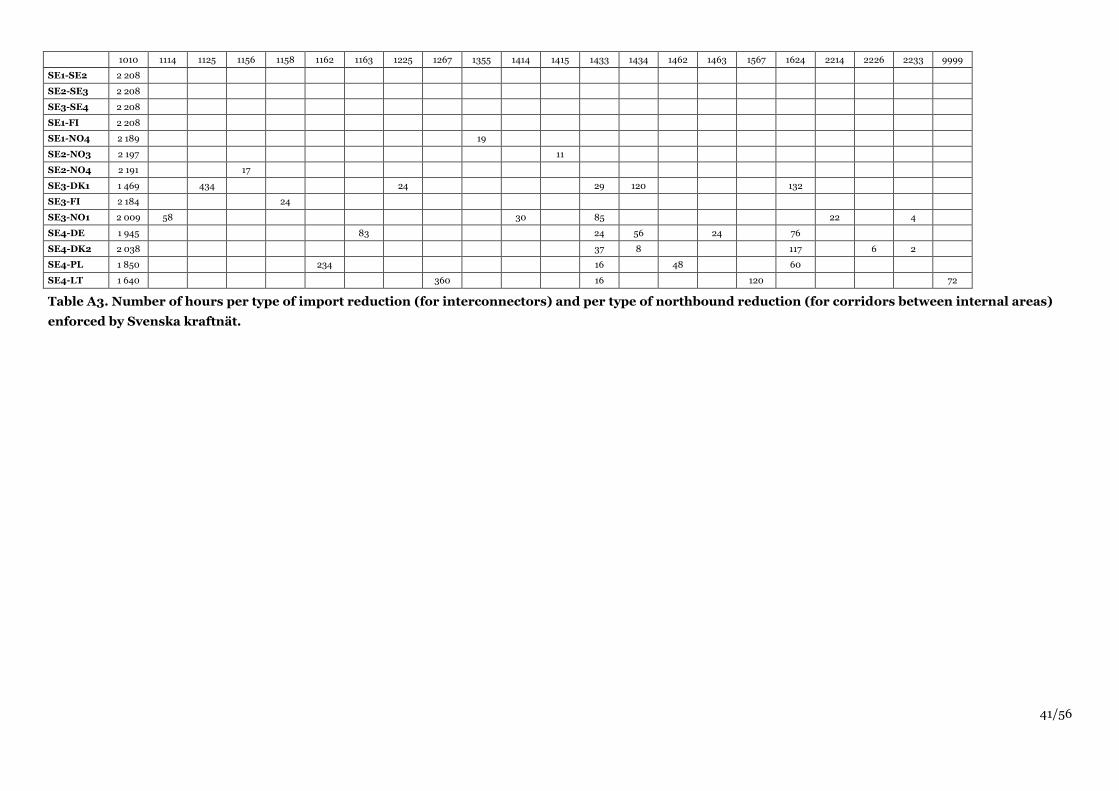
Table A3. Number of hours per type of import reduction (for interconnectors) and per type of northbound reduction (for corridors between internal areas)
enforced by Svenska kraftnät.

42/56
1010 1011 1114 1118 1125 1150 1155 1156 1158 1162 1163 1225 1267 1325 1415 1417 1422 1423 1431 1432 1433 1434 1442 1445 1447
SE1-SE2 2 169 39
SE2-SE3 1 396 53
SE3-SE4 397 35 48 157
SE1-FI 1 613 595
SE1-NO4 74 924 6 472 11
SE2-NO3 74 924 6 451 18 11 10 11 23
SE2-NO4 510 907 6 18 59 23
SE3-DK1 1 399 288 48 24 47 402
SE3-FI 2 110 24 74
SE3-NO1 764 2 11 38 442
SE4-DE 1 104 1 234
SE4-DK2 1 909 16 210
SE4-PL 1 186 76 85
SE4-LT 1 648 96
1450 1543 1545 1622 1623 1624 2214 2215 2223 2233 2234 2245 2345 2424 2522 2523 9999
SE1-SE2
SE2-SE3 307 452
SE3-SE4 763 20 788
SE1-FI
SE1-NO4 721
SE2-NO3 678 2
SE2-NO4 685
SE3-DK1
SE3-FI
SE3-NO1 821 114 9 4 2 1
SE4-DE 869
SE4-DK2 72 1
SE4-PL 7 854
SE4-LT 464
Table A4. Number of hours per type of export reduction as enforced by Svenska kraftnät and neighbouring TSOs (for interconnectors) and per type of
southbound reduction (for corridors between internal areas) enforced by Svenska kraftnät.

43/56
1010 1011 1118 1125 1126 1150 1155 1156 1158 1162 1163 1225 1267 1415 1417 1431 1433 1434 1442 1443 1445 1447 1450 1545
SE1-SE2 2 208
SE2-SE3 2 208
SE3-SE4 2 208
SE1-FI 2 088 120
SE1-NO4 74 924 6 472 11 721
SE2-NO3 1 113 882 6 11 10 186
SE2-NO4 552 907 6 35 11 697
SE3-DK1 1 448 303 48 21 63 205
SE3-FI 2 110 24 74
SE3-NO1 77 408 1 708
SE4-DE 867 1 20 55
SE4-DK2 2 011 18 37 8 9
SE4-PL 73 58
SE4-LT 1 632 96 16
1624 2214 2226 2233 2245 2424 9999
SE1-SE2
SE2-SE3
SE3-SE4
SE1-FI
SE1-NO4
SE2-NO3
SE2-NO4
SE3-DK1 120
SE3-FI
SE3-NO1 3 12
SE4-DE 58 1 207
SE4-DK2 117 6 2
SE4-PL 24 2 053
SE4-LT 464
Table A5. Number of hours per type of import reduction as enforced by Svenska kraftnät and neighbouring TSOs (for interconnectors) and per type of
northbound reduction (for corridors between internal areas) enforced by Svenska kraftnät.
44/56
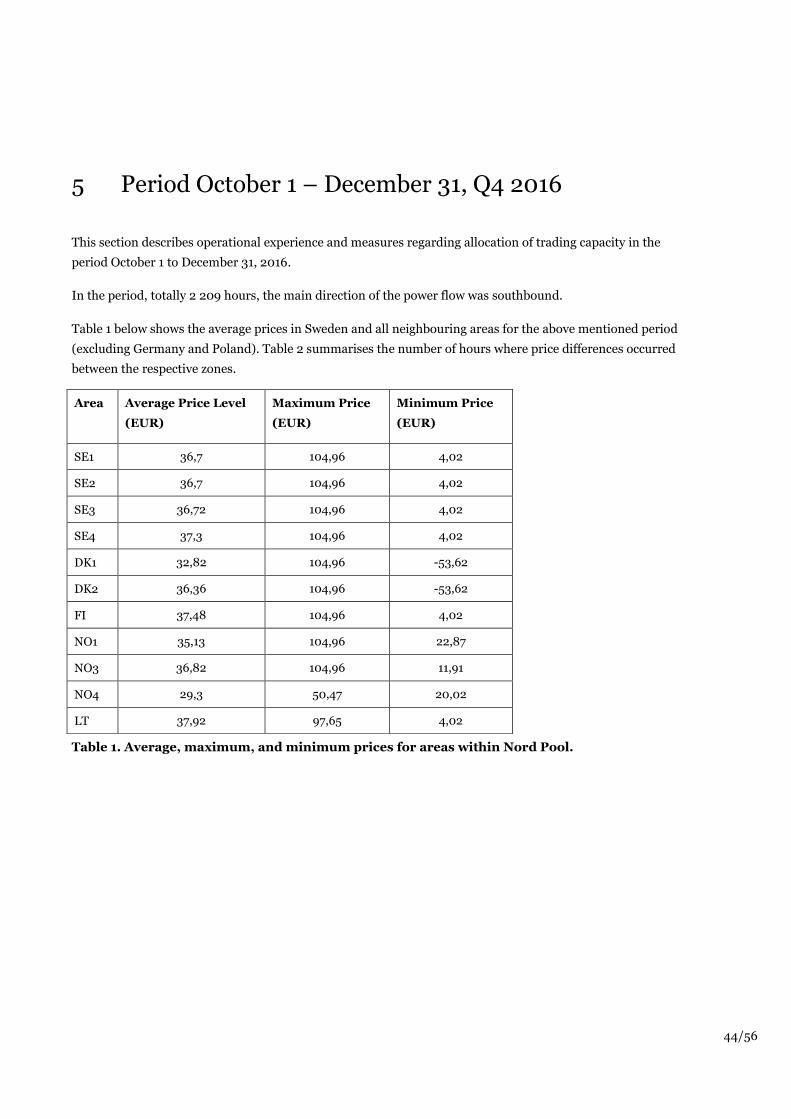
5 Period October 1 – December 31, Q4 2016
This section describes operational experience and measures regarding allocation of trading capacity in the
period October 1 to December 31, 2016.
In the period, totally 2 209 hours, the main direction of the power flow was southbound.
Table 1 below shows the average prices in Sweden and all neighbouring areas for the above mentioned period
(excluding Germany and Poland). Table 2 summarises the number of hours where price differences occurred
between the respective zones.
Table 1. Average, maximum, and minimum prices for areas within Nord Pool.
Area Average Price Level
(EUR)
Maximum Price
(EUR)
Minimum Price
(EUR)
SE1 36,7 104,96 4,02
SE2 36,7 104,96 4,02
SE3 36,72 104,96 4,02
SE4 37,3 104,96 4,02
DK1 32,82 104,96 -53,62
DK2 36,36 104,96 -53,62
FI 37,48 104,96 4,02
NO1 35,13 104,96 22,87
NO3 36,82 104,96 11,91
NO4 29,3 50,47 20,02
LT 37,92 97,65 4,02
45/56
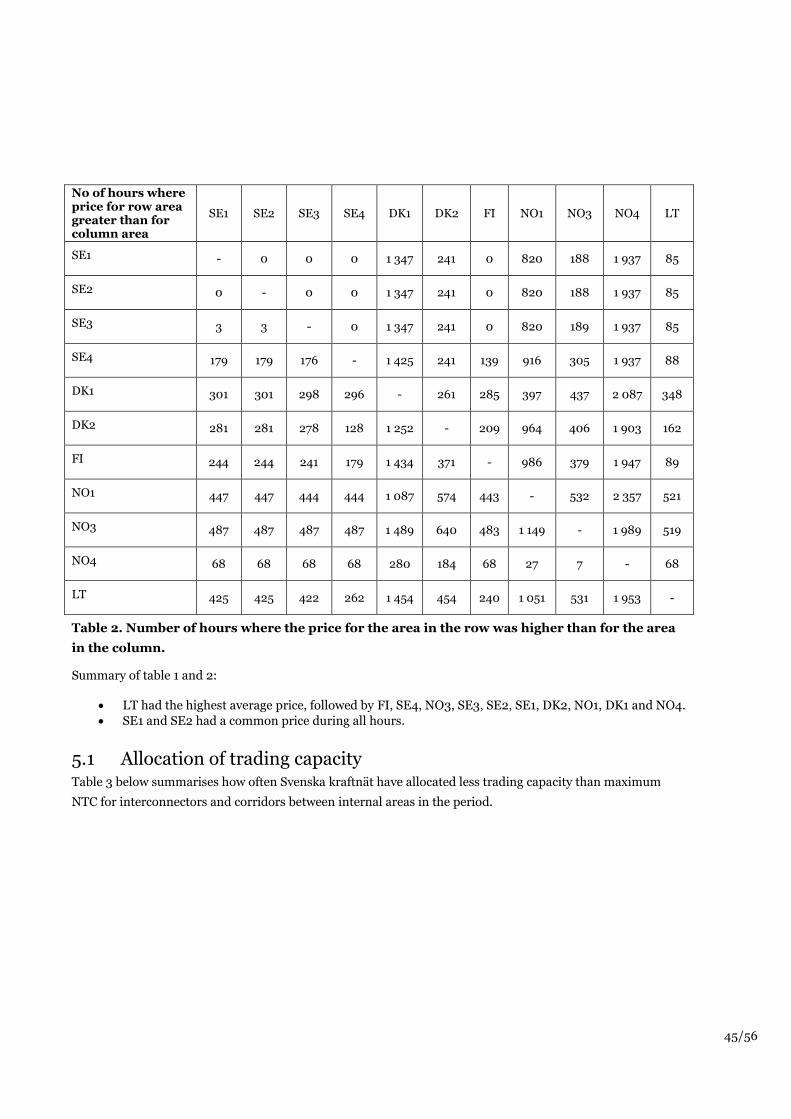
No of hours where price for row area greater than for column area
SE1 SE2 SE3 SE4 DK1 DK2 FI NO1 NO3 NO4 LT
SE1 - 0 0 0 1 347 241 0 820 188 1 937 85
SE2 0 - 0 0 1 347 241 0 820 188 1 937 85
SE3 3 3 - 0 1 347 241 0 820 189 1 937 85
SE4 179 179 176 - 1 425 241 139 916 305 1 937 88
DK1 301 301 298 296 - 261 285 397 437 2 087 348
DK2 281 281 278 128 1 252 - 209 964 406 1 903 162
FI 244 244 241 179 1 434 371 - 986 379 1 947 89
NO1 447 447 444 444 1 087 574 443 - 532 2 357 521
NO3 487 487 487 487 1 489 640 483 1 149 - 1 989 519
NO4 68 68 68 68 280 184 68 27 7 - 68
LT 425 425 422 262 1 454 454 240 1 051 531 1 953 -
Table 2. Number of hours where the price for the area in the row was higher than for the area
in the column.
Summary of table 1 and 2:
LT had the highest average price, followed by FI, SE4, NO3, SE3, SE2, SE1, DK2, NO1, DK1 and NO4.
SE1 and SE2 had a common price during all hours.
5.1 Allocation of trading capacity Table 3 below summarises how often Svenska kraftnät have allocated less trading capacity than maximum
NTC for interconnectors and corridors between internal areas in the period.

46/56
Interconnectors/
corridors between
internal areas
No of limited hours No of days with
limitation
Average reduction
Export/
South-
bound
Import/
North-
bound
Export/
South-
bound
Import/
North-
bound
Export/
South-
bound
Import/
North-
bound
SE1-SE2 25 0 2 0 0 % 0 %
SE2-SE3 1 026 0 45 0 4 % 0 %
SE3-SE4 1 779 0 76 0 11 % 0 %
SE1-FI 802 1 182 35 51 -1 % 1 %
SE1-NO4 4 21 1 2 0 % 0 %
SE2-NO3 0 0 0 0 0 % 0 %
SE2-NO4 0 0 0 0 0 % 0 %
SE3-DK1 29 951 5 76 1 % 18 %
SE3-FI 93 93 4 4 3 % 3 %
SE3-NO1 879 129 74 12 12 % 1 %
SE4-DE 370 755 16 67 13 % 12 %
SE4-DK2 679 1 114 31 74 17 % 24 %
SE4-PL 161 725 7 67 4 % 11 %
SE4-LT 460 736 20 40 21 % 27 %
Table 3. Limitations in trading capacity on interconnectors and corridors between internal
areas as enforced by Svenska kraftnät. The columns with average reductions shows the
average NTC divided by maximum NTC.
The majority of the limitations of export capacity on the interconnector SE1-FI, enforced by Svenska kraftnät
during the period, are because of that the NTC depends on forecasted transfer between Ivalo - Varangerbotn.
The forecasted transfer can both increase and decrease the NTC.
Table 4 below summarises the time during which neighbouring TSOs have allocated less trading capacity than
maximum NTC to interconnectors in the period.

47/56
Interconnectors/
corridors between
internal areas
No of limited hours No of days with
limitation
Average reduction
Export/
South-
bound
Import/
North-
bound
Export/
South-
bound
Import/
North-
bound
Export/
South-
bound
Import/
North-
bound
SE1-SE2 - - - - - -
SE2-SE3 - - - - - -
SE3-SE4 - - - - - -
SE1-FI 816 1 214 36 53 0 % 2 %
SE1-NO4 2 209 2 209 92 92 42 % 53 %
SE2-NO3 2 088 15 88 1 32 % 1 %
SE2-NO4 2 209 2 209 92 92 87 % 83 %
SE3-DK1 1 441 16 60 2 36 % 0 %
SE3-FI 92 157 4 8 3 % 4 %
SE3-NO1 489 2 209 25 92 7 % 48 %
SE4-DE 1 207 1 707 79 89 29 % 45 %
SE4-DK2 160 164 9 9 4 % 6 %
SE4-PL 887 2 092 92 92 34 % 74 %
SE4-LT 460 460 20 20 21 % 21 %
Table 4. Limitations in trading capacity on interconnectors as enforced by neighbouring TSOs.
The columns with average reductions shows the average NTC divided by maximum NTC.
Table 5 below summarises the time during which capacities on interconnectors and corridors between
internal areas have been reduced, taking into account reductions by both Svenska kraftnät and neighbouring
TSOs.
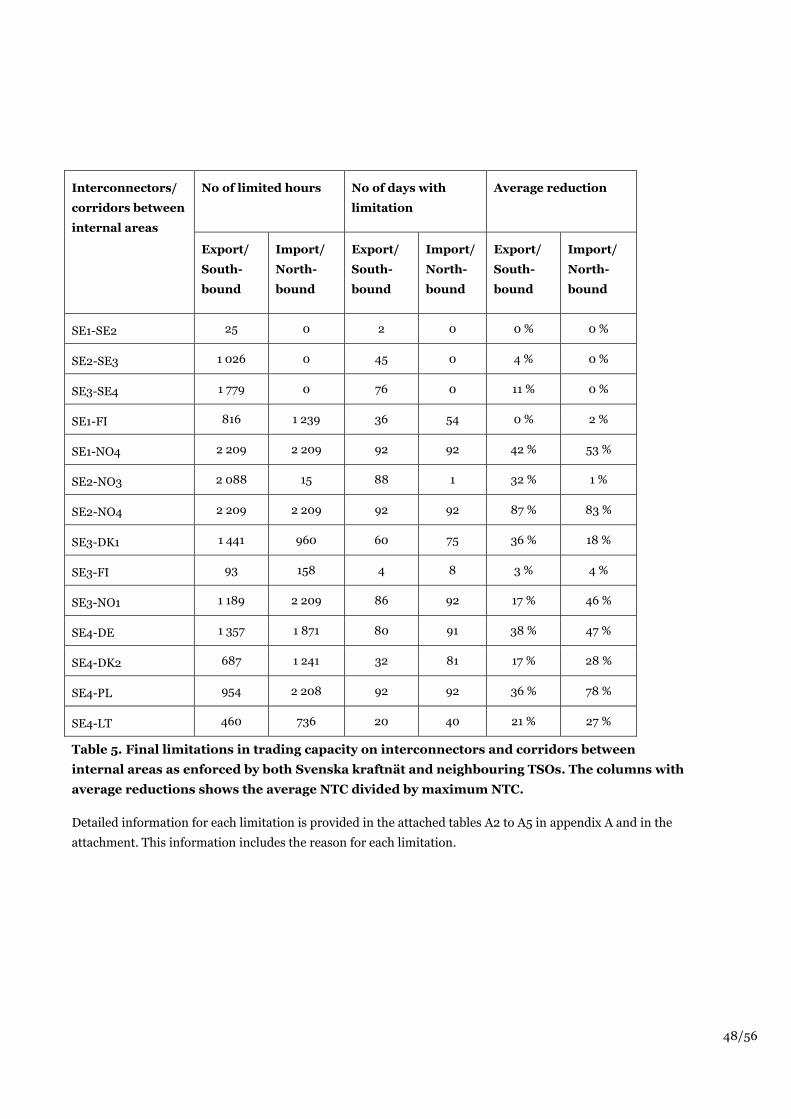
48/56
Interconnectors/
corridors between
internal areas
No of limited hours No of days with
limitation
Average reduction
Export/
South-
bound
Import/
North-
bound
Export/
South-
bound
Import/
North-
bound
Export/
South-
bound
Import/
North-
bound
SE1-SE2 25 0 2 0 0 % 0 %
SE2-SE3 1 026 0 45 0 4 % 0 %
SE3-SE4 1 779 0 76 0 11 % 0 %
SE1-FI 816 1 239 36 54 0 % 2 %
SE1-NO4 2 209 2 209 92 92 42 % 53 %
SE2-NO3 2 088 15 88 1 32 % 1 %
SE2-NO4 2 209 2 209 92 92 87 % 83 %
SE3-DK1 1 441 960 60 75 36 % 18 %
SE3-FI 93 158 4 8 3 % 4 %
SE3-NO1 1 189 2 209 86 92 17 % 46 %
SE4-DE 1 357 1 871 80 91 38 % 47 %
SE4-DK2 687 1 241 32 81 17 % 28 %
SE4-PL 954 2 208 92 92 36 % 78 %
SE4-LT 460 736 20 40 21 % 27 %
Table 5. Final limitations in trading capacity on interconnectors and corridors between
internal areas as enforced by both Svenska kraftnät and neighbouring TSOs. The columns with
average reductions shows the average NTC divided by maximum NTC.
Detailed information for each limitation is provided in the attached tables A2 to A5 in appendix A and in the
attachment. This information includes the reason for each limitation.

49/56
5.2 Comments on each interconnector
5.2.1 SE1-FI, North Finland
Svenska kraftnät has reduced the export and import capacity for 802 and 1 182 hours, respectively, on the
interconnector between SE1 and FI, because the NTC depends on forecasted transfer between Ivalo –
Varangerbotn. In total, the export and import on the interconnector have been reduced for 816 and 1 239
hours, respectively.
5.2.2 SE1-NO4, North Norway
Svenska kraftnät has reduced the export and import capacity for 4 and 21 hours, respectively, on the
interconnector between SE1 and NO4, because of maintenance close to the interconnector. In total, the export
and import on the interconnector have been reduced during all hours.
5.2.3 SE2-NO3, Central Norway
Svenska kraftnät has not reduced the capacity on the interconnector between SE2 and NO3. In total, the
export and import on the interconnector have been reduced for 2 088 and 15 hours, respectively.
5.2.4 SE2-NO4, North Norway
Svenska kraftnät has not reduced the capacity on the interconnector between SE2 and NO4. In total, the
export and import on the interconnector have been reduced during all hours.
5.2.5 SE3-DK1, Western Denmark
Svenska kraftnät has reduced the export and import capacity for 29 and 951 hours, respectively, on the
interconnector between SE3 and DK1. The main reason for reductions set by Svenska kraftnät was mainly
congestion in the West Coast Corridor, but also due to planned maintenance close to interconnector. In total,
the export and import on the interconnector have been reduced for 1 441 and 960 hours, respectively.
5.2.6 SE3-FI, Southern Finland
Svenska kraftnät has reduced the export and import capacity for 93 and 93 hours, respectively, on the
interconnector between SE3 and FI. The reasons for reductions set by Svenska kraftnät was planned
maintenance of the interconnector. In total, the export and import on the interconnector have been reduced
for 93 and 158 hours, respectively.
5.2.7 SE3-NO1, Southern Norway
Svenska kraftnät has reduced the export and import capacity for 879 and 129 hours, respectively, on the
interconnector between SE3 and NO1. The reason for reductions set by Svenska kraftnät was mainly
congestion in the West Coast Corridor, but also due to planned maintenance close to interconnector. In total,
the export and import on the interconnector have been reduced for 1 189 and 2 209 hours, respectively.
5.2.8 SE4-DE, Germany
Svenska kraftnät has reduced the export and import capacity for 370 and 755 hours, respectively, on the
interconnector between SE4 and DE. The main reason for reductions set by Svenska kraftnät was congestion
in the West Coast Corridor, but also due to maintenance in Söderåsen station. In total, the export and import
on the interconnector have been reduced for 1 357 and 1 871 hours, respectively.

50/56
5.2.9 SE4-DK2, Eastern Denmark
Svenska kraftnät has reduced the export and import capacity for 679 and 1 114 hours, respectively, on the
interconnector between SE4 and DK2. The main reason for reductions set by Svenska kraftnät was congestion
in the West Coast Corridor, but also due to maintenance in Söderåsen station. In total, the export and import
on the interconnector have been reduced for 687 and 1 241 hours, respectively.
5.2.10 SE4-PL, Poland
Svenska kraftnät has reduced the export and import capacity for 161 and 725 hours, respectively, on the
interconnector between SE4 and PL. The main reason for reductions set by Svenska kraftnät was congestion
in the West Coast Corridor, but also due to maintenance in Söderåsen station. In total, the export and import
on the interconnector have been reduced for 954 and 2 208 hours, respectively.
5.2.11 SE4-LT, Lithuania
Svenska kraftnät has reduced the export and import capacity for 460 and 736 hours, respectively, on the
interconnector between SE4 and LT. The main reasons for reductions set by Svenska kraftnät was because
congestion in the West Coast Corridor and due to planned maintenance and failure on the interconnector. In
total, the export and import on the interconnector have been reduced for 460 and 736 hours, respectively.

51/56
Appendix A – 2015 Q4
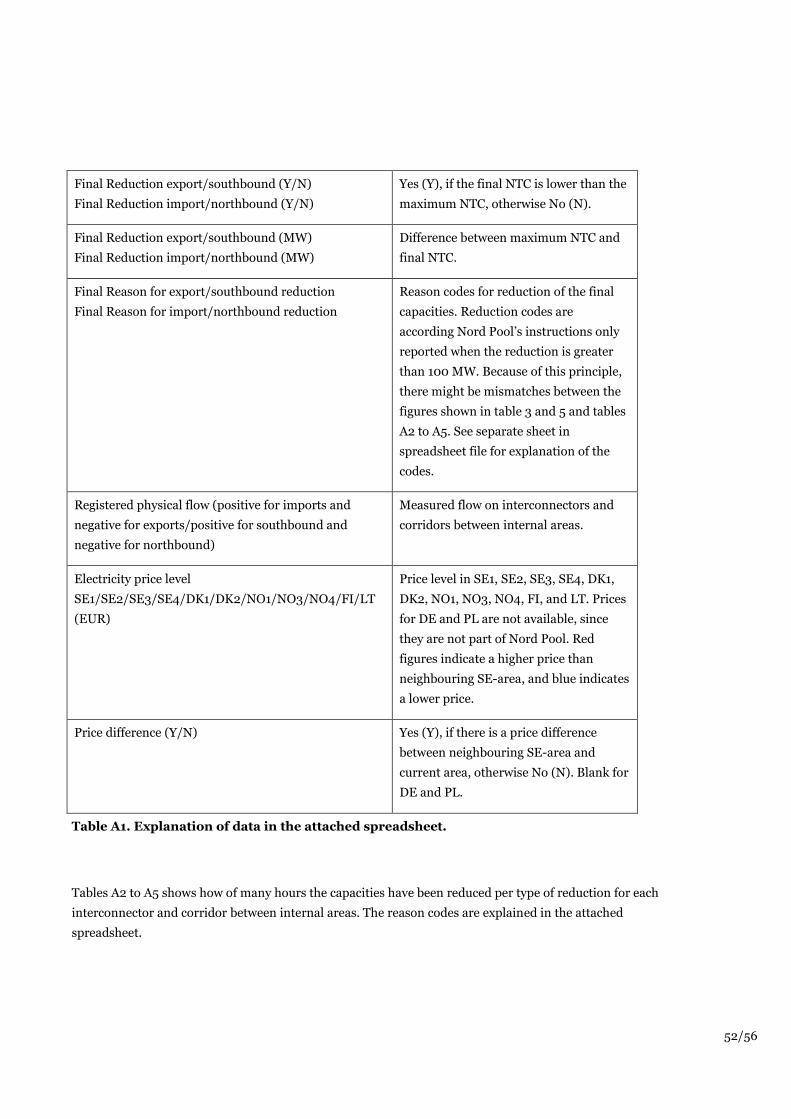
The attached spreadsheet contains data for each hour during the period. Each value in the spreadsheet is
explained in the table below.
Value Explanation
Maximum NTC export/southbound (MW)
Maximum NTC import/northbound (MW)
Maximum NTC for export/import, as
agreed by TSOs on both sides, and
maximum NTC for corridors between
internal areas in south/north direction.
These values normally only change after
the network has been reinforced.
Svk NTC export (MW)
Svk NTC import (MW)
Svenska kraftnät’s view of NTC for
export/import.
Svk Reduction export (Y/N)
Svk Reduction import (Y/N)
Yes (Y), if Svenska kraftnät’s view of NTC
for export/import is lower than
maximum NTC, otherwise No (N).
Svk Reduction export (MW)
Svk Reduction import (MW)
Difference between maximum NTC and
Svenska kraftnät’s view of NTC.
Svk Reason for export reduction
Svk Reason for import reduction
Reason codes for Svenska kraftnät’s
reduction of capacities. Reduction codes
are according Nord Pool’s instructions
only reported when the reduction is
greater than 100 MW. Because of this
principle, there might be mismatches
between the figures shown in table 3 and
5 and tables A2 to A5. See separate sheet
in spreadsheet file for explanation of the
codes.
Neighbouring TSO NTC export (MW)
Neighbouring TSO NTC import (MW)
Neighbouring TSO’s view of NTC for
export/import.
Final NTC export/southbound (MW)
Final NTC import/northbound (MW)
Final NTC for corridors between internal
areas in south/north direction, and the
minimum of Svenska kraftnät’s view and
the neighbouring TSO’s view of the
export/import NTC on interconnectors.
52/56
Final Reduction export/southbound (Y/N)
Final Reduction import/northbound (Y/N)
Yes (Y), if the final NTC is lower than the
maximum NTC, otherwise No (N).
Final Reduction export/southbound (MW)
Final Reduction import/northbound (MW)
Difference between maximum NTC and
final NTC.
Final Reason for export/southbound reduction
Final Reason for import/northbound reduction
Reason codes for reduction of the final
capacities. Reduction codes are
according Nord Pool’s instructions only
reported when the reduction is greater
than 100 MW. Because of this principle,
there might be mismatches between the
figures shown in table 3 and 5 and tables
A2 to A5. See separate sheet in
spreadsheet file for explanation of the
codes.
Registered physical flow (positive for imports and
negative for exports/positive for southbound and
negative for northbound)
Measured flow on interconnectors and
corridors between internal areas.
Electricity price level
SE1/SE2/SE3/SE4/DK1/DK2/NO1/NO3/NO4/FI/LT
(EUR)
Price level in SE1, SE2, SE3, SE4, DK1,
DK2, NO1, NO3, NO4, FI, and LT. Prices
for DE and PL are not available, since
they are not part of Nord Pool. Red
figures indicate a higher price than
neighbouring SE-area, and blue indicates
a lower price.
Price difference (Y/N) Yes (Y), if there is a price difference
between neighbouring SE-area and
current area, otherwise No (N). Blank for
DE and PL.
Table A1. Explanation of data in the attached spreadsheet.
Tables A2 to A5 shows how of many hours the capacities have been reduced per type of reduction for each
interconnector and corridor between internal areas. The reason codes are explained in the attached
spreadsheet.

53/56
1010 1125 1126 1167 1267 1422 1423 1424 1431 1433 1434 1458 1467 1622 1623 1624 1625 1633 2210 2214 2223 2258 2522
SE1-SE2 2 191 18
SE2-SE3 1 225 25 145 664 48 96
SE3-SE4 603 72 6 24 466 901 48 12 5
SE1-FI 2 209
SE1-NO4 2 205 4
SE2-NO3 2 209
SE2-NO4 2 209
SE3-DK1 2 180 4 6 19
SE3-FI 2 116 92 1
SE3-NO1 1 466 6 22 665 14 4
SE4-DE 1 839 21 349
SE4-DK2 1 531 12 6 19 640 1
SE4-PL 2 048 21 140
SE4-LT 1 748 80 168 211 1
2524 2533 2534
SE1-SE2
SE2-SE3 6
SE3-SE4 72
SE1-FI
SE1-NO4
SE2-NO3
SE2-NO4
SE3-DK1
SE3-FI
SE3-NO1 32
SE4-DE
SE4-DK2
SE4-PL
SE4-LT
Table A2. Number of hours per type of export reduction (for interconnectors) and per type of southbound reduction (for corridors between internal areas) enforced by Svenska kraftnät.

54/56
1010 1125 1126 1167 1267 1424 1431 1433 1434 1458 1467 1624 1625 2210 2214 2226 2258 2524
SE1-SE2 2 209
SE2-SE3 2 209
SE3-SE4 2 209
SE1-FI 2 209
SE1-NO4 2 205 4
SE2-NO3 2 209
SE2-NO4 2 209
SE3-DK1 1 330 4 6 19 154 652 12 32
SE3-FI 2 116 92 1
SE3-NO1 2 176 6 23 4
SE4-DE 1 640 6 19 514 11 19
SE4-DK2 1 137 12 6 21 414 575 15 1 28
SE4-PL 1 691 6 19 466 12 15
SE4-LT 1 491 80 168 6 19 211 221 11 1
Table A3. Number of hours per type of import reduction (for interconnectors) and per type of northbound reduction (for corridors between internal areas)
enforced by Svenska kraftnät.

55/56
1010 1125 1126 1157 1158 1422 1423 1424 1431 1433 1434 1442 1443 1445 1450 1456 1458 1467 1545 1622 1623 1624 1625
SE1-SE2 2 191 18
SE2-SE3 1 225 25 145 664 48
SE3-SE4 603 72 6 24 466 901 48
SE1-FI 2 177 32
SE1-NO4 441 4 1 607 157
SE2-NO3 465 1 571 161
SE2-NO4 441 1 183 585
SE3-DK1 768 24 1 417
SE3-FI 2 116 1 91
SE3-NO1 1 158 6 22 4 309 658 14
SE4-DE 1 041 21 327
SE4-DK2 1 523 20 6 19 632 8 1
SE4-PL 1 284 17 90
SE4-LT 1 749 115
1633 1915 2214 2223 2245 2258 2522 2524 2533 2534 9999
SE1-SE2
SE2-SE3 96 6
SE3-SE4 12 5 72
SE1-FI
SE1-NO4
SE2-NO3 12
SE2-NO4
SE3-DK1
SE3-FI 1
SE3-NO1 4 2 32
SE4-DE 820
SE4-DK2
SE4-PL 818
SE4-LT 344
Table A4. Number of hours per type of export reduction as enforced by Svenska kraftnät and neighbouring TSOs (for interconnectors) and per type of
southbound reduction (for corridors between internal areas) enforced by Svenska kraftnät.

56/56
1010 1114 1125 1126 1157 1158 1326 1424 1431 1433 1434 1443 1445 1450 1456 1458 1467 1545 1624 1625 1914 1950 2214
SE1-SE2 2 209
SE2-SE3 2 209
SE3-SE4 2 209
SE1-FI 2 177 32
SE1-NO4 368 4 1 607 157 73
SE2-NO3 2 209
SE2-NO4 368 1 183 585 73
SE3-DK1 1 319 16 6 19 154 651 12
SE3-FI 2 050 1 66 91
SE3-NO1 8 6 15 92 2 073 12 2
SE4-DE 604 19 170 10
SE4-DK2 1 010 44 16 6 21 414 73 575 15
SE4-PL 57 209 4
SE4-LT 1 498 19 115 221 11
2226 2245 2258 2524 9999
SE1-SE2
SE2-SE3
SE3-SE4
SE1-FI
SE1-NO4
SE2-NO3
SE2-NO4
SE3-DK1 32
SE3-FI 1
SE3-NO1 1
SE4-DE 10 1 396
SE4-DK2 7 28
SE4-PL 1 1 938
SE4-LT 344
Table A5. Number of hours per type of import reduction as enforced by Svenska kraftnät and neighbouring TSOs (for interconnectors) and per type of
northbound reduction (for corridors between internal areas) enforced by Svenska kraftnät.