swedbanki/@sc/@all/@gs/@ir/... · • stable nii – repricing – funding costs – lower deposit...
TRANSCRIPT

Swedbank
June 2013

2
Table of contents
1. Financial performance 3
2. Liquidity and funding 15
3. Cover pool data 27
4. Swedish economy 33
5. Swedish housing and mortgage market 39
6. Appendix 47

1. Financial performance
3
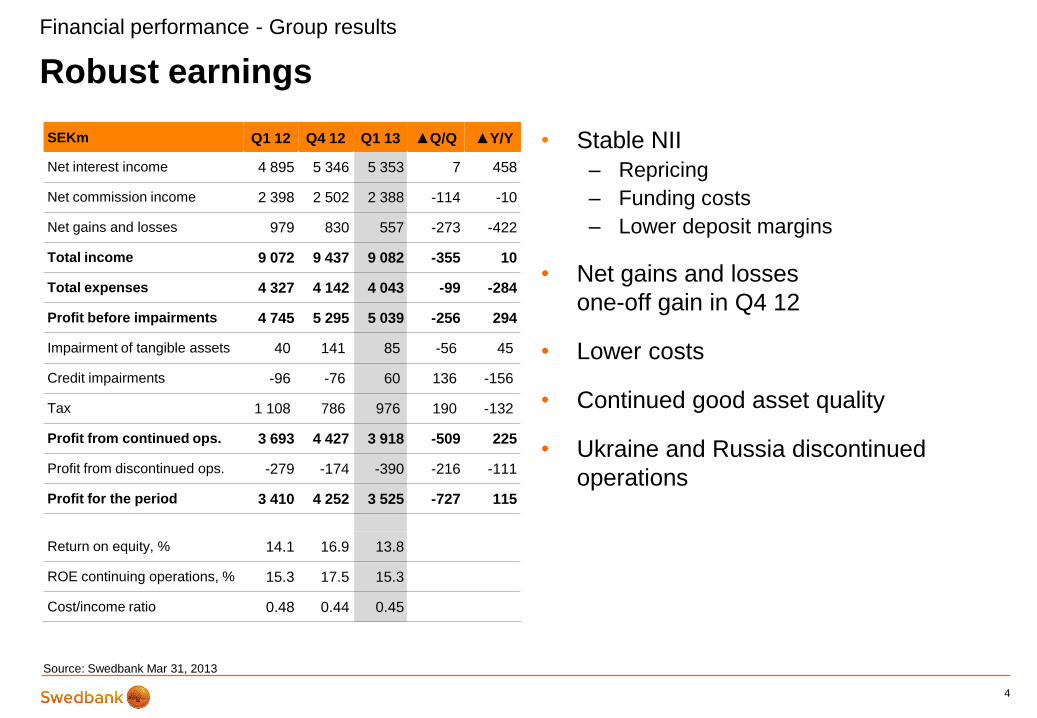
• Stable NII
– Repricing
– Funding costs
– Lower deposit margins
• Net gains and losses
one-off gain in Q4 12
• Lower costs
• Continued good asset quality
• Ukraine and Russia discontinued
operations
Robust earnings
4
Financial performance - Group results
SEKm Q1 12 Q4 12 Q1 13 ▲Q/Q ▲Y/Y
Net interest income 4 895 5 346 5 353 7 458
Net commission income 2 398 2 502 2 388 -114 -10
Net gains and losses 979 830 557 -273 -422
Total income 9 072 9 437 9 082 -355 10
Total expenses 4 327 4 142 4 043 -99 -284
Profit before impairments 4 745 5 295 5 039 -256 294
Impairment of tangible assets 40 141 85 -56 45
Credit impairments -96 -76 60 136 -156
Tax 1 108 786 976 190 -132
Profit from continued ops. 3 693 4 427 3 918 -509 225
Profit from discontinued ops. -279 -174 -390 -216 -111
Profit for the period 3 410 4 252 3 525 -727 115
Return on equity, % 14.1 16.9 13.8
ROE continuing operations, % 15.3 17.5 15.3
Cost/income ratio 0.48 0.44 0.45
Source: Swedbank Mar 31, 2013

Stable results
• Stable NII
• Solid asset quality
• New organisation
5
Financial performance - Retail
SEKm Q1 12 Q4 12 Q1 13 ▲ Q/Q ▲ Y/Y
Net interest income 3 371 3 353 3 332 -21 -39
Net commissions 1 538 1 554 1 589 35 51
Total income 5 346 5 255 5 377 122 31
Total expenses 2 429 2 474 2 406 -68 -23
Profit before
impairments 2 917 2 781 2 971 190 54
Credit impairments 21 91 55 -36 34
ROE, % 28.4 28.0 27.9
C/I ratio 0.45 0.47 0.45
Source: Swedbank Mar 31, 2013

Good return
• Stable NII
• Low activity in Corporate Finance
• Structural challenges in Equities
• Solid credit quality
6
Financial performance - Large Corporates & Institutions
SEKm Q1 12 Q4 12 Q1 13 ▲ Q/Q ▲ Y/Y
Net interest income 728 795 783 -12 55
Net commissions 485 536 419 -117 -66
Total income 2 071 1 857 1 814 -43 -257
Expenses excl variable
staff costs 661 668 646 -22 -15
Variable staff costs 105 75 88 13 -17
Profit before
impairments 1 305 1 114 1 080 -34 -225
Credit impairments 17 162 74 -88 57
ROE, % 18.9 18.3 16.7
C/I ratio 0.37 0.40 0.40
Source: Swedbank Mar 31, 2013
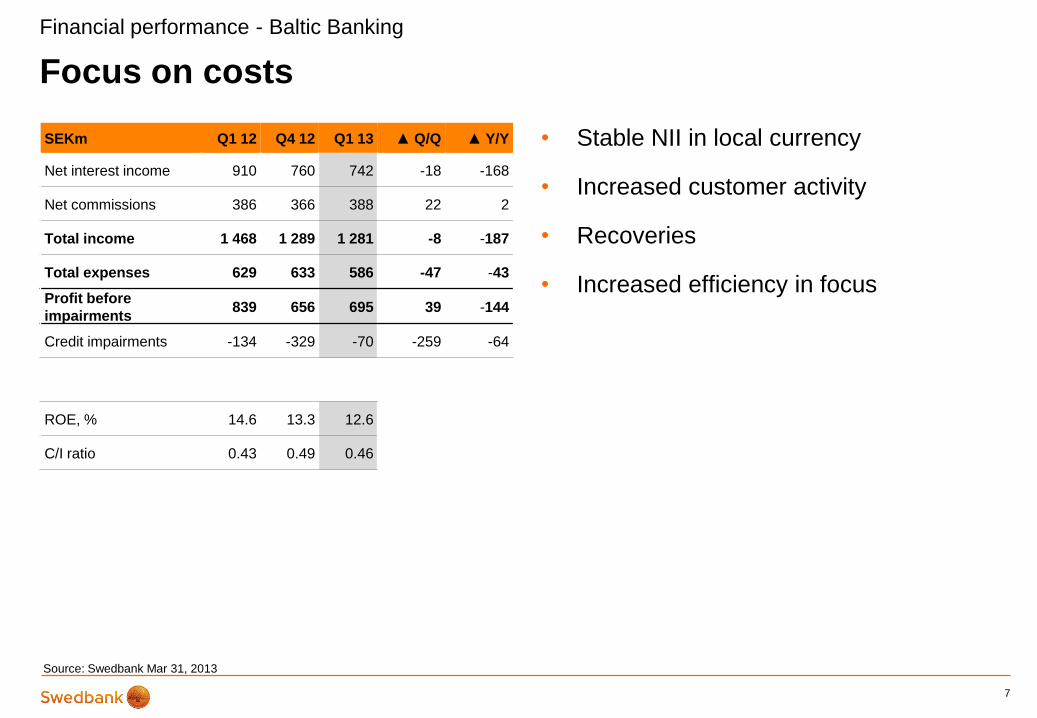
Focus on costs
• Stable NII in local currency
• Increased customer activity
• Recoveries
• Increased efficiency in focus
7
Financial performance - Baltic Banking
SEKm Q1 12 Q4 12 Q1 13 ▲ Q/Q ▲ Y/Y
Net interest income 910 760 742 -18 -168
Net commissions 386 366 388 22 2
Total income 1 468 1 289 1 281 -8 -187
Total expenses 629 633 586 -47 -43
Profit before
impairments 839 656 695 39 -144
Credit impairments -134 -329 -70 -259 -64
ROE, % 14.6 13.3 12.6
C/I ratio 0.43 0.49 0.46
Source: Swedbank Mar 31, 2013
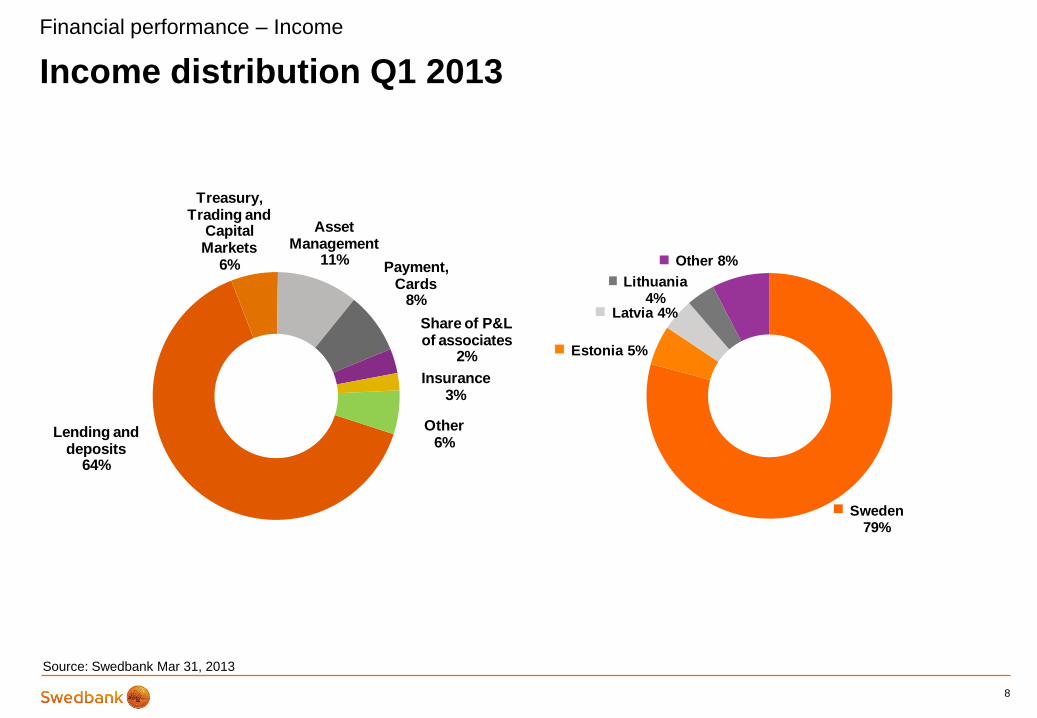
Income distribution Q1 2013
8
Financial performance – Income
Source: Swedbank Mar 31, 2013
Lending and deposits
64%
Treasury, Trading and
Capital Markets
6%
Asset Management
11%Payment,
Cards8%
Insurance3%
Share of P&L of associates
2%
Other6%
Sweden 79%
Estonia 5%
Latvia 4%
Lithuania 4%
Other 8%

Continued strengthening capital position
• 13-15% CET1
• CRD/CRR IV – less impact
• IRB Advanced
• Waiting for regulatory clarity
9
Financial performance - Capital situation
* As of 2012 incl. IAS 19
16.7 17.3
15.416.4
2007 2008 2009 2010 2011 2012 Q1 13
Common Tier 1 capital ratio
Basel 2* Basel 3
15.45%0.14% 0.14%
0.24%
0.55%
-0.13
16.38%
Q4 2012 Profit Q1 IAS 19 RWA change Q1
SME & CVA
(Basel 3)
Other Basel 3
changes
Q1 2013
Changes in B3 CET1 ratio Q4-Q1
Increase Decrease

0%
2%
4%
6%
8%
10%
12%
14%
16%
18%
20%
Proposed 2013 Proposed 2015
Supplemental capital (Equity, AT1 and/or T2), 1.5% + 2.0%
Countercyclical buf fer (Equity), 0-2.5%
Capital conservation buf fer (Equity can be used in stressed scenario), 2.5%
Swedish SiFi buf fer (Equity), 3% (2013), 5% (2015)
Min. requirement (Equity), 4.5%
Swedish capital requirement proposal • Delayed, earliest implementation end of 2013
10
Source: The Ministry of Finance, the Riksbank and the Swedish FSA
13.5-16%
12%
10%
15.5-18%
Proposal 2013 Proposal 2015
Financial performance - Capital situation
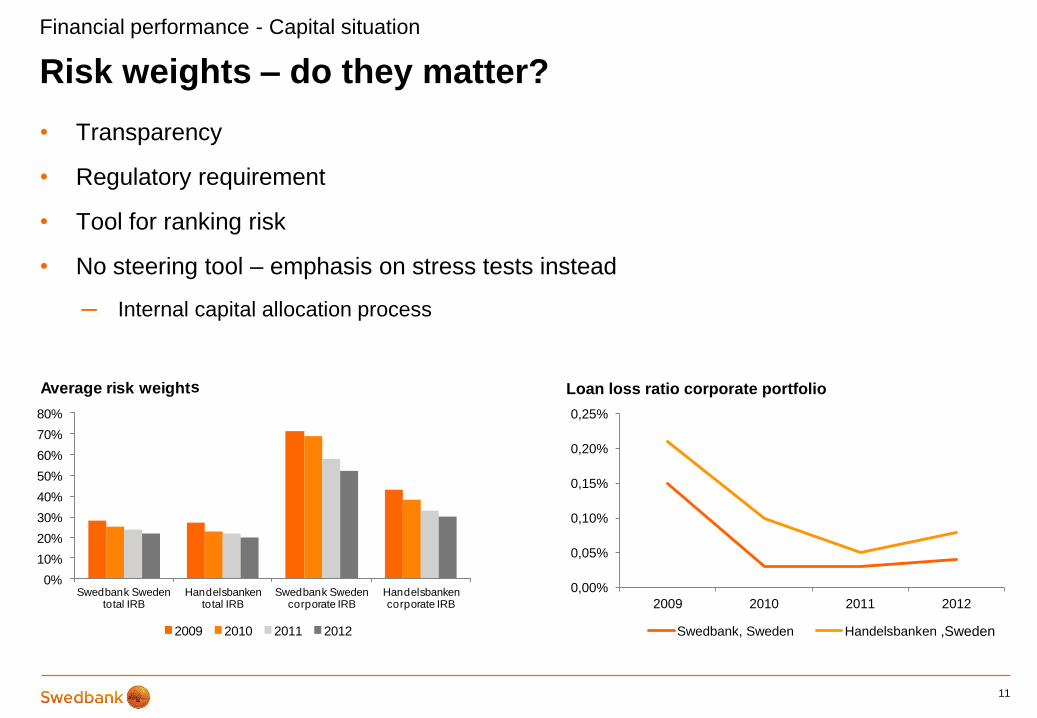
Risk weights – do they matter?
• Transparency
• Regulatory requirement
• Tool for ranking risk
• No steering tool – emphasis on stress tests instead
─ Internal capital allocation process
11
0,00%
0,05%
0,10%
0,15%
0,20%
0,25%
2009 2010 2011 2012
Loan loss ratio corporate portfolio
Swedbank, Sweden Handelsbanken
0%
10%
20%
30%
40%
50%
60%
70%
80%
Swedbank Sweden total IRB
Handelsbanken total IRB
Swedbank Sweden corporate IRB
Handelsbanken corporate IRB
Average risk weight corporate exposure class
2009 2010 2011 2012 ,Sweden
s
Financial performance - Capital situation

Strong credit quality
• Continued high credit quality in Sweden
• Slower net recoveries in
Baltic Banking
• Exiting Russia and Ukraine
12
Financial performance – Asset quality
Credit impairments, SEKm Q1 12 Q4 12 Q1 13
Retail 21 91 55
Large Corporates & Institutions 17 162 74
Baltic Banking -134 -329 -70
Estonia -78 -242 -54
Latvia -21 86 4
Lithuania -35 -173 -20
Swedbank Group -96 -76 60
31.7
10.3
0
5
10
15
20
25
30
35
Q1 11 Q2 11 Q3 11 Q4 11 Q1 12 Q2 12 Q3 12 Q4 12 Q1 13*
SEKbn Impaired loans
* Russia and Ukraine reported as discontinued operations.
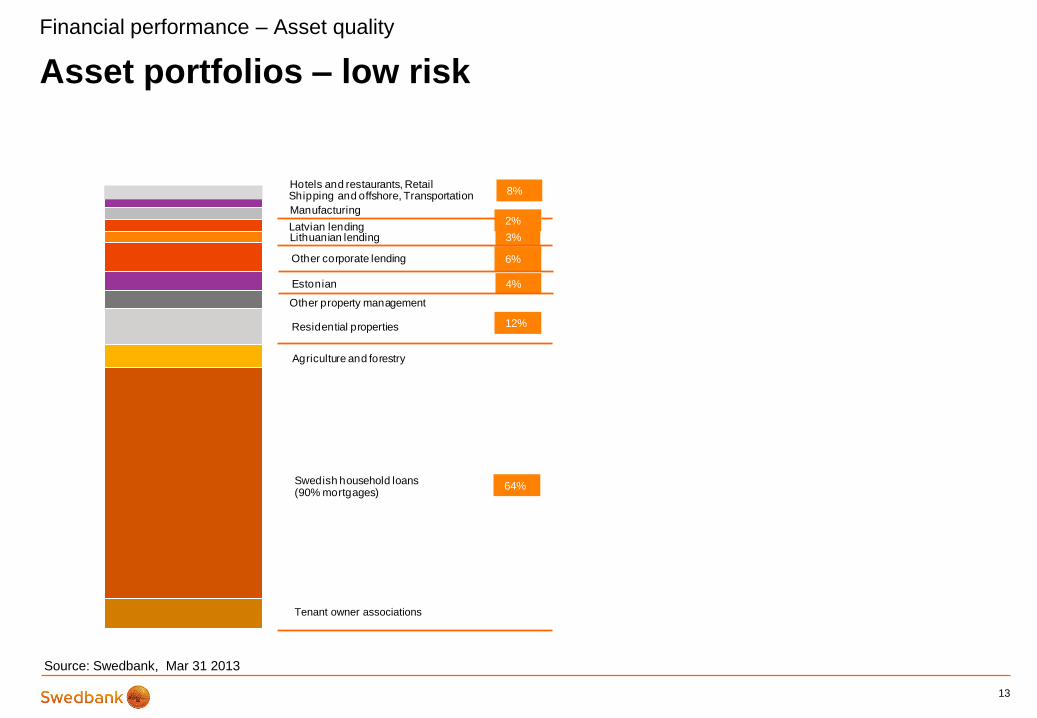
Swedish household loans(90% mortgages)
Shipping and offshore, Transportation
Manufacturing
Other corporate lending
Latvian lending
Other property management
Residential properties
Agriculture and forestry
Hotels and restaurants, Retail
64%
12%
4%
3%
8%
Lithuanian lending
2%
6%
Estonian
Asset portfolios – low risk
13
Source: Swedbank, Mar 31 2013
Financial performance – Asset quality
Tenant owner associations
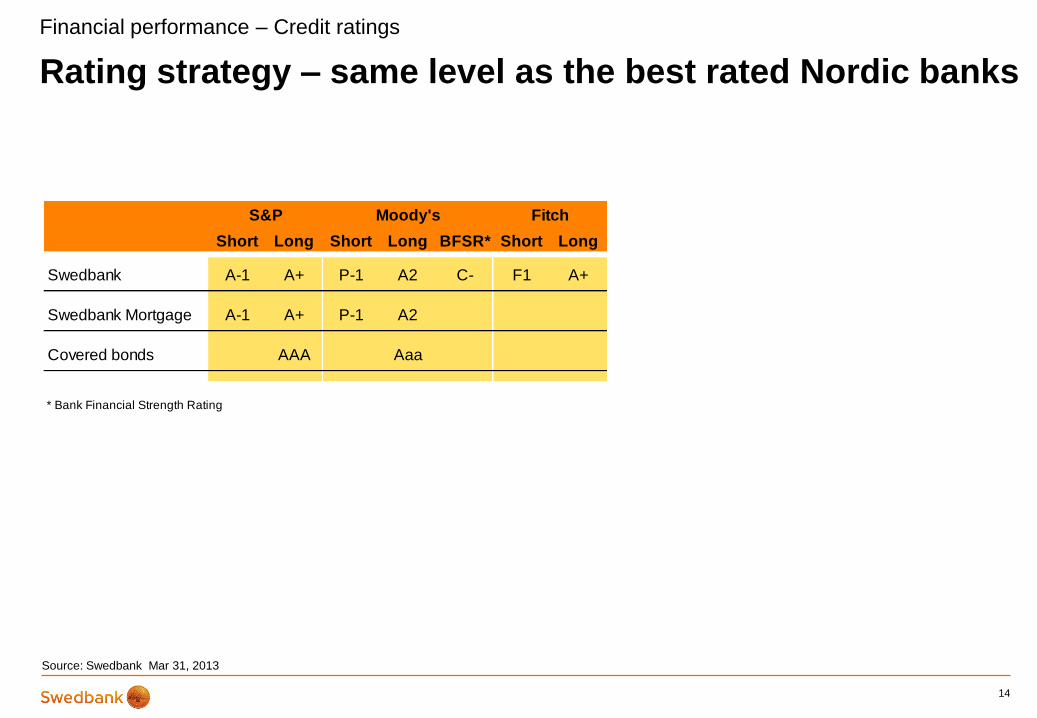
Rating strategy – same level as the best rated Nordic banks
14
Source: Swedbank Mar 31, 2013
Short Long Short Long BFSR* Short Long
Swedbank A-1 A+ P-1 A2 C- F1 A+
Swedbank Mortgage A-1 A+ P-1 A2
Covered bonds AAA Aaa
* Bank Financial Strength Rating
S&P FitchMoody's
Financial performance – Credit ratings

2. Liquidity and funding
15

0
200
400
600
800
1 000
1 200
1 400
Q1 20130
200
400
600
800
1 000
1 200
1 400
Q1 2013
Core balance sheet* structure
16
Liquidity and funding
CEE lending
Estonia
Other corporate
lending, Sweden &
other Nordic countries
Other private, Sweden
Swedish
mortgage loans
Senior
Covered
bonds
Deposits
CET1
Suppl. cap
Government guaranteed debt
Source: Swedbank, Mar 31, 2013
Assets Liabilities SEKbn SEKbn
* Simplified balance sheet

Wholesale funding strategy
• Main internal liquidity measure is survival horizon (accumulated cash-flows)
• Covered bonds less volatile than senior unsecured debt
• Secure presence in senior unsecured debt markets
– OC level
– Liquidity reserve
– Structural subordination
17
Liquidity and funding
Source: Swedbank, Dec 31, 2012
0
1 000
2 000
3 000
4 000
5 000
6 000
7 000
0%
10%
20%
30%
40%
50%
60%
70%
80%
90%
100%
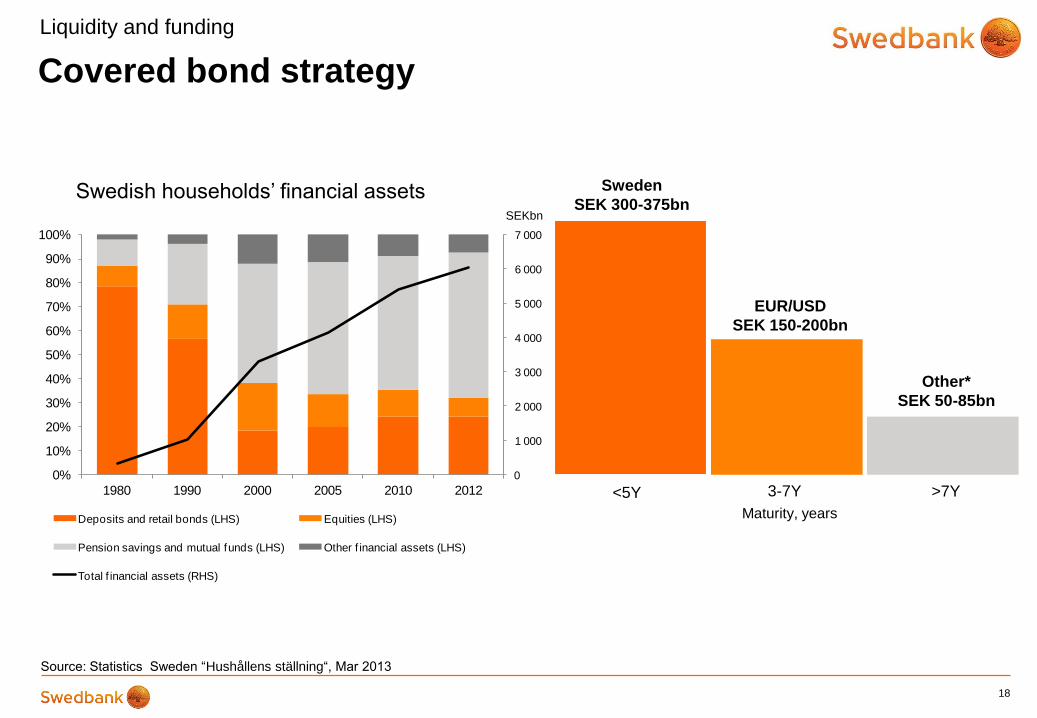
1980 1990 2000 2005 2010 2012
Deposits and retail bonds (LHS) Equities (LHS)
Pension savings and mutual funds (LHS) Other f inancial assets (LHS)
Total f inancial assets (RHS)
18
Covered bond strategy
Swedish households’ financial assets
Source: Statistics Sweden “Hushållens ställning“, Mar 2013
Liquidity and funding
Maturity, years
EUR/USD
SEK 150-200bn
Other*
SEK 50-85bn
Sweden
SEK 300-375bn
<5Y 3-7Y >7Y
SEKbn
-20%
-10%
0%
10%
20%
30%
40%
0% -5% -10% -15% -20% -25% -30% -35% -40% -45% -50%
OC, Q113
0
20
40
60
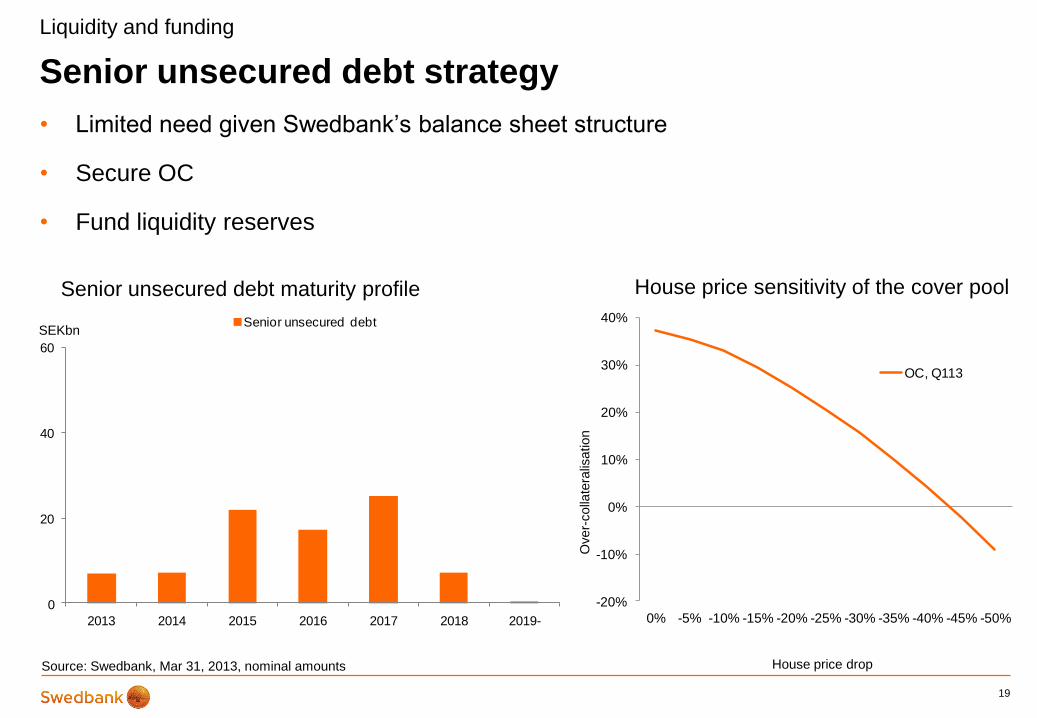
2013 2014 2015 2016 2017 2018 2019-
Senior unsecured debt
Senior unsecured debt strategy
19
Source: Swedbank, Mar 31, 2013, nominal amounts
• Limited need given Swedbank’s balance sheet structure
• Secure OC
• Fund liquidity reserves
Senior unsecured debt maturity profile
SEKbn
Over-
colla
tera
lisation
House price drop
House price sensitivity of the cover pool
Liquidity and funding
0
20
40
60
80
100
120
Covered bonds Senior unsecured
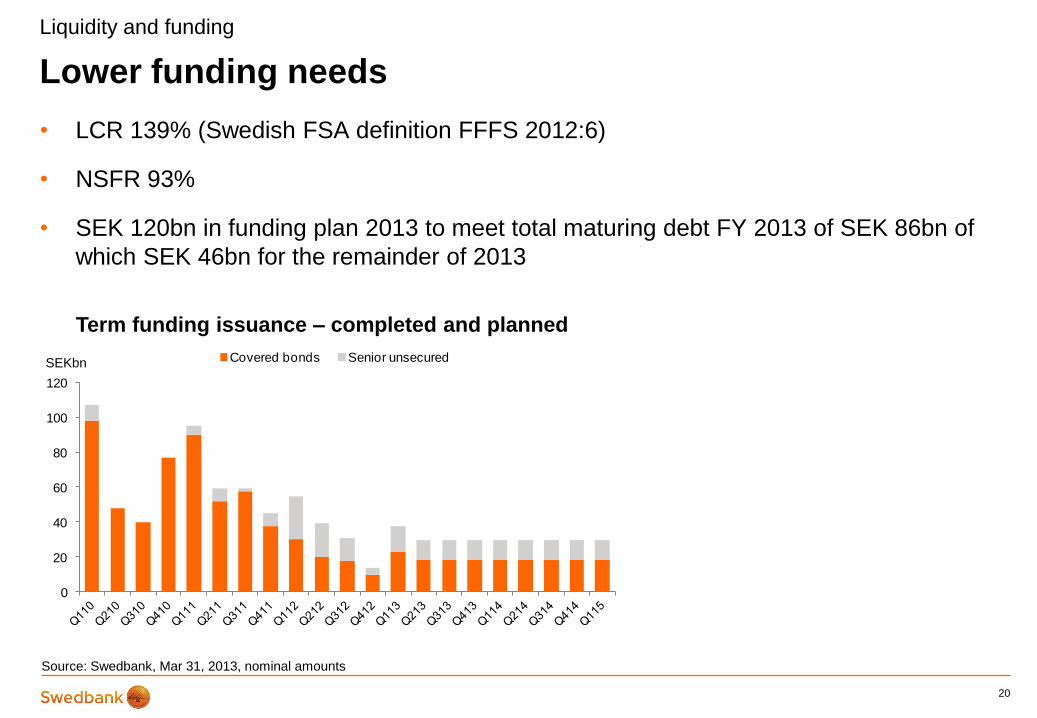
Lower funding needs
• LCR 139% (Swedish FSA definition FFFS 2012:6)
• NSFR 93%
• SEK 120bn in funding plan 2013 to meet total maturing debt FY 2013 of SEK 86bn of
which SEK 46bn for the remainder of 2013
20
Liquidity and funding
Term funding issuance – completed and planned
SEKbn
Source: Swedbank, Mar 31, 2013, nominal amounts

0
10 000
20 000
30 000
40 000
50 000
60 000
Domestic CP ECP/CD USCP Yankee CD French CD
Q4 12
Q1 13
0
10 000
20 000
30 000
40 000
50 000
60 000
70 000
Domestic CB
Euro CB USD CB (144A)
Other CB Senior unsecured
FY 2012
Q1 13
Conservative funding plan
21
Long-term debt issued
• Issued SEK 40bn of term-funding in Q1
• Term funding plan in 2013 of SEK 120bn, full-year maturities of SEK 86bn
Liquidity and funding
Outstanding short-term debt SEKm SEKm
Source: Swedbank, Mar 31, 2013, nominal amounts

Liquidity reserve
22
1 95% of the securities in the liquidity reserve per Q3 2013 are rated AAA
According to the template defined by the Swedish Bankers' Association
2 84% of the additional liquid assets fulfill the Liquidity Reserve definition by the Swedish Bankers’ Association except
from that they are held outside the Treasury department. 3 82% of the additional assets are rated AAA
Liquidity and funding
Source: Swedbank Fact book, Mar 31, 2013
Additional liquid assets, Group2, 3
56 472
SEKm
Cash and holdings in central banks 210 251
Deposits in other banks available overnight 1 290
Securities issued or guaranteed by sovereigns, central banks or multilateral development banks 27 751
Securities issued or guaranteed by municipalities or public sector entities 378
Covered bonds 58 284
- Issued by other institutions 58 284
- Own issued
Securities issued by non-financial corporates
Securities issued by financial corporates (excl. covered bonds) 2 532
Other
Total1
300 486
SEKbn
Days forw ard
0
50
100
150
200
250
300
0 20 40 60 80 100 120 140 160 180 200 220 240 260 280 300 320 340 360365
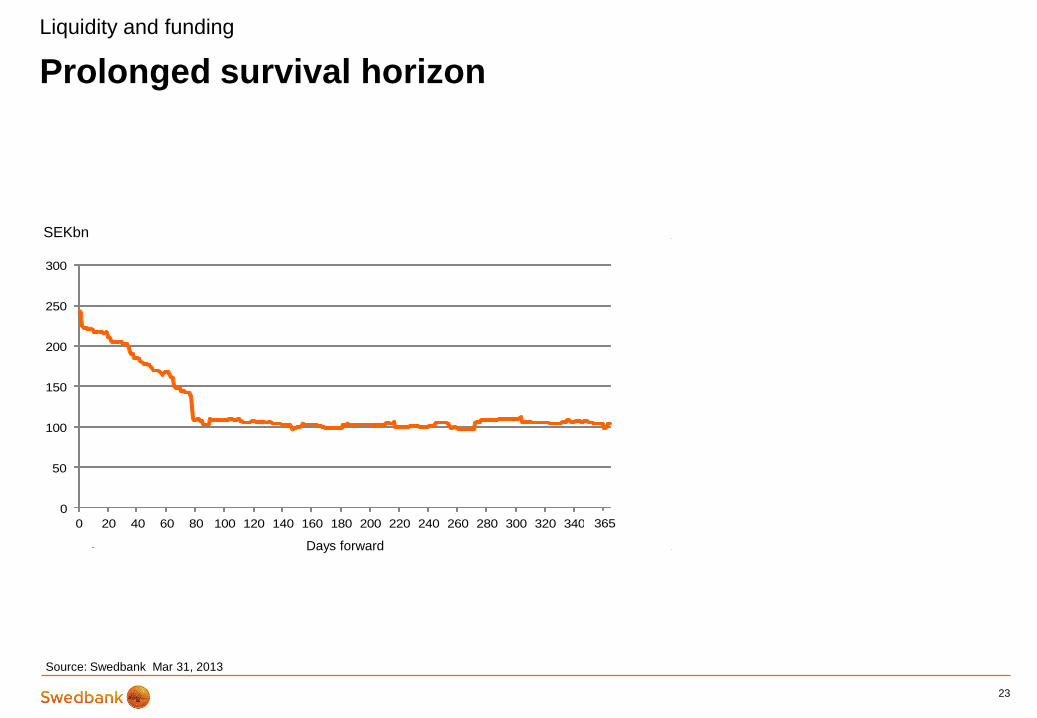
Prolonged survival horizon
23
Liquidity and funding
SEKbn
Source: Swedbank Mar 31, 2013
Days forward

0
50
100
150
200
250
300
350
400
Next 12-month term funding maturities
CP / CDs and net interbank funding,
SEKm
0
50
100
150
200
250
300
350
400
Additional pledgeable and/or liquid assets
Liquidity reserve, securities
Liquidity reserve, central bank deposits,
SEKm
Conservative liquidity levels
• Short-term funding mainly a tool for cash management
• More than 12 months pre-funded
24
SEKbn
Source: Swedbank Mar 31, 2013
Liquidity and funding
1 As defined by the Swedish Bankers’ Association
1
1
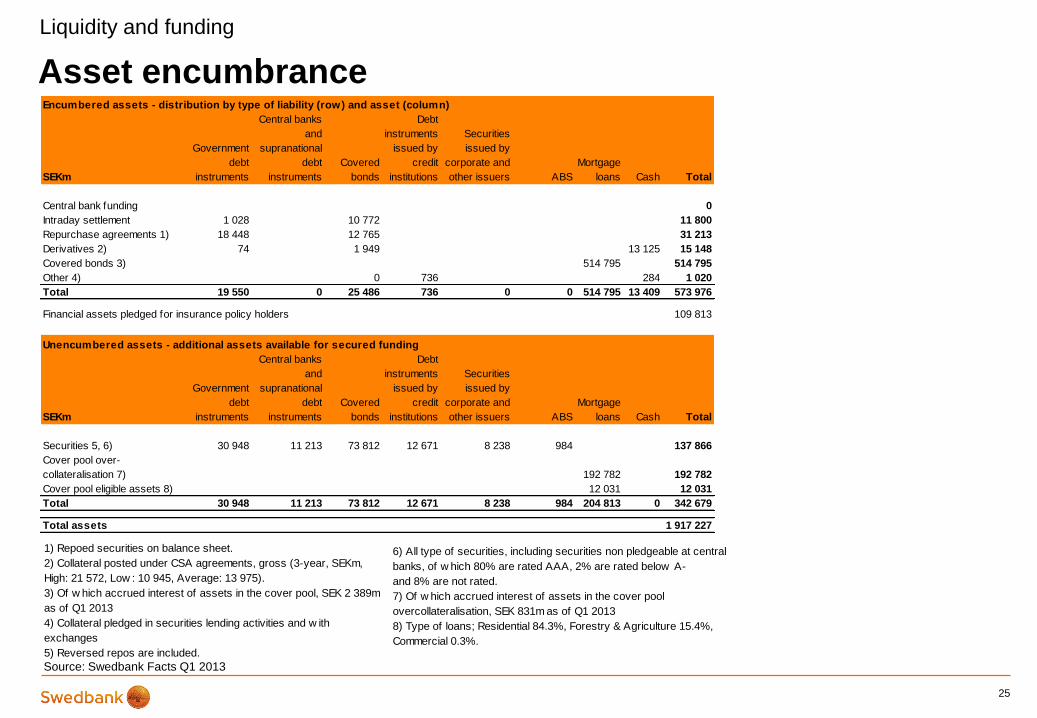
Asset encumbrance
25
Liquidity and funding
Source: Swedbank Facts Q1 2013
1) Repoed securities on balance sheet.
2) Collateral posted under CSA agreements, gross (3-year, SEKm,
High: 21 572, Low : 10 945, Average: 13 975).
3) Of w hich accrued interest of assets in the cover pool, SEK 2 389m
as of Q1 2013
4) Collateral pledged in securities lending activities and w ith
exchanges
5) Reversed repos are included.
6) All type of securities, including securities non pledgeable at central
banks, of w hich 80% are rated AAA, 2% are rated below A-
and 8% are not rated.
7) Of w hich accrued interest of assets in the cover pool
overcollateralisation, SEK 831m as of Q1 2013
8) Type of loans; Residential 84.3%, Forestry & Agriculture 15.4%,
Commercial 0.3%.
Encumbered assets - distribution by type of liability (row) and asset (column)
SEKm
Government
debt
instruments
Central banks
and
supranational
debt
instruments
Covered
bonds
Debt
instruments
issued by
credit
institutions
Securities
issued by
corporate and
other issuers ABS
Mortgage
loans Cash Total
Central bank funding 0
Intraday settlement 1 028 10 772 11 800
Repurchase agreements 1) 18 448 12 765 31 213
Derivatives 2) 74 1 949 13 125 15 148
Covered bonds 3) 514 795 514 795
Other 4) 0 736 284 1 020
Total 19 550 0 25 486 736 0 0 514 795 13 409 573 976
Financial assets pledged for insurance policy holders 109 813
Unencumbered assets - additional assets available for secured funding
SEKm
Government
debt
instruments
Central banks
and
supranational
debt
instruments
Covered
bonds
Debt
instruments
issued by
credit
institutions
Securities
issued by
corporate and
other issuers ABS
Mortgage
loans Cash Total
Securities 5, 6) 30 948 11 213 73 812 12 671 8 238 984 137 866
Cover pool over-
collateralisation 7) 192 782 192 782
Cover pool eligible assets 8) 12 031 12 031
Total 30 948 11 213 73 812 12 671 8 238 984 204 813 0 342 679
Total assets 1 917 227

26

3. Cover pool data
27
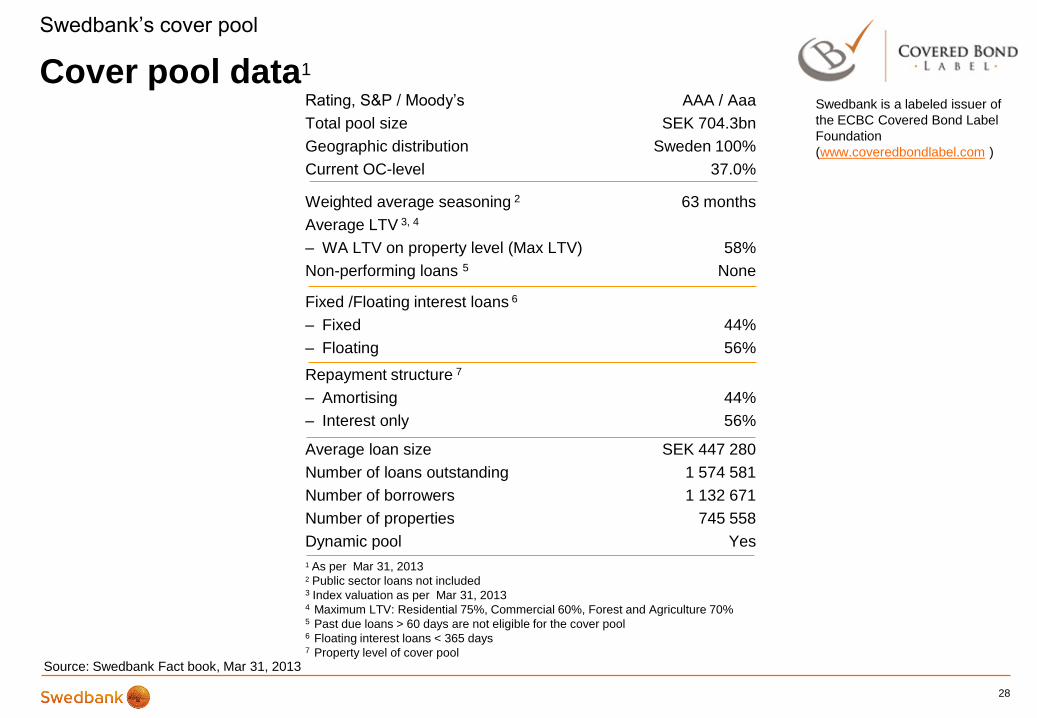
28
Rating, S&P / Moody’s AAA / Aaa
Total pool size SEK 704.3bn
Geographic distribution Sweden 100%
Current OC-level 37.0%
Weighted average seasoning 2 63 months
Average LTV 3, 4
– WA LTV on property level (Max LTV) 58%
Non-performing loans 5 None
Fixed /Floating interest loans 6
– Fixed 44%
– Floating 56%
Repayment structure 7
– Amortising 44%
– Interest only 56%
Average loan size SEK 447 280
Number of loans outstanding 1 574 581
Number of borrowers 1 132 671
Number of properties 745 558
Dynamic pool Yes
1 As per Mar 31, 2013
2 Public sector loans not included
3 Index valuation as per Mar 31, 2013 4 Maximum LTV: Residential 75%, Commercial 60%, Forest and Agriculture 70% 5 Past due loans > 60 days are not eligible for the cover pool 6 Floating interest loans < 365 days 7 Property level of cover pool
Cover pool data1
Source: Swedbank Fact book, Mar 31, 2013
Swedbank’s cover pool
Swedbank is a labeled issuer of
the ECBC Covered Bond Label
Foundation
(www.coveredbondlabel.com )

Cover pool data
29
Swedbank’s cover pool
Source: Swedbank, Facts, Mar 31, 2013
Geographical distribution - Sweden 100% Q1
% 2013
North 6.7
Norrbotten county (BD) 1.5
Västerbotten county (AC) 2.4
Västernorrland county (Y) 1.6
Jämtland county (Z) 1.3
Middle (including Stockholm) 43.9
Dalarna county (W) 2.3
Gävleborg county (X) 2.2
Värmland county (S) 2.2
Örebro county (T) 2.6
Västmanland county (U) 2.7
Uppsala county ( C) 4.0
Södermanland county (D) 2.7
Stockholm county (including Stockholm) (AB) 25.2
South (including Göteborg and Malmö) 49.4
Västra götaland county (Including Göteborg) (O) 17.4
Östergötland county (E) 4.1
Jönköping county (F) 3.7
Halland county (N) 3.7
Kronoberg county (G) 2.3
Kalmar county (H) 3.4
Skåne county (including Malmö) (M) 12.5
Blekinge county (K) 1.8
Gotland county (I) 0.6
100.0
Type of loans
%
Residentials 91.0
of w hich Single-family housing 60.6
of w hich Tenant ow ner rights 16.2
of w hich Tenant ow ner association 9.8
of w hich Multi-family housing 4.5
Public 1.4
Commercial 0.3
Forest & Agricultural 7.3
100.0

0%
5%
10%
15%
20%
25%
30%
35%
40%
00-10 10-20 20-30 30-40 40-50 50-60 60-70 70-75
0%
5%
10%
15%
20%
25%
00-10 10-20 20-30 30-40 40-50 50-60 60-70 70-75
Cover pool loan-to-value distribution
30
Swedbank’s cover pool
Source: Swedbank, Mar 31, 2013
• Weighted average LTV 58%
LTV distribution per property1 LTV distribution by volume1, 2
1 Public loans of 1.4% of the cover pool are excluded as they are either guaranteed by a Swedish municipality or the
government and have therefore no LTV assigned to them. 2 LTV distribution as defined by the Association of Swedish
Covered Bond Issuers (www.ascb.se)
-0.10%
0.00%
0.10%
0.20%
0.30%
0.40%
0.50%
Residential Forest & Agriculture
31
Source: Swedbank Mar 31 2013
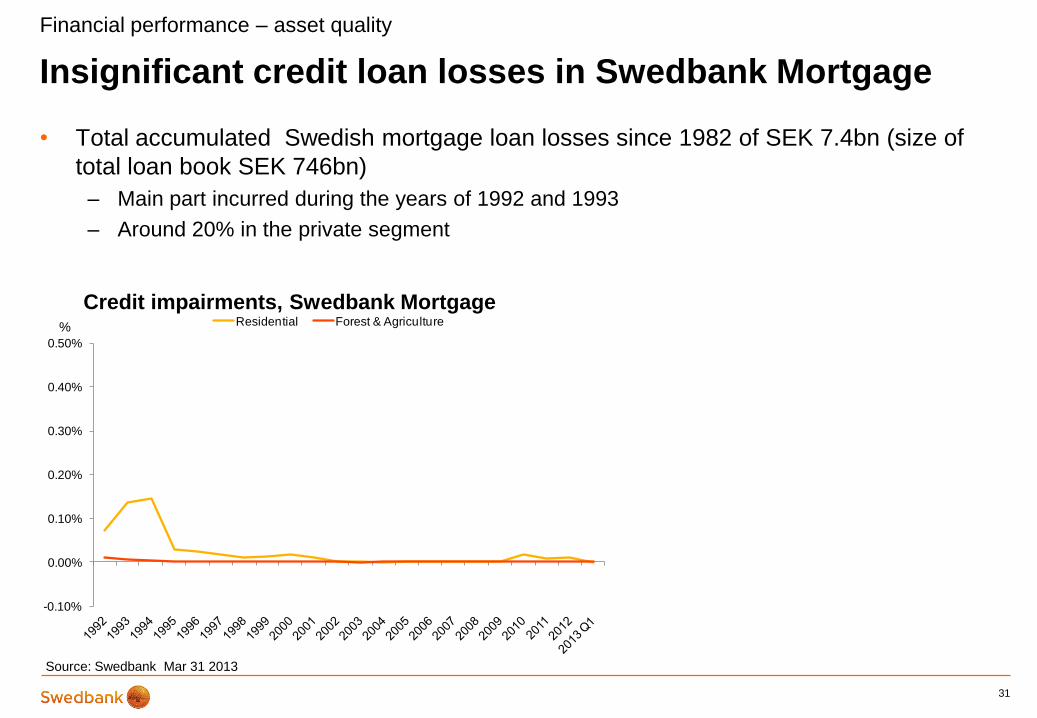
• Total accumulated Swedish mortgage loan losses since 1982 of SEK 7.4bn (size of
total loan book SEK 746bn)
– Main part incurred during the years of 1992 and 1993
– Around 20% in the private segment
Insignificant credit loan losses in Swedbank Mortgage
Financial performance – asset quality
Credit impairments, Swedbank Mortgage
%

32
4. Swedish economy
33

A balance sheet in favourable condition
• Sweden’s financial assets continue to exceed its liabilities
34
Swedish economy
Source: OECD Economic outlook 92 (table 33), Dec 18, 2012
-40
-20
0
20
40
60
80
100
120
2011 2012F 2013F
General government net financial liabilities % of nominal GDP

35
A budget in balance
Swedish economy
Source: OECD Economic outlook 92 table 27, Dec 18, 2012
Budget balance as a percentage of GDP
• Budget framework since early 1990’s – to stabilize and achieve long-term sustainability
in the public finances
– Mandatory public sector excess savings target of 1% of GDP on average over a business cycle
– Mandatory ceiling for the state and pension system expenses (3 years ahead)
Swedish historic budget balance as a percentage
of GDP
-12
-10
-8
-6
-4
-2
0
2
2010
2011
2012F
2013F
-8
-6
-4
-2
0
2
4
1995
1996
1997
1998
1999
2000
2001
2002
2003
2004
2005
2006
2007
2008
2009
2010
2011
2012F
2013F
2014F

36
Savings
Swedish economy
Source: OECD Economic Outlook 92, table 23, Dec 18 2012
Household saving rates % of disposable income
-10
-5
0
5
10
15 1995
1996
1997
1998
1999
2000
2001
2002
2003
2004
2005
2006
2007
2008
2009
2010
2011
2012F
2013F
Sweden
Germany
Norway
US
Finland
Denmark
0
200
400
600
800
1 000
1 200
1 400
1 600
1 800
2005 2006 2007 2008 2009 2010 2011 2012 Q1 130
20
40
60
80
100
1999 2001 2003 2005 2007 2009 2011 2013F
Euro area
France
United Kingdom
Germany
Denmark
Sweden
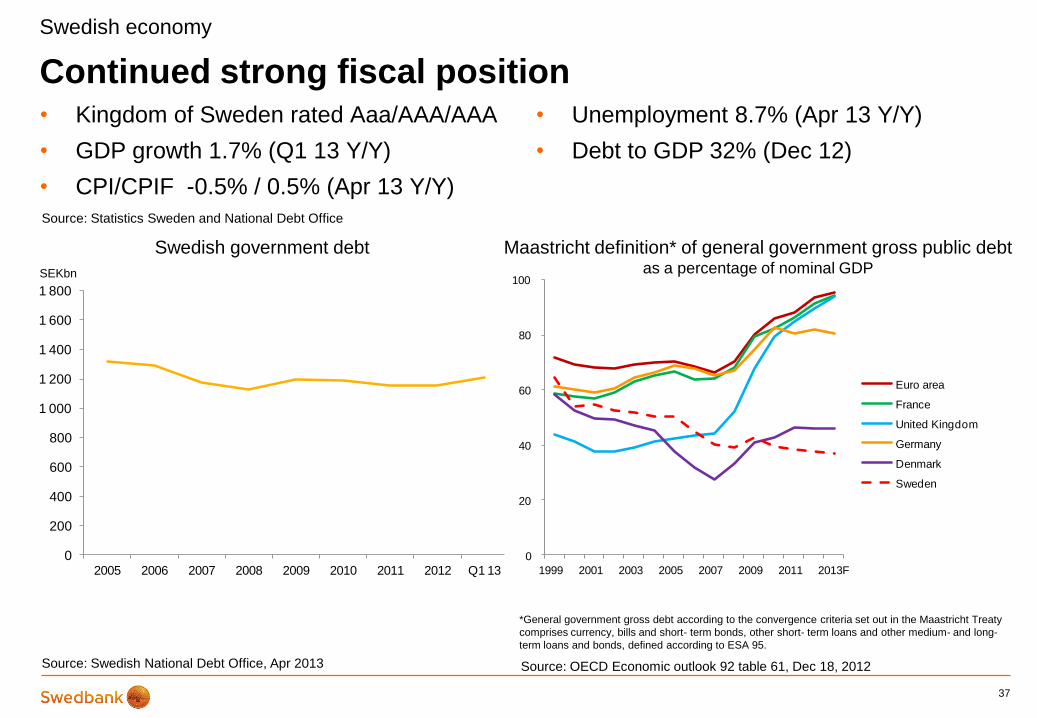
• Kingdom of Sweden rated Aaa/AAA/AAA
• GDP growth 1.7% (Q1 13 Y/Y)
• CPI/CPIF -0.5% / 0.5% (Apr 13 Y/Y)
37
Continued strong fiscal position
Source: OECD Economic outlook 92 table 61, Dec 18, 2012
Swedish government debt
Swedish economy
SEKbn
Maastricht definition* of general government gross public debt as a percentage of nominal GDP
Source: Statistics Sweden and National Debt Office
Source: Swedish National Debt Office, Apr 2013
*General government gross debt according to the convergence criteria set out in the Maastricht Treaty
comprises currency, bills and short- term bonds, other short- term loans and other medium- and long-
term loans and bonds, defined according to ESA 95.
• Unemployment 8.7% (Apr 13 Y/Y)
• Debt to GDP 32% (Dec 12)

0
20 000
40 000
60 000
80 000
100 000
120 000
2004 2005 2006 2007 2008 2009 2010 2011 2012 2013
Import Export
Exports – key factor for growth
38
Swedish economy
Source: Statistics Sweden, Mar, 2013
Top 10 export countries, Feb 2013, %
Exports and imports trend per month, SEKm Current prices
Data up to and including Feb 2013
Current account balance as % of GDP
Source: OECD – Economic outlook 92, table 51, Dec 18, 2012
-6
-4
-2
0
2
4
6
8
10
12
2007 2008 2009 2010 2011 2012F 2013F
Sweden
Germany
Denmark
Italy
Finland
France
United States
United Kingdom
Canada
0
2
4
6
8
10
12
5. Swedish housing and mortgage market
39

Swedish mortgage market
• No securitisation (on balance sheet), no sub-prime market, no 3rd party origination, restricted buy-
to-let market
• 70% home ownership1
• Rental market is regulated
• Transparent credit information (credit information agency, www.uc.se)
– Publicly available information regarding income, debt, payment track record etc
• Consumer credit legislation requires affordability calculations including stress test of higher interest
rate
• Very limited debt forgiveness possibilities (full recourse)
• Strong social security and generous unemployment benefit system
40
Swedish housing and mortgage market
1 Source: Boverket, 2011

0
2
4
6
8
10
12
14
03 04 05 06 07 08 09 10 11 12 13
Annual percentage change
Pace of household borrowing declines
• House prices stabilize
• Credit growth abates
• LTV development impacted by changed origination standards
41
House-price development (2007=100) Household borrowing growth
0
20
40
60
80
100
120
140
2007 2008 2009 2010 2011 2012 2013
HOXSWE HOXFLATSWE HOXHOUSESWE
Source: Swedbank, Statistics Sweden and Valueguard (HOXSWE= Total, HOXFLATSWE= Tenant owner rights, HOUXHOUSESWE= Single family houses)
%
Swedish housing and mortgage market
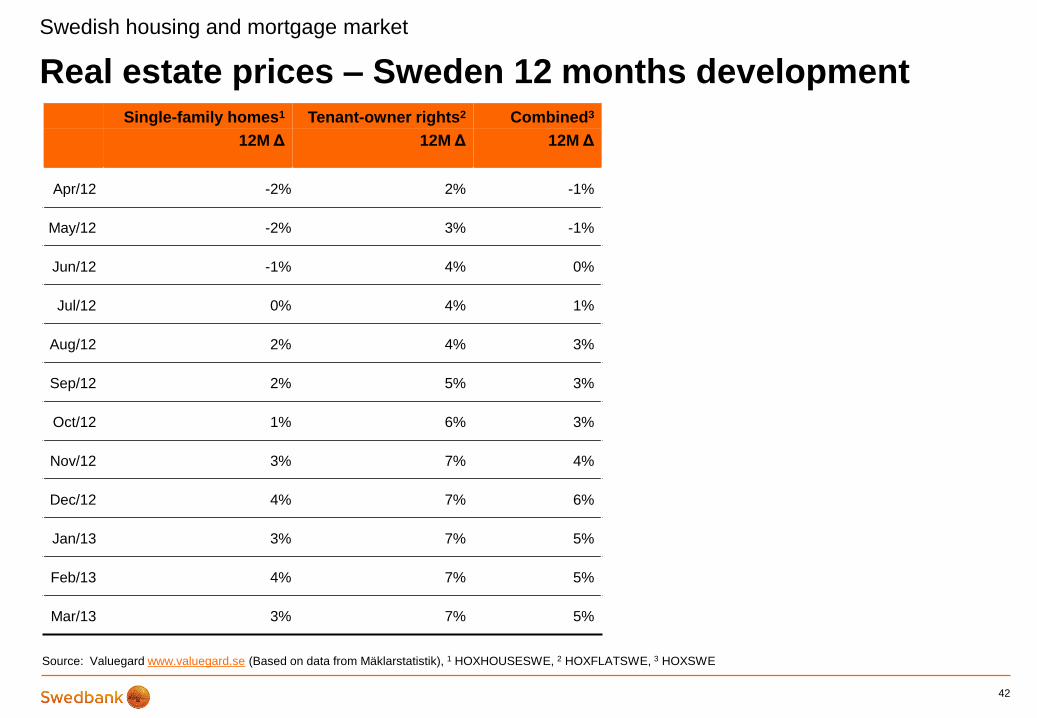
Real estate prices – Sweden 12 months development
42
Swedish housing and mortgage market
Single-family homes1 Tenant-owner rights2 Combined3
12M Δ
12M Δ
12M Δ
Apr/12 -2% 2% -1%
May/12 -2% 3% -1%
Jun/12 -1% 4% 0%
Jul/12 0% 4% 1%
Aug/12 2% 4% 3%
Sep/12 2% 5% 3%
Oct/12 1% 6% 3%
Nov/12 3% 7% 4%
Dec/12 4% 7% 6%
Jan/13 3% 7% 5%
Feb/13 4% 7% 5%
Mar/13 3% 7% 5%
Source: Valuegard www.valuegard.se (Based on data from Mäklarstatistik), 1 HOXHOUSESWE, 2 HOXFLATSWE, 3 HOXSWE
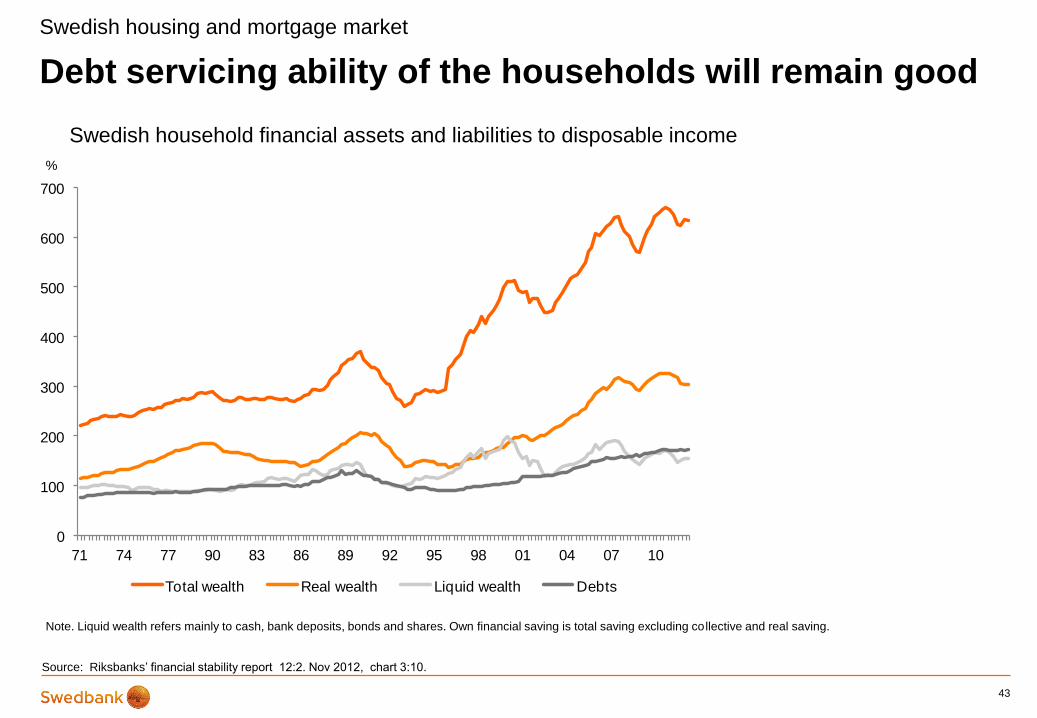
Debt servicing ability of the households will remain good
43
Swedish housing and mortgage market
Swedish household financial assets and liabilities to disposable income
Source: Riksbanks’ financial stability report 12:2. Nov 2012, chart 3:10.
%
0
100
200
300
400
500
600
700
71 74 77 90 83 86 89 92 95 98 01 04 07 10
Total wealth Real wealth Liquid wealth Debts
Note. Liquid wealth refers mainly to cash, bank deposits, bonds and shares. Own financial saving is total saving excluding collective and real saving.

0
10 000
20 000
30 000
40 000
50 000
60 000
70 000
80 000
1975
1976
1977
1978
1979
1980
1981
1982
1983
1984
1985
1986
1987
1988
1989
1990
1991
1992
1993
1994
1995
1996
1997
1998
1999
2000
2001
2002
2003
2004
2005
2006
2007
2008
2009
2010
2011
2012
Apartment buildings Single-family dwellings
44
Housing investments at a conservative level
Housing completions, apartments in Multi-family dwellings
and Single-family houses in Sweden Housing investments as a percentage of GDP (4Q moving average)
Swedish housing and mortgage market
Number of apartments
Source: Statistics Sweden, Mar 2013 (data as per FY 2012) Source: Reuters Ecowin, Oct 20, 2012 (data as per Q2 2012)
0
2
4
6
8
10
12
14
19
92
19
93
19
94
19
95
19
96
19
97
19
98
19
99
20
00
20
01
20
02
20
03
20
04
20
05
20
06
20
07
20
08
20
09
20
10
20
11
20
12
Spain
Eurozone
Denmark
UK
USA
Sweden
As per 31 Dec 2012, 24,524 apartments were completed during 2012
0
200 000
400 000
600 000
800 000
1 000 000
1 200 000
1990
1991
1992
1993
1994
1995
1996
1997
1998
1999
2000
2001
2002
2003
2004
2005
2006
2007
2008
2009
2010
2011
2012
Acc increase in population
Acc increase in housing starts
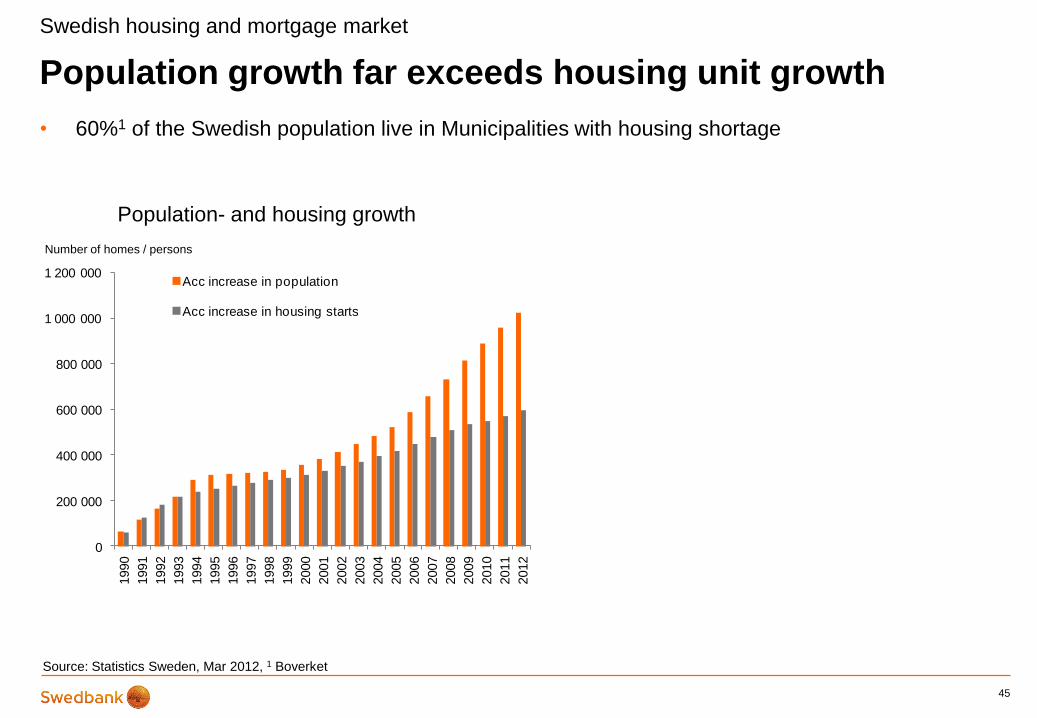
Population growth far exceeds housing unit growth
45
Source: Statistics Sweden, Mar 2012, 1 Boverket
Population- and housing growth
Number of homes / persons
Swedish housing and mortgage market
• 60%1 of the Swedish population live in Municipalities with housing shortage
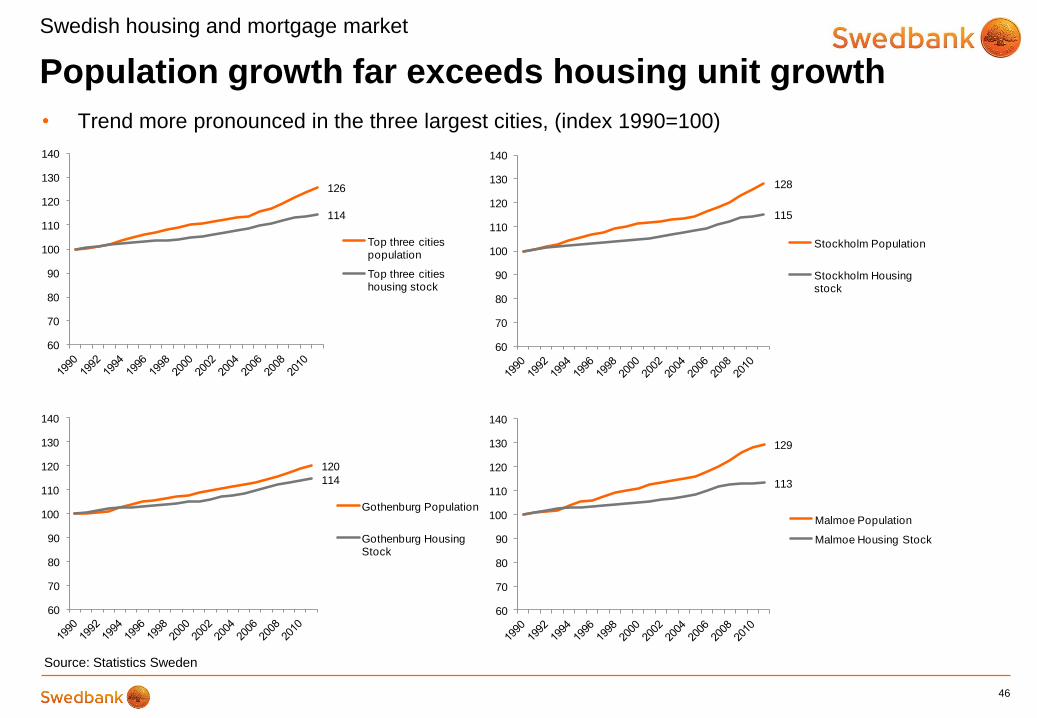
Population growth far exceeds housing unit growth
46
• Trend more pronounced in the three largest cities, (index 1990=100)
Source: Statistics Sweden
Swedish housing and mortgage market
128
115
60
70
80
90
100
110
120
130
140
Stockholm Population
Stockholm Housing stock
120
114
60
70
80
90
100
110
120
130
140
Gothenburg Population
Gothenburg Housing Stock
129
113
60
70
80
90
100
110
120
130
140
Malmoe Population
Malmoe Housing Stock
126
114
60
70
80
90
100
110
120
130
140
Top three cities population
Top three cities housing stock

Appendix
47
This is Swedbank
48

The Bank for the many people, households and businesses
49
Latvia
Population 2.0m
Private customers 0.9m
Corporate customers 84 000
Branches 54
ATMs 417
Cards 1.0m
Employees 1 738
Lithuania
Population 3.0m
Private customers 2.0m
Corporate customers 87 000
Branches 81
ATMs 503
Cards 1.9m
Employees 1 948
Estonia
Population 1.3m
Private customers 1.0m
Corporate customers 118 000
Branches 57
ATMs 496
Cards 1.1m
Employees 2 408
Sweden
Population 9.5m
Private customers 4.0m
Corporate customers 263 000
Organisations 67 000
Branches 308
ATMs 444
Cards 3.8m
Employees 7 920
This is Swedbank
Source: Swedbank Fact book Q1, 2013

0
10
20
30
40
50
60
Sweden Estonia Latvia Lithuania
Mortgage lending
Corporate lending
0
10
20
30
40
50
60
Sweden Estonia Latvia Lithuania
Deposits Private
Deposits Corporate
Market leading retail franchise in all home markets
50
% %
Source: Source Sweden: Statistics Sweden (SCB)
Source Estonia: Estonian Central Bank
Sources Latvia: Association of Commercial Banks of Latvia (ACBL) & The Financial and Capital Market Commission (FCMC)
Source Lithuania: Association of Lithuanian Banks (LBA)
This is Swedbank
Market shares, Deposits February 2013
• Largest retail bank and fund manager in Sweden
Market shares, Lending February 2013

0 200 400 600 800 1000 1200
Other* 3.3%
Lithuania 2.9%
Latvia 2.4%
Estonia 4.3%
Sweden 87.1%
Swedish Mortgage loans (private+corp)
Other corporate (incl. LC&I, Sweden)
Other
Sweden – the dominating home market
• Total lending to the public amounts to SEK 1,183bn (as per Q1 2013), out of which
around 87% is originated in Sweden
• Estonia makes up 45% of total lending in the Baltics
51
Source: Swedbank Fact book Q1 2013, page 37
This is Swedbank
* Russia & Ukraine, Denmark, Norway, Finland and NY Branch
Lending distributed by countries (Q1 2013)
SEK 1 030bn

Baltic market fundamentals
• Legal and institutional framework
• Fiscal position
• Market concentration
• Absence of “irrational” players
• Sophisticated product penetration
• Swedbank retail and deposit incumbent
• GDP / capita less than half of Sweden’s
• Risk mitigators
– Loan-to-deposit restriction
– Group governance model
52
Estonia
Latvia
Lithuania
This is Swedbank – Baltic banking
Source: Swedbank

Customer requirements drive new ways of banking
• Focus on functionality and ease of use
53
This is Swedbank - Retail banking
0
5
10
15
20
25
30
Jan 2010 Jan 2011 Jan 2012 Jan 2013
millionMonthly logins Swedbank and Savings Banks
Mobile bank Internet bank
Source: Swedbank Mar 31, 2013
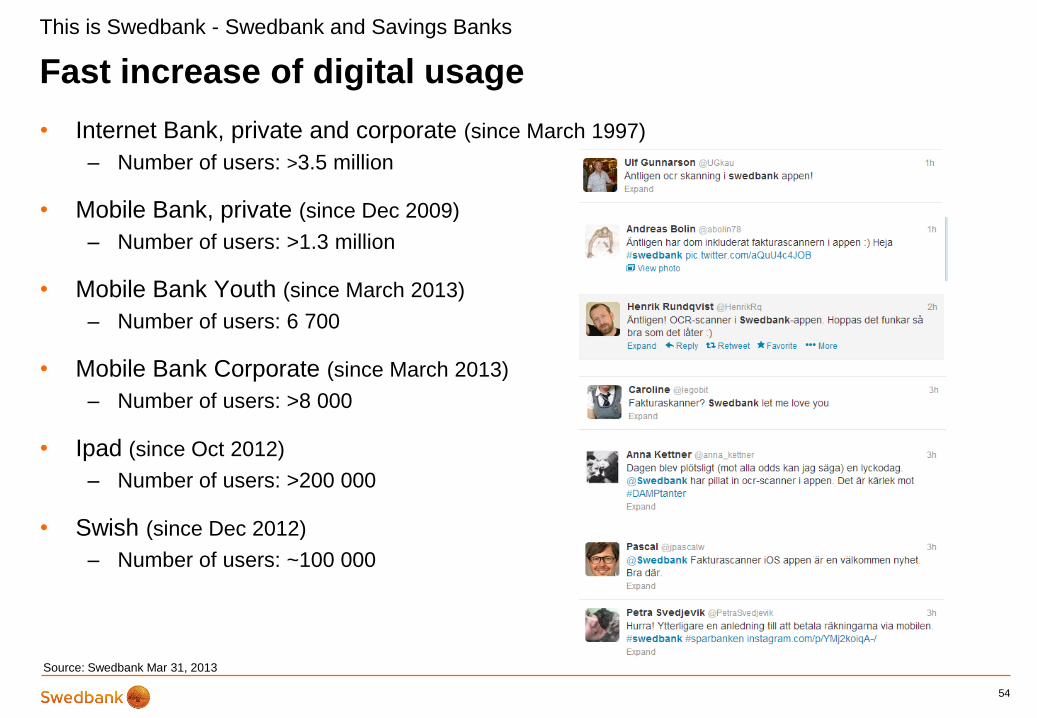
Fast increase of digital usage
• Internet Bank, private and corporate (since March 1997)
– Number of users: >3.5 million
• Mobile Bank, private (since Dec 2009)
– Number of users: >1.3 million
• Mobile Bank Youth (since March 2013)
– Number of users: 6 700
• Mobile Bank Corporate (since March 2013)
– Number of users: >8 000
• Ipad (since Oct 2012)
– Number of users: >200 000
• Swish (since Dec 2012)
– Number of users: ~100 000
54
This is Swedbank - Swedbank and Savings Banks
Source: Swedbank Mar 31, 2013

Financial performance
55

Peer comparison – Swedbank top 1 or 2 in all key metrics
56
Business position
• Peer group definition - jurisdiction matters
Reported YE 2012 figures Swedbank SHB SEB Nordea Danske DnB
Rating, long-term (S&P/Moody's/Fitch) A+/A2/A+ AA-/Aa3/AA- A+/A1/A+ AA-/Aa3/AA- A-/Baa1/A A+/A1/A+
Rating, short-term (S&P/Moody's/Fitch) A-1/P-1/F1 A-1+/P-1/F1+ A-1/P-1/F1 A-1+/P-1/F1+ A-2/P-2/F1 A1/P-1/F1
RoE, %* 14.1 14.4 10.8 11.5 3.6 10.9
RoCET1, % 19.2 17.6 13.6 15.2 4.4 11.5
Pre-provision RoCET1, % 26.2 22.8 17.8 24.6 19.6 18.0
CET1 Basel 2, % 17.4 18.4 16.4 13.1 14.5 12.1
CET1 Basel 3, % 16.1 16.5 14.3 11.8 12.5 12.1
CET1 IAS 19, % 15.4 16.4 13.1 11.6 12.5 12.1
C/I ratio, % 46.3 46.3 60.5 50.7 55.8 50.2
Credit impairment ratio, % 0.06 0.08 0.08 0.27 0.74 0.25
Impairment (gross) as % of total gross loans 1.11 0.45 1.07 1.94 6.54 2.05
LCR, % 130 136 113 127 121 n/d
NSFR, % 91 n/d n/d n/d n/d n/d
*ROE calculated as average of equity for Q1 and Q4 for comparable reasons (otherwise communicated 14.4% calculated as an average for all quarters 2012)
n/d = not disclosed
Strategic focus areas
• ROE target of 15%
– Efficiency
– Repricing
– Increase share of wallet
– Capital efficiency
• Lowest risk – lowest funding costs
– Buffers
• Customer offering
– Internet banking own profit center – further investments
– Improved advisory capability – further investments
• Continue de-centralisation
57
Financial performance - business position
Asset quality
58

Provisions – well provided for
59
Asset quality
Provision ratios, % Q1 13
Retail 70
LC&I 76
Baltic Banking 52
Group 57
* Russia and Ukraine reported as discontinued operations.
11 91510 951
9 934
7 077
4 429
2 4782 040
1 774
1 545
1 420
65.0% 63.7% 65.2%61.9%
57.0%
0
5 000
10 000
15 000
20 000
25 000
Q1 12 Q2 12 Q3 12 Q4 12 Q1 13*
SEKm
Individual provisions Portfolio provisions Provision ratio
Source: Swedbank Mar 31, 2013
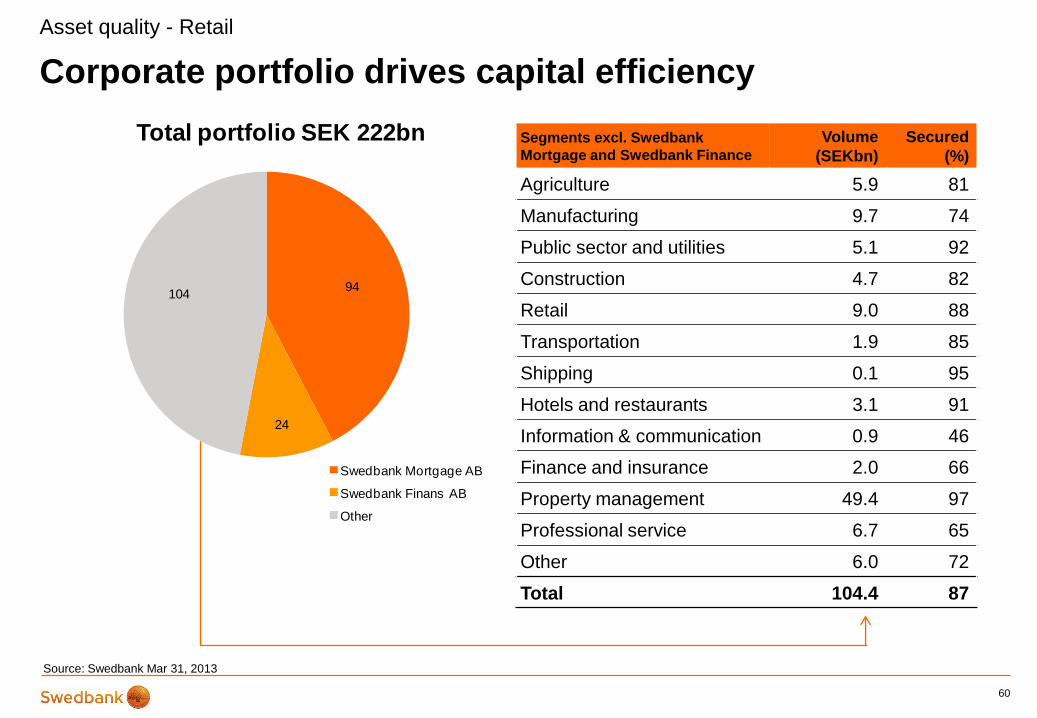
Corporate portfolio drives capital efficiency
60
Asset quality - Retail
94
24
104
Total portfolio SEK 222bn
Swedbank Mortgage AB
Swedbank Finans AB
Other
Segments excl. Swedbank
Mortgage and Swedbank Finance
Volume
(SEKbn)
Secured
(%)
Agriculture 5.9 81
Manufacturing 9.7 74
Public sector and utilities 5.1 92
Construction 4.7 82
Retail 9.0 88
Transportation 1.9 85
Shipping 0.1 95
Hotels and restaurants 3.1 91
Information & communication 0.9 46
Finance and insurance 2.0 66
Property management 49.4 97
Professional service 6.7 65
Other 6.0 72
Total 104.4 87
Source: Swedbank Mar 31, 2013

15
5
4
24 26 25
24 23
0
10
20
30
Q1-12 Q2-12 Q3-12 Q4-12 Q1-13
SEKbn
Shipping and Offshore
Offshore Tanker Other
61
• Exposure to Shipping & Offshore sector
was SEK 23.5bn plus unutilised
commitments of SEK 7.7bn
– Portfolio duration 4-5y
– Average fleet age 7y
– Strong employment profiles
Asset quality – Large Corporates & Institutions
0 5 10 15 20
SEK
EUR
USD
NOK
JPY
Shipping and Offshore portfolio by currency
Q1-13
Q4-12
0,5
6,8
1,6
3,5
1,2
1,9
0,2
2,3
0,7
1,4
0,7
0,9
1,6
0 2 4 6 8
Cruise
Drilling & exploration
Oil service
Supply
Accommodation
Floating production
Chemical
Product
Crude oil
Gas (LNG/LPG)
Dry bulk
Container
RORO
Shipping and Offshore Portfolio by subsegment
Q1-13
Q4-12
Shipping and Offshore
SEKbn
bn
Source: Swedbank Mar 31, 2013

Agriculture
• Segmentation definitions – Corporate Agriculture: Businesses
that derive their main income from
agricultural activities
– Private Investments: Private individuals who
own agricultural properties for residential or
investment purposes
• Lending to the agricultural sector SEK
63.3bn – Corporate Agriculture: (58%)
• Agriculture 45%
• Forestry 13%
– Private Investments (42%)
• Residential: 20%
• Forestry: 22%
62
Asset quality
Agriculture 45%
Forestry 13%
Private: Forestry
22%
Private: Residential
20%

Liquidity and funding
63
Structure of the Swedish domestic covered bond market
• Benchmark system established in early 1990s
• Tap issuance enhances liquidity and reduces execution risk
– Continuous daily issuance
– Buy-backs against issuance of longer tenors
– Total issue size often peak at SEK 40-60bn
• Market making at pre-set bid/offer spreads
64
Source: Swedbank
Liquidity and funding

0
200
400
600
800
1 000
1 200
1 400
1 600
2007 2008 2009 2010 2011 2012 Q1 13
SE
Kb
n
Swedbank Mortgage Total excl. Swedbank Mortgage
1 0621 149 1 113 1 075 1 128 1 134 1 103
1 015883
0
5
10
15
20
25
30
35
40
0
200
400
600
800
1 000
1 200
1 400
1 600
2008 2009 2010 2011 2012F 2013F 2014F 2015F 2016F
Government debt % of GDP
The Swedish covered bond market
65
Swedish Domestic Covered Bonds, in SEKbn Public debt projections 2012-2016
Source: Actual and forecast from government budget statement, Sep 20, 2012
• Domestic covered bonds represent approximately 1/3 of GDP and 1/2 of the total
Swedish bond market
Source: www.ascb.se , Mar 31, 2013
Liquidity and funding
% SEKbn
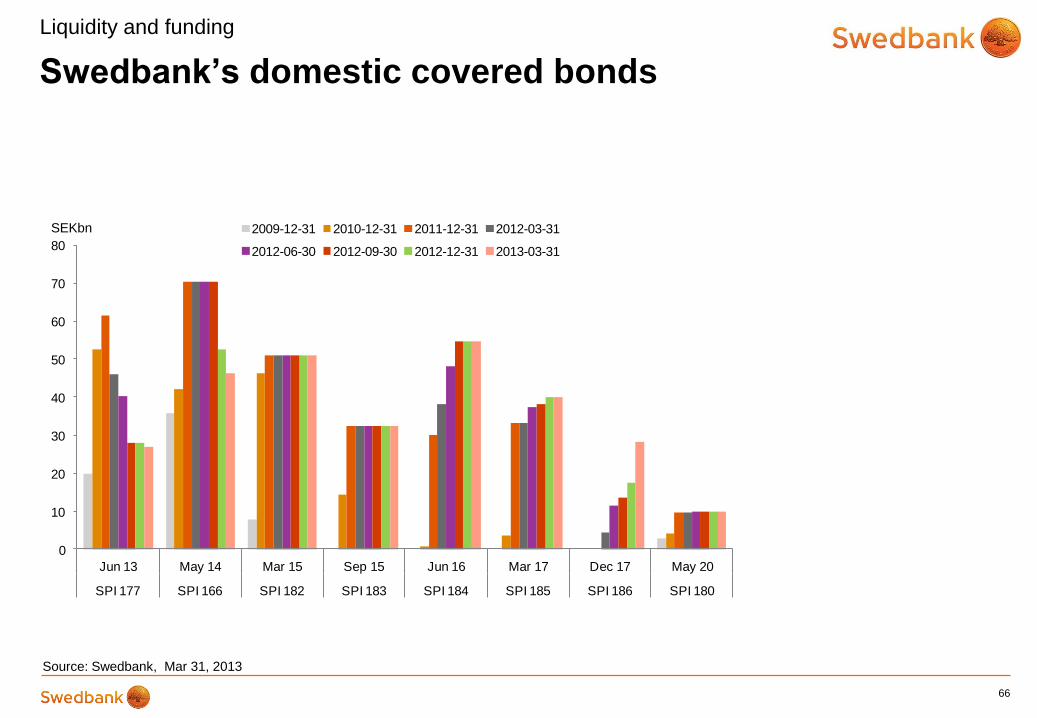
0
10
20
30
40
50
60
70
80
Jun 13 May 14 Mar 15 Sep 15 Jun 16 Mar 17 Dec 17 May 20
SPI 177 SPI 166 SPI 182 SPI 183 SPI 184 SPI 185 SPI 186 SPI 180
2009-12-31 2010-12-31 2011-12-31 2012-03-31
2012-06-30 2012-09-30 2012-12-31 2013-03-31
Swedbank’s domestic covered bonds
66
Source: Swedbank, Mar 31, 2013
Liquidity and funding
SEKbn
29%
18%
35%
10%
34%
66%
2% 6%
0%
10%
20%
30%
40%
50%
60%
70%
80%
90%
100%
2007 Q1 2013
5 years +
1-5 years
3-12 months
0-3 months
0
5
10
15
20
25
30
35
40
45
50
Q3 09
Q4 09
Q1 10
Q2 10
Q3 10
Q4 10
Q1 11
Q2 11
Q3 11
Q4 11
Q1 12
Q2 12
Q3 12
Q4 12
Q1 13
Total capital market funding Covered bond funding
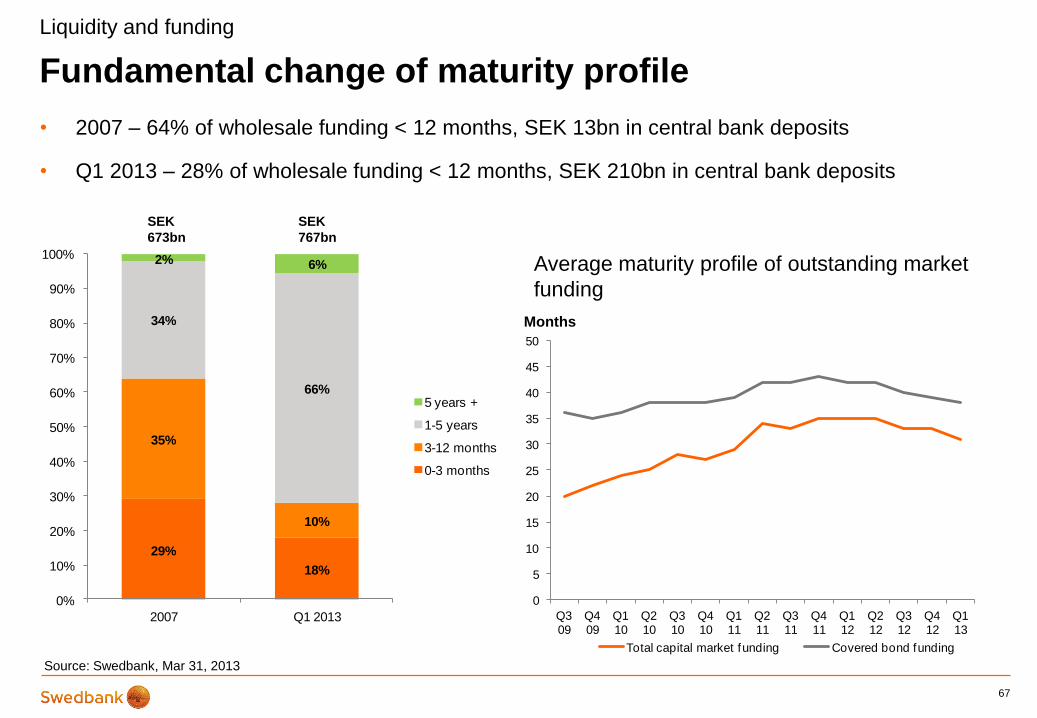
Fundamental change of maturity profile
67
Average maturity profile of outstanding market
funding
Source: Swedbank, Mar 31, 2013
Months
SEK
673bn
SEK
767bn
• 2007 – 64% of wholesale funding < 12 months, SEK 13bn in central bank deposits
• Q1 2013 – 28% of wholesale funding < 12 months, SEK 210bn in central bank deposits
Liquidity and funding

0
50
100
150
200
2013 2014 2015 2016 2017 2018 2019-
Government guaranteed debt
Senior unsecured debt
Covered bonds
68
Long-term funding maturity profile
• FY 2013 maturities amount to nominal SEK 86bn, of which SEK 46bn remains
68
Long-term funding maturity profile
Source: Swedbank Mar 31, 2013
Liquidity and funding
SEKbn
0
50
100
150
200
250
300
Assets Liabilities
Assets held for sale
Interest-bearing securities
Lending to the public
Loans to credit institutions
Cash and balances with central banks
Deposits and borrowings from the public
Amounts owed to credit institutions
Debt securities in issue
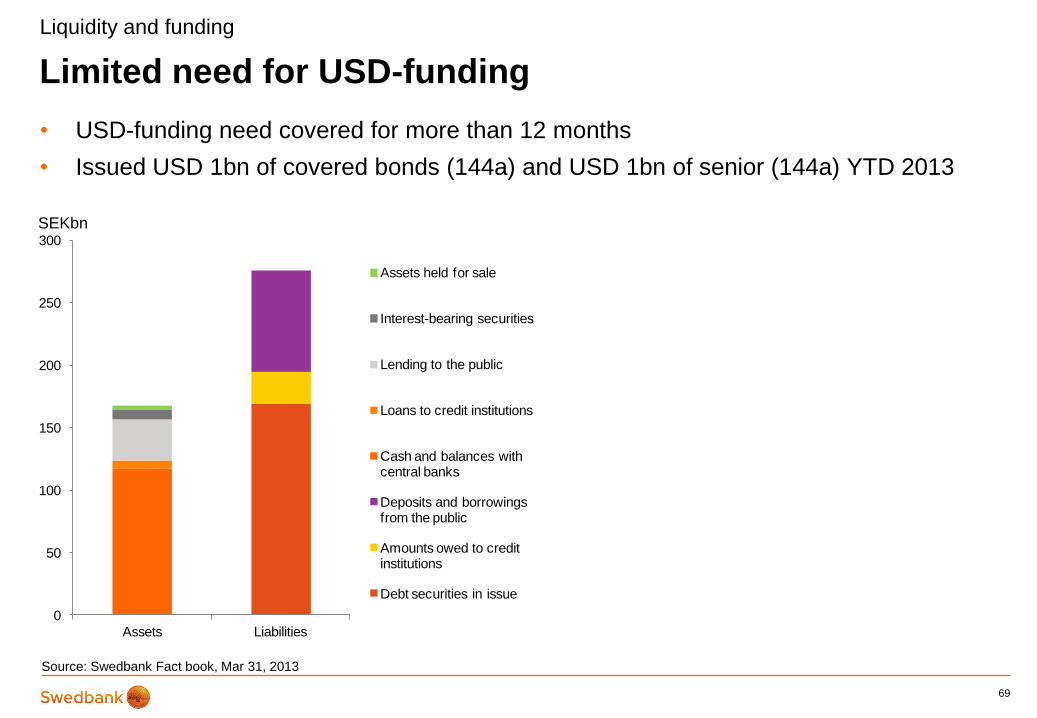
Limited need for USD-funding
69
SEKbn
• USD-funding need covered for more than 12 months
• Issued USD 1bn of covered bonds (144a) and USD 1bn of senior (144a) YTD 2013
Source: Swedbank Fact book, Mar 31, 2013
Liquidity and funding

Cover pool loan-to-value distribution
70
Swedbank’s cover pool
Source: Swedbank, Mar 31, 2013 (1excluding public sector loans)
WA LTV per property type1
1 0%
10%
20%
30%
40%
50%
60%
70%
Single-family homes
Tenant owner rights
Tenant owner associations
Multi-family housing
Commercial Forestry & Agricultural
Total all types
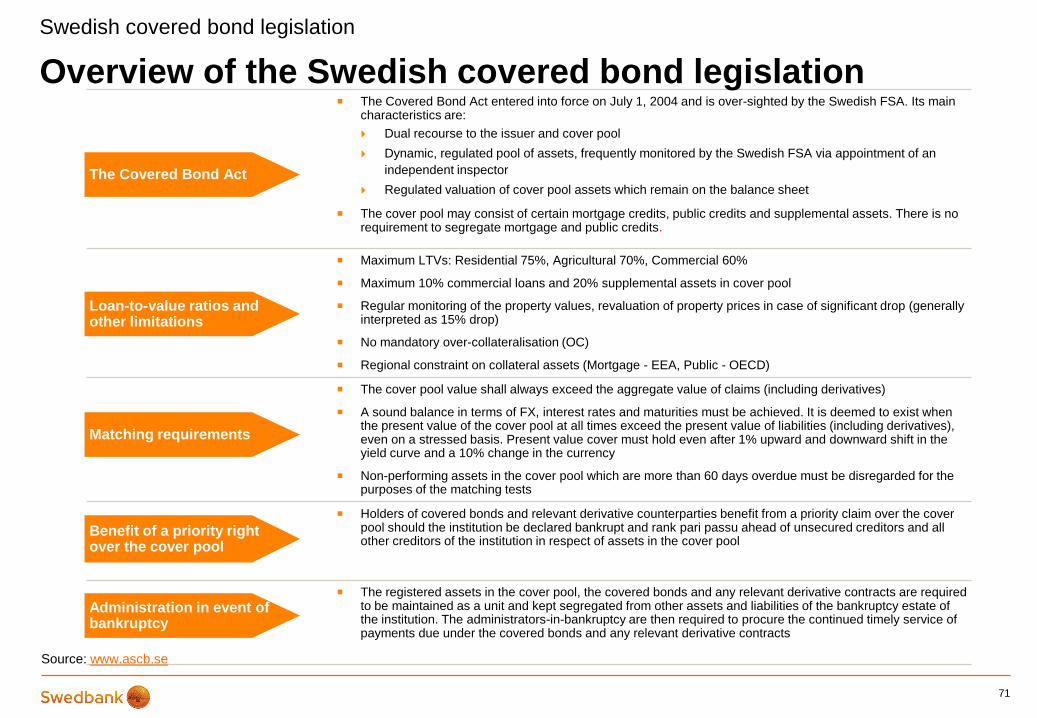
The Covered Bond Act entered into force on July 1, 2004 and is over-sighted by the Swedish FSA. Its main characteristics are:
Dual recourse to the issuer and cover pool
Dynamic, regulated pool of assets, frequently monitored by the Swedish FSA via appointment of an
independent inspector
Regulated valuation of cover pool assets which remain on the balance sheet
The cover pool may consist of certain mortgage credits, public credits and supplemental assets. There is no requirement to segregate mortgage and public credits.
Maximum LTVs: Residential 75%, Agricultural 70%, Commercial 60%
Maximum 10% commercial loans and 20% supplemental assets in cover pool
Regular monitoring of the property values, revaluation of property prices in case of significant drop (generally interpreted as 15% drop)
No mandatory over-collateralisation (OC)
Regional constraint on collateral assets (Mortgage - EEA, Public - OECD)
The cover pool value shall always exceed the aggregate value of claims (including derivatives)
A sound balance in terms of FX, interest rates and maturities must be achieved. It is deemed to exist when the present value of the cover pool at all times exceed the present value of liabilities (including derivatives), even on a stressed basis. Present value cover must hold even after 1% upward and downward shift in the yield curve and a 10% change in the currency
Non-performing assets in the cover pool which are more than 60 days overdue must be disregarded for the purposes of the matching tests
Holders of covered bonds and relevant derivative counterparties benefit from a priority claim over the cover pool should the institution be declared bankrupt and rank pari passu ahead of unsecured creditors and all other creditors of the institution in respect of assets in the cover pool
The registered assets in the cover pool, the covered bonds and any relevant derivative contracts are required to be maintained as a unit and kept segregated from other assets and liabilities of the bankruptcy estate of the institution. The administrators-in-bankruptcy are then required to procure the continued timely service of payments due under the covered bonds and any relevant derivative contracts
Overview of the Swedish covered bond legislation
71
Swedish covered bond legislation
Loan-to-value ratios and other limitations
Matching requirements
Benefit of a priority right over the cover pool
Administration in event of bankruptcy
The Covered Bond Act
Source: www.ascb.se
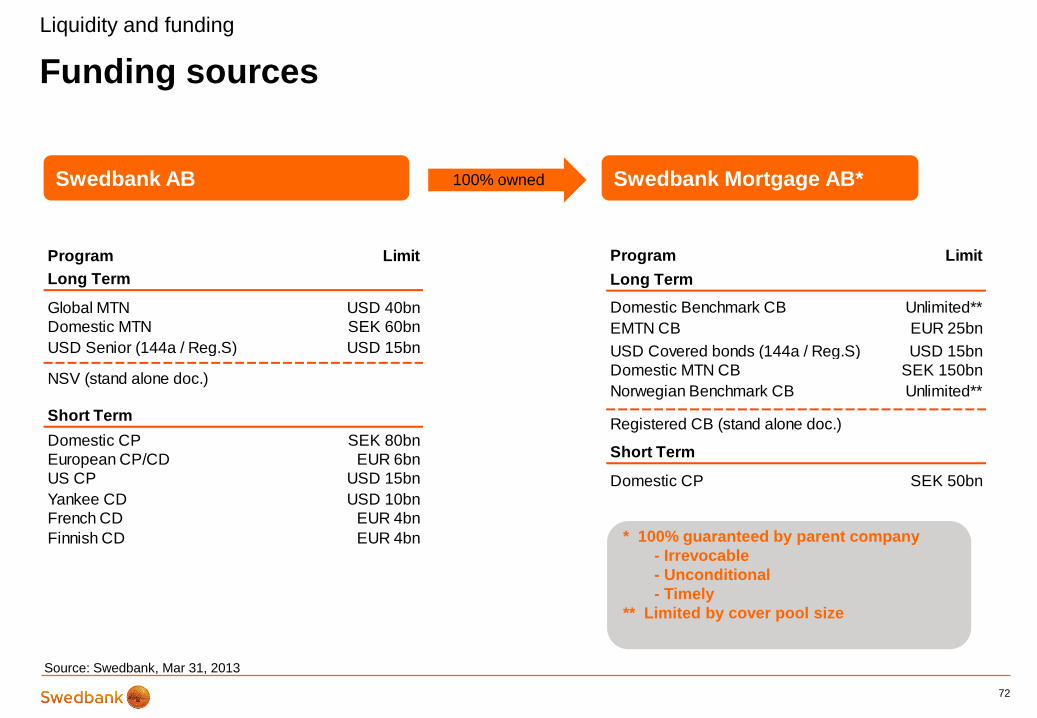
Funding sources
72
Swedbank AB Swedbank Mortgage AB*
* 100% guaranteed by parent company
- Irrevocable
- Unconditional
- Timely
** Limited by cover pool size
100% owned
Liquidity and funding
Source: Swedbank, Mar 31, 2013
Program Limit
Long Term
Global MTN USD 40bn
Domestic MTN SEK 60bn
USD Senior (144a / Reg.S) USD 15bn
NSV (stand alone doc.)
Short Term
Domestic CP SEK 80bn
European CP/CD EUR 6bn
US CP USD 15bn
Yankee CD USD 10bn
French CD EUR 4bn
Finnish CD EUR 4bn
Program Limit
Long Term
Domestic Benchmark CB Unlimited**
EMTN CB EUR 25bn
USD Covered bonds (144a / Reg.S) USD 15bn
Domestic MTN CB SEK 150bn
Norwegian Benchmark CB Unlimited**
Registered CB (stand alone doc.)
Short Term
Domestic CP SEK 50bn

Swedish economy
73

74
Swedish economy
• Real economic growth declined to 1.2% in 2012 from 3.7% the
year before. Despite the slowdown, economic activity held up
surprisingly well in the last two quarters of the year, and labour
market developments were supported by a stronger-than-
expected employment growth
• We expect GDP growth to remain weak in the first half of 2013
before picking up steam. Overall, for 2013 and 2014, we
forecast real growth at 1.6% and 2.7%, respectively. In
particular, household consumption will drive growth, and
economic policy will remain expansionary.
• In 2012, economic growth decelerated to 3.2%, primarily due
to weakened foreign demand and the contraction of export-
oriented manufacturing. Growth was primarily driven by public
investments in buildings and infrastructure, financed by EU
transfers and CO2 quota sales.
• Boosted mainly by domestic demand, GDP growth is expected
to reach 3.3% in 2013 and accelerate to 4.2% next year, with
additional support from exports. Investment growth will
decelerate as government investments will decrease. Private
consumption will contribute the most to economic growth.
• The economy expanded by 5.6% in 2012, driven by exports
and stronger domestic demand. Inflation has slowed sharply
as domestic price pressures are weak and global price
dynamics benign. Latvia has applied for euro area
membership and is expected to join it on January 1, 2014
• The GDP growth forecast for 2013 is raised to 4.3% (4.1%
before) as lower inflation will support private spending.
Inflation is revised down to 1.1% this year but will pick up to
3.5% in 2014. GDP growth will speed up to 5% in 2014, as the
global outlook improves and the personal income tax rate is
cut.
• Growth remained strong at the end of last year, mainly due to
booming exports. Companies postponed some of their
investments and slashed inventories, but we do not expect
this trend to continue. Last year, for the first time, foreign trade
was in surplus.
• We keep our GDP growth forecast at 4.0% for both 2013 and
2014. Real net wages are expected to grow faster this year
and the next, due to lower inflation and likely lower labour tax
rates. We have cut the inflation forecast for 2013 to 2.5%, but
euro accession is far from certain.
Sweden
Estonia
Latvia
Lithuania
Source: Swedbank Economic outlook, Apr 10, 2013

Government debt
• Around 15% in foreign currencies
Swedish economy
SEKbn 2011 2012F 2013F
Government debt in the beginning of the year 1188 1158 1167
Primary financing need excluding sell-off's -79 6 -4
Sale of government assets -23 0 0
Interest cost on government debt 34 26 19
Net financing need -68 32 15
Corrections of debt 22 -6 4
Money-market assets (annual change) 16 -17 0
Government debt change -30 10 19
Government debt at year end 1158 1167 1186
0
10
20
30
40
50
60
70
80
90
1990
1991
1992
1993
1994
1995
1996
1997
1998
1999
2000
2001
2002
2003
2004
2005
2006
2007
2008
2009
2010
2011
2012F
2013F
Debt to GDP ratio, % – historic distribution Government net financing need
Source: Swedish National Debt Office, Jul 2012
-8
-6
-4
-2
0
2
4
6
8
10
1995 1998 2001 2004 2007 2010
0
1 000 000
2 000 000
3 000 000
4 000 000
5 000 000
6 000 000
Resources Expenditures
Import
GDP
Gross investments
Public consumption
Privat consumption
Export
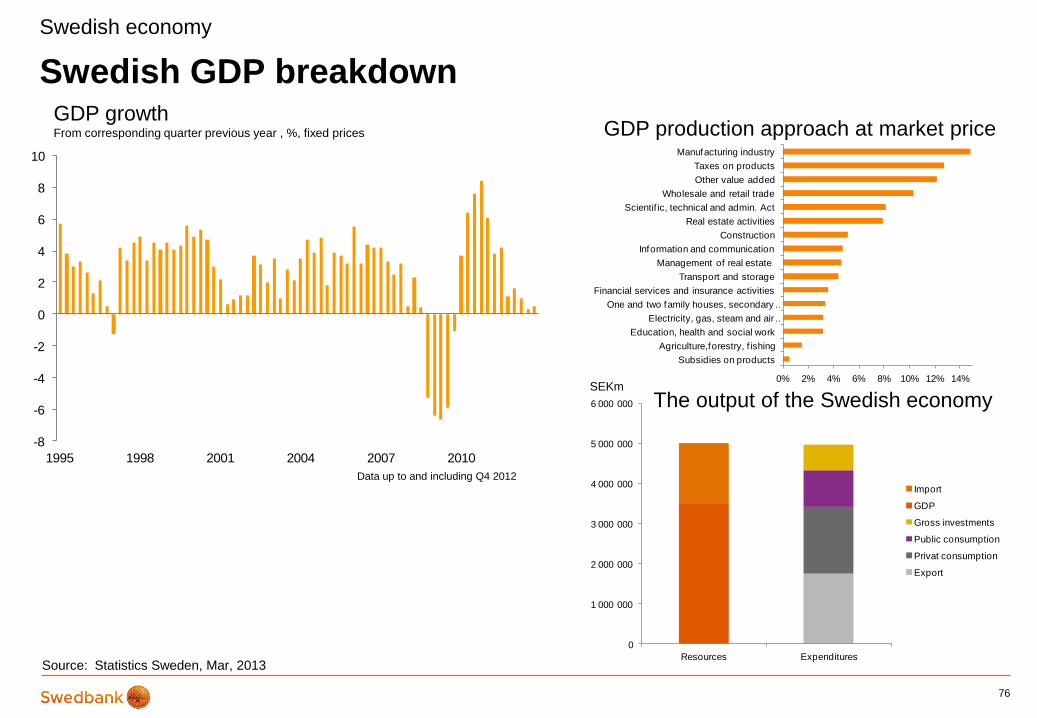
Swedish GDP breakdown
76
Swedish economy
Source: Statistics Sweden, Mar, 2013
GDP growth From corresponding quarter previous year , %, fixed prices
Data up to and including Q4 2012
0% 2% 4% 6% 8% 10% 12% 14%
Subsidies on products
Agriculture,forestry, f ishing
Education, health and social work
Electricity, gas, steam and air …
One and two family houses, secondary …
Financial services and insurance activities
Transport and storage
Management of real estate
Information and communication
Construction
Real estate activities
Scientif ic, technical and admin. Act
Wholesale and retail trade
Other value added
Taxes on products
Manufacturing industry
GDP production approach at market price
The output of the Swedish economy SEKm
Housing and mortgage market
77

Mortgage loans – risk-adjusted returns before volume
• Risk reduction – a long-term necessity
─ Price
─ Loan-to-value
─ Amortization
• Market shares
─ Risk-adjusted returns before volume
─ Defend business position
78
Swedish housing and mortgage market
Mortgage margins
0
10
20
30
40
Dec-0
5
Jun-0
6
Dec-0
6
Jun-0
7
Dec-0
7
Jun-0
8
Dec-0
8
Jun-0
9
Dec-0
9
Jun-1
0
Dec-1
0
Jun-1
1
Dec-1
1
Jun-1
2
Dec-1
2
Swedbank's share of monthly
growth
Share of housing lending
balance (Sweden statistics) 0.0%
0.2%
0.4%
0.6%
0.8%
1.0%
1.2%
Jan-0
8
Mar-
08
May-0
8
Jul-08
Sep
-08
No
v-0
8
Jan-0
9
Mar-
09
May-0
9
Jul-09
Sep
-09
No
v-0
9
Jan-1
0
Mar-
10
May-1
0
Jul-10
Sep
-10
No
v-1
0
Jan-1
1
Mar-
11
May-1
1
Jul-11
Sep
-11
No
v-1
1
Jan-1
2
Mar-
12
May-1
2
Jul-12
Sep
-12
No
v-1
2
Jan-1
3
Private, back-book of which f loating of which f ixed
Private net mortgage lending market share
Jan 2008 – Dec 2012, %
Source: Swedbank, Mar 31, 2013
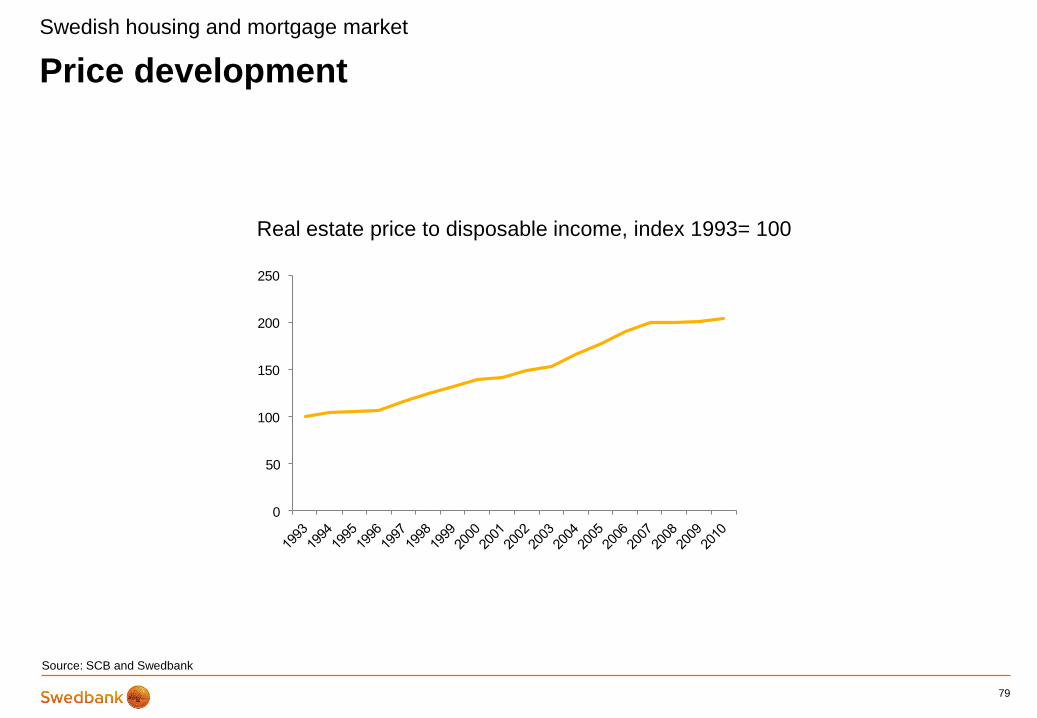
Price development
79
Swedish housing and mortgage market
Source: SCB and Swedbank
Real estate price to disposable income, index 1993= 100
0
50
100
150
200
250

Structural interest rate decline key to affordability
80
Household indebtedness and interest expenditures after tax as
percentage of disposable income
Source: Riksbanken, Financial Stability Report 2012:2, Nov, 2012, chart 3.5
Swedish housing and mortgage market
% %
0
2
4
6
8
10
12
14
16
18
20
22
0
20
40
60
80
100
120
140
160
180
200
220
93 94 95 96 97 98 99 00 01 02 03 04 05 06 07 08 09 10 11 12 13 14 15
Debt ratio (left scale) Interest ratio (right scale)

0
200
400
600
800
1 000
1 200
1 400
1 600
1 800
Jan
-05
Jul-
05
Jan
-06
Jul-
06
Jan
-07
Jul-
07
Jan
-08
Jul-
08
Jan
-09
Jul-
09
Jan
-10
Jul-
10
Jan
-11
Jul-
11
Jan
-12
Jul-
12
Jan
-13
Vilnius
Nr.of deals EUR/m2
0
200
400
600
800
1 000
1 200
1 400
1 600
1 800
Jan
-05
Jul-
05
Jan
-06
Jul-
06
Jan
-07
Jul-
07
Jan
-08
Jul-
08
Jan
-09
Jul-
09
Jan
-10
Jul-
10
Jan
-11
Jul-
11
Jan
-12
Jul-
12
Jan
-13
Riga
Nr.of deals EUR/m2
Baltic countries
81
Real estate prices
Source: Land book database
0
200
400
600
800
1000
1200
1400
1600
1800
Jan
-05
Jul-
05
Jan
-06
Jul-
06
Jan
-07
Jul-
07
Jan
-08
Jul-
08
Jan
-09
Jul-
09
Jan
-10
Jul-
10
Jan
-11
Jul-
11
Jan
-12
Jul-
12
Jan
-13
Tallinn
Nr.of deals EUR/m2
Source: Swedbank, Estonian Land Board
Source: Swedbank, State Enterprise Centre of Registers
LTV-distribution, %
Q1 2013 Q4 2011 Q4 2010
Estonia 67 75 86
Latvia 133 149 161
Lithuania 91 96 97
Swedish Riksbank’s Financial Stability Report
82

Transparency index for liquidity reporting, European banks
83
Swedish Riksbank’s financial stability report
0 20 40 60 80 100
Handelsbanken
Nordea
SEB
Swedbank
Note. The transparency index specifies the quality and scope of the banks' public reporting of liquidity risks. The higher the higher the level, the higher the quality and scope. The grey bars
represent global banks. The chart shows the Swedish banks and a sample of European banks (grey bars).
Source: The Riksbank’s Financial Stability Report 2013:1, chart 1:4
Report NSFR
at least once
a quarter
Handelsbanken Nordea SEB Swedbank
Financial
Stability
Report
2013:1
Minimum level observed
Partly observed
Not observed
Table 1:3 Public reporting of NSFR

Core Tier 1 capital ratio according to Basel II
84
Swedish Riksbank’s financial stability report
0 5 10 15 20
Crédit Agricole
RBS
Banco Santander
Raif feisen
Société Générale
Barclays
BBVA
UniCredit
Intesa Sanpaolo
DNB
Deutsche Bank
BNP Paribas
Lloyds
Commerzbank
HSBC
Nordea
Danske Bank
SEB
Credit Suisse
Swedbank
Handelsbanken
UBS
Source: The Riksbank’s Financial Stability Report 2013:1, chart 1:6
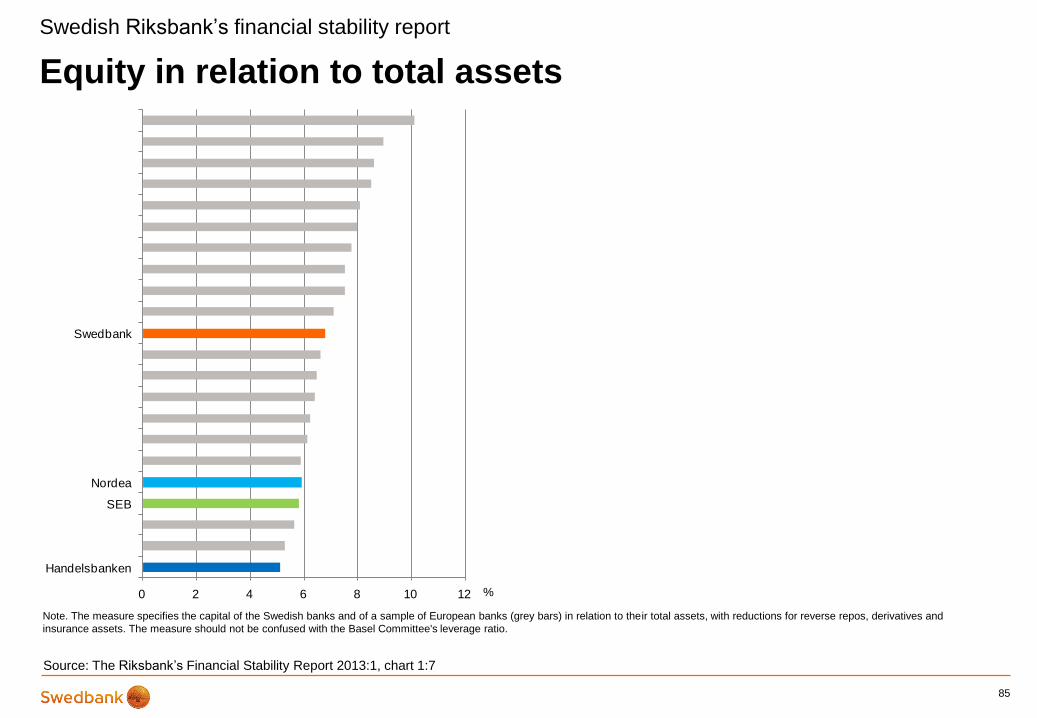
Equity in relation to total assets
85
Swedish Riksbank’s financial stability report
0 2 4 6 8 10 12
Handelsbanken
SEB
Nordea
Swedbank
%
Source: The Riksbank’s Financial Stability Report 2013:1, chart 1:7
Note. The measure specifies the capital of the Swedish banks and of a sample of European banks (grey bars) in relation to their total assets, with reductions for reverse repos, derivatives and
insurance assets. The measure should not be confused with the Basel Committee's leverage ratio.

CET1 ratios according to Basel III
86
Swedish Riksbank’s financial stability report
Note. The CET 1 ratios are stated according to the Riksbank's own calculations in accordance with the Basel III Accord. On 1 January 2013, the revised accounting standard IAS 19 "Compensation
to employees" were implemented. The revision primarily refers to defined pension plans and entails the reporting of accumulated actuarial gains and losses directly against equity, which may have
effects on reported CET 1 ratios.
Source: The Riksbank’s Financial Stability Report 2013:1, chart 1:12
%
0
2
4
6
8
10
12
14
16
18
20
Handels-banken
Nordea SEB Swedbank
March 2012
June 2012
September 2012
December 2012
March 2013
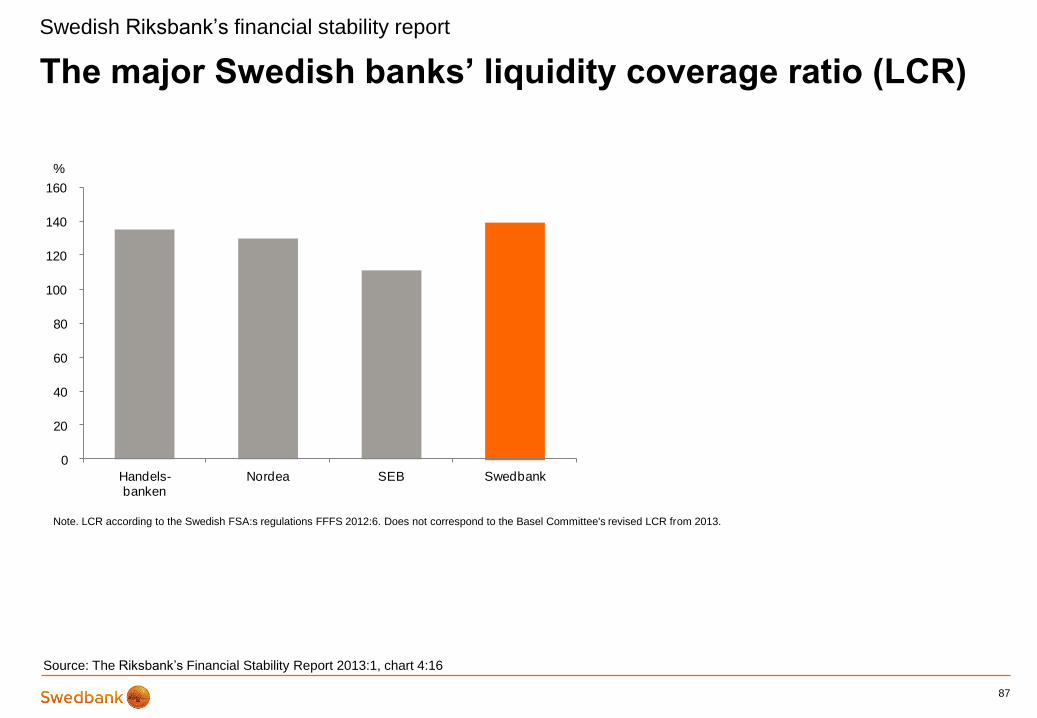
The major Swedish banks’ liquidity coverage ratio (LCR)
87
Swedish Riksbank’s financial stability report
0
20
40
60
80
100
120
140
160
Handels-banken
Nordea SEB Swedbank
%
Source: The Riksbank’s Financial Stability Report 2013:1, chart 4:16
Note. LCR according to the Swedish FSA:s regulations FFFS 2012:6. Does not correspond to the Basel Committee's revised LCR from 2013.

The Riksbank’s structural liquidity measure
88
Swedish Riksbank’s financial stability report
0
20
40
60
80
100
120
Handels-banken
Nordea SEB Swedbank
December 2010
December 2011
December 2012
%
Source: The Riksbank’s Financial Stability Report 2013:1, chart 4:17
Note. For a detailed description of the Riksbank’s structural liquidity measure, see Method for stress tests of the banks liquidity risks. Article in Financial Stability Report 2010:2. Sveriges
Riksbank.
0
20
40
60
80
100
120
140
160
180
70 80 90 100 110 120 130 140
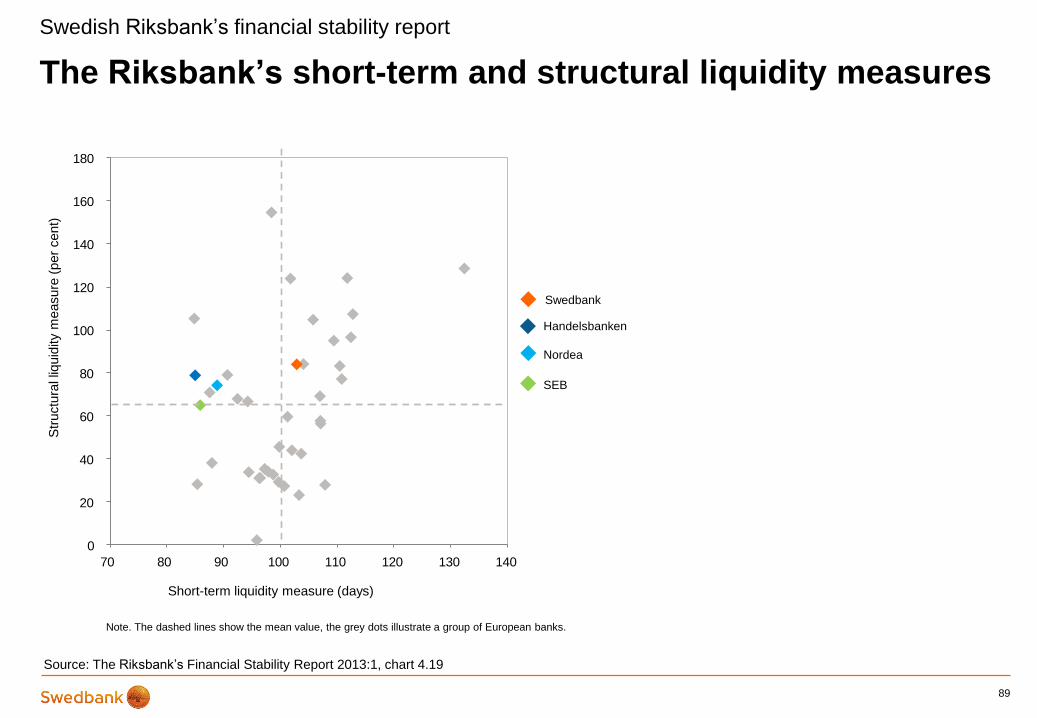
The Riksbank’s short-term and structural liquidity measures
89
Swedish Riksbank’s financial stability report
Swedbank
Handelsbanken
Nordea
SEB
Source: The Riksbank’s Financial Stability Report 2013:1, chart 4.19
Short-term liquidity measure (days)
Str
uctu
ral liq
uid
ity m
easure
(per
cent)
Note. The dashed lines show the mean value, the grey dots illustrate a group of European banks.
0
2
4
6
8
10
12
14
16
18
20
Q1 13
13 14 15 Q1 13
13 14 15 Q1 13
13 14 15 Q1 13
13 14 15
Handelsbanken Nordea SEB Swedbank
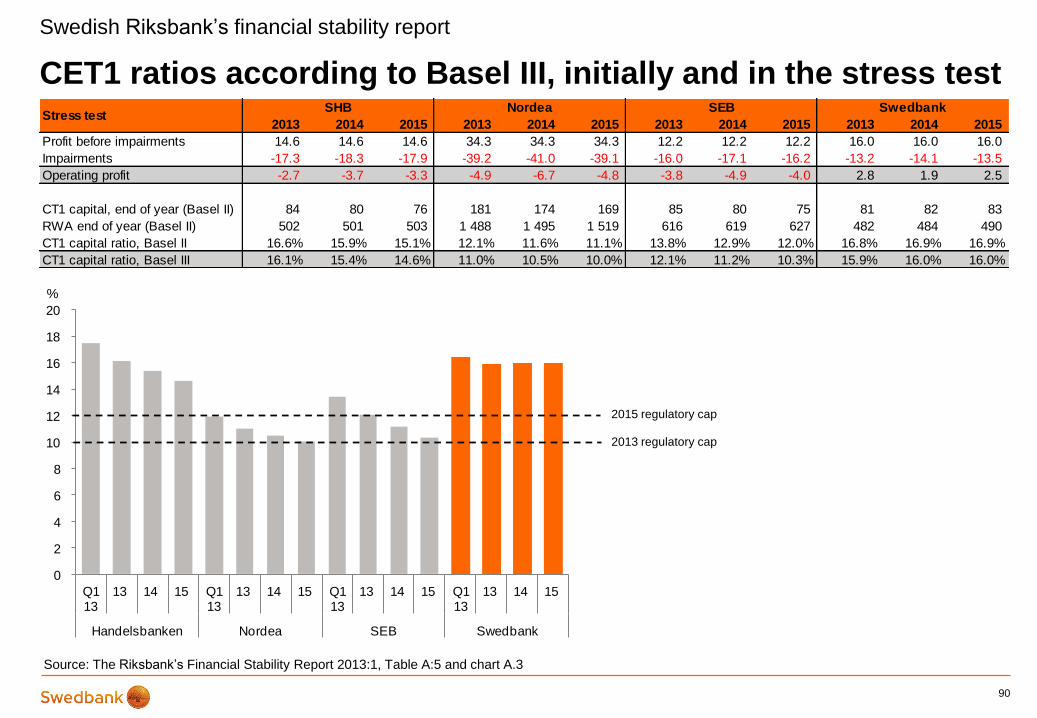
CET1 ratios according to Basel III, initially and in the stress test
90
Swedish Riksbank’s financial stability report
Source: The Riksbank’s Financial Stability Report 2013:1, Table A:5 and chart A.3
%
2013 2014 2015 2013 2014 2015 2013 2014 2015 2013 2014 2015
Profit before impairments 14.6 14.6 14.6 34.3 34.3 34.3 12.2 12.2 12.2 16.0 16.0 16.0
Impairments -17.3 -18.3 -17.9 -39.2 -41.0 -39.1 -16.0 -17.1 -16.2 -13.2 -14.1 -13.5
Operating profit -2.7 -3.7 -3.3 -4.9 -6.7 -4.8 -3.8 -4.9 -4.0 2.8 1.9 2.5
CT1 capital, end of year (Basel II) 84 80 76 181 174 169 85 80 75 81 82 83
RWA end of year (Basel II) 502 501 503 1 488 1 495 1 519 616 619 627 482 484 490
CT1 capital ratio, Basel II 16.6% 15.9% 15.1% 12.1% 11.6% 11.1% 13.8% 12.9% 12.0% 16.8% 16.9% 16.9%
CT1 capital ratio, Basel III 16.1% 15.4% 14.6% 11.0% 10.5% 10.0% 12.1% 11.2% 10.3% 15.9% 16.0% 16.0%
SHB Nordea SEB SwedbankStress test
2015 regulatory cap
2013 regulatory cap