swampscott elementary schools mcas results 2010
DESCRIPTION
Swampscott Elementary Schools MCAS Results 2010. Grade 3 ELA. Grade 4 ELA. Grade 3 Math. Grade 4 Math. Strengths Consistently perform above the state average in A/P combined in ELA over 4 year period and above the state average for A/P in Math except for 2008 - PowerPoint PPT PresentationTRANSCRIPT

Swampscott Elementary Schools
MCAS Results 2010
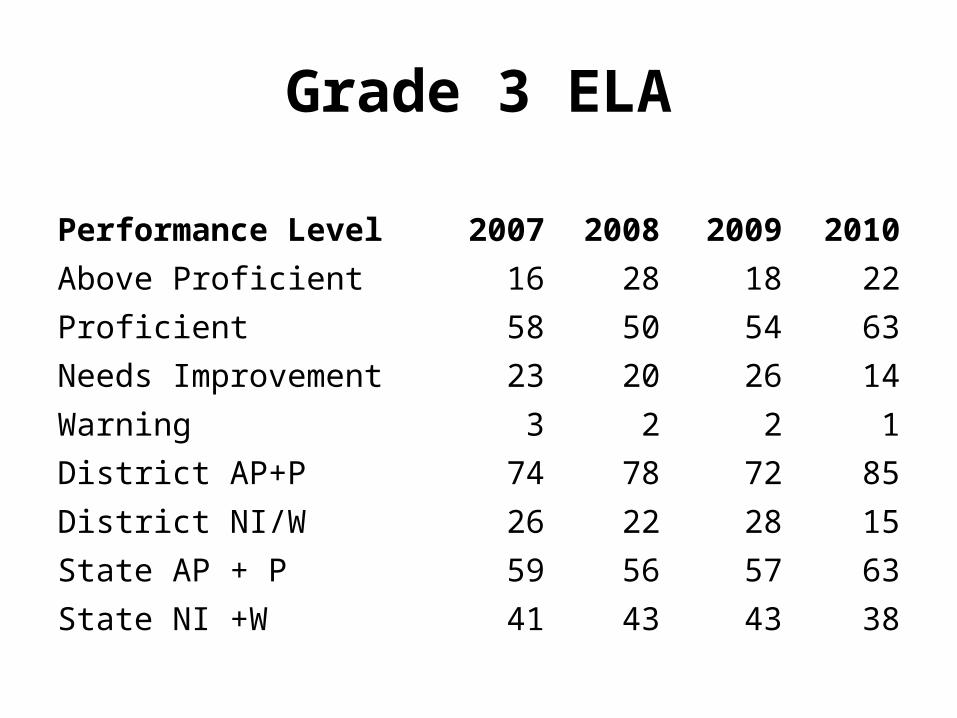
Grade 3 ELA
Performance Level 2007 2008 2009 2010
Above Proficient 16 28 18 22
Proficient 58 50 54 63
Needs Improvement 23 20 26 14
Warning 3 2 2 1
District AP+P 74 78 72 85
District NI/W 26 22 28 15
State AP + P 59 56 57 63
State NI +W 41 43 43 38

Grade 4 ELA
Performance Level 2007 2008 2009 2010
Advanced 17 12 20 18
Proficient 58 52 53 51
Needs Improvement 24 31 23 30
Warning 1 5 4 1
District A+P 75 64 73 69
District NI/WF 25 36 27 31
State AP + P 56 49 54 54
State NI +W 44 52 46 47

Grade 3 Math
Performance Level 2007 2008 2009 2010
Above Proficient 20 26 22 38
Proficient 44 47 35 53
Needs Improvement 26 23 35 7
Warning 10 3 8 2
District AP+P 64 73 57 91
District NI/W 36 26 43 9
State AP + P 60 61 60 65
State NI +W 40 39 40 35

Grade 4 Math
Performance Level 2007 2008 2009 2010
Advanced 29 21 13 17
Proficient 36 27 41 38
Needs Improvement 29 43 42 41
Warning 6 9 4 4
District A+P 65 48 54 55
District NI/WF 35 52 46 45
State AP + P 48 49 48 48
State NI +W 52 51 52 52

Strengths• Consistently perform above the state average in A/P
combined in ELA over 4 year period and above the state average for A/P in Math except for 2008
• Consistently below the state average in NI/W for ELA over 4 year period and below the state average in NI/W except 09 grade 3 and 08 grade 4
• Significant improvement (34 % points) in 2010 Grade 3 Math

Challenges
• Continue to work on Math performance across all 3 schools including Math tutoring in the Title 1 Schools and MCAS prep imbedded in daily instruction and homework in all schools
• Spiral instruction in the skills that were demonstrated weakness areas in 2010 tests
• Continue to work on Open Response Questions in both Math and ELA to give students exemplars and strategies to achieve responses that earn 3’s and 4’s
• Continue to use multiple assessment tools to determine skill levels and groupings for instruction and progress monitor students’ results to target instruction
• Continue to assist teachers and administrators in disaggregating data, perform item analysis and apply training on data driven decision making to increase their proficiency in using data to inform instruction and interventions

Swampscott Middle School
MCAS Results 2010

Grade 5 ELA
Performance Level 2007 2008 2009 2010
Advanced 23 17 15 18
Proficient 57 57 61 59
A/P Combined 80 74 76 77
Needs Improvement 18 25 20 20
Warning 1 1 5 3
NI/W Combined 19 26 25 23
State A/P 63 61 63 69
State NI/W 37
39 37 38

Grade 6 ELA
Performance Level 2007 2008 2009 2010
Advanced 8 27 22 19
Proficient 71 61 56 63
A/P Combined 79 88 78 82
Needs Improvement 16 12 16 14
Warning 4 1 6 3
NI/W Combined 20 13 22 17
State A/P 67 67 66 69
State NI/W 33 32 33 30

Grade 7 ELA
Performance Level 2007 2008 2009 2010
Advanced 8 13 15 13
Proficient 69 65 74 71
A/P Combined 77 78 89 84
Needs Improvement 18 18 11 12
Warning 6 4 0 3
NI/WF Combined 24 22 11 15
State A/P 69
69 70 72
State NI/W 31
31 30 28

Grade 8 ELA
Performance Level 2007 2008 2009 2010
Advanced 19 17 21 26
Proficient 71 68 68 70
A/P Combined 90 85 89 96
Needs Improvement 9 12 8 4
Warning 2 3 3 1
NI/WF Combined 11 15 11 5
State A/P 78
75 78 78
State NI/W
24
25 21 23

Grade 5 Math
Performance Level 2007 2008 2009 2010
Advanced 14 20 19 20
Proficient 40 38 31 40
A/P Combined 54 58 50 60
Needs Improvement 41 28 32 26
Warning 5 14 18 15
NI/WF Combined 46 22 50 41
State A/P 51 52 54 55
State NI/W 51
52 54 45
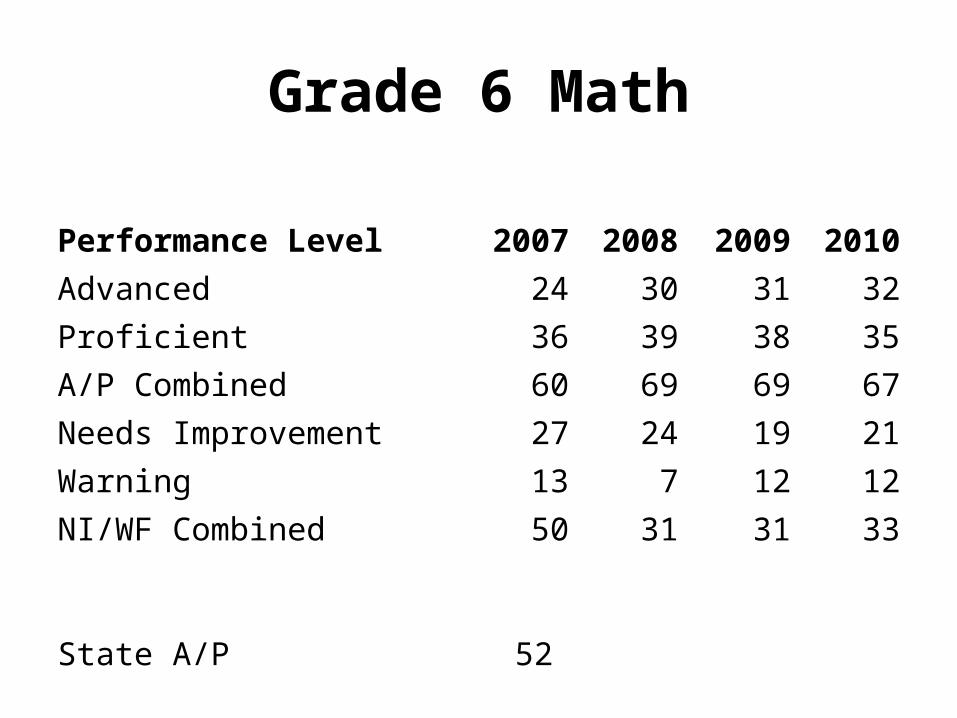
Grade 6 Math
Performance Level 2007 2008 2009 2010
Advanced 24 30 31 32
Proficient 36 39 38 35
A/P Combined 60 69 69 67
Needs Improvement 27 24 19 21
Warning 13 7 12 12
NI/WF Combined 50 31 31 33
State A/P
52 54 57 59
State NI/W 48 44
43 41

Grade 7 Math
Performance Level 2007 2008 2009 2010
Above Proficient 18 19 21 13
Proficient 43 35 39 52
A/P Combined 61 54 60 65
Needs Improvement 28 29 30 22
Warning 13 18 9 13
NI/WF Combined 41 47 39 35
State A/P 69
69 39 53
State NI/W 31
31 39 46
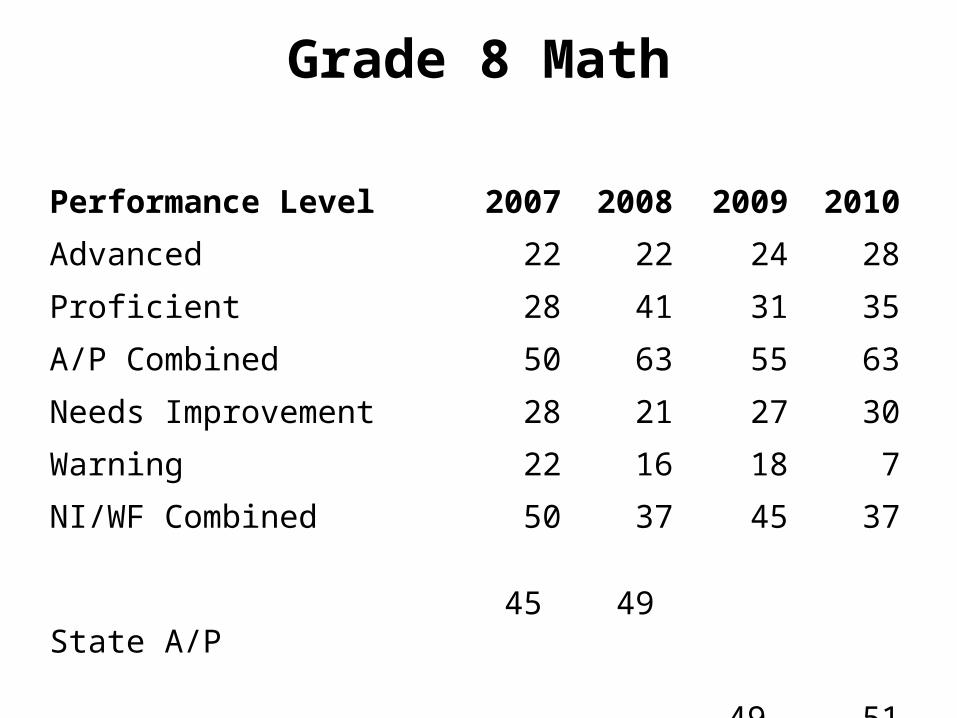
Grade 8 Math
Performance Level 2007 2008 2009 2010
Advanced 22 22 24 28
Proficient 28 41 31 35
A/P Combined 50 63 55 63
Needs Improvement 28 21 27 30
Warning 22 16 18 7
NI/WF Combined 50 37 45 37
State A/P
45
49 49 51
State NI/W 55 51
51 49

Grade 5 SMS Science MCAS Performance Scores
Performance Level 2007 2008 2009 2010
Advanced 12 13 17 13
Proficient 41 40 38 47
A/P Combined 53 53 55 60
Needs Improvement 45 40 37 36
Warning 3 8 9 4
NI/WF Combined 48 48 46 40
State A/P
51
50 49 53
State NI/W
49
50 49 47

Grade 8 SMS Science and Tech Performance Scores
Performance Level 2007 2008 2009 2010
Advanced 2 4 5 7
Proficient 33 52 53 53
A/P Combined 35 56 58 60
Needs Improvement 52 36 34 35
Warning 14 9 8 5
NI/WF Combined 66 45 42 40
State AP
33 39 39 40
State NI/W 68
61 61 60
Strengths:
• SMS performs fairly consistently in all subject areas tested• SMS performs in A/P above the state average in most areas• SMS performs in NI/W below the state average in most areas• SMS 8 Grade Science scores although still in need of
improvement have increased in A/P over the 4 years by 25% points and declined in NI/W by 26 points. This was largely due to the development of the Tech Engineering program 3 years ago which is heading us in the right direction.

Challenges:
• Grade 5 A/P for Math was below the state A/P in 2009
• Grade 7 A/P for Math was below the state A/P in 2007 and 2008 but significantly above in 2009 and 2010
• Grade 7 Math was above the state NI/W in 2007 and 2008

Challenges/ InterventionsPoor performance in Math being addressed in
the Math Intervention Program through additional time on Math
All Grade 5 students are getting 50 minutes of Math everyday
Continue to work on improving Open Response question skills for all 3 subject areas
Grade 5 science curriculum being reviewed
Swampscott High School
MCAS Results 2010

Grade 10 ELA
Performance Level 2007 2008 2009 2010Advanced 35 29 43 29Proficient 46 58 49 59A/P Combined 81 87 92 88Needs Improvement 13 12 6 11Warning 5 1 2 2NI/ WF Combined 18 13 8 13State A/P Combined 71 75 79 78State NI/W Combined 30 25 21 22

Grade 10 Math
Performance Level 2007 2008 2009 2010Advanced 50 53 57 61Proficient 26 25 27 25A/P Combined 76 78 84 86Needs Improvement 16 18 14 12Warning 7 4 2 3NI/WF Combined 23 22 16 15State AP + P 68 77 75 75State NI + W 31 28 26 24
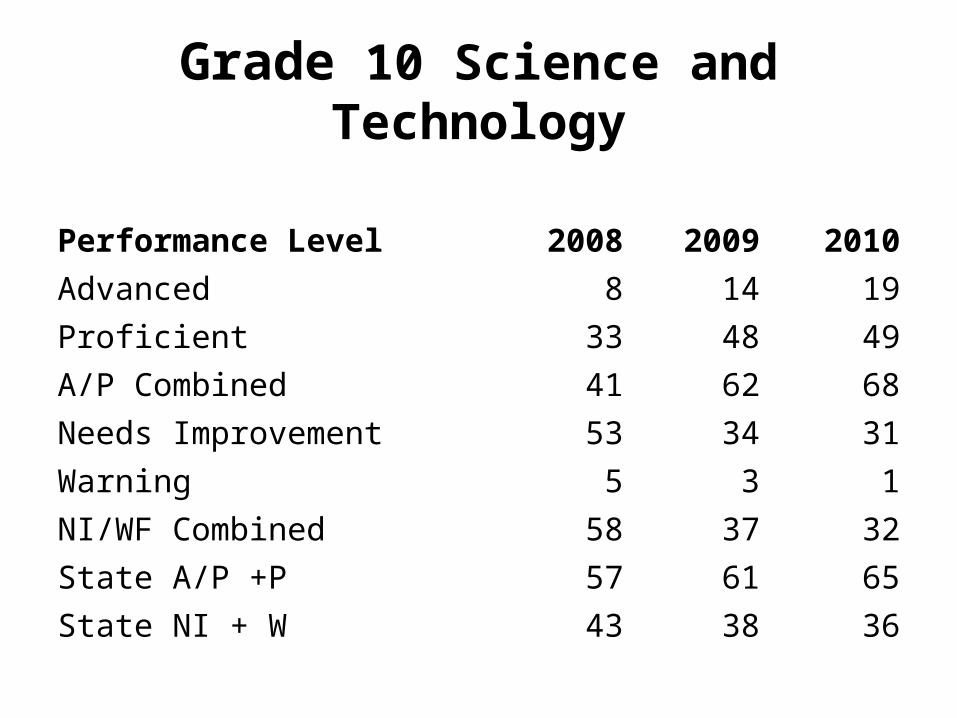
Grade 10 Science and Technology
Performance Level 2008 2009 2010Advanced 8 14 19Proficient 33 48 49A/P Combined 41 62 68Needs Improvement 53 34 31Warning 5 3 1NI/WF Combined 58 37 32State A/P +P 57 61 65State NI + W 43 38 36

Strengths
• Scores are consistently above the state level for A/P combined in ELA and Math and now for Science
• Scores are consistently below the state average for NI/F
• Scores on the whole demonstrate improvement over the 4 year period with some fluctuations in the last 3 years

Challenges
• ELA 10 scores regressed in the Advanced performance level in 2010
• Despite significant improvements in Science Swampscott is barely above the state average in A/P and barely below the state average in NI/W