swamp - state water resources control board
TRANSCRIPT

F O R T H E S U R F A C E W A T E R A M B I E N T M O N I T O R I N G P R O G R A M I N T H E
C O L O R A D O R I V E R B A S I N R E G I O N
P R O J E C T P L A N
FY 03-04
Prepared by
Basin Planning Section
California Regional Water Quality Control Board Colorado River Basin Region
UPDATED MARCH 2004

2
1. INTRODUCTION
FY 2003-04 goals and objectives for the Regional Water Quality Control Board for the Colorado River Basin Region (Region 7) are to build upon FY 2002-03 progress, refine the program, and ensure that quality information is collected to satisfy state and regional
SWAMP is implemented in each hydrologic area of the state over a five-year rotational period. The State Board allowed flexibility in monitoring design when delegating implementation to Regional Boards. Regional Boards may conduct special studies in areas that merit collection of ambient data.
Regional monitoring provides the SWRCB and RWQCBs with a better picture of the water quality outcome of their programs. The monitoring program is focused on the State’s surface waters that fully or partially supports associated beneficial uses. SWAMP provides the foundation for the reporting and listing requirements of the Clean Water Act (CWA) sections 305 (b) and 303 (d) and is the basis for the development and implementation of Total Maximum Daily Load (TMDL).
The California Legislature also is very interested in establishing a closer link between budgeted water quality program activities and the impact those activities have on protecting and improving water quality. The Supplemental Report Language to the 1999 Budget Act directed the SWRCB to “… develop performance measures for its core regulatory programs …. that relate directly to water quality outcomes ….” Since 1995, the SWRCB has used several performance objectives and measures for its programs. The measures generally are output-related and designed to measure program efficiency and timeliness. These measures include: (a) percent of total inspections completed versus the number of permitted sites, (b) number of Cleanup and Abatement Orders (CAOs), and (c) median time required to issue new National Pollutant Discharge Elimination System (NPDES) permits and Waste Discharge Requirements (WDRs). Historically, however, the ability to relate directly the performance of their programs to water quality outcomes has been hampered by limited data management capabilities and fragmented and incomplete water quality monitoring data collection, evaluation, and management.
The Surface Water Ambient Monitoring Program (SWAMP) is implemented by the State Water Resources Control Board (SWRCB) to develop a statewide and regionwide picture of the status and trends of the quality of California’s surface water resources. Monitoring is needed to define the larger scale condition of beneficial uses of surface waters in the state. State and regional monitoring can determine if known local impacts can be observed over large distances. Monitoring also allows the assessment of regionwide or statewide water resource conditions. Regional monitoring helps the SWRCB and Regional Water Quality Control Boards (RWQCBs or Regional Boards) determine clearly the effectiveness of the State’s water quality control program. The ambient monitoring program provides physical, chemical, and biological information on water bodies for which the State has limited or no water quality data. The monitoring program also establishes the effects of diffuse pollution sources and determines baseline conditions of potentially clean areas.
1.1 BACKGROUND

3
SWAMP information will be used to support Basin Planning activities and objectives, and will complement other past and present studies conducted in the Region. SWAMP will provide a comprehensive view of changes that occur with BMT implementation and will help with TMDL development. Collected information also will support listing and de-listing of impaired surface waters.
For the remaining of FY 03-04, efforts will concentrate on the New and the Alamo Rivers. The New River already has two TMDLs under implementation: Sedimentation/Siltation and Bacteria Indicators TMDLs. The Alamo River has the Sedimentation/Siltation TMDL under implementation Best Management Techniques (BMTs) to control silt runoff will be used within the next five years. Ambient monitoring information collected now and during implementation will be used to measure BMT effectiveness in reducing silt and other constituents of concern that are transported with silt.
For FY 2002-03, Regional Board staff selected 13 strategic regional sampling locations to implement the updated plan. The strategic sites are along the Lower Colorado River, New River, Alamo River, Whitewater River, and Salton Sea, which are the five surface water bodies of major interest in the Region. These water bodies are the focus on priority TMDLs for sediments, nutrients, selenium, pesticides, and pathogens. Physical, chemical, and biological parameters (water quality indicators) will be collected during the FY 03-04.
needs. Region 7 has developed and updated work plan that coordinates existing monitoring efforts to ensure funding accountability and to complete task orders. This updated work plan is a document detailing regional and site-specific SWAMP plans and procedures for FY 2003-04. The plan is based on projected funding and estimated costs from previous years, and may not reflect actual costs.

4
2. BASIN REGION DESCRIPTION
2.1 GENERAL DESCRIPTION
The Colorado River Basin Region covers approximately 13 million acres (20,000 square miles) in the southeastern corner of California. It includes all of Imperial County and portions of San Bernardino, Riverside, and San Diego Counties. The Region is bound to the northeast by Nevada; to the east by the Colorado River; to the south by Mexico; to the west by the Laguna, San Jacinto, and San Bernardino Mountains; and to the north by the New York, Providence, Granite, Old Dad, Bristol, Rodman, and Ord Mountain Ranges. The Region has 28 recognized major watersheds or “hydrologic units,” and contains water bodies of statewide, national, and international significance (e.g., Salton Sea and Colorado River) (Figure 1). The climate is arid, with zero to five inches of annual precipitation. Seasonal temperatures fluctuate from 120 ºF in summer, to near freezing temperatures in winter.
Figure 1. Colorado River Basin Region and the Basin Planning Areas
The Region can be divided into three watersheds: The Lower Colorado River, Salton Sea Transboundary, and Desert Aquifers. Major surface water bodies geographically define the Lower Colorado River Watershed and Salton Sea Transboundary Watershed. The Desert Aquifers Watershed has little surface water and hundreds of aquifers. The
2.2 WATERSHED DELINEATION
The Anza-Borrego planning area includes the Clark, West Salton Sea, and Anza-Borrego Hydrologic Units. It comprises 1,000 square miles in the southwest corner of the Region, mostly in San Diego and Imperial Counties, with a small segment in Riverside County. The drainage flows to the Salton Sea except for two small areas of internal drainage in Clark and Borrego Valleys in the northwest corner of the planning area.
5
The Coachella Valley planning area contains the Whitewater Hydrologic Unit and the East Salton Sea Hydrologic Unit. It lies almost entirely in Riverside County and covers 1,920 square miles in the west-central portion of the Region. The Whitewater River is the major drainage course in the planning area. There is perennial flow of the Whitewater River in the mountains, but due to diversions and percolation into the basin, the river becomes dry further downstream. The constructed downstream extension of the river channel known as the Coachella Valley Storm Water Channel serves as a drainage way for irrigation return flows, treated community wastewater, and storm runoff. This outfall ultimately flows into the Salton Sea.
The Imperial Valley planning area comprises 2,500 square miles in the southern portion of the Region, almost all of it in the Imperial Valley. Its northerly boundary is along Salton Sea and the Coachella Valley planning area and its south boundary follows the International Boundary with Mexico. Surface waters mostly drain toward the Salton Sea. The Alamo and New Rivers convey agricultural irrigation drainage water from farmlands in the Imperial Valley, surface runoff, and treated municipal and industrial wastewater from the Imperial Valley. The flow in the New River also contains agricultural drainage, treated and untreated wastewater discharges from Mexicali, Baja California, Mexico. The main source of this water is the Lower Colorado River, imported via the All American Canal. The imported water is used for irrigation, industrial purposes, and domestic drinking.
The East Colorado River planning area is bound to the north by Nevada, to the east by the Colorado River (which forms the Arizona-California state line), to the south by Mexico, and to the west by the drainage division of California streams and washes directly tributary to the Colorado River. The area is 200 miles long with a maximum east-west width of 40 miles. The Palo Verde and Bard Valleys are included in this planning area. All drainage flows to the Colorado River except for a minor amount, which flows into the Colorado River aqueduct via Gene Wash and Copper Basin Reservoirs.
The majority of the Region's surface waters are located in the Imperial Valley and East Colorado River planning areas, with a few situated in the Coachella Valley, Lucerne, Anza-Borrego, and Hayfield planning areas (Figure 1). Since the majority of surface waters are in the Imperial Valley and East Colorado River planning areas, the ambient surface water-monitoring program has been focused there.
6
Agricultural drain waters from Imperial Valley comprise over 70% of the freshwater flows to the Salton Sea. Because the Sea is enclosed, salts and nutrients accumulate, and cause eutrophic conditions and other ecological problems. The high salinity cannot be addressed strictly from a regulatory stance; rather, a coordinated approach aimed at stabilizing and/or restoring salinity to levels that maintain beneficial uses and water quality objectives must be implemented.
The Salton Sea Transboundary Watershed encompasses the Coachella and Imperial Valleys. It is the priority watershed for Region 7, containing five of six 303(d)-listed impaired surface water bodies. Water from the Colorado River has created an irrigated agricultural ecosystem throughout this watershed. Wildlife and aquatic species are dependent on habitat created and maintained through the discharge of agricultural return flows. Major water bodies in the watershed include the Salton Sea, Alamo River, New River, Imperial Valley Agricultural Drains, and Coachella Valley Storm Water Channel. San Felipe Creek and Salt Creek also occur in this watershed and provide critical habitat for the endangered desert pupfish. Aquatic and wildlife habitats are designated beneficial uses, among others, in the Region’s Water Quality Control Plan.
Lower Colorado River Watershed is the East Colorado River planning area discussed above that contains the Colorado River, and associated waterbodies.
7
3. MONITORING LOCATIONS, OBJECTIVES, AND ANALYSIS
3.1 MONITORING LOCATIONS
Some monitoring locations were selected based on known or suspected water quality problems that merited in-depth study. Other monitoring locations were selected to provide baseline conditions to which surface waters could be compared.
Regional Board staff prepared sampling location reconnaissance forms, with information such as longitude and latitude, access, directions to sites, photographs, and health and safety precautions. Reconnaissance forms are not to be used in lieu of health and safety planning, and will be provided to field personnel who will collect water and sediment samples.
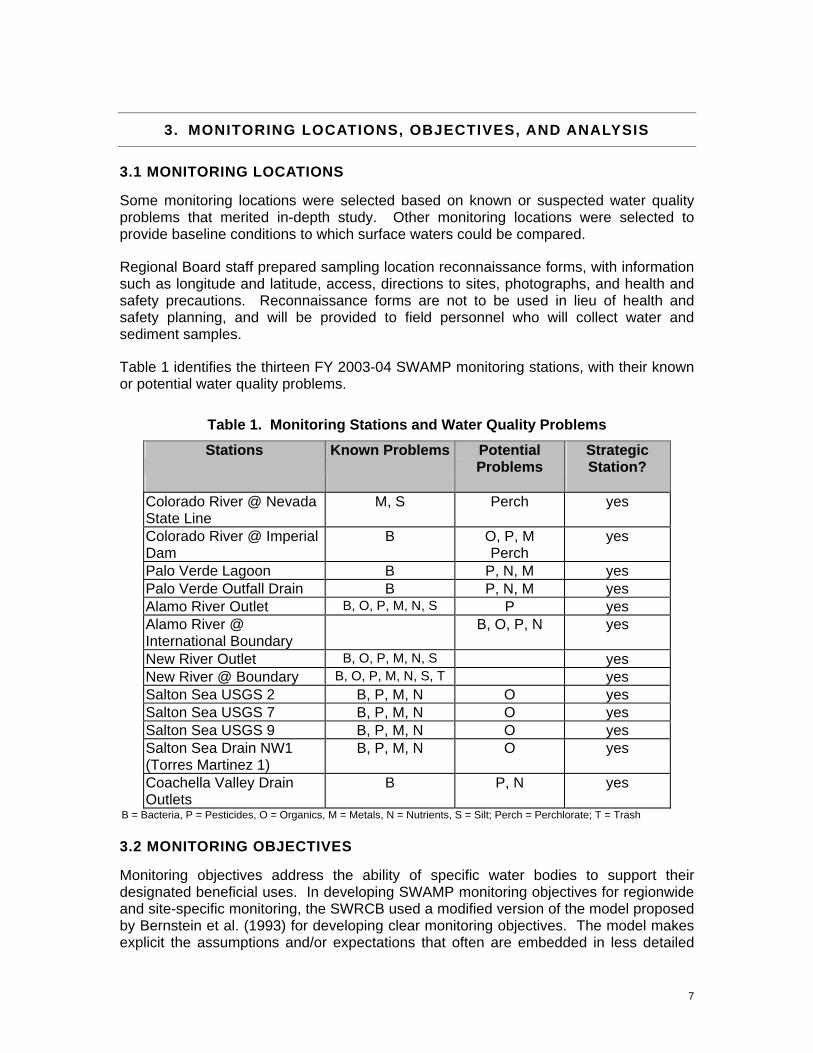
Table 1 identifies the thirteen FY 2003-04 SWAMP monitoring stations, with their known or potential water quality problems.
Table 1. Monitoring Stations and Water Quality Problems
Stations Known Problems Potential Problems
Strategic Station?
Colorado River @ Nevada State Line
M, S Perch yes
Colorado River @ Imperial Dam
B O, P, M Perch
yes
Palo Verde Lagoon B P, N, M yes Palo Verde Outfall Drain B P, N, M yes Alamo River Outlet B, O, P, M, N, S P yes Alamo River @ International Boundary
B, O, P, N yes
New River Outlet B, O, P, M, N, S yes New River @ Boundary B, O, P, M, N, S, T yes Salton Sea USGS 2 B, P, M, N O yes Salton Sea USGS 7 B, P, M, N O yes Salton Sea USGS 9 B, P, M, N O yes Salton Sea Drain NW1 (Torres Martinez 1)
B, P, M, N O yes
Coachella Valley Drain Outlets
B P, N yes
B = Bacteria, P = Pesticides, O = Organics, M = Metals, N = Nutrients, S = Silt; Perch = Perchlorate; T = Trash 3.2 MONITORING OBJECTIVES
Monitoring objectives address the ability of specific water bodies to support their designated beneficial uses. In developing SWAMP monitoring objectives for regionwide and site-specific monitoring, the SWRCB used a modified version of the model proposed by Bernstein et al. (1993) for developing clear monitoring objectives. The model makes explicit the assumptions and/or expectations that often are embedded in less detailed
8
statements of objectives, such as those presented in the SWRCB Report to the Legislature on comprehensive monitoring submitted in February 2000 (SWRCB, 2000). This section is organized by each major question posed in the January 2000 report.
Is it safe to swim? Beneficial Use: Water Contact Recreation (REC I)
1. Throughout water bodies that are used for swimming, estimate the concentration of
pathogenic contaminants above and below screening values, health standards, or adopted water quality objectives.
2. Throughout water bodies that are used for swimming, estimate the percent of beach area that poses potential health risks of exposure to pathogens in streams, rivers, lakes, nearshore waters, enclosed bays, and estuaries using several critical threshold values of potential human impact (e.g., pathogen indicators).
3. Throughout water bodies that are used for swimming, estimate the concentration of bacterial contaminants from month-to-month above and below screening values, health standards, or adopted water quality objectives.
Is it safe to drink the water? Beneficial Use: Municipal and Domestic Water Supply (MUN)
4. Throughout water bodies that are used as a source of drinking water, estimate the
area of lakes, rivers, and streams where the concentration of microbial or chemical contaminants are above and below screening values, drinking water standards, or adopted water quality objectives used to protect drinking water quality.
5. Throughout water bodies that are used as a source of drinking water, estimate the concentration of microbial or chemical contaminants from month-to-month above and below screening values, drinking water standards, or adopted water quality objectives used to protect drinking water quality.
Is it safe to eat fish and other aquatic resources? Beneficial Use: Commercial and Sport Fishing (COMM), Shellfish Harvesting (SHELL)
6. Throughout water bodies that are used for fishing or shellfish harvesting, estimate
the area of streams, rivers, lakes, near-shore waters, enclosed bays, and estuaries where the concentration of chemical contaminants in edible fish or shellfish tissue exceeds several critical threshold values of potential human impact (e.g., screening values or action levels).
7. Throughout water bodies that are used for fishing or shellfish harvesting, assess the geographic extent of chemical contaminants in selected size classes of commonly

9
consumed target species that exceed several critical threshold values of potential human impact (e.g., screening values or action levels) (Adapted from USEPA, 1995).
8. Throughout water bodies that are used for fishing or shellfish harvesting, estimate the concentration of chemical contaminants in fish and aquatic resources from year-to-year using several critical threshold values of potential human impact (advisory or action levels).
9. Throughout water bodies that are used for shellfish harvesting, estimate the concentration of bacterial contaminants from month to month above and below health standards or adopted water quality objectives.
10. Throughout water bodies that are used for shellfish harvesting, estimate the concentration of bacterial contaminants above and below health standards or adopted water quality objectives.
Are aquatic populations, communities, and habitats protected?
Beneficial Use: Cold Freshwater Habitat (COLD); Estuarine Habitat (EST); Inland Saline Water Habitats (SAL); Marine Habitat (MAR); Preservation of Biological Habitats (BIOL); Rare, Threatened or Endangered Species (RARE); Warm Freshwater Habitat (WARM); Wildlife Habitat (WILD)
11. Throughout water bodies that are used by aquatic resources, estimate the percent of degraded water area in rivers, lakes, nearshore waters, enclosed bays, and estuaries using several critical threshold values of toxicity, water or benthic community analysis, habitat condition, and chemical concentration.
12. Throughout water bodies that are used by aquatic resources, estimate the percent of degraded sediment area in rivers, lakes, nearshore waters, enclosed bays, and estuaries using several critical threshold values of toxicity, water column or benthic community analysis, habitat condition, and chemical concentration.
13. Throughout water bodies that are used by aquatic resources, identify the area extent of degraded sediment locations in rivers, lakes, nearshore waters, enclosed bays, and estuaries using several critical threshold values of toxicity, water column or benthic community analysis, habitat condition, and chemical concentration.
14. Throughout water bodies that are used by aquatic resources, estimate the percent of degraded sediment area from year-to-year in rivers, lakes, nearshore waters, enclosed bays, and estuaries using several critical threshold values of toxicity, water column or, benthic community analysis, habitat condition, and chemical concentration.
15. Throughout water bodies that are used by aquatic resources, estimate the percent of degraded water area from year-to-year in rivers, lakes, nearshore waters, enclosed bays, and estuaries using several critical threshold values of toxicity, water column or benthic community analysis, habitat condition, and chemical concentration.

10
Beneficial Use: Spawning, Reproduction and/or Early Development (SPWN)
16. Throughout water bodies that are used by fisheries, estimate the area of degraded spawning locations and water or sediment toxicity associated with toxic pollutants in rivers, lakes, nearshore waters, enclosed bays, and estuaries using critical threshold values of early life-stage toxicity, chemical concentration, and physical characteristics.
17. Throughout water bodies that are used by fisheries, estimate the area degraded spawning locations and water or sediment toxicity associated with toxic pollutants from year-to-year in rivers, lakes, nearshore waters, enclosed bays, and estuaries using critical threshold values of early life-stage toxicity, chemical concentration, and physical characteristics.
Is water flow sufficient to protect fisheries? Beneficial Use: Migration of Aquatic Organisms (MIGR); Rare, Threatened or Endangered Species (RARE); Wildlife Habitat (WILD)
18. Throughout water bodies that are used by fisheries, estimate the area with the conditions necessary for the migration of aquatic organisms, such as anadromous fish, using measures of habitat condition including water flow, watercourse geomorphology, sedimentation, temperature, and biological communities.
19. Throughout water bodies that are used by fisheries, estimate the area with the conditions from month to month necessary for the migration of aquatic organisms, such as anadromous fish, using measures of habitat condition including water flow, watercourse geomorphology, sedimentation, temperature, and biological communities.
Is water safe for agricultural use?
Beneficial Use: Agricultural Supply (AGR)
20. Throughout water bodies that are used for agricultural purposes, estimate the area of lakes, rivers, and streams that are used for agricultural purposes where the concentration of chemical pollutants are above or below screening values or adopted water quality objectives used to protect agricultural uses.
21. Throughout water bodies that are used for agricultural purposes, estimate the concentration of chemical pollutants from year-to-year above or below screening values or adopted water quality objectives used to protect agricultural uses.
Is water safe for industrial use?
Beneficial Use: Industrial Process Supply (PRO); Industrial Service Supply (IND)

11
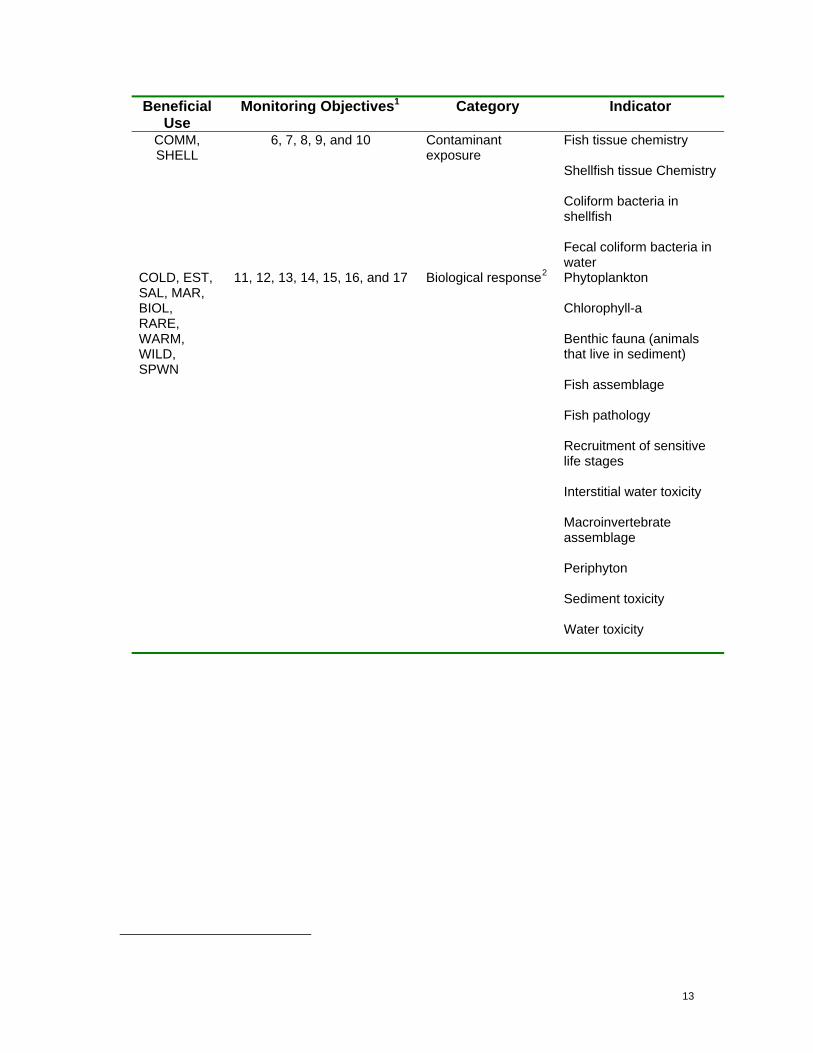
Water quality indicators are used to assess the ability of specific water bodies to support their designated beneficial uses. Water quality indicators may be physical, chemical, or biological parameters. Monitoring programs sponsored by the SWRCB and the RWQCBs have used a variety of environmental indicators. Indicators that have been used in ambient monitoring efforts and meet the requirements of the general criteria are presented in Table 2. Use of these indicators is dependent upon funding, sampling cost, and characteristics of the water body.
22. Throughout water bodies that are used for industrial purposes, estimate the area of coastal waters, enclosed bays, estuaries, lakes, rivers, and streams where the concentration of chemical pollutants are above or below screening values or adopted water quality objectives used to protect industrial uses.
23. Throughout water bodies that are used for industrial purposes, estimate the concentration of chemical pollutants from year-to-year above or below screening values or adopted water quality objectives used to protect industrial uses.
Are aesthetic conditions of the water protected?
Beneficial Use: Non-Contact Water Recreation (REC II)
24. Throughout water bodies that are used for non-contact recreation, estimate the area of coastal waters, enclosed bays, estuaries, lakes, rivers, and streams where the aesthetic conditions are above or below screening values or adopted water quality objectives used to protect non-contact water recreation.
25. Throughout water bodies that are used for non-contact recreation, estimate the
aesthetic condition from year-to-year above or below screening values or adopted water quality objectives used to protect non-contact water recreation.
These objectives may not be relevant to all Regions. Each Region prioritizes their monitoring objectives, and Regions with similar objectives will be monitored in a similar manner. Adherence to these monitoring objectives is dependent on finalized sampling costs and funding. 3.3 WATER QUALITY INDICATORS (WQI)

12
Table 2. List of Indicators for Site-Specific and Regional Monitoring
Beneficial
Use Monitoring Objectives1 Category Indicator
REC I 1, 2, and 3 Contaminant exposure
Total coliform bacteria Fecal coliform bacteria Enterococcus bacteria Enteric viruses
MUN 4 and 5
Contaminant exposure
Inorganic water Chemistry Nutrients Organic water Chemistry Total coliform bacteria Cryptosporidium Giardia
13
Beneficial Use
Monitoring Objectives1 Category Indicator
COMM, SHELL
6, 7, 8, 9, and 10
Contaminant exposure
Fish tissue chemistry Shellfish tissue Chemistry Coliform bacteria in shellfish Fecal coliform bacteria in water
COLD, EST, SAL, MAR, BIOL, RARE, WARM, WILD, SPWN
11, 12, 13, 14, 15, 16, and 17 Biological response2 Phytoplankton Chlorophyll-a Benthic fauna (animals that live in sediment) Fish assemblage Fish pathology Recruitment of sensitive life stages Interstitial water toxicity Macroinvertebrate assemblage Periphyton Sediment toxicity Water toxicity

14
Beneficial Use
Monitoring Objectives1 Category Indicator
Pollutant exposure
Acid Volatile sulfides/simultaneously extracted metals Debris Interstitial water Metal chemistry Reporter Gene System (RGS 450) Organic and inorganic sediment chemistry Total organic carbon Shellfish or fish tissue chemistry Nutrients Turbidity Inorganic and organic water chemistry

15
Beneficial Use
Monitoring Objectives1 Category Indicator
Habitat Dissolved oxygen Sediment grain size and gradations Sediment organic carbon Water flow Water temperature Channel morphology Residual pool volume Instream structure Substrate composition Wetland vegetation Riparian vegetation Electrical conductivity Salinity Hydrogen sulfide Ammonia
MIGR, RARE, WILD
18 and 19 Habitat Water flow Suspended solids Channel morphology Water temperature
Biological response Fish assemblage and populations Macroinvertebrate assemblage and populations Periphyton Wetland habitat Riparian habitat
AGR 20 and 21 Pollutant exposure Organic and inorganic chemistry

16
Beneficial Use
Monitoring Objectives1 Category Indicator
PRO, IND 22 and 23 Pollutant exposure Organic and inorganic chemistry Total organic carbon Temperature Electrical conductivity
REC II 24 and 25 Pollutant exposure Taste and odor Debris and trash
Adapted from: SWRCB, 1993; SPARC, 1997; SCCWRP, 1998; Stephenson et al., 1994; CalEPA, 1998; CABW, 1998; CDFG, 1998; Noble et al., 1999; AB 982 Scientific Advisory Group, personal communication, August, 2000
1 The number refers to the monitoring objective discussed previously. 2 The assessment of invasive species will very likely be identified when biological community measurements are made.
Regional Board staff is collecting data for the TMDL development and TMDL Implementation Units. Under the TMDL Development Unit, staff is collecting bacteria indicator data from the Palo Verde Outfall Drain, and the Coachella Storm Water
The University of Redlands compiled a list of agencies that collected data on the Salton Sea in a report titled "Salton Sea Watershed Water Quality Monitoring Program Inventory and Assessment." The report identifies the type and period the data was collected. One significant finding was that much data was collected without a quality control plan. Furthermore, data collection and/or analysis methods frequently differed, rendering the data incompatible. It is difficult to compare water quality data from various sites if different analytical methods and reporting conventions for chemical constituents are utilized. At the present, Redlands Institute collaborates with Regional Board in the design and implementation of a comprehensive Geographic Information System (GIS) data infrastructure, to support water quality monitoring activities and to promote region-wide coordination within the Salton Sea Trans-boundary Watershed.
Several public agencies have collected water quality data from the Salton Sea and its tributaries. The Imperial Irrigation District (IID) has physical and chemical data for the Alamo and New Rivers at the International Boundary, and at the outlets to the Salton Sea. The United States Geologic Survey (USGS) has water quality data from the Lower Colorado River, and the Alamo and New Rivers under their National Water-Quality Assessment (NAWQA) and National Irrigation Water Quality Programs (NIWQP). The monitoring period for these two programs varies for each station.
Water quality information collected by the Regional Board, Universities, Federal agencies, and others, was evaluated to identify types of water quality data gathered, data gaps, and sites with historical water quality concerns.
3.4 OVERVIEW OF AVAILABLE INFORMATION

17
Channel on a monthly basis. Staff is also monitoring the main drains tributary to the Salton Sea for nutrients. Further, the TMDL Implementation Unit is conducting monthly sampling events for the Alamo River for suspended sediments and turbidity; and for the New River for sediments, turbidity, and bacteria indicators.
Other critical ongoing monitoring projects (e.g., Nutrient Dynamic Model for the Salton Sea and Characterization of TSS in Agricultural Drains in Imperial Valley) will also help to evaluate regional water quality as they supplement the SWAMP for the region.

18
4. GENERAL STUDY DESIGN
The overall goal of SWAMP is to develop site-specific information on sites that are known or suspected to: (1) have water quality problems, and (2) be clean. It is intended
4.1 OVERVIEW
The overall goal of SWAMP is to develop a statewide and regionwide representation of the status and trends of the quality of California’s surface water resources. It is intended that this portion of SWAMP will be implemented in each hydrologic unit of the State at least one time every five years. This portion of SWAMP is focused on collecting information on water bodies for which the State presently has little information and to determine the effects of diffuse sources of pollution and the baseline conditions of potentially clean areas. 4.2 REGIONWIDE DESIGN
The objective of SWAMP in FY 2001-02 was twofold: to obtain representative baseline measurements for surface waters in Region 7, and to develop future program strategies based on data collected to date. Comprehensive sampling events were scheduled during two hydrological cycles in 2003 (spring and fall), to account for seasonal variations in flow. May was selected because of the increased use of agricultural chemicals at this time (e.g., pesticides, fertilizers), and high rates of flow due to melting snow and irrigation. October was selected because of increased use of agricultural chemicals, and low flow rates. For FY 2002-03, Regional Board staff designated a network of 13 strategic sampling locations from the original stations on the Lower Colorado River, New River, Alamo River, Whitewater River, and Salton Sea (Table 1). These five water bodies are the major surface waters of interest in this Region, and the focus of TMDLs because of water quality impairments. For FY 2003-04, staff proposes to continue gathering information from these 13 strategic sites. Site selection was based on location, historical information, current information, and future plans for utilization of Best Management Techniques (BMTs). Locations that exhibited high concentrations of contaminants (e.g., selenium, pesticides, VOCs, bacteria) and sites with approved TMDLs were selected to monitor the progression of these pollutants and TMDL compliance. Sites in critical areas with regional significance (e.g., International Boundary, diversion points, State borders, source waters for an entire region) also were included. Finally sites were selected for which little data have been collected to establish baseline conditions. More sampling events will enable staff to capture seasonal fluctuation trends, baseline data, and effectiveness of water quality control measures. The sampling conducted by DF&G is done on two hydrologic cycles considering water and sediments analyses. Sampling conducted by Regional Board Staff is on a monthly basis for New River at the International Boundary and Alamo and New River TMDLs. 4.3 SITE-SPECIFIC STUDY DESIGN

19
that this portion of SWAMP will be targeted at specific locations in each Region. This portion of SWAMP is focused on collecting information from sites in water bodies of the State that could be potentially listed or delisted under CWA Section 303(d). The RWQCBs are given significant flexibility to select specific locations to be monitored. The RWQCBs at their discretion may perform monitoring at clean sites to determine baseline conditions (for assessments related to antidegradation requirements) or to place problem sites into perspective with cleaner sites. Efforts will concentrate on the New and the Alamo Rivers sites (Table 3). The New River already has two TMDL being implemented: the Sedimentation/Siltation and the Pathogen TMDLs. The Alamo River has the Sedimentation/Siltation TMDL being implemented. The pathogens in the New River at the site known as New River at the International Boundary (i.e., at the border with Mexico) are of significant concern because of the extremely high concentrations of bacteria coming from Mexico. Therefore, this site is being included during FY 03-04 in this updated work plan for monitoring purposes.
Table 3. Monitoring Stations and Water Quality Problems at the New and Alamo Rivers
Stations Known Problems
Potential Problems
Alamo River Outlet B, O, P, M, N, S P
Alamo River @ Drop 3 B, P, N, S
Alamo River @ Drop 6 B, P, N, S Alamo River @ Drop 6A B, P, N, S Alamo River @ Drop 8 B, P, N, S Alamo River @ Drop 10 B, P, N, S
Alamo River @ International Boundary
O, P, N
New River Outlet B, O, P, M, N, S New River Drop 2 B, P, N, S New River Rice Drain B, P, N, S New River Evan Hewes B, P, N, S New River @ Boundary B, O, P, M, N, S,
T
B = Bacteria, P = Pesticides, O = Organics, M = Metals, N = Nutrients, S = Silt: T= Trash The New and the Alamo Rivers are sustained and dominated by agricultural return flows. These flows are either discharged directly into the rivers or into the Imperial Valley Agricultural Drains operated and maintained by the Imperial Irrigation District (IID). In the case of the New River, a third of its flow is from Mexico and is extremely polluted. Ambient monitoring information collected now and during implementation will be used to measure the effectiveness of BMTs in reducing silt and other constituents of concern that are transported with silt (e.g., pesticides); as well as pollution control efforts in Mexico.

20
The information collected through SWAMP will support Basin Planning activities, TMDL development and implementation; and water quality studies conducted in the Region. SWAMP provides a comprehensive tool to evaluate water quality changes that can be used to support listing and de-listing of impaired surface waters, and to develop and implement Triennial Review goals.
4.5 DATA USES
The University of California at Davis Aquatic Toxicology Laboratory (UCD-ATL) will conduct analyses of surface water samples for presence of substances toxic to aquatic life on surface waters of the Region. Standard US EPA three species toxicity testing protocols will be followed. If water samples are toxic, the UCD-ATL will proceed with the Toxicity Identification Evaluation Test (TIE’s).
Region 7 has no historical bioassesment data, due partly to the distribution of water via engineered canals from the Lower Colorado River. During the FY 03-04, no bioassessment study will be conducted.
The SWRCB Toxic Substances Monitoring Program (TSMP) evaluates fish tissue for the presence of contaminants and was a significant assessment monitoring activity in Region 7. Fish tissue samples have been collected from 1978 to 2001 on an annual basis. For the FY 03-04, Region 7 proposes to continue with the fish tissue analyses from strategic locations throughout the Region. The fish tissue analyses detect contaminants that bioaccumulate in fish and pose threats to aquatic species, fish-eating birds, and humans. The collection of samples and analyses will be done by DF&G.
4.4 BIOLOGICAL ASSESSMENT

21
5. ACTIVITIES PLANNED FOR FISCAL YEAR 2003-04
5.1 SAMPLING SCHEDULE FY 2003-04
Table 4 shows a list of water bodies and locations to be sampled, their beneficial uses, associated monitoring objectives, and water quality indicators. The list is contingent on funding and sampling costs.
Table 4. Sampling Locations (FY 2003-04)
Stations Frequency Beneficial
Uses Monitoring Objectives
Category Water Quality Indicators
Colorado River @ Nevada State Line
2 MUN, AGR, AQUA, IND, GWR, REC I,
REC II, WARM, COLD, WILD, POW, RARE
1, 2, 4, 5, 6, 7, 8, 11, 12, 13, 14, 15, 18, 20, 21,
24
Contaminant Exposure, Biological Response, Pollutant
Exposure, Habitat
Inorganic/Organic Water & Sediment Chemistry, Nutrients, Bacterial Analysis, Trace Metal Chemistry, Water & Sediment Toxicity
Colorado River @ Imperial Dam
2
Palo Verde Lagoon 2 REC I, REC II, WARM, WILD,
RARE
1, 2, 6, 7, 8, 11, 12, 13, 14, 15, 18,
24
Contaminant Exposure, Biological Response, Pollutant
Exposure, Habitat
Inorganic/Organic Water & Sediment Chemistry, Bacterial Analysis, Trace Metal Chemistry, Water & Sediment Toxicity
Palo Verde Outfall Drain
2
Alamo River Outlet 22
REC I, REC II, WARM, WILD POW*, FRSH,
RARE
1, 2, 6, 7, 8, 11, 12, 13, 14, 15, 18,
24
Contaminant Exposure, Biological Response, Pollutant
Exposure, Habitat
Inorganic/Organic Water & Sediment Chemistry, Bacterial Analysis, Trace Metal Chemistry, Water & Sediment Toxicity
Alamo River @ Drop 3 123 Alamo River @ Drop 6 123 Alamo R @ Drop 6A 123 Alamo R @ Drop 8 123 Alamo R @ Drop 10 123 Alamo River @ International Boundary
22
New River Outlet 22 IND*, REC I, REC II, WARM,
1, 2, 6, 7, 8, 11, 12, 13,
Contaminant Exposure,
Inorganic/Organic Water & Sediment
2 Semiannual Sampling event conducted by DF&G 3 Monthly sampling event conducted by Regional Board Staff (TMDL Implementation)

22
WILD, FRSH, RARE
14, 15, 18, 22, 23, 24
Biological Response, Pollutant
Exposure, Habitat
Chemistry, Bacterial Analysis, Trace Metal Chemistry, Water & Sediment Toxicity
New River Drop 2 123 New River Evan H 123 New River Rice Drain 123 New River @ Boundary 22-124 Salton Sea USGS 2 2 AQUA, IND*,
REC I, REC II, WARM, WILD,
RARE
1, 2, 6, 7, 8, 11, 12, 13, 14, 15, 18, 22, 23, 24
Contaminant Exposure, Biological Response, Pollutant
Exposure, Habitat
Inorganic/Organic Water & Sediment Chemistry, Bacterial Analysis, Trace Metal Chemistry, Water & Sediment Toxicity
Salton Sea USGS 7 2 Salton Sea USGS 9 2 Salton Sea Drain NW1 (Torres Martinez 1)
2
Coachella Valley Drain Outlets
2 REC I, REC II, WARM, WILD, FRSH, RARE
1, 2, 6, 7, 8, 11, 12, 13, 14, 15, 18,
24
Contaminant Exposure, Biological Response, Pollutant
Exposure, Habitat
Inorganic/Organic Water & Sediment Chemistry, Bacterial Analysis, Trace Metal Chemistry, Water & Sediment Toxicity
* Indicates Potential Beneficial Use 5.2 SAMPLE COLLECTION
Field DF&G crews will collect sediment and water samples at previously identified sites. Regional Board staff will supply reconnaissance forms to sampling crews and collect water samples for the New River at the International Boundary and support implementation of the New and Alamo Rivers TMDLs. Questions concerning site location shall be resolved in consultation with the Regional Board staff member present in the field or via phone contact. Sufficient volume of sediment, tissue, or water shall be collected to perform analyses, as well as to archive for future analysis, according to the Sampling and Analyses Schedule for 2003-04 (Table A.1) located in the appendix. Sample collection, processing, and testing will be performed according to the most recent SWAMP Quality Assurance Management Plan (QAMP) Regional Board and Region-specific QAPPs and standard operating procedures (SOPs). Scarce data dictates that spatial characteristics within sub-watersheds be addressed during each sampling event. For example, sampling locations for a small stream may vary for each sampling event due to flow conditions. Variation in flow conditions will be addressed by measuring or obtaining the flow and concentration within the water body
4 Monthly sampling event conducted by Regional Board Staff under the New River International Boundary

The following is a list of deliverable products:
5.5 DELIVERABLE PRODUCTS
23
(where applicable), and calculating a mass loading. Real-time flow data is available for the outlets of the New and Alamo Rivers, and points along the Lower Colorado River. Sampling analyses, and frequency are listed in Table A.1 of the appendix. Costs pertaining to fiscal year 2003-04 are pending contract development and encumbrance. 5.3 LABORATORY ANALYSIS
Chemical, physical, and biological parameters will be measured in the field and from water and sediment samples. Various inorganic (e.g., nitrates, selenium) and organic chemicals (e.g., VOCs, pesticides, solvents) will be evaluated. A YSI probe will be used to measure physical parameters (e.g., flow, depth, DO, turbidity, electrical conductivity). Specific laboratory analyses performed are listed in Table A.1 in the appendix. Regional Board Laboratory will perform bacterial analyses due to holding time constraints (six hours). All other laboratory work will be performed through CDFG, UCD-ATL or other contracted agency. Analytical detection limits, Quality Assurance/Quality Control criteria, and related information are included in the QAPM. 5.4 DATA QUALITY EVALUATION AND DATA REPORTING
Quality Assurance (QA) includes activities to ensure that the quality of data collected is sufficient to satisfy monitoring objectives. Quality Control (QC) activities include sample collection and protocol standardization. QA/QC evaluation reports and verification that data met QA criteria set forth in the QAPP will be provided to the Regional Board in hardcopy and electronic format. QA/QC should be included in each data report and the final report, with information describing how the data complied with QA/QC parameters. QA/QC procedures are provided in the State Board QAMP developed by CDFG. Chemical data includes the analytical result, method detection limit, reporting limit, and quality assurance information on surrogate recovery, duplicate relative percent difference (RPD), matrix spike percent recovery and RPD, and blank spike percent recovery and RPD. Deviations from QA goals established in the QAPP will be noted.
Data reports for each sampling event. Field Reports by the contractor to RWQCB Work orders as needed. Final data report by FY 03-04
24
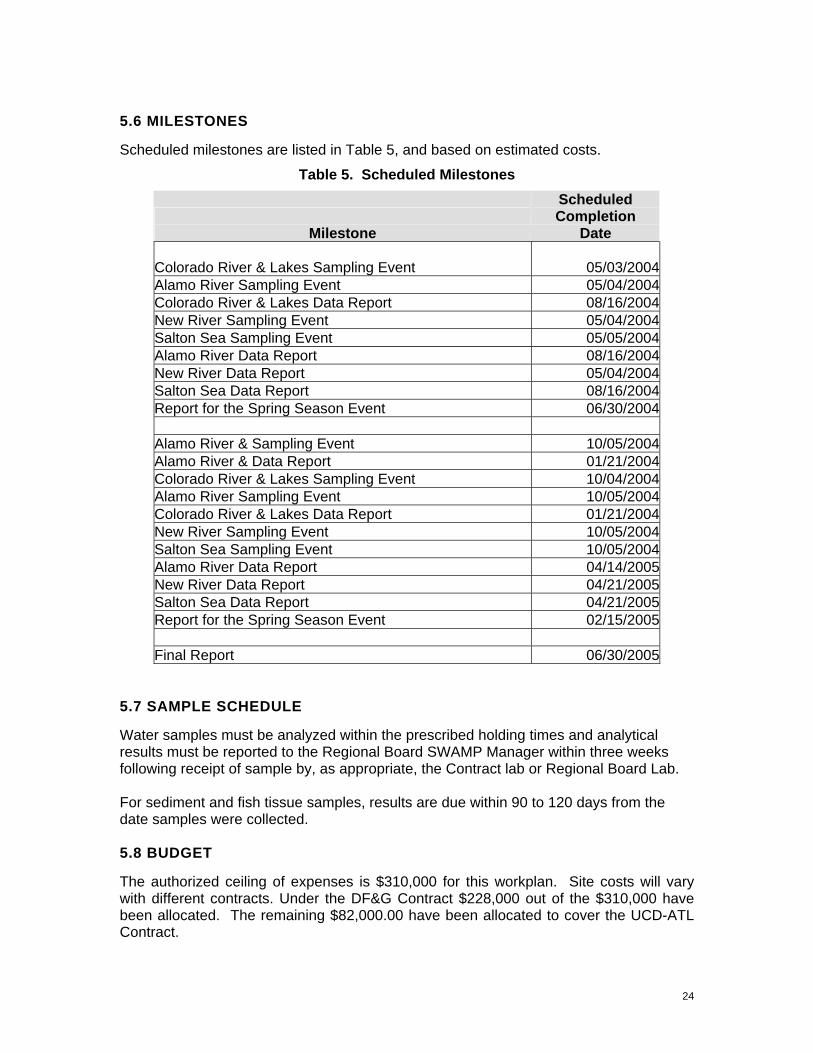
5.6 MILESTONES
Scheduled milestones are listed in Table 5, and based on estimated costs.
Table 5. Scheduled Milestones
Scheduled Completion
Milestone Date Colorado River & Lakes Sampling Event 05/03/2004Alamo River Sampling Event 05/04/2004Colorado River & Lakes Data Report 08/16/2004New River Sampling Event 05/04/2004Salton Sea Sampling Event 05/05/2004Alamo River Data Report 08/16/2004New River Data Report 05/04/2004Salton Sea Data Report 08/16/2004Report for the Spring Season Event 06/30/2004 Alamo River & Sampling Event 10/05/2004Alamo River & Data Report 01/21/2004Colorado River & Lakes Sampling Event 10/04/2004Alamo River Sampling Event 10/05/2004Colorado River & Lakes Data Report 01/21/2004New River Sampling Event 10/05/2004Salton Sea Sampling Event 10/05/2004Alamo River Data Report 04/14/2005New River Data Report 04/21/2005Salton Sea Data Report 04/21/2005Report for the Spring Season Event 02/15/2005 Final Report 06/30/2005
5.7 SAMPLE SCHEDULE
Water samples must be analyzed within the prescribed holding times and analytical results must be reported to the Regional Board SWAMP Manager within three weeks following receipt of sample by, as appropriate, the Contract lab or Regional Board Lab. For sediment and fish tissue samples, results are due within 90 to 120 days from the date samples were collected. 5.8 BUDGET
The authorized ceiling of expenses is $310,000 for this workplan. Site costs will vary with different contracts. Under the DF&G Contract $228,000 out of the $310,000 have been allocated. The remaining $82,000.00 have been allocated to cover the UCD-ATL Contract.

25
6. WORKING RELATIONSHIPS
The Regional Board has developed task orders and workplans to contract with the CDFG and UCD-ATL. At the present, Regional Board does not have private contracts. The following tables identify the responsibilities of each organization (Table 6). The Regional Board requires any contracted agency to provide a QAPP to ensure that samples are collected and analyzed according to Regional Board and SWRCB standards.
Table 6. Working Relationships
Task Responsible Organization
SWRCB RWQCB UCD-ATL CDFG
Develop contract(s) for monitoring services
• • • •
Identify water bodies or sites of concern and clean sites to be monitored
•
Identify site-specific locations with potential beneficial uses impacts or unimpacted conditions that will be monitored
•
Decide if concern is related to objectives focused on location or trends of impacts
•
Select monitoring objective(s) based on potential beneficial use impact(s) or need to identify baseline conditions
•
Identify already-completed monitoring and research efforts focused on potential problems, monitoring objective, or clean conditions
•

26
Task Responsible Organization
SWRCB RWQCB UCD-ATL CDFG
Make decision on adequacy of available information
•
Prepare site-specific study design based on monitoring objectives, the assessment of available information, sampling design, and indicators
•
(Work Plan Review Role)
• • •
Implement study design (Collect and analyze samples)
• •
Track study progress, review quality assurance information, make assessments on data quality, adapt study as needed
•
(Review Role)
• • •
Report data through SWRCB web site
• • (Coordination
Role)
• •
Prepare written report of data
• • • •

27
7. APPENDIX -
See attached file