svalbard global seed vault: banking on agrobiodiversity
TRANSCRIPT
About halfway between the North Pole and conti-
nental Northern Europe, Svalbard, an unincorpo-
rated Norwegian archipelago, houses the most ex-
tensive agricultural seed bank on the planet. The
Svalbard Global Seed Vault (SGSV) stores agricul-
tural seeds from around the world, aiming to pre-
serve and record the genetic diversity of agricultur-
al species, or agrobiodiversity.
Maintaining agrobiodiversity is key to developing agricultural resil-
ience, because it enables food supply adaptation in varying envi-
ronmental conditions and production demands. Globally, crop bio-
diversity origins, a given crop’s region of greatest natural biodiver-
sity, and food supplies have become increasingly inter-regionally
intertwined; geographic regions rely upon crops of non-native bio-
diversity origins (Khoury et al. 2016, Figures 1-2). This study ana-
lyzes the Svalbard Global Seed Vault as a critical agrobiodiversity
resource, mapping its potential underrepresentation of global agro-
biodiversity and food security needs.
Research Questions
Are there global geographic trends in SGSV’s agrobiodiversity re-
source preservation and representation?
What global patterns exist between SGSV’s preservation of agro-
biodiversity, food security, and actual agrobiodiversity?
Which regions are the most valuable agrobiodiversity origins to
global food supplies, and… have low food security? Have poor ag-
robiodiversity representation in SGSV?
Two separate analyses were performed
to (a) map the global flows of seed biodi-
versity to Svalbard and (b) index SGSV ’s
archives by biodiversity origin in the
contexts of global food security and agro-
biodiversity value to food supplies.
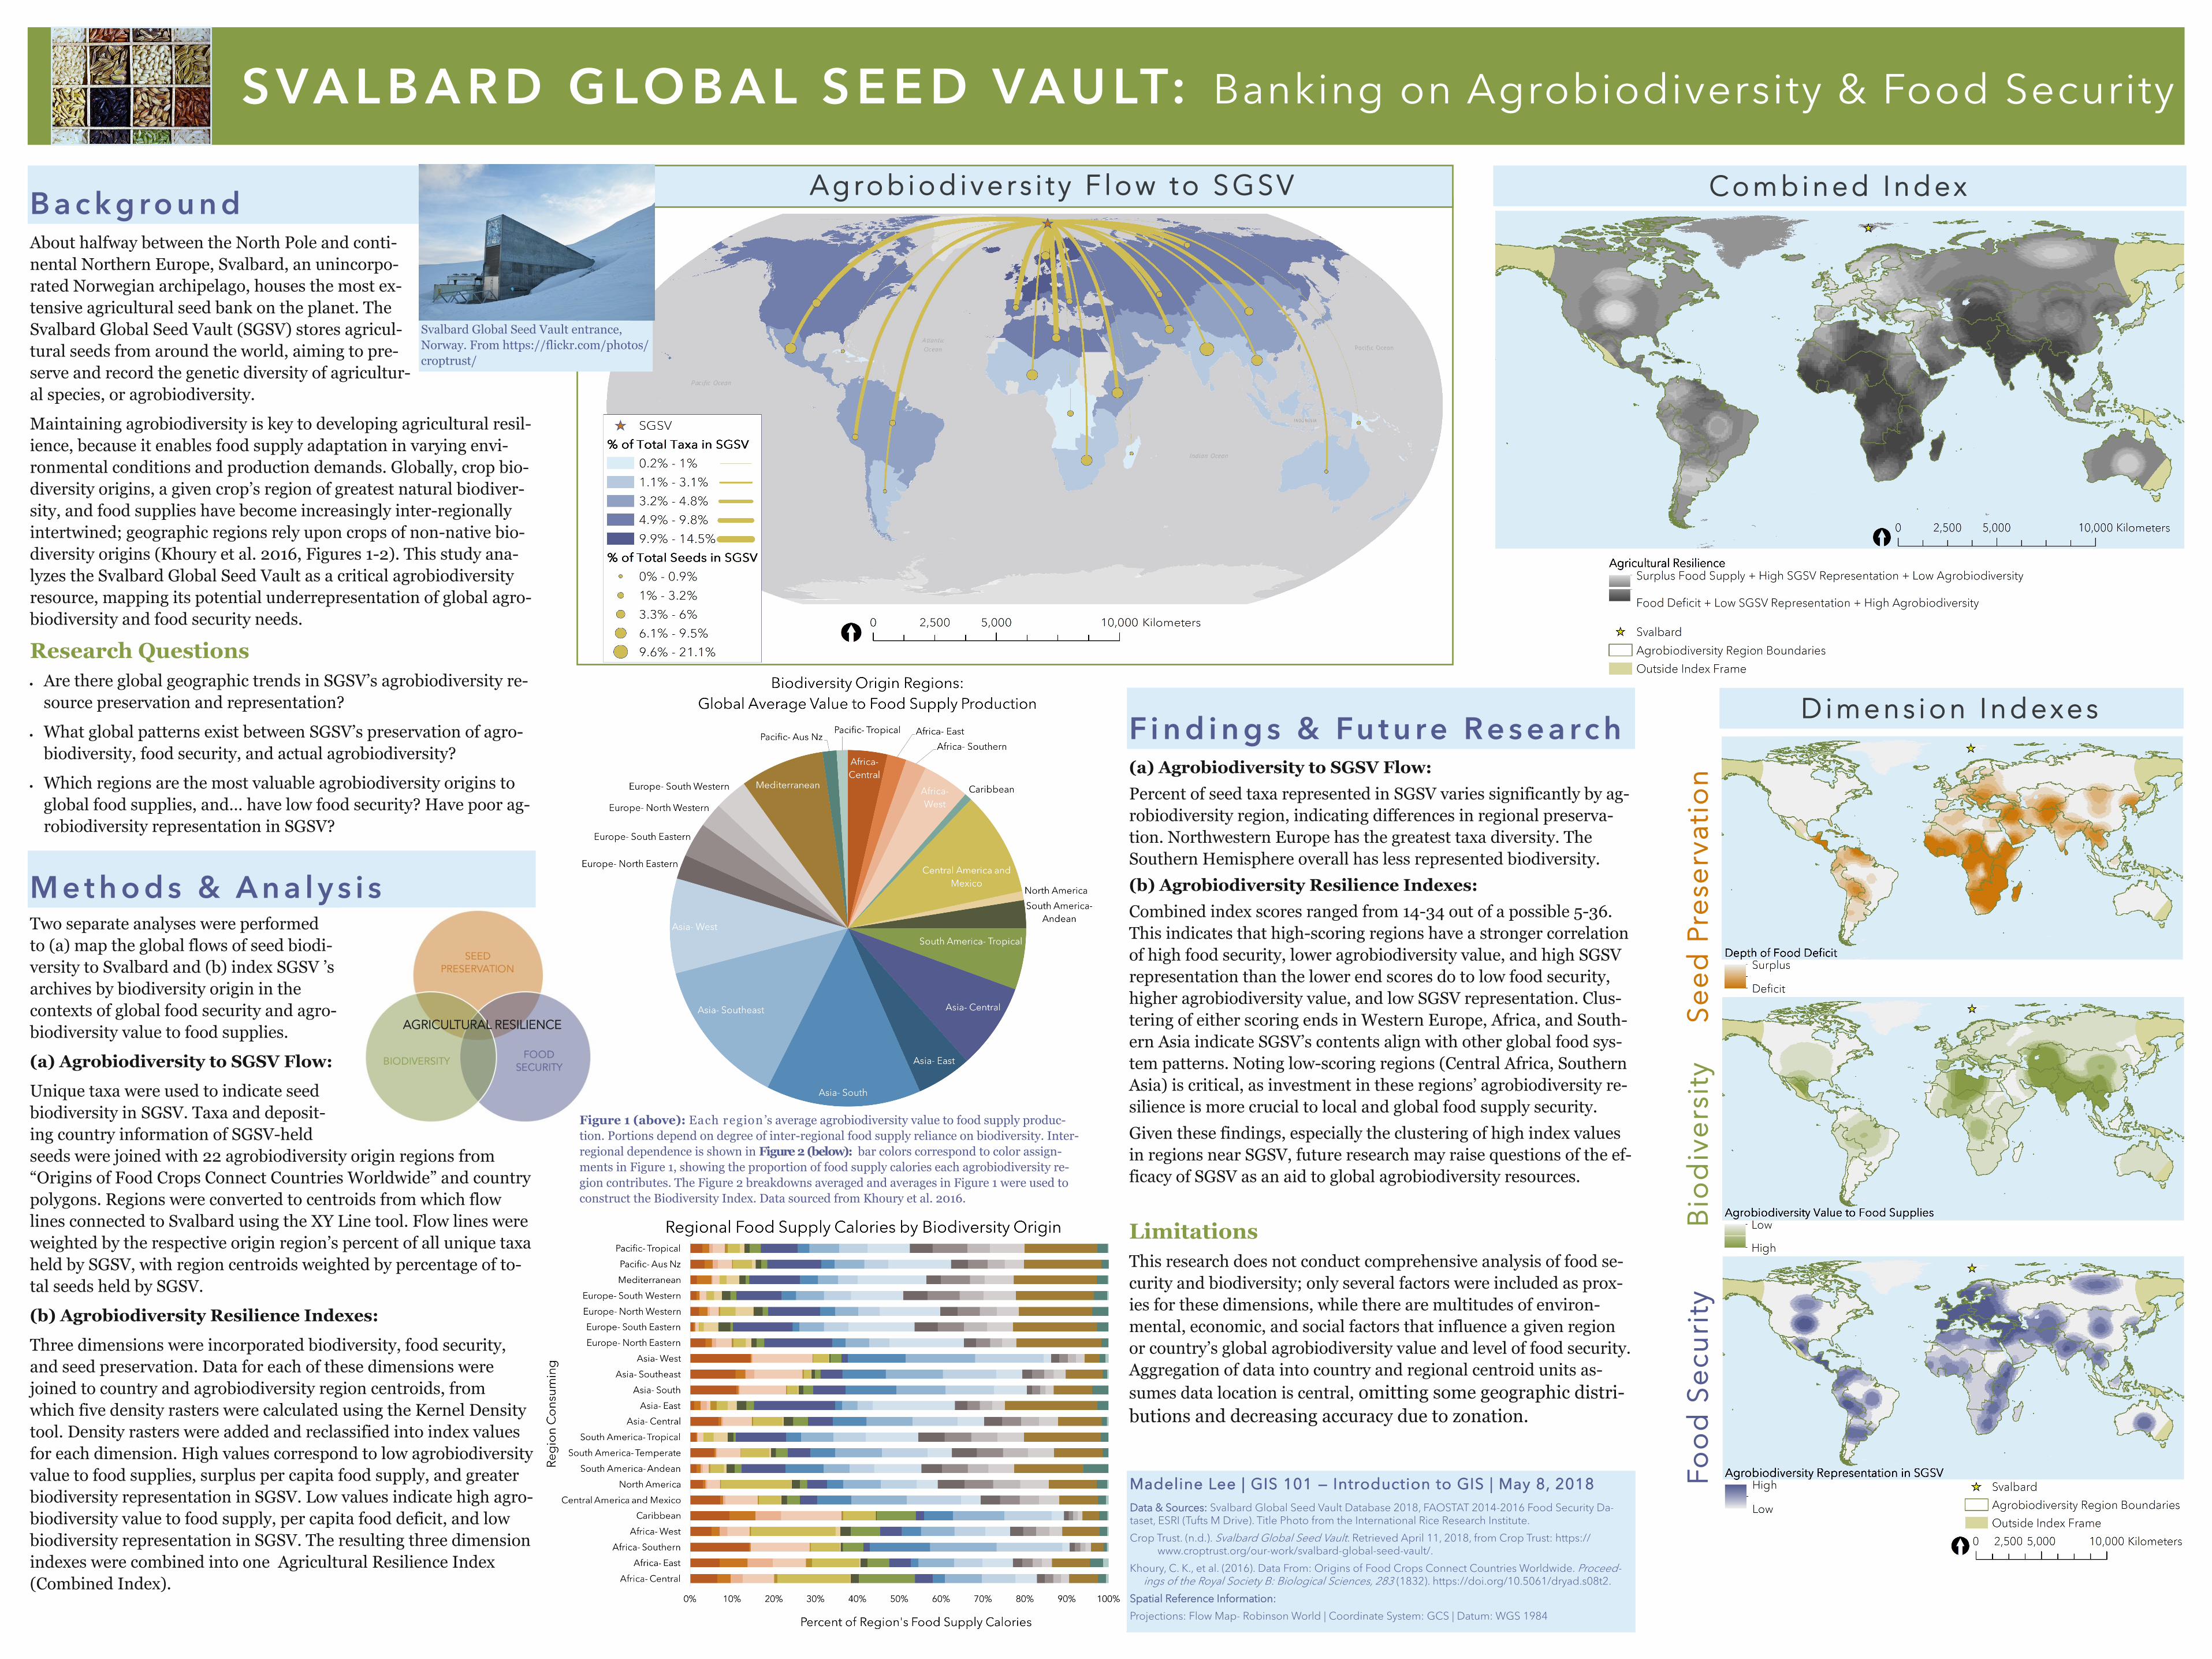
(a) Agrobiodiversity to SGSV Flow:
Unique taxa were used to indicate seed
biodiversity in SGSV. Taxa and deposit-
ing country information of SGSV-held
seeds were joined with 22 agrobiodiversity origin regions from
“Origins of Food Crops Connect Countries Worldwide” and country
polygons. Regions were converted to centroids from which flow
lines connected to Svalbard using the XY Line tool. Flow lines were
weighted by the respective origin region’s percent of all unique taxa
held by SGSV, with region centroids weighted by percentage of to-
tal seeds held by SGSV.
(b) Agrobiodiversity Resilience Indexes:
Three dimensions were incorporated biodiversity, food security,
and seed preservation. Data for each of these dimensions were
joined to country and agrobiodiversity region centroids, from
which five density rasters were calculated using the Kernel Density
tool. Density rasters were added and reclassified into index values
for each dimension. High values correspond to low agrobiodiversity
value to food supplies, surplus per capita food supply, and greater
biodiversity representation in SGSV. Low values indicate high agro-
biodiversity value to food supply, per capita food deficit, and low
biodiversity representation in SGSV. The resulting three dimension
indexes were combined into one Agricultural Resilience Index
(Combined Index).
(a) Agrobiodiversity to SGSV Flow:
Percent of seed taxa represented in SGSV varies significantly by ag-
robiodiversity region, indicating differences in regional preserva-
tion. Northwestern Europe has the greatest taxa diversity. The
Southern Hemisphere overall has less represented biodiversity.
(b) Agrobiodiversity Resilience Indexes:
Combined index scores ranged from 14-34 out of a possible 5-36.
This indicates that high-scoring regions have a stronger correlation
of high food security, lower agrobiodiversity value, and high SGSV
representation than the lower end scores do to low food security,
higher agrobiodiversity value, and low SGSV representation. Clus-
tering of either scoring ends in Western Europe, Africa, and South-
ern Asia indicate SGSV’s contents align with other global food sys-
tem patterns. Noting low-scoring regions (Central Africa, Southern
Asia) is critical, as investment in these regions’ agrobiodiversity re-
silience is more crucial to local and global food supply security.
Given these findings, especially the clustering of high index values
in regions near SGSV, future research may raise questions of the ef-
ficacy of SGSV as an aid to global agrobiodiversity resources.
Limitations
This research does not conduct comprehensive analysis of food se-
curity and biodiversity; only several factors were included as prox-
ies for these dimensions, while there are multitudes of environ-
mental, economic, and social factors that influence a given region
or country’s global agrobiodiversity value and level of food security.
Aggregation of data into country and regional centroid units as-
sumes data location is central, omitting some geographic distri-
butions and decreasing accuracy due to zonation.
S VA L B A R D G LO B A L S E E D VAU LT: Banking on Agrobiodiversity & Food Security
M e t h o d s & A n a l y s i s
B a c k g ro u n d
Fi n d i n g s & Fu t u re R e s e a rc h
Madeline Lee | GIS 101 — Introduction to GIS | May 8, 2018 Data & Sources: Svalbard Global Seed Vault Database 2018, FAOSTAT 2014-2016 Food Security Da-taset, ESRI (Tufts M Drive). Title Photo from the International Rice Research Institute.
Crop Trust. (n.d.). Svalbard Global Seed Vault. Retrieved April 11, 2018, from Crop Trust: https://www.croptrust.org/our-work/svalbard-global-seed-vault/.
Khoury, C. K., et al. (2016). Data From: Origins of Food Crops Connect Countries Worldwide. Proceed-ings of the Royal Society B: Biological Sciences, 283 (1832). https://doi.org/10.5061/dryad.s08t2.
Spatial Reference Information:
Projections: Flow Map- Robinson World | Coordinate System: GCS | Datum: WGS 1984
A g ro b i o d i v e r s i t y F l o w t o S G SV Co m b i n e d I n d ex
F
oo
d S
ecu
rity
B
iod
ive
rsit
y
Se
ed
Pre
serv
atio
n
AGRICULTURAL RESILIENCE
D i m e n s i o n I n d e xe s
Figure 1 (above): Each region ’s average agrobiodiversity value to food supply produc-
tion. Portions depend on degree of inter-regional food supply reliance on biodiversity. Inter-
regional dependence is shown in Figure 2 (below): bar colors correspond to color assign-
ments in Figure 1, showing the proportion of food supply calories each agrobiodiversity re-
gion contributes. The Figure 2 breakdowns averaged and averages in Figure 1 were used to
construct the Biodiversity Index. Data sourced from Khoury et al. 2016.
Svalbard Global Seed Vault entrance,
Norway. From https://flickr.com/photos/
croptrust/