s&v measurements - rotorlab.tamu.edu 4 sensors for vibration measurement.pdf · luis san andres...
TRANSCRIPT
Luis San AndresMast-Childs Chair Professor
Texas A&M University
Notes 4: Sensors for vibration
measurements
S&V measurements
http://rotorlab.tamu.edu/me459/default.htm
M
K C

S&V modern systems
See notes on
Digital Image Correlation (provided by
Trilion)
&
Optical Vibrometry (provided by Polytec)
Other
National Instruments –
Resources (web cats on instrumentation)
http://us.ni.com/webcasts/sensor-measurement-
fundamentals?espuid=CNATL000003505620
Application of Vibration Sensor ©, Dr. Luis San Andrés 1
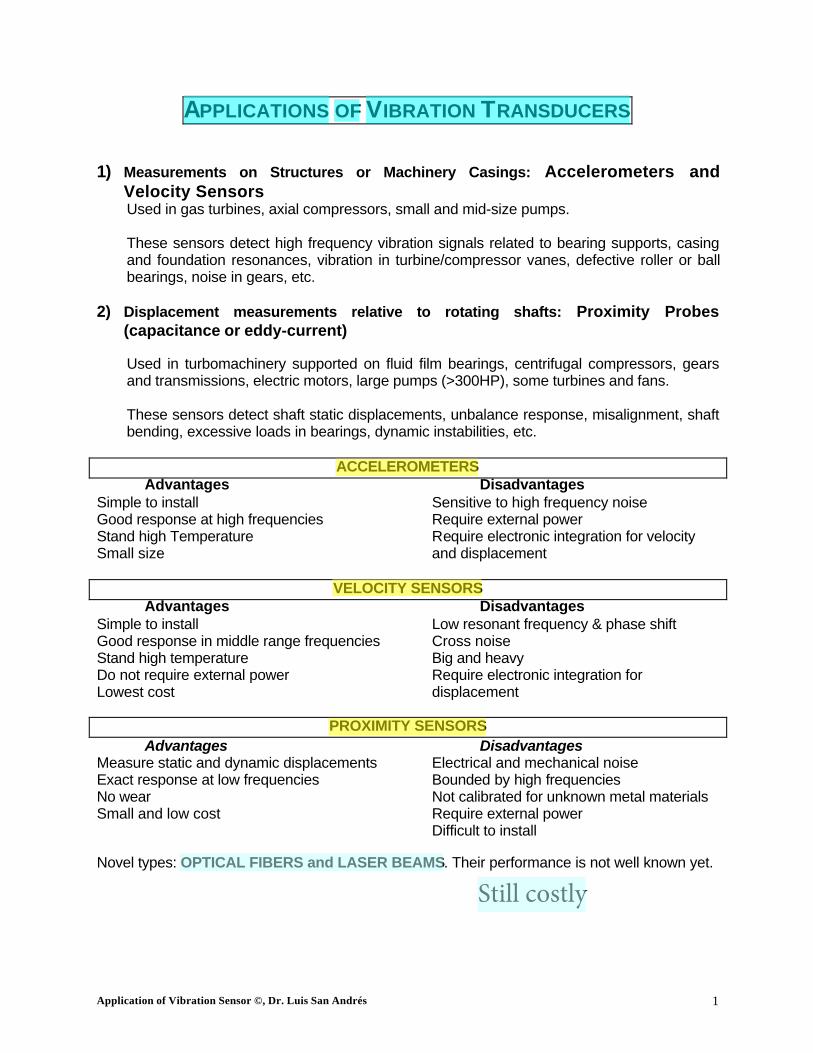
APPLICATIONS OF VIBRATION TRANSDUCERS
1) Measurements on Structures or Machinery Casings: Accelerometers andVelocity SensorsUsed in gas turbines, axial compressors, small and mid-size pumps.
These sensors detect high frequency vibration signals related to bearing supports, casingand foundation resonances, vibration in turbine/compressor vanes, defective roller or ballbearings, noise in gears, etc.
2) Displacement measurements relative to rotating shafts: Proximity Probes(capacitance or eddy-current)
Used in turbomachinery supported on fluid film bearings, centrifugal compressors, gearsand transmissions, electric motors, large pumps (>300HP), some turbines and fans.
These sensors detect shaft static displacements, unbalance response, misalignment, shaftbending, excessive loads in bearings, dynamic instabilities, etc.
ACCELEROMETERSAdvantages Disadvantages
Simple to install Sensitive to high frequency noiseGood response at high frequencies Require external powerStand high Temperature Require electronic integration for velocitySmall size and displacement
VELOCITY SENSORSAdvantages Disadvantages
Simple to install Low resonant frequency & phase shiftGood response in middle range frequencies Cross noiseStand high temperature Big and heavyDo not require external power Require electronic integration forLowest cost displacement
PROXIMITY SENSORSAdvantages Disadvantages
Measure static and dynamic displacements Electrical and mechanical noiseExact response at low frequencies Bounded by high frequenciesNo wear Not calibrated for unknown metal materialsSmall and low cost Require external power
Difficult to install
Novel types: OPTICAL FIBERS and LASER BEAMS. Their performance is not well known yet.
Still costly

Application of Vibration Sensor ©, Dr. Luis San Andrés 2
From Reference: Harry N. Norton, Handbook of transducers, Prentice Hall, Chap:5,6,7
VELOCITY SENSORS
Electromagnetic linear velocity transducers : Typically used to measure oscillatory velocity. Apermanent magnet moving back and forth within a coil winding induces an emf in the winding.This emf is proportional to the velocity of oscillation of the magnet. This permanent magnet maybe attached to the vibrating object to measure its velocity.
Electromagnetic tachometer generators : Used to measure the angular velocity of vibratingobjects. They provide an output voltage/frequency that is proportional to the angular velocity.DC tachometers use a permanent magnet or magneto, while the AC tachometers operate as avariable coupling transformer, with the coupling coefficient proportional to the rotary speed.
ACCELERATION SENSORS
Capacitive accelerometers : Used generally in those that have diaphragm supported seismicmass as a moving electrode and one/two fixed electrodes. The signal generated due to change incapacitance is post-processed using LC circuits etc., to output a measurable entity.
Piezoelectric accelerometers : Acceleration acting on a seismic mass exerts a force on thepiezoelectric crystals, which then produce a proportional electric charge. The piezoelectriccrystals are usually preloaded so that either an increase or decrease in acceleration causes achange in the charge produced by them. But they are not reliable at very low frequencies.
Potentiometric accelerometers : Relatively cheap and used where slowly varying acceleration isto be measured with a fair amount of accuracy. In these, the displacement of a spring masssystem is mechanically linked to a viper arm, which moves along a potentiometric resistiveelement. Various designs may have either viscous, magnetic or gas damping.
Reluctive accelerometers : They compose accelerometers of the differential transformer type orthe inductance bridge type. The AC outputs of these vary in phase as well as amplitude. They areconverted into DC by means of a phase-sensitive demodulator.
Servo accelerometers : These use the closed loop servo systems of force-balance, torque-balanceor null-balance to provide close accuracy. Acceleration causes a seismic mass to move. Themotion is detected by one of the motion-detection devices, which generate a signal that acts as anerror signal in the servo-loop. The demodulated and amplified signal is then passed through apassive damping network and then applied to the torquing coil located at the axis of rotation ofthe mass. The torque is proportional to the coil current, which is in turn proportional to theacceleration.
Strain Gage accelerators : these can be made very small in size and mass. The displacement ofthe spring-mass system is converted into a change in resistance, due to strain, in four arms of aWheatstone bridge. The signal is then post-processed to read the acceleration.

Page 31
© Wilcoxon Research. Proprietary. May 2009
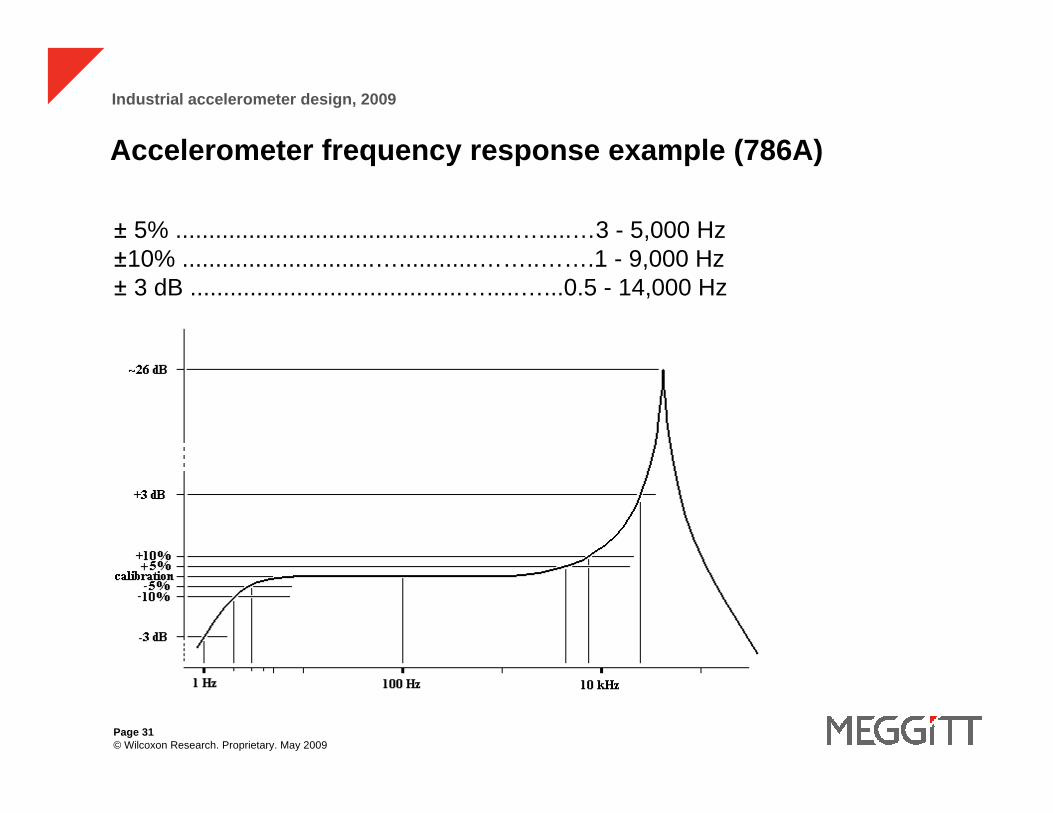
Industrial accelerometer design, 2009
± 5% ...................................................….....…3 - 5,000 Hz
±10% .............................…............……..…….1 - 9,000 Hz
± 3 dB .........................................….....…...0.5 - 14,000 Hz
Accelerometer frequency response example (786A)


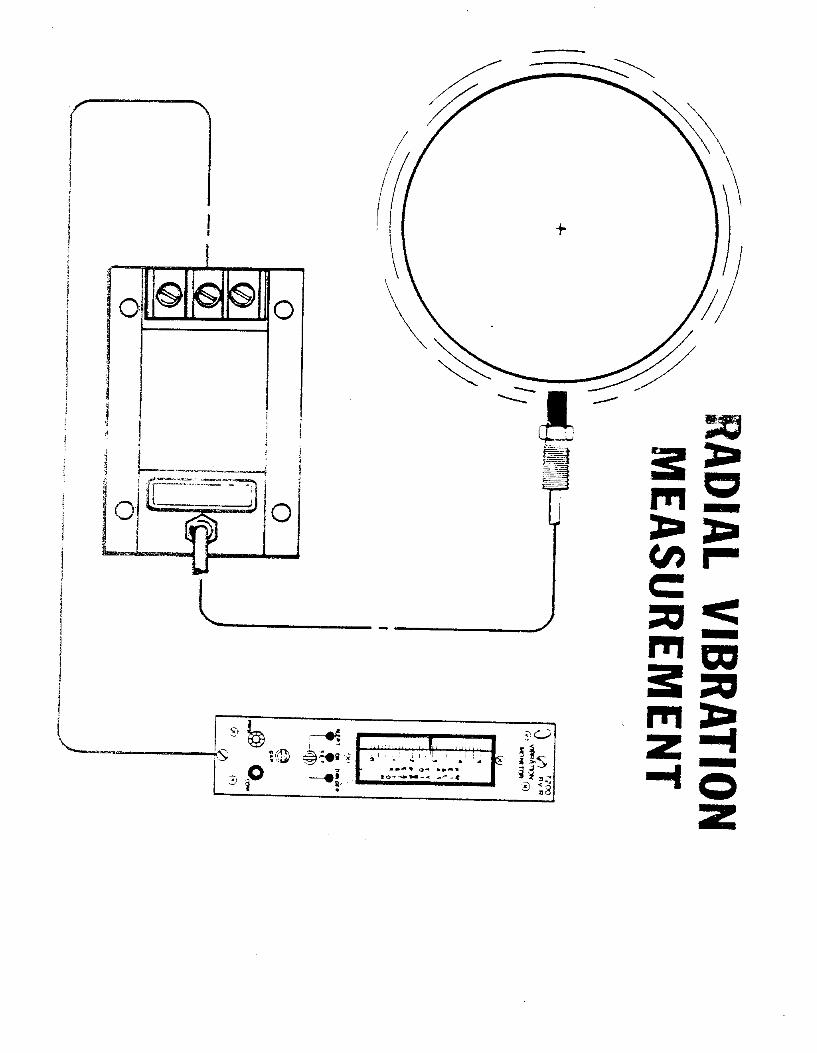
Eddy current sensor for measurement of rotor vibrations

50 ORBIT Vol .29 No.1 2009
APPLICATIONS
Figure 6. Actual probe voltage versus gap response (red) overlaid on expected output (blue) showing that the probe response is highly linear.
7
7. Linear Range
For a vibration measurement, it is critical that the probe
has enough range to measure the motion of the shaft.
To pick the correct probe, estimate the maximum peak-
to-peak vibration level that is expected and choose a
probe that has at least that much linear range. When
installing the probe it is important to gap the probe in
the middle of the linear range in order that the vibration
will “fit” into the probe’s linear range. It is good practice
to select a probe that has more linear range than is
strictly required by the application to allow for some
flexibility when gapping the probe. Figure 6 shows the
typical voltage response versus gap for a probe system.
The probe must stay in the linear range at all times in
order to provide a valid measurement.
The consequence of choosing a probe with insufficient
linear range or gapping the probe incorrectly is that the
monitor system will enter a “NOT OK” condition or there
will be data errors instead of protecting the machine.
For a thrust or differential expansion measurement,
it is even more critical that the probe has the ability to
measure the entire motion of the shaft. The selection
process is similar in that the probe is chosen based on
the expected shaft movement. The difference with a
thrust application is that the gapping of the probe needs
to be considered relative to the often asymmetrical
motion of the shaft. A complete discussion of gapping
for thrust is beyond the scope of this article, but suffice
to say that careful attention must be paid to ensure
that the probe will remain in the linear range during all
operating conditions [3,4,5].
The consequence of an error in application of probes for
thrust or expansion measurements is severe as it will
typically mean that the machine can fail in a manner
that allows rotating and non-rotating parts to contact,
such as blades and casings.
Vol .29 No.1 2009 ORBIT 51
APPLICATIONS
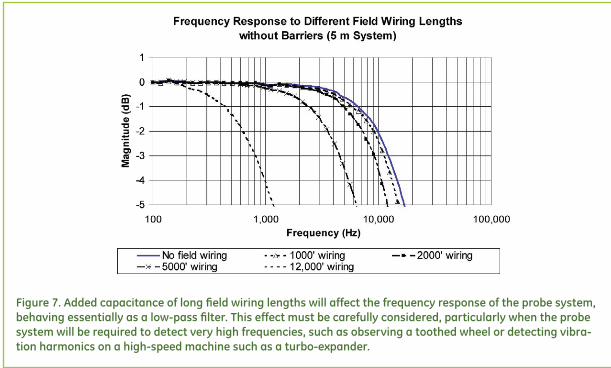
Figure 7. Added capacitance of long field wiring lengths will affect the frequency response of the probe system, behaving essentially as a low-pass filter. This effect must be carefully considered, particularly when the probe system will be required to detect very high frequencies, such as observing a toothed wheel or detecting vibra-tion harmonics on a high-speed machine such as a turbo-expander.
89
8. Signal-to-Noise Ratio Eddy-current proximity probes are amazingly accurate
devices, but they do not have infinite resolution. There
is always a noise floor for any electrical device below
which any measurement is not reliable. Typically this
value is several tens of millivolts for a proximity probe
system. Check the data sheet of the product and
consider the resolution required of the system.
“Electrical Runout” is another problem that may be
encountered in an installation. This phenomenon is
caused by variation in the material properties of the
shaft appearing as a spurious vibration signal. The
magnitude of electrical runout can be quite high
depending on the quality of the shaft material. The
causes and cures of electrical runout have been
discussed in previous ORBIT articles [6,7].
9. Field Wiring Proximity sensors are low-voltage devices—the output
of a typical sensor is usually only a few volts. As such,
it is important to maintain a clean signal path to the
monitoring system. Magnetic fields from power cabling
and transformers can cause a significant voltage to be
induced in the sensor system, introducing noise that
can cause erroneous readings. Cabling for sensors
should always be routed away from power cables. If the
instrumentation field wiring must cross power cables it
should cross perpendicular to the power cables in order
to avoid coupling the electromagnetic field.
The frequency response of the sensor is also strongly
affected by the amount of capacitance in the wiring
between the sensors and the monitor [8]. Extra
capacitance on the output of the sensor acts as a filter
and reduces the magnitude of the high frequency
components of the signal. DC and low frequency
components are not affected. Reference Figure 7 to see
a graph showing the effects of added capacitance.
ME617 ‐ A Few Sensor Types Used for Vibration Measurements 1
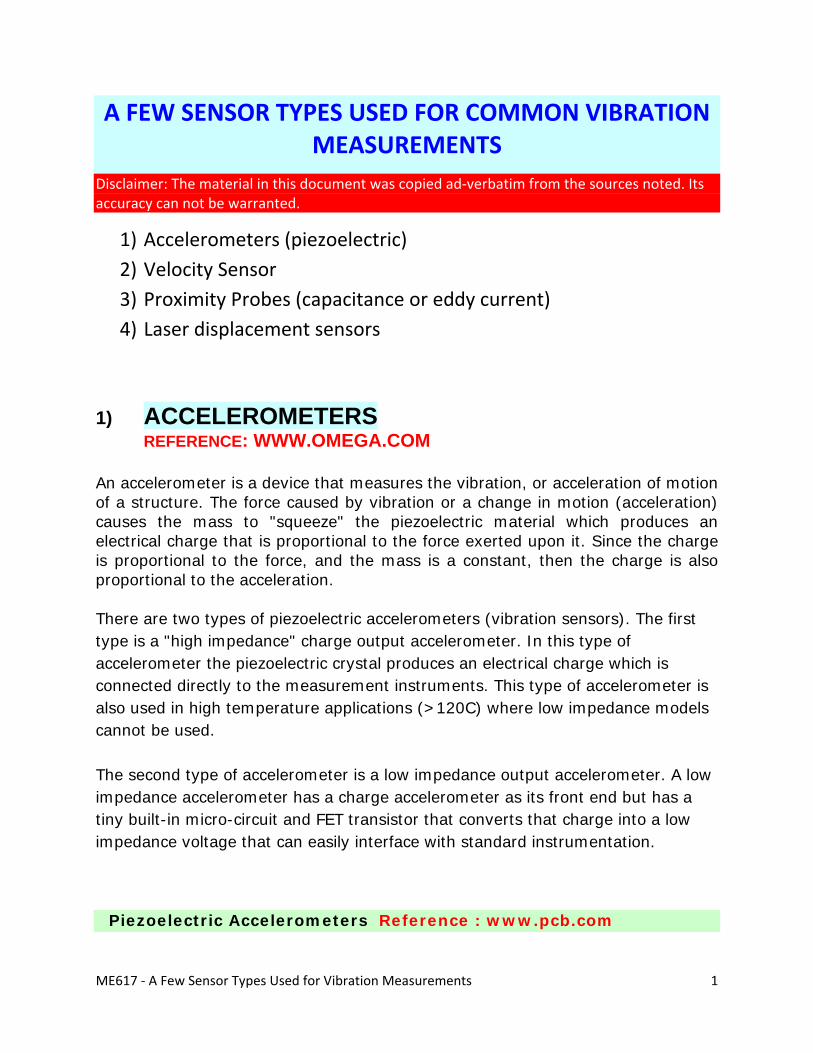
A FEW SENSOR TYPES USED FOR COMMON VIBRATION MEASUREMENTS
Disclaimer: The material in this document was copied ad‐verbatim from the sources noted. Its accuracy can not be warranted.
1) Accelerometers (piezoelectric)
2) Velocity Sensor
3) Proximity Probes (capacitance or eddy current)
4) Laser displacement sensors
1) ACCELEROMETERSREFERENCE: WWW.OMEGA.COM
An accelerometer is a device that measures the vibration, or acceleration of motion of a structure. The force caused by vibration or a change in motion (acceleration) causes the mass to "squeeze" the piezoelectric material which produces an electrical charge that is proportional to the force exerted upon it. Since the charge is proportional to the force, and the mass is a constant, then the charge is also proportional to the acceleration.
There are two types of piezoelectric accelerometers (vibration sensors). The first type is a "high impedance" charge output accelerometer. In this type of accelerometer the piezoelectric crystal produces an electrical charge which is connected directly to the measurement instruments. This type of accelerometer is also used in high temperature applications (>120C) where low impedance models cannot be used.
The second type of accelerometer is a low impedance output accelerometer. A low impedance accelerometer has a charge accelerometer as its front end but has a tiny built-in micro-circuit and FET transistor that converts that charge into a low impedance voltage that can easily interface with standard instrumentation.
Piezoelectric Accelerometers Reference : www.pcb.com

ME617 ‐ A Few Sensor Types Used for Vibration Measurements 2
Piezoelectric accelerometers rely on the piezoelectric effect of quartz or ceramic crystals to generate an electrical output that is proportional to applied acceleration. The piezoelectric effect produces an opposed accumulation of charged particles on the crystal. This charge is proportional to applied force or stress. A force applied to a quartz crystal lattice structure alters alignment of positive and negative ions, which results in an accumulation of these charged ions on opposed surfaces. These charged ions accumulate on an electrode that is ultimately conditioned by transistor microelectronics.
In an accelerometer, the stress on the crystals occurs as a result of the seismic mass imposing a force on the crystal. Over its specified frequency range, this structure approximately obeys Newton's law of motion, F=ma. Therefore, the total amount of accumulated charge is proportional to the applied force, and the applied force is proportional to acceleration. Electrodes collect and wires transmit the charge to a signal conditioner that may be remote or built into the accelerometer.
Shear Mode Accelerometer Shear mode designs bond, or "sandwich," the sensing crystals between a center post and seismic mass. A compression ring or stud applies a preload force required to create a rigid linear structure. Under acceleration, the mass causes a shear stress to be applied to the sensing crystals. By isolating the sensing crystals from the base and housing, shear accelerometers excel in rejecting thermal transient and base bending effects. Also, the shear geometry lends itself to small size, which minimizes mass loading effects on the test structure.

ME617 ‐ A Few Sensor Types Used for Vibration Measurements 3
Shear Mode Accelerometer
Flexural Mode Accelerometer Flexural mode designs utilize beam-shaped sensing crystals, which are supported to create strain on the crystal when accelerated. The crystal may be bonded to a carrier beam that increases the amount of strain when accelerated. This design offers a low profile, light weight, excellent thermal stability, and an economical price. Insensitivity to transverse motion is also an inherent feature of this design. Generally, flexural beam designs are well suited for low-frequency, low-g-level applications like those which may be encountered during structural testing.
Flexural Mode Accelerometer
Compression Mode Accelerometer Compression mode accelerometers offer simple structure, high rigidity, and historical availability. There are basically three types of compression designs: upright, inverted, and isolated.

ME617 ‐ A Few Sensor Types Used for Vibration Measurements 4
Upright compression designs sandwich the piezoelectric crystal between a seismic mass and rigid mounting base. An elastic stud or screw secures the sensing element to the mounting base. When the sensor is accelerated, the seismic mass increases or decreases the amount of force acting upon the crystal, and a proportional electrical output results. The larger the seismic mass is, the greater the stress and, hence, the output are.
Upright Compression Accelerometer
Inverted compression designs isolate the sensing crystals from the mounting base, reducing base bending effects and minimizing the effects of a thermally unstable test structure. Many reference standard calibration accelerometers use this design.
Inverted Compression Accelerometer
Isolated compression designs reduce erroneous outputs due to base strain and thermal transients. These benefits are achieved by mechanically isolating the

ME617 ‐ A Few Sensor Types Used for Vibration Measurements 5
sensing crystals from the mounting base and utilizing a hollowed-out seismic mass that acts as a thermal insulation barrier. These mechanical enhancements allow stable performance at low frequencies, where thermal transient effects can create signal "drift" with other compression designs.
Isolated Compression
Piezoelectric Material There are two types of piezoelectric material that are used in PCB accelerometers: quartz and polycrystalline ceramics. Quartz is a natural crystal, while ceramics are man-made. Each material offers certain benefits, and material choice depends on the particular performance features desired of the accelerometer.
Quartz is widely known for its ability to perform accurate measurement tasks and contributes heavily in everyday applications for time and frequency measurements.
2) VELOCITY SENSORS Theory of Operation REFERENCE : www.reliabilitydirect.com
When a coil of wire is moved through a magnetic field, a voltage is induced across
the end wires of the coil. The induced voltage is caused by the transferring of
energy from the flux field of the magnet to the wire coil. As the coil is forced
through the magnetic field by vibratory motion, a voltage signal representing the
vibration is produced.

ME617 ‐ A Few Sensor Types Used for Vibration Measurements 6
The Velocity Probe Reference:www.dliengineering.com
Some velocity transducers are made with a moving coil outside a stationary magnet. The principle of operation is the same. Another type of velocity transducer consists of an accelerometer with a built-in electronic integrator. This unit is called a "Velometer", and is by all accounts superior to the classic seismic velocity probe
The velocity probe was one of the first vibration transducers to be built. It consists of a coil of wire and a magnet so arranged that if the housing is moved, the magnet tends to remain stationary due to its inertia. The relative motion between the magnetic field and the coil induces a current that is proportional to the velocity of motion. The unit thus produces a signal directly proportional to vibration velocity. It is self-generating and needs no conditioning electronics in order to operate, and it has a relatively low electrical output impedance making it fairly insensitive to noise induction.
3) CAPACITIVE and EDDY CURRENT SENSORS
REFERENCE: www.lionprecision.com
Capacitive sensors use the electrical property of "capacitance" to make measurements. Capacitance is a property that exists between any two conductive surfaces within some reasonable proximity. Changes in the distance between the surfaces change the capacitance. It is this change of capacitance that capacitive sensors use to indicate changes in position of a target. High-performance displacement sensors use small sensing surfaces and as result are positioned close to the targets .

ME617 ‐ A Few Sensor Types Used for Vibration Measurements 7
CAPACITIVE SENSOR Reference: www.news.thomasnet.com
REFERENCE : www.thomasnet.com
d
EDDY CURRENT SENSOR PROBE
The working principle of the eddy current sensor is described below.
Eddy currents are formed when a moving (or changing) magnetic field intersects a
conductor, or vice-versa. The relative motion causes a circulating flow of electrons,
or currents, within the conductor. These circulating eddies of current create
electromagnets with magnetic fields that oppose the effect of the applied magnetic
field. The stronger the applied magnetic field, or greater the electrical conductivityy
of the conductor, or greater the relative velocity of motion, the greater the currents
developed and the greater the opposing field (Reference : www.wikipedia.org).

ME617 ‐ A Few Sensor Types Used for Vibration Measurements 8
Eddy current probes sense this formation of secondary fields to find out the distance
between the probe and the target material.
REFERENCE: www.geocities.com/raobpc/
REFERENCE :www.efunda.com

ME617 ‐ A Few Sensor Types Used for Vibration Measurements 9
4) LASER DISPLACEMENT SENSOR Reference : www.keyence.com
The Charge coupled device (CCD) laser displacement sensor uses a triangulationmeasurement system. Conventional laser displacement sensors employ aPosition sensitive detector (PSD) as the light-receiving element.. The light reflected by a target passes through the receiver lens and is focused on the PSDor CCD. The PSD uses the light quantity distribution of the entire beam spotentering the light receiving element to determine the beam spot center andidentifies this as the target position. However, the distribution of light quantity isaffected by the surface condition of the target, causing variations in measuredvalues. The CCD detects the peak value of the light quantity distribution of the beam spot for each pixel and identifies this as the target position. Therefore, theCCD enables stable highly accurate displacement measurement, regardless ofthe light quantity distribution of the beam spot.
These sensors can be used in high temperature environments.

ME617 ‐ A Few Sensor Types Used for Vibration Measurements 10
Light quantity distribution of beam spot on light-receiving element

Digital image
correlationIntroduction and theory
Courtesy of Trilion Quality Systems

2D DIC course presentationTrilion Education
Page 2
Page 2
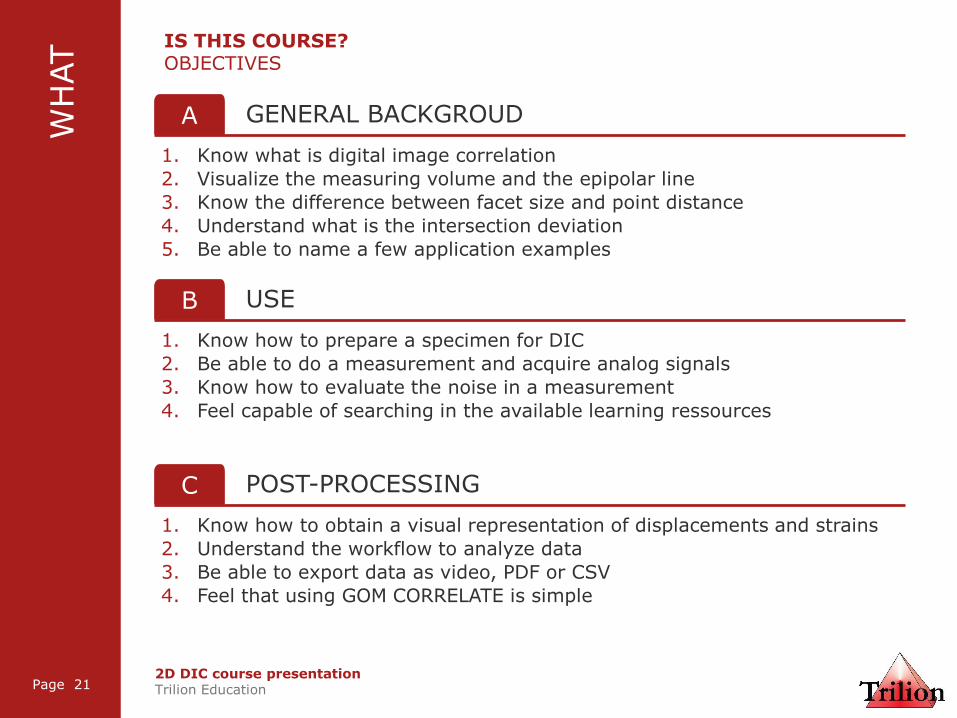
IS THIS COURSE?OBJECTIVES
WH
AT
GENERAL BACKGROUDA
1. Know what is digital image correlation
2. Visualize the measuring volume and the epipolar line
3. Know the difference between facet size and point distance
4. Understand what is the intersection deviation
5. Be able to name a few application examples
USEB
1. Know how to prepare a specimen for DIC
2. Be able to do a measurement and acquire analog signals
3. Know how to evaluate the noise in a measurement
4. Feel capable of searching in the available learning ressources
POST-PROCESSINGC
1. Know how to obtain a visual representation of displacements and strains
2. Understand the workflow to analyze data
3. Be able to export data as video, PDF or CSV
4. Feel that using GOM CORRELATE is simple

2D DIC course presentationTrilion Education
Page 3
Page 3
SHOULD WE USE ARAMIS?
• Position
• Dynamic displacement
• Dynamic deformation
• Speed / velocity
• Acceleration
• Strain
• Accelerometers
• LVDT
• Strain Gages
• Draw Wire Sensors
• Displacement Sensors
• Laser trackers
• Extensometers
• Clip gages
• Profilometer
WH
YWhat equipment or instrument would you need to do all the following static and dynamic measurements?
Previous solutions

2D DIC course presentationTrilion Education
Page 4
Page 4
SHOULD WE USE ARAMIS?TO OBTAIN FULL FIELD DISPLACEMENTS AND STRAIN MAP EASILY
WH
Y

2D DIC course presentationTrilion Education
Page 5
Page 5
SHOULD WE USE ARAMIS?POSSIBLE APPLICATIONS
• Determination of material properties
(i.e. FLC)
• Component analysis
• Structural testing and vibration
analysis (i.e. ODS)
• Validation and improvement of Finite
Element Analysis
• High-speed measurements
• Examination of non-linear behavior
• Real-time control of testing machines
• Crash and impact tests
• Characterization of creep and aging
processes
• NDT (Non Destructive Testing)
WH
Y

2D DIC course presentationTrilion Education
Page 6
Page 6
Microscopiccreeping
SHOULD WE USE ARAMIS?MATERIAL, TIME AND SCALE INDEPENDENT
WH
Y
Long term monitoring Real time High speed
Mate
ria
l
C
om
po
nen
tA
ssem
bly
Engine vibration
study
Split-Hopkinson
bars
Tensile testsCompressive tests
FLC
Fatigue test
Wing flex testBridge creep
monitoring
Impact testTool tracking
Fracture analysis
Macroscopic characterization
2D DIC course presentationTrilion Education
Page 7
Page 7
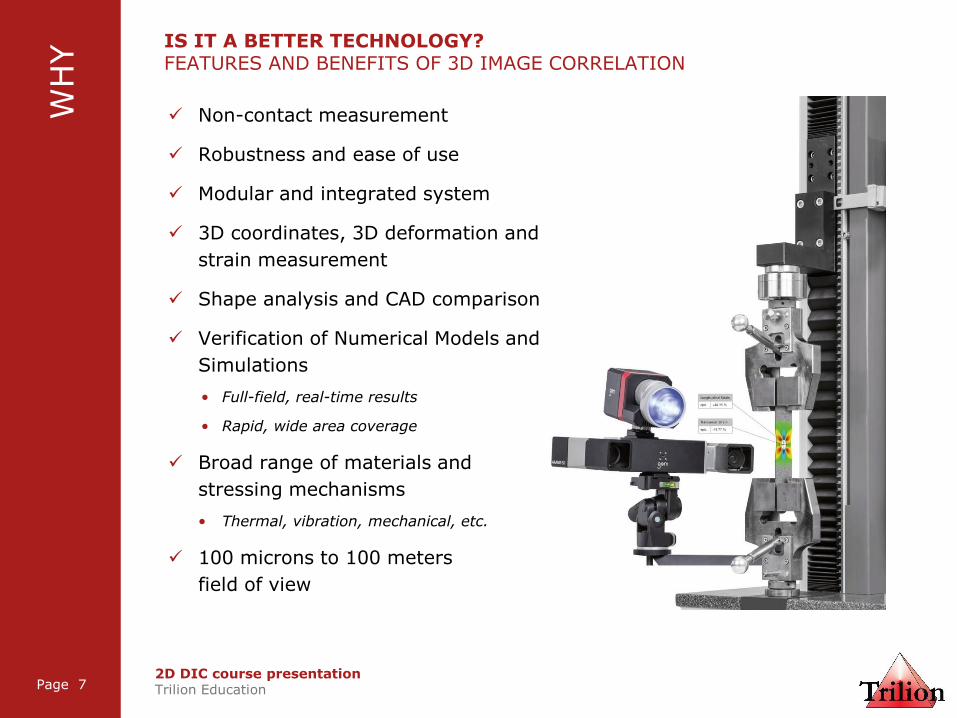
IS IT A BETTER TECHNOLOGY?FEATURES AND BENEFITS OF 3D IMAGE CORRELATION
Non-contact measurement
Robustness and ease of use
Modular and integrated system
3D coordinates, 3D deformation and
strain measurement
Shape analysis and CAD comparison
Verification of Numerical Models and
Simulations
• Full-field, real-time results
• Rapid, wide area coverage
Broad range of materials and
stressing mechanisms
• Thermal, vibration, mechanical, etc.
100 microns to 100 meters
field of view
WH
Y
2D DIC course presentationTrilion Education
Page 8
Page 8
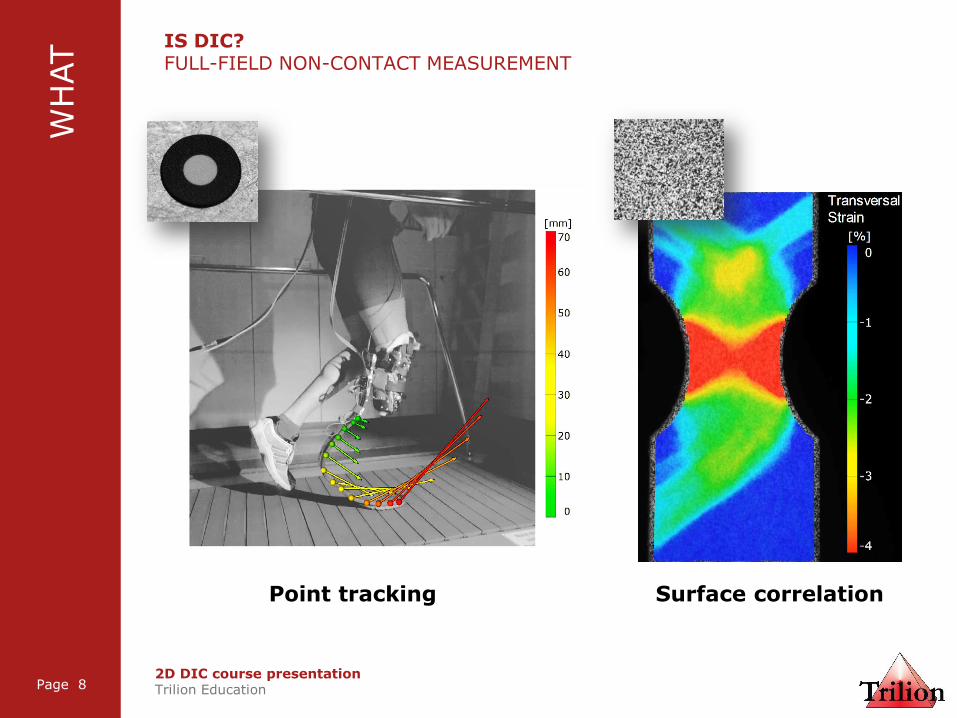
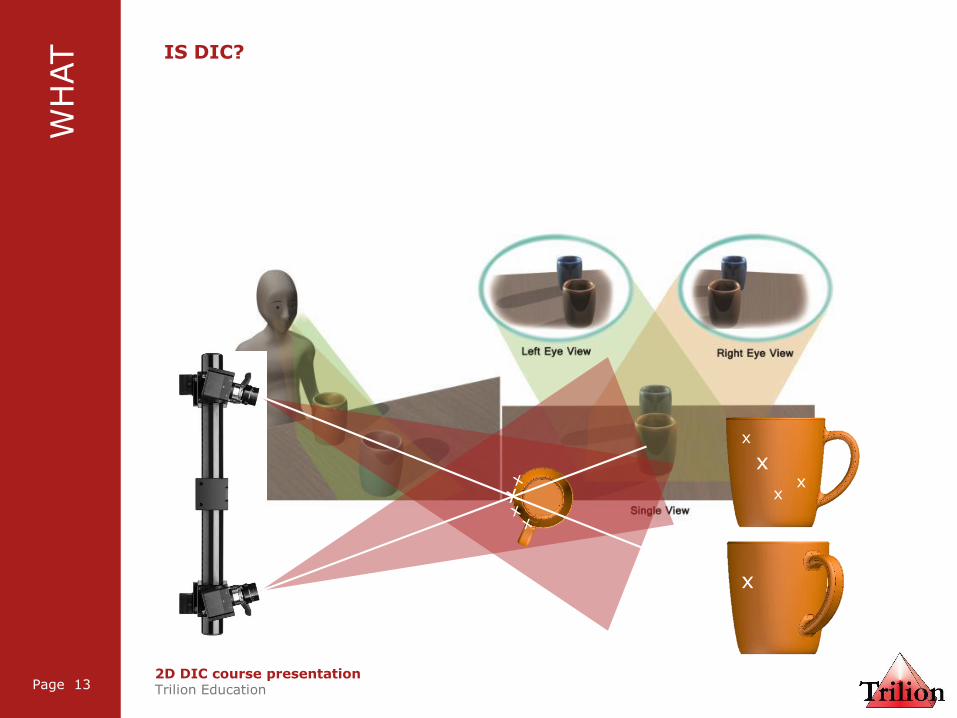
IS DIC?FULL-FIELD NON-CONTACT MEASUREMENT
WH
AT
Point tracking Surface correlation
2D DIC course presentationTrilion Education
Page 9
Page 9
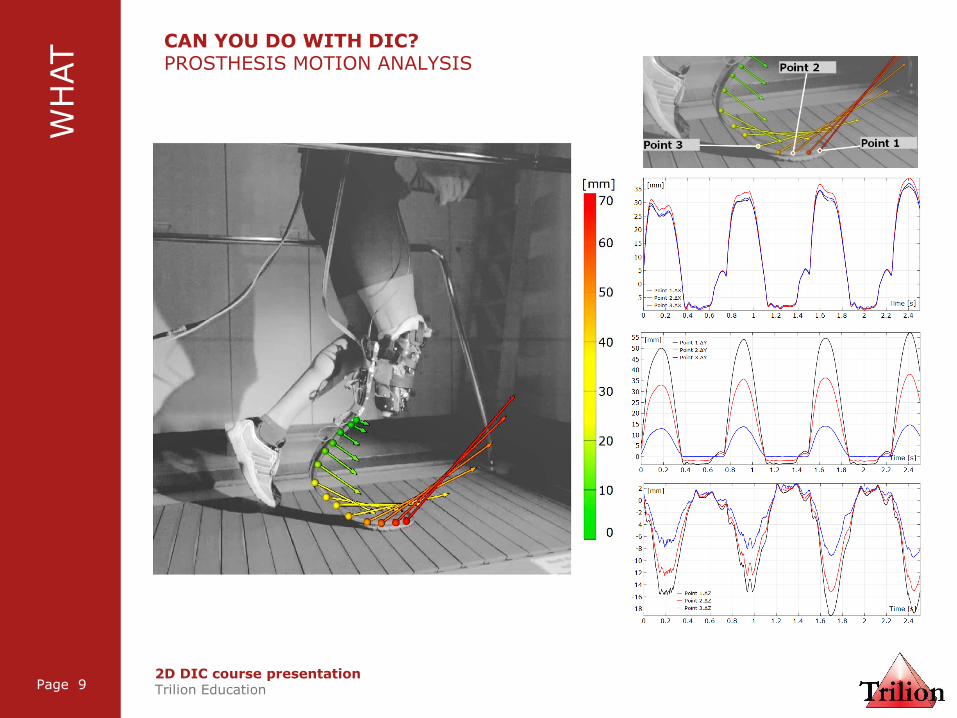
CAN YOU DO WITH DIC?PROSTHESIS MOTION ANALYSIS
WH
AT

2D DIC course presentationTrilion Education
Page 10
Page 10
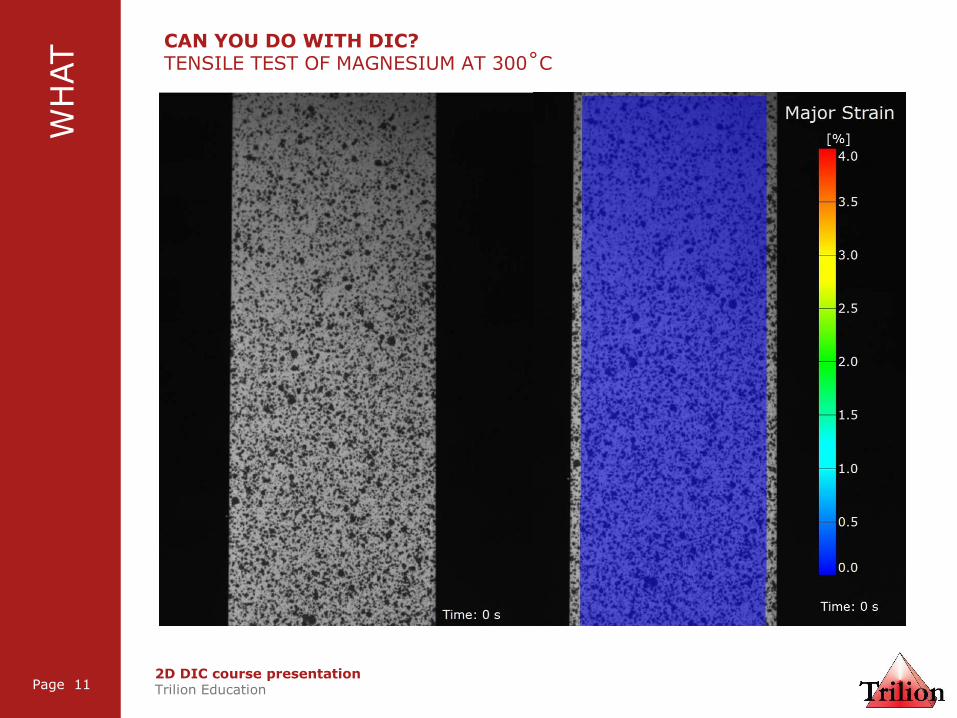
CAN YOU DO WITH DIC?TENSILE TEST OF MAGNESIUM AT 300˚C
WH
AT
2D DIC course presentationTrilion Education
Page 11
Page 11
CAN YOU DO WITH DIC?TENSILE TEST OF MAGNESIUM AT 300˚C
WH
AT
2D DIC course presentationTrilion Education
Page 12
Page 12
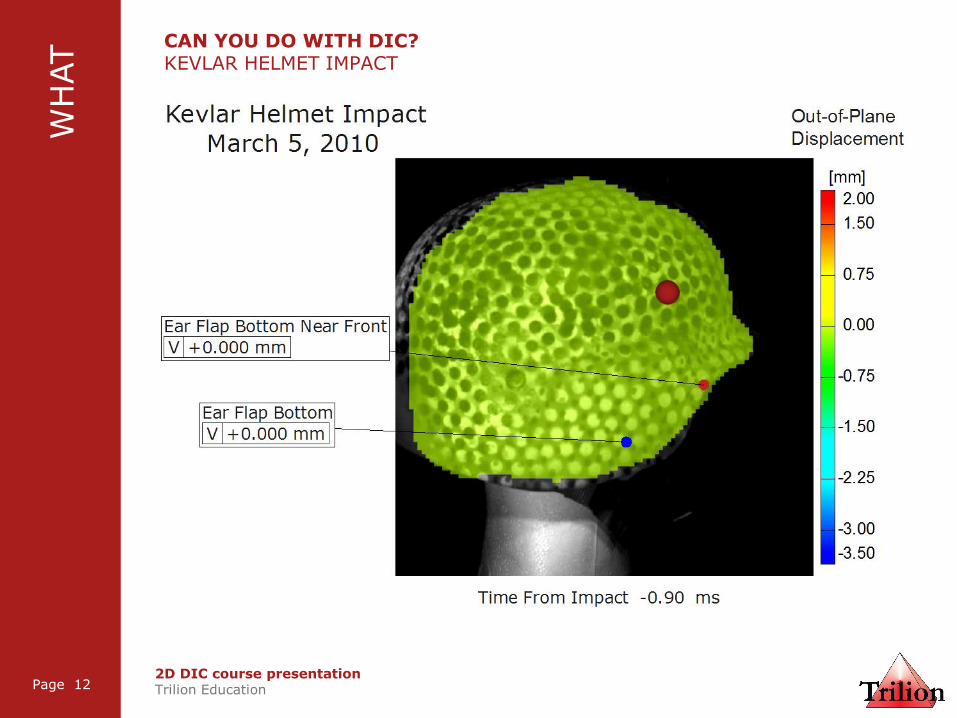
CAN YOU DO WITH DIC?KEVLAR HELMET IMPACT
WH
AT
2D DIC course presentationTrilion Education
Page 13
Page 13
IS DIC?W
HAT
x
x
xx
x
2D DIC course presentationTrilion Education
Page 14
Page 14
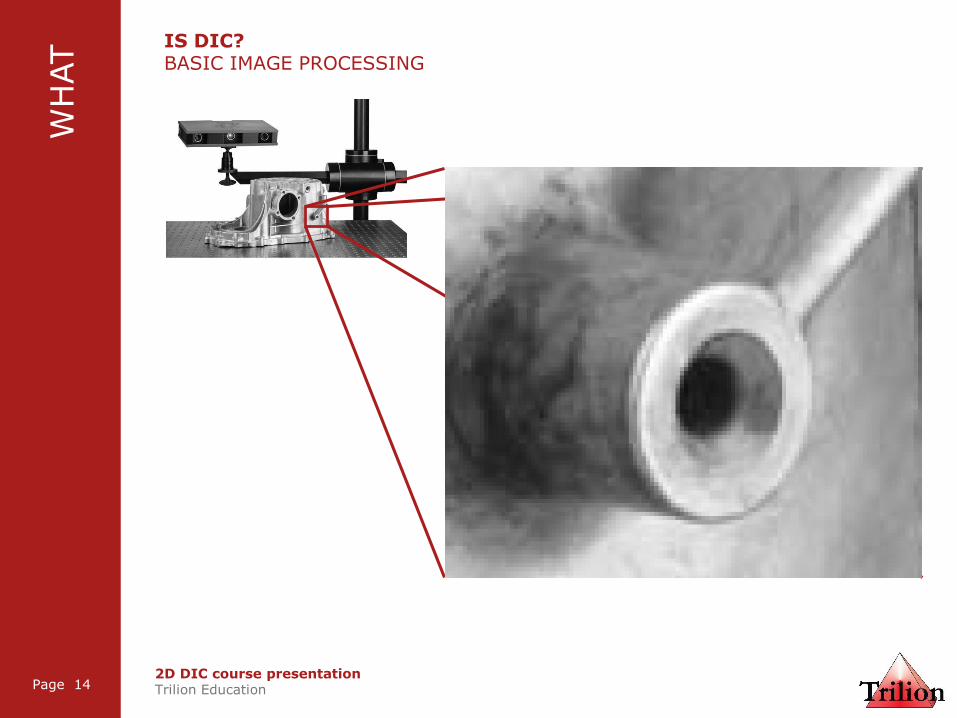
IS DIC?BASIC IMAGE PROCESSING
WH
AT

2D DIC course presentationTrilion Education
Page 15
Page 15
IS DIC?BASIC IMAGE PROCESSING
WH
AT
48
52
47
96
95
32
30
95
65
68
50
98
66
62
95
93
72
70
99
5
90
69
92
7
2

2D DIC course presentationTrilion Education
Page 16
Page 16
IS DIC?BASIC PRINCIPLE
WH
AT
100 100 100 100 100 100
100 100 100 100 100 100
100 100 100 100 100 100
100 100 100 100 100 100
100 100 100 100 100 100
100 100 100 100 100 100
0 0 0
0 0 0
0 0 0
0 0 0
0 0 0
0 0 0
0 0 0
0 0 0
0 0 0
0 0 0
0 0 0
0 0 0
0 0 0
0 0 0
0 0 0
Real image (9x9 pixels)As seen in the
computer’s memory

2D DIC course presentationTrilion Education
Page 17
Page 17
IS DIC?BASIC PRINCIPLE
WH
AT
After motionAs seen in the
computer’s memory
100 100 100 0 100 100
100 100 100 0 100 100
0 0 0 0 0 0
100 100 100 0 100 100
100 100 100 0 100 100
100 100 100 0 100 100
100 0 0
100 0 0
0 0 0
100 0 0
100 0 0
100 0 0
0 0 0
0 0 0
100 0 0
0 0 0
0 0 0
0 100 100
0 0 0
0 0 0
100 100 100

2D DIC course presentationTrilion Education
Page 18
Page 18
IS DIC?BASIC PRINCIPLE WITH NOISE CONSIDERATION
WH
AT
Before motion After motion
103 101 99 105 100 96
101 104 98 101 98 100
103 96 99 102 103 98
98 101 102 96 97 102
97 98 103 103 98 100
102 99 101 104 102 101
2 0 1
1 4 3
0 2 2
0 1 0
0 2 0
2 0 0
1 1 2
0 2 1
0 3 0
3 0 1
0 3 0
2 0 0
2 3 0
1 3 3
0 0 2
99 100 101 2 100 102
101 97 98 0 96 102
0 1 3 1 2 0
97 99 100 0 97 101
101 103 98 1 99 96
102 99 96 3 102 100
102 3 0
101 1 2
3 2 0
101 3 2
101 0 1
103 2 3
0 2 1
0 1 1
103 0 2
1 0 3
2 2 0
1 102 101
1 0 3
1 3 2
101 100 100

2D DIC course presentationTrilion Education
Page 19
Page 19
IS DIC?BASIC PRINCIPLE AND SUBPIXEL INTERPOLATION
WH
AT
103 101 99 55 100 96
101 104 98 51 98 100
103 96 99 52 103 98
98 101 102 46 97 102
97 98 103 53 98 100
102 99 101 54 102 101
52 0 1
51 4 3
49 2 2
52 1 0
51 2 0
48 0 0
1 1 2
0 2 1
0 3 0
3 0 1
0 3 0
2 0 0
2 3 0
1 3 3
0 0 2
Perfect match

2D DIC course presentationTrilion Education
Page 20
Page 20
IS DIC?WITH ROUND TARGET MARKERS
WH
AT
Radius (length of ray intersection)
Gra
ysca
les
2D DIC course presentationTrilion Education
Page 21
Page 21
IS THIS COURSE?OBJECTIVES
WH
AT
GENERAL BACKGROUDA
1. Know what is digital image correlation
2. Visualize the measuring volume and the epipolar line
3. Know the difference between facet size and point distance
4. Understand what is the intersection deviation
5. Be able to name a few application examples
USEB
1. Know how to prepare a specimen for DIC
2. Be able to do a measurement and acquire analog signals
3. Know how to evaluate the noise in a measurement
4. Feel capable of searching in the available learning ressources
POST-PROCESSINGC
1. Know how to obtain a visual representation of displacements and strains
2. Understand the workflow to analyze data
3. Be able to export data as video, PDF or CSV
4. Feel that using GOM CORRELATE is simple

2D DIC course presentationTrilion Education
Page 22
Page 22
TO USEBASIC WORKFLOW
1. Decide field of view and frame rate
2. Apply adequate stochastic pattern
3. Set up cameras
a. Focus (with aperture fully open)
b. Apply desired frame rate and close
aperture
4. Pre-test (pattern and noise check)
5. Data Acquisition
6. Data processing
7. Reporting
HO
W

2D DIC course presentationTrilion Education
Page 23
Page 23
TO USESURFACE PREPARATION AND PATTERNING
Standard spray paint patterning
• Dot size 5 Pixels
• Degrease / sand the Surface
• Uniform white background coating
• Apply appropriate sized black dots
• Use developer (Talc powder) for
removable coating
• Use discrete black and white dots
for compression testing, low
strength materials or for discrete
point tracking
Alternative patterning methods
• Sharpy Marker
• Perforated Sheets for Dots > 1/8”
• Tattoo Sheets
• Rubber Stamps
• Nothing…
HO
W

2D DIC course presentationTrilion Education
Page 24
Page 24
TO USEDEFINE THE FIELD OF VIEW AND THE SIZE OF THE PATTERN
• What is the size of one pixel?
• What is the size of a dot?
Multiply by 5
Between 0.2 mm in size
HO
W
100 mm
2,450 px= 𝑥
mm
px⇒ 𝟎. 𝟎𝟒 𝐦𝐦/𝐩𝐢𝐱𝐞𝐥
100 mm
85 m
m
2,450 pixels2,0
50 p
ixels

2D DIC course presentationTrilion Education
Page 25
Page 25
TO USEPREPARE YOUR SURFACES LIKE GEORGES AND BE CREATIVE!!!
HO
W

2D DIC course presentationTrilion Education
Page 26
Page 26
CAN YOU DO WITH DIC?KEVLAR HELMET IMPACT
WH
AT
• What do you notice about this pattern?
• Can you describe this pattern?

2D DIC course presentationTrilion Education
Page 27
Page 27
TO USEBASIC WORKFLOW
1. Decide field of view and frame rate
2. Apply adequate stochastic pattern
3. Set up cameras
a. Focus (with aperture fully open)
b. Apply desired frame rate and close
aperture
4. Pre-test (pattern and noise check)
5. Data Acquisition
6. Data processing
7. Reporting
HO
W
2D DIC course presentationTrilion Education
Page 28
Page 28
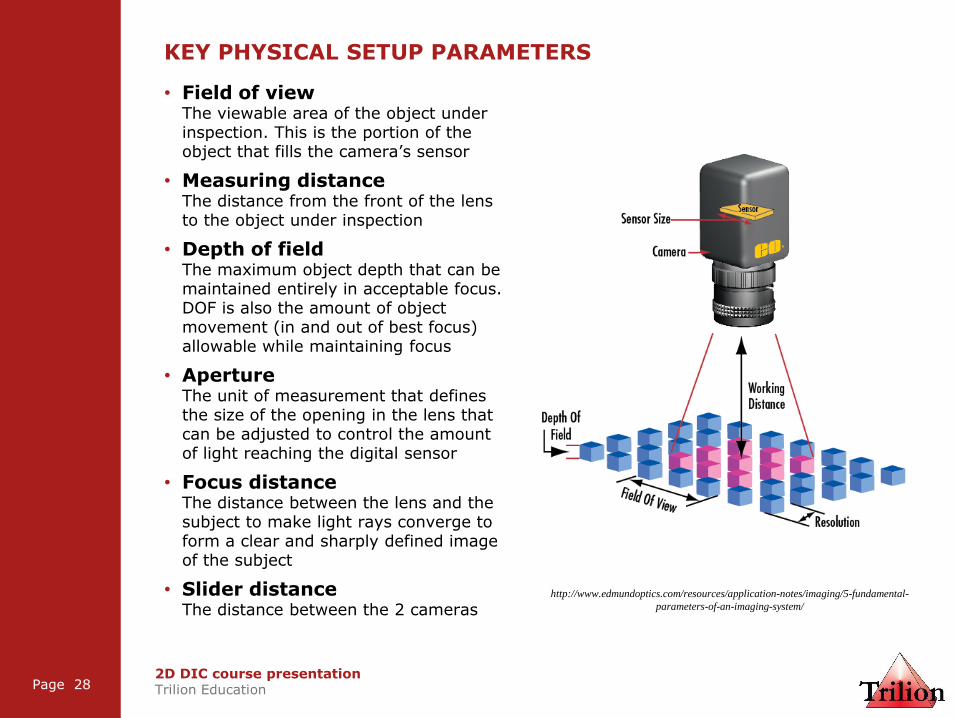
KEY PHYSICAL SETUP PARAMETERS
• Field of viewThe viewable area of the object under inspection. This is the portion of the object that fills the camera’s sensor
• Measuring distanceThe distance from the front of the lens to the object under inspection
• Depth of fieldThe maximum object depth that can be maintained entirely in acceptable focus. DOF is also the amount of object movement (in and out of best focus) allowable while maintaining focus
• ApertureThe unit of measurement that defines the size of the opening in the lens that can be adjusted to control the amount of light reaching the digital sensor
• Focus distanceThe distance between the lens and the subject to make light rays converge to form a clear and sharply defined image of the subject
• Slider distanceThe distance between the 2 cameras
http://www.edmundoptics.com/resources/application-notes/imaging/5-fundamental-
parameters-of-an-imaging-system/

2D DIC course presentationTrilion Education
Page 29
Page 29
KEY PHYSICAL SETUP PARAMETERSFIELD OF VIEW AND LENSE CHOICE (MEASURING DISTANCE OF 6 METERS)
100 mm lens
i.e. 800mm for a FOV of 50mm
24mm lens
i.e. 175mm for a FOV of 50mm
2D DIC course presentationTrilion Education
Page 30
Page 30
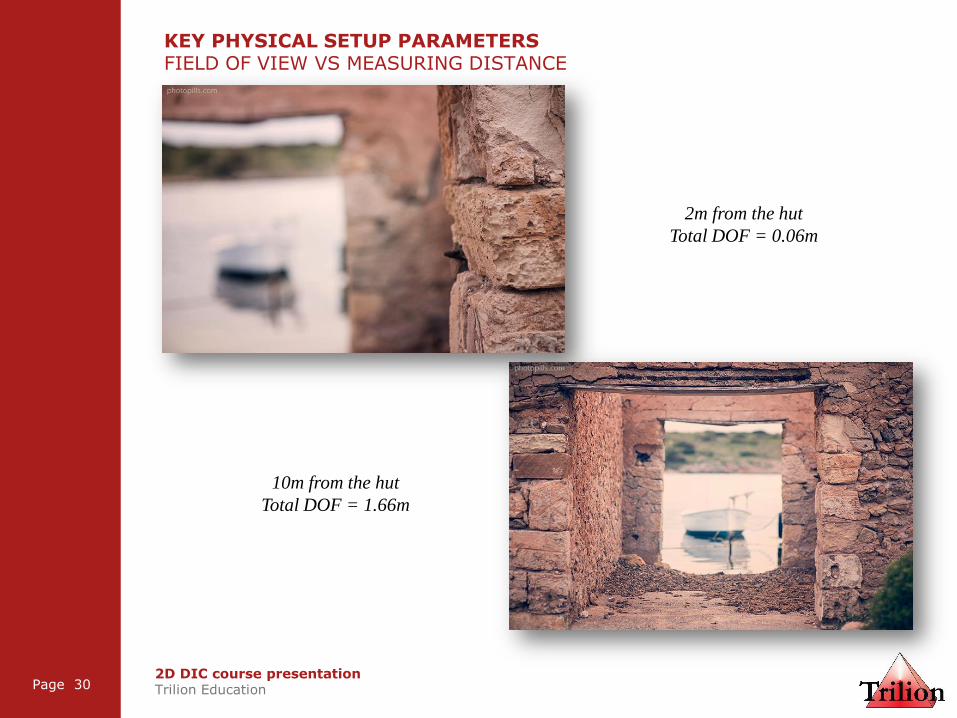
KEY PHYSICAL SETUP PARAMETERSFIELD OF VIEW VS MEASURING DISTANCE
10m from the hut
Total DOF = 1.66m
2m from the hut
Total DOF = 0.06m

2D DIC course presentationTrilion Education
Page 31
Page 31
KEY PHYSICAL SETUP PARAMETERSAPERTURE VS DEPTH OF FIELD

2D DIC course presentationTrilion Education
Page 32
Page 32
KEY PHYSICAL SETUP PARAMETERSAPERTURE VS DEPTH OF FIELD
2D DIC course presentationTrilion Education
Page 33
Page 33
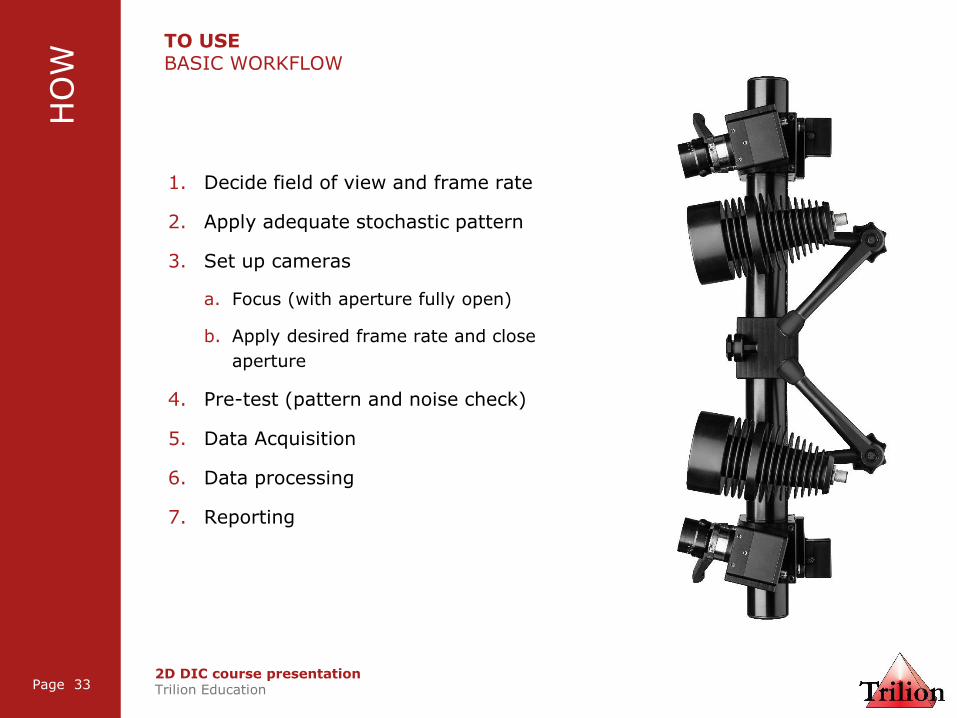
TO USEBASIC WORKFLOW
1. Decide field of view and frame rate
2. Apply adequate stochastic pattern
3. Set up cameras
a. Focus (with aperture fully open)
b. Apply desired frame rate and close
aperture
4. Pre-test (pattern and noise check)
5. Data Acquisition
6. Data processing
7. Reporting
HO
W
2D DIC course presentationTrilion Education
Page 34
Page 34
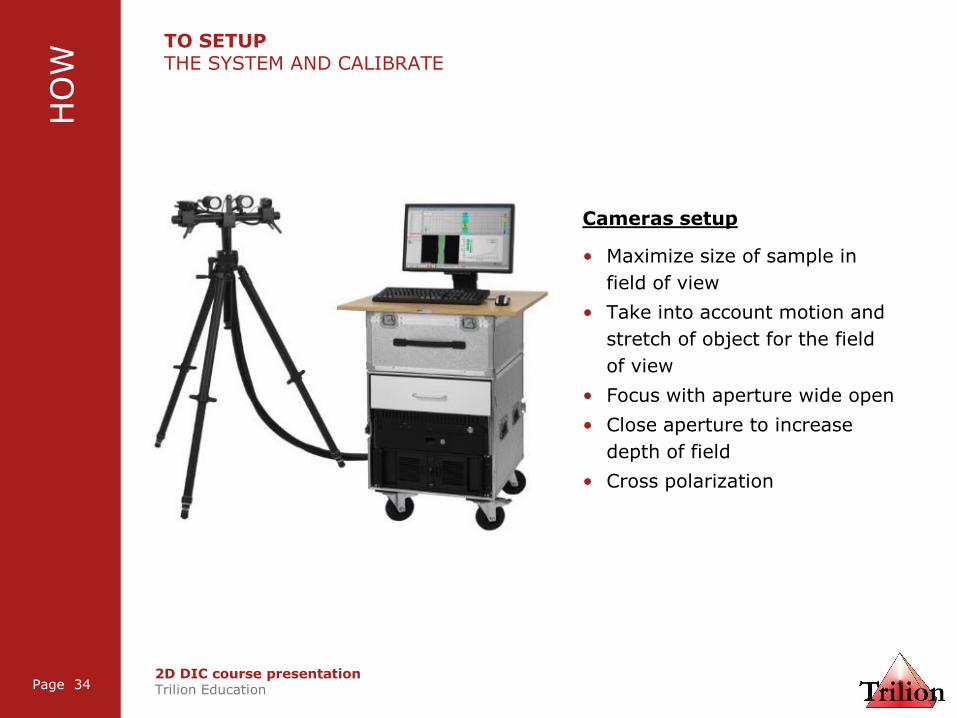
Cameras setup
• Maximize size of sample in
field of view
• Take into account motion and
stretch of object for the field
of view
• Focus with aperture wide open
• Close aperture to increase
depth of field
• Cross polarization
HO
WTO SETUPTHE SYSTEM AND CALIBRATE

2D DIC course presentationTrilion Education
Page 35
Page 35
TO USEBASIC WORKFLOW
1. Decide field of view and frame rate
2. Apply adequate stochastic pattern
3. Set up cameras
a. Focus (with aperture fully open)
b. Apply desired frame rate and close
aperture
4. Pre-test (pattern and noise check)
5. Data Acquisition
6. Data processing
7. Reporting
HO
W

2D DIC course presentationTrilion Education
Page 36
Page 36
TO SETUPTHE PRE-TEST AND THE EXPECTED SENSITIVITY
• Based on the computation, the noise should be about 1/30 of a pixel
out-of-plane
• In-plane, the noise should be 3 times lower
• Since strain is a relative value based on the displacements, we typically
have noise level around 50-100 microstrain
• Filtering reduces noise and increases accuracy but it also reduces spatial
resolution
Example for a 5MP sensor:
Field of View Out-of-plane displacement sensitivity
10 x 8 mm 0.15 microns
100 x 80 mm 1.5 microns
1 meter x 800 mm 15 microns
HO
W

2D DIC course presentationTrilion Education
Page 37
Page 37
TO USEDEFINE THE FIELD OF VIEW AND THE RESOLUTION
• What is the size of one pixel?
100 mm
2,450 px= 𝑥
mm
px⇒ 𝟎. 𝟎𝟒 𝐦𝐦/𝐩𝐢𝐱𝐞𝐥
100 mm
85 m
m
2,450 pixels
2,0
50 p
ixels
HO
W

2D DIC course presentationTrilion Education
Page 38
Page 38
SUMMARYBEST PRACTICES ON HOW TO USE, SETUP AND ACQUIRE DATA
Apply a good speckle pattern, make sure you have uniform lighting and
calibrate frequently to ensure consistent quality
Always do a pre-test to check the sensitivity
• Snap a few images with no load and compute displacements and strains
• Make sure that there are no major holes in the data
• Check average and peak strains
• Look for false hot spots
And above all:
• 5 pixels per paint dot
• Check the pattern and verify the noise level
• Intersection error must be lower than 0.3
• Be aware of the coordinate system of your results
HO
W

2D DIC course presentationTrilion Education
Page 39
Page 39
TO USEBASIC WORKFLOW
1. Decide field of view and frame rate
2. Apply adequate stochastic pattern
3. Set up cameras
a. Focus (with aperture fully open)
b. Apply desired frame rate and close
aperture
4. Pre-test (pattern and noise check)
5. Data Acquisition
6. Data processing
7. Reporting
HO
W

2D DIC course presentationTrilion Education
Page 41
Page 41
THEORYFACET PARAMETERS
Facet sizeat least 3 to 5 speckles
Point distance(granularity of the mesh)
HO
W

2D DIC course presentationTrilion Education
Page 42
Page 42
THEORYSTRAIN COMPUTATION
HO
W
2D DIC course presentationTrilion Education
Page 43
Page 43
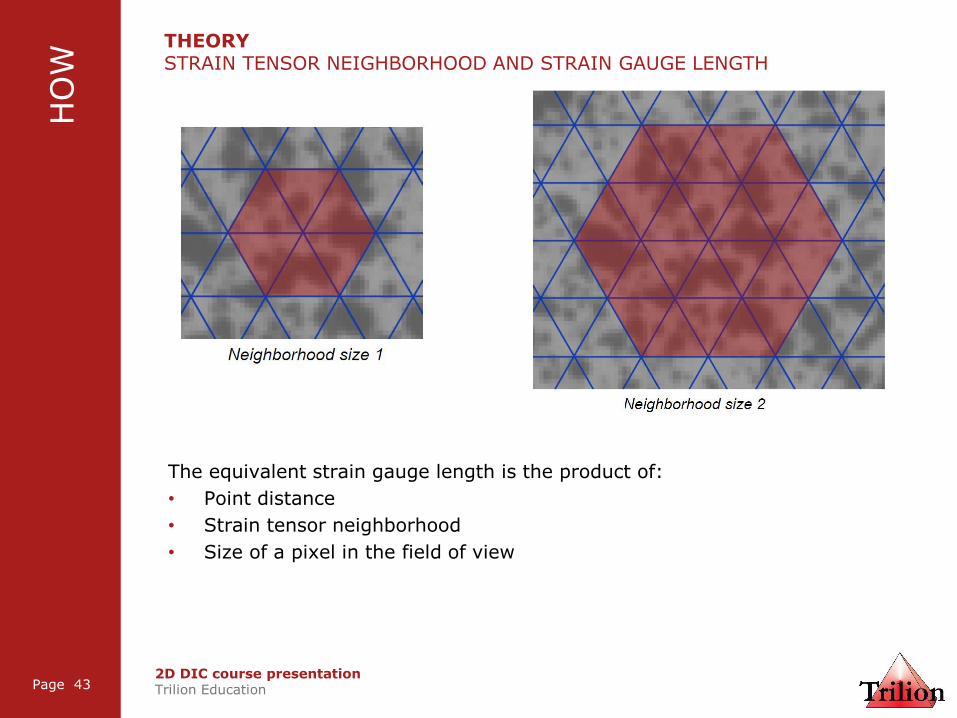
THEORYSTRAIN TENSOR NEIGHBORHOOD AND STRAIN GAUGE LENGTH
The equivalent strain gauge length is the product of:
• Point distance
• Strain tensor neighborhood
• Size of a pixel in the field of view
HO
W
2D DIC course presentationTrilion Education
Page 44
Page 44
THEORYFILTERING
HO
W
Spatial filter
• Average each data point with its neighbors
• Spreads hotspots
• Useful when material is uniform
Time filter
• Average each data point with the previous and next stages
• Spreads hotspots
• Useful when acquisition speed are not quite adequate for the test speed
• Useful to smooth quasi-static data

2D DIC course presentationTrilion Education
Page 45
Page 45
THEORYTEMPORAL FILTERING
No filter Time filter (5 passes)
HO
W

2D DIC course presentationTrilion Education
Page 46
Page 46
THEORYSPATIAL FILTERING
HO
W
No filter Spatial filter(5 passes)

THANK YOU FOR YOUR ATTENTION
For more information, feel free to contact Trilion Quality Systems:
Jonathan Pickworth
Trilion Quality Systems
Charles-Olivier Amyot
Trilion Quality Systems
418.456.4327
Rev. 1 20170125


IntroductionThe heart beats, wings flap, sounds are sent out and received – life would be much too quiet with-out vibrations. To investigate vibrating systems in nature requires sensitive and flexible measurements that don’t disturb the specimen. Challenging tasks in medicine, biology and many other sciences take advantage of Polytec‘s uni versal modular vibrome-ters, single-box portable devices, or high-end scanning systems.
In the field of industrial research and development, Polytec’s vibrometers are used to study objects ofvery different sizes including large automobile bo-dies, airplane fuselages, ship engines and buildings as well as tiny silicon micromachines, hard disk drive components and wirebonders. There are numerous other research applications in mechanical and civil engineering.
Demanding applications such as measurements on hot running exhausts, rotating surfaces, under water
objects, delicate structures or ultrasonic devices are all made possible by non-contact laser vibrometry.
At the heart of every Polytec vibrometer system is the laser Doppler vibrometer – a very precise optical transducer used for determining the vib ration velocity and displacement at a point by sensing the frequen-cy shift and phase variation of back scattered laser light from a moving surface. To learn more about laser Doppler vibrometry, please visit www.polytec.com/vib-university
Nature & Technology: Vibrations Everywhere!
Advancing Measurements by Light www.polytec.com
Application Note
A Aerospace
B Audio & Acoustics
C Automotive
D Data Storage
G General Vibrometry
M MEMS & Microstructures
P Production Testing
S Scientific & Medical
T Structural Testing
U Ultrasonics
Field of Application
Polytec GmbHOptical Measurement SystemsApplication NoteVIB-G-05
June 2006
Polytec’s Vibrometers are Indispensable Tools to Optimize Parts and Goods and to Investigate Natural Dynamic Processes
Originally developed to characterize man-made products, technology and systems, non-contact
laser-Doppler vibrometry is also exploring measurements that unravel the mysteries of biological
structures. Read on to learn more about vibrations in both nature and technical products and pro-
cesses. Discover how these vibrations are detected and studied using laser vibrometry. Find more
interesting applications and Polytec Application Notes on www.polytec.com/applications.
HeNe-LaserBS1
BS3
Bragg Cell
BS2Optical Lens Measure-
ment Object

Polytec vibrometers. The vibro meter can also function as a non-contact poly-graph detector recording artery pulse waves and res piratory activity, or as a remote voice detector as a part of a multi-media surveillance system. www.polytec.com/research
2
BiologyFor numerous living species on our planet there are corresponding biological appli-cations of laser vibrometry. One of the most prominent is insect communication. Some insect sounds are quite loud, such as the singing of the cicada; while others are supersonic and can’t be heard. Some insects are so small that their songs are trans mitted mainly through a plant rather than air. Entomologists use vibrometers to record this unheard noise for later study. Consider honeycomb vibrations in bee-hives; these signals can only be measured with highly sophisticated equipment. Other bio applications include measuring communication between elephants, fruit ripeness, spider web motion, and the hea-ring mechanism in frogs and fruit flies. www.polytec.com/research
Medical and Health CareLaser vibrometry can assist with eardrum diagnos tics and research on the middle and inner ear. In addition, vibrometers have been used for vib ra tion measure-ments on artificial heart valves, mecha-nical properties of tendons, analysis of vibrations while bone drilling or medical laser ab lation, and detection of bone crack propagation.
Medical, safety and health care devices like tooth brushes, dental scalers and respirators have been investigated using
Measurement of honeycomb vibrations generated by dancing bees
Drosophila head and laser spot focused onto its antenna sound receiver
Laser Audiometer providing full ear diag-nostics within a couple of seconds
Laser vibrometer measurements of the vibration patterns of dental ultrasonic scaling equipment
Scanning vibro meter representation of heart valve motion

3
AcousticsMusical instruments generate wonderful, inspiring sounds through their vibrations. Polytec vibro meters can help us understand how this happens with early work already done on violins, cembalos and dulci-mers. Vibrometers are also indispensable tools for loudspeaker design identifying diaphragm resonances that are deleterious to the sound quality. Vibro-meter measurements provide an experimental basis for sophisticated acoustic investigations like structural-acoustic response (sound field) predic-tions, acoustic imaging and anti-sound research. Acoustics are also increasingly important in pro-duct design. The focus is on how and where are undesired noises generated and at which point or location can countermeasures be taken.
Sound field measurement using PSV Scanning Vibrometer (photo courtesy: Bosch)
Automotive DevelopmentTo certify that a new part meets noise and vibration specifications, auto-motive engineers favor testing in struments that are easy to set up and operate, and that can exchange data with existing CAE equipment and software. Polytec’s laser vibrometers are widely used both for structural dynamics measurements in the R&D labs and for quality control purposes in the production process. Laser vibrometry gives the opportunity to opti-mize dynamic automotive FE models by matching the parameters derived from vibration measurements on pro totypes to the FE model. Scanning vibrometers provide time saving measurements without mass loading regard less whether on large areas, hot components, ro tating parts, light weight surfaces, or at high frequencies. www.polytec.com/automotive
Valve train measurement using High Speed Vibrometer (photo courtesy: Porsche)
3-D vibrometry on brake disks to reveal brake sqealing
3-D scanning measurement of structural dynamics of a car body
Operational deflection shape of a violin
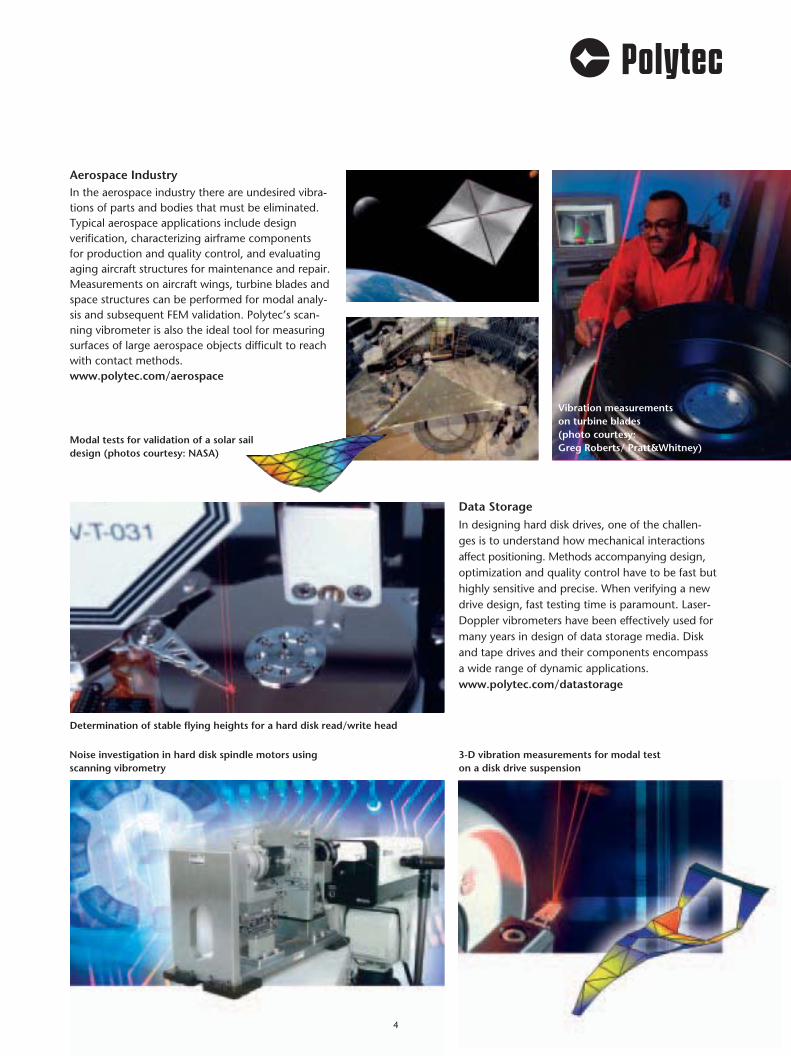
Aerospace IndustryIn the aerospace industry there are undesired vibra-tions of parts and bodies that must be eli minated. Typical aerospace applications include design verification, characterizing airframe components for production and quality control, and evaluating aging aircraft structures for maintenance and repair. Measurements on aircraft wings, turbine blades and space structures can be performed for modal analy-sis and subsequent FEM validation. Polytec’s scan-ning vibrometer is also the ideal tool for measuring surfaces of large aero space objects difficult to reach with contact methods. www.polytec.com/aerospace
Data StorageIn designing hard disk drives, one of the challen -ges is to understand how mechanical inter actions affect positioning. Methods accompanying design, optimization and quality control have to be fast but highly sensitive and precise. When verifying a new drive design, fast testing time is paramount. Laser-Doppler vibrometers have been effectively used for many years in design of data storage media. Disk and tape drives and their components encompass a wide range of dynamic applications. www.polytec.com/datastorage
Noise investigation in hard disk spindle motors using scanning vibrometry
Determination of stable flying heights for a hard disk read/write head
3-D vibration measurements for modal test on a disk drive suspension
Modal tests for validation of a solar sail design (photos courtesy: NASA)
Vibration measurements on turbine blades (photo courtesy: Greg Roberts/ Pratt&Whitney)
4
5
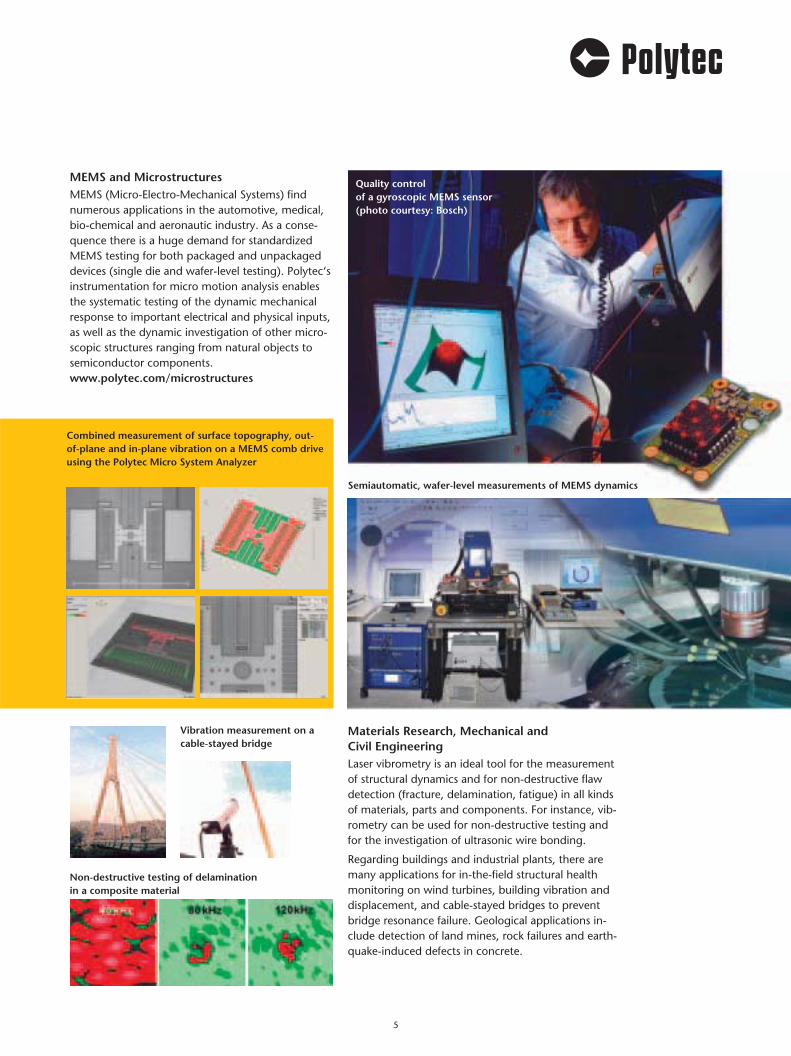
MEMS and MicrostructuresMEMS (Micro-Electro-Mechanical Systems) find numerous applications in the automotive, medical, bio-chemical and aeronautic industry. As a conse-quence there is a huge demand for standardized MEMS testing for both packaged and unpackaged devices (single die and wafer-level testing). Polytec‘s instrumentation for micro motion analysis enables the systematic testing of the dynamic mechanical response to important electrical and physical inputs, as well as the dynamic investigation of other micro-scopic structures ranging from natural objects to semiconductor components. www.polytec.com/microstructures
Materials Research, Mechanical and Civil EngineeringLaser vibrometry is an ideal tool for the measurement of structural dynamics and for non-destructive flaw detection (fracture, delamination, fatigue) in all kinds of materials, parts and components. For instance, vib-rometry can be used for non-destructive testing and for the investigation of ultrasonic wire bonding.
Regarding buildings and industrial plants, there are many applications for in-the-field structural health monitoring on wind turbines, building vibration and displacement, and cable-stayed bridges to prevent bridge resonance failure. Geological applications in-clude detection of land mines, rock failures and earth-quake-induced defects in concrete.
Semiautomatic, wafer-level measurements of MEMS dynamics
Combined measurement of surface topography, out-of-plane and in-plane vibration on a MEMS comb drive using the Polytec Micro System Analyzer
Quality control of a gyroscopic MEMS sensor (photo courtesy: Bosch)
Vibration measurement on a cable-stayed bridge
Non-destructive testing of delamination in a composite material

Tech
nica
l sp
ecifi
catio
ns a
re s
ubje
ct t
o ch
ange
with
out
notic
e. O
M_A
N_V
IB-G
-05_
2011
_01_
PDF_
US
Advancing Measurements by Light
Polytec GmbH (Germany)Polytec-Platz 1-776337 Waldbronn Tel. + 49 7243 604-0Fax + 49 7243 [email protected]
Polytec France S.A.S.Bâtiment Orion – 1er étage39, rue Louveau92320 ChâtillonTel. +33 1 496569-00Fax +33 1 [email protected]
Polytec Ltd.(Great Britain)Lambda House, Batford Mill Harpenden, Herts A L5 5BZTel. + 44 1582 711670Fax + 44 1582 [email protected]
Polytec Japan Arena Tower, 13th floor3-1-9, Shinyokohama, Kohoku-ku, Yokohama-shi, Kanagawa, 222-0033Tel. +81 45 478-6980Fax +81 45 [email protected]
Polytec, Inc. (USA) North American Headquarters16400 Bake ParkwaySuites 150 & 200Irvine, CA 92618Tel. +1 949 943-3033Fax +1 949 [email protected]
Central Office1046 Baker RoadDexter, MI 48130Tel. +1 734 253-9428Fax +1 734 424-9304
East Coast Office25 South Street, Suite AHopkinton, MA 01748Tel. +1 508 417-1040Fax +1 508 544-1225
Please find more interesting applications and Polytec Application Notes on www.polytec.com/applications
Metrology and CalibrationPrimary calibration of vibration transducers by laser Interferometry has the unique advantage that meas-urements of surface acceleration, velocity or dis-placement are made with a precision that is trace-able directly to the wavelength of laser light. Also, laser vibrometric velocity measurements offer the possibility to perform traceable impulse calibrations of trans ducers subjected to known impulse loads.
Production Testing The optimization of products and processes plays an important role in a company’s economic success. In industrial production, process and quality control relies on fast, automated and rugged meas urement instrumentation. For both 100% quality control of manufactured products and on-line monitoring in continuous production, Polytec provides interfe-rometric sensors that optically measure vibration, but also velocity, length and surface integrity. In addition, they offer many specific advantages for industrial production applications such as precise results without contact, a flexible retrofitting and continuous operation under industrial conditions with low maintenance. www.polytec.com/industrial
Calibration of impulse force trans-ducers using a laser interferometer
Semiautomatic test station based on a Compact Laser Vibrometer for qua-lity control of medical devices
Automatic vibration analysis for crack testing of cam rings
Automated 100% quality assurance of vehicle com-ponents (photo courtesy: P. Marpe, TRW Automotive)