suwlwlary technical report cool( islands …pdf.usaid.gov/pdf_docs/pnabx635.pdf · name tongareva...
TRANSCRIPT


P- 149
SUWlWlARY TECHNICAL REPORT 95-04
Cool( ISLANDS BLACK-LIP PEARL OYSTER PROJECT
The Pacific Islands Marine Resource Project Cook Islands Component
Project No. 879-0020
Prepared by RDA International, Inc. under Contract No. 879-0020-C-00-1 177-00
wi th USAIDIRDOISP
September 1995
RDA International, Inc. 801 Morey Drive
Placerville, California 95667-441 1 Telephone: (91 6 ) 622-8800 Facsimile: (91 6) 626-7391
Cover Photo' B lack- l~p Pearl Oyster (Pinctada ~nargari t i fera)
BEST AVAILABLE COPY

This report was made possible through support provided by USAID under the terms of Contract No. AID 879-0020-C-00-1177-00. The opinions expressed and conclusions reached here are those of the authors and do not necessarily reflect the views of USAID.
Although the names Tongareva and Penrhyn may occasionally be used in project reports interchangeably in reference to the same atoll, the name Tongareva will generally be given preference. This is in response to requests from national and local Cook Island government officials. Tongareva has appeared on European maps as Penrhyn ever since the British transport sh@, Lady Penrhyn, sighted the island in August 1788. This was at least 500 years after the first Polynesian voyagers reached Tongare va.

ACKNOWLEDGMENTS
This report has been prepared by RDA International, Inc., under the technical direction of Dr. Maria Haws, RDA Senior Biologist and Chief o f Party on Tongareva, in cooperation with the employees of the Ministry of Marine Resources, the Cook Islands Meteorological Service, Air Rarotonga and the people and farmers of Tongareva. Their hard work, willingness t o share their knowledge of the environment, and their commitment t o sustainable development of the pearl industry greatly aided the research effort. Special thanks are due to the diving staff o f NlNlR for their assistance w i th the field work which required many long hours underwater and t o the staffltrainees of the TMRC for their dedication t o learning. Although the many individuals who participated in Project activities are too numerous t o mention here individually, w e gratefully acknowledge their assistance and support without which this work would not have been possible.

ABBREVIATIONS
ACl AR
COP
DMA
GOCl
MMR
PCC
PIMAR
RDO
RDA
SP
TMRC
USAlD
Australian Centre for International Agricultural Research
Chief of Party
Defense Mapping Agency
Government of the Cook Islands
Ministry of Marine Resources
Project Coordination Committee
Pacific Island Marine Resource
Regional Development Office
RDA International, Inc.
South Pacific
Tongareva Marine Research Center
United States Agency for International Development

TABLE OF CONTENTS
. . . . . . . . . . . . . . . . . . . . . . . . . . . . . . . . . 1.0 EXECUTIVE SUMMARY 1-2
3.0 BACKGROUND . . . . . . . . . . . . . . . . . . . . . . . . . . . . . . . . . . . . . . . 3-1
. . . . . . . . . . . . . . . . . 4.0 RESEARCH AND MONITORING COMPONENTS 4-1 . . . . . . . . . . . . . . . . . . . . . . 4.1 Meteorology and tide information 4-1
4.1.1 Objectives . . . . . . . . . . . . . . . . . . . . . . . . . . . . . 4-1 4.1.2 Methods . . . . . . . . . . . . . . . . . . . . . . . . . . . . . . 4-1
. . . . . . . . . . . . . . . . . . . . . 4.1.3 Results and discussion 4-1 . . . . . . . . . . . . . . . . . . . . . . . . . . . . . . . . . . . 4.2 Current studies 4-3
. . . . . . . . . . . . . . . . . . . . . . . . . . . . . 4.2.1 Objectives 4-3 4.2.2 Methods . . . . . . . . . . . . . . . . . . . . . . . . . . . . . . 4-3 4.2.3 Results and discussion . . . . . . . . . . . . . . . . . . . . . 4-3
4.2.3.1 Background . . . . . . . . . . . . . . . . . . . . . . . . 4-3 4.2.3.2 Current meter measurements . . . . . . . . . . . . 4-4 4.2.3.3 Drogue movements . . . . . . . . . . . . . . . . . . . 4-4 4.2.3.4 Relationship between winds and tides on water
. . . . . . . . . . . . . . . . . . . . . . . . . . currents 4-8 . . . . . . . . . . . . . . . . . . . . . . 4.3 Baseline water quality monitoring 4-9
4.3.1 Objectives . . . . . . . . . . . . . . . . . . . . . . . . . . . . . 4-9 4.3.2 Methods . . . . . . . . . . . . . . . . . . . . . . . . . . . . . . 4-9
4.3.2.1 Sampling strategy . . . . . . . . . . . . . . . . . . . . 4-9 4.3.2.2 Sampling protocol and analysis . . . . . . . . . . 4-10
. . . . . . . . . . . . . . . . . . . . . . 4.3.2.3 Data analysis 4-12 . . . . . . . . . . . . . . . . . . . . 4.3.3 Results and discussion 4-12
. . . . . . . . . . . . . . . . . . . . . . 4.3.3.1 Temperature 4-12 4.3.3.2 pH . . . . . . . . . . . . . . . . . . . . . . . . . . . . . 4-15
. . . . . . . . . . . . . . . . . . . . . . . . . . 4.3.3.3 Salinity 4-15 4.3.3.4 Oxygen . . . . . . . . . . . . . . . . . . . . . . . . . . 4-17
. . . . . . . . . . . . . . . . . . . . 4.3.3.5 Orthophosphate 4-17 4.3.3.6 Nitrite-nitrate nitrogen . . . . . . . . . . . . . . . . 4-17
. . . . . . . . . . . . . . . . . . . . . . . . 4.3.3.7 Ammonia 4-17 4.3.3.8 Silicates . . . . . . . . . . . . . . . . . . . . . . . . . 4-20 4.3.3.9 Total dissolved phosphorus . . . . . . . . . . . . 4-20
. . . . . . . . . . . . . . . 4.3.3.1 0 Total dissolved nitrogen 4-20 . . . . . . . . . . . . . . . . . . . . . . 4.3.3.1 1 Chlorophyll a 4 -20
. . . . . . . . . . . . . . . . . 4.3.3.12 Total organic carbon 4-23 . . . . . . . . . . . . . . . . . . . . . . . . . . . . . . . . . 4.4 Reef monitoring 4-25
. . . . . . . . . . . . . . . . . . . . . . . . . . . . 4.4.1 Objectives 4-25 . . . . . . . . . . . . . . . . . . . . . . . . . . . . . 4.4.1 Methods 4-26
. . . . . . . . . . . . . . . . . . . . 4.4.3 Results and discussion 4-28

. . . . . . . . . . . . . . . . . . . . . . . . . . . . . . . . 4.5 Stock assessment 4-28 . . . . . . . . . . . . . . . . . . . . . . . . . . . . 4.5.1 Objectives 4-28
. . . . . . . . . . . . . . . . . . . . . . . . . . . . . 4.5.2 Methods 4-28 . . . . . . . . . . . . . . . . . . . . 4.5.3 Results and discussion 4-30
. . . . . . . . . . . . . . . . . . . . . . . . . 4.6 Spat collection experiments 4-33 4.6.1 Objectives . . . . . . . . . . . . . . . . . . . . . . . . . . . . 4-33 4.6.2 Methods . . . . . . . . . . . . . . . . . . . . . . . . . . . . . 4-35 4.6.3 Results and discussion . . . . . . . . . . . . . . . . . . . . 4-35
. . . . . . . . . . . . . . . . . . . . . . . . . . . . . . . . . . 4.7 Histopathology 4-41 . . . . . . . . . . . . . . . . . . . . . . . . . . . . 4.7.1 Objectives 4-41
. . . . . . . . . . . . . . . . . . . . . . . . . . . . . 4.7.2 Methods 4-42 . . . . . . . . . . . . . . . . . . . . 4.7.3 Results and discussion 4-42
. . . . . . . . . . . . . . . . . . . . . . . . . . . . . . . . . 4.8 Genetic analysis 4-43 4.8.1 Objectives . . . . . . . . . . . . . . . . . . . . . . . . . . . . 4-43 4.8.2 Methods . . . . . . . . . . . . . . . . . . . . . . . . . . . . . 4-44 4.8.3 Results and discussion . . . . . . . . . . . . . . . . . . . . 4-44
. . . . . . . . . . . . . . . . . . . . . 4.9 Assessment of gonadal condition 4-46 . . . . . . . . . . . . . . . . . . . . . . . . . . . . 4.9.1 Objectives 4-46
. . . . . . . . . . . . . . . . . . . . . . . . . . . . . 4.9.2 Methods 4-46 . . . . . . . . . . . . . . . . . . . . 4.9.3 Results and discussion 4-46
. . . . . . . . . . . . . . . . . . . . . . . . . . . . . . . . . 4.10 Farm Monitoring 4-49 . . . . . . . . . . . . . . . . . . . . . . . . . . . . 4.10.1 Objectives 4-49
4.10.2 Methods . . . . . . . . . . . . . . . . . . . . . . . . . . . . . 4-49 4.10.3 Result and discussion . . . . . . . . . . . . . . . . . . . . . 4-49
. . . . . . . . . . . . . . . . . . . . . . . . . . . . . . . . . . . . 4.1 1 Spat growth 4-51 4.1 1 . 1 Objectives . . . . . . . . . . . . . . . . . . . . . . . . . . . . 4-51
. . . . . . . . . . . . . . . . . . . . . . . . . . . . . 4.1 1.2 Methods 4-51 4.1 1.3 Results and discussion . . . . . . . . . . . . . . . . . . . . 4-51
4.1 2 Hatchery trials and microalgae production . . . . . . . . . . . . . . . . 4-54 4.12.1 Objectives . . . . . . . . . . . . . . . . . . . . . . . . . . . . 4-54 4.1 2.2 Methods . . . . . . . . . . . . . . . . . . . . . . . . . . . . . 4-54 4.1 2.3 Results and discussion . . . . . . . . . . . . . . . . . . . . 4-56
. . . . . . . . . . . . . . . . . . . . . . . . . . . . . . . . . . . . . . . . . . 5.0 SUMMARY 5-1
. . . . . . . . . . . . . . . . . . . . . . . . . 6.0 ISSUES AND RECOMMENDATIONS 6-1
. . . . . . . . . . . . . . . . . . . . . . . . . . . . . . . . . . . . . . . . 7.0 REFERENCES 7-1
. . . . . . . . . . . . . . . . . . . . . . . . . . . . . . . . . . . . . . . . . 8.0 APPENDICES 8-1

LIST OF TABLES
Table 1. Wind data for the period 27 July through 7 August, 1993, Tongareva airport.
Table 2. Tide data for the period 27 July through 7 August, 1993, Tongareva boat harbor.
Table 3. Summary statistics for drogues released at Tongareva, July-August 1993.
Table 4. Summary results of water quality monitoring, September 1992- January 1995.
Table 5. Summary of results of water quality monitoring, September 1992 - January 1995.
Table 6. Water quality sampling results near Omoka and Tetautua villages, August 1992, April 1993, and August 1993.
Table 7. Preliminary spat collection results, Tongareva lagoon.
vii

LIST OF FIGURES
Figure 1.
Figure 2a.
Figure 2b.
Figure 3.
Figure 4.
Figure 5.
Figure 6.
Figure 7.
Figure 8.
Figure 9.
Figure 10.
Figure 1 1.
Figure 12.
Figure 13.
Figure 14.
Figure 15.
Figure 16.
Figure 17.
Figure 18.
Figure 19.
Map of Tongareva (Penrhyn) Atoll
Current vector plots, average of July 2 9 and 31, and August 3, 1993 observations, Tongareva Lagoon.
Current vector plots, average of ten 2 4 hour-long observations, July t o September, Tongareva Lagoon.
Drogue movements at the old farm site, July-August 1993.
Drogue movements at the existing farm site, July-August 1993.
Water quality sampling stations, Tongareva Lagoon
Temperature results (means *standard deviations)
pH results (means *standard deviations)
Salinity results (means *standard deviations)
Dissolved oxygen results (means * standard deviations)
Orthophosphate results (means +standard deviations)
Nitrate-nitrite N (means k standard deviations)
Ammonia results (means f standard deviations)
Silicate (means f standard deviations)
Total dissolved phosphorus (means *standard deviations)
Total dissolved nitrogen (means +standard deviations)
Chlorophyll a results (means -e standard deviations)
Total organic carbon results (means *standard deviations)
Permanent transect sites for pearl oyster stock assessments
Spat collection and histopathology sample collection sites

Figure 20. Spat collection results, for periodic deployments
Figure 21. Spat collection results by location and deployment
Figure 22. Average gonad index by month.
Figure 23. Average daily growth for spat (5-60mm)
Figure 24. Average daily growth for spat (60-100mm)

Appendix 1.
Appendix 2.
Appendix 3.
Appendix 4.
Appendix 5.
Appendix 6.
Appendix 7.
LIST OF APPENDICES
Wind direction and speed.
Plot of predicted tides, July and August 1993.
Current meter series plots
Drogues and trajectories.
Linear regression analyses with F-test.
Visual representation of water quality data
List of RDA International, Inc., PIMARICOOK ISLAND reports

LIST OF PHOTOS
Cover Photo: Black-lip pearl oyster (Pinctada margaritifera)
Black-lip pearl oyster (Pinctada margaritifera)
The Tongareva Marine Research Center (TMRC) staff departing for a day of field work in the Tongareva lagoon.
Aerial view of Penrhyn Atoll.
A coral patch reef in the Tongareva lagoon. Note the small "pipi" oysters (Pinctada maculata), an imported economic resource.
The people of Tongareva rely heavily on reef resources. The reef monitoring program was designed to assess and monitor the condition of the patch reefs.
A Black-lip pearl oyster (P. margaritifera) in its native habitat. The stock assessment program resulted in an estimated population size of 2-3 million.
Two Black-lip pearl oysters of typical seeding size. Until growth studies were conducted, it was unknown how long it took for a pearl oyster to reach this critical size.
Spat collectors heavily encrusted with fouling organisms (spat collection experiment #2).
Small P. margaritifera spat obtained from spat collectors.
Microscopic view of developing eggs obtained during the gonad condition check.
Pearl oyster farming in Tongareva follows the Tahitian longline method. Note the missing pearl oysters; oysters may fall from the lines if they become too heavily fouled.
MMR staff removing heavily fouled pearl oysters from a farm line in order to clean them.
Cleaning pearl oysters is an important part of farm management. Meremere (Arake) Tunitara is shown cleaning a pearl oyster using the typical technique.

15. Large quantities of microalgae were grown as food for pearl oyster larvae. Staff Biologist Kelvin Passfield is shown instructing MMR trainees Teinakore Tuatai and Rakeikura Taime in culture methods.
16. Spawning Black-lip pearl oysters. Once pearl oysters begin t o spawn, they are removed from the spawning tanks and isolated in individual containers. Note the large number of eggs in the lower container.
17. Pearl oyster larvae are cultured in large larviculture tanks in the TNlRC hatchery. Chief of Party Maria Haws and MMR trainee Rakeikura Taime are shown draining a tank in order t o change the water.
18. Staff Biologist Kelvin Passfield and MMR trainees Teinakore Tuatai and Rorangi Tonitara fill a larviculture tank with filtered seawater.
xii

1.0 EXECUTIVE SUMMARY
This is the surrlmary technical report of the Cook Islands Black-Lip Pearl Oyster and Lagoon Ecology Project, a component of the USAID-funded Pacific Islands Marine Resource (PIMAR) Program, Contract No. AID 879-0020-C-00-1 177-00. This report, prepared by RDA International, Inc. (RDA), reviews the results of the scientific and technical aspects of the program through August 1995, and complements the final report on that project (RDA Final Report 95-05, September, 1995).
The program was designed t o render assistance for the development of small-scale resources activities in the South Pacific with the goal of increasing income generating opportunities for Pacific Islanders through means which enhance the conservation and management of natural resources. In the case of the Cook Islands, this specifically called for development and implementation of an ecologically sound and environmentally sustainable pearl oyster culture industry.
Sustainable development of natural resources requires a thorough knowledge of the environment, the organisms involved and human interactions wi th the environment. Prior to initiation of the Project, Tongarevans had not permitted pearl oyster culture to begin, as they feared potential negative environmental impacts. This provided the impetus for the emphasis on environmental monitoring and characterization of the lagoon environment. In the case of the Tongareva lagoon, relatively little was known regarding its environmental conditions or the status of the black-lip pearl oyster (Pinctada margaritifera) population. Additionally, the pearl oyster culture industry has traditionally maintained a high level of secrecy. Many basic aspects of the culture and biology of pearl oysters are still unavailable at a public level.
Implementation of a pearl oyster culture industry in Tongareva therefore demanded that resource managers and farmers have access t o knowledge of the lagoon environment, status of the pearl oyster population, and other biological and physio- chemical data needed t o formulate management plans.
Research activities began in mid-1 992, before farming activity began and continued until August 1995. The monitoring and research program was designed t o fulfill 4 objectives:
Collect data and develop a database containing information on the physio- chemical, biological and hydrological processes of the lagoon;
Research basic and applied aspects of pearl oyster biology and make this available to farmers and resource managers;
Collect data relevant to pearl oyster culture;

@ Monitor for possible environmental impacts of farming or other human activities on the lagoon and the pearl oyster population.
Related technical activities included establishment of a pearl oyster hatchery and microalgae laboratory and provision of technical training in all areas. The objective of this work was t o produce pearl oyster larvae and juveniles for farming and research activities.
One key element of the project was t o train MMR staff so that all research and technical activities could continued after withdrawal of technical assistance.
Basic parameters of lagoon ecology such as meteorology and tide data were monitored and archived from the beginning of the Project. These data were used in conjunction with the current measurement research. Wind direction is primarily easterly. Rainfall is usually highest from November to April, and a nominal dry season occurs from May to November. Air temperatures vary little throughout the year although temperatures peak in December. Tides have a small annual and diurnal range. This data is available from the TOGA Sea Level Center, University of Hawaii, USA and the Meteorological Service, Rarotonga, Cook Islands.
A series of water current measurements were conducted during the first t w o years of the project. Attempts to use a single digital current meter were only partially satisfactory since little comprehensive data can be conducted using a single meter. Electronic problems with the meter were also encountered during field work. Use of drogues proved t o be a more efficient method of data collection on a large-scale basis. Current studies focused on the northwest quadrant of the lagoon as this is the center of farming activity and human habitation. Currents usually run at a rate of 3 to 4 knots in the West Pass (Taruia) but were significantly slower in the lagoon. Both surface (-2 m) and deep (-10 m) currents were measured. Currents in the farming areas studied were generally in a northwesterly direction wi th speeds o f 1 t o 6 cmlsecond. Surface currents, probably wind driven, were faster (averaging 6 cmlsecond) than the subsurface currents (averaging 2 cmlsecond). It appears that surface currents may be primarily wind driven, piling up against the inner reef. This impedance of f low may produce a deep, recirculating current in a counter direction.
One of the principal components of the research effort was the environmental monitoring program. Water samples were taken on a lagoon wide basis and analyzed quarterly for t w o years. Stations near large pearl farmers and centers of human habitation were also monitored. Parameters measured included temperature, pH, salinity, dissolved oxygen, orthophosphate, nitratelnitrate N, ammonia, silicates, total dissolved phosphate, total dissolved nitrogen, total organic carbon and chlorophyll a.

A t each station, a shallow sample (-2 m) and a deep sample (2 m above the substrate) were taken.
One objective of the monitoring program was to collect baseline data before farming began to use as a reference in comparison with later samples in an effort t o detect any detrimental effect of farming. This was achieved with three quarterly samples collected before the first large-scale farming activity began; five more quarterly samples were taken after this.
Most parameters varied widely throughout the lagoon during each sample period indicating possible environmental differences between geographic areas although no coherent trend was detected over time. Variation may be due to the proximity of samples to patch reefs, passes or other phenomena which affect water circulation and quality. Shallow and deep samples for each sampling period generally did not differ significantly, indicating that vertical mixing of the lagoon water may occur. The parameter values from samples taken near farm and village areas were well within the range of values of samples taken from other areas in the lagoon indicating that any possible changes in water quality produced by these areas is below the level of detection of the analyses. A t the present scale of activities, pearl oyster farming is not producing noticeable changes in water quality.
Monitoring of coral patch reefs was also implemented to evaluate possible effects of farming on reefs. Three reefs, t w o near large pearl farms and one located up-current and away from any farms, were monitored. A transect method was used and t w o surveys were conducted along each transect; indicator fish species and the benthic commur~ity were surveyed. A high variation between reefs was noted for both species abundance and diversity. This appears to be the norm for the patch reefs of Tongareva. The only possible negative effect of farming which was observed was broken coral which may have been due to repeated anchoring at the same site. Further monitoring of reef areas is indicated.
When pearl farming began, the size of the P. margaritifera population was unknown. The abundance of the wild stock of the black-lip pearl oyster will significantly affect the future development of the farming industry. Stock assessment studies were conducted using a line transect method. The population was estimated at 2 t o 3 million. This is insufficient to support a large scale pearl culture industry, although the current l irr~it of 3,000 seeded oysters per farmer has limited the size of the farming effort to well below this number. Continued monitoring efforts suggested that the population size may be increasing, but further work in this area is required. Approximately 4% of the total population is now being farmed. Due to the limited size of the wild population, alternative sources of spat will have to be developed through improved spat collection or hatchery production.

lrrlproved spat collection was seen as crucial to developing a reliable source of pearl oysters for the farmers given the relatively small population size of the wild stock. Three series of spat collection experiments were implemented during the project. The first series produced poor results which were due to the sinking of the spat collection lines. A second attempt was made in which spat collectors were periodically deployed in five locations throughout the lagoon over a period of one year. The second series was more successful. Although the overall rate of spat collected per collector was low at 0.57 spat per collector (30 c m in length), up to 9.2 spat per collector was obtained for one deployment on one line. It was observed that more shallow portions of the line contained higher numbers of spat indicating the importance of maintaining the line high in the water at 1-2 meters depth. This experiment demonstrated that spat collection can be successful in Tongareva if proper methods are used. A third experiment was begun to evaluate different types of collector materials which will be completed by MMR staff.
Spat collected during the above experiments were used to quantify juvenile growth rates. It was found that spat measuring 5 to 100 mm DVM grew fairly uniformly at an average rate of 0.2 mm/day. This suggest that the average pearl oyster will grow to the minimum seeding size of 120 m m in approximately 18 months.
Pearl oyster tissue samples were collected for histopathological and genetic analysis. Tissue samples collected from three sites in the lagoon were examined for the presence of pathogens. No significant pathogen was found. At this time, disease does not appear to be producing significant levels of mortality in the lagoon. The sectioned tissue samples were preserved and archived for future reference in case of a disease outbreak. Pearl oysters were also visually examined for signs of disease at monthly intervals in conjunction the gonad condition research.
Genetic analysis and comparison with pearl oysters from Kiribati, Australia, Manihiki, and Suwarrow determined that significant genetic differences between stocks exists wi th in the Cook Islands and between .the Cook Islands stocks and stocks from Australia and Kiribati. These genetic differences indicate that sufficient natural variation exists between stocks to contraindicate transferal of stocks within the Cook Islands or wi th other South Pacific islands.
Pearl oysters were collected on a monthly basis for one year for measurement of gonad condition which is reflective of the state of reproductive readiness of the animal. A high condition index is indicative of gonads containing relatively large amounts of eggs or sperm. High condition indices were noted in September and October and again in February and March. This has important implications for spat collection, seeding and hatchery production. These may be peak periods of reproduction in the Tongareva lagoon, although data should be collected for subsequent years in order to verify this.

A farm monitoring program was designed to monitor four of the largest pearl farms from seeding to harvest in order to evaluate farming methods and to quantify growth rates, mortality rates, environmental conditions and harvest results. It did not prove possible to evaluate the harvest results in relation to culture conditions since the first harvest occurred after the RDA technical assistance team left Tongareva. However, other valuable information was obtained. Mortality, beginning 2 weeks to 2 months after seeding, was low (e.g., 1-2%), indicating that disease problems are not affecting production. Monthly growth rates were approximated at 0.21 c m in the DVM aspect and 0.35 cm in width. Biofouling presented the greatest farm management problem. Biofouling rates are sufficiently high that a farmer must clean the oysters at least every 2 months or the accumulated weight will cause the farm line to sink or pearl oysters to fall off the lines. Farmers did not clean their pearl oysters often enough to prevent this; this may in part be due to the prohibition on the use of SCUBA which inhibits this activity. No significant environmental impact of farming on either patch reefs or water quality was observed.
A pearl oyster hatchery was designed, built and operated wi th the goal of producing larvae and juveniles for farming and experimental purposes. Six spawning trials were conducted and viable larvae were obtained in four of these. Spawning was achieved without the use of chemicals. Increased water temperatures (up to 3 2 "C) and the addition of macerated gonad promptly induced spawning. In t w o of the trials, larvae were successfully cultured to 9 and 11 days post-fertilization. The cause of mortality for the cultured larvae is unknown. The larvae were observed to swim and feed actively, ingesting all three types of algae offered as food.
Training was given t o MMR staff in all aspects of the scientific and applied work. Training efforts were highly successful; MMR staff was capable of conducting most activities wi th moderate supervision at the end of the project.
All of the scientific and technical goals of the project were successfully achieved. The collection of baseline data before farming began has provided a reference database for resource managers. Monitoring of water quality, farm management, reef conditions and pearl oyster population size continued throughout the project. Basic aspects of pearl oyster biology and culture were evaluated and quantified. This body of information will be invaluable in the future. Additionally, few instances of negative environmental impacts by pearl farming and human activities were detected, indicating that at its present size, pearl farming is a sustainable activity in Tongareva.
2.0 INTRODUCTION
This is the summary technical report of the Cook lslands Black-Lip Pearl Oyster and Lagoon Ecology Project, a component of the USAID-funded, Pacific lslands Marine Resource (PIMAR) Program, Contract No. AID 879-0020-C-00-1177-00. This report, prepared by RDA International, Inc. (RDA), reviews the results of the scientific and technical aspects of the program through August 1995, and complements the final report on that project (RDA Final Report 95-05, September 1995).
The PlMAR program was designed by USAlD as a five year program of assistance for the development of small-scale resources activities in the South Pacific with the goal o f increasing income generating opportunities for Pacific Islanders through means which enhance the conservation and management of natural resources. Within the Cook Islands, this specifically called for development and implementation of a sustainable pearl oyster industry. Sustainable development requires a thorough knowledge of the environment and the organisms involved along with the human interactions with these.
Few long-term studies have been made of the physio-chemical and biological processes occurring in tropical atoll environments, and the atolls o f the Cook lslands are no exception. This paucity of data became evident in the early planning stages of the Cook lslands Project. The primary objective of the project was to assist in the establishment of a pearl culture industry using sound management practices to prevent detrimental environmental effects. An environmental monitoring program entailing collection of basic biological, hydrological and physio-chemical data was therefore planned and implemented. This research was aimed at providing the critical data necessary for development of farming and management schemes as well as for monitoring environmental impacts of farming and associated human activities. It consisted of two phases: 1) collection of baseline data before farming activities began and 2) continuation of monitoring and data collection as the farming industry developed. Other research components included pearl oyster biology, stock assessment, pathology and genetics, reproductive studies and other basic research.
Evaluation and testing of technical applications were also considered key t o developing a sustainable industry. These included spat collection, spawning trials and hatchery techniques, and evaluation of farm management methods.
Training of MMR staff in scientific research and the various technological applications was also critical to the sustainability of the effort. The Cook lslands has relatively few qualified resource managers, biologists and other technical specialists for a country w i th major dependence on marine resources. This is particularly true of the outer islands. It was therefore important to focus on training of technical staff in order t o

create a core group qualified to continue the programs after withdrawal of technical assistance.
When the research program began in 1992, pearl oyster culture and seeding was not permitted on Tongareva. Farming activity was confined t o the "bankingn or transplanting undersized oysters on patch reefs and the setting of a few spat collectors. Residents of Tongareva and other Cook Islanders expressed concern about the possible environmental effects of pearl farming. This concern was based on the v iew that negative environmental and sociological irr~pacts could accompany the introduction of pearl farming.
The neighboring atoll of Manihiki, where pearl culture had begun some 8 years earlier, was taken as an example by Cook Islanders of what the Tongareva lagoon might become if uncontrolled farming were allowed. Although much of the evidence was anecdotal in nature, pearl culture was purported t o have been responsible for depletion of the wild oyster stocks, disease and mortality in wild and cultured oyster stocks and other negative impacts on the lagoon ecosystem. If the introduction of pearl culture were successful, it was believed that many Tongarevans resident
\
overseas would return to the islands to farm and the increased human population would affect environmental quality. 'This, coupled with similar reports from other South Pacific pearl-producing regions, made the Tongarevans hesitant t o allow pearl culture to proceed without evaluation and control of possible impacts. 'The desire of the residents of Tongareva to protect and manage their lagoon and its resources was the impetus for the emphasis on environmental monitoring and pearl oyster research as key elements of the Project.
Environmental monitoring began in mid-1 992, before farming activity began, and continued throughout the project until August 1995. The monitoring and research program was designed to fulfill four objectives:
Collect baseline data to form a database containing information on the physio- chemical, biological and hydrological processes of the lagoon;
• Investigate basic and applied aspects of pearl oyster biology and disseminate this information for the benefit of farmers;
Collect data relevant to oyster culture to benefit development of management plans; and
Monitor possible environmental impacts of farming or other human activities.

Related technical activities included establishment of a pearl oyster hatchery and microalgae laboratory, and provision of technical training in all areas. The objectives of this work were:
Build and operate a black pearl oyster hatchery; Conduct spawning trials and produce juvenile pearl oysters for farming and research purposes; and
• Train MMR staff in all facets of hatchery operations.

Photo 2 . Black-1 i p P e a r l O y s t e r .
Photo 3 . The TMRC s t a f f - d e p a r t i n g f o r a day o f f i e l d work i n t h e Tongareva l a g o o n .
BEST AVAILABLE COPY

3.0 BACKGROUND
Tongareva, also known as Penrhyn, is located at about 9 south latitude and 158 west longitude. It is an atoll, with emergent and slightly emergent coral reefs and islets encircling a lagoon of 197 square kilometers. See Figure 1, page 3-2 and photo 4, page 3-3. The land area is 1 0 square kilometers. The maximum elevation above sea level is about 4 meters. 'The longest axis, trending northwest t o southeast, is 2 3 kilometers. There are three deep passes through the reef into the lagoon. The deep- water port, airport and center of local government are at the village of Omoka, in the northwest quadrant, with a population of about 350. Te Tautua, in the northeast, has a population of about 250.


2 Rhoto 4. A e r i a l v iew o f Penrhyn A t o l l .
-
BES 7 AVAILABLE COPY

4.0 RESEARCH AND MONITORING COMPONENTS
4.1 Meteorology and tide information
Meteorological and tidal data were obtained to identify important trends which could affect water current flow and direction, and water quality in Tongareva lagoon. They are expected t o have a major influence on the biological productivity of the lagoon.
Methods
Meteorological and hydrological data are collected by the Cook Islands Meteorological Service. These data includes wind speed and direction, temperature, rain fall and tidal elevation. Other related information collected includes solar insolation and cloud cover.
Tongareva is influenced from November to April by the doldrums belt (a region noted for dead calms and light fluctuating winds). According to sailing directions for the Pacific Islands (DMA, 1988), the area during this period experiences heavy rains, thunderstorms, and violent squalls sometimes causing hazards. The more intense of these storms are sometimes accompanied by confused seas, lightning, poor visibility and clouds (cumulus and cumulonimbus) with ceilings sometimes reduced to 500- 1 0 0 0 feet for short periods. Most of these storms are short in duration and rarely cover an area larger than 20-25 miles. Typhoons or hurricanes have not been reported at Tongareva.
Trade winds occur throughout the year, but are particularly steady during May t o November. The prevailing winds are usually easterly, wi th occasional north and northwest winds between December and March. A detailed wind record for Tongareva, measured at the meteorological station located at the air field, was taken from 27 July through 7 August. During this period, the winds were predominately f rom the northeast to the southeast, blowing 65% of the time from 8 0 t o 1 0 0 degrees. See Table 1, page 4.2 and Appendix 1.

Table 1. Wind data for the period 27 July - 7 August, 1993, Tongareva airport.
The island experiences a wet season, generally from November to April, and a dry season, from May t o November. January is the wettest month. Air temperatures vary little throughout the year, and December is usually the hottest month (DMA, 1988).
Tides within Tongareva lagoon have a small annual and diurnal range (mean tide -- 0.2 m, spring tide -- 0.4 m). A summary of predicted tidal observations for the period 27 July through 7 August is shown in Table 2 below. These predictions were made by the TOGA Sea Level Center, University of Hawaii, and were based on data collected between December 1989 and December 1990.
Table 2. Tide data for the period 27 July - 7 August, 1993, Tongareva boat harbor.
BEST AVAILABLE COPY

Plots of tidal elevations for the July and August 1993 period are shown in Appendix 2.
4.2 Current studies
To obtain information on water currents within Tongareva lagoon for the purpose of determining nutrient transport, water exchange and effects on other biological parameters.
Methods
Water currents measurements were obtained using a current meter and drogues. One mooring was deployed with a single current meter for 4 days between 27 July 1993 and 5 August 1993, and 6 days between 6 and 13 September, 1993. Drogues were released and tracked for 4 days during deployment of the current mooring.
A subsurface current mooring was deployed at the TMRC farm site to characterize the currents along the reef. The mooring consisted of a 15 c m (6-inch) diameter subsurface, plastic buoy, one Aandera current meter, and a concrete anchor all connected wi th 6 m m (114 inch) line.
The Aandera current meter recorded current speed and current direction every 90 minutes, and stored the data internally. The current meter data were read from the meter, graphed and edited to remove obviously erroneous data.
The drogue design used in .this study is described as follows. The drogue, or underwater sail, is a window-shade type, where a piece of fabric 1.2 m wide by 2.4 m long is sewn for insertion of steel rods at both the upper and lower ends. A harness is attached to the upper bar and a nylon line (e.g. 2 or 1 0 meters long) attaches a surface float to the drogue. A mast and flag are attached to the surface float so an observer may find and return to the drogue. A t approximately hourly intervals the observer returns to the float and notes the latitude and longitude using a GPS positioning system.
4.2.3 Results and discussion
4.2.3.1 Background
There is limited information in the literature on currents in Tongareva lagoon and surrounding waters. The DMA reported currents outside the atoll to be westerly, and usually not exceeding 1 knot.

There are three passes through the barrier reef, Northeast Pass (Takuua), Northwest Pass (Siki Rangi) and West Pass (Taruia). Currents in West Pass were noted in the DMA to ordinarily run at a rate of 3 to 4 knots, but at times have been reported as high as 8 knots. Both flood and ebb currents run for about 5 l/z hours except in cases of heavy sea on the reef, when the current always f lows out of the lagoon. There is a period of slack water about 40 rr~inutes long at low water. The slack water period is shorter at high water.
4.2.3.2 Current meter measurements
Daily current meter series plots are shown in Appendix 3. 'These graphs present the current meter data versus time after meter startup. Each plot includes current speed and direction, and a wind vectors at 0, 12 and 21 hours after meter startup. Current speed is divided into one cmlsec increments, and current direction is divided into 1 5 degree sectors.
Figures 2a and 2b, pages 4-5 and 4-6, show summary plots integrating current observations for 29 and 31 July and 3 August, and all 1993 observations. These figures illustrate the percent occurrence of current speed versus direction.
Inspection of the current meter results shown in the percent occurrence plots gave the following. A t the farm site mooring in July and August, 8 2 % of the time the currents were flowing toward the northwest between directions of 270 and 345 degrees, and 13% toward the northeast between 0 to 9 0 degrees. Over the entire recording period, approximately 6 9 % of the time the currents were flowing to the northwest and 1 7 % of the time they were flowing northeast.
Given the dominance of the northwesterly currents, there will be an average current directed to that direction. The speeds vary from 1 to 6 centimeterslsecond [cmlsec] (9 cm/sec measured in 5 August is probably instrument error). A speed of 3 cm/sec
is approximately equivalent to a movement of 3 kilometers per day.
4.2.3.3 Drogue movements
Observations of water movement using drogues were made on four days during 1993. Figures 3 and 4, page 4-7, show the drogue deployment sites for all field surveys. In general, all of the drogues were deployed and positions noted 3 0 minutes t o t w o hours after deployment (daylight hours only). If the drogues grounded (snagged on the reef) or traveled too far (approximately 2 nautical miles), they were recovered. Shallow (2 m) and deep (10 m) drogues were deployed so as to acquire additional data over the range of tidal cycle at several sites in the lagoon.

Figure 2a. Plot of the average cxrent directions during three 24 hour periods on July 29 and 31, and August 3,1993. Tongareva lagoon TMRC farm site.

Figure 2b. Plot of the average current directions during ten 24 hour periods July to September, 1993. Tongareva lagoon TMRC farm site.

I
F i , g 3. Illustration of drogue movements at old farm site, July-August 1993.
1 I
Fig- 4. Drogue movements at existing farm site, July-August 1993.
BESTAVAILABLE COPY

Appendix 4 lists the velocities and trajectories of the individual drogues. These data are summarized in Table 3 below. Drogues set at -1 0 m moved an average of about 81 m/h or 2 cm/sec, at a mean heading of 186". The -2 m drogues had an average velocity of about 220 m/h or 6 cm/sec with a mean heading of 256". The differences in both speed and direction of the 2 and 10 m drogues was significant at a probability less than 0.05 in an F-test for correlation. Based on, as yet, limited information, there is no significant correlation between tide stage and drogue direction or velocity (Appendix 5).
4.2.3.4 Relationship between winds and tides on water currents
Based on limited current meter records, tidal currents were found to be weak in Tongareva lagoon, except in the passes and channels into the lagoon. The currents that were observed in drogue releases were primarily generated by wind stress on surface waters of the lagoon. This stress appears t o cause t w o responses: (1) surface waters are pulled in the same direction as the winds, piling up against the inner lagoon reef impeding the flow, and (2) a deep but weaker recirculating counter- current (opposite t o the wind direction) develops t o offset water transport near the sea surface. These processes have important implications in predicting dispersion patterns of oyster larvae, other plankton, and possible pollutants that may enter the lagoon, and in describing the water quality characteristics of farm sites. Efforts were made t o continue collecting data t o assess water currents in Tongareva lagoon throughout the project but this proved to be unfeasible due t o electronic problems with the current meter. The meter could not be repaired despite repeated efforts and water current studies were discontinued.
Table 3. Summary statistics for drogues released at Tongareva, July-August 1993.

Table 3 (cont). Summary statistics for drogues released at Tongareva, July- August 1993.
4.3 Baseline water quality monitoring
Periodic water sampling was conducted in the Tongareva lagoon with four objectives: 1 ) collect baseline data on 12 critical water quality parameters throughout the lagoon t o evaluate the environmental status of the lagoon; 2) obtain data for use as a reference for environmental assessment in .the future; 3 ) develop an understanding of the basic biological and hydrological processes of the lagoon; and 4) monitor water quality as the pearl industry developed to assess environmental impacts.
4.3.2 Methods
4.3.2.1 Sampling strategy
For the first sampling in August 1992, samples were taken along t w o transects: one transecting the area from the northern-most point of the atoll to the southern-most point; and one passing from the original farm site (Parahatea) to the village of Te Tautua. Five sites were selected near Parahatea with replicate sites 100 meters in the windward direction. The second set o f samples collected in April 1993, were taken from randomly selected sites. A new farm site, Naharakura, had been designated since the previous sample date. Five new sites with replicate windward sites 100 meters distant were randomly selected in a 1 square kilometer area off-shore of Naharakura. For the third sampling (August 1993) samples were taken along the original transects, since the random sampling scheme proved unfeasible for logistical reasons. The five sites for intensive sarr~pling near Naharakura were retained. For the subsequent 4 quarterly samplings, the same stations were sampled. Samples from

five of the largest farms were also sampled during periods four through seven. T w o additional sampling stations were added close to the village of Omoka and an oceanic site outside the Taruia (West) Pass for the final sampling periods. The sampling sites are noted in Figure 5, page 4-1 1.
At each sample site a shallow sample was taken at a depth of 2 meters and a deep- water sample was taken at 2 meters above the substrate. In cases where the substrate depth exceeded 40 meters, the deep-water sample was taken at this maximum depth, rather than near the substrate, to avoid snagging the Hydrolab probe or Nansen bottle at unrecoverable depths. A total o f forty samples were taken on each sampling date.
Some data is not available for some sampling periods. Dissolved oxygen and pH were not measured during the first sampling period, September 1992, for lack of instrumentation. Data for orthophosphate, nitrate-nitrite nitrogen, ammonia silicates, total dissolved phosphorus, total dissolved nitrogen, chlorophyll a, and total organic carbon are missing for the October 1994 sampling period. The samples which were shipped to a laboratory in Hawaii were lost en route. Only the data taken in situ survives from this period.
4.3.2.2 Sampling protocol and analysis
Temperature, salinity, pH, depth and dissolved oxygen were measured in situ using a Hydrolab on-line data transmitter and water samples were shipped to a laboratory for analysis of other parameters. The only exceptions were the salinity samples from August 1992 which were also analyzed in a laboratory. Water samples were taken using a Nansen bottle. Samples were stored and shipped at 5-10 "C.
Miles Anderson of the Natural Energy Laboratory of Hawaii (IVELH) provided the original protocol which was subsequently slightly modified. All sample vessels and the syringe were first rinsed three times with the sample water. A 0.45 micron combusted glass fiber filter was placed in a filter holder which was screwed onto the syringe. Filtered water was then used to rinse the sample container and cap three times. A total of 240 ml of seawater was filtered into two sample containers. 'The filter containing the chlorophyll a sample was then removed and placed in a sealable plastic bag wi th analytical grade acetone, wrapped in aluminum foil to exclude light and placed on ice along with the water samples. All samples, with the exception of the first set of salinity samples, were frozen as soon as possible and were kept frozen until analysis.
Analysis was conducted at NELH. Orthophosphate, silicates, nitratelnitrite nitrogen, ammonia and total dissolved phosphorus were analyzed using a Technicon

BEST AVAILABLE COPY

automated analyzer. Total dissolved nitrogen was analyzed with an automated nitrogen analyzer and total organic carbon with an automated total carbon analyzer. Salinity of samples collected in August 1992 was measured with a salinometer. Chlorophyll a was measured fluorometrically (Parsons, et al., 1984).
4.3.2.3 Data analysis
Means and standard deviations for the data collected in each sampling period were calculated for each parameter for both shallow and bottom samples (Appendix 6). One-way ANOVA was used to analyze data for differences between shallow and deep samples for each sampling date. Comparisons were also made between sample dates for shallow and deep samples, respectively. For the purpose of statistical analysis, deep samples were considered t o be samples taken from a depth greater than 10 meters. Analysis for spatial trends was performed by grouping data from shallow and deep samples, respectively, for different geographical areas. The following spatial divisions were considered: north versus south and east versus west. The data were also grouped into four quadrants (north-west, north-east, south-west, south-east) which were then compared. Linear regression analysis using the least squares method was used to examine all possible pairwise correlations between parameters for both shallow and deep samples.
'Three-dimensional visual representations were constructed for the parameters which displayed the most extreme geographic variation, salinity, total organic carbon, silicates and chlorophyll a. These are presented in Appendix 6.
4.3.3 W l t s and discussion
Results are summarized for each sample period in Table 4, pages 4-13 and 4-14, and overall means for each parameter for the entire two year period are presented in Table 5, page 4-15. The results of the analysis demonstrate that values of inorganic and organic nutrients fall within the range expected for an atoll with a relatively high rate of exchange with oceanic water (Johannes, 1975; Martin, 1970; Stoddart and Johannes, 1979). However, values generally range above those expected for tropical mid-oceanic seawater indicating that nutrient retention and recycling are occurring within the lagoon. A high level of variability for most parameters was found within the lagoon in both shallow and deep samples. Spatial trend analysis did not reveal any detectable concentration gradients.
4.3.3.1 Temperature
Shallow temperatures ranged from 27.8 OC to 30.4 oC while deep temperatures ranged f rom 27.6 OC to 30.1 oC. Overall mean temperatures for shallow and deep samples were not significantly different for any of the sampling dates although

shallow temperatures were always slightly higher. This indicates that little stratification o f the lagoon water occurred, at least t o the maximum depth sampled, 47.5 meters. A slight seasonal variation in temperature was observed w i th temperatures being slightly higher in samples taken during the January to April period,
Table 4. Summary results of water quality monitoring September 1992 - January 1995 (means k standard deviations).

'(suo!ie!nap plepueis 7 sueaw) 466 L hlenuer - 2661 laquaidas 6u!roi!uow Ai!lenb JaieM 40 silnsal hleururns *(iuo3) alqel

Table 5. Summary of water quality data, means for all sample periods (means k standard deviations)
although the difference was not significantly different. The seasonal difference in temperature may have a biological significance, however. See Table 4, pages 4-1 3 and 4-1 4, and Figure 6, page 4-1 6.
pH was not measured in September 1992 for lack of a pH electrode. pH values ranged from 6.83 t o 8.84 for shallow samples and from 7.83 to 8.82 for deep samples. There was no significant difference between shallow and deep pH for either sample date, nor did samples from either depth differ significantly over time. 'The lowest pH values were measured during the October 1994 sampling period and a high degree of variability was found. It is suspected that these may be the result of an faulty pH electrode which was later found to be slightly corroded. See Table 4, pages 4-13 and 4-14 and Figure 7, page 4-1 6.
4.3.3.3 Salinity
Salinity ranged from 33.0 to 36.5 parts per thousand (ppt) for shallow samples and from 32,1 to 36,O ppt for deep samples, Shallow and deep salinities were similar for

Figure 6: Temperature resul t s (means * standard deviations)
1 El Deep
Sample Date
Figure 7: pH results (means * standard deviations)
8.8
Sample Date
BEST AVAILABLE COPY

all sample periods, although generally the deep samples were slightly more saline. This is taken as another indication of the lack of stratification of the lagoon water. Both shallow and deep samples taken in April 1993 are significantly lower in salinity than samples taken in other sample periods. These samples were taken during a time of heavy, extended rainfall. See Table 4, pages 4-13 and 4-14, Figure 8, page 4-18 and Appendix 6.
4.3.3.4 Oxygen
Dissolved oxygen concentrations ranged from 4.96 to 6.62 mg/L in shallow samples and from 4.13 to 7.82 mg/L in deep samples. Dissolved oxygen levels did not differ significantly according to depth in any of the sample periods although shallow samples tended t o be slightly higher in dissolved oxygen concentration. No differences were detected over time. See Table 4, pages 4-1 3 and 4-14 and Figure 9, page 4-18.
4.3.3.5 Orthophosphate
Orthophosphate in shallow samples ranged from 0.0020 to 0.01 5 0 mg/L while deep levels of ranged from 0.0035 t o 0.1 500 mg/L. No significant trends were seen between different depths nor between seasons. This parameter did display a high degree of variation between sample sites within each sample period. This could be the result of the relative proximity of each site to patch reefs which generally produce a net export of phosphate. See Table 4, pages 4-13 and 4-14 and Figure 10, page 4-1 9.
4.3.3.6 Nitrite-nitrate nitrogen
Shallow levels ranged from 0.0001 (the limit of detection) t o 0.2060 mg/L nitrite- nitrate nitrogen while deep levels ranged f rom 0.0001 (the limit of detection) to 0.2210 mg/L N. No significant trends were observed for either depth nor season. With the exception of the April 1993 and the August 1993 sample periods in which a high degree of variability was observed, nitrite-nitrate nitrogen was relative constant throughout the lagoon for each sample period and over time. See Table 4, pages 4- 13 and 4-1 4 and Figure 11, page 4-1 9.
4.3.3.7 Ammonia
Ammonia levels ranged from 0.0007 to 0.0400 mg/L for both deep and shallow samples. Concentrations in shallow and deep samples were similar for all three sample periods. Ammonia levels were similar over all sampling period except for April 1993 when both deep and shallow ammonia levels were significantly higher than for

F igu re 8: Sal i n i t y r e s u l t s (means + standard d e v i a t i o n s )
Sample Date
F igu re 9: Disso lved oxygen r e s u l t s (means 2 standard d e v i a t i o n s )
1. Deep i
Sample Date
BESTAVAILABLE COPY

F i g u r e 10: Orthophosphate r e s u l t s (means + s tandard d e v i a t i o n s )
Sample Date
F i g u r e 11: N i t r i t e - n i t r a t e N (means + s tandard d e v i a t i o n s )
Sample Date
BESTAVAlLABLE COPY

most other sampling periods. See Table 4, pages 4-1 3 and 4-1 4 and Figure 12, page 4-21 .
4.3.3.8 Silicates
Shallow silicates levels ranged from 0.0021 to 0.7290 mg/L. Deep silicates levels ranged from 0.0007 to 1.2561 mg/L. Silicates levels tended to be highly variable throughout the lagoon during each sampling period, perhaps an indication of patchy distribution of diatoms. Overall, silicates levels were similar in shallow and deep samples for each of the three sampling dates. Shallow silicates levels were significantly different for each period and deep levels significantly higher in the last two sample dates. See Table 4, pages 4-1 3 and 4-1 4, Figure 13, page 4-21 and Appendix 6.
4.3.3.9 Total dissolved phosphorus
Total dissolved phosphorus (TDP) ranged from 0.0010 to 0.017 mg/L in shallow samples and 0.007 to 0.0262 mg/L in deep samples. Deep samples tended to have higher orthophosphate levels than shallow samples but the difference was not statistically significant. Orthophosphate levels were significantly higher in the deep samples of March 1994 than for most other sample periods. See Table 4, pages 4- 13 and 4-1 4 and Figure 14, page 4-22.
4.3.3.1 0 Total dissolved nitrogen
Shallow samples ranged from 0.0090 to 0.951 0 mg/L total dissolved nitrogen (TDN) while deep samples contained 0.0102 to 0.9100 mg/L TDN. Total nitrogen levels tended to be very similar for deep and shallow samples and were also very similar throughout the two year sample period. The samples taken during April and August 1993 showed a very high degree of variation which exceeded the amount of variation seen during other sample periods. See Table 4, pages 4-1 3 and 4-14 and Figure 15, page 4-22.
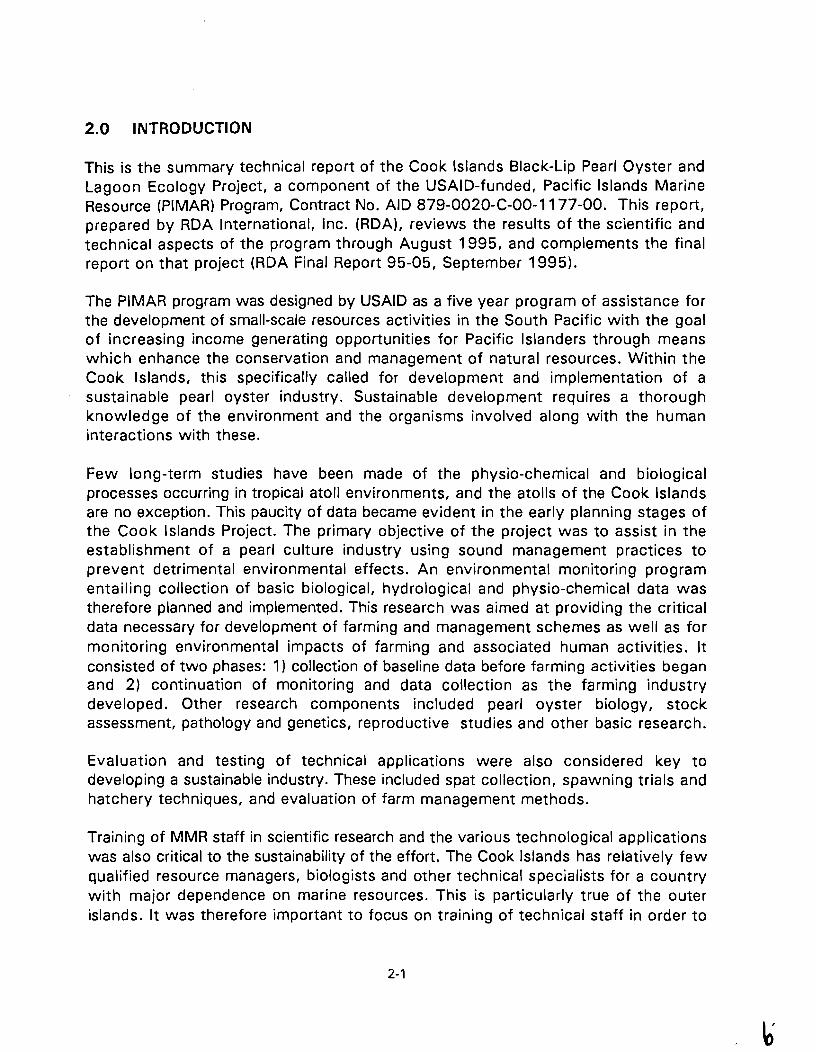
4.3.3.1 1 Chlorophyll a
Levels of chlorophyll a ranged from 0.001 (the limit of detection) to 0.21 g/L in shallow samples, while levels in deep samples ranged from 0.001 (the limit of detection) to 1.32 g/L. Chlorophyll a levels varied widely between sample stations for each sample period and also varied widely over the two year study period. See Table 4, pages 4-13 and 4-14, Figure 16, page 4-24 and Appendix 6.


F i g u r e 14: To ta l d i s s o l v e d phosphorus (means + s t a n d a r d d e v i a t i o n s )
Sample Date
F i g u r e 15: T o t a l d i s s o l v e d n i t r o g e n (means + s t a n d a r d d e v i a t i o n s )
Sample Date
BEST AVAILABLE COPY

4.3.3.1 2 Total organic carbon
Total organic carbon (TOC) levels ranged from 0.98 to 72.6 mg C/L in shallow sarr~ples and from 0.95 t o 80.72 mg C/L in deep samples. It is suspected that some the extremely high measurement may be the result of oil or gas contamination (hydrocarbons). These high levels were detected in the March 1994 samples. Results from other sarr~ple periods are relative consistent. No significant difference was found for total organic carbon levels between deep and shallow samples for any sampling period. Little difference was seen between samples for the different sample periods. See Table 4, pages 4-13 and 4-14, Figure 17, page 4-24 and Appendix 6.
The values obtained for the 1 2 parameters in this survey are typical of a tropical coral atolls wi th oceanic water exchange (Johannes, 1975; Martin, 1970; Stoddart and Johannes, 1979. That few significant differences were found between shallow and deep samples indicates that sufficient vertical mixing occurs t o prevent stratification. 'The lack of broad spatial trends within the lagoon suggests that current activity may be sufficiently high to prevent localized concentration of nutrients or that the scale of sampling was too coarse to detect these. One factor which was not examined in this baseline study was .the influence of patch reefs on water quality parameters. Some of the variation seen in the data is probably the result of some samples being taken close to patch reefs while others were taken in open lagoon areas.
Linear regression revealed no significant correlations between parameters contrary t o a priori expectations. It is generally accepted that certain parameters are significant predictors of others (e.g., pH is affected by temperature). The lack of significant correlations in these data is probably due to sampling strategy in which single date points were taken from wide-spread geographic areas.
Some seasonal effects were observed, particularly for temperature and salinity. The March-April period appears to be a time of slightly higher temperatures and slightly lower salinities than August. The differences are relatively small (about 1 "C for temperature and about 2 ppt for salinity), but these differences may be sufficiently large to affect some aspects of oyster biology. Other season trends were difficult t o detect. One confounding factor in the analysis of seasonal trends, aside from the small number of sampling periods, was the occurrence of a minor El Nifio event in 1992. The following year was also an El Nifio year.
Values for most parameters were highly variable .throughout the lagoon (Appendix 6) but no significant spatial trends were detected. Based on .these data, no conclusions can be drawn regarding potentially superior sites for farmirrg activities. Ideally farms should be located in areas with high rates of water exchange, in areas with high levels of dissolved organic nutrients or in areas wi th high food abundance, as indicated by silicate or chlorophyll a levels. I t may be that the scale of measurement
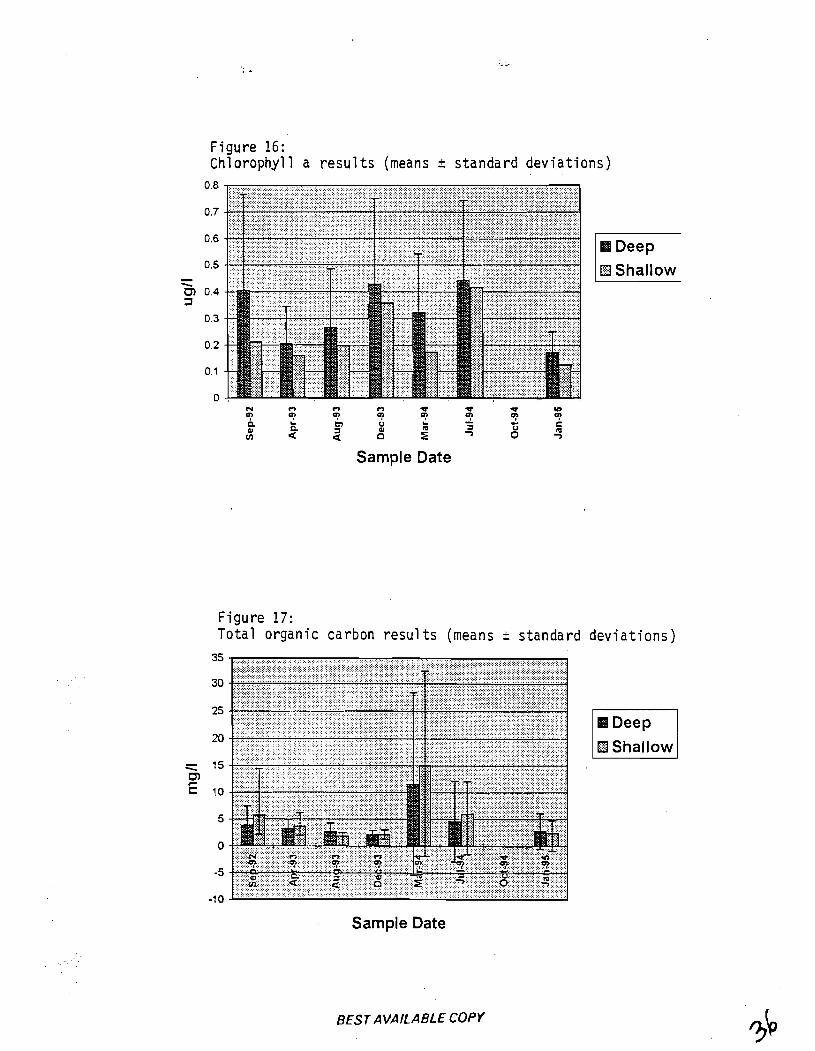
Figure 16: Chlorophyll a resul ts (means a standard deviations)
Sample Date
Figure 17: Total organic carbon results (means 2 standard deviations)
Sample Date
BEST AVAILABLE COPY
D e e p 1 Shallow 1

is sufficiently coarse to preclude detection of localized areas o f high concentrations of these substances.
No indications of deleterious human impact were found. The values o f all 1 2 parameters found in samples taken in proximity of the villages of Omoka and Te Tautua (Table 6, page 4-26) are well within the range of the results from other lagoon areas. None of these values are suggestive of nutrient loading or eutrophication. Human inputs to the lagoon may at this stage be sufficiently small that any differences produced are below the limits of detection of the analyses. These baseline data wil l serve as a valuable reference for future environmental monitoring, as the human population is expected to increase as farming progresses.
The high degree of variation of most parameters throughout the lagoon, the occurrence of two consecutive El Niiio years and the possible influence of numerous small patch reefs highlights the importance maintaining a long term monitoring program. Subtle changes in water quality due to human impacts may be difficult to detect due to other sources of natural variation. However, continued monitoring would permit detection of trends occurring over a period of several years. Any large changes outside the established baseline range of data collected since 1992 would indicate a need for closer investigation.
The objectives for the baseline water quality survey were achieved; representative values were obtained for 1 2 critical parameters throughout the lagoon before intensive pearl farming began. This valuable database will serve as a standard by which to assess potential environmental changes associated wi th farming and human activities in the future. The two years of data collected also indicate that at this point in the development of the pearl industry, any changes induced by farming or associated human activity are sufficiently subtle that they cannot be distinguished from normal variation produced by natural factors. 'The largest pearl farm in the Tongareva lagoon during the sampling period consisted of 8,000 pearl oysters. Water samples were taken from this farm and near it but no significant differences were detected in any of the water quality parameters.
4.4 Reef monitoring
0 biectives
Preserving the health of coral reefs is paramount to conservation of the lagoon environment and the welfare of the people who depend on reef resources for food, livelihood and successful pearl farming. Pearl farming may potentially impact .the lagoon patch reefs because they are widely used as anchoring points for farm mainlines. Additionally, pearl farming may act t o increase human population and, subsequently, the use of reef resources. Assessment and evaluation of patch reefs

Table 6. Water quality sampling results near Omoka and Te Tautua villages compared to other sampling stations (means 2 standard deviation).
Surface and
was planned in order to characterize the reefs and t o begin monitoring for potential impacts.
4.4.1 Methods
Three patch reefs were chosen for study. T w o reefs were close and down-current t o one of the largest pearl oyster farms in the lagoon. One patch reef o f approximately the same size and in the same area of the lagoon was selected t o serve as a control. Although additional patch reefs were selected for study, surveys were not completed due t o a number of logistical factors beyond the control o f the researchers. Methods were adopted from the UNEP publication, "Monitoring coral reefs for global change". Three fifty meter line transects were established at a depth of 10 feet a t each study site along the slope of each patch reef. T w o surveys were conducted for each
4-26
BEST AVAILABLE COPY

Photo 5. A coral patch reef in the Tongareva lagoon,
Photo 6. The people of-Tongareva re ly heavily on reef re-sources.
BEST AVAILABLE COPY

transect: 1 ) survey of fish indicator species; and 2) survey of the benthic reef community.
4.4.3 Results and discussion
Results indicated a high species diversity for the indicator fish species surveyed (26 species of the indicator classes were positively identified). Species abundance and diversity also varied among the three reefs surveyed, but more surveys would have to be conducted before any definitive conclusion can be drawn regarding effects of farming. Preliminary reef surveys conducted in 1992 and 1993 throughout the lagoon revealed differences in diversity of species type and abundance between the northern and southern parts of the lagoon. Some of the differences observed between the three surveyed reefs may therefore be due in part to geographical separation.
The only noticeable affect of farming was some recently broken coral on the patch reef adjacent to the farm area that may have been the result of repeated anchoring on the site. All of the patch reefs are subject to fishing and the taking of shellfish, yet all edible species were present in abundance indicating that fishing pressure is not severe. No signs of coral bleaching were observed. This has occurred in other areas of the Cook Islands. A great deal of small coral rubble and large pieces of broken dead coral were observed on the tops of patch reefs and along the shallow slopes. This is attributed to sea level changes in the recent past. Residents of Tongareva recount periodic falls in sea level during which the tops of the patch reef are completely exposed for extended periods of time. The most recent of these events is purported to have occurred in 1989.
4.5 Stock assessment
As part of the ecological assessment of Tongareva lagoon, a stock assessment program was initiated in order to: 1 ) estimate the standing stock of the Pinctada margaritifera population; 2) establish permanent sites to monitor the mortality and recruitment rates of the fishery; and 3) collect relevant basic biological data.
4.5.2 Methods
One hundred randomly selected sites were surveyed within the lagoon. Data were collected using the transect method of Sims (1992a). The maximum survey depth was set at 3 6 m (1 20 feet) for diver safety. Pearl oyster densities were measured along a single transect line of 50 m length laid on the lagoon floor. The transect width was 4 m. All lines were located with GPS coordinates and compass headings.

Photo 7 . A B l a c k - l i p Pear l O y s t e r i n i t s n a t i v e h a b i t a t .
Photo 8. Two Black-1 i p P e a r l Oys te rs o f t y p i c a l seed ing -s. ize.
BEST AVAILABLE COPY

Not all of the 100 transect surveys were completed: in some cases extreme depth or substrate type precluded survey.
Twenty permanent transect sites were established for continued monitoring of the population dynamics of the fishery. See Figure 18, page 4-31. Each site was located at a coral head. The sites were selected from 20 sectors distributed throughout the lagoon. Permanent transect lines were laid and 'tied downward along the rock face of each coral head to either a length of 100 m or to a depth of 36 m. Oysters within 2 m on either side of the transect were counted, measured and tagged.
A database was compiled from the results of the surveys of both permanent and non- permanent transects and includes densities, depths at which oysters were encountered, lengths, widths and mortalities. Approximately 300 oysters were counted and measured (dorso-ventral measurement-DVM).
Eight of the twenty permanent transect sites were resurveyed in early 1994 in an effort to assess changes in the population.
4.5.3 Results and discussion
Approximately 40% of the 100 sites surveyed were less than 36 m deep. It was therefore assumed for .the sake of estimation of the population that 40% of the lagoon was within the normal habitat range of P. margaritifera. Surveys conducted by Sims (1 990, 1992a) showed relatively low densities below 36 m. An overall density of 2 individuals per 100 m2 was calculated from the data. Total standing stock for the lagoon was estimated at 2 to 3 million. This estimate is in general agreement with that of Sims (1 990, 1992a) of 5.0 2 4.1 million.
The use of the transect method was found to have several potentially confounding factors. A number of the monitoring sites were regularly fished for pearl oysters by free divers. At these sites, there was a marked absence of pearl oysters in the upper depth strata. It is therefore difficult to distinguish between natural and fishery-induced mortality in the upper depth strata. Estimates of recruitment from future surveys of the permanent transects will only be obtainable at depths lower than the dive limits of free divers (approximately 21 m or 70 feet) since oysters of all sizes are generally taken. Several of the permanent transects were resurveyed in order to evaluate the error in locating and counting the oysters. Due to the deep depth of some transects, dive time is often limited and particularly in areas of heavy macroalgal cover, some oysters may not be found. The error of the counts was approximately 10%. Within the limitations of this method, the estimate is adequate for management purposes.
The average dorsoventral length was 15.0 2 3.0 cm. Maximurn length recorded was 22.0 cm. The depths of 400 oysters were recorded with approximately 50% of the

Rgm~ 18. Pemamx uansect sites for pearl oyster sock ass-
BEST AVAILABLE COPY

population observed in the 18 t o 27 m (60 to 9 0 ft) depth strata. Oysters tended to be clumped in patches on rock shallows. The highest densities were found on large, free-standing coral outgrowths which protruded above the substrate. This increased density may be due to increased water f low and consequently increased food supply around these unobstructed formations.
Attempts t o resurvey the permanent transects were only partially successful. Difficulties were encountered in relocating the transect lines. Several had broken and sunk below visible range. Other complicating factors were the loss or damage of identification tags from the oysters and loss of depth markers along the line. This made reidentification of many oysters impossible. An average increase of 10% in the total number of oysters along transects was found. The missing tags made it difficult t o determine if these were oysters previously tagged or were new recruits t o the population. Many of these were small in size indicating that i t was possible that these were new recruits. Additionally, small pearl oysters were found in upper depth strata where previously none had been encountered. Overall, this may be indicative of a slight increase in population numbers. Continued monitoring is recommended t o evaluate possible increases in population size.
The present P. margaritifera population of 2 to 3 million is clearly insufficient to support a large scale farming effort. The largest farm on the neighboring atoll of Manihiki consists of approximately 250,000 oysters (Tuara, 1991 ). The total number of oysters currently being farmed (defined as any oysters hung on main lines) in Tongareva is approximately 80,000, wi th the largest farm having 8,000 oysters. All oysters currently being farmed were collected from the wild by free divers. Spat collection is not widely practiced as past efforts at spat collection have yielded insufficient numbers of spat for farming purposes. Although the current scale of farrr~ing is still relatively small, consisting of approximately 3% to 4% of the population as estimated from the number of farmed oysters (approx. 80,000) and the total estimated population (2 to 3 million), it is expected that the number of farmed oysters will rapidly increase. It should also be noted that nothing is yet known regarding the recruitment rate of the wild population, so the maximum sustainable harvest has not been calculated.
Several future scenarios are possible. While free diving for oysters for the purpose of selling the shell (and thereby removing the oyster from the population) has decreased due t o the low prices for pearl oyster shell, some of the older oysters which are unsuitable for seeding are still being removed from the system. The majority of the oysters harvested are not removed from the system, but are hung on mainlines, thereby reducing fishing mortality from previous levels. It is estimated that approximately 5,000 oysters per day were harvested during the late 1980's resulting in an annual figure of 900,000 to 1,000,000 (assuming a conservative estimate of 15 fishing days per month) (Soa Tini, pers. comm.). The current emphasis on farming

has therefore reduced fishing pressure on the population and may eventually result i n an increase in the population. Additionally, it is possible that increasing oyster densities within a relatively small area (the NW quadrant of the lagoon) may result in increased recruitment if this promotes mass spawning events. If this assumption is true, then more wild oysters may be available for farming in the future. Caution is indicated, however, since even if current conditions favor population growth it will take several years before an increase would be observable.
It should be noted that in past years, despite the relatively high harvest rate, the wild p~pu l~at ion was protected from decimation by the ban on SCUBA diving. The depth limit of free divers guaranteed a residual population of oysters below that depth which served as broodstock for the population. While SCUBA diving for oyster collection purposes is still banned, it is now allowed for MMR staff to assist local farmers. Due to the heavy demands on the limited staff and equipment, there is pressure to allow more general use of SCUBA so that individual farmers can tend their farms. Widespread use of SCUBA would make it difficult to control the illegal collection of shell by SCUBA divers which would have a significant impact on the wild population.
The alternatives to dependence on the wild stock for farming are the development of improved spat collection techniques or hatchery production. Spat collection experiments have demonstrated that obtaining good spat set is possible in the Tongareva lagoon, although spat collection techniques require further refinement. The hatchery currently in operation on Tongareva has a minimum potential production of 50,000 spat per year. Neither of these initiatives can guarantee sufficient numbers of spat for farmers should the farming effort greatly accelerate in the near future. Given the pioneering nature of the farming methods in Tongareva and the relatively low numbers of the wild population, it is recommended that the present farms be kept relatively small. This should prevent novice farmers from overextending themselves initially while protecting the wild population from over-exploitation. Given sufficient time (3-5 years), the population may begin to rebound. It is also recommended that stock assessment activities be continued in order to monitor 'the condition of the population over the next several years.
4.6 Spat collection experiments
Objectives
T w o series of spat collection experiments were conducted and a third series was initiated to evaluate the feasibility of this method for obtaining oysters for farming purposes. Different locations, depths, deployment times and collection materials were to be evaluated.

Pho
L- rl Photo 9. Spat c o l l e c t o r s heav i l y enc ru s t ed w i t h
f ou l i ng organisms.
t o 10. Small Black-1 i p Pear l Oys te r s p a t ob ta ined from s p a t c o l l
BEST AVAILABLE COPY
e c t o r s .

4.6.2 Methods
Experiment 1 : Three spat collection lines were deployed in August 1991 in several locations throughout the lagoon. See Figure 19, page 4-36. Polypropylene, Christmas tree rope and shade cloth were used as collection materials. Half of the individual collectors were encased in mesh spat collection bags and half remained exposed. One hundred collectors were deployed on each long-line at a depth of 1 to 3 meters. The lines were monitored periodically and finally removed from the lagoon in January 1994. Two private lines were also monitored.
Experiment 2: Five spat lines were deployed in January 1994 in five locations throughout the lagoon. See Figure 19, page 4-36. Main lines were set at a depth of 1.5 meters so that the collectors, when hung on the line, would float at a depth of approximately t w o meters once they were weighted with setting organisms (initially the plastic collectors float upwards). Collectors were manufactured out of black, plastic shade cloth cut in 2.5 cm strips which was threaded concertina fashion onto 4 mm plastic rope. The collectors measured approximately 3 0 cm in length and 2.5 cm in diameter. Fifty collectors were deployed on each line at intervals of approximately six weeks. This resulted in 8 deployments and a total of 400 collectors deployed on each line over a period of a year. Samples were taken periodically to give early indications of spat fall. Retrieval began in September 1994 when the first deployment was retrieved after 9 months in the lagoon. Retrievals continued at approximately six week intervals when the first deployment was retrieved, with the final 2 deployments being retrieved in January 1995.
Experiment 3: After completion of Experiment 2, a third set of collectors was deployed on Spat Collection Line #5 (Figure 19, page 4-36) in the northern part o f the lagoon. Three types of collection materials were used: shade cloth, Christmas tree rope and looped plastic line material. This experiment was an additional task outside the scope of the PlMAR project and will be completed in mid-1996 by MMR staff.
4.6.3 Results and discussion
Experiment 1 : As can seen from the results in Table 7 page 4-37, attempts at spat collection proved neither practical nor economically feasible. In part this is due to a lack of maintenance of the line causing it to sink under the accumulated weight of biofouling organisms. The use of spat bags to protect the spat on collectors does not appear to be feasible since it is rapidly ripped open by some unknown organism, possibly fishes. This has also been observed to occur fairly rapidly after deployment on the lines of private farmers.

I I Figure 19. Spat mllection and hisropatho1ogy sample coIlectian sites.
BESTAVAlLABLE COPY

Table 7 . Preliminary spat collection results, Tongareva lagoon.
l~arahatea ( August, 1992 1 January, 1994 1 95 I 11 11 Ibroiect
I
l~araharakura I August, 1992 1 January, 1994 1 3 2 2 11
Ibrivate farmer 1 NW lagoon I June, 1 991 1 April, 1993 1 7 9 I 1 2 I I Ibroiect
I I I I I
Island Council I N W lagoon I August, 1991 I April, 1993 1 1 2 2
Tetautua I August, 1992
Experiment 2: A total of 91 8 spat were collected from 1622 collectors retrieved. The average spat per collector was low, with a mean of 0.57 spat per collector obtained. Analysis by location gives a range of 0.14 spatlcollector for line #3 to 1.48 for line #4. Considered over time, the range extends from a low of 0.1 2 for a deployment in MayIJune with retrieval in January to a high of 2.03 spatlcollector for the April deployment wi th retrieval in December. See Figure 20, page 4-38.
Overall, spat collection was poor. However, the experiment was not designed to obtain large numbers of spat, but rather to determine if some areas of the lagoon would produce better spat fall than others as well as to determine the best season(s) for deployment. The experiment was of relatively short duration, lasting only 12 months which may not be sufficient to definitively evaluate these parameters. The results do provide preliminary indications that spat collectors set in the vicinity of line #4, and set before August and retrieved in December may yield enough spat to be feasible. Average spatlcollector obtained during this time in this location was 9.2. See Figure 21, page 4-39.
11 January, 1994
Personal observations by the researchers also provided useful insight into other aspects of spat collection. It is generally recognized that spat fall is higher if lines are kept in the top few meters of the water column. Because of the weight of the fouling that rapidly accumulates on ropes, floats, and collectors, the lines require regular maintenance if they are to effectively collect spat. In almost all cases, the highest number of spat were observed on the floats and ropes immediately adjacent the floats. Up to 1 4 spat were collected from a single float. These are the areas that are most likely t o maintain their position high in the water column. These observations further emphasize the need to keep lines high, and free of fouling. Lines should be checked and cleaned monthly, and particularly from August to October, the most likely time for significant spat fall.
7 6
The highest number of spat collected for a single deployment of 50 collectors was 9.2 per collector. These collectors were deployed in April and retrieved in December. See Figure 21, page 4-39. The average size of these spat was 3 mm. Data collected
BEST AVAILABLE COPY

Figure 20: Spat col lec t ion r e s u l t s , f o r periodic deployments
U) 0)
r' IU 3
Retrieval date

Figure 21: Spat c o l l e c t i o n r e s u l t s by loca t ion and deployment 10.00
9.00
8.00
7.00
Sample Date

f rom French Polynesia indicates spat of this size are approximately 2 months old. This would mean that there was a significant spat fall in late Septemberlearly October. The gonad index data obtained for these months also suggests a spawning around this time, with a high gonad index from the September sampling and a much lower index in October.
While there appears to have been a significant spawning around late September, the fact that spat were collected at each retrieval date indicates that spawning is continuous, with at least some pearl oysters spawning throughout the year. This was further reinforced by casual observations of seeded pearl oysters spawning on several different occasions throughout the year during routine farm monitoring.
The retrieval of the MayIJune deployment occurred in January 1995. If the pattern described in the preceding paragraph were repeated, it would have been expected that high numbers of spat would also be retrieved at this time. However, this was not the case, and, in fact, this deployment produced the poorest result for line 4. The reasons for this are unknown, but could possibly be the result of heavy predation on the spat once they reach a certain size. It is also possible that this portion of the line had sunk below the optimum depth for spat collection t o be effective. Again, this reinforces the theory that lines must be kept high in the water column. It may also be best to retrieve collectors within 2 months of spat settlement in order t o reduce the possibility of predation. The small size of spat at this stage would necessitate keeping them in lantern baskets or spat collector bags after retrieval in order t o reduce the incidence of predation at this vulnerable stage.
This experiment has indicated that spat collection in Tongareva is viable, although refinements of the techniques are necessary.
Experiment 3: No results are yet available. Completion date is projected for mid-1 996.
4.7 Histopathology
Diseases associated with poor growth, poor pearl quality or mortality (George, 1978) have been a persistent problems in areas where pearl oysters have been intensively farmed. Occurrence of oyster disease can have a significant economic and environmental impact (Sims, 1992b1, but in relatively few cases has the pathogen responsible for the outbreak been identified. It is widely thought that in most instances, disease outbreaks are due to overcrowding or other poor farming practices which weaken oysters thus allowing opportunistic infection by pathogens, although this has not been well researched. As Sims (1992b) notes, the etiology of disease affecting pearl oysters is poorly understood and outbreaks are not predictable. Most

farming areas are not monitored by biologists and by the time an outbreak becomes apparent, the damage is done. In the absence of treatment once disease is evident, prevention is appropriate, but is only possible with a better understanding o f the nature of disease outbreaks.
In the case of Tongareva, where intensive culture is only now beginning, an unique opportunity existed to begin monitoring for cases of disease before a major outbreak could occur. An examination of oyster tissue can reveal which pathogens or parasites are routinely present in healthy oysters as well as providing samples of the normal tissues from oysters. A collection of oysters from the lagoon was therefore made wi th the objective of performing a baseline histopathological examination. Examples of healthy tissue types would be archived to use as references in case of future outbreaks.
4.7.2 Methods
Specimens for histopathological examination were gathered in July-August 1992 from three sites in the Tongareva lagoon. Eighty-five oysters were collected from three locations in the lagoon (Figure 19, page 4-36) and sent t o Dr. James A. Brock, D.M.V. of the Aquaculture Development Program, State of Hawaii. Five paraffin tissue blocks were prepared from each specimen for microscopic examination of mantle, gills, connective tissues, heart, vasculature, intestine, digestive diverticula, kidney, abductor muscle, and gonad. A total of 425 tissue blocks were prepared and examined. Tissue sections were stained with hematoxylin and eosin. When indicated, staining was by Periodic Acid-Schiff (PAS) method, a Giemsa Method or Feulgen Method (Brock, 1 993).
Two additional tissue samples were collected in August 1993 from the patch reef of Nahono located in the northern part of the lagoon. During examination of oysters for gonadal condition, it was observed that approximately 15% had small lesions (4-10 mm in diameter) on the mantle tissue. These lesions consisted of a small, colorless ulcer-like depression in the mantle tissue with a surrounding zone of rose-colored tissue which in turn was surrounded by a darker zone. Some lesions were also associated with surrounding areas of puffy, blister-like tissue. Oysters wi th lesions were otherwise indistinguishable with other oysters.
4.7.3 Results and discussiorl
Although no evidence was found of pathogenic or parasitic infection, a few observations are worth noting. In the first samples collected (1992), several associated organisms were found. An unidentified flatworm was found in the gill sections of 3 specimens. The pea crab, Pinnotheres sp. was also found in the gills of some specimens. A rotifer-like organism was found in the intestinal contents o f 52%

of the specimens. None of these organisms appeared t o be associated with pathological conditions.
A n unidentified multi-nucleated cell was found in the connective tissue of approximately 10% of the specimens. Dr. Brock suggests these may indicate a subclinical infection of a Perkinsus species.
The lesions found in the specimens collected in 1993 may have to have been caused by mechanical trauma, as no associated pathogenic organisms were found. Sections of a small crustacean were found in one of the tissue samples, possibly from a pea crab. Pea crabs have been previously associated with lesions in the mantle tissue (Dix, 1973).
Pearl oysters continued to be visually examined for signs of disease from June 1994 t o August 1995 during period gonad examinations. Although the above mentioned lesions were occasionally observed, no other cases of abnormalities were detected during this examination of approximately 500 pearl oysters. Additionally, results of the farm monitoring program indicate that mortality among farmed pearl oyster is low (~2%).
In conclusion, the current stock of P. margaritifera in the Tongareva lagoon does not appear t o be suffering from any serious pathogenic or parasitic induced diseases.
4.8 Genetic analysis
There are visible morphological differences in the stocks of Pinctada margaritifera found in the lagoons of the different atolls of the Cook Islands (pers. ob). Little is known, however, about possible genetic differences between the stocks. Knowledge of the degree o f genetic heterogeneity in the pop~~ la t ion is important for several reasons. Transfers of oysters have occurred several times within the Cook Islands and in other Pacific areas. If the spatially separated populations are genetically distinct, then the introduction of new genetic material could potentially "swamp" the local genetic traits which make each population uniquely suited t o its environment. Loss of adaptive traits could result in lower survival, slower growth, increased susceptibility to disease and potentially, poorer pearl quality. The genetic contribution t o good pearl quality is unknown, but until this is further elucidated, it is advisable t o maintain the genetic diversity present within the Cook Islands. Genetic analysis conducted before large-scale transfers take place will determine the advisability of this and other management practices. The results will also bear on the fate of hatchery produced oysters. If significant genetic differences are found between stocks, then it is not be advisable t o transfer hatchery produced oysters between lagoons.

The population genetics study was funded by the South Pacific Commission in coordination with MMR. RDA International personnel also provided supplemental funding for travel. MMR and RDA personnel collaborated with the effort by collecting tissue samples from Manihiki, Suwarrow and Tongareva. Dr. Benzie, the Principal Investigator, kindly shared his findings wi th the MNlR and RDA staff at the earliest opportunity.
4.8.2 Methods
Oyster tissue samples were collected from the lagoons of Penrhyn, Suwarrow and Manihiki in 1992 for genetic analysis. The genetic analysis was performed by Dr. John Benzie of the Australian Institute of Marine Science, Queensland, Australia. Dr. Benzie is a population geneticist renown for his research with tropical molluscs, most recently including the population genetics of the giant clam (Tridacna).
4.8.3 Results and discussion
Knowledge of the degree of genetic diversity among the various oyster stocks of the Cook Islands is needed as the possibility of transferring oysters between lagoons has been frequently discussed. If significant genetic heterogeneity is detected between the stocks, this would contraindicate transferences. Aside from the possibility of spreading diseases, caution in transferring oysters between lagoons is needed since it is important t o maintain the genetic variability found in each area. This genetic variability is the result of adaptation to local conditions during thousands of years of evolution and introduction of new genetic material may decrease the fitness of the local stock rendering it more susceptible to disease or resulting in slower growth. The genetic contribution to pearl quality is unknown, but different coloration patterns in the nacre of oysters from different lagoons have been observed (pers. observations).
The analysis was completed and submitted to the South Pacific Commission (SPC) for approval (Benzie and Ballmont, 1993). Significant genetic differences were found between pearl oyster stocks within the Cook Islands, and between Cook Islands stocks and stocks from Kiribati and Australia. Dr. Benzie has stated, "...there were significant genetic differences between populations within the Cook Islands, and that may have implications for you (moving) animals around that region". (pers. comm., 1994). It is therefore recommended that until more is understood regarding the effect of genetic composition on pearl quality and other traits, that each stock be preserved from interbreeding with other stocks.

BEST AVAILABLE COPY . -.
Photo 11. Mic roscop ic v iew o f deve lop ing eggs o b t a i n e d d u r i n g the gonad c o n d i t i o n check.
Photo 1 2 . Pear l o y s t e r f a r m i n g i n Tongareva f o l l o w s t h e T a h i t i a n l o n g l i n e method.

4.9 Assessment of gonadal condition
Knowledge of the reproductive habits of P. margaritifera is essential for organizing pearl seeding, deployment of spat collectors and hatchery spawning. If the spawning season(s) can be accurately forecast, spat collection programs, hatchery work and seeding of pearl oysters could be more economically and efficiently carried out . In other South Pacific regions, the major reproductive effort occurs in August-September with a minor peak occ~~rr ing in February-March. Since i t was unknown whether this pattern of reproductive effort also occurred in Tongareva pearl oysters, a periodic assessment of gonadal condition was initiated.
Beginning in September 1993, approximately 30 oysters were collected from the lagoon at monthly intervals. Divers collected all oysters encountered regardless of size. These were opened and the amount of gonadal material was evaluated visually. Samples for microscopic examination were removed from each sample and the developmental state of the eggs or sperm determined. Gonads were separated from somatic tissue and each tissue type was weighed separately. After weighing, each tissue was dried to a constant weight and reweighed. The gonad index was determined by dividing the dry weight of the gonad by the total dry weight of gonad plus tissue.
4.9.3 Results and discussion
Results are presented in Figure 22, page 4-46. High gonad indices, followed by low gonad indices, were noted in September and October, and again in February and March. Data from June was discarded due to obvious sampling errors. The final sample taken in August 1995 shows a decreasing gonad index, somewhat contrary to what would be expected if spawning were to occur during this month. This suggests that perhaps the spawning season in Tongareva may occur slightly later than in other South Pacific regions or it may be that more data is needed to accurate determine the spawning season. 'The possibility of a major spawning occurring in October is also suggested by the spat collection experiments (see Section 4.6.3) which appears to be the case in Manihiki (Newnham, pers. comm).

Figure 22: Average gonad index by month
9 a) L
Month

Photo 13. M M R s t a f f removing heav i ly fou led pear l o y s t e r s from farm 1 i n e f o r c l ean ing .
-- Photo 14. Cleaning pearl o y s t e r s i s an important p a r t of farm management.
BEST AVAILABLE COPY

4.10 Farm monitoring
Many aspects of pearl oyster biology and pearl culture remain unknown, particularly the relationship between the t w o areas. The farm monitoring program was designed to monitor several of the larger farms in Tongareva from seeding to harvest. Data was collected on mortality rates, growth rates, fouling rates, farm management methods, environmental conditions, and harvest results. The latter could not be observed since the harvest occurred after departure of the researchers from Tongareva. It was hoped that by observing actual farm practices and their results, insights could be gained into the most appropriate methods for Tongareva farmers. Additionally, knowledge of basic biological parameters such as growth and mortality rates is essential for formulation of management plans.
4.10.2 Methods
Four of the largest, most geographically dispersed pearl oyster farms were chosen for study. All of these were located in the northwest quadrant of the lagoon, where the majority of the farms are located. The largest farm consisted of 8,000 seeded oysters. 'The number of seeded pearl oysters on the other farms ranged from 1,050 t o 1,500. These farms also had an undetermined and variable number of unseeded pearl oysters. Most of the farms were in the vicinity of patch reefs which provided anchoring points for the mainline but which also contained a number of unseeded pearl oysters being "bankedn on the reefs.
The farms were visited approximately every t w o months for one year. Visits were timed slightly irregularly due to difficulties traveling t o the farms. During each visit, f i f ty tagged oysters were measured. Dorso-ventral (DVM) and width (perpendicular t o DVM) measurements were taken. Approximately 150 oysters were examined for mortality. Observations were made regarding environmental conditions, maintenance of the farm, biofouling, and other pertinent information. Results were provided to the farmers in a written report which was also discussed wi th them. The farm monitoring was initially planned to continue until harvest, but the generally poor management practices eventually led t o extreme states of fouling which made accurate measurements impossible. Since sufficient growth and mortality data for analysis had been collected during earlier phases, the program was discontinued in early 1995.
4.10.3 Result and discussion
The farm monitoring program produced the following results:

1. The Tahitian method of long-line farming is followed in Tongareva. This method has the advantage of utilizing relatively little in the way of materials (lines and floats) in comparison with raft or hanging basket methods. The farms are also completely submerged, thus avoiding navigational hazards. The principal disadvantage to this method is the requirement to perform a great deal of work underwater which requires either skill in free-diving or use of SCUBA gear. While the MMR staff is allowed the use of SCUBA gear to assist the farmers, MMR does not have sufficient staff or equipment to adequately assist farmers on a routine basis. Not all farmers are able to free dive and use of SCUBA gear is prohibited. This has adversely affected farm management practices.
2. Growth in the seeded adult oysters averaged 0.21 cm in the DVM aspect and 0.35 cm in width per month. The average DVM for a seeded oyster was 15.3 cm and width was 14.9 cm. Adult oyster appear to grow uniformly in both axes. The growth rate is consistent with extrapolated growth rates from juvenile oysters (see section 4.1 1.3). No differences in growth rates were detected between farms. It should be noted that due to biofouling and observer variation, these growth rates are approximate.
3. Observations began two weeks to two months after the oysters were seeded. Although the farmers reported some mortality immediately following seeding, mortality during the subsequent months was low. During the first two observations (taken at monthly intervals), mortality averaged 2% and then dropped to less than 1 % for the remaining observation time. This indicates that disease and predation do not appear to be serious threats to farmed oysters in this lagoon.
4. Biofouling, although not quantified, appeared to be slightly heavier on the two centrally located farms with the most northern and the most southern farms having slightly slower rates. Principal fouling organisms were the "pipi" pearl oyster (Pinctada maculata), sponges, hydrozoans and sea anemones. The degree of biofouling was often severe and the pearl oyster became rapidly encrusted within approximately 2 months if left unattended.
5. Farm management practices were generally poor. The weight of severe biofouling often caused the pearl oysters to break off the chaplets and for the mainlines to sink, often to the bottom of the lagoon. It is unknown what effect, if any, this fouling has on growth rates or pearl quality, but physical damage to the line and lost pearl oysters are often the result. During the nine months of monitoring, one farmer cleaned his oysters three times; one cleaned his twice and the other two farms were cleaned only once. To prevent lines from sinking, cleaning is advisable at least every two months. Most successful pearl farmers in other areas clean their oysters on a bi-monthly to a monthly basis because it is believed that this improves pearl quality.

6. No significant difference in environmental conditions between the farms was observed. Water samples were also taken from these farm sites, but no significant differences between farms or between farm and non-farm sites were found. Farms of this size apparently do not produce detectable changes in water quality in their immediate vicinity.
Correlations between these observations and resulting pearl quality were not possible since researchers were not able t o observe the harvest.
4.1 1 Spat growth
Little is known about growth and mortality of juvenile pearl oysters. Information on these subjects is useful for formulation of management plans and for planning hatchery and farm tasks.
Methods
Spat of various sizes were collected during spat collector trials. Spat greater than about 45 mm were measured, drilled and hung on tagged chaplets. Spat o f smaller sizes, down to 5 mm, were measured and placed into tagged spat collector bags. Spat were remeasured at irregular intervals over a 1 0 month period. Individual spat on tagged chaplets were identified by their position on the chaplet. The smaller oysters were measured in their size classes, and average growth rates were calculated were calculated for each class. Daily growth increments in m m were plotted for size classes from 5-1 0mm to 91-1 00mm.
4.1 1.3 Results and discussion
Results are presented in Figures 23 and 24, pages 4-51 and 4-52. These results suggest that small spat measuring less than 15 mm DVM, grow at a slightly slower rate than spat from 15 mm to 100 mm. Growth rate can be seen t o approximate 0.2 m m daily for P. margaritifera in the 5 t o 100 mm size range. This is approximately three times the growth rate obtained for adult pearl oysters. Growth rate was remarkably uniform, with very little variation within the same size class.
Spat growth rate appears to be uniform for spat from 5 t o 100 m m DVM. This represents spat of approximately 3 months t o 16 months in age. The relatively uniform growth rates suggest that other studies that have produced a wide variety of growth rates (e.g., Sims 1994) were probably using oysters of different ages, with some approaching their maximum size and consequently growing more slowly. All the spat used in this experiment were under 18 monlhs of age, and still growing

F i g u r e 23: Average d a i l y qrowth f o r spa t (5-60mm)
S t 0 1 0 11 to 15 1 6 to20 21 to 3 0 31 to 40 41 to 5 0
Size class (mm)

F i g u r e 24: Average d a i l y growth f o r spat (60-100mm)
71 to 80 81 to 90
Size class (mm)

rapidly. Some individual oysters attained growth rates of up to 0.4 mm per day while a few grew at only 0.1 mm per day.
The results indicate that on average, P. margaritifera in Tongareva lagoon can be expected to take approximately 25 months at an average growth rate of 0.2mm per day t o reach the typical minimum seeding size of 150 mm. This figure correlates with observations of the larger spat from the spat collection experiment. These are now mostly between 100 and 120mm DVM. The maximum probable age of these animals is 17 months (if they settled on the spat collectors as soon as they were deployed in January 1994) although they are most likely 15 t o 1 6 months old since little settlement was observed during first t w o months.
4.1 2 Hatchery trials and microalgae production
Hatchery production of juvenile pearl oysters offers one means by which to assure spat supply t o farmers in cases where the wild stock is limited in number. Hatchery produced larvae and juveniles also make ideal research subjects because they are of uniform size, known age and known genetic background. Many types of basic biological studies can be performed easily in hatchery facilities, but not in the wild. The objective of the hatchery work was therefore t o establish and operate a small- scale commercial size pearl oyster hatchery. The first step in the implementation of this was culturing of microalgae as a food source for pearl oyster larvae and subsequently conducting spawning trials.
4.1 2.2 Methods
Stocks of microalgae were imported from sources in the U.S. Three types of algae which were reported to have been used successfully t o culture pearl oysters were used: lsochrysis galbana, Chaetoceras gracilis and Tetraselmis pseudonana (Alagarswami, 1989). Culture media was F2 algae food obtained as a commercial preparation from Fritz Aquaculture, USA. Culture techniques were standard method. Microalgae culture immediately proved to be quite successful. Within 4 weeks of receiving the stocks, sufficiently large volumes of microalgae were cultured (400 liters) to permit spawning trials to begin in May 1995.
Pearl oyster broodstock for spawning trials was taken directly from the wild. Adult pearl oysters of varying sizes were collected, brought to the hatchery, biofouling removed, rinsed briefly with freshwater and placed in the spawning tanks. The tanks were filled with filtered seawater heated to 3 0 "C which was then slowly heated to 32-33 "C over a period of about t w o hours. Macerated gonad was also added. Pearl oysters usually spawned within 3 0 minutes of the addition of the gonad material.

Photo 15. S t a f f B i o l o g i s t i n s t r u c t s MMR t r a i n e e s a b o u t m i c r o a l g a e grown as o y s t e r l a r v a e food .
Photo 16. Spawning B l ack--1 i p Pear l O y s t e r s .
BEST AVAILABLE COPY

4.1 2.3 ts and d i u s i o n
A total of six spawning trials were conducted between May and July 1995. Spawning was induced and viable larvae were obtained in four of these trials. Spawning was achieved using natural methods with no use of chemicals. Relatively few eggs were obtained at each spawning. The most successful resulted in 55 million eggs from 7 spawning females: a relatively low number for large bivalves. The gonad examinations during this period revealed only partially filled gonads.
In t w o of the trials, larvae were cultured until days 9 and 11 post-fertilization before larvae were accidentally lost during training exercises. Larvae were observed t o feed vigorously, ingesting all three types of algae. Larvae also swam actively. In the other trials, complete mortality occurred within 5 days of fertilization. Reasons for this mortality are unknown; but could be due to poor egg quality. This phenomena has been observed in other species of bivalves which are spawned during non-optimal reproductive seasons.
Although larviculture was not successfully realized t o metamorphosis, one major hurdle has been achieved. Spawning appears t o be relatively simple t o induce even though the animals were not fully ripe. Better success may be expected during peak spawning seasons.

Photo 17 . Chief of Par ty and t r a i n e e dra in ing l a r g e l a r v i c u l t u ' r e t anks .
I ' Photo 18. S t a f f B i o l o g i s t and MMR t r a i n e e s f i l l a l a r v i c u l t u r e tank with
-
f i 1 t e r e d seawater .
BEST AVAILABLE COPY

5.0 SUMMARY
'The collection of baseline environmental data was sa.tisfactorily completed before large-scale intensive farming began. Results of continued monitoring during the development of pearl farming did not detect any detrimentdl effects of farming. 'The lagoon appears to be relatively healthy in an ecological sense. The major detectable human impact was on the stock of P. margaritifera. However, these findings should be interpreted cautiously since the relatively small size of farms may be below the
- point at which any associated effects could be detected. Continued monitoring as the industry develops further is advisable.
The population of oysters in the lagoon is sufficiently small that large-scale farming efforts coupled with the use of SCUBA for oyster collection could seriously threaten the population. Sound management schemes must be implemented and enforced within the coming years. The prohibition on SCUBA serves t o protect the wild population and this, coupled with decreased fishing mortality, may lead to a rebound of the population. However, lack of SCUBA has seriously affected farm management, and alternatives should be explored that would allow farmers to better tend their farms. Since spat collection and hatchery production will probably not provide a reliable source of spat for farmers in the near future, continued protection of the wild stock remains an imperative.
As the scale of farming is rapidly accelerating and pearl seeding is now in progress, continuation of monitoring efforts is imperative in order t o maintain the overall condition of the lagoon and its resources.

ISSUES AND RECOMNIENDATIONS
Collection of baseline water quality data was completed before intensive farming activities began. Results of the water quality monitoring program suggest that human and farming activities have had little impact on water quality. Quarterly water sampling should continue on a lagoon-wide basis t o continue augmenting the database and to monitor possible impacts of farming and other human activities. It is recommended that monitoring be intensified around farm areas as the scale of farming increases.
Crucial areas for future study include: a) the collection of reference data around reefs and farms; 2) correlations between water quality, oyster growth and health, and pearl quality; and 3) the impact of farming and other human activities (including the impact of population growth).
Although patch reefs do not appear to be directly impacted at this stage of farming, further reef studies should be initiated as part of an on-going monitoring program. One area which deserves further attention is the assessment of "pipi" (P. maculata) and giant clam (Tridacna) harvest, which is heavy and may be intensifying.
Collection of additional information on currents within the lagoon is crucial for both research and farming purposes. Use of drogues in the northwest quadrant of the lagoon will now prove difficult due to the large number of farms, but use of multiple current meters or dye studies s h o ~ ~ l d be feasible.
The results of stock assessment data indicate that the standing stock of P. margaritifera is insufficient t o support a large-scale, intensive farm effort without possibly irreparable damage to the wild stock. Management practices should be promptly instituted to limit farm size, both to protect the resource and to prevent novice farmers from overextending themselves.
Monitoring of the P. margaritifera population should continue in order t o determine the effects of farming on the condition of the wild population.
The ban on collection of P. margaritifera using SCUBA should remain in place. In the past, the depth limit of free divers was the mechanism by which the natural population was protected from decimation. Unless sound management practices are implemented and enforced in the near future, this ban will continue t o function as the only means to conserve the population. From a practical perspective, i t is much easier to enforce the ban on general use of SCUBA equipment than it is to enforce fishing regulations. Some manner must be found, however, t o accommodate the needs of the farmers for services

which can only be provided using SCUBA, such as anchoring and monitoring long lines. One alternative would be permitting the use of hookah gear with a limit imposed on the length of air hose allowed. This would allow farmers to work the farm lines while maintaining a depth restriction on oyster collection activities. Implementation of a marine law enforcement patrol could also assist in limiting the use of hookah for farming activities since the hookah apparatus is visible from the surface, unlike SCUBA.
a Alternatives to collection of wild stock for farming purposes, such as spat collection and hatchery production should be emphasized as these will reduce fishing pressure on the wild stock in the future.
a The wild P. margaritifera stock appears to be generally healthy with no prevalent pathogen nor parasite. Continued monitoring is recommended over the course of the development of the farming industry.
a The finding that genetic differences exist among the stocks of P. margaritifera from the various atolls of the Cook Islands strongly contraindicates transfers of oysters between lagoons or from other countries.

7.0 REFERENCES
Alagarswami, K., S. Dharmaraj, A. Chellam, and T.S. Velayudhan. 1989. Larval and juvenile rearing of Black-lip Pearl Oyster, Pinctada margaritifera (Linnaeus). Aquaculture 76: 42-56.
Benzie, J.A.H. and F. Ballment. 1993. Genetic differences among black-lipped pearl oyster (Pinctada margaritifera) populations in the Western Pacific. lnshore Fisheries Research Project Miscellaneous contributions. South Pacific Commission, Noumea, New Caledonia.
Brock, J.A. An histological survey of Black Lipped pearl oysters collected from the Cook Island Lagoon in July-August, 1992. Report to RDA, International, Inc.
Dix, T.G. 1973. Mantle changes in the pearl oyster Pinctada maxima induced by the pea crab, Pinnotheres villosulus. The Veliger 15: 330-331.
DMA. 1988. Sailing Directions for the Pacific Islands. 3rd Ed. U. S. Defense Mapping Agency. Publication 126. 407 p.
George, C.B. 1978. A report to the government of Papua New Guinea. The Food and Agriculture Organization of the United Nations, and the Asian Development Bank. Samarai, Mile Bay Province, Papua New Guinea.
Johannes, R.E. 1975. Pollution and degradation of coral reef communities in E.J.F. and R.F. Johannes (eds.): Tropical Marine Pollution. Elsevier, Amsterdam.
Martin, D.F. 1970. Marine Chemistry. Vol 2. Marcel Dekker, New York.
Pers. Comm. 1994. With John Benzie, Australian Institute of Marine Science.
Parson, T.R., M. Yoshiaki, and C.M. Lalli, 1984. A manual of chemical and biological methods for seawater analysis. Pergamon Press, Oxford.
Sims, N.A. 1988. Stock assessment of pearl oyster resources in the Cook Islands. Workshop on Pacific Inshore Fisheries Resources. South Pacific Commission/lnstitute Fish. Res.IBP83.
Sims, N.A. 1992a. Abundance and distribution of the Black-lip pearl oyster Pinctada margaritifera (L.) in the Cook Islands, South Pacific. Aust. J. Mar. Freshwater Res. 43: 1409-21 .

Sims, N.A. 1992b. Reducing the risk of pearl oyster disease in Polynesian lagoons; can we prevent the unpredictable? in press.
Stoddart, D.R. and R.E. Johannes. 1979. Coral reefs: research methods. UNESCO.
Tuara, P.N. 1991. Pearl shell population count. Ministry of Marine Resources, Cook Islands.
United Nations Environmental Program. 1993. Monitoring coral reefs for global change. Report of LINEP, United Nations.

8.0 APPENDICES
Appendix 1. Wind direction and speed
Appendix 2. Plot of predicted tides, July and August
Appendix 3. Current meter series plots.
Appendix 4. Drogues and trajectories.
Appendix 5. Linear regression analyses with F-test.
Appendix 6. Visual representation of water quality data.
Appendix 7. RDA International, Inc., PIMARICOOK Islands reports

.- ...... _ _ _ _ _ .... ..-- . ...
...__.___.___ .... .-.--.
.--......_..........--.
Tongareva Wind Direction and Duration July 27-A~i011~17, 1093
I I
> n

9 10 1 1 12 13 14 15 16 Fl r m 1 .r1-1--1- v r v 1-r r 1 .g--w I - T T n -r r - - v - l - a - r v n r-8- I-,- n 1 - n - , - ~ - r m ~ i - 1 - r~ - l - t - r , r-r r - r ~ r T-1 -v-.m-l--v-r r r l s-rr-r,-l-r- v -~ l - r - - l -~y - r -m
6 . . ... _ _ ... --
nr(77;m 3 -
2 ...... ---- --- - --
.... I I . I . I ~ L L I A ILL ,_ . A 1.1 L~-I.~., 1 .-a , - s I ,.: I # * . I A d . . a - m . . l . d . ~ l . , L a .a. .*.* l . a - e - l . a - a . l . . ~ a . --I.JA-I-AJ-. .L~-I-LIALI.JLL ALI.LLLL~AA-
F l
6
2
I
3 Fcrll Mmn l l Lasl Uuatler 10 N o w MOM 26 f-ksl Oualler .
---
I 2 r v ~ 1 - 1 - 1 i 1-r-*- .ni.r r-r I-,T l - r r
.- -.-
4 / V \ - T / V \
3 . - --
1.L 1d3.1 ...A. a ~ . , . ...... I.. . > A . I ..a
BEST AVAILABLE COPY

EGG I- ISI~G~~V UA~~JUOJ
... ,._, . _ I.. .. .... . . .

1803 - Meter Star1 16~40 Wind DlrerUon Is hdlcillud by &lows
REST AVAILABLE COPY

Appendix 3 . ( c o n t . )
BESTAVAILABLE COPY

l M n C -- I atilude and I o ~ y l k ~ d e ~acorc l r 101 C)to~ur. Cwronl Meler end Walat Gamyllrq Sallons. July -Aug~rrL 1893
Vaclnr I VU$!W 1 M.~P Doplh Sde S J WIIKI Wind Tlde l l d e R e c w Voclor Vulocllr Volocl l~ Voclor Vdocltr Veloclly Commenlr Codr Dale No b!b) l l rne I)lraclion Speud llulgll l Stage l l r l la l englh lleadlng [cllJbuc) (rlulu) I m g l h l l a e d l l l ~ (c~~dcec) Irnulu)
- 2 o k s Rsl.r%?c_~ F 1 ? D M P 2 I 4 0 0 80 I 6 3 l F W l 5 5 # 4 I I53 185 87 250 234 6 6 8 103 F 1 10W t) 2 1400 80 18 3 1 flood )559 37 180 111 8 1 225 235 4 48 I80
f 3 28 W C I 0 1414 80 I 8 3 1 fbocl I 8 0 1 18 0 I 3 9 M I I O 0 1 1 4 77 F 4 29 J d E 1 14 42 80 I 8 3 7 Flood 240 168 6 8 7 216 F 5 2 9 U I 1 10 4 4 80 18 S I F l o o d 28 45 0 6 5 23 . .
28-Ju( J 2 I 4 51 80 I 6 37 Flood . - 299 8 18 315 Suck on r e e l d m t e l ~ k v s d - ----- E W I 3 0 - L I A I 0 I 0959 80 I 0 36 Ebb I 4 0 1 130 315 1 6 8 86 I 8 0 0 19 I N a u 1uarJ. 18 m deplh. stuck on reel E W I EW3 EW4 EW5 EW6 EW7 Ewe EWS EWlO E w l l E W I 2 ----- Nl- I N l - 2
N l .3 N l - 4 N I - 5 N l .6 N l . 1 N l - 8 N I ~ B N I - I 0 141-I1
&!:!a- N1- I N1.2 N2-3 N 1 ~ 4 141-5 N2-8 N 2 . l
N2 1) N2-9
N1- I 0 N 1 - I t N1- I1 N2- 13 141-I4
M J d 0 2 I l O W 3 0 - W E I 2 1 0 . 1 1 3 0 . W C 10 1 IO.IS
' 30-Jul I 1 3 I 0 2 8 3 0 4 4 J I 0 3 I 0 3 0 3 0 - W F 2 4 1 0 4 5 30 Jul 11 10 4 10.48 30-Jul 0 10 1 1 1 : 1 2 30-Jul P 1 1 1 1 : 1 3 3Q-JUI 8 2 14 32
M2!! A_!! ! ! ! 21- 31-Jul 10 I I 0 0 4 3 1 - N 0 1 I 0 05 31-Jul P 10 2 1020 31-W 1 1 lo. 21 31-Jd I 0 10.42 3 8 - W 0 1 80.43 3 1 - W B 10 3 1051 31-Jul E 1 10.53 31-Jd C 10 4 1102 31-Jul A 1 1102 31-Jd F 10 6 11U8
3 ( . J u ( _ ! ! . 0 9 -- 06-Aug E I 0 I 3 34 06-Aug F 2 13 34 OB-Aug C 1 I 3 45 06-Aug A 10 13'45 OB-Aug 0 10 13 50
06~Aug 0 1 13 50
0s-AUQ I 1 14 39 06-Aug P 2 14143
OS-AUQ C 2 I 0 I 5 I 4 06-k rg B 1 I 0 I 5 01
06-AUQ I 1 10 15.11 06~Aug A I 0 I 5 01 OB.Aug 0 2 I 5 05 Wrula C 1 J5.W
IM I W 100 IM
IM
I W
4 0 0
IOU IM
Irn Irn I W I00
I 0 3 6 E b b I 3 6 9 10 3 6 E b b 15.13 I 0 3 6 E b b 10 3 0 Ebb I 0 3 6 Ebb 10 3 0 E b b I 0 3 0 Ebb 10 35 Slack 10 35 6lack 15 36F lood I 5 36F luod -- - 28 315 I 5 5 ------ 68 I 5 35 Ebb 68 236 425 I53 I 5 3 6 E b b 118 151 6 8 3 149
I 5 35 Ebb 148 300 155 56 15 3 5 E b b I 685 251 7 0 1 251 I 5 3 6 Ebb 350 87 4 8 1 I14 15 3 5 E M 431 310 5 9 9 116 I S 3 5 Ebb 18 110 0 11 8 I 6 3 5 E W 26 315 0 3 0 11 18 34 Slack 148 210 163 59 16 3 4 Slack 61 I 240 6 18 207 18 34 Slack 31 180 0 3 8 13
3 ! S l u c k - M ) I i ' C L ! 2 5 p p 18 3 1 Ebb I 6 3 1 116 18 1 5 1 91 I40 61 18 3 1 Ebb I 8 25 260 118 6 4 9 I08 l W 314 16 3 7 Ebb 68 18 198 71 I 8 3 1 E N 188 I I 6 25 225 18 3 7 EL*, 0 180 0 0 1 0 18 3 1 Ebb 115 301 I 0 8 4 390
I 8 3 6 5 E b b I814 118 288 7 18 258 408 218
I 8 365 Ebb 16.16 0 210 0 0 2 1 14 210
I 6 365 Ebb 144 310 3 8 0 131 I 8 365 Ebb 31 I80 0 8 4 30 16 365 Ebb 92 I43 1 I 6 18 I 8 3 0 Slack 158 308 5 1 8 160 18 36 Sldck 238 293 1 5 2 111 16 3 6 Slack 280 8 1 3 318 J ! a - - -
0 55 XI Neiu Iuual . I 8 m drplh. rluck on reel
7 09 255 Mou. 44 nu Jeplh Mou. 48 m deplh Varlr.npl. 55 m depth Varlrengl. 65 m depth Teakuaku. 81 m dsplh Iaakuaku. 81 m depLh Sluck on re01
Stuck M teal 41m relrlewd. earl sldr d reel Earl rWe d r e u l Werl rWa d rael. 28 m Werl r u e d real. 18 m muck 4 r re lwtnn relrkwd. M m 61uck on r e e l d ~ s r relrlewd. 20 III 3Qm 30 rn 21 m C.
BEST AVAILABLE COPY

Ippendix 5. Linear Regression Analyses with F-test.
Drogue Depth Vs Drogue Speed
Tide Stage Vs Drogue Direction
Regression Statistics
R Square
Analysis of Variance
Regression
Residual
Total
Tide Stage Vs Drogue Speed
0.39
df
1
3 9
40
Sum of Squares
195352.1 8
309786.36
5051 38.55
Segression Statistics
S Square
Analysis of Variance
Segression
Sesidual
Total
0.01
df
1
39
40
Sum of Squares
0.17
25.78
25.95
Regression Statistics
R Square
Analysis of Variance
Segression
Sesidual
Total
Mean Square
195352.1 8
7943.24
0.01
df
1
3 9
40
Sum of Squares
995.20
504143.35
5051 38.55
Mean Square
0.17
0.66
F Value
24.5935
Mean Square
995.20
12926.75
Significance of
0.00000
F Value
0.2647
Significance of F
0.6098
F Value
0.0770
Significance of F
0.7829

Appendix 6. Visual representation of water quality data.
Note: The following four series of visual representations present the results of analysis for the following parameters:
Series 1: Salinity Series 2: Silicates Series 3: Total Organic Carbon Series 4: Chlorophyll a
Each figure contains two images. The upper image presents results of the shallow samples and is delineated by a map of Tongareva. The lower image presents results of deep samples in a topographical fashion. The sample dates are in the lower right hand corner of each image.

Series 1. S a l i n i t y
BESTAVAILABLE COPY

S e r i e s 1. S a l i n i t y
Salinity
-- December
BEST AVAILABLE COPY

Series 1. Sa l in i ty
July 1994
October 1944
BEST AVAILABLE COPY

Series . S a l i n i t y
Mmth
December 1
BEST AVAILABLE COPY

Series 2. S i l i c a t e s
BEST AVAILABLE COPY

Series 2. S i l i c a t e s
- w March 1994
BEST AVAILABLE COPY

Series 2. Si l icates
North
North
BEST AVAILABLE COPY

S e r i e s 3. T o t a l Organ ic Carbon
Carbon North
BEST AVAILABLE COPY

Series 3 . Total Organic Carbon
. March 1 994
BEST AVAILABLE COPY

S e r i e s 3. T o t a l Organ ic Carbon
BEST AVAILABLE COPY

Series 4. Chlorophyll a
.;+"
August 1993
BEST AVAILABLE COPY

Series 4. Chlorophyll a
%-
December --
BEST AVAILABLE COPY

Series 4. Chlorophyll a
BEST AVAILABLE COPY

Appendix 7 . RDA IN'TERNATIONAL PIMARICOOK ISLANDS REPORTS (does not include Monthly Progress Reports)
9201 Quarterly Progress Report Cook Islands Black-Lip Pearl Oyster Culture Project, October - December 199 1. RDA International, Inc. January 1992.
9202 Quarterly Progress Report Cook Islands Black-Lip Pearl Oyster Culture Project, January - March 1992. RDA International, Inc.
9203 Cook Islands Black-Lip Pearl Oyster Culture Project lmplemen ta tion Plan, RDA International, Inc. July 1992.
9204 Cook Islands Training Plan, RDA International, Inc. August 1992.
9206 Quarterly Progress Report Cook Islands Black-Lip Pearl Oyster Culture Project, April - June 1992. RDA International, Inc.
9207 Establishing a Pearl Oyster Research Program in Tongareva, Neil A. Sims. RDA International, Inc. September 1992.
9207a Initial Report and Recommendations for the 0 yster Research Program in Tongareva, Neil A. Sims. RDA International, Inc. April 1993.
9208 Quarterly Progress Report Cook Islands Black-Lip Pearl Oyster Culture Project, July - September 1992, RDA International, Inc. October 1992.
9209 Quarterly Progress Report Cook Islands Balck-Lip Pearl Oyster Culture Project, October - December 1992, RDA International, Inc. October 1992.
9301 A Preliminary Economic Assessment of the Expansion of the Cook lslands Cultured Black Pearl Industry: Constraints, Opportunities and Potential Impacts, Dr. John T . Rowntree. RDA International, Inc. March 1993.
9303 Quarterly Progress Report Cook Islands Black-Lip Pearl Oyster Culture Project, January - March 1993, RDA International, Inc. 1993.
9304 Cooks Second Year Implementation Plan, RDA International, Inc. June 1993.

Cook lslands Trlb Report, Maria C. Haws. RDA International, Inc. May 1993.
Tongareva Black Pearl Hatchery Design Objectives and Goals, Maria C. Haws. RDA International, Inc. May 1993.
Ouarterly Progress Report Cook lslands Black-Lip Pearl Oyster Culture Project, April - June 1993, RDA International, Inc. 1993.
Ouarterly Progress Report Cook lslands Black-Lip Pearl Oyster Culture Project, July - September 1993, RDA International, Inc. 1993.
Results of Inspection Visits to Potential Bidders Facilities for the Tongareva Marine Research Center, Kenneth B. Craib. RDA International, Inc. December 1992.
Ouarterly Progress Report Cook lslands Black-Lip Pearl Oyster Culture Project, October - December 1993, RDA International, Inc. 1993.
Cook lslands Black Pearl Oyster Project Pearl Oyster Biology, and Lagoon Water Quality and Ecological Conditions, RDA International, Inc. May 1994.
Ouarterly Progress Report Cook lslands Black-Lip Pearl Oyster Culture Project, October - December 1993, RDA International, Inc. 1993.
Ouarterly Progress Report Cook lslands Black Pearl Oyster Project, July - September 1994. RDA International, Inc. October 1994.
Ouarterly Progress Report Cook lslands Black Pearl 0 yster Project, October - December 1994. RDA International, Inc. January 1995.
Ouarterly Progress Report Cook lslands Black Pearl Oyster Project, January - March 1995. RDA International, Inc. April 1995.
Ouarterly Progress Report Cook lslands Black Pearl Oyster Project, April - June 1995. RDA International, inc. July 1995.