sustaining critical sectors of the u.s. defense industrial
TRANSCRIPT
Sustaining Critical Sectors of the U.S. Defense Industrial Base
Barry D. Watts toDD Harrison
C e n t e r f o r s t r a t e g i C a n D B u D g e t a r y a s s e s s m e n t s
Center for Strategic and Budgetary Assessments 1667 K street, nW, suite 900Washington, DC 20006 tel. 202-331-7990 • fax 202-331-8019www.CsBaonline.org

SUSTAINING CRITICAL SECTORS OF THE U.S. DEFENSE INDUSTRIAL BASE
Barry D. Watts and Todd Harrison
2011

© 2011 Center for Strategic and Budgetary Assessments. All rights reserved.

About the Center for Strategic and Budgetary Assessments
The Center for Strategic and Budgetary Assessments (CSBA) is an independent, nonpartisan policy research institute established to promote innovative thinking and debate about national security strategy and investment options. CSBA’s goal is to enable policymakers to make informed decisions on matters of strategy, security policy and resource allocation.
CSBA provides timely, impartial and insightful analyses to senior decision mak-ers in the executive and legislative branches, as well as to the media and the broader national security community. CSBA encourages thoughtful participation in the de-velopment of national security strategy and policy, and in the allocation of scarce human and capital resources. CSBA’s analysis and outreach focus on key questions related to existing and emerging threats to U.S. national security. Meeting these challenges will require transforming the national security establishment, and we are devoted to helping achieve this end.

About the Authors
Prior to joining CSBA in 2002, Barry Watts headed the Office of Program Analysis and Evaluation at the Defense Department (2001–2002). Following retirement from the Air Force in 1986, Mr. Watts was with the Northrop Grumman Analysis Center, which he directed from 1997 to 2001. During his Air Force ca-reer, Mr. Watts flew a combat tour in Vietnam in F-4s, taught logic and philosophy at the US Air Force Academy, served two tours in the Office of Net Assessment, and headed the Red Team in the Air Staff’s Project Checkmate.
Mr. Watts has written on a wide variety of military topics, in-cluding CSBA monographs on the Revolution in Military Affairs (2011); Regaining Strategic Competence (2008 with Andrew Krepinevich); The Case for Long-Range Strike (2008); The Past and Future of the Defense Industrial Base (2008); US Combat Training, Operational Art, and Strategic Competence: Problems and Opportunities (2008); Six Decades of Guided Munitions and Battle Networks (2007); US Fighter Modernization (2007 with Steve Kosiak); Long-Range Strike: Imperatives, Urgency and Options (2005); and The Military Use of Space: A Diagnostic Assessment (2001).
He holds a Bachelor of Science in mathematics from the U.S. Air Force Academy and an Master of Arts in philosophy from the University of Pittsburgh.

Todd Harrison is the Senior Fellow for Defense Budget Studies at the Center for Strategic and Budgetary Assessments.
Mr. Harrison joined CSBA in 2009 from Booz Allen Hamilton, where he supported clients across the Department of Defense, assessing challenges to modernization initiatives and evaluating the performance of acquisition programs. He previously worked in the aerospace industry developing advanced space systems and technologies and served as a Captain in the U.S. Air Force Reserves. Mr. Harrison combines his budgetary, programmatic and engineering experience with a strong background in sys-tems analysis to lead the budget program for CSBA.
Since joining CSBA, Mr. Harrison has authored a number of publications, including The New Guns and Butter Debate, annu-al analysis of the FY 2010, FY 2011, and FY 2012 defense budget request, and Impact of the Wars in Iraq and Afghanistan on the US Military’s Plans, Programs, and Budgets. He is a graduate of the Massachusetts Institute of Technology with both a Bachelor of Science and Master of Science in Aeronautics and Astronautics.

Acknowledgments
The authors would like to thank the CSBA staff for their assistance with this report. Special thanks go to John Speed Meyers for his many contributions and research support; Charlotte Brock, Julie Lascar, and Eric Lindsey for their editorial and production sup-port; and Cutting Edge for their design. The analysis and find-ings presented here are solely the responsibility of the Center for Strategic and Budgetary Assessments and the authors.

conTenTs
vii executive summary
1 chapter 1. Introduction
3 chapter 2. Metrics and scope
5 chapter 3. The emergence of a Permanent Defense Industry
13 chapter 4. Differences beteen Defense Acquisition and a Free Market
19 chapter 5. efficiency Then and now
27 chapter 6. suggestions on Improving efficiency
37 chapter 7. DoD’s Approach To Managing the U.s. Defense Industry
41 chapter 8. Three Acquisition cases
51 chapter 9. sustaining the Vital sectors of the Defense Industrial Base
59 chapter 10. Industrial Mobilization and Attrition
65 Appendix 1. cost-per-Pound for Tactical Aircraft
67 Appendix 2. selected U.s. Force Levels versus U.s. Defense spending, 1986 to 2009
69 Appendix3.Table1withCosts/UnitinConstantFY2011Dollars
71 Appendix4.TheTopTwentyDefenseFirmsWorldwidein2008
75 Appendix5.Top-TierU.S.DefenseIndustryConsolidation,1993to2007
77 Appendix6.The1986DescriptionofDefenseAcquisitionbythePresident’sBlueRibbonCommissiononDefenseManagement
81 Appendix7.PerCapitaModernizationSpendingandProcurement/RDT&ERatios
FIgURES
6 Figure1.Ford’sWillowRunBomberPlantduringWorldWarII10 Figure2.U.S.MonthlyAverageMunitionsProductionbyQuarter,
July1,1940toJuly31,194520 Figure3.UnitCostTrendsinTacticalAircraftandTanks28 Figure4.DoD’sRequirements,Acquisition,andExecutionSystems60 Figure5.TheEmergenceofU.S.-SovietNuclearParity66 Figure6.Cost-per-PoundofSelectedFighterandAttackAircraft68 Figure7.SelectedU.S.ForceLevelsVersusU.S.DefenseSpending73 Figure8.ChineseJ-2075 Figure9.Top-TierU.S.DefenseIndustryConsolidation,1993to200781 Figure10.PerCapitaModernization,FY1948toFY201182 Figure11.Procurement/RDT&ERatios,FY1957toFY2016
TABLES
22 Table1.Cost-ChangeRatiosforTwenty2010MDAPs(NormalizedforInflationandQuantity)
24 Table2.Cost-ChangeRatiosforEighteen1950sAirForcePrograms38 Table3.TopAmericanPrimeDefenseContractorsin200970 Table4.CostChangeRatiosforTwenty2010MDAPS
(InConstantFY2011Dollars)
72 Table5.TheTopTwentyDefenseFirmsWorldwidein2008

ExECUTIvE SUmmARy
From 1812 to World War II, government arsenals produced almost all of the ord-nance for the U.S. Army and a good share of the ordnance and ships for the U.S. Navy. Once the December 1941 Japanese attack on Pearl Harbor had brought the United States into the conflict, however, it soon became apparent that gov-ernment arsenals could not meet the war’s demands for massive quantities of military equipment. To meet this demand, the bulk of U.S. weapons production shifted to private, for-profit companies.
Following World War II, the onset of the Cold War, American leaders’ determi-nation to create an international system centered on U.S. power, and the Korean War combined to create, for the first time in the nation’s history, a permanent defense industrial base. Today as in the 1950s, the U.S. defense industry is com-prised of for-profit companies that develop and produce the weapons used by the U.S. military Services and many allied nations. Despite this system’s recurring problems containing costs and delivering weapons on schedule, it is difficult to disagree with Norman Augustine’s judgment that the modern U.S. defense indus-try helped to win the Cold War and has produced weapons that are the envy of the world’s military forces. Looking to the future, there is every reason to think that the United States’ defense industrial base will continue to be a source of strategic advantage in the decades ahead—if it is adequately maintained.
This monograph focuses on two main questions concerning what is most ac-curately described as the “military-industrial-Congressional” complex. First, does it function like a normal free market in which the forces of supply and de-mand—Adam Smith’s invisible hand—can be relied upon to allocate resources efficiently, encourage innovation, and exhibit the kind of price sensitivity evident in commercial markets such as consumer electronics? Second, what has been the Department of Defense’s approach to sustaining a strong, technologically vibrant and financially successful domestic defense industry?

x center for strategic and Budgetary Assessments
The short answer to the first question is that the U.S. defense industry is a highly regulated sector of the U.S. economy in which the government is both the sole customer—even if it speaks with many discordant voices—and the regula-tor. Fundamental decisions about what weapons to develop, the relative priority to be given to cost, schedule and performance, and the funding to be allocated annually to various weapons programs are the result of complex, often politi-calized, interactions between the military Services and their war-fighting com-munities, the Joint Chiefs of Staff, the Office of the Secretary of Defense, the White House, and Congress. It is, therefore, a serious misunderstanding of the realities of weapons acquisition in the United States to think that the U.S. de-fense industry operates like a normal free market. A classic free market involves many small buyers and many small suppliers, and competition among buyers and suppliers drives prices toward stable, economically efficient equilibrium levels. None of these features resemble the way in which the U.S. defense industrial base functions. Consequently, incremental regulatory and statutory adjustments to defense acquisition based on the presumption that the defense industry operates like a normal free market are not only unlikely to improve efficiency, but have often made things worse.
These conclusions are not new. In a seminal 1962 economic analysis of the weapons acquisition process, Merton Peck and Frederic Scherer reached similar conclusions. In their view, one of the foremost reasons for the non-market struc-ture of the defense industrial base was the much greater uncertainty confronting weapon acquisitions compared to commercial product developments in the rest of the U.S. economy. Indeed, they went a step further, arguing against the very possibility of defense acquisition functioning like a free market. Almost two de-cades later, Jacques Gansler’s 1980 analysis of the defense industry portrayed the continuing belief that the industry functions like a free market as a myth, adding that it was one widely perpetuated by the Defense Department, Congress, and the defense industry itself. Nevertheless, as evidenced by current senior officials in the Defense Department and recent Congressional legislation, this myth contin-ues to be widely accepted in both the Pentagon and Congress.
Much of the reason for the persistence of belief in the free-market character of the military-industrial-Congressional complex stems from the understandable frustration over the continuing inability of the requirements, acquisition and budget execution systems to control cost and schedule. The B-2 bomber, of which only twenty-one were eventually procured, ended up with a unit cost over $2 billion. Currently, unit acquisition cost growth in the F-35 Joint Strike Fighter program is over 50 percent (using constant dollars), the schedule has slipped considerably for all three variants, and the end of these problems is not yet in sight. Such examples inevitably lend credence to the impression that cost over-runs, schedule slippage and performance shortfalls in major defense acquisition programs are growing steadily worse.
Sustaining Critical Sectors of the U.S. Defense Industrial Base xi
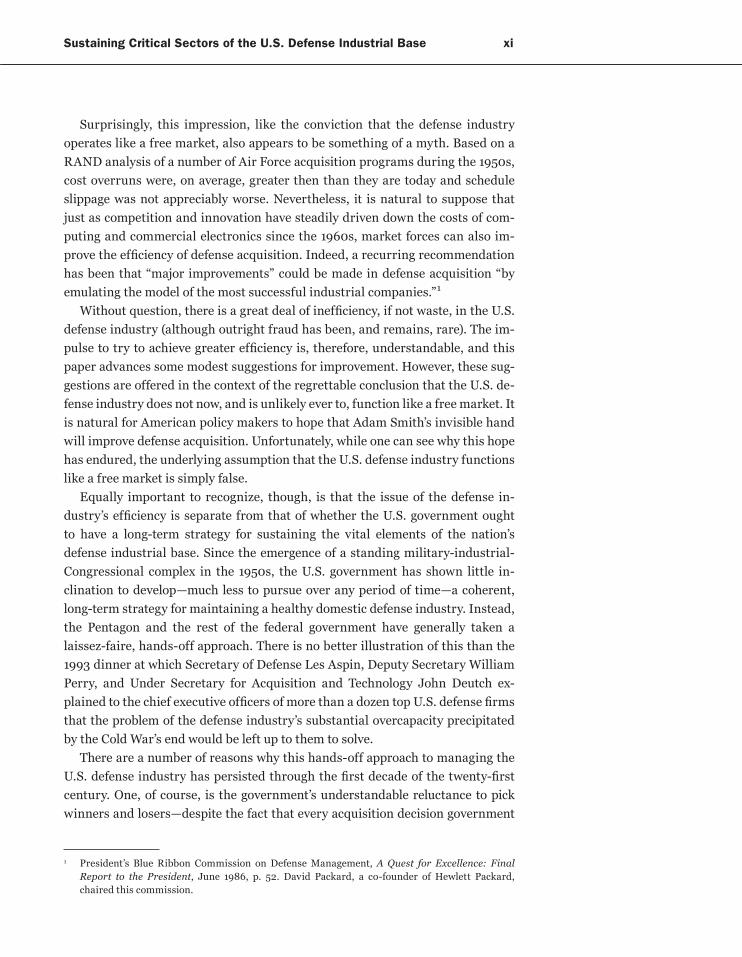
Surprisingly, this impression, like the conviction that the defense industry operates like a free market, also appears to be something of a myth. Based on a RAND analysis of a number of Air Force acquisition programs during the 1950s, cost overruns were, on average, greater then than they are today and schedule slippage was not appreciably worse. Nevertheless, it is natural to suppose that just as competition and innovation have steadily driven down the costs of com-puting and commercial electronics since the 1960s, market forces can also im-prove the efficiency of defense acquisition. Indeed, a recurring recommendation has been that “major improvements” could be made in defense acquisition “by emulating the model of the most successful industrial companies.”1
Without question, there is a great deal of inefficiency, if not waste, in the U.S. defense industry (although outright fraud has been, and remains, rare). The im-pulse to try to achieve greater efficiency is, therefore, understandable, and this paper advances some modest suggestions for improvement. However, these sug-gestions are offered in the context of the regrettable conclusion that the U.S. de-fense industry does not now, and is unlikely ever to, function like a free market. It is natural for American policy makers to hope that Adam Smith’s invisible hand will improve defense acquisition. Unfortunately, while one can see why this hope has endured, the underlying assumption that the U.S. defense industry functions like a free market is simply false.
Equally important to recognize, though, is that the issue of the defense in-dustry’s efficiency is separate from that of whether the U.S. government ought to have a long-term strategy for sustaining the vital elements of the nation’s defense industrial base. Since the emergence of a standing military-industrial-Congressional complex in the 1950s, the U.S. government has shown little in-clination to develop—much less to pursue over any period of time—a coherent, long-term strategy for maintaining a healthy domestic defense industry. Instead, the Pentagon and the rest of the federal government have generally taken a laissez-faire, hands-off approach. There is no better illustration of this than the 1993 dinner at which Secretary of Defense Les Aspin, Deputy Secretary William Perry, and Under Secretary for Acquisition and Technology John Deutch ex-plained to the chief executive officers of more than a dozen top U.S. defense firms that the problem of the defense industry’s substantial overcapacity precipitated by the Cold War’s end would be left up to them to solve.
There are a number of reasons why this hands-off approach to managing the U.S. defense industry has persisted through the first decade of the twenty-first century. One, of course, is the government’s understandable reluctance to pick winners and losers—despite the fact that every acquisition decision government
1 President’s Blue Ribbon Commission on Defense Management, A Quest for Excellence: Final Report to the President, June 1986, p. 52. David Packard, a co-founder of Hewlett Packard, chaired this commission.
xii center for strategic and Budgetary Assessments
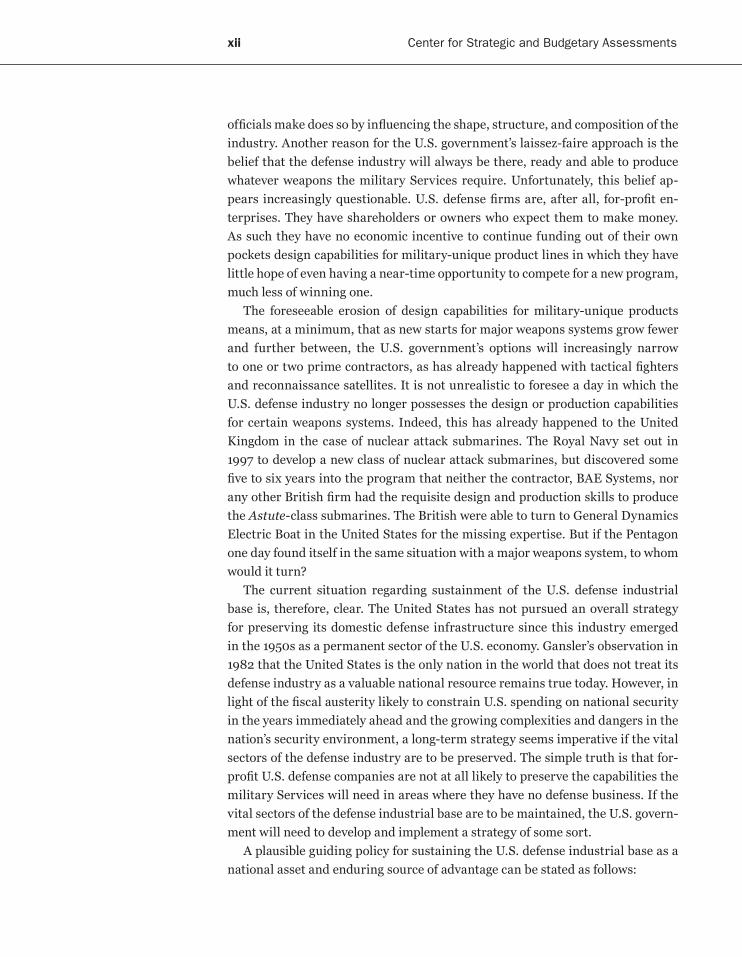
officials make does so by influencing the shape, structure, and composition of the industry. Another reason for the U.S. government’s laissez-faire approach is the belief that the defense industry will always be there, ready and able to produce whatever weapons the military Services require. Unfortunately, this belief ap-pears increasingly questionable. U.S. defense firms are, after all, for-profit en-terprises. They have shareholders or owners who expect them to make money. As such they have no economic incentive to continue funding out of their own pockets design capabilities for military-unique product lines in which they have little hope of even having a near-time opportunity to compete for a new program, much less of winning one.
The foreseeable erosion of design capabilities for military-unique products means, at a minimum, that as new starts for major weapons systems grow fewer and further between, the U.S. government’s options will increasingly narrow to one or two prime contractors, as has already happened with tactical fighters and reconnaissance satellites. It is not unrealistic to foresee a day in which the U.S. defense industry no longer possesses the design or production capabilities for certain weapons systems. Indeed, this has already happened to the United Kingdom in the case of nuclear attack submarines. The Royal Navy set out in 1997 to develop a new class of nuclear attack submarines, but discovered some five to six years into the program that neither the contractor, BAE Systems, nor any other British firm had the requisite design and production skills to produce the Astute-class submarines. The British were able to turn to General Dynamics Electric Boat in the United States for the missing expertise. But if the Pentagon one day found itself in the same situation with a major weapons system, to whom would it turn?
The current situation regarding sustainment of the U.S. defense industrial base is, therefore, clear. The United States has not pursued an overall strategy for preserving its domestic defense infrastructure since this industry emerged in the 1950s as a permanent sector of the U.S. economy. Gansler’s observation in 1982 that the United States is the only nation in the world that does not treat its defense industry as a valuable national resource remains true today. However, in light of the fiscal austerity likely to constrain U.S. spending on national security in the years immediately ahead and the growing complexities and dangers in the nation’s security environment, a long-term strategy seems imperative if the vital sectors of the defense industry are to be preserved. The simple truth is that for-profit U.S. defense companies are not at all likely to preserve the capabilities the military Services will need in areas where they have no defense business. If the vital sectors of the defense industrial base are to be maintained, the U.S. govern-ment will need to develop and implement a strategy of some sort.
A plausible guiding policy for sustaining the U.S. defense industrial base as a national asset and enduring source of advantage can be stated as follows:

Sustaining Critical Sectors of the U.S. Defense Industrial Base xiii
The United States’ defense industrial base strategy should ensure the preserva-tion of those few sectors that are currently critical to American national security, adding over time any emerging sectors that become critical, and ruthlessly under-funding or jettisoning any sectors that cease to be critical.
In other words, the overarching policy would be the adaptive sustainment of those elements of the defense industrial base that are truly important to retain.
The foremost point to be made about this broad policy is that of the perhaps two or three dozen sectors into which the defense industrial base can be logi-cally segmented, the number of strategically critical sectors cannot exceed five to seven. Good strategy is always about choice—in this case favoring the genuinely vital sectors of the defense industry while, more importantly, neglecting or ig-noring the rest. An industrial-base “strategy” that seeks to preserve every sector deemed desirable by any of the war-fighting communities across the four military Services, the prime defense contractors, or their Congressional allies is not in fact a strategy and will not succeed. Indeed, even within the truly critical sectors, not every design or production capability will merit preservation. The sine qua non of the proposed guiding policy, then, is the imperative to make hard choices. Which five (or six, or seven) sectors of the U.S. defense industrial base are truly critical to national security, and which elements within those sectors are themselves im-portant enough to justify preservation? This is the essential question that must be answered to underpin the development and implementation of a coherent, long-term strategy to preserve the vital core of the U.S. defense industry.
Reaching consensus on a meaningful answer to this question is a formida-ble challenge even within the Department of Defense, much less between the Pentagon and Congress. But even if consensus were to be achieved, there would remain other strategic questions about the defense industrial base. Once the Soviet Union achieved rough strategic-nuclear parity with the United States around 1970, the need to continue paying for surge or mobilization capacity that would be lost in a nuclear exchange came to been seen as an avoidable drain on defense resources. This perception was reinforced by the extremely modest attrition that U.S. forces experienced in the 1991 Persian Gulf War and subse-quent episodes of high-intensity combat operations (Afghanistan in 2001–2002 and Iraq in 2003). One further question, then, is whether surge or mobilization might be needed against an opponent with the size, strategic depth, and stay-ing power of China. Whatever the answer, the U.S. defense budget is entering another period of austerity, reinforced by the global financial crisis and the un-checked growth of U.S. government debt. While there may be little agreement on how much modernization funding (research and development plus procurement) the Pentagon will need annually to sustain its domestic industrial base, no strat-egy for preserving the American defense industry is likely to succeed unless it is adequately funded.


“We must be the great arsenal of democracy.”
— Franklin D. Roosevelt, December 29, 19402
“The U.S. defense industry helped to win the Cold War.”
— Norman Augstine, 19973
“The fundamental starting point is the understanding that we in DOD do not make our weapons systems. They come from our defense industry. And these weapons systems are, second only to our superb men and women in uniform, what makes our military power unrivaled and what provides the buttress of national and interna-tional securtity. A strong, technologically vibrant and financially successful defense industry is therefore in the national interest.”
— Ashton Carter, February 9, 20114
What is the fundamental economic character of the permanent defense indus-try that emerged in the United States during the 1950s? What was it about this industry that provoked President Dwight Eisenhower, in his January 1961 fare-well address, to warn against the acquisition of unwarranted influence by the
2 Franklin Delano Roosevelt, fireside radio chat on national security, delivered December 29, 1940, at http://www.americanrhetoric.com/speeches/fdrarsenalofdemocracy.html, accessed February 8, 2011. This website includes an audio mp3 of Roosevelt’s speech. The phrase “arsenal of democ-racy” originated with the American playwright Robert Sherwood and was suggested to Roosevelt by Harry Hopkins.
3 Norman R. Augustine, “Reshaping an Industry: Lockheed Martin’s Survival Story,” Harvard Business Review, May–June 1997, p. 83.
4 Ashton B. Carter, “The Defense Industry Enters a New Era,” prepared remarks at the Cowen Investment Conference, New York, NY, February 9, 2011, p. 2.
cHAPTeR 1 > INTRODUCTION

2 center for strategic and Budgetary Assessments
military-industrial complex?5 Does the government-industry weapons acquisi-tion process function anything remotely like a classic free market? How efficient or inefficient has defense acquisition been over time, and how do the complex relations between the Office of the Secretary of Defense (OSD) in the Department of Defense (DoD), the military Services, Congress, and private weapons contrac-tors affect metrics such as cost and schedule? Since the 1950s, has the U.S. gov-ernment ever attempted any systematic, long-term management of the country’s defense industrial base as a source of long-term strategic advantage and, if not, what hard choices would be required to develop and implement a strategy aimed at sustaining the defense industry’s critical capabilities?
These are the questions that this paper addresses. They highlight the first-order issues that must be confronted if one is to think productively about what is most accurately labeled the “military-industrial-Congressional complex.”6
Nevertheless, these issues—especially the non-market structure of the U.S. de-fense industry—are also widely ignored in public and policy debates over the per-ceived inefficiency, waste, and corruption of the U.S. weapons acquisition process.
5 Dwight Eisenhower, “Farewell Radio and Television Address to the American People,” January 17, 1961, at http://www.eisenhower.archives.gov/all_about_ike/Speeches/Farewell_Address.pdf, accessed January 24, 2011. In 1959, Eisenhower had decried what he termed a “munitions lobby” in response to full-page ads for competing products by defense firms. Merton J. Peck and Frederic M. Scherer, The Weapons Acquisition Process: An Economic Analysis (Boston, MA: Harvard University, 1962), p. 242.
6 Eisenhower’s farewell address used the term “military-industrial complex.” However, in 1993 then Brigadier General Andrew J. Goodpaster, who served as staff secretary and defense liaison officer to Eisenhower from 1954 to 1961, told Davis that the president had elected to strike the word “Congressional” just minutes before he spoke (Thomas J. Davis, “The Military Industrial Congressional Complex,” email to Barry Watts, February 25, 2011).

What basic measures or metrics should be used to assess such core concerns as the relative efficiency of weapons acquisition and the U.S. defense industrial base? In 1959, two RAND analysts advanced four criteria for judging the success of military acquisition programs:
1. Costs (development and production);
2. Time of Availability (initial operational availability);
3. System Performance (in the sense of all the qualities that contribute to the effectiveness of a military system within its intended domain); and
4. Utility (the broader military value of the weapon system over and above whether it meets its specific performance goals).7
The first three criteria are relatively quantifiable. The Defense Department regularly publishes Selected Acquisition Reports (SARs) that have baseline and current costs for major defense acquisition programs (MDAPs).8 In the case of a troubled program such as the F-35 Joint Strike Fighter (JSF), the draft SAR published in March 2010 contains extensive cost data, descriptions of unclassi-fied performance objectives, and the schedule of projected annual procurement
7 A. W. Marshall and W. H. Meckling, “Predictability of the Costs, Time, and Success of Development,” RAND P-1821, revised December 11, 1959, p. 4.
8 SARs from June 2010 back to 1973 can be accessed at http://www.acq.osd.mil/ara/am/sar/. Currently an MDAP is a program designated as such by the Under Secretary of Defense for Acquisition, Technology, and Logistics (USD(AT&L)), or estimated by the USD(AT&L) to require an eventual total expenditure for Research, Development, Test and Evaluation (RDT&E) of more than $365 million in Fiscal Year (FY) 2000 constant dollars or, for procurement, of more than $2.19 billion in FY 2000 constant dollars.
cHAPTeR 2 > mETRICS AND SCOpE

4 center for strategic and Budgetary Assessments
quantities through 2035.9 The fourth criterion, overall utility, is more qualitative. A weapon system could completely meet or exceed its detailed performance goals when fielded but still be obsolesced by external developments. The rapid emer-gence during the 1950s of thermonuclear warheads small and light enough to be delivered over intercontinental distances by ballistic missiles led to the early retirement of air-breathing nuclear cruise missiles such as the Navy’s SSM-N-8 Regulus and the Air Force’s SM-62 Snark.10 Soviet intercontinental ballistic mis-siles (ICBMs) also eroded the utility of the F-102 and F-106 interceptors for de-fending the United States against a Soviet nuclear attack irrespective of their ability to intercept Long-Range Aviation’s nuclear bombers.
By and large, the U.S. government “customer” has generally emphasized per-formance or schedule—and sometimes both—over cost. The Corona program to develop a reconnaissance satellite provided dramatically better strategic recon-naissance deep inside the Soviet Union than manned aircraft could, and became extremely urgent after Francis Gary Power’s U-2 was shot down by S-75 Dvina surface-to-air missiles near Degtyarsk on May 1, 1960. Similarly, during the 1950s the perceived imperative to keep up with the Soviets in strategic-nuclear forces gave overriding urgency to early U.S. ICBM programs such as Atlas and Titan.11 In most cases, though, U.S. acquisition programs have given first priority to performance with cost in third place. The B-2 and F-22 illustrate programs in which performance was accorded first priority, schedule second, and cost third.
The Defense Department procures many things besides advanced weapon systems. However, everyday items such as jet fuel, office computer equipment, and food for military dining facilities are rarely the focus of acquisition debates. Thus, like Merton Peck and Frederic Scherer’s classic 1962 economic analysis of the U.S. weapons acquisition process, this paper concentrates on the “conception, development, and production of technically advanced weapons” for the ultimate use of the U.S. military and its close allies.12
9 Defense Acquisition Management Information Retrieval (DAMIR), “Selected Acquisition Report (DRAFT SAR): F-35, As of December 31, 2009,” RCS DD-AT&L(Q&A)823-198, March 26, 2010, pp. 10–12, 14–16, 26–27. The earliest DAMIR document on the JSF program is dated 1996.
10 Marshall and Meckling, “Predictability of the Costs, Time, and Success of Development,” p. 5.11 In 1955 President Eisenhower designed the U.S. ICBM project “a research and development
program of the highest priority above all others”—Neil Sheehan, A Fiery Peace in a Cold War: Bernard Schriever and the Ultimate Weapon (New York: Random House, 2009), p. 299.
12 Peck and Scherer, The Weapons Acquisition Process, p. 3. With the exception of Chapter 9’s attempt to model cost, time, and quality relationships in the absence of technical and bureau-cratic uncertainties, this massive study by the research division of Harvard’s Graduate School of Business Administration remains worthy of study even today.

From the War of 1812 until World War II, government arsenals produced almost all of the ordnance for the U.S. Army and a good share of the ordnance and ships for the U.S. Navy.13 However, the arsenals and shipyards the government main-tained in peacetime usually lacked the capacity to meet the increased demands of wartime. Under the arsenal system, private firms generally took up the slack during conflicts such as the American Civil War and then downsized or returned to commercial business after the fighting ceased. This “feast-or-famine” pattern persisted until World War II.
From 1942 to 1945, the “bulk” of U.S. weapons production “in all fields shift-ed to private firms.”14 Roosevelt’s “Arsenal of Democracy” was largely built on the United States’ existing industrial base. The wartime distribution of defense contracts “more or less followed the existing pattern of manufacturing and the major industrial states—Michigan, Pennsylvania, Ohio, and Indiana—ranked high in prime contract awards.”15 Wartime aircraft production illustrates both the shift to private firms and the role played by automobile manufacturers. After the Japanese attack on Pearl Harbor brought the United States into the war, the rapid growth of demand for aircraft exceeded the American aircraft indus-try’s production capacity. In 1940, the United States produced less than 2,900 bombers and fighters; in 1944, the total was nearly 74,000 (35,003 bombers and 38,873 fighters).16 As a result, automobile companies—primarily Ford, General Motors, and Fisher Body—filled the capacity gap by building or converting plants
13 Peck and Scherer, The Weapons Acquisition Process, p. 98. 14 Peck and Scherer, The Weapons Acquisition Process, p. 99. 15 Peck and Scherer, The Weapons Acquisition Process, p. 112. 16 Alan L. Gropman, Mobilizing U.S. Industry in World War II (Washington, DC: National Defense
University, August 1996), McNair Paper 50, p. 96. From 1940 through 1945, the United States produced 98,431 bombers and 100,708 fighters (ibid.).
cHAPTeR 3 > THE EmERGENCE OF A pERmANENT DEFENSE INDUSTRy

6 center for strategic and Budgetary Assessments
to produce entire planes, major aircraft subassemblies, tanks, anti-aircraft guns, etc.17 In the case of heavy bombers, the 3.5-million-square-foot plant Ford built at Willow Run, Michigan, produced 8,685 of the 18,482 B-24s built during World War II.18 After the war, however, the automobile companies largely exited the defense business.
The emergence, for the first time in U.S. history, of a standing U.S. defense industry that existed in peacetime as well as wartime resulted from a confluence of factors. One, of course, was the shift from arsenals to private firms and univer-sities that occurred during World War II. Developments such as radar, proximity fuses, electronic computers, and the atomic bomb were beyond the capabilities of government arsenals. As Irving Stewart, Vannevar Bush’s deputy director at the wartime Office of Scientific Research and Development (OSRD), wrote in 1948:
Previous efforts to bring civilian science into the program of weapon development were based on the theory that the Services would know what they needed and would ask the scientists to aid in its development. Modern science has progressed to the point where the military chieftains were not sufficiently acquainted with its
17 Peck and Scherer, The Weapons Acquisition Process, p. 191. General Motors’ Eastern Aircraft Division produced FM Wildcats (F4Fs) and TBM Avengers (TBF Avengers). By August 1945, Fisher Body had delivered, among other wartime products, 21,000 tanks, major subassemblies for some 10,000 B-25s and B-29s, 422,000 aircraft instruments, 3,400 anti-aircraft guns, 550,000 shells, and thousands of diesel crankcases for submarines.
18 Jenny Nolan, “Willow Run and the Arsenal of Democracy,” The Detroit News, January 28, 1997, at http://apps.detnews.com/apps/history/index.php?id=73, accessed February 7, 2011.
FIGURE 1 . FORD’S WILLOW RUN BOmBER pLANT DURING WORLD WAR I I
source: U.s. Army signal corps

Sustaining Critical Sectors of the U.S. Defense Industrial Base 7
possibilities to know for what they might ask with a reasonable expectation that it could be developed. The times called for a reversal of the situation, namely letting men who knew the latest advances in science become more familiar with the needs of the military in order that they might tell the military what was possible in sci-ence so that together they might assess what should be done. It was this conception which Bush and his colleagues sold to President Roosevelt and to which General Marshall and Admiral Stark gave their blessing …19
The atomic bomb readily illustrates Stewart’s point. “World War II,” Vannevar Bush later observed, “was the first war in human history to be affected decisively by weapons unknown at the outbreak of hostilities.”20
These lessons, which argued powerfully against returning to an arsenal sys-tem, were further reinforced by episodes such as the dismal performance of the Newport Torpedo Station’s Mark-14 torpedo. The Newport facility developed the Mark-14 during the 1930s, and the Mark-14 was the principal torpedo used by U.S. submarines during World War II. However, early in the war operational ex-perience in the Pacific began to reveal major deficiencies in the weapon. Tests conducted by operational submarines based in Australia in mid-1942 confirmed what many submarine skippers had begun to suspect: the Mark-14 ran an aver-age of 11 feet deeper than its set depth.21 By April 1943, further tests and combat experience revealed that the Mark-14’s magnetic-influence exploder was defective and, by mid-1943, it became clear that the Mark-14’s contact exploder was also prone to failure when the impact angle approached 90 degrees, a perfect shot.22 Due to an unfortunate confluence of personalities and bureaucratic inertia, it took twenty-one months to isolate and correct all of the Mark-14’s defects—less time than it took the OSRD to develop and field the first acoustic homing torpedo, the Mark-24, from scratch.23 Part of the reason it took so long to correct the Mark-14’s defects was that each problem masked the remaining ones. Nevertheless, long
19 Irvin Stewart, Organizing Scientific Research for War: The Administrative History (Boston, MA: Little, Brown, 1948), p. 6. OSRD was created formally by Executive Order 8807 on June 28, 1941. It largely superseded the earlier National Research Defense Committee, which had been established under Vannevar Bush in July 1940 “to coordinate, supervise, and conduct scientific research on the problems underlying the development, production, and use of mechanisms and devices of warfare” in the United States. OSRD was given almost unlimited access to funding and resources, and Bush reported only to President Roosevelt. It was discontinued in December 1947.
20 Vannevar Bush in Stewart, Organizing Scientific Research for War, p. ix. 21 Clay Blair, Jr., Silent Victory: The U.S. Submarine War against Japan (New York: Bantam Books,
1975), pp. 160, 274–278, 292; also, Frederick J. Milford, “U.S. Navy Torpedoes,” Pt. 2, “The Great Torpedo Scandal, 1941–43,” The Submarine Review, October 1996, pp. 83–87.
22 Blair, Silent Victory, pp. 412–415, 437–438; also, Milford, Pt. 2, “The Great Torpedo Scandal, 1941–43,” pp. 87–90.
23 Blair, Silent Victory, pp. 20, 140–141, 206, 216, 225–227, 280–281, 348, 367, 401–404, 413–415. Bell Lab designed the Mark-24 and Western Electric produced it. The development began in December 1941 and the torpedo was deployed operationally in March 1943 (A. C. Dickieson, “Early ‘Smart Bombs’ at Bell Labs,” reprinted from Vintage Electrics, Vol. 3, No. 1, at http://www.smecc.org/early_’smart_bombs’_at_bell_labs.htm, accessed February 8, 2011).
8 center for strategic and Budgetary Assessments
after operational units began experiencing problems with the weapon on combat patrols, the Navy’s Newport Torpedo Station resisted realistic testing.24 “The scan-dal was not that there were problems in what was then a relatively new weapon, but rather the refusal by the ordnance establishment [ashore] to verify the prob-lems quickly and make appropriate alterations.”25 As Clay Blair documented in 1975, each of the Mark-14’s major defects was largely “discovered and fixed in the field—always over the stubborn opposition of the [Navy’s] Bureau of Ordnance.”26
While the Mark-14 torpedo scandal was small potatoes compared to decid-ing whether an operational atomic bomb could be fielded, both issues reflected the growing intrusion of science into the weapon acquisition process during the Second World War. A striking feature of American wartime experience “was the extent to which scientists, temporarily in government service, acted as the promoters for new weapons, made the important development decisions, and participated in their administration.”27 The success of operations research in ap-plying mathematics and scientific methods to military problems led the newly independent U.S. Air Force to establish the nation’s first “think tank,” the RAND Corporation, in 1948.28 Over the next decade, virtually all the “basic ideas and philosophies about nuclear weapons and their use” were generated by RAND’s civilian strategists.29 Thus, the wartime collaboration between the military, in-dustry, and scientists not only continued after 1945 but also reinforced the shift from arsenals to private defense firms. By 1958, arsenals carrying out activities comparable to those of private defense contractors were estimated to account for less than 10 percent of the resources devoted to new weaponry.30
Three main externalities encouraged the development of a permanent defense industrial base centered on for-profit defense companies. First and foremost was the onset of the Cold War, whose central feature was the U.S.-Soviet competition in nuclear arms. A second catalyst was the determination of U.S. post-war lead-ers—including President Harry Truman, George Kennan, Dean Acheson, George Marshall and Paul Nitze—to “create an international system with American
24 Milford, Pt. 2, “The Great Torpedo Scandal, 1941–43,” p. 82.25 Milford, Pt. 2, “The Great Torpedo Scandal, 1941–43,” p. 83.26 Blair, Silent Victory, p. 439; Milford, Pt. 2, “The Great Torpedo Scandal, 1941–43,” p. 92. 27 Peck and Scherer, The Weapons Acquisition Process, p. 177.28 General H. H. “Hap” Arnold, who commanded the Army Air Forces during World War II, directed
the creation of Project RAND, which later became the RAND Corporation. His reasons were best captured in a postwar report he wrote to Henry Stimson: “During this war the Army, Army Air Forces, and the Navy have made unprecedented use of scientific and industrial resources. The conclusion is inescapable that we have not yet established the balance necessary to insure the con-tinuance of teamwork among the military, other government agencies, industry, and the universi-ties. Scientific planning must be years in advance of the actual research and development work.” (“The Origins of RAND,” at http://www.rand.org/about/history.html, accessed March 9, 2011).
29 Bernard Brodie, “The Development of Nuclear Strategy,” International Security, Spring 1978, p. 67. 30 Peck and Scherer, The Weapons Acquisition Process, p. 98.

Sustaining Critical Sectors of the U.S. Defense Industrial Base 9
power at its center” in order to minimize the possibility of major power conflicts as destructive as the two world wars had been.31 And, third, the North Korean dictator Kim Il-sung’s invasion of South Korea in June 1950 precipitated a rapid increase in military spending.
There were, of course, other factors that served to foster both the creation of a permanent defense industrial base and the eclipse of government arsenals. One was the “rise of missiles and electronics and the decline of ordnance, ships, and, to a more limited extent, aircraft”; these developments constituted a dramatic change in the weapons business, and witnessed the migration of defense produc-tion from the pre-World War II industrial states to California, Texas, Washington and rejuvenated defense firms in the New England states.32 California, for ex-ample, went from 8.7 percent of defense contracts in 1945 to 24 percent in 1959–1960.33 The other important post-World War II trend was the declining role of large-quantity production.34 During World War II the United States produced nearly 35,000 heavy bombers (12,731 B-17s, 18,482 B-24s, and 3,970 B-29s). Subsequently, the Air Force procured 2,032 B-47s during the early 1950s, 744 B-52s during the late 1950s and early 1960s, 100 B-1Bs during the 1980s, and 21 B-2s during 1994–2000.35 This decline in production quantities went hand in hand with an increasing emphasis on advanced-technology weaponry, quality, and state-of-the-art performance.
There was, then, a confluence of trends and forces that reshaped the composi-tion and structure of defense acquisition in the United States after World War II. The shift from arsenals to private defense contractors has proved permanent. Quality has become ascendant over quantity, and a peacetime defense industry has become a permanent feature of the U.S. economy, continuing even after the collapse of the Soviet Union.
Largely forgotten in current discussions of the U.S. defense industry is the is-sue of mobilization for protracted conflict. President Roosevelt’s pre-1942 efforts to mobilize the U.S. economy were resisted by Congress and uncoordinated. As a result, one of the lessons that the U.S. government drew from World War II was the need for a permanent, rationalized mobilization apparatus. Toward this end, in December 1950 President Harry Truman established the Office of Defense
31 Robert Kagan, “The Price of Power,” The Weekly Standard, January 24, 2011, at http://www.weeklystandard.com/articles/price-power_533696.html?nopager=1, accessed February 8, 2011.
32 Peck and Scherer, The Weapons Acquisition Process, pp. 110, 112. For insight into firms such as Hughes and TRW that were at the forefront of the growth in defense electronics and missiles in the Los Angeles basin, see Thomas C. Reed, At the Abyss: An Insider’s History of the Cold War (New York: Ballantine, 2004), pp. 61–68, 125.
33 Peck and Scherer, The Weapons Acquisition Process, p. 111. 34 Peck and Scherer, The Weapons Acquisition Process, p. 161. 35 The same trend toward smaller and smaller quantities are evident in fighter aircraft, surface naval
combatants, nuclear submarines and other major weapon systems.
Quality has become
ascendant over
quantity, and a
peacetime defense
industry has become
a permanent feature
of the U.S. economy,
continuing even
after the collapse of
the Soviet Union.

10 center for strategic and Budgetary Assessments
Mobilization or ODM (which became the Office of Civil and Defense Mobilization in 1958). Truman appointed General Electric’s president Charles E. Wilson as ODM’s first director.36 In this position Wilson was a member of the Executive Office of the President, and the nineteen mobilization agencies eventually created within ODM had the authority to control every aspect of the U.S. economy. During the Korean conflict Wilson became so powerful that he was referred to as “co-president.” After the ceasefire in Korea, though, ODM’s role in the U.S. economy became less intrusive. Most of ODM’s production, wage and price controls were relaxed by the fall of 1953. While ODM was initially powerful under Wilson, the organization eventually fell victim to the nuclear competition between the United States and Soviet Union. As the Soviets began to field intercontinental missiles
36 After leaving ODM, Wilson served as Eisenhower’s defense secretary from 1953 to 1957.
FIGURE 2. U.S. mONTHLy AvERAGE mUNITIONS pRODUCTION By QUARTER, JULy 1 , 1940 TO JULy 31 , 1945
Aircraft
Guns and Fire Control
Ammunition
Combat and Motor Vehicles
Communication and Electronic Equipment
Other Equipmentand Supplies
Ships
Bill
ions
of S
tand
ard
Mun
ition
s D
olla
rs
Aircraft23.9%
Guns and Fire Control
5.8%
Ammunition10.6%
Combat and Motor Vehicles
11.6%
6
4
2
03Q 4Q 1Q 2Q 3Q 4Q 1Q 2Q 3Q 4Q 1Q 2Q 3Q 4Q 1Q 2Q 3Q 4Q 1Q 2Q
1940 1941 1942 1943 1944 1945
Comm. and Elect. Equip.
5.7%
Other Equipmentand Supplies
20.5%
Ships21.9%
source: Wartime Production Achievements and the Reconversion Outlook (Washington, Dc: War Production Board, 1945), p. 105”

Sustaining Critical Sectors of the U.S. Defense Industrial Base 11
able to deliver megaton-class thermonuclear warheads throughout the United States, interest in traditional defense mobilization faded in the belief that after a nuclear exchange there would be little industrial capacity left to mobilize. ODM was consolidated into the Federal Civil Defense Administration in 1958, and in July 1961 the Office of Civil and Defense Mobilization ceased to exist. Thus, the 1950s not only witnessed the emergence of a standing defense industrial base but a gradual decline in attention to industrial mobilization.


In 1980, Jacques Gansler portrayed the widespread presumption that market forces—Adam Smith’s invisible hand37—could be relied upon to produce eco-nomic efficiency and strategic responsiveness in the U.S. defense industry as a dangerous myth. Early in The Defense Industry, he highlighted some thirty ways in which the structure of defense acquisition in the United States diverged from a free market involving many small buyers and sellers, with buyer choices be-ing based on price and prices being set by the efficient interplay of supply and demand.38 By contrast, the combination of a single buyer (the U.S. government), a few very large prime contractors in each segment of the industry, and a small number of extremely expensive weapons programs constituted a structure for doing business that was altogether different from a classic free market.39
In considering the conduct and performance of the defense industry it is critically important that one recognize the great degree of regulation present, in spite of the fact that defense is not normally listed as a regulated industry. This regulation is unique in kind, in that the regulator is also the buyer. With so much involvement on the part of the buyer in the operation of the supplier, there can be no free market at work. Yet the Department of Defense, the defense industry, and Congress continue to perpetuate the myth that a free market is in operation, and count on the invisible hand of this market to produce economic efficiency.40
37 Adam Smith first used the term “invisible hand” to suggest that market forces lead the rich to contribute to the wealth of all by pursuing their own narrow self interests in his 1759 The Theory of Moral Sentiments—Adam Smith, D. D. Raphael and A. L. Macfie (eds.) The Theory of Moral Sentiments (Indianapolis, IN: Liberty Fund, 1984), Part IV, Chapter I, pp. 184–185. Smith again invoked the invisible hand to make the same point in his 1776 The Wealth of Nations (see Book 4, Chapter II).
38 Jacques S. Gansler, The Defense Industry (Cambridge, MA, & London: MIT Press, 1980), pp. 30–31.39 Gansler, The Defense Industry, p. 69. 40 Gansler, The Defense Industry, p. 92.
cHAPTeR 4 > DIFFERENCES BETEEN DEFENSE ACQUISITION AND A FREE mARkET

14 center for strategic and Budgetary Assessments
The dominant characteristic of the U.S. defense industry was, therefore, “the lack of competition for most of the dollars involved.”41 True, prior to source selection, there was fierce rivalry between prime contractors to win the initial development contracts for new weapon systems. But once source selection had been made,
the remainder of the program—product development, which may last over ten years, and then long-term production and product support—is normally conducted in a sole-source environment, where the contractor is essentially in a monopoly position and the government is dependent upon that producer for military equipment that it badly wants and for which it will usually pay whatever is asked.42
Gansler therefore concluded that “well over 90 percent of the defense contract dollars were not awarded on the basis of price competition or in the presence of any incentives that would drive down costs.”43 Furthermore, he observed, most government policies, DoD acquisition regulations, and Congressional statutes aimed at improving acquisition were predicated on the presumption that it is a free market and, as a result, “have not had the desired effects.”44 Recurring acquisition reform efforts had either maintained the non-free-market structure that emerged in the 1950s or had actually made things worse.
Gansler, of course, was not the first to notice the fundamentally non-market character of the U.S. defense industrial base. In 1962, this insight was a ma-jor finding of Merton Peck and Frederic Scherer’s The Weapons Acquisition Process.45 They concluded that the uncertainties and risks embedded in the weapons acquisition process not only made it unique, but vitiated the use of free-market concepts such as “competition,” “price,” “buyer,” and “seller” in thinking about how the U.S. defense industry functioned:
Payments to contractors are on the basis of cost incurred, yet competitive prices are an essential feature of a market system. In weapons acquisition the buyer exercises control over sellers through the auditing of costs and other activities that involve the government in the internal management of its contractors. Yet another essential element of a market system is that the buyers exert their control only by distributing their patronage among competing sellers. Similarly, while in a market system the
41 Gansler, The Defense Industry, p. 92. 42 Gansler, The Defense Industry, p. 93. 43 Gansler, The Defense Industry, p. 93. 44 Gansler, The Defense Industry, p. 96. For empirical analysis of the burden statues and regula-
tions impose on DoD program offices, see Jeffrey A. Drezner, et al., Measuring the Statutory and Regulatory Constraints on DoD Acquisition: An Empirical Analysis (Santa Monica, CA: RAND, MG569, 2007). Surprisingly, this research found that compliance activities constituted less than 5 percent of the total staff time available and had few adverse consequences (ibid, pp. 56–57).
45 Because a great deal of the basic source material was classified, Assistant Secretary of Defense (Installations and Logistics) Perkins McGuire and his successor, Thomas Morris, provided the staff for this study with clearance and “need to know” in return for submitting all written material to the OSD security office for clearance (Peck and Scherer, The Weapons Acquisition Process, p. xi).
Sustaining Critical Sectors of the U.S. Defense Industrial Base 15
initiative for product decisions rests upon sellers, [yet in defense] the government rather than its contractors decides what weapons are to be created through its pro-gram decisions. Program decisions are in turn implemented by … scores of optimi-zation decisions … , some made by government agencies, some shared between the government and its contractors, and still others made by contractors. At this more detailed level the decision-making roles of government and contractors become en-twined in a manner foreign to a market system’s rigid distinction between buyers and sellers. Thus weapons acquisition is characterized by a form of economic organization quite different from the market system found elsewhere in the U.S. economy.46
Here one of the most striking differences between the defense industry and the rest of the U.S. economy was that the U.S. government is ultimately a single buyer even if, in practice, it speaks with “many different and discordant” voices.47
Peck and Scherer went even further than simply pointing out the funda-mentally non-market character of the permanent defense industrial base that emerged in the 1950s. They offered four reasons for what they termed the “re-grettable” conclusion that a market system in its entirety could never exist for weapon acquisition: (1) individual weapons projects require such large expendi-ture of private financing that their development is virtually impossible by private firms48; (2) the development of advanced weapons involves far larger technical, bureaucratic and funding uncertainties than do commercial products; (3) a free market could not determine the product characteristics desired by government buyers of advanced weaponry; and (4) price competition in advanced weapons is not like that in a free market.49 Suffice it to say that Peck and Scherer’s con-clusions about the unique, non-market character of defense acquisition were certainty true in the early 1960s, and Gansler’s analysis confirmed that they remained true into the 1980s.
How much has the fundamental character of the U.S. defense industry moved in the direction of functioning like a normal free market since the Cold War ended? One looks in vain for evidence that there has been discernible movement in this direction. In April 2009, none other than Secretary of Defense Robert Gates ob-served that the “perennial procurement and contracting cycle—going back many
46 Peck and Scherer, The Weapons Acquisition Process, p. 582.47 Peck and Scherer, The Weapons Acquisition Process, p. 76. Gansler, too, emphasized that DoD is
a single buyer for weapons, whereas there are many buyers, large and small, for most commercial products (Gansler, The Defense Industry, p. 30).
48 During the late 1950s, Northrop used its own funds to develop the F-5 as a low-cost, lightweight fighter that could be sold to less-developed nations under the Military Assistance Program. Over 2,200 F-5s were eventually built and hundreds remain in service today. Later, Northrop invested some $1.2 billion of its own money to develop the F-20, but the Reagan administration’s decision to sell F-16s overseas doomed the F-20, of which only three were built. The F-5, therefore, is the last supersonic jet fighter that an aerospace firm was able to develop on its own dime and success-fully market.
49 Peck and Scherer, The Weapons Acquisition Process, pp. 57–60.

16 center for strategic and Budgetary Assessments
decades—of adding layer upon layer of cost and complexity onto fewer and fewer platforms that take longer and longer to build must come to an end.”50 The follow-ing month, President Barack Obama made much the same observation when he signed the “Weapon System Acquisition Reform Act of 2009.” In the president’s view, the act represented “an important next step” toward reforming a defense procurement process in which “taxpayers are charged too much for weapons sys-tems that too often arrive late.”51 Moreover, the persistence of substantial cost growth in many current acquisition programs (see Table 1 in the next section) supports the judgment that, despite repeated numerous attempts at reform, the U.S. defense industry still does not operate like a classic free market. Again, a sine qua non of free markets is price sensitivity based on supply and demand, competi-tion, and innovation, characteristics not present in defense acquisition.
Nevertheless, the myth about the free-market character of the U.S. defense industry persists. To cite a recent example, in February 2011 Ashton Carter, the Pentagon’s Under Secretary for Acquisition, Technology, and Logistics, an-nounced at an investment conference that Secretary of Defense Robert Gates’ ef-ficiency initiative would, in the main, “rely on normal market forces to make the most efficient adjustments to the defense industrial base.”52 Nor was Carter alone in continuing to subscribe to this view of how the defense industry functions. Title II, Section 202, of the “Weapon System Acquisition Reform Act of 2009” requires the Secretary of Defense to include in the acquisition strategy for each MDAP “measures to ensure competition, or the option of competition, at both the prime contract level and the subcontract level … throughout the life-cycle of such a pro-gram as a means to improve contractor performance.”53 Here again the underlying premise is that just as free-market competition has contained costs and improved performance in computers, consumer electronics, and other commercial sectors, free-market competition can also achieve efficiencies in the defense industry.
The obvious way to achieve such competition would be, as Section 202 of the 2009 reform act suggests, to retain more than one supplier at the prime and sub-contractor levels well past source selection. But in the case of congressional efforts
50 Robert M. Gates, “Defense Budget Recommendation Statement,” April 6, 2009, at http://www.defenselink.mil/speeches/speech.aspx?speechid=1341, accessed February 13, 2011.
51 President Barack Obama, “Remarks by the President at signing of the Weapons Systems Acquisition Reform Act,” The White House, May 22, 2009, at http://www.whitehouse.gov/search/site/weapons%20systems%20acquisition%20form%20act%20of%202009, accessed February 13, 2011.
52 Ashton Carter, “The Defense Industry Enters a New Era,” remarks at Cowen Investment Conference, New York, NY, February 9, 2011.
53 The “Weapons Systems Acquisition Reform Act of 2009,” Public Law 111-23, is available at http://www.gpo.gov/fdsys/pkg/PLAW-111publ23/pdf/PLAW-111publ23.pdf. For a summary of recent Congressional efforts to reform defense acquisition, see Moshe Schwartz, “Defense Acquisitions: How DOD Acquires Weapon Systems and Recent Efforts to Reform the Process,” Congressional Research Service RL34026, April 23, 2010.
In fact, the
U.S. defense
industry … does
not operate like
a classic free
market.

Sustaining Critical Sectors of the U.S. Defense Industrial Base 17
to develop an alternative engine for the F-35, Secretary Gates has adamantly re-sisted doing so. As he explained to Representative John Larson in May 2010,
DOD’s independent Cost Analysis and Program Evaluation (CAPE) estimates that an additional $2.9 billion would be required to take an alternate engine, the F136, to competitive procurement in FY17. While the $2.9 billion cost is real and certain, the benefits of a second engine are not. CAPE has concluded that a second engine might provide savings if both engine vendors respond to competitive pressures and drive prices lower and the second engine supplier matches the F135’s vendor prices for the duration of the competition. Some international partners are almost certain to only buy the F136 engine made by the General Electric (GE) and Rolls Royce team, and the Navy has stated they will only buy one engine to avoid having to maintain two different engines aboard a ship. While DOD favors competition where possible, in this case there would not be a true competition between the engine vendors, with accompanying reductions in cost. Therefore, it is DOD’s strong judgment that these real costs outweigh the theoretical benefit.54
Presumably the added expense of second production lines for major items such as the JSF, the Trident II submarine-launched ballistic missile (SLBM), the Space-Based Infrared Systems (SIBRS) satellites, or Global Hawk RQ-4 unmanned aerial reconnaissance vehicles would be far more expensive than the alternative F136 engine for which Congress has provided $1.3 billion in unrequested addi-tional funding. Even if separate sources were preserved throughout production, the small quantities the government procures these days would probably not al-low either competitor to get far enough down its learning curve to yield savings greater than the costs of funding a second source. In fact, if the competition were to be staged as a multi-round split buy (with, say, 60 percent going to the winner and 40 percent to the loser each round), then the cost advantage obtained by the winner of the first round by being able to progress further down the learning curve could make it impossible for the loser of the first round to win any subse-quent rounds. Consequently, as the Pentagon moves into an era of fiscal austerity, it is difficult to envision Section 2o2 of the 2009 acquisition reform act being implemented successfully, especially at the prime level. If not, then there appears to be scant hope that defense acquisition will move perceptibly in the direction of functioning like a true free market anytime soon.
54 Robert M. Gates, letter to John B. Larson, May 25, 2010, p. 1. This letter is available at http://f135engine.blogspot.com/2010/05/letter-from-defense-secretary-robert.html. In the case of the F-16, however, the Air Force funded the development and testing of a second engine. In the first four years of the resulting competition, results based on comparing actual costs to the program’s baseline estimate included: nearly 30 percent cumulative savings for acquisition costs; roughly 16 percent cumulative savings for operations and support costs; and total savings of about 21 percent in overall life cycle costs” (Michael Sullivan, “Defense Acquisitions: Analysis of Costs for the Joint Strike Fighter Engine Program,” statement before the Subcommittees on Air and Land Forces, and Seapower and Expeditionary Forces, House Armed Services Committee, March 22, 2007, GAO-07-656T, p. 12).
In fact, if the
competition were
to be staged as a
multi-round split
buy, then the cost
advantage obtained
by the winner of the
first round by being
able to progress
further down the
learning curve could
make it impossible
for the loser of the
first round to win
any subsequent
rounds.


For decades, a constant criticism of the U.S. defense industry has been that the ac-quisition system has been unable to control either program or unit costs.55 Figure 3’s left-hand plot shows unit-cost trends from 1940 to 1980 for both tactical air-craft and tanks using a logarithmic scale on the vertical axis. These trends, which have certainly persisted into the 2000s for tactical aircraft, reflect the persistent inclination of Service and OSD customers to accord first priority in weapons pro-grams to state-of-the-art performance. True, early-as-possible availability has also occasionally been accorded top priority in major weapons programs; a recent example is the Mine Resistant Ambush Protected (MRAP) vehicle program. In most cases, however, cost has tended to end up in last place, even when initially given first billing. In the early days of both the JSF and the Evolved Expendable Launch Vehicle (EELV) programs, controlling costs was a major, if not overriding, priority. But even in the case of EELV, cost control gave way to performance in the sense of insisting on the availability of two reliable launch vehicles.
The most important consequence of the acquisition system’s inability to con-trol costs has been to limit the quantities of advanced weapons systems that the Defense Department has been able to buy. Especially in areas such as U.S. naval combatants and Air Force combat aircraft, inventory levels have steadily gone down since the mid-1990s (see Appendix 2). Perhaps the most striking illustra-tion can be seen in the case of all-aspect, low-observable (LO) combat aircraft. Ignoring the JSF, the Pentagon has started four major programs to field “stealthy” combat aircraft: the F-117, the B-2, the Advanced Tactical Aircraft (A-12), and the Advanced Tactical Fighter (F-22). Only three of these planes entered operational service: the now-retired F-117, the B-2 and the F-22. The Navy’s A-12, conceived
55 See, for example, John Lehman. “Wasteful Spending Is a Clear and Present Danger,” The Wall Street Journal, July 18, 2009, at http://online.wsj.com/article/SB124787043032160493.html, ac-cessed February 12, 2011.
cHAPTeR 5 > EFFICIENCy THEN AND NOW

20 center for strategic and Budgetary Assessments
to replace its aging A-6, was cancelled by defense secretary Richard Cheney in January 1991.56 Granted, all four of these “stealth” programs were begun before the Cold War ended. So the quantities initially envisioned were undoubtedly influenced by American perceptions of the Soviet threat. Still, at the outset the Services planned to field 20 F-117s and no less than 132 B-2s, 858 ATAs for the Navy and Marine Corps (with possibly another 400 for the Air Force), and 750
56 Litigation over the A-12’s cancellation between the government and the contractors continued into 2011. Initially General Dynamics and McDonnell Douglas (now Boeing) challenged the termina-tion on the grounds that the Air Force did not share knowledge about stealth technology from the F-117 and B-2 programs. A federal claims court ruled that because of the withheld information the contractors did not default and ordered the Pentagon to pay them $1.2 billion in expenses. A fed-eral appeals court then overturned this decision and ordered a new trial, at which DoD prevailed and asked the contractors to return $1.35 billion it had paid them for work never accepted plus interest. On March 23, 2011, the U.S. Supreme Court vacated the appeals court ruling and sent the case back to the federal circuit (Marcus Weisgerber, “Supreme Court Overturns A-12 Ruling against Contractors,” Defense News, May 23, 2011).
* The left-hand chart is an early version of the basis of Augustine’s lighthearted “law” that by 2054 the entire defense budget will purchase just one aircraft (norman R. Augustine, “Land Warfare,” Ieee Transactions on Aerospace and electronic systems, Vol. Aes-22, no. 5, september 1986, p. 510, Figure 46). The right-hand chart updates Augustine’s original for tactical aircraft using sources such as Air Force fact sheets and constant FY 1998 dollars. currently Augustine says that the ongoing growth in aircraft unit prices is “right on target” to fulfill his original prediction (“Defence spending in a Time of Austerity,” The Economist, August 28, 2010, p. 21).
FIGURE 3. UNIT COST TRENDS IN TACTICAL AIRCRAFT AND TANkS*
$10$107 7
$10$106 6
$10$105 5
$10$104 4
Ave
rage
Uni
t C
ost
(Mill
ions
The
n-Ye
ar $
) A
vera
ge U
nit
Cos
t (M
illio
ns T
hen-
Year
$)
F-14 F-14
F-15 F-15
1940
1940
1980
1980
Year of IOCYear of IOC
Harrier Harrier F-4J F-4J
A-6 A-6
F-111A F-111A F-111D F-111D
F-4B F-4B F-105 F-105 A-7E A-7E
A-7A A-7A F-104 F-104
F-8E F-8E F-5 F-5
F-106 F-106
A-1E A-1E
F-101 F-101
F-102 F-102
F-100 F-100 F-84 F-84
F-86 F-86
P-51 P-51
P-38 P-38
P-47 P-47
F-4U F-4U
MBT-70 MBT-70 M60A1E2 M60A1E2
M60A1 M60A1
M60 M60
M48A3 M48A3
M48A1 M48A1
M48 M48 M41 M41
M-4
F9F-6 F9F-6
A-4D A-4D
F8F-2 F8F-2
MAIN BATTLE TANKS
MAIN BATTLE TANKS
TACT
ICAL
AIR
CRAF
T
Year of Initial Operational CapabilityYear of Initial Operational Capability
F-14 F-14
F-15A/B F-15A/B
F-15C/D F-15C/D
F/A-18A/B F/A-18A/B
A-10 A-10 F-16A/B F-16A/B
F-16C/D Block 25-32 F-16C/D Block 25-32
Ave
rage
Uni
t C
ost
(Mill
ions
FY
98
$)
Ave
rage
Uni
t C
ost
(Mill
ions
FY
98
$)
F-15E F-15E
F/A-18C/D F/A-18C/D
F/A-18E/F F/A-18E/F
F-22 F-22
$200$200
$100$100
$50 $50
$40 $40
$30 $30
$20 $20
$10$10
F-35 F-35 Estimates Estimates (Dec 2009) (Dec 2009)
1945
1945
1950
1950
1955
1955
1960
1960
1965
1965
1970
1970
1975
1975
1970
1970
1975
1975
1980
1980
1985
1985
1990
1990
1995
1995
2000
2000
2005
2005
2010
2010
2015
2015

Sustaining Critical Sectors of the U.S. Defense Industrial Base 21
Air Force F-22s and 618 carrier variants for a grand total of 2,778 jets. The F-117 alone was procured in greater numbers than originally envisioned. B-2 and F-22 cost growth, successive reductions in planned buys, the A-12’s cancelation and the Navy’s exit from the F-22 program in favor of an improved variant of F/A-18 resulted in only 267 of these aircraft being fielded (59 F-117s, 21 B-2s, and 187 F-22s). What makes these final quantities so distressing is, of course, the large development costs these aircraft required. The B-2 and F-22 developments each cost the U.S. taxpayer over $24 billion (in then-year dollars).57 Reducing the F-22 buy from 750 to 187 added nearly $100 million to the unit acquisition cost of each fighter, and reducing the B-2 buy from 132 to 21 added almost $1 billion to the unit acquisition price of each bomber.58
It is tempting to conclude, in light of post-Cold War production quantities being as truncated as they were in case of the B-2, that the efficiency of DoD’s weapons acquisition process has been growing progressively worse over time. Surprisingly, however, this does not appear to be the case. Based on available data, cost-change ratios and schedule slippage during the 1950s were not dramatically better than they are today.
The right hand columns in Table 1 display cost-change ratios for twenty current MDAPs. The ratios have been normalized to remove the effects of inflation and to account for changes in the quantities to be procured. The base-year original and current program costs used to compute the cost-per-unit ratios for each MDAP are not completely comparable unless the programs being compared have the same base year. For example, the cost/quantity prices for the Air Force’s Advanced Medium Range Air-to-Air Missile (AMRAAM) are in constant FY 1992 dollars, whereas the price for the Guided Multiple Launch Rocket System (GMLRS) is in FY 2003 dollars. (See Appendix 3 for Table 1 with the original and current acqui-sition unit prices in constant FY 2011 dollars.) Note, also, that two cumulative cost-change ratios are shown for the two programs—the F-22 and the V-22—in which re-baselining in 2005 lost visibility into prior changes in program costs and planned buy quantities. The F-22 program, for instance, experienced a cost-change ratio of 2.89—a 189 percent cost overrun per unit—from 1990 to the end of 2004, whereas the re-baselined program has a cost-change ratio of only 1.04—a mere 4 percent increase—since 2005. Thus, the cumulative cost growth per F-22 has been 200 percent.
57 For the B-2’s RDT&E cost in then-year dollars, see Department of the Air Force (DoAF), “Supporting Data for Fiscal Year 1999 Amendment: Research, Development, Test and Evaluation Descriptive Summaries,” Volumes I, II, & III, February 1998, p. 821; for F-22 RDT&E, see DoAF, “Fiscal Year (FY) 2008/2009 Budget Estimates: Research, Development, Test and Evaluation Descriptive Summaries,” Vol. II, February 2007, p. 899.
58 The cancelation of programs such as the Comanche helicopter and the Future Combat Systems suggests that during the 2000s the Army had even more difficulty getting from development to production than the Air Force or Navy. See Marjorie Censer, “Go Big or Go To War with the Weapons You Have,” The Washington Post, May 29, 2011, pp. G1 and G4.
Based on available
data, cost-change
ratios and schedule
slippage during the
1950s were not
dramatically better
than they are today.

22 center for strategic and Budgetary Assessments
TABLE 1 . COST-CHANGE RATIOS FOR TWENTy 2010 mDApS (NORmALIzED FOR INFLATION AND QUANTITy)*
* The primary source for Table 1 is DoD, OUSD(AT&L) ARA/AM, “Selected Acquisition Report (SAR) Summary Tables: As of Date: December 31, 2010,” April 5 2011. However, earlier SARs were used to capture prior cost and quantity changes for two programs that were re-baselined: the F-22 and the V-22. The cost-change ratios in gray boxes were used to compute the average for all twenty programs. If the re-baselining of the F-22 and V-22 is ignored, then the average cost-change ratio for Table 1 is 1.21. Congress requires that cost growth in DoD acquisition programs be reported relative to the original baseline (US Code Title 10, Subtitle A, Part IV, Chapter 144, § 2435, “Baseline Description,” as of February 1, 2010). However, if the acquisition or procurement unit price exceeds the critical cost growth thresholds in § 2433, the baseline can be adjusted or revised. Senator Sam Nunn and Congressman Dave McCurdy first established thresholds for reporting program cost growth to Congress in an amendment to the 1982 Defense Authorization Act. These reporting requirements were made permanent in 1983. Breaches of the cost-growth thresholds in § 2435 are commonly known as “Nunn-McCurdy breaches.”
program (Base year)
Base year $ (millions) per Unit
Cost-Change Ratio
Cumulative Change Ratio
original/Quantity
current/Quantity
F-35 Joint strike Fighter (2002) $61.793 $110.134 1.78
F-22 Advanced Tactical Fighter (1990) $93.009 $268.503 2.893.00
F-22 Raptor (2005) $355.148 $369.490 1.04
AMRAAM (1992) $0.797 $1.000 1.26
Joint Direct Attack Munition (1995) $0.026 $0.022 0.86
global Hawk RQ-4A/B (2000) $69.052 $171.039 2.48
Reaper MQ-9 (2008) $27.497 $28.359 1.03
global Positioning system IIA (2010) $480.100 $527.200 1.10
Advanced eHF (2002) $1,933.567 $1,945.067 1.01
F/A-18e/F super Hornet (2000) $84.814 $83.880 0.99
ssn 774 nuclear Attack submarine (1995) $2,145.120 $2,107.317 0.98
cVn 78 class Aircraft carrier (2000) $9,567.067 $9,142.000 0.96
DDg-51 Aegis Destroyer (1987) $737.117 $802.199 1.09
Trident II sLBM (1983) $31.428 $48.729 1.55
V-22 (1986) $25.27 $69.21 2.742.74
V-22 (2005) $109.717 $109.625 1.00
stryker (2004) $3.949 $3.671 0.93
guided MLRs (2003) $0.070 $0.111 1.59
Longbow Apache (1996) $7.507 $15.027 2.00
UH-60M Black Hawk Upgrade (2005) $13.605 $16.064 1.18
Patriot PAc 3 (2002) $7.838 $7.932 1.01
MQ-1c UAs gray eagle (2010) $378.738 $162.006 0.43
1.40 Average

Sustaining Critical Sectors of the U.S. Defense Industrial Base 23
Two further observations should put the cost-change data in Table 1 in per-spective. First, the choice of programs was somewhat arbitrary. The intent was to include major platforms from all the Services with a sampling of troubled MDAPs in which there had been substantial cost growth. Nevertheless, Table 1 contains several programs—including the F/A-18E/F, the SSN 774 nuclear attack submarine, the Stryker ground combat vehicle, the Joint Direct Attack Munition (JDAM), and, most dramatically, the MQ-1C Gray Eagle unmanned air sys-tem—in which the cost per unit has gone down rather than up. Second, while the overall average program cost-change in Table 1 is an increase of 40 percent, this percentage is greater than the 22 percent cost growth over all of the Pentagon’s 101 MDAPs as of December 31, 2010. The U.S. Army’s average across twenty-four major acquisition programs is only 19 percent, the average for the thirty-six Navy and Marine Corps MDAPs is 15 percent, and the Air Force’s average is 26 percent over thirty-one major programs.
How do the normalized cost-change ratios from December 2010 compare with those from the 1950s? Table 2 shows cost-change ratios for eighteen Air Force programs from a 1959 RAND paper by Andrew Marshall and William Meckling. Because removing inflation and taking quantity into account were trickier before SARs became widely available, the normalized ratios were calculated indepen-dently by two different researchers (Eugene R. Brussell and Robert Summers). Both sets of cost-change ratios are shown in Table 2. The overall cost growth calculated by these two researchers varies from a low average of 167 percent to a high of 258 percent. But even the low of 167 percent is more than four times the 40 percent in Table 1, and more than seven times the 22 percent average for all 101 Army, Air Force, Navy/Marine Corps and DoD MDAPs as of December 2010. The available data suggest, therefore, that program cost growth was substantially greater in the 1950s than it is today. Moreover, this conclusion makes sense in light of how technically challenging were first-of-kind developments such as the Atlas ICBM, the solid-fuel Polaris SLBM, the first Corona reconnaissance sat-ellites, the military’s transition from propeller to jet aircraft, and the post-war generation of guided missiles.
Schedule slippage too is not appreciably worse today than it was in the 1950s. Based on ten programs from the 1950s, Marshall and Meckling reported an aver-age slippage of two years and a slippage factor of 1.5 between early predictions and the achievement of an initial operational capability (IOC).59 In 2009, the Government Accountability Office (GAO) reported schedule slippages of eigh-teen, twenty-one and twenty-two months for MDAP portfolios from FY 2003, FY
59 Marshall and Meckling, “Predictability of the Costs, Time, and Success of Development,” pp. 17. 19. The unadjusted cost-change ratio for the Missile Program 1 in Table 2 was an astonishing 57.6-to-1. As best Marshall can recall, this program was the Air Force’s Snark.

24 center for strategic and Budgetary Assessments
2007, and FY 2008, respectively.60 Given the much greater complexity of current weapons systems, especially their enormous software content, schedule slippag-es in the 2000s do not appear to have grown dramatically worse than they were in the 1950s.
One therefore cannot conclude on the basis of cost growth and schedule slip-page then and now that the U.S. defense industry has become increasingly inef-ficient in recent decades. The core problem appears to be the steady growth in average unit costs depicted in Figure 3. And the causes of this problem appear to be both persistent and complex. They include, at a minimum, the longstanding preferences of the military Services for state-of-the-art weaponry and the cost in-sensitivity built into the acquisition system both before and after source selection.
Of course, while the efficiency of the U.S. weapons acquisition system may not have grown appreciably worse since the 1950s, the system is inefficient and even wasteful compared to commercial sectors of the U.S. economy. In 1980, Gansler
60 Government Accountability Office (GAO), “Defense Acquisitions: Assessments of Selected Weapon Programs,” March 2009, GAO-09-326SP, p. 7.
TABLE 2. COST-CHANGE RATIOS FOR EIGHTEEN 1950S AIR FORCE pROGRAmS*
* Marshall and Meckling, “Predictability of the Costs, Time, and Success of Development,” p. 14.
Fighter programs Bomber programs missile programs
cost-change Ratios cost-change Ratios cost-change Ratios
1 3.9 4.0 1 6.2 4.0 1 14.7 6.4
2 2.6 2.5 2 2.8 2.8 2 9.4 6.0
3 2.0 2.0 3 1.1 1.2 3 4.4 2.7
4 1.5 1.5 Averages 4 7.2 7.1
5 1.7 2.1 3.37 2.67 5 1.5 1.3
6 1.2 1.2 6 1.1 0.8
7 1.0 0.8 Averages
8 1.0 1.0 6.38 4.05
9 1.1 0.6
Averages Overall Averages 3.58 2.67
1.78 1.74
Sustaining Critical Sectors of the U.S. Defense Industrial Base 25
identified a host of functional problems that contribute to inefficiency, if not waste. Among those he highlighted as being the greatest sources of inefficiency were the lack of production competition, designing for maximum performance, high overhead, and the lack of automation.61 Except for the increasing incorpora-tion of computer-driven machine tools by the aerospace industry, none of these problems have disappeared since the 1980s. But their persistence should come as no surprise. Again, the U.S. defense industrial base is a highly regulated sec-tor in which the regulators and the buyers are one and the same. The inescap-able conclusion is that as long as the industry’s fundamental structure remains unchanged, the inefficiencies dictated by that structure will likewise persist.
61 Gansler, The Defense Industry, pp. 221–222.


Is it at all likely that the U.S. defense industry can be restructured to function like a normal free market? Again, in 1962, Peck and Scherer argued against the very possibility. Due to the many uncertainties about outcomes endemic to defense acquisition, they concluded that the post-World War II U.S. defense industry had developed a unique, non-market structure.62 Not only do their arguments appear to remain valid today but, if anything, they have been reinforced with the pas-sage of time. A half-century later, the vested interests of the various stakeholders in the military-industrial-Congressional complex created during the 1950s have become deeply entrenched. Congress, OSD, the military Services, and defense contractors all have incentives to preserve the existing regulated market in which the government acts as both regulator and buyer. Enormous effort and political capital would be required to bring about any fundamental restructuring of the U.S. acquisition system. For all its faults, waste and inefficiencies (see Appendix 6), the post-World War II U.S. defense industry has time and again produced
62 As an example of uncertainty in the defense business, Augustine offered the following observa-tions stemming from the rapid reduction in defense spending that took place during 1990 to 1997: “Most industries consider the loss of a few percentage points in their market a severe setback, even a catastrophe. The companies that make up the defense industry have seen more than 50% of their market disappear—a disaster not widely understood by the public. … The severity of the impact on the defense industry has been devastating, exceeding that of the great stock market crash of 1929 on the U.S. economy … Estimates suggest that only about one-quarter of the 120,000 companies that once supplied the Department of Defense still serve in that capacity; the others have shut down their defense lines of business or have dissolved altogether. And the surviving companies have laid off highly skilled workers at the rate of one every 45 seconds for a number of years—a sustained rate of loss far greater than that experience by any other industry in re-cent times.” (Augustine, “Reshaping an Industry: Lockheed Martin’s Survival Story,” Harvard Business Review, May–June 1997, p. 84).
cHAPTeR 6 > SUGGESTIONS ON ImpROvING EFFICIENCy

Figure 4. DoD’s requirements, Acquisition, AnD execution systems
Trades
Trades
Trades
Trades
TradesTrades
Landfill
Integrated System Design
System Capability & Manufacturing Process Demonstration Low-Rate Initial Production
Integrated Defense Acquisition, Technology, and Logistics Life Cycle Management System
Full-Rate Production/Deployment
Engineering & Manufacturing Development Phase Operations & Support Phase
DoD DecisionSupport SystemsEffective Interaction
is Essential
Life Cycle Sustainment
Technology Development PhaseMateriel Solution Analysis Phase Production & Deployment Phase
Version 5.4 15 June 2010
Complete Analysis of Alternatives to assess potential materiel solutions to capability need, identify key technologies and estimate life cycle costs.
Consider commercial-off-the-shelf and solutions from both large andsmall business. Identify materiel solution to capability need.
Complete Technology Development Strategy.
Reduce technology risk, determine and mature appropriate set of technologies to integrate into full system, demonstrate critical technology elements on prototypes, and complete preliminary design. Identify an
affordable program or increment of militarily useful capability, demonstrate technology in relevant environment, and identify and assess manufacturing risks. Provide for two or more competing teams
producing prototypes of system and/or key system elements prior to or through Milestone B.
Develop a system or increment of capability; complete full system integration, develop affordable and executable manufacturing process; ensure operational supportability; reduce logistics footprint; implement human systems integration; design for producibility; ensure
affordability; protect critical program information; and demonstrate system integration, interoperability, safety, and utility.
Achieve operational capability that satisfies mission needs. Low-rate initial production (limited deployment for software intensive systems with no development hardware) and full-rate production (full deployment for software intensive systems). Deliver
fully funded quantity of systems and supporting material and services for program or increment to users.
Execute support program that meets materiel readiness and operational support performance requirements and
sustains system in most cost-effective manner. Overlaps Production and Deployment Phase.
Disposal
Strategic Guidance
MSB
MSC
MSA
Joint Capabilities Integration& Development System
VCJCS OversightCJCSI 3170.01 series
DefenseAcquisition
SystemUSD(AT&L) Oversight
DoDD 5000.01
Planning,Programming,
Budgeting & ExecutionProcess
DEPSECDEF OversightDoD 7000.14-R Following the Materiel Development Decision, the Milestone Decision Authority may authorize entry into the acquisition process at any point, consistent with phase-specific entrance criteria and statutory requirements
Joint Capabilities Integration and Development System - AcronymsCDD – Capability Development DocumentCPD – Capability Production DocumentDCR DOTMLPF Ch R d ti
IOC – Initial Operational CapabilityIT – Information TechnologyJP 3 0 J i t P bli ti 3 0 “J i t O ti ”
System Threat AssessmentForce
ProtectionSurvivability
KPP
System Threat AssessmentForce
ProtectionSurvivability
KPP
System Threat AssessmentForce
ProtectionSurvivability
KPP
Post-CDR ADecision Points/Milestones MDD FRP
DR IOC FOC
This chart is a classroom aid for Defense Acquisition University students. It provides a notional illustration of interfaces among three major decision support systems used to develop, produce and field a weapon system for national defense. Defense acquisition is a complex process with many more activities than shown here and many concurrent activities that cannot be displayed on a two-dimensional chart. Supporting information is on back of this chart. For more information, see the Defense Acquisition Portal (http://dap.dau.mil).
FDDRFor software intensive systemsCompliant
Solution
SupportabilityRequirements
TechnicalStandards &
Compliant Solution
SupportabilityRequirements
TechnicalStandards &
Compliant Solution
SupportabilityRequirements
TechnicalStandards &
E it
B C
Joint Capabilities Integration & Development
System(need-driven)
Joint Operations ConceptsConcept of Operations
Operations Plans
Initiate Evolutionary Acquisition Strategy Evolutionary Acquisition Strategy
Joint Operations ConceptsConcept of Operations
Technology Development StrategyAoA Report
DoD Enterprise Architecture &Solution Architecture
Technical Standards Profile
Threshold/objective tradeoffs –Revised Performance Attributes
Component/JROCValidation &
ApprovalKPPs
CDDDraftCDD
KPPs
CPD
MS BCert
FRP
CE itMS ACert
Non-materiel solutions
JROC/Component
Validation andApproval
DCR
E it
Threshold/objective tradeoffs –Revised Performance Attributes
Threshold/objective tradeoffs –Revised Performance Attributes
A
Increment 2P-CDRA
Capabilities-BasedAssessment
DCR – DOTMLPF Change RecommendationDOTMLPF – Doctrine, Organization, Training, Materiel,
Leadership and Education, Personnel, & FacilitiesFOC – Full Operational CapabilityICD – Initial Capabilities Document
JP 3-0 – Joint Publication 3-0, “Joint Operations”JROC – Joint Requirements Oversight CouncilMUA – Military Utility AssessmentKPP – Key Performance ParameterKSA – Key System Attribute
Validated and approved CDD & CPD for each increment of
evolutionary acquisition
Selectively AppliedSystemTraining
KPP
EnergyEfficiency
KPPJoint Staff Review
J-1 – Joint manpower. J-2 – Intelligence/threat. J-3 – Operational suitability, sufficiency, &
supportability. J-4 – Facilities, sustainment, & energy efficiency. J-5 – Alignment with strategy & priorities.
J-6 – IT/NSS interoperability & supportability.J-7 – Systems training. J-8 – Weapons safety.
ProtectionKPP
KPP
Selectively AppliedSystemTraining
KPP
EnergyEfficiency
KPPJoint Staff Review
J-1 – Joint manpower. J-2 – Intelligence/threat. J-3 – Operational suitability, sufficiency, &
supportability. J-4 – Facilities, sustainment, & energy efficiency. J-5 – Alignment with strategy & priorities.
J-6 – IT/NSS interoperability & supportability.J-7 – Systems training. J-8 – Weapons safety.
Joint Staff ReviewJ-1 – Joint manpower. J-2 – Intelligence/threat.
J-3 – Operational suitability, sufficiency, & supportability. J-4 – Facilities, sustainment, & energy efficiency. J-5 – Alignment with strategy & priorities.
J-6 – IT/NSS interoperability & supportability.J-7 – Systems training. J-8 – Weapons safety.
KPPsTraceable To ICD &
JP 3-0
ProtectionKPP
KPPProtectionKPP
KPP
Selectively AppliedSystemTraining
KPP
EnergyEfficiency
KPP
E it
(If program initiation, or if equiv to FDDR)
Clinger-Cohen Act (IT incl NSS)- Compliance- CIO Confirmation of Compliance
E it
Clinger-Cohen Act (IT incl NSS)- Compliance- CIO Confirmation of Compliance
Clinger-Cohen Act (IT incl NSS)- Compliance- CIO Confirmation of Compliance
Clinger-Cohen Act (IT incl NSS)- Compliance- CIO Confirmation of Compliance
Component/JROCValidation &
Approval
Component/JROCValidation &
Approval
SolutionArchitectures
InformationAssurance
Net Centric Data & Services
Strategy
Standards & interfacesNet-Ready
KPP
SolutionArchitectures
InformationAssurance
Net Centric Data & Services
Strategy
Standards & interfacesNet-Ready
KPP
SolutionArchitectures
InformationAssurance
Net Centric Data & Services
Strategy
Standards & interfacesNet-Ready
KPP
InformationSupport
Plan
MUA/Final Demo Report for
Joint Capability Technology Demonstrations & other
prototype projects
InformationSupport
Plan
MUA/Final Demo Report for
Joint Capability Technology Demonstrations & other
prototype projects
InformationSupport
Plan
MUA/Final Demo Report for
Joint Capability Technology Demonstrations & other
prototype projects
KPPsTraceable To ICD &
JP 3-0
KPPsTraceable To ICD &
JP 3-0
Materiel Availability &Operational Availability
ReliabilityKSA
OwnershipCostKSA
AvailabilityKPP
Materiel Availability &Operational Availability
ReliabilityKSA
OwnershipCostKSA
AvailabilityKPP
Materiel Availability &Operational Availability
ReliabilityKSA
OwnershipCostKSA
AvailabilityKPP
ICD
Joint Operations ConceptsConcept of Operations
System Threat AssessmentAoA (if updated)
DoD Enterprise Architecture &Solution Architecture
Information Support PlanTechnical Standards Profile
Joint Operations ConceptsConcept of Operations
System Threat AssessmentAoA (if updated)
DoD Enterprise Architecture &Solution Architecture
Information Support PlanTechnical Standards Profile
A
Oversight&
Review
ExitCriteria
ExitCriteria
ADMExit
CriteriaMet Exit
Criteria
ADMExit
Criteria
ADM
Contracting
Purpose of LRIP: •Complete manufacturing development•Establish initial production base•Ramp to production rate•Produce systems for IOT&E
StudyContracts
AoAupdated as necessary
TLCSMTLCSM TLCSMTotal Life
Cycle SystemsManagement
MDADAB/ITAB MDA
ExitCriteria
ADMExit
Criteria
Cost-TypeContract
Determination(if applicable)
ADMB C
FRP
ExitCriteria
MetAPBPSR
Cert
ADM
AoA
AoA Study Guidance
AoA Study Plan
ExitCriteria
MetAPB
Final RFP cannot be released until TDS is approved
Post-CDR Report
P-CDRA Increment 3
Final RFP cannot be released until Acq Strategy is approved
Final RFP cannot be released until Acq Strategy is approved
Final RFP cannot be released until Acq Strategy is approved
AoAupdated asnecessary AoAMAIS
only
ADM – Acquisition Decision MemorandumAoA – Analysis of AlternativesAPB – Acquisition Program BaselineCDR – Critical Design ReviewCBRN – Chemical, Biological, Radiological & NuclearDAB – Defense Acquisition BoardECP – Engineering Change ProposalESOH – Environment, Safety, and Occupational HealthEVM – Earned Value ManagementFRPDR – Full Rate Production Decision ReviewFDDR – Full Deployment Decision ReviewIBR – Integrated Baseline ReviewITAB – Information Technology Acquisition BoardLRIP – Low Rate Initial Production
MAIS – Major Automated Information SystemMDA – Milestone Decision AuthorityMDD – Materiel Development DecisionNSS – National Security SystemsPDR – Preliminary Design ReviewP-CDRA – Post Critical Design Review AssessmentP-PDRA – Post PDR AssessmentPSR – Program Support ReviewRAM-C – Reliability, Availability, Maintainability & Cost
Rationale ReportRFP – Request for ProposalsRFI – Request for InformationTRA – Technology Readiness AssessmentTLCSM – Total Life Cycle Systems Management
Oversight & Review and Contracting Acronyms
ADMPost-
PDR A
Required if PDR is after Milestone B
ExitCriteria
MetPSR
PSRTRA Exit
CriteriaMet
APBPSR
TRA
PDR Report
DAB/ITAB MDA DAB/
ITAB MDA DAB/ITAB MDA DAB/
ITAB MDA
Acquisition Strategy• Acquisition Approach• Source & Related Documents• Capability Needs• Top-Level Integrated Schedule• Program Interdependency &
Interoperability Summary• International Cooperation• Risk & Risk Management• Technology Maturation• Industrial Capability &
Manufacturing Readiness• Business Strategy
• Resource Management• Program Security Considerations• Test & Evaluation• Data Management • Life-Cycle Sustainment Planning• Life-Cycle Signature Support Plan• CBRN Survivability• Human Systems Integration• ESOH• Military Equipment Valuation &
Accountability• Corrosion Prevention & Control
Contract Management ECPs/ChangesContractCloseout
Acq Plan
Draft RFP
RFP &Proposals
Source Selection
Plan
Source Selection
Draft RFP
RFP &Proposals
Source Selection
Plan
Source Selection
• Acquisition Approach• Source & Related Documents• Capability Needs• Top-Level Integrated Schedule• Program Interdependency &
Interoperability Summary• International Cooperation• Risk & Risk Management• Technology Maturation &
Competitive Prototyping• Industrial Capability &
Manufacturing Capabilities
• Business Strategy• Resource Management• Program Security
Considerations• Test Planning• Data Management &
Technical Data Rights• Life-Cycle Sustainment
Planning• Life-Cycle Signature
Support Plan• CBRN Survivability
Technology Development Strategy (TDS) Acquisition Strategy• Acquisition Approach• Source & Related Documents• Capability Needs• Top-Level Integrated Schedule• Program Interdependency &
Interoperability Summary• International Cooperation• Risk & Risk Management• Technology Maturation• Industrial Capability &
Manufacturing Readiness• Business Strategy
• Resource Management• Program Security Considerations• Test & Evaluation• Data Management • Life-Cycle Sustainment Planning• Life-Cycle Signature Support Plan• CBRN Survivability• Human Systems Integration• ESOH• Military Equipment Valuation &
Accountability• Corrosion Prevention & Control
Acquisition Strategy• Acquisition Approach• Source & Related Documents• Capability Needs• Top-Level Integrated Schedule• Program Interdependency &
Interoperability Summary• International Cooperation• Risk & Risk Management• Technology Maturation• Industrial Capability &
Manufacturing Readiness• Business Strategy
• Resource Management• Program Security
Considerations• Test & Evaluation• Data Management • Life-Cycle Sustainment Planning• Life-Cycle Signature Support
Plan• CBRN Survivability• Human Systems Integration• ESOH• Corrosion Prevention & Control
TechnologyDevelopment
Contract
Draft RFP
RFP &Proposals
Source Selection
Plan
Source Selection
PDR Report
Draft RFPAcq Plan
RFP &Proposals
Source Selection
Plan
Source Selection
Contract Management ECPs/ChangesContractCloseout
Engineering & Manufacturing
Development Contract
Acq Plan
Acq Plan
Contract Management ECPs/ChangesContractCloseout
LRIPContract Contract Management ECPs/Changes
ContractCloseout
ProductionContract
Post-Production Software Support Contracts
Initial RAM-CReport
DefenseAcquisition
Low-Rate Initial Production
SystemsPrototypes
SystemPerformance
Spec
ProductionRepresentative
Articles
Full-RateProduction
Systems
MajorProducts
FinalProductBaseline
FOT&E
•ICD•AoA Study Plan•Exit Criteria•Alternative Maintenance & Sustainment Concepts
OUTPUTS•ICD & Draft CDD•Approved Materiel Solution•Exit Criteria •Support & Maintenance Concepts& Technologies•Systems Engineering Plan•AoA Report
MostAcceptable
Recycle/Reuse
Disposal
Logistics/Sustainment
Evaluate ProductSupport Capabilities
Performance-Based Agreements
Product Support Integrator/Product Support Provider
BLRIPReport to Congress
Post-CDR AFRPDRB
Demonstrate Product Support Capability•Footprint Reduction •Supply Chain Management•Product Support Elements•Finalize Product Support BCA
•Preliminary System Spec•Systems Engineering Plan•T&E Strategy•System Safety Analysis•Support & Maintenance Concepts& Technologies•Inputs to:
•System Allocated Baseline•PDR Report •Test Reports•SEP •TEMP •PESHE •PPP •TRA•NEPA Compliance Schedule•Risk Assessment •LCSP•Validated Systems Support & MaintObjectives & Requirements
•Initial Product Baseline•Test Reports•SEP •TRA •PESHE •TEMP•NEPA Compliance Schedule•Elements of Product Support •Risk Assessment•Life Cycle Sustainment Plan
Develop Initial Product Support StrategyInitiate Product Support BCA
(Define Ground Rules & Assumptions)
Performance-Based Logistics (PBL) Strategy (Preferred Product Support Approach)
Refine Supportability
Objectives/Constraints
Pre-IOC and Post IOC Supportability Assessments
Post-DeploymentReview
INPUTSINPUTSSTUPTUOSTUPNI OUTPUTSC
Business CaseAnalysis
InitialProductBaseline(verified)
Define Supportability
Objectives
Prototypes
Product Support Plan•Statutory/Regulatory•Source of Support•Legacy Considerations•Conduct Product Support BCA
-Supply Support -Training-Maintenance -Support Data
-Manpower & personnel
•Product Support ElementsSet Product Support
Strategy
Technical & Logistics AcronymsASR – Alternative Systems ReviewAOTR – Assessment of Operational Test ReadinessBCA – Business Case AnalysisBLRIP – Beyond Low Rate Initial ProductionCDR – Critical Design ReviewCI Configuration Item
OA – Operational AssessmentOTRR – Operational Test Readiness ReviewPBA – Performance-Based AgreementPESHE – Programmatic Environment,
Safety & Occupational Health EvaluationPDR Preliminary Design Review
•Sys Performance Spec•Acquisition Strategy•Exit Criteria•APB •CDD •STA •ISP •SEP •TEMP •PESHE •PPP •NEPA Compliance Schedule•Risk Assessment
AMDD
AlternativeMateriel
Solutions
InitialProductBaseline
CloseoutEVM
SurveillanceIBR
MaterielSolution
CloseoutEVM
SurveillanceIBR
Closeout
EVMSurveillance
IBRCloseout
EVMSurveillance
IBR
Production Qualification Testing
Joint Interoperability
Full-Up System Level LFT&E
IOT&E
AOTR OTRR
as required
Sustainment Contracts
Product Support Package/PBL Implementation•Product Support Elements •Support and Cost Baseline•Contract for Sustainment (organic & Commercial)
•Supply Chain Management•Revalidate BCA•Refine Life Cycle Sustainment Plan
•Continuous Tech Refreshment•Obsolescence Management•Configuration Control•Data Management•Monitor Performance & Adjust Product Support
Product Support/PBL Management•Public-Private Partnering•Supply Chain Management•PBA Modifications•Assessment of PSI/PSPs•Revalidate PBA/BCA
Operations and Sustainment•Peacetime•Training•Revalidate BCA
•Joint Operations •Crises•Refine LCSP
System(event-driven) FCA
TechnicalSystems EngineeringTest and EvaluationSupportability
Analyze/Assess Concepts Versus
Defined User Needs &Environmental Constraints
Decompose Concept Functional Definition into Component Concepts &Assessment Objectives
Trades Trades
Implement andField
INPUTS•Service Use Data•User Feedback •Failure Reports•Discrepancy Reports•SEP•System Safety Analysis•Product Support Element
Requirements
OUTPUTSIntegrated DT&E/OT&E/LFT&E
Demonstrate System toSpecified User Needs and
Environmental Constraints
o epo t•T&E Strategy•Technology Development Strategy•System Safety Analysis
Analyze DeficienciesTo Determine Corrective
Actions
OUTPUTS
Modify Configuration(Hardware/Software/Specs)
To Correct Deficiencies
LeastAcceptable
Reprocessing
Disposal
•Test Results •Exit Criteria•APB •CPD •SEP •TEMP•Product Support Element
Requirements•PESHE•System Safety Analysis
INPUTS
LFTEReport to Congress
Verify and ValidateProduction
Configuration
puts to-draft CDD -AoA -TDS -IBR-Cost/Manpower Est.-Product Support Strategy
ASR
•System Safety Analysis•Inputs to: -CDD -ISP -STA -IBR
-Acq Strategy-Affordability Assessment-Cost/Manpower Est.
SVR PRR
•System Safety Analysis•Inputs to: -CPD -STA -ISP
-IBR -Cost/Manpower Est.
•Data for In-Service Review•Input to CDD for next increment•Modifications/upgrades to fielded
systems•SEP •Test Reports•System Safety Analysis•Product Support Package
•Product Baseline•Test Reports•SEP •PESHE •TEMP •System Safety Analysis •Inputs to: -IBR
- Cost/Manpower Est.- Product Support Package
JITC Joint Interoperability Test Certification
PCA In-ServiceReviewMonitor & Collect
Service Use & SupplyChain Performance Data
Analyze Data to:Validate Failures &
Determine Root Causes
Assess Risk of Improved System
Interpret User Needs,Analyze Operational
Capabilities &Environmental Constraints
VerificationLinkage
ValidationLinkage
VerificationLinkage
VerificationLinkage
VerificationLinkage
ValidationLinkage
VerificationLinkage
VerificationLinkage
VerificationLinkage
Verification/ValidationLinkage
VerificationLinkage
VerificationLinkage
ITR
Verification/ValidationLinkage
FMECAFTA
LORA
RCM
CI – Configuration ItemDT&E – Developmental Test & EvaluationEOA – Early Operational AssessmentESOH – Environment, Safety & Occupational HealthFCA – Functional Configuration AuditFMECA – Failure Mode Effects & Criticality AnalysisFOT&E – Follow-On Test & EvaluationFTA – Failure Tree AnalysisIOT&E – Initial Operational Test & EvaluationISR – In-Service ReviewISP – Information Support PlanITR – Initial Technical ReviewJITC – Joint Interoperability Test CommandLFT&E – Live Fire Test & EvaluationLORA – Level of Repair AnalysisMTA – Maintenance Task AnalysisNEPA – National Environmental Policy Act
PDR – Preliminary Design ReviewPCA – Physical Configuration AuditPRR – Production Readiness ReviewPPP – Program Protection PlanPSI – Product Support IntegratorPSP – Product Support ProviderRCM – Reliability Centered MaintenanceRMS – Reliability, Maintainability & SupportabilitySEP – Systems Engineering PlanSFR – System Functional ReviewSRR – System Requirements ReviewSTA – System Threat AssessmentSVR – System Verification ReviewTEMP – Test & Evaluation Master PlanTDS – Technology Development StrategyTRA – Technology Readiness AssessmentTRR – Test Readiness Review
Decompose FunctionalDefinitions into CriticalComponent Definition &
Technologies Verification Plan
•Validated Sys Support & MaintObjectives & Requirements•Product Support Strategy•System Safety Analysis
Demo & Validate System& Tech Maturity Versus Defined User Needs &
Environmental Constraints
SRR
Lighter blocks reflect technical efforts required if PDR is
required after Milestone B.
Assess/AnalyzeConcept & Verify System Concept’s
Performance
Develop Concept Performance (& Constraints)
Definition & VerificationObjectives
Decompose ConceptPerformance into
Functional Definition &Verification Objectives
Assess/AnalyzeSystem Concept
Versus FunctionalCapabilities
Assess/AnalyzeEnabling/Critical
Components VersusCapabilities
Interpret User Needs.Analyze Operational
Capabilities & Environmental Constraints
Develop System Performance(& Constraints) Spec &
Enabling/Critical Tech &Prototypes Verification Plan
Demo System & PrototypeFunctionalityVersus Plan
Develop FunctionalDefinitions for Enabling/
Critical Tech/Prototypes &Associated Verification Plan
Demo Enabling/Critical Technology Components
Versus Plan
Demo/ModelIntegrated System Versus
Performance Spec
Interpret User Needs, Refine System
Performance Specs &Environmental Constraints
Interpret User Needs, Refine System
Performance Specs &Environmental Constraints
Evolve FunctionalPerformance Specs into
System Allocated Baseline
PDR
Develop System Functional Specs & Verification Plan toEvolve System Functional
Baseline
Evolve FunctionalPerformance Specs into
System Allocated Baseline
SFR
PDR
System DT&E, OT&E, LFT&E& OAs Verify System
Functionality & ConstraintsCompliance to Specs
Integrated DT&E, LFT&E & EOAs Verify Performance
Compliance to Specs
Individual CIVerification
DT&E
TRR
SFR
Develop System Functional Specs & Verification Plan toEvolve System Functional
Baseline
Joint Interoperability Certification Testing
Evolve CI FunctionalSpecs into Product
(Build to) Documentation& Verification Plan
FinancialManagement
Actual CostsEngineering
Cost EstimationMethods
ParametricAnalogy
PMO Budget Estimate
PMO POM Input
CARD – Cost Analysis Requirements DescriptionCCE – Component Cost EstimateCCP – Component Cost PositionICE – Independent Cost EstimateMDAP – Major Defense Acquisition ProgramMAIS – Major Automated Information SystemPMO – Program Management OfficeRDT&E – Research, Development, Test & Evaluation
Cost Acronyms
Operations andMaintenance
Types ofFunds RDT&E – Management & Support
RDT&E – Advanced Component Development and Prototypes RDT&E – Systems Development & DemonstrationRDT&E – Advanced Technology Development
Assessment Objectives
Develop Component Concepts, i.e., Enabling/Critical
Technologies, Constraints, & Cost/Risk Drivers
Design/Develop System Concepts,i.e., Enabling/Critical Technologies,
Update Constraints, & Cost/Risk Drivers • Process Change
- Operations/Maintenance Support• Materiel Change- Hardware/Product Support Package
Fabricate, Assemble,Code to “Build-to”
Documentation
DetermineSystem Risk/
Hazard Severity
DevelopCorrective
Action
Integrate and TestCorrective Action
MTALORA
LFT&EWaiver
(if appropriate)
(with alternate LFT&E Plan)
Procurement
Technologies Verification PlanCDR
CCE CCPMDAP
CARDMDAP/MAIS
ICEMDAP
CCEMDAP
CCP AffordabilityAssessment CARD
MDAP/MAIS
ICEMDAP
CCE CCPCARDMDAP/MAIS
CARDMDAP/MAIS
ICEMDAP
CCE CCP AffordabilityAssessment
Economic Analysis (MAIS)Manpower Estimate (MDAP) Manpower Estimate (MDAP)
TD PhaseFully Funded
Full FundingIn FYDP
Full FundingIn FYDP
Full FundingIn FYDP
Capabilities
ICEMDAP MDAP
Economic Analysis (MAIS)Manpower Estimate (MDAP)
MSA PhaseFully Funded
MDAP
Economic Analysis (MAIS)
& Verification Plan
Planning,Programming,
Budgeting& Execution
Process
MilitaryDepartments andDefense Agencies
Decisions
WhiteHouse
Office of theSecretary of Defense
and Joint Staff
MBI
July
rebmeceDrebmevoNrebmevoN- tsuguA
January February (1st Monday)
FYDP – Future Years Defense ProgramMBI – Major Budget IssuesOMB – Office of Management and Budget
PMO – Program Management OfficePOM – Program Objectives Memorandum
Planning, Programming, Budgeting, and Execution Acronyms
Authors Chuck Cochrane and Brad Brown For a single copy of this chart, send a request to [email protected] Send recommendations to improve the content of this chart to [email protected]
(annual-calendar-driven)
Congressional Budget Process
AppropriationCommittees
AuthorizationCommittees
Authorization/AppropriationActs Passed
DoD Testimony DoD Appeals
OMB
Appropriated Funds To Support Contracts
Fiscal GuidanceMarch
Fiscal GuidanceApril
POM/Budget Formulation
SECDEF Option
POM/Budget Submit
DoD BudgetIntegrated Program/Budget Review
President’s Budget toCongress
FYDPupdated
FYDPupdated
February – September
BudgetCommittees
Defense Planning & Programming Guidance
Issue Nominations/Disposition
National Strategy Documents (updated as necessary)
National Security Strategy
National Defense Strategy
National Military Strategy
Allocation
Apportionment

30 center for strategic and Budgetary Assessments
world-class weaponry. Norm Augustine was right to observe that the U.S. defense industry helped to win the Cold War and has provided the U.S. armed forces “with equipment that is the envy of the world’s military forces.”63
Nevertheless, there are areas in which the efficiency of the U.S. acquisition system could be improved. The suggestions that follow highlight a few of the more obvious possibilities. However, because the likelihood is vanishingly small that the U.S. defense industry will be fundamentally restructured anytime soon, these suggestions assume that its non-market character will persist for the fore-seeable future. In light of this assumption, a brief overview is in order of the processes by which the present system sets requirements, develops programs to acquire new weaponry, and resources their execution.
The system by which the U.S. military develops and procures weapons has many moving parts. Formally, they consist of (1) a requirements process (the Joint Capabilities Integration and Development System or JCIDS), (2) the Defense Acquisition System itself, and (3) the Planning, Programming, Budgeting and Execution Process. Figure 4 provides a pictorial depiction of these three systems as of June 2010. To give a sense of the complexity of these three overlapping sys-tems, a major weapons program may need to develop as many as sixty different documents, twenty-eight required by statue and thirty-two by regulation, dur-ing its life cycle.64 In terms of the main stakeholders, the overall system includes the acquisition arms of the military Services, the Joint Requirements Oversight Council (JROC) of the Joint Staff, the Office of the Under Secretary of Defense for Acquisition, Technology and Logistics, Congress as a whole, the House and Senate armed Services and defense appropriations subcommittees, the Office of Management and Budget in the White House, and the various defense con-tractors. Program funding is provided by annual defense appropriations bills passed by Congress.
There is widespread agreement that the resulting system is overly complex, process-driven, and slow. In the judgment of the independent panel on the 2010 Quadrennial Defense Review (QDR),
the fundamental reason for the continued underperformance in acquisition activi-ties is fragmentation of authority and accountability for performance, or lack of clarity regarding such authority and accountability. Fragmented authority and ac-countability exists at all levels of the process, including identifying needs, defining alternative solutions to meeting the need, choosing and resourcing the solution, and
63 Norman R. Augustine in LtGen Ronald Kadish, Dr. Gerald Abbott, Mr. Frank Cappuccio, General Richard Hawley, General Paul Kern, and Mr. Donald Kozlowski, Defense Acquisition Performance Assessment Report, Assessment Panel of the Defense Acquisition Performance Assessment Project, January 2006, p. vi.
64 For a list of these various documents, which include everything from an Analysis of Alternatives to the Acquisition Decision Memorandum, see the Milestone Document Identification Tool at https://dap.dau.mil/aphome/das/pages/mdid.aspx.
Sustaining Critical Sectors of the U.S. Defense Industrial Base 31
delivering the defined capability with discipline on the agreed schedule and within the agreed cost. In the current system, the complex set of processes and authori-ties so diffuses the accountability for defining executable programs intended to pro-vide the needed increment of capability that neither objective is achievable—either rapid response to the demands of today’s war or meeting tomorrow’s challenges. … An additional consequence of the current long, complex, process-driven approach is that, once a program runs the gauntlet of committees, boards, and reviews to become a “program of record,” it becomes nearly immortal. We treat system per-formance as a given once approved by the Joint Requirements Oversight Council (JROC). Subsequent increases in cost and schedule, due to all the causes identified in the QDR, are accepted. Performance is rarely traded off. Only the most egregious cases are candidates for cancellation.65
To improve defense acquisition, the independent panel recommended that the Secretary of Defense restore line authority and accountability, adopt a block up-grade approach to new weapons systems, and return to the dual sourcing that was largely dropped during the post-Cold War defense cuts.66 As sensible as these recommendations may sound, they all face significant hurtles. Fundamentally reforming a process-driven acquisition bureaucracy, for example, would un-doubtedly require nonpartisan cooperation from Congress; constant OSD atten-tion would be needed to curb the military Services’ appetites for excessive perfor-mance requirements; and dual sourcing would increase near-term costs even if they were later offset by long-term savings. The three suggestions for improving acquisition performance offered next are, therefore, less ambitious than overall systemic reform but perhaps fall closer to being within the realm of the possible.
COmpETITION BELOW THE pRImE CONTRACTOR LEvEL
Given the limited quantities in which major weapons systems are being procured (due to their high unit costs) and the likelihood of a protracted downturn in U.S. defense budgets, it is unrealistic to think that second production lines to encour-age price competition or innovation will save money in the long run. Granted, the MRAP program utilized three principal vendors (the Navistar International
65 Stephen J. Hadley and William J. Perry (co-chairs), The QDR in Perspective: Meetings America’s National Security Needs in the 21st Century (Washington, DC: United States Institute of Peace, 2010), p. 85, italics in the original. The panel members were: Richard Armitage, J. D. Crouch, Charles Curtis, Rudy deLeon, Joan Dempsey, Eric Edelman, Sherri Goodman, David Jeremiah, George Joulwan, John Keane, Richard Kohn, John Lehman, Alice Maroni, John Nagl, Robert Scales, James Talent, Paul Van Riper and Larry Welch. It is sobering to compare the diagnosis of the ills of U.S. defense acquisition by the independent QDR panel in 2010 with that made by the President’s Blue Ribbon Commission on Defense Management in 1986. See the excerpt from A Quest for Excellence in Appendix 5.
66 Hadley and Perry, The QDR in Perspective, p. 91.

32 center for strategic and Budgetary Assessments
Military Group, Force Protection Inc., and BAE Systems) in order to get the vehi-cles into the field in quantity as rapidly as possible. Similarly, the first two Littoral Combat Ships (LCSs) were built by two different shipyards using different hull designs (semiplaning monohull and trimaran). These cases, however, appear to be exceptions. At best, the two Littoral Combat Ships are prototypes comparable to those DoD funded in the demonstration/validation phases of the F-22 and JSF programs. But after down-select in these two fighter programs, the foreseeable cost of continuing two parallel development programs, as occurred with Atlas and Titan I early in the Cold War, was deemed prohibitive. Through FY 2010, over $55 billion (in then-year dollars) had been invested in the F-35’s develop-ment (including nineteen test and some low-rate initial production aircraft). If an alternative engine for the F-35 was judged a luxury unlikely to produce real sav-ings in the long run, then how much more unaffordable would a second JSF pro-duction line be?67 Thus, maintaining second sources past down-select for most major weapons systems is not economically attractive today despite legislation calling for actual or potential competition to be maintained at the prime level throughout the life cycle of MDAPs. Second sources are likely to be even less attractive from DoD’s perspective in the years ahead except for commercially de-rived (“off-the-shelf”) systems that perform well and are far down the learning curve. Competition at the subcontractor level, though, is another matter. One of the ways in which prime contractors have been able to put themselves into the position of a monopoly supplier after source selection has been through the use of proprietary interfaces at the sub-system and component levels. A commercial example is the docking port used on the Apple iPod and iPhone. This proprietary interface forces manufacturers of iPod and iPhone accessories, such as power connectors and data cables, to pay royalties to Apple—the so-called “Apple Tax.”68 One way to preserve competition at the subsystem and component levels and avoid the “tax” incurred from the use of proprietary interfaces would be to insist that the primes use standard interfaces throughout their system designs. One of the innovations in the F-35 was the development of an open avionics architec-ture. What this innovation meant was that the JSF’s software would not be tied to specific microprocessors. Instead, Lockheed Martin developed a layered ar-chitecture consisting of (1) hardware and operating system, (2) execution middle-ware and (3) functional applications programs. By isolating the microprocessors and operating system from the functional software for aircraft functions such as navigation and air-to-ground weapon delivery, the hardware and operating system could be upgraded without affecting functionality.
67 Gates, letter to Larson, May 25, 2010, p. 2.68 Joel Johnson, “How the ‘Apple Tax’ Boosts Prices on iPod & iPhone Accessories,” Popular
Mechanics, July 10, 2008, at http://www.popularmechanics.com/technology/gadgets/news/4272628?page=1, accessed March 3, 2011).
One of the ways
in which prime
contractors have
been able to put
themselves into
the position of a
monopoly supplier
after source
selection has
been through the
use of proprietary
interfaces at the
sub-system and
component levels.

Sustaining Critical Sectors of the U.S. Defense Industrial Base 33
An extension of this concept would be for the Defense Department to adopt, as widely as possible, standard power, mechanical, data and software interfaces throughout major weapon systems. The analogy would be to the USB (univer-sal serial bus) interface widely used in personal computers and other consumer electronic equipment. These interfaces would make it possible for many ven-dors to compete for subsystems and components, thereby retaining competition throughout the service life of the system.
TImE-CERTAIN ACQUISITION
Another prospective way to improve the efficiency of the U.S. defense industry in the long term would be to provide MDAPs with firm IOC dates and then ruthlessly shed performance requirements or cancel programs that did not adhere to their planned schedules. In 2005, then Acting Deputy Secretary of Defense Gordon England initiated an effort to assess every aspect of DoD acquisition. The as-sessment panel, chaired by retired Air Force Lieutenant General Ronald Kadish, published its findings in January 2006. A key recommendation was that defense acquisition needed to shift to “Time Certain Development” and make schedule a critical factor in balancing tradeoffs between cost and performance. Kadish’s panel suggested a “nominal” six-year timeline “from Milestone A to delivery of the first Operational Acceptable capability to the operating force.”69 Their report also noted that the greatest trade space for programs and the largest risk reduc-tion opportunities exist between Milestone A and Milestone B, and argued that Time Certain Development differs from prior attempts to value time to market, such as evolutionary acquisition and spiral development.70 In 2010 the indepen-dent QDR panel endorsed a similar recommendation. After observing that IOC for the F-15A only took six years (compared to more than fourteen in the case of the F-22), the independent QDR panel argued that, with rare exceptions, “incre-ments of military capability should be defined and designed for delivery within 5 to 7 years with no more than moderate risk.”71
Both Kadish’s 2006 acquisition assessment panel and the 2010 indepen-dent QDR panel, therefore, concluded that imposing time limits on acquisition programs would be a reasonable way to improve efficiency. Nevertheless, two caveats should be noted. First, Peck and Scherer, like Marshall and Meckling be-fore them, were deeply impressed by the uncertainties pervading the schedule, quality, cost and strategic value of military systems.72 Recall that by the early
69 Kadish, et al., Defense Acquisition Performance Assessment Report, p. 50. 70 Kadish, et al., Defense Acquisition Performance Assessment Report, pp. 49–50. 71 Hadley and Perry, The QDR in Perspective, p. 92.72 Peck and Scherer, The Weapons Acquisition Process, p. 323; Marshall and Meckling,
“Predictability of the Costs, Time, and Success of Development,” pp. 21–24.

34 center for strategic and Budgetary Assessments
1960s Snark proved to be the wrong solution for intercontinental nuclear strike despite the money lavished on the program. Second, it has consistently proven extremely difficult to cancel major military acquisition programs once they have become “programs of record” and acquired contractor and Congressional support. Time-certain development is, therefore, a lot easier to recommend than to enforce. For it to succeed, program managers would have to be able to trade some perfor-mance requirements to meet schedule, and the military Services have generally been loath to do so.
LONG-TERm mILITARy UTILITy
Finally, the requirements process is surely an area in which large savings of tax-payer dollars appear possible. Here the rarely asked strategic question is whether the requirement underlying a given Service acquisition program is a “business” in which DoD needs to retain a competitive or dominant position. The predominant tendency of the Services is to concentrate their major acquisition programs on im-proving the ability of existing weaponry to perform traditional missions more ef-ficiently and effectively than in the past. But there are times when militaries, like commercial firms, are confronted with the need to exit a longstanding business because its value or importance is declining. Andy Grove and Gordon Moore’s decision in 1985 to shift Intel’s core business from memory chips to microproces-sors is a commercial example of a corporation that had to exit the very business on which it was founded.73 A possible parallel for the Defense Department in the early twenty-first century is the Marine Corps’ costly investments in the capa-bility to conduct large-scale, contested amphibious assaults. True, the Marine Corps’ doctrinal view is that an opposed amphibious assault is an option of last resort; planners would always prefer to choose times and locations with minimal or no enemy opposition. Nevertheless, the need to be able to project ground pow-er from the sea even in an opposed situation has driven the Marine Corps to opt for costly acquisition programs such as the V-22, Landing Platform Dock (LPD)-17, EFV, and the short takeoff and vertical landing (STOVL) variant of the JSF. All four of these programs have experienced substantial cost growth (Table 1) and schedule slippage. A plausible question, then, is how much should the United States continue investing to retain this long-unused capability?74 After all, the Marine Corps’ last amphibious assault against enemy-held beaches was at Inchon in September 1950. Further, the ongoing proliferation of non-nuclear precision
73 Andrew S. Grove, Only the Paranoid Survive: How To Exploit the Crisis Points That Challenge Every Company (New York: Currency & Doubleday, 1996 & 1999), p. 89.
74 Today the Marine Corps’ one-time amphibious lift capacity is less than two Marine Expeditionary Brigades compared with five in 1980 (Dakota Wood, “Capabilities, Capacities, Costs … and Their Implications,” CSBA, unpublished slides, September 2010, Slide 3).
Time-certain
development
is … a lot easier
to recommend
than to enforce.
For it to succeed,
program managers
would have to
be able to trade
some performance
requirements to
meet schedule, and
the military Services
have generally been
loath to do so.

Sustaining Critical Sectors of the U.S. Defense Industrial Base 35
strike capabilities suggests that, in the not too distant future, the attrition enemy anti-access/area-denial capabilities may be able to inflict on the kind of amphibi-ous assault the Marine Corps practiced as recently as Dawn Blitz in December 2010 could grow too high to bear even with the planned equipment moderniza-tions. The point is not to insist categorically that the Marine Corps needs to move away from this longstanding core business and focus more on some of the other missions it performs, but that the Corps’ acquisition priorities might be far less expensive if it did.
CONTExTUAL CAUTIONS
These three suggestions are neither panaceas nor silver bullets that will neces-sarily wring all the inefficiency out of an acquisition process that has long been “slow, overly complex and incompatible with meeting the needs of multiple, com-peting, departmental demands, in a diverse marketplace.”75 Indeed, given the di-versity of major DoD programs and the rapidly changing security environment, these suggestions may not even be applicable to each and every MDAP. A recur-ring—and legitimate—criticism of the existing acquisition system is that it im-poses “one size fits all” regulatory and procedural processes despite the enormous diversity of major defense programs.76 Nonetheless, facilitating competition be-low the prime contractor level, shifting to time-certain acquisition, and thinking strategically about the long-term value of the Services’ “business” preferences seem like promising places to start in seeking greater efficiency within the ex-isting structure of the U.S. defense industrial base. The pervasive uncertainties endemic to the weapons business and the non-market structure that emerged in the United States during the 1950s mean that waste and inefficiency cannot be eliminated completely.
75 Kadish, et al., Defense Acquisition Performance Assessment Report, p 48.76 Kadish, et al., Defense Acquisition Performance Assessment Report, p 48.
A recurring—and
legitimate—
criticism of the
existing acquisition
system is that it
imposes “one size
fits all” regulatory
and procedural
processes despite
the enormous
diversity of major
defense programs.


The U.S. defense industrial base was a major source of strategic advantage for the United States throughout the Cold War. The dominant performance of the American military in high-intensity combat operations in Iraq in 1991, in Kosovo in 1999, in Afghanistan during 2001–2002, and again in Iraq in 2003, argues that the U.S. defense industry has continued to be a valuable national asset. Given the rise of Chinese military and economic power and the challenging international security environment that has manifested itself since al Qaeda’s September 11, 2001 (9/11) attacks, there seems good reason to agree with Ashton Carter’s recent contention that maintaining a strong, technologically vibrant and financially suc-cessful defense industry in the decades ahead is in the national interest.
Nevertheless, since the emergence of a standing military-industrial- Congressional complex in the 1950s, the U.S. government has shown little inclina-tion to develop—much less to pursue over any period of time—a coherent, long-term strategy for maintaining a healthy, indigenous defense industry. Instead, the Pentagon and the rest of the federal government have embraced a predominantly laissez-faire, hands-off approach. In 1982, Gansler observed that “the United States is the only nation in the world—capitalist or communist—that does not treat its defense industry as a valuable national resource.”77 In 1993, Pentagon officials adopted a hands-off approach to how the U.S. arms industry should re-spond to the downturn in defense spending that followed the end of the Cold War. At a dinner subsequently known as the “Last Supper,” Secretary of Defense Les Aspin, Deputy Secretary William Perry, and Under Secretary for Acquisition and Technology John Deutch explained to the chief executive officers (CEOs) of more
77 Jacques S. Gansler, “Can the Defense Industry Respond to the Reagan Initiatives?” International Security, Spring 1982, p. 117.
cHAPTeR 7 > DOD’S AppROACH TO mANAGING THE U.S. DEFENSE INDUSTRy
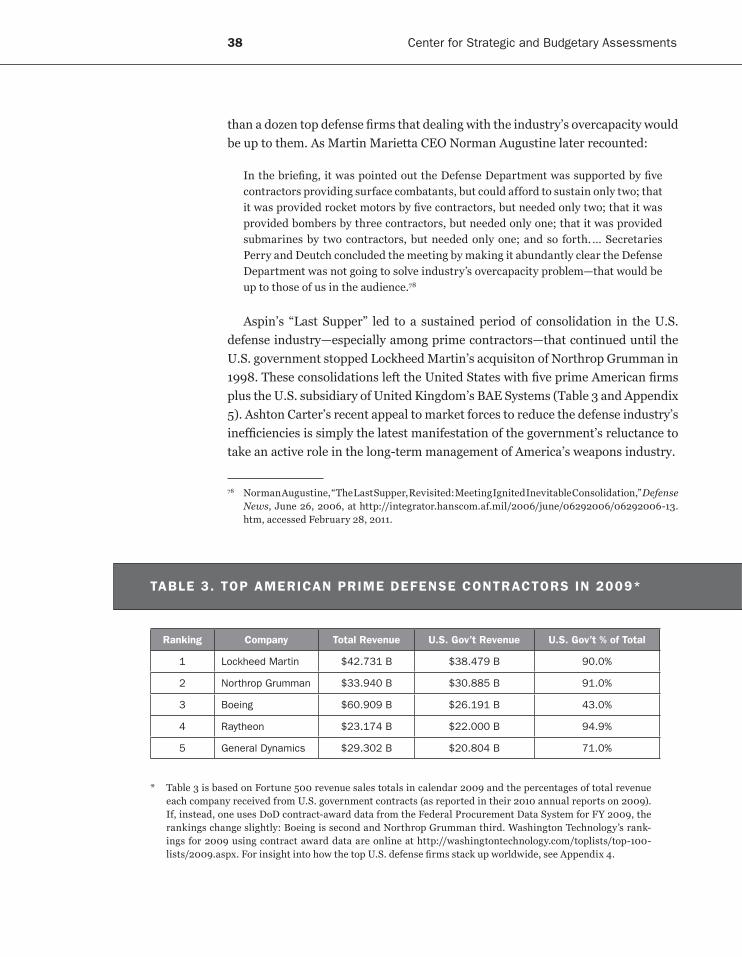
38 center for strategic and Budgetary Assessments
than a dozen top defense firms that dealing with the industry’s overcapacity would be up to them. As Martin Marietta CEO Norman Augustine later recounted:
In the briefing, it was pointed out the Defense Department was supported by five contractors providing surface combatants, but could afford to sustain only two; that it was provided rocket motors by five contractors, but needed only two; that it was provided bombers by three contractors, but needed only one; that it was provided submarines by two contractors, but needed only one; and so forth. … Secretaries Perry and Deutch concluded the meeting by making it abundantly clear the Defense Department was not going to solve industry’s overcapacity problem—that would be up to those of us in the audience.78
Aspin’s “Last Supper” led to a sustained period of consolidation in the U.S. defense industry—especially among prime contractors—that continued until the U.S. government stopped Lockheed Martin’s acquisiton of Northrop Grumman in 1998. These consolidations left the United States with five prime American firms plus the U.S. subsidiary of United Kingdom’s BAE Systems (Table 3 and Appendix 5). Ashton Carter’s recent appeal to market forces to reduce the defense industry’s inefficiencies is simply the latest manifestation of the government’s reluctance to take an active role in the long-term management of America’s weapons industry.
78 Norman Augustine, “The Last Supper, Revisited: Meeting Ignited Inevitable Consolidation,” Defense News, June 26, 2006, at http://integrator.hanscom.af.mil/2006/june/06292006/06292006-13.htm, accessed February 28, 2011.
Ranking Company Total Revenue U.S. Gov’t Revenue U.S. Gov’t % of Total
1 Lockheed Martin $42.731 B $38.479 B 90.0%
2 northrop grumman $33.940 B $30.885 B 91.0%
3 Boeing $60.909 B $26.191 B 43.0%
4 Raytheon $23.174 B $22.000 B 94.9%
5 general Dynamics $29.302 B $20.804 B 71.0%
* Table 3 is based on Fortune 500 revenue sales totals in calendar 2009 and the percentages of total revenue each company received from U.S. government contracts (as reported in their 2010 annual reports on 2009). If, instead, one uses DoD contract-award data from the Federal Procurement Data System for FY 2009, the rankings change slightly: Boeing is second and Northrop Grumman third. Washington Technology’s rank-ings for 2009 using contract award data are online at http://washingtontechnology.com/toplists/top-100-lists/2009.aspx. For insight into how the top U.S. defense firms stack up worldwide, see Appendix 4.
TABLE 3. TOp AmERICAN pRImE DEFENSE CONTRACTORS IN 2009*
Sustaining Critical Sectors of the U.S. Defense Industrial Base 39
How is this longstanding government reluctance to have a long-term strategy for managing the U.S. defense industry to be explained? Even within the defense sector of the U.S. economy there is great reluctance to impose industrial policies that would pick winners and losers. Of course, with every acquisition decision government officials make—from issuing proposal requests to source selection and deciding on the quantities to be procured—the Defense Department is in ef-fect setting industrial policy and influencing the shape, structure, and composi-tion of the defense industry. Moreover, because source selection decisions have been generally made on a program-by-program basis, the effects of each indi-vidual choice on the defense industrial base as a whole are rarely taken into ac-count. Consider, for example, the government’s decision in 2001 to award the JSF program to the same prime contractor that had previously been awarded the F-22 contract in 1991. By giving both fifth-generation fighters to the same firm, the Pentagon certainly sent a message to other primes that it might be decades before they would see another opportunity to develop a state-of-the-art fighter. Given the substantial annual cost of maintaining a design team for advanced fighters, the natural inclination of most companies would be to exit the business, thereby re-ducing the number of qualified competitors the Defense Department could count on in this business area going forward. U.S. defense firms are, after all, for-profit enterprises. They have shareholders or owners who expect them to make money.
How can one explain this continuing reluctance to ensure that the vital sectors of the U.S. defense industry are maintained? The assumption remains widespread in the Pentagon that the defense industrial base will always be there—ready and willing to supply whatever weapons and equipment the military Services need. This assumption, in turn, seems to be based on the view that the defense sector of the U.S. economy operates like a normal free market. As has been argued through-out this report, however, the assumption that the defense sector functions more or less like the rest of the U.S. economy is simply false. Particularly in light of indus-try consolidation since 1993 and the growing pressures for the U.S. defense budget to begin contracting, developing and implementing a coherent, long-term strategy to sustain the vital elements of the defense industry base take on new urgency.
Two examples should suffice to illustrate why the question of strategic man-agement of the defense industrial base has acquired an urgency that it did not have during the Cold War, or even immediately afterwards. In 1997 the United Kingdom initiated a program to develop a nuclear attack submarine (SSN). BAE Systems at the Barrow-in-Furness shipyard was selected to develop and build the Astute class of SSNs. But some five to six years into the program, it became clear that neither BAE Systems nor any other British firm had the requisite de-sign and production skills to build the new submarine. Fortunately, BAE was able to hire General Dynamics (GD) Electric Boat’s Groton shipyard to provide the
With every
acquisition decision
government officials
make—from issuing
proposal requests
to source selection
and deciding on
the quantities to
be procured—the
Defense Department
is in effect setting
industrial policy
and influencing the
shape, structure,
and composition of
the defense industry.

40 center for strategic and Budgetary Assessments
missing skills and expertise.79 With American help, HMS Astute was completed and began sea trials in February 2010. However, by then the cost for the first three Astute-class submarines had reportedly grown from £2 billion to some £3.8 bil-lion, and the first of the class was some four years late.80 If the U.S. military one day found itself in the same position as the British did with the Astute program, it would have few places to turn for help since no allies currently maintain the breadth and depth of capabilities resident in the U.S. defense industry.
Moreover, there are areas in which the U.S. industrial base has already lost certain capabilities. Almost all the hands-on work relating to nuclear weapons development, from initial design to final assembly, is done by private contrac-tors.81 After the Cold War ended Congress began cutting funds for the U.S. nucle-ar stockpile and the Department of Energy gave priority to preserving the design capabilities at Los Alamos and Lawrence Livermore at the expense of the pro-duction plants. The consequences of these decisions are now clear. Of the three nuclear materials found in modern U.S. weapons—uranium, plutonium, and tri-tium—the United States currently has only a limited capability to manufacture uranium and tritium, and the small plutonium capability at Los Alamos would be inadequate if the need arose to replace hundreds of plutonium pits in a short period of time.82 The United States “differs from all other nuclear powers in that we are the only one that does not regularly remanufacture and replace our weap-ons”; all other nuclear powers “believe that the maximum shelf life of a nuclear explosive is in the range of ten to fifteen years.”83 Together, therefore, these two examples suggest that a coherent, long-term strategy for sustaining the vital ele-ments of U.S. defense industrial base is no longer something that can be safely deferred or avoided.
79 By late 2003, GD Electric Boat had received two contracts totaling $52.7 million to provide BAE Systems with “design assistance” for the Astute-class nuclear attack submarine (“General Dynamics Awarded $23 million Contract for UK Astute-Class Submarine Work,” October 23, 2003, at http://www.generaldynamics.com/news/press_releases/2003/October%2023,%202003%20News%20Release.htm, accessed December 31, 2010).
80 Andrew Preston, “Defender of the Realm: Britain’s £1.2bn Submarine—and Typically, We Can’t Afford It …,” MailOnline, last updated March 22, 2010, online at http://www.dailymail.co.uk/home/moslive/article-1258678/Defender-realm-Britains-1-2bn-submarine--typically-afford- .html (accessed December 31, 2010).
81 Stephen M. Younger, The Bomb: A New History (New York: Ecco and HarperCollins, 2009), p. 175.82 Younger, The Bomb, p. 190. 83 Younger, The Bomb, p. 189. See also pp. 91–94, 200, 217–219.

Before turning to the difficult choices about what such a strategy would entail, it is important to recognize that a one-size-fits-all approach to either acquisi-tion strategy or weapons design will not do. Consider, first, weapons design. Engineers create artifacts based on empirical knowledge, and engineers know that any design entails tradeoffs dictated by physical laws.84 For instance, a bomber or commercial airliner designed for very long range cannot offer the ma-neuverability of an air-to-air fighter such as the F-22. Conversely, the F-22 cannot achieve the unrefueled range of a B-52H or a Boeing 777. Similarly, a classic trad-eoff in fighter design concerns top speed. If Mach 2.3 to 2.5 is required, then one or more variable ramps will be needed for each engine inlet to slow the incoming air to provide subsonic flow to the engine’s compressor face. But if a top speed of Mach 1.8 to 1.9 will suffice, the weight, complexity and cost of variable inlets can be eliminated, as was done with the F-16.
Tradeoffs between performance, cost, and schedule confront engineers in every weapons development program. A well-known reality is that, at any state of the engineering art, achieving the last five or ten percentage points of possible performance entails disproportionally large costs. “Some estimate that the last 5 percent of performance often results in a 50 percent cost increase, and therefore a very significant reduction in the quantity of equipment that could be procured
84 There is a “fundamental difference between engineering as the creation of artifacts and science as the pursuit of understanding”—Walter G. Vincenti, What Engineers Know and How They Know It: Analytical Studies from Aeronautical History (Baltimore and London: Johns Hopkins University Press, 1990), p. 112. Vincenti’s basic argument is that engineering is based on “an autonomous body of knowledge, identifiably different from the scientific knowledge with which it interacts” (ibid., pp. 3–4). He offers numerous examples from aeronautical design to prove his thesis.
cHAPTeR 8 > THREE ACQUISITION CASES

42 center for strategic and Budgetary Assessments
for the same money.”85 The three cases that follow examine tradeoffs between cost, schedule and performance in the JSF, MRAP and EELV programs. They also highlight some ways in which decisions that may be best for an individual program may not be in the best interests of the U.S. defense industrial base as a whole.
THE F-35 JOINT STRIkE FIGHTER
As of June 30, 2010, the projected cost of the JSF program had grown since 2002 from $233 billion then-year dollars to over $379 billion, and this cost growth was accompanied by substantial schedule slippage. (In constant FY 2012 dollars, the F-35 program has grown from $214 to $327 billion.86) The F-35 is also not only the most expensive acquisition program in DoD’s current MDAP portfolio, but it is now projected to cost more than double that of the second most expensive pro-gram, ballistic missile defense.87 Once the last F-22s are delivered, the F-35 will be the United States’ only active fifth-generation fighter production line. The Air Force, Navy, and Marine Corps are relying solely on this program for their future strike, interdiction, and close air support capabilities. Because only the Air Force will have a fifth-generation air superiority fighter (the F-22) in service, the Navy and Marine Corps will also depend on the JSF for air-to-air. As a result of all these developments, the Joint Strike Fighter has attracted increasing attention and concern from the military Services, OSD, and Congress.
The JSF—formerly the Joint Advanced Strike Technology (JAST)—grew out of a series of programs in the late 1980s and early 1990s to develop advanced tactical aircraft for the Air Force, Navy, Marine Corps and close U.S. allies.88 The program was launched in October 1993 by defense secretary Les Aspin’s Bottom-Up Review (BUR). JAST originally focused on “developing common compo-nents—such as engines, avionics, materials, and munitions—that could be used in any future combat aircraft the nation decide[d] to build.”89 Currently the JSF
85 Gansler, The Defense Industry, p. 79. During the Cold War, Soviet plutonium (Pu-239) was sub-stantially more expensive than that produced in the United States because the Soviets continued reprocessing the “tails” from breeder reactors until they contained only two hundred parts per million of Pu-239 (o.02 percent), whereas the American stopped at 2 percent (Thomas Reed, At the Abyss: An Insider’s History of the Cold War (New York: Random House, 2004) pp. 223–224).
86 DoD, OUSD(AT&L) ARA/AM, “Selected Acquisition Report (SAR) Summary Tables: As of Date: December 31, 2010,” April 15 2011, p. 12.
87 DoD, OUSD(AT&L) ARA/AM, “Selected Acquisition Report (SAR) Summary Tables: As of Date: June 30, 2010,” August 12 2010, pp. 3–6.
88 For brief summaries of the various programs that led to JAST/JSF, see “History” at http://www.jsf.mil/history/his_prejast.htm, accessed March 2, 2011.
89 Les Aspin, Report of the Bottom-Up Review, DoD, October 1993, p. iv. The Bottom-Up Review terminated the Advanced-Attack (A-X)—later renamed the Advanced/Fighter-Attack (A/F-X) program—and Multi-Role Fighter programs, substituting JAST in their place. A core of the A/F-X personnel performed a large portion of the working-level planning and definition for the JAST program (“History” at http://www.jsf.mil/history/his_prejast.htm).

Sustaining Critical Sectors of the U.S. Defense Industrial Base 43
program is developing three variants for a range of U.S. and foreign customers: the CTOL (conventional takeoff and landing) F-35A, the STOVL (short take-off and vertical landing) F-35B, and the F-35C carrier variant. The program’s website states that it aims to fulfill the following requirements:
>> Provide the U.S. Navy with a first-day-of-war, survivable strike fighter to com-plement the F/A-18E/F;
>> Provide the U.S. Air Force with a primarily air-to-ground multi-role aircraft to replace the F-16 and A-10 and complement the F-22;
>> Provide the U.S. Marine Corps with a supersonic STOVL aircraft to replace its AV-8Bs and F/A-18s as the Corps’ only strike fighter;
>> Replace the Royal Air Force’s STOVL GR.7/9s (although the United Kingdom recently canceled its planned buy of 138 F-35Bs in favor of switching to F-35Cs); and
>> Offer JSF variants to other allied participants (currently Canada, Australia, Italy, Norway, Demark, the Netherlands, and Turkey).90
In October 2001, when Lockheed Martin was selected over Boeing to develop and produce the F-35, the program was being touted as a way of reducing fly-away and life-cycle costs. Ostensibly, the JSF was intended to be a “design to cost” program with recurring flyaway unit cost targets of $38 million for the CTOL variant, $40 to $48 million for the STOVL version and $42 to $51 million for the CV (all in constant-year FY 2011 dollars).91 Interestingly, nearly a decade later, the program’s web site continues to assert that the “focus of the program is afford-ability—reducing the development cost, production cost, and cost of ownership.”92
Of course, keeping affordability as first priority meant that if costs began ris-ing, tradeoffs would have to be made in performance, schedule or both. But as JSF costs did begin to rise, the schedule also began slipping without appreciable cost containment. One source of cost overruns has been development of the STOVL variant, which is now on a two-year probation; but other sources have included degradation in commonality, higher labor and overhead rates and, most recently, “a combination of unforeseen engineering changes and other factors [that] went
90 “Program” at http://www.jsf.mil/program/, accessed March 2, 2011.91 DoD, “JSF Cost History,” Cost Integrated Product Team (IPT) Brief, September 2001, slide 3.92 “Program” at http://www.jsf.mil/program/.

44 center for strategic and Budgetary Assessments
unacknowledged and virtually unmanaged for two years.”93 In addition, like most other modern weapons developments, software has contributed to cost growth. JSF software has already grown to nearly 7 million lines of code as compared with only 1.1 million in the F/A-18E/F and 2.2 million in the F-22.94
However, the structure of the program has largely precluded significant per-formance tradeoffs to reign in cost growth. The original idea of a joint program was to drive down unit costs through a large production run coupled with a high degree of commonality across the three F-35 variants. In 2002, the production quantity initially envisioned was over 2,866 aircraft (now reduced to 2,457). But this structure had the unforeseen consequence of giving the individual partic-ipants the leverage to hold out for their desired performance requirements in order to retain their participation. The result—which should have been predict-able—is that the program’s foremost priority has gradually shifted from afford-ability to performance.
DoD’s management of the JSF program has also had some questionable effects on overall health of the U.S. defense industry. Whether or not the BUR’s deci-sion to combine the Advanced/Fighter-Attack (A/F-X) and Multi-Role Fighter programs into a single joint program and involve foreign customers early in the process was part of a coordinated strategy, the net effect has been to narrow the Defense Department’s options for replacing aging fourth-generation fighters such as the F-16, F/A-18A/B/C/D, A-10, AV-8B, and F-15E. Subsequently, the decisions to down-select to a single prime contractor—in this case to the same company that won the F-22—and to end production of the F-22 have led to a narrowing of the nation’s industrial capacity in this sector. True, Boeing maintains production lines for the F/A-18E/F/G as well as for the F-15E, and Lockheed Martin may be able to keep the F-16 production line open a few more years in response to foreign demand. However, these decisions have limited the Defense Department’s op-tions for similar acquisitions in the future to just one or two prime contractors, thereby limiting competition.
93 Bill Sweetman, “JSF—Talking Real Money,” Ares—A Defense Technology Blog, Aviation Week, April 3, 2010, at http://www.aviationweek.com/aw/blogs/defense/index.jsp?plckController= Blog&plckBlogPage=BlogViewPost&newspaperUserId=27ec4a53-dcc8-42d0-bd3a-01329aef79a7&plckPostId=Blog%3a27ec4a53-dcc8-42d0-bd3a-01329aef79a7Post%3ab2c55-873-f236-4887-889e-311f590ae4a0&plckScript=blogScript&plckElementId=blogDest; and “JSF in the Dock,” Ares—A Defense Technology Blog, April 11, 2010, at http://www.aviationweek.com/aw/blogs/defense/index.jsp?plckController=Blog&plckScript=blogScript&plckElementId=blogDest&plckBlogPage=BlogViewPost&plckPostId=Blog%3A27ec4a53-dcc8-42d0-bd3a-01329aef-79a7Post%3A795b3327-f99e-432d-987d-76ea0bae7dc9, both accessed March 2, 2011.
94 GAO, “Joint Strike Fighter: Accelerating Procurement before Completing Development Increases the Government’s Risk,” GAO-09-303, March 2009, p. 10. By the end of F-35 development, the software projected to be around 9 million lines of code.

Sustaining Critical Sectors of the U.S. Defense Industrial Base 45
THE EvOLvED ExpENDABLE LAUNCH vEHICLE
Like the JSF, the Evolved Expendable Launch Vehicle program began in 1995 with an emphasis on cost. The early goals were to reduce launch costs by at least 25 percent, assure access to space, and preserve the United States’ industrial base for space launch.95 Four companies, Lockheed Martin, Boeing, McDonnell Douglas, and Alliant Techsystems, were awarded contracts in 1995 to complete preliminary system designs. In December 1996 DoD selected McDonnell Douglas (later acquired by Boeing) and Lockheed Martin to continue design activities for an additional eighteen months, after which DoD planned to down-select to a sin-gle company. After some debate, the Office of the Secretary of Defense decided in November 1997 to continue with the two competing rockets instead of having a down-select. Its stated reasons at the time were to reduce costs over the life of the program, to encourage innovation, and to leverage the benefits of what was pro-jected to be a booming commercial market for space launch.96 Instead of award-ing just one contract to finish development, the Air Force awarded two contracts worth $500 million each. Simultaneously, it awarded firm fixed-price contracts for the first twenty-eight launch vehicles (known as Buy I), with nineteen going to Boeing and nine going to Lockheed Martin for a combined value of $2.03 billion.97
By 2003 it became clear that the commercial demand for space launch was not materializing as had been projected, and both contractor teams informed the government that they could not provide launch services for the contracted price. The Air Force renegotiated with the two contractors, and in December 2003 re-ported a Nunn-McCurdy breach for the program. The total cost of the program increased nearly 90 percent, or some $15 billion in FY 2011 dollars.98
In 2005, under continuing pressure to contain costs, Lockheed Martin and Boeing proposed merging their space-launch businesses. The companies argued that maintaining two separate launch providers created redundancies in their organizations and that merging the two operations could lead to substantial cost savings. This position was, of course, contrary to what the EELV program of-fice had argued in 1997 when it decided against down-selecting to one company.
95 GAO, “Access to Space: Issues Associated With DOD’s Evolved Expendable Launch Vehicle Program,” GAO/NSIAD-97-130, June 1997, pp. 1–2, at http://www.gao.gov/archive/1997/ns97130.pdf, accessed March 3, 2011.
96 GAO, “Space Acquisitions: Uncertainties in the Evolved Expendable Launch Vehicle Program Pose Management and Oversight Challenges,” GAO-08-1039, September 2008, p. 6.
97 It was later discovered that Boeing improperly possessed Lockheed Martin proprietary documents at the time of the competition. The Air Force suspended the Boeing units involved and removed seven of the launches from Boeing’s contract and awarded them to Lockheed. See Kerry Gildea, “Air Force Hands Boeing Stiff Penalty For EELV, Increases Lockheed Martin Launches,” Defense Daily, July 25, 2003, at http://findarticles.com/p/articles/mi_6712/is_18_219/ai_n29022293/, accessed March 3, 2011.
98 DoD, OUSD(AT&L) ARA&A/AM, “Selected Acquisition Report (SAR) Summary Tables, As of Date: December 31, 2003,” April 2, 2004, pp. 5, 7.

46 center for strategic and Budgetary Assessments
The joint venture, known as the United Launch Alliance (ULA), was eventually approved, although the Federal Trade Commission noted that it would cause “reduced competition.”99
A newcomer to the space launch industry also emerged during this time pe-riod. Space Exploration Technologies (SpaceX) was established in 2002 by Elon Musk, the billionaire founder of PayPal. SpaceX’s goal was to reduce the cost of ac-cess to space for private as well as government customers. SpaceX sued Lockheed Martin and Boeing over the ULA merger, claiming in court filings that the pro-posed merger was an “unlawful conspiracy to eliminate competition in, and ulti-mately to monopolize, the government space launch system and prevent SpaceX and other potential new entrants from competing in that business.”100 The suit was eventually dismissed on the grounds that SpaceX was “not yet ready to com-pete” against the ULA since it had not had a successful launch.101 In September of 2008, SpaceX’s Falcon 1 launch vehicle became the first privately developed liquid-fueled rocket to achieve earth orbit. SpaceX has since had two additional launches, including the first launch of its Falcon 9 launch vehicle, which is sized to compete with the lower end of the EELV market. According to SpaceX, the Falcon 9 can deliver up to 4,680 kilograms (kg) to geosynchronous transfer or-bit (GTO) at an advertised price of $56 million102 compared to 4,210 kg to GTO for a Boeing Delta IV Medium with a reported price of over $130 million.103 (In December 2010, a second Falcon 9 launched from Cape Canaveral, successfully deploying a Dragon spacecraft and a cache of small CubeSats.104)
In 2006, Kenneth Krieg, then Undersecretary of Defense for Acquisition, Technology, and Logistics, defended the merger of Boeing and Lockheed’s EELV business units. He acknowledged that the creation of the ULA would “almost cer-tainly have an adverse effect on competition, including higher prices over the long term, as well as a diminution in innovation and responsiveness,” contrary to
99 FTC Press Report, “FTC Intervenes in Formation of ULA Joint Venture by Boeing and Lockheed Martin,” October 3, 2006.
100 Brian Berger, “SpaceX Sues Boeing and Lockheed Martin,” Space News, October 21, 2005, at http://www.space.com/1701-spacex-sues-boeing-lockheed-martin.html, accessed March 4, 2011.
101 Michael Sirak, “US Federal Court Dismisses Space X Lawsuit against Boeing and Lockheed Martin,” Defense Daily, February 22, 2006, at http://findarticles.com/p/articles/mi_6712/is_34_229/ai_n29251382/, accessed December 31, 2010.
102 According to a Falcon 9 price and performance data sheet, at http://www.spacex.com/falcon9.php#pricing_and_performance., accessed December 31, 2010.
103 According to the Delta IV Medium information page of Encyclopedia Astronautica, accessed at: http://www.astronautix.com/lvs/deledium.htm, accessed December 31, 2010.
104 Stephen Clark, “Musk ‘Optimistic’ Next Dragon Flight Will Visit Space Station,” Spaceflight Now, December 9, 2010, at http://spaceflightnow.com/falcon9/002/status.html, accessed March 3, 2011. The Dragon spacecraft was recovered in the Pacific after two orbits.

Sustaining Critical Sectors of the U.S. Defense Industrial Base 47
the original goals of the EELV program.105 Nevertheless, Krieg argued that DoD now had higher priorities than cost:
The current and future commercial launch market, including the inability of U.S. firms to compete against foreign firms coupled with the low number of national security launches, makes it extremely difficult for two competing U.S. providers to maintain separate, competing, experienced workforces. ULA will offer two distinct families of launch vehicles with a single, more efficient workforce, thereby enhanc-ing assured access to space. Launch presents significant risk to a payload, and fifty years of launch experience teaches that risk is reduced when the launch is supported by an experienced workforce with recent launch experience. The single ULA work-force will benefit from a launch tempo, defined as the number of booster cores built in the assembly line and launched per year, that would be greater than could be expected for either of the two competing workforces.106
Reliable access to orbit, not reduced launch costs, had now become the overriding consideration.107 Krieg also suggested that the ULA merger would “infuse each launch vehicle design with the technical improvements and innovation of its for-mer competitor” and maintained that the short-term cost savings from having only one workforce were “attractive.”108
The EELV case study provides sobering lessons about the uncertainties inher-ent in major acquisition programs. DoD attempted to manage the launch segment of the U.S. industrial base proactively by splitting the buy between two companies, both to foster long-term competition and to ensure sufficient industrial capacity would be available to meet the future needs of the Defense Department. But this approach was predicated on a robust commercial demand for space launch, and when the commercial market did not materialize as planned, costs soared. In the wake of the Nunn-McCurdy breach in 2003 and the proposed merger of the two launch providers in 2005, DoD abruptly changed its strategy and insisted that the foremost priority for the program was reliability, not cost, and competition was no longer desired. In the meantime, a new competitor, SpaceX, entered the space launch industry, independent of DoD funding, potentially offering an alternative launch vehicle with lower launch costs.
105 Kenneth J. Krieg, Letter to Deborah Platt Majoras, Chairman of the Federal Trade Commission, August 15, 2006, p. 1, at http://www.ftc.gov/os/caselist/0510165/0510165dodletterkriegtomajoras. pdf, accessed January 3, 2011.
106 Krieg, Letter to Majoras, p. 3.107 Krieg, Letter to Majoras, p. 4.108 Krieg, Letter to Majoras, pp. 1, 3.
DoD attempted
to manage the
launch segment of
the U.S. industrial
base proactively
by splitting the
buy between two
companies, both
to foster long-
term competition
and to ensure
sufficient industrial
capacity would be
available to meet
the future needs
of the Defense
Department.

48 center for strategic and Budgetary Assessments
THE mINE RESISTANT AmBUSH pROTECTED vEHICLE
In February 2005, less than two years after the United States overthrew Saddam Hussein’s regime in Iraq, the Marine Corps identified an urgent operational need (UON) for 1,169 armored tactical vehicles to protect troops against Improvised Explosive Devices (IEDs), rocket-propelled grenades, and small arms fire.109 Given the threat at the time, the initial response to this need could be satisfied with an up-armored M1114 high-mobility multi-purpose wheeled vehicle (HMMWV). However, as the threat evolved over the next eighteen months, it became clear that a more robust solution than an up-armored HMMWV was needed: by 2008, 75 percent of all casualties in Iraq and Afghanistan were due to IEDs and the quan-tity envisioned had expanded to 15,838 vehicles for the military Services.110 In the meantime, in February 2007, the Assistant Secretary of the Navy for research, de-velopment and acquisition approved MRAP as a rapid acquisition program and, in September 2007, the Under Secretary of Defense for acquisition, technology and logistics designated it a major defense acquisition program.111
While it took two years for a program to be initiated after the UON was writ-ten, once MRAP was underway it took less than nine months to produce the 1,169 vehicles initially requested. By March 2008, thirteen months after the program was initiated, nearly 7,000 vehicles had been produced, and by July 2009 the number had climbed to over 16,000.112 But the success of the MRAP program in achieving its main goal—rapid fielding to reduce IED casualties—was in large part because it was not a typical DoD acquisition program. MRAP was desig-nated a rapid acquisition program from the start; the program office was allowed to contract for multiple variants from multiple vendors in order to get vehicles to the field in quantity as quickly as possible, and the program enjoyed high-level attention and support from the outset.
MRAP’s early designation as a rapid acquisition enabled the program office to waive the normal acquisition and contracting rules and regulations.113 This meant that the program could proceed without the normal series of reviews and milestone approvals that are part of the DoD acquisition process (Figure 4) and could begin procuring vehicles in production quantities concurrent with testing. While this saved time, it also created a great deal of risk because it was possible
109 GAO, “Rapid Acquisition of Mine Resistant Ambush Protected Vehicles,” GAO-08-884R, July 15, 2008, pp. 2, 3, at http://www.gao.gov/new.items/d08884r.pdf, accessed March 5, 2011.
110 GAO, “Rapid Acquisition of Mine Resistant Ambush Protected Vehicles,” pp. 1, 3.111 GAO, “Rapid Acquisition of Mine Resistant Ambush Protected Vehicles,” p. 3.112 Michael J. Sullivan, “Defense Acquisitions: Rapid Acquisition of MRAP Vehicles,” GAO-10-155T,
October 8, 2009, p. 1, at http://www.gao.gov/new.items/d10155t.pdf, accessed December 31, 2010.113 Public Law 108-375, “The Ronald Reagan National Defense Authorization Act for Fiscal Year
2005,” October 28, 2004, Title VIII, Subtitle B, Section 811.

Sustaining Critical Sectors of the U.S. Defense Industrial Base 49
that testing would uncover a substantial design flaw that would render the initial vehicles produced unusable. The program office attempted to mitigate this risk by minimizing government-unique requirements and relying heavily on commercial- off-the-shelf components. In the end, some design issues were discovered during testing that necessitated design changes and post-production fixes, but none of them substantially slowed production.114
In addition to being a rapid acquisition, the MRAP program differed from tra-ditional acquisitions in that it contracted with multiple vendors to build differ-ent designs of several variants of the vehicle simultaneously. Nine vendors were initially awarded indefinite delivery, indefinite quantity contracts to produce ve-hicles. Ultimately, five vendors received the bulk of the orders, including one com-pany that was new to mass vehicle production for the military. The program office ordered three different variants of the MRAP, known as Category I, II and III vehicles, from each of the vendors. Mission-essential equipment for the vehicles, such as radios and sensors, were provided separately as government-furnished equipment. Together, these factors led to a high degree of complexity in vehicle integration: the designs of each variant produced by each vendor differed, and the mission equipment installed on them differed by the Service or command re-ceiving the vehicle. Ultimately, this meant that twenty-seven different major con-figurations of MRAPs were being fielded simultaneously.115 Nevertheless, MRAP did not pose technological or engineering challenges comparable to those of the JSF or other advanced technology MDAPs.
The MRAP program also differed from traditional acquisitions in that it gar-nered a significant degree of high-level attention and oversight. In May 2007, Secretary Gates named the MRAP as DoD’s “single most important acquisition program.”116 He also used the powers of the Defense Production Act to give the MRAP program a DX rating, which meant that contracts had to be “accepted and performed on a priority basis over other contracts without this rating.”117 The Secretary of the Army also waived restrictions to expand the countries from which armor plate steel could be sourced.118 Lastly, the program received a high level of attention in Congress, which held numerous hearings and gave the pro-gram quick funding through the supplemental appropriations process.
The MRAP case study provides several valuable lessons in managing the industrial base. First, DoD was able to rapidly ramp up production of a new vehicle and expand its industrial capacity within months because it was will-ing to relax military-unique requirements and allow companies to use more
114 Sullivan, “Defense Acquisitions: Rapid Acquisition of MRAP Vehicles,” pp. 10–11.115 Sullivan, “Defense Acquisitions: Rapid Acquisition of MRAP Vehicles,” pp. 5–8.116 Sullivan, “Defense Acquisitions: Rapid Acquisition of MRAP Vehicles,” p. 1.117 Sullivan, “Defense Acquisitions: Rapid Acquisition of MRAP Vehicles,” p. 4.118 Sullivan, “Defense Acquisitions: Rapid Acquisition of MRAP Vehicles,” p. 4.

50 center for strategic and Budgetary Assessments
commercial-off-the-shelf components. DoD was also willing to make direct in-vestments in key areas of industry, such as steel and tire production, to prevent bottlenecks from occurring. As a result, the total cost of the program is now over $36 billion for nearly 22,882 vehicles, or an average cost of $1.59 million per vehicle (in FY 2011 dollars).119 The MRAP example shows that acquisitions can be quick if requirements are relaxed and significant funding is available. But it should also be noted that MRAP vehicles have considerable commonality with the commercial trucks and construction equipment. Hence the industrial capac-ity that would normally have been used for commercial products could be quickly redirected to military production. This ability to rapidly ramp up production is not found in many other areas of the defense industrial base such as nuclear submarines or fifth-generation fighters.
The other instructive lesson from the MRAP case study is DoD’s role as sys-tems integrator. Because each vendor was allowed to use their own designs and their own off-the-shelf components, more companies were able to enter the com-petition. It also sped up deliveries to the fielded forces because companies did not have to retool or redesign as much as they would have if DoD had selected a single design for all vendors to build. The decision to use multiple designs from multiple vendors greatly increased integration complexity and risk, but in the end this added complexity did not prove insurmountable. Perhaps the most impressive success of the MRAP story is that DoD managed this integration challenge on its own using government personnel and facilities at the Space and Naval Warfare Center (SPAWAR) in Charleston, South Carolina. Twenty-five integration lines were established with a projected capability of integrating one thousand vehicles per month—a figure that was exceeded in April 2008 when 1,157 vehicles were successfully integrated.120
119 DoD, “Selected Acquisition Report (SAR) Summary Tables, As of Date: June 30, 2010,” August 12, 2010, p. 4. In the case of MRAP, SAR data do not provide the desired resolution on unit costs. Because there are three classes of MRAP vehicles, and because each one is significantly different, one would prefer to see the average unit price for each of the classes. Available SAR data do not provide this level of detail.
120 Sullivan, “Defense Acquisitions: Rapid Acquisition of MRAP Vehicles,” p. 8.
Perhaps the most
impressive success
of the MRAP story is
that DoD managed
this integration
challenge on its own
using government
personnel and
facilities at the
Space and Naval
Warfare Center
(SPAWAR) in
Charleston, South
Carolina.

The foremost implication of the three programs just reviewed is that the gov-ernment customer and regulator, not the market forces of supply and demand, determine the relative priority given to cost, schedule and performance in major defense acquisitions. The government rightly determines whether cost, sched-ule or performance is to be accorded highest priority. Further, since the circum-stances behind the initial prioritization among performance, schedule and cost can change over time, acquisition authorities may alter the prioritization as the program evolves, as occurred with both the JSF and EELV. The JSF program is particularly instructive regarding the tendency of performance to take priority over cost and schedule despite early intentions to emphasize cost.
These observations should put to rest once and for all the recurring inclination to presume that the U.S. defense industry functions even remotely like normal free market. They also argue that a long-term strategy for sustaining key sec-tors of the U.S. defense industrial base cannot be a one-size-fits-all approach. Consider, for example, the vastly different engineering challenges that con-fronted the MRAP and JSF programs. The fundamental challenge in the case of MRAP was to adopt a shape for the vehicle’s bottom that would defect the blast of an IED. Compare that modest design challenge with those of designing a super-sonic STOVL JSF variant and packing it in a low-observable airframe. The vast range of uncertainty across programs as technically diverse as MRAP and JSF alone argues against a one-size-fits-all approach, despite the extent to which the accretion over time of incrementally modified DoD acquisition regulations and Congressional statutes push the acquisition system in this direction. Next there is the annual uncertainty of Congressional funding, to include whether Congress will pass a defense authorization bill on time or resort to continuing resolutions for a significant portion of the fiscal year. When the broader uncertainties of the ultimate military utility of any weapon system and the externalities imposed
cHAPTeR 9 > SUSTAINING THE vITAL SECTORS OF THE DEFENSE INDUSTRIAL BASE
The government
customer and
regulator, not the
market forces of
supply and demand,
determine the
relative priority given
to cost, schedule
and performance
in major defense
acquisitions.

52 center for strategic and Budgetary Assessments
by changes in the international security environment are considered, any long-term strategy for preserving the vital sectors of the defense industrial base would have to offer a high degree of flexibility to address each sector on its own terms. Uncertainty at multiple levels is an inherent feature of defense acquisition. As RAND economists concluded in the late 1950s, research and development (R&D) in particular “is characterized by uncertainty or unpredictability at every stage, and R&D should be understood as “a process of discovery” rather than a method of procurement.121 Thus, any viable strategy for preserving the vital sectors of the U.S. defense industrial base must be able to accommodate the vast uncertainties that affect both R&D as well as procurement.
What might such a strategy look like? More importantly, what first-order choic-es would such a strategy need to make about which sectors of the defense indus-trial base truly merit preservation in the decades ahead? The business strategist Richard Rumelt argues that good strategies have three essential elements: “(1) A diagnosis that defines or explains the nature of the challenge … (2) A guiding-policy for dealing with the challenge … (3) A set of coherent actions that are designed to carry out the guiding-policy.”122 The validity of Rumelt’s framework is easy to confirm. Consider what is usually termed the “strategy of contain-ment” that the United States pursued against the Soviet Union during the Cold War. While George Kennan is rightly credited with conceiving this “strategy,” it was clearly preceded by an insightful diagnosis of the nature of Soviet power, starting with Kennan’s long telegraph to Secretary of State James F. Byrnes in February 1946 and articulated publicly in his July 1947 Foreign Affairs article, “The Sources of Soviet Conduct.”123 The essential insight in Kennan’s diagnosis was that the Soviet system contained “within it the seeds of its own destruction,” and that the sprouting of these seeds was “well advanced.” Containment, then, was not a complete strategy but the guiding policy for American conduct vis-à-vis the Soviet Union that emerged from Kennan’s diagnosis of the challenge that the Soviet state posed for the United States and the West after 1945. As for the set of coherent actions that implemented this guiding policy over a period of some four decades, they ranged from the establishment of Strategic Air Command in 1946 and the European Recovery Program (the “Marshall Plan”) in 1947 to Dwight
121 B. H. Klein, W. H. Meckling and E. G. Mesthene, “Military Research and Development Policies,” RAND R-333, December 4, 1958, pp. 1–2. This paper was one product of a multi-year study of military R&D by members of RAND’s economics department. In 1961, Burton Klein succeeded Charles Hitch as the head of RAND’s economics department.
122 Richard P. Rumelt, Good Strategy/Bad Strategy: The Difference and Why It Matters (New York: Crown Business, 2011) p. 77, emphasis in the original.
123 The abstract to Kennan’s “The Sources of Soviet Conduct,” which he published under the pseud-onym X in the July 1947 issue of Foreign Affairs, offered this diagnosis: “Soviet pressure against the free institutions of the Western world is something that can be contained by the adroit and vigilant application of counterforce at a series of constantly shifting geographical and political points, corresponding to the shifts and maneuvers of Soviet policy, but which cannot be charmed or talked out of existence.”

Sustaining Critical Sectors of the U.S. Defense Industrial Base 53
Eisenhower’s reliance on massive nuclear retaliation as part of his administra-tion’s New Look, Ronald Reagan’s defense build-up in the early 1980s, and the U.S. response to the Soviet invasion of Afghanistan.
Adopting Rumelt’s framework, the requisite diagnosis is straightforward enough. The United States has not pursued an overall strategy for preserving its defense industrial base ever since the emergence in the 1950s of a standing, peacetime defense industry in which for-profit firms developed and produced most weaponry. Since the Cold War ended, one of the very few sectors of the U.S. defense industrial base that has been consciously downsized by the responsible government decision-makers with an eye toward reducing production capacity to a sustainable level while preserving critical design and production capabili-ties is the Naval Nuclear Propulsion program (also known as Naval Reactors).124 However, because Presidential Executive Order 12344 in 1982 and subsequent public laws give the Director of Naval Reactors cradle-to-grave authority over nuclear propulsion for the U.S. Navy, this case appears to be a rare exception.125 Elsewhere in the U.S. defense industry, the fragmentation of control among di-verse stakeholders has made it much more difficult for the government to imple-ment a long-term strategy for sustaining other critical segments of the industrial base. Insofar as government decision-makers have thought about the need for an overarching strategy at all, the predominant inclination has been to hope that Adam Smith’s invisible hand would somehow preserve whatever industrial seg-ments or capabilities the military Services might one day need. But in light of the fiscal austerity likely to constrain U.S. spending on national security in the years ahead and the growing complexities and dangers in the nation’s security environment, a long-term strategy seems imperative if the vital sectors of the de-fense industry are to be preserved. The simple truth is that for-profit U.S. defense companies are not at all likely to preserve the capabilities the military Services will need in areas where they have no business interest. If the vital sectors are to be maintained, the U.S. government will need to develop and implement a comprehensive industrial strategy of some sort.
124 Stanley R. Szemborski, telephone interview, March 14, 2011. After production of the Los Angeles-class nuclear attack submarines (SSNs) ended in 1996, the Director of Naval Reactors began work-ing with industry to resize the portion of the defense industrial base involved in naval reactors to the reduced demand. Szemborski is a retired vice admiral. Among other assignments during his U.S. Navy career, he commanded the nuclear attack submarine USS Chicago (SSN 721) on its first western Pacific deployment with a tactically loaded vertically launched Tomahawk missile system.
125 The provisions of Executive Order 12344 were later incorporated into Public Laws 98-525 in 1984 and 106-65 in 1999 (Admiral Frank L. “Skip” Bowman, “Statement before the House Committee on Science, October 29, 2003, at http://www.navy.mil/navydata/testimony/safety/bowman031029.txt). The Director of Naval Reactors, who serves an eight-year term, has decision-making au-thority on naval nuclear propulsion both within the Navy as a four-star admiral and within the Department of Energy’s National Nuclear Security Administration as Deputy Administrator.
Insofar as
government decision-
makers have thought
about the need
for an overarching
strategy at all,
the predominant
inclination has been
to hope that Adam
Smith’s invisible hand
would somehow
preserve whatever
industrial segments
or capabilities the
military Services
might one day need.

54 center for strategic and Budgetary Assessments
What might be a sensible guiding policy for sustaining the U.S. defense in-dustrial base as a national asset and enduring source of advantage? Given the preceding diagnosis, the logical suggestion would be to implement a strategy:
To ensure the preservation of those few sectors that are currently critical to American national security, adding over time any emerging sectors that become critical, and ruthlessly under funding or jettisoning any sectors that cease to be critical.
The guiding policy, then, would be the adaptive sustainment of those elements of the defense industrial base that are judged truly important.
The first point to be made about this broad policy is that of the perhaps two or three dozen sectors into which the defense industrial base can be logically segmented, the number of strategically “critical” sectors cannot exceed five to seven. Good strategy is always about choice—in this case favoring the genuinely vital sectors of the defense industry while, more importantly, neglecting or ig-noring the rest. An industrial-base “strategy” that seeks to preserve every sector deemed desirable by any of the war-fighting communities across the four military Services, the prime defense contractors or their Congressional allies is not in fact a strategy and will not succeed. Indeed, even within the truly critical sectors, not every design or production capability will merit preservation. The sine qua non of the proposed guiding policy, then, is the imperative to make hard choices. Which five, or six, or seven sectors of the U.S. defense industrial base are truly critical to national security, and which elements within those sectors are themselves im-portant enough to justify preservation? This is the essential question that must be answered to underpin the development and implementation of a coherent set of actions aimed at preserving the U.S. defense industrial base.
The question of which sectors and sector components to preserve is also the most difficult because it entails identifying Service and Congressional sacred cows that, like horse cavalry in the 1930s, need to be put out to pasture. It is also the question that brought the strategy review Andrew W. Marshall’s Office of Net Assessment (ONA) undertook for defense secretary Donald Rumsfeld in early 2001 to an abrupt halt. Marshall’s initial inclination at the time was to suggest that U.S. defense strategy should be focused on maintaining significant margins of advantage in a handful of areas judged critical to the United States’ military position. The areas could be either ones that were currently important, such as non-nuclear precision strike, or emerging areas of competition, such as robotics, that appeared likely to become critical. Marshall realized that a portfolio large enough to include every sacred cow of the four military Services contained far too many areas of military competition to be strategically useful or permit pref-erential investment in the really important areas. But as successive drafts of the strategy review circulated to a wider and wider audience within the Pentagon, clamor grew for an example of a portfolio of critical areas to preserve. ONA
An industrial-base
“strategy” that seeks
to preserve every
sector deemed
desirable by any
of the war-fighting
communities across
the four military
Services, the prime
defense contractors
or their Congressional
allies is not in fact a
strategy and will not
succeed.

Sustaining Critical Sectors of the U.S. Defense Industrial Base 55
eventually complied by including the following list of candidates in a version of the strategy review:
1. long-range, non-nuclear precision strike,
2. air-to-air (or, more broadly, air dominance of enemy air defenses),
3. undersea warfare,
4. orbital space,
5. robotics, and
6. realistic combat training.
It did not take the U.S. Army’s chief of staff, General Eric Shinseki, long to ob-ject strenuously that heavy armored and mechanized ground forces were missing from the candidate portfolio. As these sorts of objections multiplied, the essential thrust behind the concept of maintaining or increasing U.S. advantages in a small number of critical areas of enduring military competition was quickly lost.
The question of exactly which areas of the U.S. industrial base will be critical to American security in coming decades is one that the Department of Defense, Congress, and the defense industry itself have, understandably, been reluctant to confront. But if a coherent set of actions aimed at implementing the guiding policy stated above are to be developed and implemented, it is a question that will have to be answered, and sooner rather than later if the U.S. military is to avoid one day finding itself in the same position as the Royal Navy did with its Astute-class submarine development.
Given the extreme reluctance of all concerned to make the hard choices about which elements of the U.S. defense industrial base warrant preservation in the national interest, there seems little to be gained by trying to spell out a long list of potential implementing actions for the guiding policy. But to offer one mod-est suggestion, the Defense Department will have to find ways to make source-selection decisions that take into account their impact on the overall health of defense industry. Figuring out how to do that, like other implementing actions, is of course a task for the U.S. government. Like Cold War policy of containment, any long-term strategy for preserving the vital elements of U.S. defense industry would have to be embraced by successive administrations regardless of political party. Developing and selling a defense industrial base strategy that could satisfy this fundamentally political requirement would be a tall order. The very mag-nitude of the challenge points to the need for a national conversation about the defense industry that has been prompted neither by the end of the Cold War nor by 9/11. And that conversation, if it is to be productive enough to lead to a bipar-tisan industrial base strategy, cannot proceed from the false belief that the U.S. defense industry operates like a normal free market.

56 center for strategic and Budgetary Assessments
Finally, it should not be forgotten that even the best strategy for preserving the critical elements of the defense industrial base will come to naught if the Department of Defense is not adequately resourced.126 The recently enacted Budget Control Act of 2011 appears to frame the debate over defense spending for the next few months. Under the initial cuts included in the plan, the DoD budget would be reduced by about $330 billion over ten years. However, if an agreement is not reached for further deficit reduction by the January 15, 2012 deadline, the trigger provision of the bill would go into effect, cutting an additional $500 billion from the ten-year budget.127 In light of these realities, the Defense Department is entering an era of fiscal austerity compared to the previous decade. If the defense industrial base is to be sustained, however, reductions in defense spending can only be allowed to go so far.
The question of how much the defense budget can be safely cut in the next few years is not an easy one to answer—especially in light of the inherent uncertainties of defense acquisition even in the best of times. But as a point of departure, an interesting suggestion is the Aerospace Industries Association’s (AIA’s) argument that DoD procurement needs remain between $125 and $140 billion annually in order to sustain the high quality of an all-volunteer, active-duty military of around 1.5 million.128 The main reasons for this conclusion are two. First, as active-duty end strength (including full-time National Guard and Reserve personnel) de-creased after the Cold War from about 2.2 million to 1.5 million, the average per capita procurement investment (in constant FY 2012 $) grew from under $40,000 for each service member during 1952–1981 to over $80,000 during 2002–2011 (Appendix 7).129 Most of this growth in the per capita procurement spending came, not surprisingly, after 9/11. Second, the procurement holiday of the last two decades argues that the ratio of procurement to R&D needs to be pushed back up toward 3-to-1, a ratio last seen in the 1980s (Appendix 7). AIA, therefore, concluded that even in an era of fiscal austerity, a “commitment of 4 percent of GDP to defense,” with 35 percent going to procurement and R&D, “is a prudent and affordable level” for supporting U.S. defense establishment in the long term.130
126 “Resources are always limited in comparison with our wants, always constraining out action. (If they did not, we could do everything, and there would be no problem of choosing preferred cours-es of action.)”—Charles J. Hitch and Roland N. McKean. The Economics of Defense in the Nuclear Age (Cambridge, MA: Harvard University Press, 1960), p. 23.
127 Todd Harrison, “Defense Funding in the Budget Control Act of 2011,” CSBA, August 4, 2011.128 Aerospace Industry Association, “Defense Investment: Finding the Right Balance,” May 2011, p. 10.129 Office of the Under Secretary of Defense (Comptroller), “National Defense Budget Estimates for
FY 2012,” March 2011, pp. 75–80, 232–234. AIA cites the higher estimate of $90,000 to $100,000 in procurement per service member for the late 2000s (AIA, “Defense Investment: Finding the Right Balance,” pp. 8, 10). The lower figure of $80,000 in procurement per service member is the average for 2002–2011. Note, too, that the average for 1982–1991, which spans the Reagan admin-istration’s defense build up, was just over $60,000 per service member.
130 AIA, “Defense Investment: Finding the Right Balance,” p. 11.

Sustaining Critical Sectors of the U.S. Defense Industrial Base 57
One could quibble with this estimate of the minimum level for total DoD pro-curement spending in the years ahead and the appropriateness of pegging de-fense spending to a fixed percent of GDP regardless of the variations in the threat environment. AIA is, after all, a defense industry association, and the metric of procurement spending per active-duty service member is highly aggregated. Nevertheless, AIA’s report highlights the broader point that a strategy for sus-taining the vital elements of the U.S. defense industrial base as a national asset must be adequately resourced to have any hope of succeeding.


cHAPTeR 10 > INDUSTRIAL mOBILIzATION AND ATTRITION
There is an additional reason why a long-term strategy for sustaining the U.S. defense industrial base is needed. Again, the Office of Civil and Defense Mobilization was eliminated in 1961. After the Cuban missile crisis in 1962, the growing specter of a massive U.S.-Soviet nuclear exchange further eroded the U.S. government’s inclination to invest in the capacity for industrial mobilization that a conventional conflict with significant attrition might require. Even before the Soviet Union achieved rough nuclear “parity” in the early 1970s (Figure 5), it was evident that each side would eventually be able to devastate the other in an all-out nuclear exchange, regardless of who struck first. Consequently, a U.S. capacity to ramp up or surge arms production on anything approaching the scale seen during World War II basically went by the wayside during the 1960s.
Nevertheless, U.S. forces sustained levels of equipment attrition in Southeast Asia that would be staggering today. From January 1962 to June 1973, the U.S. Air Force, Navy and Marine Corps lost over 3,300 fixed-wing aircraft, includ-ing 2,371 inflight losses to enemy action and another 852 in-flight operational losses.131 Air Force losses to all causes included 376 F-4s and 334 F-105s.132 Total helicopter losses were even greater: over 5,000, most of which were U.S. Army HU-1 (later UH-1) “Hueys.”133 Spread over more than a decade during the Cold War, the larger U.S. defense industrial base of the Vietnam era had little difficulty replacing these losses.
131 Michael M. McCrea, “U.S. Navy, Marine Corps, and Air Force Fixed-Wing Losses and Damage in Southeast Asia (1962–1973),” Center for Naval Analyses, August 1976, p. 1–2 (meaning section 1, page 2).
132 McCrea, “U.S. Navy, Marine Corps, and Air Force Fixed-Wing Losses and Damage in Southeast Asia (1962–1973),” p. 1–3.
133 Gary Roush, “Helicopter Losses during the Vietnam War,” pp. 1, 3, online at http://www.vhpa.org/heliloss.pdf (accessed April 24, 2011). Roush’s study was done for the Vietnam Helicopter Association. See, also, Michael M. Dunn, “Helicopter Losses in Viet Nam,” December 21, 2010, at http://airforceassociation.blogspot.com/2010/12/helicopter-losses-in-viet-nam.html.

60 center for strategic and Budgetary Assessments
FIGURE 5. THE EmERGENCE OF U.S. - SOvIET NUCLEAR pARITy*
* Natural Resources Defense Council (NRDC), “Archive of Nuclear Data from NRDC’s Nuclear Program,” at http://www.nrdc.org/nuclear/nudb/datainx.asp (accessed March 28, 2011). (ICBM = intercontinental nuclear missile; SLBM = submarine launched ballistic missile.) Figure 5’s warhead totals omit the theater, tactical, and reserve warheads in the U.S. and Soviet arsenals. The tabular data also indicates that the Soviet Union’s achievement of nuclear parity was based largely on its build up of ICBMs.
23:1
21:1
19:1
17:1
15:1
13:1
11:1
9:1
7:1
5:1
3:1
1:1
1:356 58 60 62 64 66 68 70 72 74 76 78 80 82 84 86 88 90
37:1
U.S.Advantage
USSR
U.S
. / U
SSR
For
ce R
atio U.S. / USSR Operational Warhead Ratio
U.S. / USSR Launcher Ratio (Bombers + ICBMs + SLBMs)
1970 1975 1980 1985 1990
U.s. Bomber Warheads 3,339 3,978 4,104 4,104 4,648
U.s. IcBM Warheads 1,244 2,144 2,110 2,110 2,440
U.s. sLBMs Warheads 1,552 4,544 5,376 5,376 5,216
Total U.S. Warheads 6,135 10,666 11,590 11,590 12,304
soviet Bomber Warheads 568 568 728 920 1,402
soviet IcBM Warheads 1,472 1,799 6,660 6,913 6,857
soviet sLBMs Warheads 287 828 1,854 2,264 2,900
Total Soviet Warheads 2,327 3,195 9,242 10,097 11,159

Sustaining Critical Sectors of the U.S. Defense Industrial Base 61
This capacity to absorb attrition, however, is much more limited today. The post-Cold War U.S. military is smaller than that of the Vietnam era, as is the country’s defense industry; the programmatic disincentives for the Services to fund excess production capacity have intensified; and by all past histori-cal standards, weapon system attrition in recent conflicts has been negligible. Psychologically, the major combat phases of the campaigns against Iraq in 1991 and 2003 have encouraged the belief that the U.S. military can prevail quickly and with minimal losses in high-intensity operations. The exemplar is Operation Desert Storm. In a mere forty-three days in 1991, U.S.-led Coalition forces were able to eject the Iraqi army from Kuwait with astonishingly few losses. Coalition fixed-wing losses totaled only thirty-eight aircraft, of which a mere twenty-seven were U.S. warplanes.134 During the hundred-hour ground campaign in February 1991, only eighteen M-1A1 or M1A1 HA (Heavy Armor) main battle tanks were withdrawn from combat, and the nine that could not be repaired were lost to friendly, rather than to enemy, fire.135 The American counterinsurgency cam-paigns in Afghanistan after 2002 and in Iraq after 2003 were both waged against far less capable adversaries than Saddam Hussein’s conventional forces in 1991 and 2003, and they too generally reinforced the belief that the U.S. military could prevail in high-intensity operations without appreciable equipment attrition.
As for funding an industrial surge capacity, since the 1960s U.S. acquisition program managers have been less and less willing to bear the additional costs. In late 2001, when the United States initiated operations in Afghanistan against al Qaeda and the Taliban, the main “surge” issue was not replacing lost warplanes, helicopters or armored fighting vehicles but increasing the production of preci-sion weapons, notably JDAMs. In late 2001 the JDAM production rate was only about 750 kits a month and, during the first nine weeks of Operation Enduring Freedom, U.S. air operations consumed about half of the roughly 10,000 JDAM kits in the inventory.136 Moreover, JDAM kits are relatively simple pieces of equip-ment compared to an F-22 or a JSF. While Ford’s Willow Run plant was eventu-ally able to crank out a B-24 in an hour, modern combat aircraft take months to manufacture. Thus, for a variety of reasons, the U.S. defense industrial base no longer has much surge capacity and serious mobilization planning has atrophied.
How concerned should defense officials be about these developments? Excluding China, it is difficult to point to another nation with the strategic depth,
134 Gulf War Air Power Survey, A Statistical Compendium, in Vol. V, A Statistical Compendium and Chronology (Washington, DC: U.S. Government Printing Office, 1993), p. 641.
135 Department of Defense, Conduct of the Persian Gulf War (Washington, DC: U.S. Government Printing Office, April 1992), p. 751.
136 Global Security, “Joint Direct Attack Munition (JDAM) History,” at http://www.globalsecurity.org/military/systems/munitions/jdam-history.htm (accessed April 26, 2011). In 2002 Boeing in-creased JDAM production to 1,500–2,000 kits a month (ibid.).

62 center for strategic and Budgetary Assessments
economic power, population and military technology to engage the U.S. military in a protracted, high-intensity conventional conflict. On the assumption that a rising China will never go to war with the United States, the risk inherent in the limited mobilization and surge capacities of the U.S. defense industry appears to be quite low. With the Defense Department entering a period of fiscal austerity, one might even argue that would be wasteful to invest scarce acquisition dollars in excess production capacity for major weapon systems.
On the other hand, recent war games exploring protracted conventional conflict against a large, technologically advanced opponent suggest that the U.S. military would soon begin running out of expendables, especially precision-guided muni-tions (PGMs) such as the Tomahawk Land Attack Missile (TLAM), the Standard Missile for air and missile defense, and JDAM. Furthermore, running out of PGMs is just the beginning of the problems today’s U.S. forces would encounter in fight-ing a protracted conventional war against a first-rate opponent with the staying power of China. Naval combatants cannot be reloaded with Standard Missiles or TLAMs at sea but must return to major naval ports to replenish their magazines. The United States lacks overseas facilities for repairing damage to major combat systems. And should significant attrition occur, the United States has little or no capacity to quickly replace such high-end assets as F-22s or aircraft carriers. In this regard, consider RAND’s 2008 analysis of a Taiwan Strait scenario in which the entire F-22 force operated from Guam in order to base outside the reach of Chinese ballistic missiles. Heavy F-22 attrition occurred due to the roughly nine-to-one numerical advantage Chinese Su-27 and Su-30 Flankers enjoyed over the Taiwan Strait operating from their nearby airfields.137 Even though the analysis as-sumed that F-22s would be able to shoot down large numbers of opposing Chinese Flankers without losses even when heavily outnumbered, by the time the F-22s ran out of missiles and fuel there were enough unengaged Flankers still in the air over the strait to begin attacking U.S. air refueling tankers and E-8 Airborne Warning and Control System aircraft. As a result, F-22s were lost not to enemy fighters but to fuel exhaustion because they were unable to rendezvous with tank-ers and get the fuel to make it back to Guam.138
As the long wars in Afghanistan and Iraq have shown, the U.S. military does not need industrial mobilization and surge capacities to pursue counterinsurgen-cy campaigns—even protracted ones—against Iraqi insurgents, al Qaeda terror-ists or the Taliban. A high-intensity, protracted conflict against an adversary with the advanced capabilities and strategic depth of China is another matter. In such high-end contingencies, the ability to ramp up production of key weapon systems
137 John Stillion and Scott Perdue, “Air Combat Past, Present and Future,” Project Air Force briefing, August 2008, Unclassified/FOUO/Sensitive, Slide 29. Despite the FOUO (For Official Use Only) caveat on this briefing, it has been circulated over the Internet.
138 Stillion and Perdue, “Air Combat Past, Present and Future,” Slide 50.

Sustaining Critical Sectors of the U.S. Defense Industrial Base 63
and munitions could prove critical. Mobilization of the U.S. defense industry, therefore, is yet another issue that a coherent, long-term strategy for sustaining key sectors of the country’s defense industrial base would need to address.


The usual way of portraying the mounting costs of combat platforms (tactical aircraft, main battle tanks, aircraft carriers, etc.) is to plot unit costs in constant dollars as a function of time (see Figure 3). However, cost-per-pound may bet-ter capture the increasing information and electronic content (computers, soft-ware, navigation equipment, displays, sensors, electronic countermeasures and so forth) of modern weapon systems. Figure 6 shows cost-per-pound trends for U.S. fighter and attack aircraft expressed in constant FY 2011 dollars. For uniformity, the underlying unit-cost data have all been taken from Wikipedia entries, which generally report unit flyaway prices. In general, unit flyaway costs are somewhat lower than unit procurement costs because they omit items such as government furnished equipment and spare parts. For example, the unit flyaway price of the F-117 is widely reported to have been $42.6 million (probably in then-year dollars) or around $82 million in FY 2011 dollars. But, according to later RAND analysis, the plane’s unit procurement cost was nearly $120 million (in FY 2011 $).139
The graphic suggests some insights. Most obviously it highlights the relatively greater information processing and electronics content of the fifth-generation fighters (the F-22 and F-35), which have made these planes significantly more ex-pensive on a cost-per-pound basis than earlier fighters and attack aircraft. There are two exceptions to this generalization: the AV-8B and the F-117. The F-117’s relatively high cost-per-pound is best explained by the fact that it was the first LO or “stealthy” attack aircraft. As for the AV-8B, its high cost-per-pound appears to reflect the penalty that the U.S. Marine Corps has paid to field short takeoff and vertical landing attack aircraft. Lastly, the A-10, which was procured to pro-vide close air support for the U.S. Army and little loved by the Air Force’s fighter community, has about the same price-per-pound as the Vietnam-era F-4E.
139 Giles K. Smith, Hyman L. Shulman, & Robert S. Leonard, “Application of the F-117 Acquisition Strategy to Other Programs in the New Acquisition Environment,” MR-749-AF, 1996, p. 25.
APPenDIx 1 > COST-pER-pOUND FOR TACTICAL AIRCRAFT

66 center for strategic and Budgetary Assessments
FIGURE 6. COST-pER-pOUND OF SELECTED FIGHTER AND ATTACk AIRCRAFT
$5,000
$4,500
$4,000
$3,500
$3,000
$2,500
$2,000
$1,500
$1,000
$500
$0
1960 1965 1970 1975 1980 1985 1990 1995 2000 2005 2010 2015 2020
Cos
t / lb
(FY
2011)
F-4C
F-111F
A-6
AV-8B
F-4E
F-15E
F-14A
F-15A/B
F-15C/D F-18C/DF-18E/F
F-22F-35C
F-35A
F-35B
F-16C/D
F-16A/B
F-18A/B
F-117
A-10

Figure 7 compares changes since 1986 in DoD outlays (using constant FY 2011 dollars) with U.S. Army active end strength, the U.S. Air Force’s (USAF’s) total active inventory of fighter/attack and bomber aircraft, and the U.S. Navy’s sur-face combatants and submarines.140 Particularly since 9/11, USAF and Navy in-ventories of major platforms have not grown at all despite sharp and prolonged growth in defense spending. The steady growth in unit costs for major weapons systems depicted in Figure 3 has surely been a major contributor to the lack of growth in aircraft and naval inventories since 2001.
140 Sources: DoD outlays and US Army active-duty end strength: DoD, OUSD (Comptroller), National Defense Budget Estimates for FY 2011, March 2010, pp. 130–132, 217; USAF combat aircraft in-ventories: Colonel James C. Ruehrmund Jr. and Christopher J. Bowie, Arsenal of Airpower: USAF Inventory 1950–2009 (Washington, DC: Mitchell Institute, November 2010), pp. 2, 23, 25-; Navy combatants: http://www.history.navy.mil/branches/org9-4.htm#2000, accessed March 7, 2001.
APPenDIx 2 > SELECTED U.S. FORCE LEvELS vERSUS U.S. DEFENSE SpENDING, 1986 TO 2009
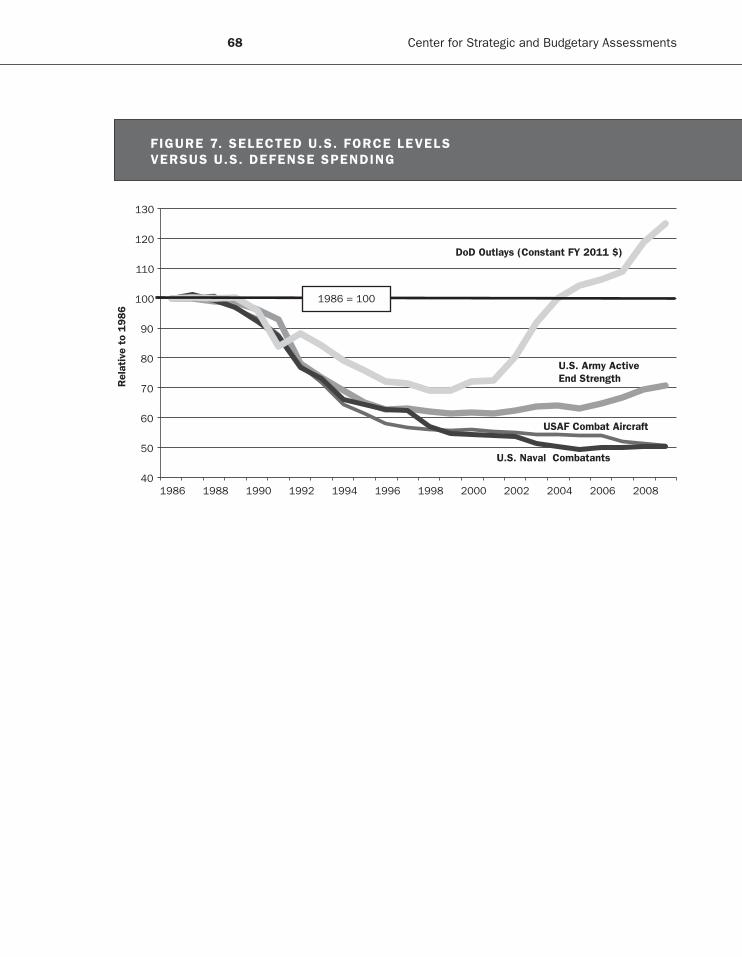
68 center for strategic and Budgetary Assessments
40
50
60
70
80
90
100
110
120
130
1986 1988 1990 1992 1994 1996 1998 2000 2002 2004 2006 2008
Rel
ativ
e to
1986
U.S. Army Active End Strength
USAF Combat Aircraft
U.S. Naval Combatants
1986 = 100
DoD Outlays (Constant FY 2011 $)
FIGURE 7. SELECTED U.S. FORCE LEvELS vERSUS U.S. DEFENSE SpENDING

Table 4 is identical to Table 1 except that the costs/unit for the programs shown has been converted to constant FY 2011 dollars. Notice that the cost-change ra-tios are the same in both versions of this table. Indeed, this is the reason for including both versions of the table. In any case, the costs/unit in this table are directly comparable across all twenty programs. The prices are acquisition unit prices: they include military construction, RDT&E, and procurement.
APPenDIx 3 > TABLE 1 WITH COSTS/UNIT IN CONSTANT Fy 2011 DOLLARS

70 center for strategic and Budgetary Assessments
program (Base year)
Fy 2011 $ (millions) per Unit
Cost-Change Ratio
Cumulative Change Ratio
original/Quantity
current/Quantity
F-35 Joint strike Fighter (2002) $73.467 $130.941 1.78
F-22 Advanced Tactical Fighter (1990) $138.799 $400.691 2.893.00
F-22 Raptor (2005) $398.684 $414.785 1.04
AMRAAM (1992) $1.107 $1.390 1.26
Joint Direct Attack Munition (1995) $0.034 $0.029 0.86
global Hawk RQ-4A/B (2000) $84.323 $208.865 2.48
Reaper MQ-9 (2008) $28.471 $29.363 1.03
global Positioning system IIA (2010) $485.391 $533.010 1.10
Advanced eHF (2002) $2,298.855 $2,312.527 1.01
F/A-18e/F super Hornet (2000) $103.570 $102.430 0.99
ssn 774 nuclear Attack submarine (1995) $2,799.687 $2,750.348 0.98
cVn 78 class Aircraft carrier (2000) $11,682.827 $11,163.756 0.96
DDg-51 Aegis Destroyer (1987) $1,228.939 $1,337.444 1.09
Trident II sLBM (1983) $60.788 $94.253 1.55
V-22 (1986) $43.273 $118.515 2.742.74
V-22 (2005) $123.167 $123.063 1.00
stryker (2004) $4.557 $4.237 0.93
guided MLRs (2003) $0.082 $0.131 1.59
Longbow Apache (1996) $9.606 $19.228 2.00
UH-60M Black Hawk Upgrade (2005) $15.273 $18.034 1.18
Patriot PAc 3 (2002) $9.32 $9.43 1.01
MQ-1c UAs gray eagle (2010) $382.91 $163.79 0.43
1.40 Average
TABLE 4. COST CHANGE RATIOS FOR TWENTy 2010 mDApS (IN CONSTANT Fy 2011 DOLLARS)

How do the leading U.S. defense firms stack up relative to foreign competitors? The following table is drawn from Stockholm International Peace Research Institute (SIPRI) data published in 2010.141 It indicates where the U.S. defense industrial base stands relative to all international competitors except China. In China’s case, the SIPRI’s current position is that although several Chinese arms-producing enterprises are large enough to rank among its “Top 100,” they can-not be included due to the lack of “comparable and sufficiently accurate data.”142 Another limitation is that by focusing on prime contractors, Table 5 gives little insight into the lower tiers of the worldwide arms industry, including small com-panies that are, in some cases, the sole suppliers of key components to the major primes. That said, U.S. dominance of the worldwide arms industry is evident.
SIPRI’s data for 2007 and 2008 do reflect some movement among the top arms producers. Using SIPRI’s rankings, in 2008 BAE Systems, which includes its U.S. subsidy, overtook Lockheed Martin based on arms sales, although Lockheed Martin’s total revenue remained larger than BAE’s. The most striking instance of movement from 2007 to 2008, however, is Navistar, which was not even in the top 100 in 2007. Navistar was propelled to twentieth place in 2008 due to a single program, the Mine Resistant Ambush Protected vehicle.
Lastly, to emphasize the need to develop better data on China’s defense indus-try, Figure 8 is of the first flight in January 2011 of the indigenous J-20 “stealth fighter.” It certainly suggests that the Chengdu Aircraft Industry Corporation is one Chinese defense firm that might well rank up with major U.S. prime con-tractors. Chengdu includes an aircraft plant, a design institute and an engine
141 Susan T. Jackson and the SIPRI Arms Industry Network, “The SIPRI Top 100 Arms-Producing Companies, 2008,” Stockholm International Peace Research Institution, April 2010, pp. 3, 5.
142 Jackson, et al., “The SIPRI Top 100 Arms-Producing Companies, 2008,” p. 5.
APPenDIx 4 > THE TOp TWENTy DEFENSE FIRmS WORLDWIDE IN 2008

72 center for strategic and Budgetary Assessments
Rank
Company Country Sector
Sales 2008
($ billions)% to
Defense
2008 Arms Sales2008 2007
1 2BAe systems UK Artillery, Aircraft,
electronics, Missiles, small Arms/Ammo, ships
$34.086 B 95% $32.420 B
2 3Lockheed Martin U.s. Aircraft, electronics,
Missiles, space$42.731 B 70% $29.880 B
3 1Boeing U.s. Aircraft, electronics,
Missiles, space$60.909 B 48% $29.200 B
4 4northrop grumman U.s. Aircraft, electronics,
Missiles, services, ships, space
$33.877 B 77% $26.090 B
5 5general Dynamics U.s. Artillery, electronics,
Military Vehicles, small Arms/Ammo, ships
$29,300 B 78% $22.780 B
6 6 Raytheon U.s. electronics, Missiles $23.174 B 91% $21.030 B
7 7eADs West eur. Aircraft, electronics,
Missiles, space$63.346 B 28% $19.970 B
8 9
Finmeccanica Italy Artillery, Aircraft, electronics, Military Vehicles, missiles, small Arms/Ammo
$25.037 B 53% $17.900 B
9 8 L-3 communications U.s. electronics, services $14.901 B 82% $13.240 B
10 10
Thales France Artillery, electronics, Military Vehicles, Missiles, small Arms/Ammo, ships
$18.543 B 58% $12.160 B
11 11United Technologies U.s. Aircraft, electronics,
engines$58.781 B 17% $10.760 B
12 12sAIc U.s. services, Military Vehicle
components$10.070 B 73% $9.980 B
13 16 KBR U.s. services $11.581 B 50% $7.350 B
14 13 computer sciences U.s. services $16.740 B 34% $5.730 B
15 15 Honeywell U.s. electronics $36.556 B 15% $5.710 B
16 19 ITT corporation U.s. electronics $11.695 B 44% $5.310 B
17 17 Rolls-Royce UK engines $16.695 B 28% $5.170 B
18 23 Almaz-Antei Russia Missiles $4.614 B 94% $4.720 B
19 25 AM general U.s. Military Vehicles no data no data no data
20 - navistar U.s. Military Vehicles (MRAP) $14.724 B 26% $3.900 B
TABLE 5. THE TOp TWENTy DEFENSE FIRmS WORLDWIDE IN 2008

Sustaining Critical Sectors of the U.S. Defense Industrial Base 73
company. It is also producing MD-80 and MD-90 transports for China’s do-mestic “trunk routes,” and is manufacturing structural components for Boeing and Airbus. The corporation has also produced the J-7/F-7 fighter based on the MiG-21 and is developing a J-10 multirole fighter utilizing technology from the cancelled Israeli Lavi fighter.143
143 Global Security, “Chendu Aircraft Corporation (CAC),” at http://www.globalsecurity.org/military/world/china/cac.htm, accessed March 5, 2011.
FIGURE 8. CHINESE J -20
source: Airpower Australia (original author unknown).


APPenDIx 5 > TOp-TIER U.S. DEFENSE INDUSTRy CONSOLIDATION, 1993 TO 2007
1993 1994 1995 1996 1997 1998 1999 2000 2001 2002 2003 2004 2005 2006 2007
Boeing
Rockwell Aerospace & Defense units McDonnell Douglas
De Haviland Ltd (Australia) Hughes Space & Communications units Litton Precision Gear
BOEING Rocketdyne to Pratt & Whitney
Hughes Electronics Texas Instruments Electronics Allied Signal
Solipsys Chrysler Electronics & Aircraft Upgrading units E-Systems
Raytheon Raytheon
Scaled Composites Logicon Grumman & Vought Aircraft
NORTHROP GRUMMAN
Northrop
Westinghouse Defense Teledyne Ryan Aeronautical Litton & Newport News Shipbuilding TRW LM Control Systems
LM Aerospace Electronic Systems Sanders Associates & Fairchild Systems
Sold to BAE LM Space & Electronic Communications
Martin Marietta
General Dynamics Space GE Aerospace
General Dynamics Ft. Worth Lockheed Loral (including IBM Federal Systems & Unisys)
L O C K H E E D M A R T I N
10 Loral units spun off to L-3
Gulfstream Aerospace Galaxy Aerospace Advanced Technology Products General Motors Defense, Steyr Daimler Puch Spezialfahrzeug & Datron’s IMCO unitSpectrum Astro
National Steel & Shipbuilding Company Lockheed Martin armaments units Bath Iron Works GENERAL DYNAMICS General Dynamics
FIGURE 9. TOp-TIER U.S. DEFENSE INDUSTRy CONSOLIDATION, 1993 TO 2007
76 center for strategic and Budgetary Assessments
The figure shows consolidation from 1993 to 2007 in the U.S. defense industry. Ignoring entities later spun off (e.g., Rocketdyne to Pratt & Whitney), it depicts some thirty-seven “prime” contractors collapsing into five.
Acquisitions of professional-services and information-technology (IT) firms have been mostly excluded. Exceptions include Logicon, E Systems and Solipsys. For consolidation diagrams including professional services and IT, see Pierre Chao, et al., Structure and Dynamics of the U.S. Federal Professional Services Industrial Base: 1995–2005 (Washington, DC: CSIS, May 2007), pp. 75–86. BAE, a British-Italian defense prime with a U.S. subsidiary, is not shown except for units it acquired from Lockheed Martin in 2000. The heavier lines in the figure indicate the acquisition of larger defense firms.
The problems with defense acquisition have changed remarkably little over the past quarter century. The description in the excerpt below from A Quest of Excellence in 1986 does not diverge noticeably from that offered by the independent panel on the QDR in 2010.
All of our analysis leads us unequivocally to the conclusion that the defense acquisi-tion system has basic problems that must be corrected. These problems are deeply entrenched and have developed over several decades from an increasingly bureau-cratic and overregulated process. As a result, all too many of our weapon systems cost too much, take too long to develop, and by the time they are field, incorporate obsolete technology. Recent public attention has focused on cases of spare parts overpricing that have been prominently reported by the media. Many of these cases were uncovered by DoD itself, which has a major effort underway to detect spare parts overpricing and to minimize such problems in the future. By contrast, we have focused on the acquisition of major weapon systems, because improved efficiency there can lead to cost savings greater by orders of magnitude. We nonetheless also analyzed the spare parts cases to determine whether they are indicative of systemic problems and, if so, how these should be addressed. Although each of the cases we examined had its own peculiarities, we identified problems that frequently recurred: for example, government insistence on rigid custom specifications for products, despite the com-mercial availability of adequate alternative items costing much less; the ordering of spare parts so late in a program, after the close of the production line, that they must be expensively hand tooled; the use of unsuitable cost allocation procedures that grossly distort the price tags of inexpensive spare parts; the buying of spare parts in uneconomically small quantities and hence at higher prices; and the simple exercise of poor judgment by acquisition personnel. In general, we discovered, these problems were seldom the result of fraud or dis-honesty. Rather they were symptomatic of other underlying problems that affect the
APPenDIx 6 > THE 1986 DESCRIpTION OF DEFENSE ACQUISITION By THE pRESIDENT’S BLUE RIBBON COmmISSION ON DEFENSE mANAGEmENT

78 center for strategic and Budgetary Assessments
entire acquisition system. Ironically, actions being prescribed in law and regulation to correct spare parts procurement tend to exacerbate these underlying problems by making acquisition procedures even more inflexible and by removing whatever mo-tivation exists for the exercise of individual judgment. This chapter will concentrate on ways of improving the efficiency of the overall acquisition system. Removing bu-reaucratic inefficiencies in out acquisition of major weapon systems also will realize significant improvements in our procurement of associated spare parts. Problem with the present acquisition systems begin with the establishment of approved “military requirements” for a new weapon, a step that occurs before de-velopment starts. Two common methods exist for establishing the need for a new system—“user pull” and “technology push.” Both methods are unsatisfactory.User pull defines the institutional process by which users (notable the Services) assess the adequacy of existing weapons to meet military needs, and state the characteristics of the next generation of equipment desired to overcome identified inadequacies. In general, this process does not adequately involve participants with a sophisticated knowledge of the cost and schedule implications of technical im-provements required to satisfy these characteristics. Consequently, user pull often leads to goldplating—that is, the inclusion of features that are desirable but whose cost far exceeds their real value. If users understood the likely impact of their re-quirements on the schedule, quantity, and maintainability of the weapons they eventually received, they would have strong motivations for compromise. Generally, however, that compromise—a conscious trade-off between performance and cost—does not take place to an adequate degree. Implicitly, it is assumed that military requirements should be “pure,” and that any necessary trade-offs will take place later in the process. Alternatively, requirements often are established by technology push. A govern-ment or industry team conceives of a new or advanced technology. It then tries to persuade users to state requirements that will exploit the new technology. Most of the really significant improvements in military technology—radar, jet engines, and the atomic bomb, for example—have occurred by technology push rather than by an abstract statement of requirements. Because participants in this process tend to push technology for its own sake, however, this method is no less prone to result in goldplating than user pull. Once military requirements are defined, the next step is to assemble a small team whose job is to define a weapon system to meet these requirements, and “market” the system within the government, in order to get funding authorized for its devel-opment. Such marketing takes place in a highly competitive environment, which is desirable because we want only the nest ideas to survive and be funded. It is quite clear, however, that this competitive environment for program approval does not encourage realistic estimates of cost and schedule. So, all too often, when a program finally receives budget approval, it embodies not only overstated requirements but also understated costs. Funding haven been approved, the DoD program team is then enlarged and given the task of preparing detailed specifications. Weapon system specifications for a ma-jor military program typically run to thousands of pages, not counting generic mili-tary specifications included by reference. System specifications effectively become a surrogated for overstated military requirements, which tend to fade from view.

Sustaining Critical Sectors of the U.S. Defense Industrial Base 79
DoD then invites industry to bid on the program. The overly detailed system specifications serve as a basis for defense contractors to prepared competitive pro-posals describing how they would meet the specifications, and at what cost to them and price to the government. The preparation of competitive proposals may very well expose technical problems with the specifications, or reveal modifications that would be cost effective. The environment in which program competition typically takes place, however, encouraged improvements within specifications, but discour-ages modifications that deviate from specifications. This effectively forecloses one principal factor—trade-offs between performance and cost—on which the competi-tion should be based. The resulting competition, based instead principally on cost, all to often goes to the contractor whose bid is the most optimistic.In underbidding, contractors assume there will be an opportunity later in a pro-gram to negotiate performance trade-offs that make a low bid achievable, or to re-cover understated costs through engineering change orders. Today, however, most production and many development contracts are negotiated on a firm, fixed-price basis. For the government, the advantages of a fixed-price arrangement, particu-larly the incentives it creates for realistic bidding, are obvious. The disadvantages to the government, while more subtle, are nevertheless of real concern. Fixed-price contracts effectively can enshrine overstated requirements and understated costs in a legal arrangement that allows little or no flexibility for needed trade-offs be-tween cost and performance. This contractual arrangement, intended to protect the government, may cause both sides to lose. In the fact of these daunting problems, DoD selects a successful bidder and launches the program. The DoD program manager sets out to accomplish the improbable task of managing his overspecified and underfunded program to a successful conclusion. But what was merely improbable soon becomes impossible. The program manag-er finds that, far from being the manager of the program, he is merely one of the par-ticipants who can influence it. An army of advocates for special interests descends on the program to ensure that it complies with various standards for military speci-fications, reliability, maintainability, operability, small and minority business uti-lization, and competition, to name a few. Each of these advocates can demand that the program manager take or refrain from taking some action but none of them has any responsibility for the ultimate cost, schedule, or performance of the program. None of the purposes they advocate is undesirable in itself. In the aggregate, how-ever, they leave the program managers no room to balance their many demands, some of which are in conflict with each other, and most of which are in conflict with the program’s cost and schedule objectives. Even more importantly, they produce a diffusion of management responsibility, in which everyone is responsible, and no one is responsible. Meanwhile, throughout this process, various committees of Congress are in-volved. During the marketing phase, it is not enough for the program manager to sell the program to his Service leaders and the various staffs in the Office of the Secretary of Defense. He must also sell the program to at least four committees
80 center for strategic and Budgetary Assessments
and to numerous subcommittees of Congress, and then resell it for each fiscal year it is considered. In doing so, the program manager is either assisted or opposed by a variety of contractors, each advocating its own views of the program on Capitol Hill. While congressmen have an abstract interest in greater program effectiveness, they also have an intense pragmatic interest in their own constituencies. These two interests are frequently in conflict, as they exert pressure on specific programs through legislative oversight. All of these pressures, both internal and external to DoD, cause the program manager to spend most of his time briefing his program. In effect, he is reduced to being a supplicant for, rather than a manager of, his program. The resulting huck-ster psychology does not condition the program manager to search for possible inconsistencies between performance and schedule, on the one hand, and autho-rized funding, on the other. Predictably there is a high incidence of cost overruns on major weapon system programs. But a much more serious result of this management environment is an unreason-ably long acquisition cycle—ten to fifteen years for our major weapon systems. This is a central problem from which most other acquisition problems stem:
>> It leads to unnecessarily high costs of development. Time is money, and experi-ence argues that a ten-year acquisition cycle is clearly more expensive than a five-year cycle.
>> It leads to obsolete technology in our fielded equipment. We forfeit out five-year technological lead by the time it takes us to get our technology from the labora-tory into the field.
>> And it aggravates the very goldplating that is one of its causes. Users, knowing that the equipment to meet their requirements is fifteen years away, make ex-tremely conservative treat estimates. Because long-term forecast are uncertain at best, users tend to err on the side of overstating the threat.
This description of the acquisition system is stark, but it by no means exaggerates the environment of many, if not most, defense programs. Given this pernicious set of underlying problems, it is a tribute to the dedication of man professionals in the sys-tem, both in and out of DoD, that more programs do not end up in serious trouble.144
144 President’s Blue Ribbon Commission on Defense Management, A Quest for Excellence: Final Report to the President, June 1986, pp. 44–48.
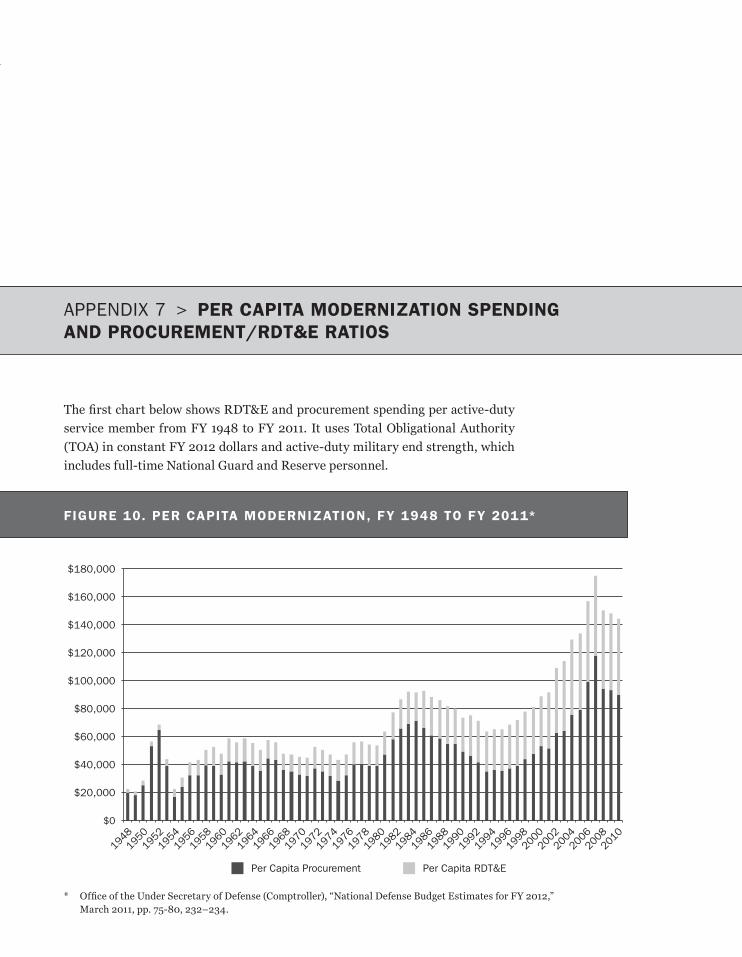
The first chart below shows RDT&E and procurement spending per active-duty service member from FY 1948 to FY 2011. It uses Total Obligational Authority (TOA) in constant FY 2012 dollars and active-duty military end strength, which includes full-time National Guard and Reserve personnel.
APPenDIx 7 > pER CApITA mODERNIzATION SpENDING AND pROCUREmENT/RDT&E RATIOS
* Office of the Under Secretary of Defense (Comptroller), “National Defense Budget Estimates for FY 2012,” March 2011, pp. 75-80, 232–234.
FIGURE 10. pER CApITA mODERNIzATION, Fy 1948 TO Fy 2011*
$0
$20,000
$40,000
$60,000
$80,000
$100,000
$120,000
$140,000
$160,000
$180,000
1948
1950
1952
1954
1956
1958
1960
1962
1964
1966
1968
1970
1972
1974
1976
1978
1980
1982
1984
1986
1988
1990
1992
1994
1996
1998
2000
2002
2004
2006
2008
2010
Per Capita Procurement Per Capita RDT&E
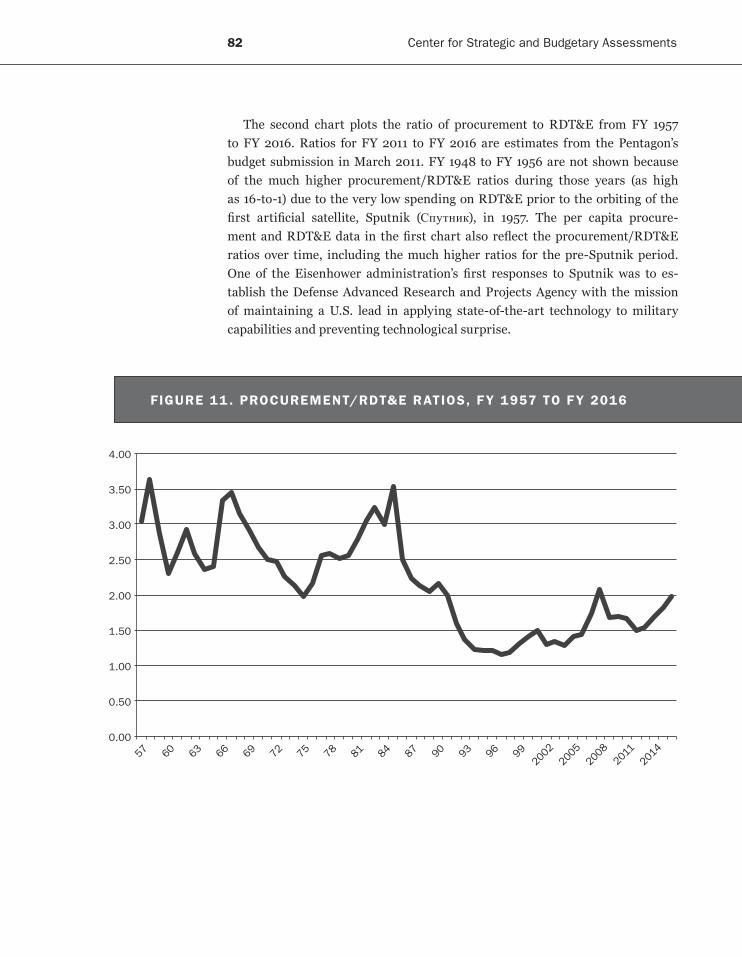
82 center for strategic and Budgetary Assessments
The second chart plots the ratio of procurement to RDT&E from FY 1957 to FY 2016. Ratios for FY 2011 to FY 2016 are estimates from the Pentagon’s budget submission in March 2011. FY 1948 to FY 1956 are not shown because of the much higher procurement/RDT&E ratios during those years (as high as 16-to-1) due to the very low spending on RDT&E prior to the orbiting of the first artificial satellite, Sputnik (Спутник), in 1957. The per capita procure-ment and RDT&E data in the first chart also reflect the procurement/RDT&E ratios over time, including the much higher ratios for the pre-Sputnik period. One of the Eisenhower administration’s first responses to Sputnik was to es-tablish the Defense Advanced Research and Projects Agency with the mission of maintaining a U.S. lead in applying state-of-the-art technology to military capabilities and preventing technological surprise.
FIGURE 11 . pROCUREmENT/RDT&E RATIOS, Fy 1957 TO Fy 2016
0.00
0.50
1.00
1.50
2.00
2.50
3.00
3.50
4.00
57 60 63 66 69 72 75 78 81 84 87 90 93 96 9920
0220
0520
0820
1120
14

Sustaining Critical Sectors of the U.S. Defense Industrial Base
Barry D. Watts toDD Harrison
C e n t e r f o r s t r a t e g i C a n D B u D g e t a r y a s s e s s m e n t s
Center for Strategic and Budgetary Assessments 1667 K street, nW, suite 900Washington, DC 20006 tel. 202-331-7990 • fax 202-331-8019www.CsBaonline.org