sustainable recovery - world energy outlook special report
TRANSCRIPT
RecoverySustainable
World Energy Outlook Special Report in collaboration with the International Monetary Fund

The IEA examines the full spectrum of energy issues including oil, gas and coal supply and demand, renewable energy technologies, electricity markets, energy efficiency, access to energy, demand side management and much more. Through its work, the IEA advocates policies that will enhance the reliability, affordability and sustainability of energy in its 30 member countries, 8 association countries and beyond.
Please note that this publication is subject to specific restrictions that limit its use and distribution. The terms and conditions are available online at www.iea.org/t&c/
Source: IEA. All rights reserved.International Energy Agency Website: www.iea.org
IEA member countries:
Australia Austria BelgiumCanadaCzech Republic DenmarkEstoniaFinland France Germany Greece HungaryIreland ItalyJapanKorea Luxembourg Mexico Netherlands New Zealand NorwayPoland Portugal Slovak Republic Spain Sweden Switzerland Turkey United Kingdom United States
The European Commission also participates in the work of the IEA
IEA association countries:
BrazilChinaIndiaIndonesiaMoroccoSingaporeSouth AfricaThailand
INTERNATIONAL ENERGYAGENCY
Revised version, July 2020. Information notice found at: www.iea.org/corrigenda

Foreword 3
Foreword
As it grapples with the unprecedented health emergency triggered by the Covid‐19 pandemic,
the world is experiencing its worst economic shock since the 1930s. This is having a severe
impact on employment and investment across all parts of the economy, including energy.
Governments have taken the lead in providing urgent financial and economic relief to prevent
the crisis from spiralling further downward. Today, attention is increasingly focusing on how to
bring about an economic recovery that repairs the damage inflicted by the crisis while putting
the world on a stronger footing for the future.
Since the scale of the economic crisis began to emerge, the International Energy Agency (IEA)
has been leading the calls for governments to make the recovery as sustainable and resilient as
possible. This means immediately addressing the core issues of global recession and soaring
unemployment – and doing so in a way that also takes into account the key challenge of building
cleaner and more secure energy systems.
At the IEA, we quickly re‐focused the work of our analytical teams across the Agency on the
shocks caused by the crisis to global energy demand, assessing the impact across all major fuels
including oil, gas, coal, electricity and renewables. We then quantified and examined the
staggering effects in key areas, such as the unparalleled 20% plunge in global energy investment
that is expected this year. And now, we are identifying the most effective measures available to
governments as they consider their once‐in‐a‐lifetime recovery plans. The Sustainable Recovery
Plan proposed in this report is the result.
The Sustainable Recovery Plan is not intended to tell governments what they must do. It seeks
to show them what they can do. Whether countries choose to follow the measures laid out in
the plan remains their sovereign choice. Our plan – a combination of policy actions and targeted
investments – offers a hugely encouraging picture of what the world can achieve despite the
tremendous difficulties we face today.
As they design economic recovery plans, policy makers are having to make enormously
consequential decisions in a very short space of time. These decisions will shape economic and
energy infrastructure for decades to come and will almost certainly determine whether the
world has a chance of meeting its long‐term energy and climate goals. Our Sustainable Recovery
Plan shows governments have a unique opportunity today to boost economic growth, create
millions of new jobs and put global greenhouse gas emissions into structural decline.
The IEA’s work is designed to provide the world’s top decision‐makers in government, industry
and the investment community with the strongest possible data, analysis and options to enable
them choose the best path forward. With this in mind, we are bringing all of these groups
together at the IEA Clean Energy Transitions Summit on 9 July 2020 in an effort to identify how
to step up actions that achieve real‐world results.
A sustainable recovery is within our reach – I hope the grand coalition of global energy leaders
we are assembling will seize this opportunity.
Dr. Fatih Birol
Executive Director
International Energy Agency
IEA.
All
right
s res
erve
d

IEA.
All
right
s res
erve
d

Acknowledgements 5
Acknowledgements
This study, a cross‐agency effort, was prepared by the World Energy Outlook team in
co‐operation with all divisions in the Directorate of Sustainability, Technology and Outlooks,
the Strategic Initiatives Office and the Directorate of Energy Markets and Sustainability. The
study was designed and directed by Laura Cozzi, Chief Energy Modeller.
The lead authors and co‐ordinators were: Christophe McGlade and Daniel Wetzel. Daniel
Crow, Blandine Barreau and Davide D’Ambrosio were also part of the core group. Laszlo
Varro, Chief Economist, provided essential guidance. The International Monetary Fund, in
particular Benjamin Hunt and Keiko Honjo, partnered with the IEA to provide the
macroeconomic analysis.
The other main authors were: Zakia Adam (subsidies and data support), Yasmine Arsalane
(power), Heymi Bahar (renewables), Stéphanie Bouckaert (modelling co‐ordination),
Arthur Contejean (access), Elisabetta Cornago (transport), Amrita Dasgupta (transport),
Connor Donovan (power), Musa Erdogan (industry), Araceli Fernandez Pales (innovation
lead), Timothy Goodson (buildings lead), Maxine Jordan (buildings), Vanessa Koh (power),
Kevin Lane (buildings), Pharoah Le Feuvre (biofuels), Lilly Lee (transport), Olivier Lejeune
(macro analysis), Sara Moarif (context), Samantha McCulloch (innovation),
Kieran McNamara (grids), Ariane Millot (buildings), Sarbojit Pal (transport), Leonardo Paoli
(transport), Sebastian Papapanagiotou (grids), Claudia Pavarini (power), Daniele Perugia
(grids), Apostolos Petropoulos (transport lead), Alison Pridmore (urban infrastructure),
Uwe Remme (innovation), Arnaud Rouget (access), Hugo Salamanca (industry),
Andreas Schroeder (industry lead), Leonie Staas (jobs), Brent Wanner (power lead).
The study also relied on support from across the entire World Energy Outlook team.
Teresa Coon and Eleni Tsoukala provided essential support.
Edmund Hosker carried editorial responsibility. Debra Justus was the copy‐editor.
Valuable comments and feedback were provided by other senior management and
numerous other colleagues within the IEA. In particular Mechthild Wörsdörfer,
Keisuke Sadamori, Alessandro Blasi, Joel Couse, Paolo Frankl, Peter Fraser, Rebecca Gaghen,
Tim Gould, Timur Gül, Brian Motherway, Masatoshi Sugiura, Lucila Arboleya Sarazola and
Peter Janoska.
Thanks go to the IEA’s Communication and Digitalisation Office for their help in producing
the report and website materials, particularly to Jad Mouawad, Jethro Mullen,
Astrid Dumond, Christopher Gully, Isabelle Nonain‐Semelin, Julie Puech and Therese Walsh.
Diana Browne provided essential support to the production process. IEA’s Office of the Legal
Counsel, Office of Management and Administration and Energy Data Centre provided
assistance throughout the preparation of the report.
We are grateful for the guidance and valuable advice of Peter Betts on climate issues.
Valuable input to the analysis was provided by David Wilkinson (independent consultant).
IEA.
All
right
s res
erve
d

6 World Energy Outlook 2020 | Special Report
The work could not have been achieved without the support and co‐operation provided by
many government bodies, organisations and companies worldwide, notably: Ministry of
Economy, Trade and Industry, Japan; and Mistry of the Environment, Land and Sea, Italy on
smart grids and power system modernisation. Activities within the IEA Clean Energy
Technologies Programme provided valuable support to this report.
A webinar and an online consultation was held at the end of March 2020 in which
participants offered valuable insights, feedback and data for this analysis. We are grateful for
their input.
A number of senior government officials and international experts provided input and
reviewed preliminary report drafts. Comments and suggestions that were of great value for
the report were received from:
Lydia Shawel Abebe World Health Organization (WHO)
Angeline Afanoukoe Nexans
Doug Arent US National Renewable Energy Laboratory (NREL)
Jason Babik Westinghouse
Georg Baeuml Volkswagen
Richard Baron 2050 Pathways Platform
Jim Barrett Barrett Economics
Harmeet Bawa ABB Power Grids
Sama Bilbao y Leon Nuclear Energy Agency (NEA)
Rina Bohle Zeller Vestas, Denmark
Jason Bordoff Columbia University, United States
Nils Borg European Council for an Energy Efficient Economy
Alex Bowen London School of Economics and Political Science
William Brent Power for All
Sam Brock American Wind Energy Association
Mark Brownstein Environmental Defense Fund, United States
Simon Buckle Organisation for Economic Co‐operation and Development (OECD)
Nick Butler Kings College London
Sally Cairns University of Leeds
Ben Caldecott University of Oxford
Julie Cammell Global Off‐Grid Lighting Association
Pantelis Capros E3Modelling
Anne‐Sophie Cerisola United Nations
Russel Conklin US Department of Energy
Beth Copanas RES
Paula Coussy IFP Energies Nouvelles
Francois Dassa EDF
Brian Dean Sustainable Energy for All
IEA.
All
right
s res
erve
d
Acknowledgements 7
Nicolas Di Sbroiavacca Fundación Bariloche
Navroz Dubash Centre for Policy Research, India
Candice El‐Asmar Permanent Delegation of Australia to the OECD
David Elzinga Asian Development Bank
Normant Emmanuel Saint‐Gobain
Alex Evans Global LPG Partnership
Olivier Fontan Haut Conseil pour le Climat, France
James Foster UK Department for Business, Energy and Industrial Strategy
Christopher Frey ENERCON
Jean‐François Gagné Department of Natural Resources Canada
Faith Gan Energy Market Authority, Singapore
Peter George Clean Cooking Alliance
Michael Ghielmetti ABB
Arunabha Ghosh Council on Energy, Environment and Water, India
Dolf Gielen International Renewable Energy Agency (IRENA)
Peter Gornischeff Permanent Representation of Estonia to the OECD and UNESCO
Michael Grubb University College London
Stéphane Hallegatte The World Bank
Atle Harby Sintef
Antoine Herzog EDF
Christina Hood Compass Climate
Frank Jotzo Australian National University
Michael Kelly World LPG Association
Fabian Kesicki E.ON SE
Hoseok Kim Korea Environment Institute
Tomasz Kozluk OECD
Jochen Kreusel T&D Europe
Vedantha Kumar UK Department for Business, Energy and Industrial Strategy
Bharadwaj Kummamuru World Bioenergy Association
Michał Kurtyka Minister of Climate, Poland
Rodolfo Lacy OECD
Carole Lancereau Ministry for the Ecological and Inclusive Transition, France
Joyce Lee Global Wind Energy Council
Aaron Leopold African Mini‐Grid Association
Karan Mangotra The Energy and Resources Institute (TERI)
Michael Mavrovouniotis Wellspring Climate Initiative
Espen Mehlum World Economic Forum
Bert Metz European Climate Foundation
Axel Michaelowa University of Zurich / Perspectives Climate Change
Vincent Minier Schneider Electric
IEA.
All
right
s res
erve
d

8 World Energy Outlook 2020 | Special Report
Simone Mori ENEL
Luis Mundaca Lund University
Clay Nesler Johnson Controls
Sarah Neumann Federal Ministry for Climate Action Environment Energy Mobility Innovation and Technology, Austria
Patrick Oliva Paris Process on Mobility and Climate
Koen Peters GOGLA (Global association for the off‐grid solar energy industry)
Volkmar Pflug Siemens
Ivan Pineda WindEurope
Michael Pollitt University of Cambridge
Lynn Price US Lawrence Berkeley National Laboratory
Michael Renner International Renewable Energy Agency (IRENA)
Rasmus Nicolas Ringgaard Permanent Delegation of Denmark to the OECD
Seth Roberts Saudi Aramco
Nick Robins London School of Economics and Political Science
Karen Roiy Danfoss
Raffaele Rossi Solar Power Europegeo
Catherine Saget International Labour Organization
Yamina Saheb OpenEXP
Carlos Salle Alonso Iberdrola
Roberto Schaeffer Universidade Federal do Rio de Janeiro, Brazil
Joachim Schmitz Federal Ministry for Economic Affairs and Energy, Germany
Rob Schwiers Chevron
Simon Sharpe UK Cabinet Office
Adnan Shihab Eldin Foundation for the Advancement of Sciences, Kuwait
Maria Sicilia ENAGAS
Jim Skea Intergovernmental Panel on Climate Change (IPCC) Working Group III Co‐Chair
Ottavia Stella ENI
Ivan Torre The World Bank
Matteo Trascinelli ABB
Diana Ürge‐Vorsatz Central European University
Frank van der Vleuten Ministry of Foreign Affairs, The Netherlands
Willem Tom Van Ierland DG Climate Action, European Commission
Jean‐Pascal van Ypersele Université Catholique de Louvain, Belgium
Christelle Verstraeten ChargePoint
David Victor UC San Diego School of Global Policy and Strategy, United States
Salvatore Vinci World Health Organization (WHO)
Doug Vine Center for Climate and Energy Solutions (C2ES)
IEA.
All
right
s res
erve
d

Acknowledgements 9
Jeff Waller ENGIE Impact
Wang Yanjia Tsinghua University
Wang Yao International Institute Green Finance
Peter Wooders International Institute for Sustainable Development (IISD)
Akira Yabumoto J‐POWER
Kyota Yamamoto Ministry of Economy Trade and Industry, Japan
Mel Ydreos International Gas Union
Kandeh Yumkella Former UN Under‐Secretary General and first CEO of Sustainable Energy for All
The individuals and organisations that contributed to this study are not responsible for any
opinions or judgements it contains. All errors and omissions are solely the responsibility of
the IEA.
This document and any map included herein are without prejudice to the status of or
sovereignty over any territory, to the delimitation of international frontiers and boundaries
and to the name of any territory, city or area.
IEA.
All
right
s res
erve
d

IEA.
All
right
s res
erve
d

Table of Contents 11
Table of Contents
Foreword........................................................................................................................... 3
Acknowledgements ........................................................................................................... 5
Executive summary ......................................................................................................... 13
Covid‐19 and energy: setting the scene 17
1.1 Introduction ................................................................................................... 18
1.2 Macroeconomic impacts of the crisis ............................................................ 19
1.3 Covid‐19 crisis and the energy sector ............................................................ 21
1.3.1 Energy sector investment .................................................................. 24
1.3.2 Jobs in the energy sector ................................................................... 25
1.4 How should governments respond? .............................................................. 28
1.4.1 How the energy sector features in announced emergency
and recovery plans ............................................................................ 30
1.4.2 Lessons from the 2008‐09 financial crisis for stimulus spending on
clean energy technologies ................................................................. 32
1.4.3 Why is a sustainable recovery plan needed for the energy sector? .. 34
Evaluation of possible recovery measures 37
2.1 Introduction ................................................................................................... 38
2.1.1 Overview of findings on jobs and emissions ...................................... 39
2.2 Electricity ....................................................................................................... 43
2.2.1 Expand and modernise grids ............................................................. 45
2.2.2 Accelerate the growth of wind and solar PV ..................................... 48
2.2.3 Maintain the role of hydro and nuclear power ................................. 52
2.2.4 Manage gas‐ and coal‐fired power generation.................................. 55
2.3 Transport ....................................................................................................... 58
2.3.1 New vehicles ...................................................................................... 60
2.3.2 Expand high‐speed rail networks ...................................................... 64
2.3.3 Improve urban infrastructure ............................................................ 65
2.4 Buildings ........................................................................................................ 68
2.4.1 Retrofit existing buildings and more efficient new constructions ..... 70
2.4.2 More efficient and connected household appliances ....................... 73
1
2
IEA.
All
right
s res
erve
d
12 World Energy Outlook 2020 | Special Report
2.4.3 Improve access to clean cooking ....................................................... 76
2.5 Industry ......................................................................................................... 80
2.5.1 Improve energy efficiency and increase electrification ..................... 82
2.5.2 Expand waste and material recycling ................................................ 84
2.6 Fuels .............................................................................................................. 85
2.6.1 Reduce methane emissions from oil and gas operations .................. 87
2.6.2 Reform fossil fuel subsidies ............................................................... 90
2.6.3 Support and expand the use of biofuels ............................................ 93
2.7 Strategic opportunities in technology innovation ......................................... 96
2.7.1 Hydrogen technologies ...................................................................... 97
2.7.2 Batteries ............................................................................................ 98
2.7.3 Small modular nuclear reactors ....................................................... 100
2.7.4 Carbon capture, utilisation and storage .......................................... 101
A sustainable recovery plan for the energy sector 103
3.1 Introduction ................................................................................................. 104
3.2 Objectives and design of a sustainable recovery plan for energy ............... 104
3.2.1 Goals of a global sustainable recovery plan for energy ................... 104
3.2.2 Sustainable recovery plan measures ............................................... 105
3.2.3 Policies to support the sustainable recovery plan ........................... 111
3.2.4 Recovery plans in developing economies ........................................ 114
3.3 Implications of the sustainable recovery plan ............................................. 116
3.3.1 The economy ................................................................................... 116
3.3.2 The energy sector ............................................................................ 122
3.3.3 The environment ............................................................................. 123
3.3.4 Energy security and resilience ......................................................... 126
Annexes
Annex A. Employment analysis methodology ................................................................ 129
Annex B. Definitions ...................................................................................................... 151
Annex C. References ...................................................................................................... 163
3
IEA.
All
right
s res
erve
d

Executive Summary 13
Executive Summary
The Covid‐19 pandemic has created a historic crisis for economies and energy markets
The biggest global economic shock in peacetime since the 1930s is having a severe impact
on employment and investment across all sectors, including energy. With the global
economy set to shrink by 6% in 2020, some 300 million jobs may have been lost during the
second quarter of the year. This disruption has sent shock waves through energy markets,
with global energy investment expected to shrink by an unparalleled 20% in 2020.
The energy sector, particularly electricity, has played a critical role in the global response
to the Covid‐19 crisis. Uninterrupted energy supplies have enabled hospitals to provide
care, food and other essentials to be delivered, and millions of people to work and study
from home while maintaining social contact online. Without access to reliable and
affordable electricity, the lockdowns introduced by governments to tackle the public health
crisis would have resulted in far greater economic damage.
Governments are responding to the economic crisis on a massive scale. So far, they have
announced measures worth about USD 9 trillion, focusing primarily on emergency financial
and economic relief to prevent an even deeper crisis. With more stimulus coming,
attention is now turning to longer‐term recovery plans that seek to repair the economic
damage from the disruptions caused by confinement measures and restrictions on
mobility. Some plans already include energy, and its role could grow in successive rounds of
stimulus spending.
A Sustainable Recovery Plan
In response to calls from governments around the world, the IEA has produced a
Sustainable Recovery Plan for actions that can be taken over the next three years. This
detailed plan is focused on cost‐effective measures that could be implemented during the
specific timeframe of 2021 to 2023. It spans six key sectors – electricity, transport, industry,
buildings, fuels and emerging low‐carbon technologies. The plan takes into account
national and international objectives for long‐term growth, future‐proofed jobs and
sustainable development goals.
Based on rigorous analysis conducted in co‐operation with the International Monetary
Fund (IMF), the Sustainable Recovery Plan has three main goals: boosting economic
growth, creating jobs and building more resilient and cleaner energy systems. The plan
sets out the policies and targeted investments for each key sector, including measures
designed to: (1) accelerate the deployment of low‐carbon electricity sources like new wind
and solar, and the expansion and modernisation of electricity grids; (2) increase the spread
of cleaner transport such as more efficient and electric vehicles, and high‐speed rail; (3)
improve the energy efficiency of buildings and appliances; (4) enhance the efficiency of
equipment used in industries such as manufacturing, food and textiles; (5) make the
production and use of fuels more sustainable; and (6) boost innovation in crucial
IEA.
All
right
s res
erve
d

14 World Energy Outlook 2020 | Special Report
technology areas including hydrogen, batteries, carbon capture utilisation and storage, and
small modular nuclear reactors.
Governments are set to make major decisions that will affect huge amounts of
investment and shape infrastructure and industries for decades to come. Massive
stimulus packages offer a unique opportunity to put the energy sector on a more
sustainable path. Compared with the 2008‐09 crisis, the costs of leading clean energy
technologies such as wind and solar PV are far lower, and some emerging technologies like
batteries and hydrogen are ready to scale up. Global CO2 emissions flat‐lined in 2019 and
are set for a record decline this year. While this drop, which results from lockdown
measures and their economic impacts, is nothing to celebrate, it provides a base from
which to put emissions into structural decline.
The plan provides a significant boost to jobs and growth …
Our Sustainable Recovery Plan shows it is possible to simultaneously spur economic
growth, create millions of jobs and put emissions into structural decline. Through detailed
assessments of more than 30 specific energy policy measures to be carried out over the
next three years, this report considers the circumstances of individual countries as well as
existing pipelines of energy projects and current market conditions. Achieving the results
outlined below would require global investment of about USD 1 trillion annually over the
next three years. This represents about 0.7% of global GDP.
This plan can add 1.1 percentage points to global economic growth each year. It would
boost the annual growth of developing countries by around 1.3 percentage points and lead
to global GDP being 3.5% higher in 2023 than it would have been otherwise. It would also
bring lasting benefits to the global economy because investment in new infrastructure,
such as electricity grids and more energy‐efficient buildings and industries, would improve
the overall productivity of both workers and capital. The measures would also accelerate
the achievement of sustainable development goals: around 420 million people would gain
access to clean‐cooking solutions in low‐income countries, and nearly 270 million people
would gain access to electricity.
The effect on employment would be significant, saving or creating roughly 9 million jobs
a year over the next three years. Our new IEA energy employment database shows that in
2019, the energy industry – including electricity, oil, gas, coal and biofuels – directly
employed around 40 million people globally. Our analysis estimates that 3 million of those
jobs have been lost or are at risk due to the impacts of the Covid‐19 crisis, with another
3 million jobs lost or under threat in related areas such as vehicles, buildings and industry.
The largest amount of new jobs would be in retrofitting buildings and other measures to
improve their energy efficiency, and in the electricity sector, particularly in grids and
renewables. The other major areas where jobs are created or saved include energy
efficiency in industries such as manufacturing, food and textiles; low‐carbon transport
infrastructure; and more efficient and new energy vehicles.
IEA.
All
right
s res
erve
d

Executive Summary 15
The global energy sector would also become more resilient, making countries better
prepared for future crises. Investment in enhancing and digitalising electricity grids,
upgrading hydropower facilities, extending the lifetime of nuclear power and increasing
energy efficiency would improve electricity security by lowering the risk of outages,
boosting flexibility, reducing losses and helping integrate larger shares of variable
renewables such as wind and solar PV. Electricity grids, the backbone of secure and reliable
power systems, would see a 40% increase in investment after years of decline. This would
put them on a stronger footing to withstand natural disasters, severe weather and other
potential threats.
… and helps put the world on a trajectory in line with international climategoals
As a result of the Sustainable Recovery Plan, annual energy‐related greenhouse gas
emissions would be 4.5 billion tonnes lower in 2023 than they would be otherwise. After
the 2008‐09 financial crisis, global CO2 emissions bounced back with the largest increase
ever recorded as the world economy started growing again. The Sustainable Recovery Plan
would avoid that kind of rebound in emissions and instead put them into structural decline
while still generating economic growth and creating jobs. Air pollution emissions would also
decrease by 5% as a result of the plan, reducing health risks around the world.
The plan would make 2019 the definitive peak in global emissions, putting them on a
path towards achieving long‐term climate goals, including the Paris Agreement. Energy
efficiency measures would deliver the largest overall emissions reductions under the plan,
accompanied by a major increase in low‐carbon electricity generation. Emissions of
methane, a potent greenhouse gas, from oil and gas operations would fall. Around one‐
third of the reductions in greenhouse gas emissions would result from measures that also
save money for consumers and industries. The process of reforming inefficient fossil fuel
subsidies would also accelerate, taking advantage of low oil and gas prices to avoid hurting
consumers.
Governments have a once‐in‐a‐lifetime opportunity to shape a better energy future
A wide range of policies, initiatives and new regulatory frameworks would be required to
support the deployment of this plan. The focus for governments should be to deliver
resilient and clean energy projects that are shovel‐ready. They also need to develop a
strong pipeline of new projects and to tailor support for distressed industries such as the
auto sector. Creating the right investment conditions will be critical for mobilising large
quantities of private capital and ensuring that this aligns with the goals of the Sustainable
Recovery Plan. International co‐operation is also essential to help align different countries’
actions and re‐establish global supply chains.
IEA.
All
right
s res
erve
d

16 World Energy Outlook 2020 | Special Report
The IEA has been leading the calls for governments to make the economic recovery as
sustainable and resilient as possible. We first conducted detailed analysis of the impact on
global energy demand and assessed the damage caused in key areas. With this report, we
are identifying the most effective measures available to governments as they consider their
recovery plans. The Sustainable Recovery Plan is not intended to tell governments what
they must do. It seeks to show them what they can do. The IEA is providing decision‐makers
in government, industry and the investment community with the strongest possible data,
analysis and policy options to help them choose the best path forwards. We are bringing all
of these groups together to identify how to act on the findings of this report at the IEA
Clean Energy Transitions Summit on 9 July 2020.
IEA.
All
right
s res
erve
d

Chapter 1 | Covid-19 and energy: setting the scene 17
Chapter 1
Covid-19 and energy: setting the scene
• The economic crisis caused by the coronavirus pandemic is prompting governmentsaround the world to enact emergency support measures. Understandably, most ofthe measures announced so far focus on healthcare and financial support forvulnerable households and businesses. There are large variations betweencountries, but the announced fiscal measures in G20 countries represent around 7% of each country’s gross domestic product on average.
• The energy sector has played a vital role in supporting the delivery of healthcare,remote working and many other needs. Like many other sectors, it has been stronglyaffected by the Covid-19 crisis. Global energy demand is estimated to fall by around6% in 2020 relative to 2019. We estimate that around 8% of the 40 million jobsdirectly provided by the energy sector are at risk or have already been lost.Electricity from renewables could be the only energy source to grow in 2020, thanksto new capacity additions and priority dispatch.
• Attention is now turning to longer term recovery plans that seek to repair theeconomic damage being caused by Covid-19, minimise job losses among the300 million jobs thought to be at risk globally, and help to create new jobs. Decisionsmade now will inevitably shape infrastructure and industries for decades.
• Recovery plans need to be aligned with long-term national and global objectives onenergy resilience and sustainable development, and it is essential that they focus onclean energy transitions if those are to be met. Annual global CO2 emissions areexpected to fall by around 8% in 2020, predominantly due to the downturn ineconomic activity, but recoveries from previous global economic crises havegenerally been accompanied by a large jump in emissions. A similar rebound inemissions can be expected after this crisis unless there is effort by governments toplace clean energy transitions at the heart of the economic recovery.
• This report analyses sector-by-sector over 30 specific energy measures thatgovernments may wish to include in their economic recovery plans. It draws on newIEA analysis of the direct and indirect jobs created by different measures and – incollaboration with the International Monetary Fund – presents an assessment of theimpact of these measures on global economic growth. On this basis, we set out asustainable recovery plan – a collection of measures and associated policies,initiatives and regulatory frameworks for countries to consider in the light of theirown circumstances – with a view to deliver a cleaner, affordable, more secure andmore resilient energy system, and at the same time provide a major boost toemployment and economic growth.
S U M M A R Y
IEA.
All
right
s res
erve
d

18 World Energy Outlook 2020 | Special Report
1.1 Introduction
The Covid-19 pandemic has delivered a brutal shock to countries around the world. The immediate focus of governments has necessarily been on healthcare, with parallel emergency financial and economic interventions to provide essential support to citizens and businesses, and to help avert economic meltdown.
The energy sector has played a vital role at this time of crisis, not least in enabling the provision of digital services. In most regions, the energy sector, in particular electricity, has enabled hospitals to provide care, food to be delivered, and allowed millions of people to work remotely and be home-schooled: it has also underpinned digital connections with family and friends. Where access to reliable electricity remains a challenge, the impact of this on health services, economic activity and the wellbeing of households during the crisis has served to underline the urgency of achieving universal access to energy (IEA, 2020a).
The enormity of the shock caused by the economic crisis – the largest since the great depression of the 1930s – is prompting governments around the world to develop recovery packages on a scale that will shape infrastructure and industries for decades to come. These packages offer a significant opportunity to advance national and global objectives for long-term growth and sustainable development. If well designed, the parts of these packages focussed on the energy sector have the potential to deliver both jobs and growth, as well as an energy system that is cleaner, more secure, resilient and cost-effective.
A unique feature of the Covid-19 crisis is that governments have had to take short-term measures that actively suppress economic activity, and it is possible that some of these measures could continue for some time. Reduced economic activity has been accompanied by a steep drop in carbon dioxide (CO2) emissions. However, these emissions are very likely to rebound as economies recover, making it increasingly hard to meet sustainable development goals related to climate and health, and to mitigate other energy risks – notably those related to climate resilience1 – in the coming decades. By putting clean energy transitions at the heart of recovery, governments can help to bring about the structural changes needed to ensure that economic recovery is not associated with an unsustainable rebound in CO2 emissions and local air pollution.
This special report analyses energy-related measures that could be included in recovery plans and quantifies their implications for jobs, emissions and energy sector resilience. It proposes a variety of measures that could provide a major boost to economies, generate millions of new jobs, make the energy sector more resilient, and provide a pathway towards achieving long-term climate and sustainable development objectives. Some measures are likely to be more suitable for particular countries than others, depending on national circumstances. If countries were to align their actions, however, there could be
1 Resilience of the energy sector refers to the capacity of the energy system or its components to cope with a hazardous event or trend, such as war, famine and extreme weather. Because climate change can create conditions that will negatively impact the energy sector, resilience becomes increasingly important (IEA, 2015).
IEA.
All
right
s res
erve
d

Chapter 1 | Covid-19 and energy: setting the scene 19
1
synergistic gains from better integrated supply chains, cost reductions associated with cumulative deployment and policy/regulatory co-ordination across markets. Such co-ordination could make for a more cost-effective and quicker recovery for all.
The report is structured as follows:
Chapter 1 sets the scene. It assesses the macroeconomic impact of the Covid-19 pandemic and its impact on the energy sector, including on energy demand, investment and employment. It looks at the emergency economic measures announced or implemented by governments to date. It examines the lessons for clean energy transitions from stimulus plans in the wake of the 2008-09 financial crisis and the case for energy being an important part of stimulus programmes. The chapter concludes with an overview of some of the main ways in which the unique set of circumstances created by the Covid-19 crisis may influence the design and implementation of sustainable recovery plans.
Chapter 2 assesses a number of energy sector measures in six areas: electricity, transport, industry, buildings, fuel supply and strategic opportunities in technology innovation. It looks at both the short-term and longer term implications of these measures for job creation, economic growth and energy security, resilience and emissions. It takes account of major original analysis that has been undertaken for this report on current employment in the energy sector and the potential for future job creation. Not all measures are applicable to all countries, but given the breadth of the measures covered, we hope that all countries will be able to find measures that are relevant to their particular situation and gain insights from the various specific examples presented.
Chapter 3 presents a sustainable recovery plan for policy makers to consider, taking account of the individual circumstances of their countries and their strategic long-term energy security and sustainability goals. It aims to help countries deliver their energy security and sustainable energy goals while at the same time boosting jobs and economic recovery. The gross domestic product (GDP) impacts were assessed in co-operation with the International Monetary Fund (IMF).
1.2 Macroeconomic impacts of the crisis It is still unclear how long the current health crisis will last and how deeply the pandemic and related containment measures will impact global trade fundamentals, businesses, consumer behaviour and investor confidence. By mid-April 2020, lockdown measures were at their peak, with the governments of countries representing almost 60% of the global economy having mandated full or partial lockdowns, resulting in huge job and output losses (IEA, 2020a). By mid-May, around one-third of the global population remained under full or partial lockdown (Figure 1.1).
IEA.
All
right
s res
erve
d

20 World Energy Outlook 2020 | Special Report
Figure 1.1 ⊳ Share of global population under containment measures, 2020
Measures to contain the spread of the pandemic started at the end of January. In mid-May, around one-third of the global population remained under full or partial lockdown.
Sources: IEA analysis based on Oxford Covid-19 Government Response Tracker; UNESCO Covid-19 Educational Disruption Database; UN 2019 Revision of World Population Prospects; and coronavirusmeasures.herokuapp.com, accessed 3 June 2020.
The Organisation for Economic Co-operation and Development (OECD) expects the global economy to contract by around 6% in 2020, on the assumption that a second wave of infections is avoided during the second-half of 2020: this would be the largest economic dip since the global depression of the 1930s (OECD, 2020).2 This is similar to a projection by the IMF which assumes long-lasting containment measures, but no second wave of infections (IMF, 2020a). GDP is expected to shrink in nearly every country in 2020, although with significant variation reflecting their differing circumstances. As economic growth projections have been revised downwards, the unemployment count has continued to rise. Worldwide, some 300 million full-time jobs could be lost and nearly 450 million companies are facing the risk of serious disruption (ILO, 2020).
There has been a high degree of volatility in global energy markets, with a major drop in oil and natural gas prices in early March 2020. This is of particular concern for countries in which the production and export of oil and gas are central to financing national budgets (IEA, 2018). Oil and gas income in producer economies such as Iraq, Nigeria, Algeria, Oman and Angola could fall by as much as 80% in 2020. This would reduce their income to its lowest level in over two decades (IEA, 2020b) at a time when the social and health infrastructure of many of these countries face significant strains and their public finances are in worse shape than during the previous oil price shock in late 2014. Such reductions would reinforce the importance of economic diversification but also undercut the means to support it.
2 Values presented for the year 2020 are estimates.
20%
40%
60%
80%
100%
1 January 1 February 1 March 1 April 1 May 1 June
Full lockdown Partial lockdownNon-essential businesses closed Schools and universities closed Ban on public gatherings
IEA.
All
right
s res
erve
d

Chapter 1 | Covid-19 and energy: setting the scene 21
1
Low-income countries are facing additional pressures in dealing with the pandemic and its fallout. The ability to mitigate immediate health risks is often compromised by a lack of access to sanitation and public health infrastructure, high household occupancy rates and a significant number of low-income, often informal jobs which cannot be carried out remotely, making it hard to practise social distancing. In 27 sub-Saharan African countries, close to 60% of health centre facilities are without access to reliable electricity (IEA, 2019), and over 860 million people worldwide lack access to electricity, severely limiting their ability to store medicines and food, charge phones, access digital information, maintain access to education remotely or light their homes effectively (IEA, 2019b).
Many developing economies also have less capacity than advanced economies to boost spending on health measures, provide emergency assistance to workers, households and businesses, and rekindle their economies. This is because it is harder for them to deploy many of the fiscal and monetary levers that are available to advanced economies. In addition, developing economies often face high levels of debt service: many countries in sub-Saharan Africa spend more on interest repayments than healthcare. Remittance flows, which can be a significant source of revenue for many economies, could also fall by around a fifth in 2020 due to job losses in wealthier countries (World Bank, 2020). International co-operation, assistance and aid will be critical to ensure that developing economies do not suffer disproportionately from the fallout of the crisis.
1.3 Covid-19 crisis and the energy sector
Based on data for the first four months of 2020, and on the assumption of a gradual recovery in the global economy, we estimate that total primary energy demand will drop in all major regions and contract globally by around 6% in 2020 (Figure 1.2). This would amount to a shock around seven-times larger than occurred during the 2008-09 financial crisis.
Oil demand is expected to drop by around 8% on average across the year. Demand in April declined by 25%, with transport demand dropping particularly sharply. Demand is expected to pick up as economic activity increases, but a number of uncertainties remain over the speed and magnitude of the rebound (IEA, 2020c).
Natural gas demand is expected to fall by around 4%, which would constitute one of the largest contractions since natural gas became a major industry. However, the recent major reduction in gas prices, together with the widespread availability of liquefied natural gas, have created a cushion for gas demand and made it more competitive with coal, including in many Asian countries.
Coal demand is expected to drop by 8% in 2020, the largest contraction since World War II, as a result of reductions in demand in major coal consuming countries, including India. Declines in electricity demand are the principal cause of lower coal use.
Nuclear power is set to fall by 2.5% from 2019 levels due to lower demand and delays both in refuelling existing projects and in operations at new plants.
IEA.
All
right
s res
erve
d
22 World Energy Outlook 2020 | Special Report
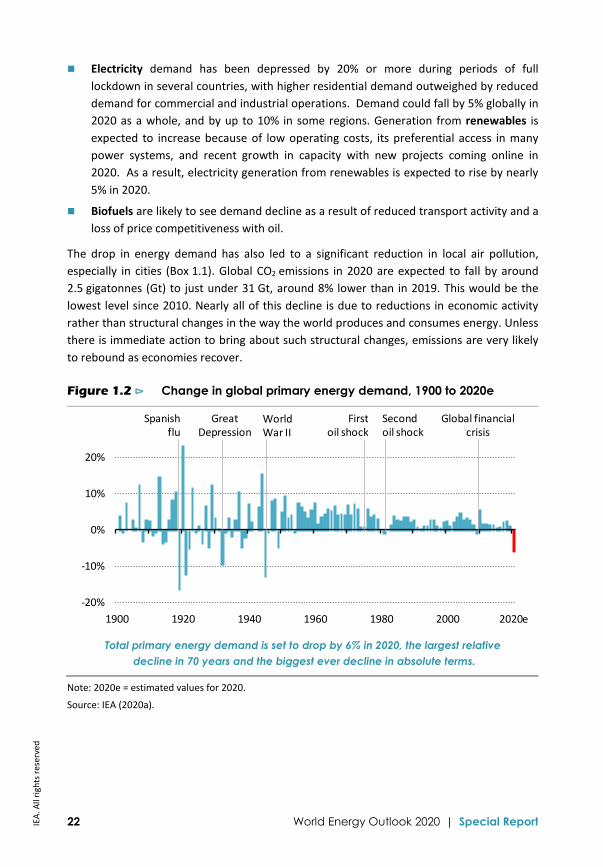
Electricity demand has been depressed by 20% or more during periods of full lockdown in several countries, with higher residential demand outweighed by reduced demand for commercial and industrial operations. Demand could fall by 5% globally in 2020 as a whole, and by up to 10% in some regions. Generation from renewables is expected to increase because of low operating costs, its preferential access in many power systems, and recent growth in capacity with new projects coming online in 2020. As a result, electricity generation from renewables is expected to rise by nearly 5% in 2020.
Biofuels are likely to see demand decline as a result of reduced transport activity and a loss of price competitiveness with oil.
The drop in energy demand has also led to a significant reduction in local air pollution, especially in cities (Box 1.1). Global CO2 emissions in 2020 are expected to fall by around 2.5 gigatonnes (Gt) to just under 31 Gt, around 8% lower than in 2019. This would be the lowest level since 2010. Nearly all of this decline is due to reductions in economic activity rather than structural changes in the way the world produces and consumes energy. Unless there is immediate action to bring about such structural changes, emissions are very likely to rebound as economies recover.
Figure 1.2 ⊳ Change in global primary energy demand, 1900 to 2020e
Total primary energy demand is set to drop by 6% in 2020, the largest relative decline in 70 years and the biggest ever decline in absolute terms.
Note: 2020e = estimated values for 2020.
Source: IEA (2020a).
-20%
-10%
0%
10%
20%
1900 1920 1940 1960 1980 2000 2020e
Second oil shock
Global financialcrisis
Great Depression
World War II
First oil shock
Spanish flu
IEA.
All
right
s res
erve
d

Chapter 1 | Covid-19 and energy: setting the scene 23
1
Box 1.1 ⊳ Effects of lockdowns on traffic congestion and air quality in cities
More than 90% of people worldwide are exposed to unsafe levels of fine particulate matter (PM2.5) over their lifetimes. Outdoor air pollution still accounts for around 3 million premature deaths globally, mostly in middle income countries in the Middle East and Asia.
In regions with lockdowns, there was a decrease of 50-75% in road transport activity and up to 95% in rush-hour traffic congestion in major cities. Road vehicles are a major source of nitrogen dioxide (NO2) in cities. There were many recorded declines in NO2 concentrations, probably due to the lockdowns (Figure 1.3). For example, average NO2 concentrations in Milan were around 17% lower during the two week period after the start of its lockdown than during the two weeks before. The most polluted cities saw some of the biggest improvements in overall air quality: in New Delhi a major reduction in rush-hour traffic congestion during the first weeks of lockdown coincided with a 66% drop in NO2. Cities in the People’s Republic of China (hereafter China) and India also recorded reductions in sulfur oxide (SOX) concentrations as industrial activities were curtailed.
The impact of lockdowns on levels of PM2.5 is not as clear-cut. Road traffic typically accounts for less than a third of PM2.5 emissions. The majority of PM2.5 emissions come from other sources such as industrial activity, space heating in buildings and agriculture. Therefore the impact of reduced road traffic on PM2.5 emissions is likely to be smaller than on NO2 emissions. Local weather conditions can also drive large fluctuations in NO2 and PM2.5 concentrations, making it hard to see the effects of the relatively small reductions in PM2.5 emissions in concentration levels. For example, in New Delhi and Paris there were marked increases in average concentrations of PM2.5 during the two weeks after lockdown compared to the previous two weeks, while in Milan there was little significant change. This underlines the need for efforts to reduce PM2.5 in line with the UN Sustainable Development Goal 3.9 to be wide ranging.
After the Severe Acute Respiratory Syndrome (SARS) outbreak in 2003 it was shown that previous exposure to air pollution dramatically increased the risk of death (Cui et al., 2003). Although a connection between air pollution and mortality rates from Covid-19 has yet to be established, several recent studies have pointed towards a link between areas of high pollution and high death rates (Conticini, Frediani and Caro, 2020). In northern Italy, which has some of the highest concentrations of PM2.5 in Europe, death rates from Covid-19 are markedly higher than in the rest of the country. Causation, however, is difficult to establish: other factors such as demographics and population density may be important. There may also be a connection between the likelihood of becoming infected with Covid-19 and levels of particulate matter pollution, as one preliminary study reports that the Covid-19 virus has been found attached to samples of micro-particulate pollutants (Setti et al., 2020).
IEA.
All
right
s res
erve
d

24 World Energy Outlook 2020 | Special Report
Figure 1.3 ⊳ Change in air quality index and rush-hour traffic congestion before and after lockdowns in selected cities
Changes in air quality between the weeks before and after lockdowns only partially reflect decreased congestion as most PM2.5 emissions do not come from road vehicles.
Notes: Rush-hour traffic congestion refers to the expected percentage increase in travel time compared to free-flow conditions on an average Monday at 09:00. Change in traffic congestion 2019 annual average versus April 2020.
Source: IEA analysis based on TomTom International (2020).
1.3.1 Energy sector investment
Volatile commodity prices and suppressed energy demand will leave many energy companies with weakened financial positions and strained balance sheets. As a result, spending has been reined in, project workers have been confined to their homes, planned investments have been delayed, deferred or shelved and supply chains have been disrupted. We expect that investment in the energy sector in 2020 will experience its largest decline on record with a reduction of one-fifth – almost $400 billion – in capital spending compared with 2019 (IEA, 2020d).
The oil and gas sector has experienced the largest reduction in investment of any energy sector as a result of diminished revenues that reflect less demand and lower prices, and uncertainties about future prospects. We estimate a decline in oil and gas investment in 2020 of around one-third compared with 2019. The power sector has been less exposed to price volatility, and cuts in investment announced by companies are lower, yet we estimate a drop of 10% in capital spending. Investment in renewable energy has been relatively resilient, compared with fossil fuels, but is still set to fall by around 10%. In addition, sharp reductions in vehicle sales, construction and industrial activity are set to stall progress in improving energy efficiency.
-100%
-50%
0%
50%
New Delhi Milan Bangkok New York Paris
Congestion
NO₂
PM2.5
IEA.
All
right
s res
erve
d

Chapter 1 | Covid-19 and energy: setting the scene 25
1
The share of investment in low-carbon technologies (such as renewables, efficiency, nuclear, carbon capture, utilisation and storage [CCUS]) has held at around one-third of total energy sector investment in recent years. It is likely to jump towards 40% in 2020, but only because investment in fossil fuels is set to drop sharply. In absolute terms, it remains far below the levels that would be required to accelerate clean energy transitions (Figure 1.4). The IEA’s Sustainable Development Scenario3 sees annual investment in electricity networks in the 2025-30 period that is around 50% above the level seen in 2019, and annual investment in power from renewables that is around 90% higher.
Figure 1.4 ⊳ Energy sector investment in 2019 and 2020e, and annual average investment in the Sustainable Development Scenario
Investment levels have dropped across the board, especially in oil and gas. Power sector investments are at half the levels seen in the Sustainable Development Scenario.
* Annual average in the Sustainable Development Scenario. Note: 2020e = estimated values for 2020.
Source: IEA (2020d).
1.3.2 Jobs in the energy sector
The energy industry4 is a major employer that directly employed around 40 million people around the world in 2019. Of these, around 17 million worked in electricity generation and networks, and around 20 million in the production, transport and distribution of fossil fuels, and a further 3 million in the production, transport and distribution of bioenergy (Figure 1.5).
3 The Sustainable Development Scenario sets out a pathway for the development of the global energy sector consistent with the goals of the Paris Agreement and UN Sustainable Development Goals related to air pollution and energy access (IEA, 2019b). 4 The “energy industry” encompasses all supply of fuels to end-uses, including the production, transformation and provision of solid, liquid and gaseous fuels to consumers, together with the power sector, including the operation, development and manufacturing of power generation technologies, networks and storage.
200
400
600
800
1 000
1 200
2019 2020e 2025-30* 2019 2020e 2025-30*
Billi
on d
olla
rs
Oil Gas Renewable power Fossil fuel powerCoal Biofuel and biogas Nuclear Electricity networks
Fuel supply Power sector
IEA.
All
right
s res
erve
d

26 World Energy Outlook 2020 | Special Report
Figure 1.5 ⊳ Energy sector, energy efficiency and vehicle manufacturing jobs at risk post Covid-19 and share of total sector employment
Fossil fuels, bioenergy and vehicle manufacturing have the highest share of jobs at risk. Oil and gas, energy efficiency and vehicles have the largest gross number of jobs at risk.
Of the roughly 17 million people working in electricity generation and networks, nearly 12 million were employed in electricity generation in 2019, with around 30% of those involved in the operation and maintenance of existing plants, and the remainder involved in the building of new power plants (including construction and manufacturing activities). The solar industry is the largest employer in the power sector, with over 3 million employed, mainly in manufacturing and construction, followed by employment in coal at roughly 2.5 million, hydropower at 2 million and wind at about 1 million. Electricity networks employed around 5 million globally, with roughly a quarter of jobs in transmission and three-quarters in distribution. About 90% of those jobs are in utilities and related projects, and around 10% are associated with equipment manufacturers.
Of the roughly 20 million people working in fossil fuel industries, the oil and gas sector employed over 13 million people in 2019, with around 5 million of those working in oil field services, the market segment impacted the most by low prices. Coal extraction, processing and delivery employed roughly 6.5 million globally in 2019. Coal mining, particularly in China and India, employs a large number of unskilled labourers in low-income regions, and the industry is an important element of socio-economic stability in these regions.
Economy-wide labour hours are expected to be down 10.5% in the second-quarter 2020 due to Covid-19, the equivalent of 305 million full-time jobs (ILO, 2020). We estimate around 6 million jobs across the energy sector, energy efficiency and vehicle manufacturing have been lost or are at risk of being permanently lost due to Covid-19 impacts.5 Jobs in
5 These estimates reflect neither those jobs likely to resume after furlough measures nor lost labour wages associated with lockdowns.
4% 8% 12% 16%
0.5 1.0 1.5 2.0
Oil and gas
Coal
Electricity
Bioenergy
Energy efficiency
Vehicle manufacturing
Million jobs
Jobs at structural risk Share of sector employment (bottom axis)
IEA.
All
right
s res
erve
d

Chapter 1 | Covid-19 and energy: setting the scene 27
1
fossil fuel industries are likely to be hardest hit due to sustained low prices, especially in oil and gas, where more than 1.2 million job losses are expected in upstream operations. Global employment in coal, which has already been on a downward trend in recent years, could drop by around a further 0.7 million jobs, driven primarily by decreasing demand for coal in the power sector and fuel switching to low price natural gas.
Jobs in operating power plants and networks are likely to be less affected, as electricity demand is expected to return more quickly and since electricity grids have to continue to operate reliably. The majority of power sector job losses are related to expected declines in new investment for generation and grid projects. Many projects currently on hold are expected to resume after lockdown measures are lifted, but some face being postponed until electricity demand increases. Developers and manufacturers in both power generation and networks are bracing for a decreased pipeline of new projects in the coming years; around 0.6 million jobs have already been lost or are at risk in the longer term.
The transport sector and energy efficiency have significant impacts on improvements in energy intensity; both are expected to see sharp job losses due to the pandemic. We estimate that around 1.3 million jobs in energy efficiency are at risk worldwide, primarily in construction associated with retrofits and manufacturing of efficient appliances. Automobile and parts manufacturers employ around 13 million globally, including contract workers, with alternative fuel vehicles representing roughly 10% of total employment. Car sales are expected to decline by 15% in 2020, with the decrease in sales being most pronounced for efficient internal combustion engine vehicles, and more moderate declines for alternative fuel vehicles, in particular electric vehicles (EVs) (IEA, 2020e). Aviation directly employs6 about 10 million people worldwide of which about 1.2 million are in civil aerospace, where fewer orders for new planes will decrease jobs and slow improvements in fleet efficiency (IATA, 2020).
Sustaining and creating employment is a major priority for policy makers and is fundamental for economic recovery. To provide a full understanding of the implications and design of recovery packages, we have undertaken a new global analysis of jobs in the energy sector. This analysis was conducted by energy sectors and by regions, and estimates pre-pandemic employment, potential job losses and the job creation potential of various investments targeted in stimulus measures. This analysis is discussed at length in Chapters 2 and 3. (For more information on the detailed jobs analysis conducted for this report and its methodology, please refer to Annex A.)
6 This includes airport operators, airlines, civil aerospace (the design, manufacturing and testing of aeroplanes) and air navigation service providers.
IEA.
All
right
s res
erve
d

28 World Energy Outlook 2020 | Special Report
1.4 How should governments respond?
While significant uncertainty lingers on the length, depth and impacts of the Covid-19 crisis, there is a broad consensus on the need for well-designed packages of measures that will support economic recovery. The pandemic is global and its impacts – though uneven – are global too. This suggests that packages of measures are likely to be more effective if they involve some elements of international co-operation.
Table 1.1 ⊳ Emergency financial and economic support measures in selected countries and regions (as of 4 June 2020)
Braz
il
Chin
a
Euro
pean
Uni
on
Indi
a
Japa
n
Saud
i Ara
bia
Sout
h A
fric
a
Sout
heas
t Asi
a
Uni
ted
Stat
es
Financial system stability
Ease in implementation of fiscal rule, flexibility within accounting and prudential rules, central bank intervention.
● ● ● ● ● ● ● ● ●
Social measures Emergency safety net for vulnerable households
Government loans, direct payments, tax cuts/deferral,
extension of rent/mortgage payment deadlines, food assistance. ● ● ● ● ● ● ● ● ●
Emergency safety net for workers
Enhanced/extended unemployment insurance/wage subsidies. ● ● ● ● ● ● ● ● ● Business support
Direct tax rebates ● ● ● ● ● ● ● ● Liquidity provisions for SMEs Loans, credit guarantees. ● ● ● ● ● ● ● ● ● Forbearance (debt, tax, bills) ● ● ● ● ● ● ● ● ● Support to exporters ● ● ● ● ● ● Bailouts, grants and/or subsidies ● ● ● ● ● ●
Energy sector support
Public investment/support for ongoing projects; government loans and bailouts for energy companies and targeted support for their workers; purchase of oil stocks; energy access measures.
● ● ● ● ● ● ●
Notes: Prudential rules = regulations requiring that financial firms maintain adequate capital and have appropriate risk controls in place. SMEs = small and medium enterprises. Data for the European Union and the Association of Southeast Asian Nations (ASEAN) encompass measures taken at member state level as well as at the regional association level. As of 11 May 2020, the Saudi Arabian government had announced fiscal consolidation measures (increased consumption tax, suspension of a cost-of-living allowance for civil servants).
Sources: IEA analysis based on official communications, as compiled in the OECD Country Policy Tracker; IMF Policy Responses to Covid-19; Gentilini et al. (2020).
IEA.
All
right
s res
erve
d

Chapter 1 | Covid-19 and energy: setting the scene 29
1
Many governments remain primarily focussed on emergency relief packages that target the health sector, as well as on maintaining financial stability and providing emergency support to households and businesses (Table 1.1). In response to the pandemic, many countries implemented some form of health and containment measures, although these differed in scope and duration. Around one-third of the global population was subject to complete or partial lockdowns in mid-May 2020, and nearly the entire global workforce was affected by some form of containment measure.
Social protection measures have been implemented or extended in about 160 countries and form the bulk of short-term policy responses (Gentilini et al., 2020). Wage subsidies are among the most common measures, and many governments are going beyond formal employment support to provide explicit help to informal workers. Argentina, Brazil, Ecuador, Egypt, India, Morocco, the Philippines and the United States are among the countries providing social assistance through cash transfers.
Many governments have also provided financial and regulatory support to small and medium enterprises (SMEs), as many of these are facing liquidity stress and solvency concerns. SMEs account for around 70% of total employment in OECD countries, and around 45% in emerging economies (OECD, 2017). Emergency response measures in many countries are also targeting sectors identified as particularly exposed or as strategically important: in some countries this has led to support for industries such as aviation and vehicle manufacturing.
The scope, orientation and duration of current emergency social and economic plans vary widely by country. They depend not only on the local severity of the health crisis and its impact, but also on fiscal policies and social and economic structures. Different national challenges mean that governments have chosen various responses tailored to their particular circumstances.
It is difficult to compare the precise sums of money that have been committed to support schemes across countries and regions, but existing plans, in terms of fiscal measures, are estimated to represent between -3% and 21% of countries' GDP (Figure 1.6), corresponding to around seven trillion dollars for G20 countries in total. At a global level, recent appraisals show that the total amount spent on fiscal measures is about nine trillion dollars (Battersby, Lam and Ture, 2020). Some of these emergency measures will have an influence in the longer term. However, as this report went to press, only a handful of governments had announced intentions to implement medium-term plans beyond the immediate economic and financial relief measures.
IEA.
All
right
s res
erve
d

30 World Energy Outlook 2020 | Special Report
Figure 1.6 ⊳ Emergency fiscal measures announced by G20 countries in response to the Covid-19 crisis
In G20 countries, emergency fiscal measures vary between -3% and 21% of GDP – similar to the large variation of final recovery plans after the 2008-09 financial crisis.
Notes: Includes measures announced to 7 June 2020. US dollars are presented in 2019 purchasing power parities. GDP is expressed in real terms. In Saudi Arabia, fiscal consolidation measures correspond to a net negative package.
Sources: IEA analysis based on Elgin, Basburg and Yalaman (2020); IILS (2011).
1.4.1 How the energy sector features in announced emergency and recovery plans
So far, the energy sector features in a number of emergency plans, although not as a primary target. These energy-related measures can be clustered into three key areas.
Focus on energy security and opportunities provided by lower prices. Some governments have seen an opportunity in the recent low market prices to boost strategic oil reserves, with longer term benefits for global energy security, or to take other actions. The Australian government, for example, has agreed to buy capacity in the US Strategic Petroleum Reserve. The Indian government increased excise duties on petrol in order to generate public revenues earmarked for post Covid crisis recovery.
-5% 0% 5% 10% 15% 20% 25% 30%
- 500 0 500 1 000 1 500 2 000 2 500 3 000 3 500
ArgentinaAustralia
BrazilCanada
ChinaFrance
GermanyIndia
IndonesiaItaly
JapanMexicoRussia
Saudi ArabiaSouth Africa
KoreaTurkey
United KingdomUnited States
Package
Share of GDP(bottom axis)
Billion dollars (2019)
IEA.
All
right
s res
erve
d

Chapter 1 | Covid-19 and energy: setting the scene 31
1
Revising or reaffirming commitments to clean energy transitions. In the context of responding to the crisis, a number of countries in the European Union are implementing or considering measures to accelerate clean energy transitions. The Netherlands has continued with legislative processes for the implementation of national carbon taxes and, along with Spain, has reasserted commitments to achieve climate change targets. Germany announced a series of measures incorporating purchase incentives for electric and hybrid vehicles, financial support for charging stations and battery production and public investment to expand the production of low-carbon hydrogen. Austria and Sweden have completed their phase-out of coal power generation ahead of schedule. Denmark has set out plans to invest heavily in energy efficiency improvements in social housing and to build two artificial islands for energy purposes and target a minimum combined 4 gigawatts (GW) of offshore wind capacity by 2030. The European Commission’s proposal for a new €750 billion recovery instrument aims to support member states to accelerate clean energy transitions.
In the United Kingdom, budgetary plans set out in March include provisions to enable the funding of at least two carbon capture storage clusters by 2030. In Korea, the government’s recovery plans encompass a number of measures that aim to achieve a net zero greenhouse gas emissions target in 2050, ranging from investments in renewable energy sources to the introduction of a carbon tax and targeted support for fossil fuel industry workers transitioning to other sectors. In China, plans and objectives announced during the convening of the National People's Congress in May 2020 include additional investments in electric and fuel cell vehicles, as well as in new infrastructure supporting digitalisation, EV charging stations and ultra-high electricity transmission. China’s government extended financial support that had been set to expire at the end of 2020 to 2022 to cushion the impacts of the Covid-19 epidemic on new EV markets.
A number of countries have confirmed or extended their support for clean energy projects. In France, deadlines for contracting and grid connection for project developers were extended, and the level of feed-in-tariffs was frozen to accommodate delays due to supply chain disruptions or labour constraints. The Portuguese government has confirmed its intention to start the construction of a 1 GW solar-powered hydrogen plant in the coming year. The UK government has maintained the original timetable for wind auctions, and is continuing public consultations on its proposed support scheme for biomethane injection into the grid. In India, the government listed renewable energy installations as essential services, allowing the workforce to continue operations as needed. In Indonesia, the government has reconfirmed its plan to enact a new regulation on renewable energy that had been announced before the epidemic. A number of governments have also defined climate change or environmental conditions for access to public support. For instance, in Canada authorities have included annual environmental planning and reporting requirements among the conditions that large firms will need to meet in order to qualify for its emergency loan programme. They also announced funding for the decommissioning of inactive and orphan wells in three provinces, as well as a fund to support the oil and gas
IEA.
All
right
s res
erve
d

32 World Energy Outlook 2020 | Special Report
sector in reducing methane emissions. The Austrian and French governments, among others, have signalled a willingness to link airline bailouts to environmental conditions.
At the same time, however, some countries have chosen to delay a number of decisions related to clean energy transitions. For example renewable energy auction schedules have been subject to partial or full postponement in Chile, China, France, Germany, Ireland and Portugal. In Brazil, where power sector auctions have also been postponed, the flagship policy to enhance biofuel targets in its transport sector may be adjusted in a way that affects planned reductions in CO2 emissions.
Creating safety nets for companies and consumers. A number of governments have introduced measures to defer energy bills or provide other support for vulnerable households and businesses. In Togo, for example, households with “solar home” systems operated by private companies participating in the national electrification programme have been offered free services and payment deferrals. Governments are also implementing measures to help utility companies. In Brazil, tariff revision cycles have been suspended to avoid increases in consumer prices, and funds have been provided to improve power sector liquidity and to help utilities provide consumer subsidies. Liquidity injections and state-guaranteed loans have also been provided to electricity distribution companies in India. As part of wider responses to support heavy industries, some governments have implemented specific support measures for the oil and gas sector, notably in the form of loans in the United States.
1.4.2 Lessons from the 2008-09 financial crisis for stimulus spending on clean energy technologies
The current economic crisis differs in a number of ways from the financial crisis in 2008-09, and the ways in which countries respond will also differ. There are, nonetheless, some useful lessons to be drawn from analysing the results of the energy-related spending and support for clean energy technology in recovery plans launched in the wake of the 2008-09 global financial crisis.
While definitions of what constituted clean energy in the 2008-09 packages vary, policies targeting renewable energy generation, energy efficiency in buildings, scrappage payments for vehicles with low fuel efficiency, clean technology development support, mass transit, nature conservation and water resource management were then estimated to account for around 16% of the total global stimulus measures, totalling over half a trillion dollars (Agrawala, Dussaux and Monti, 2020). Although global clean energy investment in 2008-09 helped to unlock growth in wind and solar photovoltaic (PV) technologies, and to improve the resilience of gas and electricity networks, the overall recovery from the financial crisis generally was carbon intensive. Following an initial decline in emissions of 0.4 Gt CO2 in 2009, emissions rebounded by 1.7 Gt CO2 in 2010.
It is difficult to measure the overall effectiveness of these energy-related funds. But to take one example, spending by European Union member countries on clean energy measures
IEA.
All
right
s res
erve
d

Chapter 1 | Covid-19 and energy: setting the scene 33
1
included investment in energy efficiency, transport infrastructure, vehicle scrappage schemes, renewables and innovation. Spending on these specific measures, estimated on average to have cost around 0.3% of GDP, provided a boost to GDP at a national level of around 0.6 - 1.1%, depending on the level of ambition in each country, and as much as 1.5% at a European Union level (Cambridge Econometrics, 2011). This was in the context of a 0.1% decrease in global GDP during the financial crisis, with G7 countries7 recording an average decline of 3% (IMF, 2020b).
Some of the key lessons from the financial crisis in 2008-09 for stimulus spending on clean energy include:
Scaling up successful existing policies usually delivers the biggest economic and employment returns. The two policies that significantly increased renewable energy investment in Europe and the United States pre-dated the crisis, but were then boosted in scope and ambition as a response to the economic crisis. At one stage in 2010, the US government was providing as much project financing for renewables as the ten-largest private green investment funds combined (Mundaca and Richter, 2015). Large-scale programmes used well-known, standardised technologies and deployment approaches, for example to improve energy efficiency in industrial energy use in China. In Germany, funding allocated to energy efficiency in public buildings significantly exceeded previous investment levels. While the use of existing policy structures helped with the efficient roll out of large fiscal and investment programmes, the size, speed and choice of policy instruments led to challenges in some cases. In China, for example, reliance on rapid investment driven growth led to a surge in local government debt and to inflation in land and housing markets (Wong, 2011).
Technology readiness is critical. Clean energy stimulus investment provided strong support for wind and solar PV in 2009, creating positive feedback loops and cost declines. In the United States there was strong support for research and development for lithium-ion battery storage systems and for electric vehicles which led to accelerated cost reductions and improved standardisation of EVs and grid storage. However, a lack of sufficient maturity in 2009, combined with prevailing market conditions (in particular an oil price crash), meant that stimulus funding for technologies such as advanced biofuels and hydrogen did not lead to a material increase in manufacturing capacity.
Large infrastructure projects require careful appraisal and management if they are to fulfil expectations. Policy makers in 2008 identified energy infrastructure as a promising area for stimulus in part because of its large macroeconomic multiplier impact. While this helped the development of some clean energy infrastructure, it also led to the allocation of funding to projects that never got built, often because of complex licensing procedures (for example long-distance direct current transmission lines in the United States) or an inability to get the projects co-funded and off-the-
7 G7 countries are Canada, France, Germany, Italy, Japan, United Kingdom and United States.
IEA.
All
right
s res
erve
d
34 World Energy Outlook 2020 | Special Report
ground within the required timeframe (for example, CCUS projects in the power sector in the United States and Europe).
Stimulus spending on clean energy is most effective when synchronised with training. Experience from the United States shows that the deployment of clean energy technology is labour intensive, and that a critical success factor is including targeted education and training in programme deployment from a very early stage. Timely training (or re-training) enables workers to develop the skills needed to be ready for employment when projects are deployed (Mundaca and Richter, 2015).
Stimulus funding is most effective when it is aligned with long-term price signals. Some large low-carbon projects receiving significant public investment struggled to attract private funding due to the absence of clear, long-term price signals, such as carbon prices. Following the 2008-09 financial crisis, legislative efforts to introduce an emissions trading system in the United States were abandoned, while allowance prices in the European Union Emissions Trading System remained very low. This meant that the business case for investments such as CCUS was difficult to maintain.
1.4.3 Why is a sustainable recovery plan needed for the energy sector?
Energy has not featured prominently in the Covid-19 recovery packages proposed to date. Yet the magnitude of this crisis, as well as lessons from the 2008-09 financial crisis, combined with the long-term current trajectory of global CO2 emissions all lend credence to the case for heightening attention to the energy sector in the next phases of recovery and stimulus programmes.
Investment in energy can sustain and boost employment while helping to deliver affordable and reliable energy and to improve the resilience of energy systems. This in turn helps to support higher employment and activity levels in all parts of the economy. Investment in energy measures therefore can induce indirect economic benefits which extend far beyond the energy sector.
Furthermore, investment in energy is needed if there is to be a structural reorientation of the global energy sector that enables countries to meet their long-term goals on climate change, energy access and sustainability.
While the Covid-19 crisis could in some ways hamper efforts to develop cleaner and more resilient energy economies, in other ways it could bolster these efforts. It has, for example, led to:
A focus on the urgent need to restore existing jobs and create new ones. The massive unemployment rates around the world make labour-intensive projects that also boost the productive capacity of the economy attractive components in economic recovery and stimulus packages. Some measures in the energy sector would be excellent candidates in terms of job creation. However there is a risk that measures that are not sufficiently labour intensive (such as spending on electricity networks) may receive less
IEA.
All
right
s res
erve
d

Chapter 1 | Covid-19 and energy: setting the scene 35
1
attention, even though they could make an important contribution to improving long-term resilience and sustainability.
Changes in the monetary environment. Central banks are responding to the Covid-19 crisis by lowering interest rates and increasing quantitative easing programmes. This means that the cost of capital in many regions has fallen, which improves the economics of new capital-intensive projects such as large-scale infrastructure. However, there has also been a large increase in capital outflows from many developing economies, where monetary action is not always easy to take, private sector co-financing ability is limited and government borrowing capacity on international markets is constrained. As a result, it may be difficult for some developing countries to undertake large-scale investment programmes.
Volatility in fossil fuel markets. The recent large drop in oil demand has led to extreme oil price volatility. This has had negative consequences for key producer economies as well as for many companies: while this highlights the need for many of these countries to diversify their sources of revenue, it simultaneously makes the process of reform more challenging to implement. Natural gas prices have also fallen, which is helping the economics of coal-to-gas switching, but, at the same time, is making some efficiency measures less cost-effective.
Heightened awareness of the benefits of clean and secure energy. Air pollution in cities, largely linked to road transport and to oil and coal use, has major implications for health, and is a possible contributory factor in Covid-19-related mortality. Significant improvements in air quality during the lockdown period have underlined how much air pollution there normally is in many cities. Meanwhile more than 4 billion people have spent time in lockdown, with many working from home and home-schooling, underlining the vital importance of reliable electricity supplies.
The possibility of lasting changes to the way people behave. Some of the changes to behavioural patterns originally brought about by the Covid-19 lockdowns could continue to some extent after the immediate crisis has waned. Working from home could become more common, reducing commuter journeys and potentially reducing air pollution in cities. Conversely, due to perceived health risks, there might also be some lasting reluctance to use public transport, making it harder and slower to reduce air pollution and decarbonise transport.
IEA.
All
right
s res
erve
d

IEA.
All
right
s res
erve
d

Chapter 2 | Evaluation of possible recovery measures 37
Chapter 2
Evaluation of possible recovery measures
• This chapter assesses a menu of over 30 energy-related measures for key sectorsthat policy makers could consider as part of a plan to boost growth and create newjobs while building a more sustainable and resilient energy sector. For each measurewe examine the impacts of the Covid-19 crisis on the sector, job creation potential,cost effectiveness, and CO2 emissions reduction potential. We also suggest specificpolicies for consideration. The assessments set out in this chapter form the buildingblocks for a sustainable recovery plan for the energy sector: this plan is set out inChapter 3. The chapter covers the following sectors:
• Electricity: A range of measures could be put in place to support the expansion andmodernisation of electricity grids; accelerate new wind and solar installations andrepower existing ones; maintain the role of hydro and nuclear power, mainly bypreserving existing facilities; and manage gas- and coal-fired generation. Each optionhas the potential to create 1-14 jobs per million dollars invested, and would have very different impacts on energy resilience and sustainability.
• Transport: Car sales are expected to drop by around 15% globally in 2020.Government support through schemes such as “cash-for-clunkers” could reduce joblosses, boost the efficiency of the vehicle fleet and promote the use of electric cars.Investment in high-speed rail and urban transport – ranging from walking andcycling infrastructure, electric vehicle recharging and mass transport – hassignificant job creation potential, would reduce local air pollution and help shiftfuture transport patterns.
• Buildings: Measures to improve the efficiency of buildings and appliances could beimplemented quickly, in some cases have very short payback periods and wouldcreate 10-15 jobs per million dollars invested. In low-income countries, over2.5 billion people still lack access to clean cooking. Low LPG prices make providingaccess attractive, with payback periods of just one year, plus substantial job creationpotential.
• Industry: One-in-four jobs are in industry, and the Covid-19 pandemic hasdisproportionately hit small and medium industrial enterprises. Investing in energyefficiency, notably motors and agricultural pumps, and recycling would createaround 10 and 18 million jobs per million dollars invested respectively.
• Fuels: Investment to reduce methane emissions could mitigate some job losses inthe oil and gas sector while cost effectively reducing GHG emissions. The currentperiod of low oil and gas prices provides fertile ground for renewed efforts to phaseout fossil fuel subsidies. The biofuels sector is being hit hard by Covid-19: supporting growth in sustainable biofuels could create around 15-30 jobs per million dollarsinvested.
S U M M A R Y
IEA.
All
right
s res
erve
d

38 World Energy Outlook 2020 | Special Report
• Innovation: Technology innovation plays a crucial role in improving future energysystems, and innovation in hydrogen, batteries, small modular nuclear reactors andcarbon capture, utilisation and storage could bring enormous long-termsustainability and resilience benefits while creating 3-8 new jobs per million dollarsinvested.
2.1 Introduction
The fallout from the Covid-19 pandemic means that there is an urgent need for significant levels of investment in the energy sector to sustain and boost employment, boost economic growth, and improve future sustainability and resilience. Investment decisions made now will impact the ways in which energy is produced and consumed for decades, and they therefore need to be aligned with long-term national and global objectives.
This chapter explores a range of energy-related measures that countries may wish to consider adopting (Table 2.1). These measures do not cover every option: we have had to be selective. Where possible we quantify the impact of investing 1 million dollars on job creation; we also look at greenhouse gas (GHG) emissions, energy security and resilience, and how these factors may vary by region. When we look at job creation, we consider both jobs that would be created by spending on the measure and the jobs that could be lost as a result of the Covid-19 crisis. We also provide an overview of selected policies for each measure.
Table 2.1 ⊳ Energy sector measures analysed
Sector Measure
Electricity • Expand and modernise grids • Accelerate the growth of wind and solar PV • Maintain the role of hydro and nuclear power• Manage gas- and coal-fired power generation
Transport • New vehicles• Expand high-speed rail networks• Improve urban infrastructure
Buildings • Retrofit existing buildings and more efficient new constructions• More efficient and connected household appliances• Improve access to clean cooking
Industry • Improve energy efficiency and increase electrification• Expand waste and material recycling
Fuels • Reduce methane emissions from oil and gas operations• Reform fossil fuel subsidies• Support and expand the use of biofuels
Strategic opportunities in technology innovation
• Hydrogen technologies• Batteries• Small modular nuclear reactors • Carbon capture, utilisation and storage
IEA.
All
right
s res
erve
d

Chapter 2 | Evaluation of possible recovery measures 39
2
The assessments in this chapter provide the buildings blocks for an integrated recovery plan. Chapter 3 sets out a sustainable recovery plan for the energy sector that draws on these assessments: it also sets out and explains the criteria that determine the inclusion of the measures in the plan.
2.1.1 Overview of findings on jobs and emissions
Job creation1
To standardise the comparison of employment creation, we have developed employment multipliers for the various measures based on the gross number of jobs that would be produced for every million dollars of spending. These numbers represent global weighted averages for the gross direct and indirect jobs created by the spending. Jobs that may be induced (or lost) by the subsequent spending (or saving) of the new workers are not included.
Figure 2.1 is divided into two types of measures: long-lived infrastructure, where jobs are given per million dollars of capital investment from government or private sources; and spending on final demand of energy or energy devices, where jobs are given per million dollars spent on final products.
Employment multipliers for a given technology can vary substantially between regions. Low employment multipliers are typically associated with sectors with higher wages and with relatively complex, capital-intensive projects. High multipliers are typically associated with measures that employ a larger number of lower wage workers and measures where material costs represent a smaller share of project costs. Since the multipliers are global weighted averages, measures that are primarily deployed in countries with lower average wages and lower labour efficiency have higher multipliers. Figure 2.1 provides the global average estimates: further detail and ranges across regions are provided in the individual sector discussions in the following sections.
The employment multipliers discussed in this chapter include only the jobs directly involved in the delivery of the measure and paid for by each million dollars of investment or spending, such as those in manufacturing, construction, sales and production. Most of these jobs would be created quickly but would only last as long as it takes for the relevant work to be completed.
For investment measures, energy efficiency in buildings and industry together with solar PV create the most jobs per million dollars of investment: on average, these three measures create between 10-15 jobs for every million dollars. Energy efficiency measures tend to be labour intensive, and the jobs involved tend to pay relatively low average wages, while the rapid cost reductions in solar photovoltaic (PV) in recent years means that labour
1 Details on definitions and methods for developing employment figures and employment multipliers are given in Annex A.
IEA.
All
right
s res
erve
d
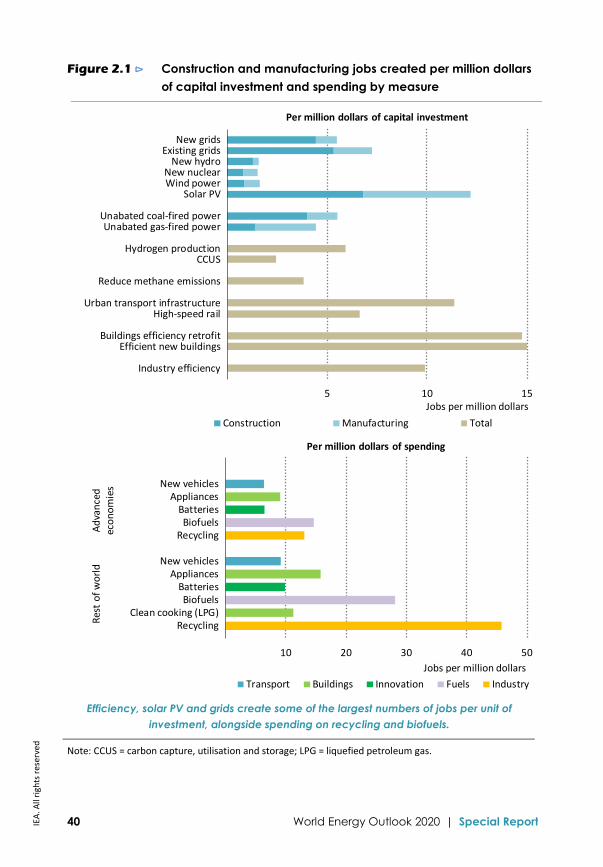
40 World Energy Outlook 2020 | Special Report
Figure 2.1 ⊳ Construction and manufacturing jobs created per million dollars of capital investment and spending by measure
Efficiency, solar PV and grids create some of the largest numbers of jobs per unit of investment, alongside spending on recycling and biofuels.
Note: CCUS = carbon capture, utilisation and storage; LPG = liquefied petroleum gas.
5 10 15
New gridsExisting grids
New hydroNew nuclearWind power
Solar PV
Unabated coal-fired powerUnabated gas-fired power
Hydrogen productionCCUS
Reduce methane emissions
Urban transport infrastructureHigh-speed rail
Buildings efficiency retrofitEfficient new buildings
Industry efficiency
Construction Manufacturing Total
Jobs per million dollars
Per million dollars of capital investment
10 20 30 40 50
New vehiclesAppliances
BatteriesBiofuels
Recycling
New vehiclesAppliances
BatteriesBiofuels
Clean cooking (LPG)Recycling
Transport Buildings Innovation Fuels Industry
Jobs per million dollars
Rest
of w
orld
Adva
nced
econ
omie
s
Per million dollars of spending
IEA.
All
right
s res
erve
d

Chapter 2 | Evaluation of possible recovery measures 41
2
now represents a much larger portion of total costs than was the case in the past. Large projects such as electricity grids and centralised power plants provide between 1-7 jobs per million dollars of capital investment. Building new grids and maintaining existing ones are at the higher end of this range because of the need to construct systems such as transmission towers and power lines; wind and new hydro or nuclear power are at the lower end of the range. Developing economies account for a large share of current investment in nuclear, hydro and coal power, as well as new grids: these regions tend to have lower cost labour, raising the multipliers for these technologies slightly.
For spending measures, recycling and biofuels have the highest multipliers because of the labour intensity of processing feedstocks. Growth for both of these industries is fastest in developing markets, which tend to have a large informal economy and relatively low wages in the formal economy. Measures relating to new vehicles, batteries, and appliances typically create 6-9 jobs per million dollars of spending in advanced economies: a high degree of automation however means that manufacturers contribute less to overall employment than the suppliers who provide the materials they use. Manufacturing jobs in advanced economies on average pay higher wages than is the case elsewhere, while less-automated processes in developing economies may require more workers to produce the same output.
New long-lived infrastructure or assets created by investment require continuing operation and maintenance (O&M). Sustaining these O&M jobs would require spending by the wider market or project beneficiaries that is additional to the initial capital investment or consumer spending. We therefore discuss these O&M jobs separately. Other important issues include are how quickly the jobs can be created, job location, and the skill sets required: these factors are also discussed within each sector.
Abatement costs
Abatement costs show for each measure the cost or savings associated with reducing greenhouse gas (GHG) emissions by 1 tonne of carbon dioxide (CO2) equivalent.2 This is based on the lifetime cost of deploying the measure and the savings that would accrue to the consumer (both discounted to the present based on sector- and region-specific discount rates) divided by the cumulative CO2 emissions savings over the measure lifetime. The costs and savings of the measures are given relative to a number of different base case technologies. For example, for new energy efficient cars, the abatement costs are compared with the cost of buying and operating a new internal combustion engine (ICE) vehicle within each region; for appliances and retrofits, they are compared with the energy cost of a standard inefficient appliance or of not undertaking the retrofit; for biofuels, they are compared with the cost of gasoline.
2 We assume that 1 tonne of methane is equivalent to 30 tonnes of CO2, which is the 100-year global warming potential.
IEA.
All
right
s res
erve
d

42 World Energy Outlook 2020 | Special Report
Positive abatement costs mean that the measure would cost money to reduce emissions, while negative abatement costs would reduce emissions while also saving money. A large number of the energy efficiency measures in industry, buildings and transport save money over their lifetime for consumers or industry while also reducing emissions. Extending the lifetime of hydro and nuclear power plants, and installing new solar PV panels in some regions, also have negative abatement costs. In oil and gas operations, the value of captured methane emissions can sometimes be greater than the cost of deploying the abatement measure (even though natural gas prices have fallen substantially in most regions globally), meaning that some of these options also have negative abatement costs. In contrast, a number of the measures that involve substituting for an existing fuel or technology (for example by switching to biofuels, or adding carbon capture, utilisation and storage [CCUS] to a coal-fired power plant) would reduce emissions but would also entail additional cost over their lifetimes.
Figure 2.2 ⊳ GHG abatement costs for selected measures
Many measures can reduce emissions and save money; yet there is a wide range of abatement costs for measures, reflecting regional and technology characteristics.
Note: CCUS = carbon capture, utilisation and storage; tCO2 –eq = tonnes of carbon-dioxide equivalent.
0
5
10
15
20
- 200 - 100 0 100 200 300
Coal CCUS
Materials efficiency
Industrial energy efficiency
Biofuels
Methane reductions
Clean cooking
Efficient appliances
Retrofits and efficient new builds
Electric buses
Battery electric cars
Hybrid cars
Solar PV
Wind power
Nuclear lifetime extensions
Hydro repower
Dollars per tCO2-eqGlobal average
IEA.
All
right
s res
erve
d
Chapter 2 | Evaluation of possible recovery measures 43
2
There is a wide range of abatement costs for some of the measures, reflecting differences between regions and technologies. The range of abatement costs for different regions and various technologies within each of the measures is shown in Figure 2.2. Regions have varying fuel prices (especially for gas and electricity), taxation regimes (e.g. on gasoline or diesel), capacity factors (e.g. for solar PV and wind capacities), emission intensities of electricity and country-specific characteristics. For example, abatement costs for electric buses are positive in the United States because of its low tax levels on gasoline and diesel, and its high power and range needs, meaning that larger batteries are required; abatement costs are however negative in Europe, where countries tend to have relatively low emissions intensity electricity and higher tax levels for gasoline and diesel, and where range needs allow for smaller battery packs.
2.2 Electricity
The Covid-19 crisis reduced electricity demand by 20% or more in countries with full lockdown measures (IEA, 2020a). The crisis has also reduced construction activities and caused supply chain disruptions affecting all power generation technologies, as well as transmission and distribution. Total power sector revenues are set to fall by around 7% globally in 2020, mainly due to lower electricity demand.3 Electricity retailers, power generation and grid companies will share this burden. The electricity sector employed close to 17 million people in 2019, with nearly 12 million jobs in electricity generation, and over 5 million jobs related to building, operating and maintaining electricity networks. More than 4 million electricity sector jobs are in maintaining and operating power plants and networks, the remainder are associated with construction and manufacturing.
Generators also face risks posed by depressed wholesale electricity prices. Negative prices have occurred more often in markets across Europe and the United States, with the burden falling mainly on coal, gas and nuclear power, despite the low operating costs of nuclear power plants. Revenue for renewables has been more robust because of fixed price contracts, low operating costs and priority access to grids. Financial concerns will create pressures to reduce costs and may lead to a wave of layoffs for non-essential activities. Early retirements of thermal power plants, including nuclear power, threaten thousands of jobs, concentrated in Europe and the United States, while the loss of nuclear capacity will hinder climate mitigation activities.
We focus on four specific areas:
Expand and modernise grids: Grid-related measures could boost employment and deliver many long-term advantages in terms of sustainability and resilience (Figure 2.3). Efficient networks are the foundation of robust and secure power systems, and there is scope for action to reduce high-cost disruptions, improve the integration of variable renewables, and enable demand-side response and cross-border trade. In low-income countries,
3 Values presented for the year 2020 are estimates.
IEA.
All
right
s res
erve
d

44 World Energy Outlook 2020 | Special Report
modernising grids would enable a number of innovative energy services that support access to electricity such as linking energy payments to mobile phones, installing local charging stations and building mini- and micro-grids. Policy makers could stimulate grid investment by raising borrowing limits, providing tax credits, expanding employee caps, streamlining permitting processes and expanding training and skills conversion programmes.
Accelerate the growth of wind and solar PV: Wind and solar have shown a degree of immunity to the Covid-19 crisis, and will be the only source of energy to grow in 2020, although, new construction is set to decline by about 15% in 2020 (IEA, 2020b). Additional solar PV and wind power could rapidly create a large number of jobs and cost effectively reduce CO2 emissions, but this will require policy support. Auction schemes in recent years have harnessed competitive forces while enabling lower cost financing: tools that reflect market conditions and system costs will be increasingly important as wind and solar PV expand their market shares. Repowering existing wind farms and distributed solar PV offer the fastest avenues to invest capital rapidly into sustainable power generation technologies.
Figure 2.3 ⊳ Job creation per million dollars of capital investment in power generation technologies and average CO2 abatement costs
New solar PV and wind have low abatement costs, as do nuclear lifetime extensions and repowering existing wind and hydro facilities; solar PV provides the largest boost to jobs.
Note: Avoided CO2 emissions calculated based on displacing coal-fired generation, global averages shown.
Maintain the role of nuclear and hydro power: Hydropower and nuclear power are the two largest sources of low-carbon generation today, together providing 70% of all low-carbon electricity. They help reduce fossil fuel imports, improve electricity security by adding to power system flexibility, and improve the affordability of electricity to consumers. Many facilities are ageing and face financial challenges because of lower revenues as a result of the crisis, heightening the risk of early retirements and limiting the prospects for new investment. Modernising and upgrading existing hydropower facilities
20
40
60
80
0 5 10 15
Abat
emen
t cos
ts ($
per
tCO
2)
Jobs created during construction phase
Short
Long
Moderate
Delay to activity
Solar PV utility
Solar PV rooftop
Efficient gas new
Nuclear new
Wind offshore
Wind onshorerepower
Nuclear lifetimeextensionWind onshore
newHydro repower
Hydro new
IEA.
All
right
s res
erve
d
Chapter 2 | Evaluation of possible recovery measures 45
2
and nuclear plants (for countries that intend to retain the option of nuclear power), would avoid a steep decline in low-carbon electricity generation; new construction would further boost low-carbon generation, and could also be considered where appropriate
Manage gas- and coal-fired power generation: Natural gas and coal have supported economic development and electricity security for decades, though their roles are now changing. Coal-fired power was under pressure even before the crisis, with lower electricity demand and renewables growth leading to reduced utilisation rates and overcapacity in major developing economies. With a major drop in gas prices in 2020, the economics of coal-to-gas switching have now also improved. Nearly 130 gigawatts (GW) of coal-fired capacity was under construction at the start of 2020 and a further 500 GW was in a planning phase. While these projects could boost employment, they must be balanced against commitments to reduce CO2 emissions and air pollution.
2.2.1 Expand and modernise grids
Electricity networks are the backbone of a secure and reliable power system: there are nearly 7 million kilometres (km) of transmission lines and 72 million km of distribution lines worldwide. Global investment in electricity networks (including sub-stations, switchgear, metering, digital infrastructure and electric vehicle fast-chargers) was around $270 billion in 2019, with distribution networks accounting for two-thirds of investment, and spending on digital grids for 15%. Delays caused by lockdowns could affect project timelines in 2020, particularly in developing economies: spending on grids is therefore likely to decline in the absence of any targeted support.
Over five million people were employed globally in 2019 to construct, operate and maintain electricity transmission and distribution networks, as well as to manufacture associated equipment. The fall in electricity demand caused by the Covid-19 crisis has reduced revenues for some network companies and placed them under strain. This is likely to make it more difficult to finance future grid extensions and upgrades, putting at risk a significant portion of the almost two million grid construction and manufacturing jobs worldwide.
Selected policy approaches
Electricity networks are generally regulated businesses, and government policies to maintain and develop agile, reliable and cost-effective electricity grids depend on the circumstances of each country. Frameworks to encourage investments in grids are however essential, and should incorporate clear long-term plan plans and strategies alongside a stable regulatory framework. Transparent and efficient administrative procedures (planning, permitting) which incorporate comprehensive engagement with stakeholders are also essential. Working with network operators and the power sector, governments could develop policies that encourage or require action to:
Expand and accelerate modernisation of existing grids, including through the roll-out of digital infrastructure and smart grids. Possible ways of supporting this includereforming planning and consenting procedures, increasing borrowing thresholds,
IEA.
All
right
s res
erve
d

46 World Energy Outlook 2020 | Special Report
issuing tax credits or grants, expanding employee caps, encouraging training and skills conversion programmes and investing in research, development and innovation.
Scale-up investment in new transmission and distribution infrastructure, includingcross-border interconnections, particularly where infrastructure has the necessaryplanning consents. Tax credits, loan guarantees and simplified consenting processescould help with this.
Accelerate the development of integrated planning to expand access to electricity inmany developing countries by means of both grid infrastructure and decentralisedsystems (Box 2.1).
Box 2.1 ⊳ Supporting decentralised power technologies in developing countries
Support for off-grid approaches will form an essential part of a national integrated strategy to bring access to electricity to those who currently lack it (860 million people in 2018). Mini-grids and stand-alone systems are the least-cost way of providing power to more than half of those that lack access (IEA, 2019a). Decentralised solutions have already provided access to essential energy services (lighting, telecommunications, pumped water, cooling and cooking) to a larger number of people: around 15 million people are connected to mini-grids in Africa (ESMAP, 2019), while around 18 million solar home systems are currently in use, serving tens of millions of people (ESMAP, 2020).
The Covid-19 crisis has severely impacted progress on energy access, and lockdown measures have put off-grid developments at risk. There are more than 1 000 firms in developing countries in the off-gird sector, employing around 500 000 people. In many countries, activities and sales have slowed or halted, and growing unemployment is dampening the capacity of customers to find the finance for these essential systems. Exempting solar components from duties and value-added taxes, removing diesel subsidies, facilitating access to public or direct foreign investment, direct funding to electrify health centres, and low-cost loans for large customers would be useful measures to support off-grid solutions.
If sufficient action were taken to put the world on track for universal access to electricity by 2030, we estimate that decentralised systems would create around 900 000 job-years within the next three years. Expansion would also provide major socio-economic benefits for connected households: for example, households that gained access to electricity could work longer days and expand their businesses. Every 100 solar home systems could generate the equivalent of 20 full-time induced jobs – although mostly informal – with half of them for women (GOGLA, 2020). Such systems would also help to improve the quality of health services and boost food security by increasing agricultural productivity and the resilience of value chains.
IEA.
All
right
s res
erve
d

Chapter 2 | Evaluation of possible recovery measures 47
2
Economic implications
Grid investments are capital-intensive undertakings that require a diverse workforce including line workers, engineers, and transmission, distribution and communication technicians. Grid investments create jobs across a variety of roles during the construction phase (engineers to plan and supervise the works, construction workers to erect the pylons and poles, electricians and technicians to connect and wire households). They also create manufacturing jobs, and a small number of long-term jobs in O&M. Job creation is higher per unit of investment for projects that involve modernising or digitalising existing networks.
Every million dollars spent modernising distribution lines would support up to six jobs for a one-year construction phase, and around two jobs in manufacturing. Investment in smart grids would create additional employment for a range of skills and support the development of new skills (Figure 2.4).
Figure 2.4 ⊳ Average jobs created globally per million dollars of spending on electricity networks
Grid investment supports local jobs to construct, operate and maintain networks, together with jobs in manufacturing and supply chains.
Implications for emissions and resilience
Losses from the transmission and distribution of electricity through inefficient networks mean that additional electricity must be generated to service the same level of demand. Losses in grids resulted in around 1 gigatonne of carbon dioxide (Gt CO2) emissions in 2018. We estimate that reducing worldwide losses towards efficient levels of around 5% from as much as 18% in some regions today could reduce these emissions by over 400 Mt CO2. Options to reduce these losses include replacing transformers and power lines, and optimising the reactive power profile. Investments in smart grids would facilitate further CO₂ emissions reductions by reducing load peaks, load shifting, facilitating the integration
1
2
3
4
5
6
Construction Manufacturing Construction Manufacturing
Jobs
cre
ated
Transmission Distribution
New infrastructure Modernise existing
IEA.
All
right
s res
erve
d

48 World Energy Outlook 2020 | Special Report
of renewables generation, supporting the adoption of electric vehicles and improving energy efficiency.
The digitalisation of electricity systems improves reliability and reduces operating costs. Investment in smart, modern, secure and climate-proof networks also helps diversify the power mix and reduces the risk of power outages and losses in the future. The Covid-19 crisis has highlighted the critical role of electricity and information and communication technologies (ICT) systems in our society, and investment could help accelerate the building of energy efficient ICT infrastructure. Modern electricity systems are also exposed to other risks from natural, technological and man-made threats. Investment is needed to safeguard electricity systems and to increase resilience in the face of these threats. In many developing economies, investment in electricity networks and mini-grids is particularly needed to increase the reliability of the network, support the connection of renewable energy and displace polluting diesel generation.
2.2.2 Accelerate the growth of wind and solar PV
Wind and solar PV power technologies have rapidly become the most favoured power generation technologies in markets around the world. In 2019, capital spending in wind and solar PV made up almost half of total power plant investment. Wind and solar PV accounted for 80% of the growth in global electricity supply in 2019 and now make up the majority of global power capacity additions, up from under 20% in 2010 (Figure 2.5). The rapid growth of solar PV and wind has been paired with impressive cost reductions: close to 80% on average for solar PV, 40% for onshore wind and 30% for offshore wind power over the past ten years (IRENA, 2020).
Figure 2.5 ⊳ Global solar PV and wind power capacity additions, 2010-2020
Solar PV and wind have rapidly become the most commonly built type of new generation, accounting for roughly half of all new capacity in 2018 and 2019.
Note: 2020e = estimated values for 2020.
10%
20%
30%
40%
50%
60%
40
80
120
160
200
240
2010 2015 2020e
GW
Solar PV Wind Share of capacity additions (right axis)
IEA.
All
right
s res
erve
d

Chapter 2 | Evaluation of possible recovery measures 49
2
Solar PV and wind power have so far shown a degree of immunity to the Covid-19 crisis, with renewables-based generation increasing by 3% in the first-quarter 2020. New construction has slowed, however, and global wind and solar PV additions are set to fall by 16% in 2020. Supply chains have been disrupted by measures to contain and slow the spread of Covid-19 and there have been delays due to reduced personnel availability at all stages of the supply chain, from equipment production to transporting materials, and from siting and licensing to construction work. Re-establishing these supply chains, which often involve companies in different regions of the world, requires careful cross-border collaboration.
Selected policy approaches
Solar PV and wind deployment are increasingly competitive, but their deployment remains closely tied to supportive policy frameworks for renewable energy in close to 180 countries. Direct financial support for solar PV and wind is now less common than in the past, though it is still used to accelerate investment. In the United States, investment and production tax credits continue to support solar PV and wind expansion.
Incorporating market signals and reflecting the impact on system costs will be increasingly important for support measures as wind and solar PV come to represent increasing shares of electricity supply. For small-scale solar PV, incentivising self-consumption and appropriately reflecting the value to the system are top policy priorities, as new opportunities arise from more digitalised power systems. In the wake of the Covid-19 crisis, policy tools that aim to reduce tax burdens may need to shift towards grants to increase the efficacy of support, as was done following the 2008 financial crisis. Auction schemes are also gaining in popularity for utility-scale projects and now support more than half of all renewables deployment in the near term. These schemes help to harness competitive forces so as to drive down technology prices, control financial commitments and reduce financing costs by minimising price risks. Policy makers are also paying increasing attention to the importance of diversifying supply chains for critical minerals needed for solar PV and wind (IEA, 2020c).
Economic implications
There are about 5 million jobs are associated with the solar and wind industries (IRENA, 2019). We estimate that these account for nearly one-third of global power sector employment. A wide range of skills are needed across value chains. About half of the solar workforce is local, and works on project development, installation and O&M activities for large- or small-scale projects. There are close to two million solar manufacturing jobs worldwide: China has around 70% of global PV component manufacturing capacity, and Southeast Asia has around 10%. In the wind industry, most manufacturing takes place in the United States, Europe, China and India.
IEA.
All
right
s res
erve
d

50 World Energy Outlook 2020 | Special Report
Figure 2.6 ⊳ Annual electricity generation per million dollars of capital investment in solar PV and wind power, 2010 and 2020
Falling costs for solar PV and wind over the past decade have significantly increased the productivity per unit of investment.
Note: 2020e = estimated values for 2020; MWh = megawatt-hours.
Source: IEA analysis based on IRENA (2020).
Falling costs for new solar PV and wind projects over the past decade have made capital investment far more productive. The expected annual generation from investment in solar PV in 2020 is more than seven-times the amount for the same investment in 2010: for onshore wind it has nearly doubled and for offshore wind it has risen by over 60% (Figure 2.6).
Solar is the most labour-intensive power generation technology. For utility-scale solar PV, 1 million dollars of capital spending now creates about 3 local construction jobs and about 6 manufacturing jobs. Rooftop solar PV is more labour intensive and creates around 10 construction jobs for the same investment.
Wind power is less labour intensive. Onshore wind power projects create about one job in construction and one-half in manufacturing per million dollars invested. Offshore wind creates about one-fifth as many construction jobs but twice the number of manufacturing jobs per unit of investment.
There are over 600 000 O&M jobs worldwide today in solar PV and wind. Utility-scale solar PV creates between 0.3-0.4 O&M jobs per million dollars invested, on a par with thermal power plants; rooftop solar PV creates three-times as many O&M jobs per unit of investment. The number of O&M jobs created per million dollars invested in wind is much smaller.
500 1 000 1 500 2 000 2 500
Solar PV buildings
Solar PV utility
Wind onshore
Wind offshore
MWh
2020e
2010
IEA.
All
right
s res
erve
d

Chapter 2 | Evaluation of possible recovery measures 51
2
Solar PV and wind power offer opportunities to deploy capital rapidly at both new and existing sites. New projects can be constructed quickly once permits are in place. The streamlining of administrative processes would help to speed up projects further. For projects that have chosen sites and obtained the necessary licences, the construction phase can often be completed in less than a year. Rooftop solar PV installation draws on widely available skills and can also be scaled up quickly.
Projects to repower existing sites can generally deploy capital even more quickly because they do not have to manage pre-development or site preparation and there are fewer permitting processes. There are significant opportunities to repower ageing wind farms by upgrading turbines and other components: over the past three years, about $13 billion was invested to repower wind parks in the United States and Europe, and there is potential for nearly twice that amount to be invested in the next three years (IEA, 2020d). Opportunities are more limited for repowering solar PV as the vast majority of existing capacity has been built within the past decade. Repowering wind and solar projects are as cost effective as new projects in reducing power sector emissions.
Implications for emissions and resilience
Solar PV and wind power are in the vanguard of clean energy transitions. They are widely available at commercial scale and are a cost-effective means of reducing CO2 emissions, while at the same time lowering local air pollution and reducing energy-related water use.
The extent of CO2 emission reductions depends on the type of power plant that is displaced. Many developing economies are currently heavily reliant on coal-fired generation: around 65-75% of electricity generation in China and India, and about 40% in Southeast Asia comes from coal. When displacing coal-fired generation, a 1 GW solar PV project reduces emissions by close to 1.5 million tonnes of carbon dioxide (Mt CO2) annually. With higher average capacity factors, 1 GW of wind power avoids about 3 Mt CO2 emissions per year for onshore projects and over 3.5 Mt CO2 for offshore sites. Natural gas is the largest source of electricity in most advanced economies: where gas is displaced rather than coal, the associated CO2 emissions reductions from new solar PV and wind projects would be cut by more than half.
Accelerating the construction of utility-scale wind and solar PV requires investments in grid infrastructure to connect projects and to support integration of their variable output. The availability of dispatchable sources of electricity is also critical to integrating variable renewables. New wind and solar PV projects would ideally be located close to demand centres to minimise integration issues. A surge in rooftop solar PV may require some reinforcing of distribution grids to maintain reliability to all consumers.
Current supply chain issues are raising concerns about reliance on relatively few equipment providers, particularly solar panels. For manufacturers, the availability of critical minerals and sustainability of extraction is also of some concern: these minerals include rare earth elements such as neodymium, which is used in large onshore and offshore wind turbines.
IEA.
All
right
s res
erve
d

52 World Energy Outlook 2020 | Special Report
2.2.3 Maintain the role of hydro and nuclear power
Hydropower is the largest low-carbon source of electricity worldwide today and nuclear power is the second-largest source. Together, they represent almost 30% of global electricity supply and provide 70% of low-carbon electricity generation (Figure 2.7). In 2019, capital spending on new and existing projects was over $50 billion globally for hydropower and nearly $40 billion for nuclear power. In advanced economies, nuclear power is the largest low-carbon source of electricity by a wide margin, but its future role is uncertain as ageing plants begin to shut down. Without additional lifetime extensions, nearly 40% of the nuclear reactor fleet in advanced economies will retire by 2030. Many hydropower facilities in advanced economies are also several decades old.
Figure 2.7 ⊳ Global low-carbon generation by source, 2010-2020
Hydro and nuclear power represent the low-carbon foundation of electricity supply today.
Note: TWh = terawatt-hours; 2020e = estimated values for 2020.
Hydro and nuclear power have proven relatively resistant to the Covid-19 crisis to date, but challenging conditions have worsened in key markets where they are exposed to wholesale price or volume risk. The resulting reduction in revenues and the uncertain pace of recovery puts at risk capital flows for both hydro and nuclear power, which are more often exposed to market prices and volumes than other low-carbon sources. Under these conditions, the hurdle for investment in either existing or new projects is very high. In terms of CO2 emissions, a lack of new investment in hydro and nuclear power risks undermining the emissions reductions that derives from growth in other low-carbon sources of electricity.
Selected policy approaches
Hydro and nuclear power development require sustained support from governments. Both technologies are capital intensive, and projects can be among the largest in the energy
2 000
4 000
6 000
8 000
10 000
12 000
2010 2015 2020e
TWh Other renewables
Solar PVWindBioenergyNuclearHydro
IEA.
All
right
s res
erve
d

Chapter 2 | Evaluation of possible recovery measures 53
2
sector in terms of total investment. For example, first-of-a-kind nuclear reactors, mega-hydropower projects and large refurbishment programmes can each require more than $10 billion in capital spending. Nuclear lifetime extensions of 20 years cost between $0.5-1.1 billion per GW.
With long development times and high capital requirements, finding ways to limit risks and facilitate low-cost financing is clearly very important. Direct financial support is not always necessary: long-term power purchase agreements or feed-in tariffs can offer a degree of price certainty and have been used extensively in China. Loan guarantees and preferential loans, where available, can also lower the cost of financing. Five states in the United States, for example, have provided zero-emission credits to recognise the low-carbon contributions of nuclear power and keep several reactors in operation in the face of challenging market conditions. Market-based solutions, such as carbon pricing or capacity payments, could significantly improve the financial position of both nuclear and hydropower. Enhanced flexibility markets could also bolster the economics of hydropower.
Economic implications
Hydropower employs about 2 million people globally, over two-thirds of them in local jobs concerned with operating and maintaining existing facilities. Nuclear power provides over 800 000 jobs, about half of which are located at reactors. New construction of nuclear power projects has been most prominent in recent years in emerging markets, including India and China, although several advanced economies continue to support nuclear power. The development of new hydropower projects is most active in China, Latin America and Africa.
Existing hydropower projects can be upgraded by replacing turbines to increase maximum output or adding new pumping facilities to support more flexible operations. Upgrades and construction work at hydropower projects create about 3 jobs per million dollars of capital spending. Nuclear lifetime extensions create about 2-3 jobs per million dollars of capital spending, as well as preserving local O&M jobs.
Accelerating the deployment of new hydro or large-scale nuclear projects can be challenging: siting can be a lengthy process, and project development may take several years even under the best conditions before construction can begin. Nonetheless, there are a handful of shovel-ready nuclear power projects around the world, including in Europe, which would benefit from greater capital availability. Interest in small modular nuclear reactors (SMRs) is growing among policy makers and investors, in part due to the difficulties associated with financing large projects (see section 2.7.3).
Implications for emissions and resilience
Hydro and nuclear power are making a significant contribution to emissions reductions. Without further nuclear lifetime extensions in advanced economies, for example, clean energy transitions would require around $80 billion additional investment per year and consumer electricity bills would be around 5% higher (IEA, 2019b).
IEA.
All
right
s res
erve
d

54 World Energy Outlook 2020 | Special Report
In many countries, growth in hydro and nuclear along with expansion of solar PV and wind power would reduce the need for coal-fired power. If additional output displaces coal-fired generation, then 1 GW of nuclear power avoids about 6 million tonnes (Mt) of direct CO2 emissions per year.4 Hydro tends to have a lower utilisation rate than nuclear (because of seasonal variations), but 1 GW of hydro capacity nevertheless avoids about 3 Mt CO2
emissions. In advanced economies, higher output from hydro or nuclear mainly affects the amount of gas-fired generation and savings from avoided emissions therefore are lower (Figure 2.8).
Figure 2.8 ⊳ Annual direct CO2 emissions avoided per 1 GW of installed capacity by technology and displaced fuel
Nuclear power avoids more CO2 emissions per GW of capacity than other fuels.
Notes: Mt CO2 = million tonnes of carbon dioxide. Efficient gas refers to combined-cycle gas turbines. Applied capacity factors are current global fleet averages for nuclear power, hydro and efficient gas, and global averages for new projects completed in 2019 for wind offshore, wind onshore and solar PV.
Hydro and nuclear power are fundamental to electricity security in many regions since they have high availability and are dispatchable, low-carbon sources of electricity. Hydropower is an important source of power system flexibility in many regions and has played a central role in accommodating sharp reductions in electricity demand in several countries during lockdowns related to the Covid-19 crisis. Nuclear power tends to operate at constant levels of output, but can also provide flexibility. In France, for example, nuclear power provides around three-quarters of electricity supply today, and a significant portion of the nuclear fleet regularly operates in a load-following mode.
4 Indirect emissions during construction, operations or decommissioning are not included.
1
2
3
4
5
6
Coal displaced Gas displaced
Mt C
O₂ Nuclear
Hydro
Wind offshore
Wind onshore
Solar PV utility
Efficient gas
IEA.
All
right
s res
erve
d

Chapter 2 | Evaluation of possible recovery measures 55
2
Hydro and nuclear power increase fuel diversity and self-sufficiency. Nuclear fuel is only available from a small number of suppliers, but refuelling is required only once every 18 months to two years. At the same time, appropriate safeguards are critically important in the nuclear fuel cycle, from mining to enrichment, fabrication and waste disposal.
When managed well, hydropower can also provide critical water-related services that support irrigation, flood prevention and drought control. However, water withdrawals and consumption can be a concern for both technologies. Hydropower is subject to seasonal variations determined by water availability, and there are risks that climate change could permanently reduce water availability in some regions, although other regions may see an increase. Nuclear power is one of the most water-intensive power technologies and is often located on coastlines to ensure a critical supply of water for cooling reactors.
Both hydro and nuclear power are less dependent on critical minerals in their designs and operations than other low-carbon technologies.
2.2.4 Manage gas- and coal-fired power generation
In 2019, coal was the largest source of electricity at 36%, followed by natural gas at 23%, although both gas- and coal-fired generation are set to fall in 2020 (Figure 2.9). Coal-fired power plants are the largest single source of energy-related CO2 emissions globally, at about 10 Gt per year; even without new additions they could remain so for decades to come without concerted action including the deployment of carbon capture, utilisation and storage technologies (IEA, 2019c). Gas-fired generation, which has grown more any other source over the last decade, emitted about 3 Gt CO2 in 2018 and 2019.
Figure 2.9 ⊳ Coal- and gas-fired electricity generation by region, 2010-2020
Coal-fired power generation has been on a plateau globally in recent years, while gas-fired generation has been rising in most regions.
Note: TWh = terawatt-hours; 2020e = estimated values for 2020.
4
8
12
2010 2015 2020e 2010 2015 2020e
Thou
sand
TW
h
United States European Union Other advanced economies China India Rest of world
Coal Gas
IEA.
All
right
s res
erve
d

56 World Energy Outlook 2020 | Special Report
The Covid-19 crisis is having significant impacts on coal and, to a lesser extent, gas. Natural gas prices, already in decline, recently touched historic lows in several regions, dropping to around $2 per million British thermal units (MBtu) in the United States, Europe and some markets in Asia. Global gas-fired generation is on track to be about 7% lower in 2020 than in 2019 owing to reduced electricity demand and growth in renewables (IEA, 2020a). Coal has been squeezed by cheaper renewables and cost competition with gas, and is set to decline by more than 10% in 2020.
Coal-fired power faces financial strains from lower output in regulated markets and depressed wholesale electricity prices in liberalised markets. New construction of coal plants may have been delayed due to temporary workforce or supply chain issues, but nearly 130 GW of coal-fired power capacity is still under construction worldwide. This project pipeline risks increasing the locked-in emissions from coal-fired power plants that already threaten to put a sustainable energy pathway out of reach.
Selected policy approaches
Governments can guide power sector investment in several ways, including by providing long-term vision in line with their countries’ environmental and policy goals to ensure the consistency of decisions for new construction and existing power plants. Power sector revenues are set to fall by about 7% worldwide in 2020, though coal-fired power is likely to be hit harder. Robust carbon pricing or emission trading schemes can be effective tools to shift decisions concerning existing and new investment onto a more sustainable track. Many developing economies have fully regulated markets, in which granting gas-fired generation priority to the grid ahead of coal would help take advantage of low gas prices. Key principles related to gas- and coal-fired power might include:
Incentivise flexibility and reflect the contributions of all power plants to systemadequacy.
Harness market forces by pricing negative externalities to deliver cost-effectivemitigation of CO2 emissions.
Boost RD&D and deployment of technologies that can reduce pollution and emissionsfrom coal and gas (see section 2.7.4).
Economic implications
Coal-fired power plants support around 1.7 million jobs worldwide, and gas-fired power plants support around 900 000 jobs (these figures exclude coal mining and natural gas production). Almost half of these jobs are located on-site and are concerned with the O&M of existing facilities. For example, a 400 megawatt (MW) coal-fired power plant requires around 200 people to operate and maintain the facility: a gas-fired power plant of the same capacity requires about 100 people. Current construction activities employ about 900 000 people worldwide, and manufacturing parts for coal and gas-fired plants employs about 400 000 people.
IEA.
All
right
s res
erve
d

Chapter 2 | Evaluation of possible recovery measures 57
2
Around 1.5 jobs in manufacturing and 4 jobs in construction would be created per million dollars of capital investment, together with 0.4 O&M jobs in the longer term. Gas-fired power plants are less complex to build, operate and maintain, but also have lower capital costs: they create about 4.5 jobs per million dollars of capital investment during the construction phase and about 0.3 O&M jobs.
At the start of 2020, over 500 GW of coal-fired capacity was in the planning phase, including 180 GW in China, 100 GW in India and 95 GW in Southeast Asia. However the long-term operating environment is likely to be challenging, given falling costs of renewables and the environmental implications of coal-fired power. The case for building this planned new coal capacity – without CCUS – needs to be carefully weighed against the implications for local air pollution and global climate goals.
Implications for emissions and resilience
As leading sources of electricity generation and the largest emitters of CO2 in the power sector today, the role of coal and gas is central to discussions on clean energy transitions. Coal-to-gas switching within the existing fleet of power plants as a transition measure can deliver immediate reductions of CO2 emissions and local air pollution.5 Combined-cycle gas turbines are typically more efficient than those burning coal, enabling them to emit about 50% less CO2 per unit of electricity generated than an average coal-fired power plant (without CCUS).
Based on current commodity prices – and only using existing gas-fired power plants and gas delivery infrastructure – we estimate that cost-effective coal-to-gas switching in the power sector could reduce global emissions by around 340 Mt CO2 (Figure 2.10). The majority of the cost-effective potential lies in the United States and Europe: coal-to-gas switching could displace about half of the coal-fired power output in both. Elsewhere, the switching potential may not be economic at local gas prices, particularly in Asia where long-term contracts with prices pegged to a historical average of oil tend to have higher prices than seen in spot markets.
Where new capacity is under consideration, gas-fired power plants require two to three years to construct, and when in operation can reduce emissions by around 2 Mt CO2 per GW each year if displacing coal-fired generation. New high efficiency coal-fired power plants can reduce CO2 emissions if they displace less efficient coal plants. However, without adding CCUS so as to reduce CO2 emissions by nearly 100%, or co-firing with biomethane or biomass, the additional emissions would put long-term climate change goals at risk.
Action to reduce emissions from unabated coal-fired generation as rapidly as possible is a critical element of a sustainable energy pathway, but this – and action in due course to minimise unabated natural gas-fired generation - has to be achieved while maintaining affordability and electricity security. Coal- and gas-fired power plants currently provide a
5 Reducing methane emissions from oil and gas operations are discussed in section 2.6.1.
IEA.
All
right
s res
erve
d

58 World Energy Outlook 2020 | Special Report
number of benefits in terms of security of supply, dispatchability and power system flexibility. They are currently the largest sources of power system flexibility globally, and (together with grid flexibility, energy storage and demand-side response measures) play a critical role in the integration of variable renewables. They also provide ancillary services that ensure power quality.
Figure 2.10 ⊳ CO2 emissions savings possible from coal-to-gas switching at different gas prices (left) and cost-effective savings in 2020 (right)
It is technically feasible to avoid about 1 000 Mt of CO2 from coal-to-gas switching using existing infrastructure. One-third of it is cost effective under current regional fuel prices.
Notes: MBtu = million British thermal units; Mt CO2 = million tonnes of carbon dioxide.
2.3 Transport
Due to Covid-19 lockdowns, global private car use in April 2020 was around 40% lower than in previous months (IEA, 2020e). Car sales have also been affected, with a 30% year-on-year drop in sales in first-quarter 2020. We estimate that around 2 million jobs in the automotive industry are at risk globally, representing around 15% of the manufacturing workforce in this sector. The aviation, high-speed rail and public transport sectors also have been hit hard by Covid-19, with air travel demand6 expected to be around 50% lower in 2020 than in 2019 (Peace, 2020). Many governments are now looking to support the transport sector to preserve employment and ensure the continuity of transport services, while also improving resilience and sustainability.
We focus in this section on three specific areas: encouraging consumer purchase of more efficient new vehicles, urban infrastructure and high-speed rail (Figure 2.11).
6 Air travel demand is expressed in revenue passenger kilometres (RPK).
1
2
3
4
5
6
0 200 400 600 800 1 000
Dol
lars
per
MBt
u
Mt CO₂
European Union United States Rest of world
30
60
90
120
150
180
Mt C
O₂
IEA.
All
right
s res
erve
d

Chapter 2 | Evaluation of possible recovery measures 59
2
Figure 2.11 ⊳ Employment multipliers for investment in the transport sector
Charging points and bike infrastructure have large employment multipliers. Manufacturing BEVs is less labour intensive than ICEs, but battery production could offset this drop.
Notes: ICE = internal combustion engine; BEV = battery electric vehicle. Ranges show differences across regions.
New vehicles: The automotive sector directly employs around 11 million workers globally and supports a further 4 million indirect jobs (for parts manufacturing).7 Car sales are expected to fall globally by around 15% in 2020 and commercial vehicles production by 22% (IHS, 2020a). Consumer incentives for the replacement of old, inefficient vehicles by new, more energy efficient ones are a way of sustaining production facilities. For commercial vehicles such as trucks, support could take the form of improved financing or tax reductions for low-emission vehicles. In addition to job retention, these incentive schemes can enhance energy security through reduced oil consumption, and, if designed appropriately, can reduce air pollution and GHG emissions. Boosting demand for electric vehicles, including fuel cell vehicles, would incentivise automakers to shift towards lower emission models and to pursue cost reductions in battery and fuel cell manufacturing: it could also lead to jobs in new domestic industries such as battery production (see section 2.7).
Expand high-speed rail networks: The high-speed rail industry directly employs 420 000 people in operation and management jobs today, and the construction of projects supports around 2.6 million construction and engineering jobs. Government support to this sector to ensure the completion of announced projects would help to protect these jobs and could create an additional 220 000 jobs in O&M. Railways can support territorial cohesion and spatially balanced and decentralised economic development. Rail travel is
7 Indirect jobs include suppliers that produce parts exclusively for automobiles and would not see job creation due to purchases made in other industries.
5
10
15
20
25
Pedestrian andbike lanes
Charginginfrastructure
Railway Battery cellmanufacturing
ICE carmanufacturing
Battery electriccar manufact.
Jobs
per
mill
ion
dolla
rs
IEA.
All
right
s res
erve
d

60 World Energy Outlook 2020 | Special Report
also the most efficient transport mode for journeys under 800 km (IEA, 2019d), requiring on average 12-times less energy per passenger kilometre than airplanes and road vehicles.
Improve urban infrastructure: Walking and cycling has significantly increased since theoutbreak of Covid-19, and many cities have reallocated road space to pedestrians and cyclists. However the use of public transport in cities worldwide has fallen by 50-90%, with billions of dollars of revenue losses for operators (Moovit, 2020). Globally, the public transport sector employs about 13 million people and plays an important role in ensuring accessibility for citizens in many cities (UITP, 2011). Without government assistance, there is a risk that jobs could be lost, operations curtailed and prices raised. Any resulting modal shift to cars would increase GHG and air pollutant emissions as well as congestion levels. Investment in public transport systems, including the electrification of city bus systems, would create around 30% more construction and engineering jobs than a similar level of investment in roads (Smart Growth America, 2011). Public health fears could be addressed by investing in heightened cleaning practices on public transport and by appropriate social distancing measures.
2.3.1 New vehicles
Passenger car sales grew by just under 5% every year on average over the past decade (Figure 2.12). The Covid-19 crisis is bringing this period of sustained growth to an abrupt halt: we expect global car sales in 2020 to fall by around 15% from 2019 levels. Meanwhile the commercial vehicles market is expected to decline globally by 22% in 2020 (IHS, 2020a). In the European Union, demand for new trucks decreased by 35% during the first four months of 2020 (ACEA, 2020a). The automotive industry globally employs around 14 million workers in vehicle manufacturing. We estimate that around 2 million jobs are now at risk globally due to the declining demand for new vehicles.
After the 2008-09 global economic crisis, several countries introduced vehicle scrappage programmes as part of efforts to support domestic automotive industries. For example, the United States established a cash-for-clunkers scheme in 2009 that is estimated to have led to additional sales of 440 000 - 600 000 new cars (US GAO, 2010): nearly half of the vehicles sold were manufactured in the United States, creating or retaining 40 000 - 120 000 local jobs during the period of the scheme (Romer and Carroll, 2009). By incorporating fuel efficiency and GHG emissions standards as well as lifecycle impact considerations in programme design, scrappage programmes can incentivise consumers and companies to replace their old, less efficient, vehicles with more efficient alternatives such as hybrids, plug-in hybrids, battery electric and fuel cell vehicles. Where schemes involve the trade-in of an old car, enabling people to trade their cars for alternative forms of transport, such as bikes, e-bikes, e-cargo bikes or public transport passes, can help to boost cycling and public transport, and to reduce emissions. Similar scrappage programmes targeting other vehicle types such as two/three- wheelers, taxis, buses and light trucks could also contribute to job retention, fleet modernisation and emissions reductions. For example, China has announced direct and indirect incentives for reviving the trucks market and has extended subsidies for electric vehicles until 2022 (IHS, 2020a).
IEA.
All
right
s res
erve
d

Chapter 2 | Evaluation of possible recovery measures 61
2
Figure 2.12 ⊳ Passenger car sales by key region
Global passenger car sales in 2020 are expected to drop by 15% compared with 2019.
Note: 2020e = estimated values for 2020.
Economic implications
The employment implications of vehicle scrappage schemes depend upon the job intensity and the geographical distribution of a country’s car manufacturing industry. Scrappage schemes create direct manufacturing jobs by increasing new car sales: they also create jobs in car disassembly and metal recycling, as well as programme administration.
Table 2.2 ⊳ Direct manufacturing jobs in the automotive sector in key producer regions
Country/region Car production in 2019
(millions) Jobs in 2019
(millions) Jobs at risk*
(millions)
China 22.6 4.3 0.6
Europe 21.8 3.8 0.5
United States 15.5 2.2 0.3
Southeast Asia 13.8 1.9 0.3
Latin America 3.9 0.7 0.1
India 3.6 0.7 0.1
Africa 1.1 0.2 0.0
*Estimate based on declines in passenger car sales expected in 2020.
Tying the size of subsidies for new car purchases to fuel efficiency and GHG emission standards can improve the overall efficiency of the car fleet. More efficient ICEs and hybrids do not require a significant change in the automotive value chain and associated
20
40
60
80
100
2010 2011 2012 2013 2014 2015 2016 2017 2018 2019 2020e
Mill
ion
vehi
cles Other
Europe
United States
China
Other regions 2.9 0.5 0.1
IEA.
All
right
s res
erve
d

62 World Energy Outlook 2020 | Special Report
skills. However, electric engines have around 200 components, as opposed to 1 400 components in internal combustion engines (FES, 2015). As a result, electric vehicle (EV) manufacturing reduces the need for upstream parts manufacturing and assembly labour: at the same time it creates local jobs downstream in the installation and O&M of charging points (AIE, 2018).
Excluding job creation connected with charging infrastructure and battery manufacturing, plug-in hybrid electric cars create an additional 6 000 jobs for every 1 million cars sold compared to a gasoline car (ICE), whereas battery electric cars create 20 000 fewer jobs (Wietschel et al., 2017). The difference in manufacturing jobs created between ICEs and electric cars is however more than offset if batteries are produced domestically. Current battery production for EVs is geographically concentrated, with China accounting for more than 70% of global battery capacity (Benchmark Minerals, 2020) (see section 2.7). While manufacturing costs may substantially differ across regions, a more regionally diffuse battery value chain could offer more resilience.
Scrappage schemes can be rolled out relatively quickly, helping retain jobs in the short term and clearing vehicle stocks accumulated during lockdown periods: however, their effect might only be temporary, serving to bring forward future vehicle sales. While these schemes can reduce transport GHG emissions by incentivising electrification, they are less cost effective than carbon pricing. As such, their implementation should be time-limited and paired with long-term strategies to address the multiple challenges faced by the automotive sector, which include electrification, workforce re-training and the need to adjust to a potential structural reduction in demand in certain regions, if teleworking patterns persist.
Scrappage schemes involving unconditional rebates might lead to most of the subsidies going to high-income households retaining the budget capacity to buy a new car during an economic downturn. Tying rebate eligibility to income criteria, as in France’s recently revised scrappage scheme, could help to prevent this.
Implications for emissions and resilience
Over one-third of the global car fleet is more than ten years old. Replacing a ten-year old gasoline car with a new same class hybrid car would result in a 40% reduction in lifecycle CO2 emissions in most regions. The lifetime emissions savings of replacing a ten-year old ICE car with a battery electric vehicle (BEV) depend on the emissions intensity of electricity generation. Based on today’s electricity mix, emissions from a BEV would be 80% lower than an ICE vehicle in the European Union, 60% lower in the United States and around 40% lower in China. Emissions savings are likely to increase in the future as power sectors decarbonise. Shifting to the most fuel efficient gasoline cars could also reduce nitrogen oxide (NOX) emissions by 14%, while shifting to BEVs would eliminate NOX emissions almost entirely (Bieker and Mock, 2020; EEA, 2018).
IEA.
All
right
s res
erve
d
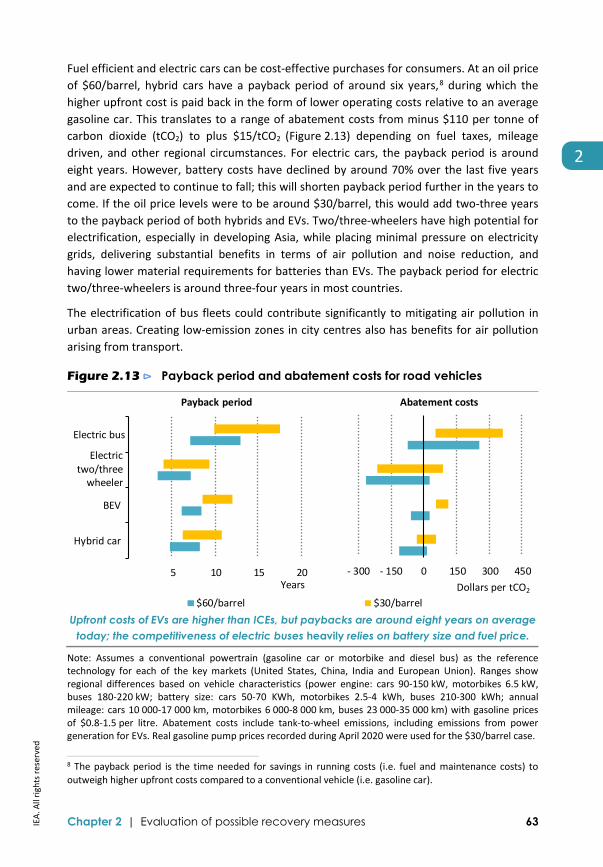
Chapter 2 | Evaluation of possible recovery measures 63
2
Fuel efficient and electric cars can be cost-effective purchases for consumers. At an oil price of $60/barrel, hybrid cars have a payback period of around six years,8 during which the higher upfront cost is paid back in the form of lower operating costs relative to an average gasoline car. This translates to a range of abatement costs from minus $110 per tonne of carbon dioxide (tCO2) to plus $15/tCO2 (Figure 2.13) depending on fuel taxes, mileage driven, and other regional circumstances. For electric cars, the payback period is around eight years. However, battery costs have declined by around 70% over the last five years and are expected to continue to fall; this will shorten payback period further in the years to come. If the oil price levels were to be around $30/barrel, this would add two-three years to the payback period of both hybrids and EVs. Two/three-wheelers have high potential for electrification, especially in developing Asia, while placing minimal pressure on electricity grids, delivering substantial benefits in terms of air pollution and noise reduction, and having lower material requirements for batteries than EVs. The payback period for electric two/three-wheelers is around three-four years in most countries.
The electrification of bus fleets could contribute significantly to mitigating air pollution in urban areas. Creating low-emission zones in city centres also has benefits for air pollution arising from transport.
Figure 2.13 ⊳ Payback period and abatement costs for road vehicles
Upfront costs of EVs are higher than ICEs, but paybacks are around eight years on average today; the competitiveness of electric buses heavily relies on battery size and fuel price.
Note: Assumes a conventional powertrain (gasoline car or motorbike and diesel bus) as the reference technology for each of the key markets (United States, China, India and European Union). Ranges show regional differences based on vehicle characteristics (power engine: cars 90-150 kW, motorbikes 6.5 kW, buses 180-220 kW; battery size: cars 50-70 KWh, motorbikes 2.5-4 kWh, buses 210-300 kWh; annual mileage: cars 10 000-17 000 km, motorbikes 6 000-8 000 km, buses 23 000-35 000 km) with gasoline prices of $0.8-1.5 per litre. Abatement costs include tank-to-wheel emissions, including emissions from power generation for EVs. Real gasoline pump prices recorded during April 2020 were used for the $30/barrel case.
8 The payback period is the time needed for savings in running costs (i.e. fuel and maintenance costs) to outweigh higher upfront costs compared to a conventional vehicle (i.e. gasoline car).
5 10 15 20
$60/barrel $30/barrel
Payback period
Years
Electric bus
Electrictwo/three
wheeler
BEV
Hybrid car
- 300 - 150 0 150 300 450
Dollars per tCO2
Abatement costs
IEA.
All
right
s res
erve
d

64 World Energy Outlook 2020 | Special Report
2.3.2 Expand high-speed rail networks
Long-distance rail transport has been severely affected by recent mobility restrictions: demand in first-quarter 2020 fell by more than 80% from levels in 2019 (WSDOT, 2020; Boursier, 2020). Demand for rail travel is expected to remain low even after travel restrictions are lifted because of reduced customer spending and continuing health concerns. The aviation industry has also been severely impacted by lockdown measures and the fallout from Covid-19. Some governments have started to support the aviation sector by providing financial relief packages to try to limit job losses: a co-ordinated approach would also consider investment into alternatives modes of transport such as high-speed rail (HSR).
Before the crisis, major rail companies employed around 3 million people in operation and management jobs and operated more than 360 000 km of rail network (Railway Technology, 2018). There are around 60 000 km of HSR in operation today, and around 32 000 km HSR lines are under construction or planned around the world (Figure 2.14). Many of the projects under construction are heavily reliant on public support and, with the economic downturn and pressure on public budgets, there is a risk that this could be reduced. Stabilising these projects would prevent job losses, while accelerating plans for new HSR lines would spur new employment and could, if well prepared and executed, provide long-term economic and environmental benefits.
Figure 2.14 ⊳ High-speed rail networks around the world, 2020
A global network of 60 000 kilometres of operational high-speed rail employs more than
420 000 people; current projects account for a further 2.6 million construction jobs.
Economic implications
The high-speed rail industry is likely to require some short-term financial aid to limit job losses from operators and to maintain the development of new projects. In 2019, 60 000 km of operational HSR projects across the world employed over 420 000 people in
10 20 30 40 50
China
Europe
Japan
Middle East
Korea
United States
India
Africa
In operation
Underconstruction
Thousand km
IEA.
All
right
s res
erve
d

Chapter 2 | Evaluation of possible recovery measures 65
2
operations and management jobs, while HSR construction projects currently support around 2.6 million construction jobs globally. The majority of existing HSR lines and those under construction are in China, Europe and Japan, but a number of regions such as the Middle East, India, Africa and the United States are currently building their first lines. Besides protecting the loss of these construction jobs, the completion of all projects that are currently underway would generate around 220 000 jobs in operations and management.
Looking beyond the projects under construction, financial support to plan and promote new projects would also create additional jobs in manufacturing, although these may be largely limited to countries with existing manufacturing bases such as China and Japan unless new local supply chains are also developed. Promoting high-speed rail could also create domestic jobs in the power sector by increasing electricity demand.
Implications for emissions and resilience
Previous IEA reports have shown that around 20% of domestic flights in North America, 10% of flights in Europe and almost 8% of flights in Asia-Pacific could be displaced by high-speed rail (IEA, 2019d). An estimated 18 grammes of CO2-eq would be saved for every passenger kilometre travelled by high-speed rail rather than by air.
High-speed rail, on average, is at least 12-times more energy efficient than air and road travel per passenger kilometre. Investment in HSR could therefore strengthen energy security and resilience of oil importing countries, as well as reduce emissions. We estimate that, if the share of rail passenger activity were to increase by 60% above current levels, it would avoid around 200 million tonnes of oil equivalent (Mtoe) in energy demand by 2030. Most of this would take the form of a reduction in the demand for oil of around 4 million barrels per day (mb/d). Conversely, a modal shift from railways to road transport could lead to an increase of up to 8 mb/d in oil consumption (IEA, 2019d).
2.3.3 Improve urban infrastructure
The lockdown measures brought about by the Covid-19 pandemic have led to large-scale reductions in urban transport activity: the number of trips in most cities has reduced by more than 50% (Citymapper, 2020). Even after lockdown measures are relaxed, use of urban public transport may remain low due to social distancing needs and passengers’ health concerns. In contrast, cycling and walking, are increasing, as is car travel. Several cities are looking at improving infrastructure to promote walking and cycling, with the aim of creating job opportunities while improving air quality and health and wellbeing of citizens: investment in public transport and in charging infrastructure for electric vehicles and electric buses offers a complementary way to achieve those objectives.
Charging infrastructure
The provision and availability of recharging infrastructure for EVs and electrified ride sharing services (e.g. e-bikes, scooters, e-buses) plays a key role in the uptake of electro-
IEA.
All
right
s res
erve
d

66 World Energy Outlook 2020 | Special Report
mobility. Globally, there were nearly 1 million public recharging points in 2019, a 60% increase compared with 2018 (IEA, 2020e). There is a strong correlation between the availability of charging infrastructure and the size of the EV fleet (Figure 2.15). More extensive charging infrastructure therefore will be required within cities as the use of EVs and other forms of electric mobility increases. The installation and manufacturing of electric charging points supports over 12 jobs per million dollars of investment.
Figure 2.15 ⊳ Global electric cars and public charging points in key markets
There is a strong correlation between electric car fleet and number of public chargers.
Electric buses offer an efficient and flexible form of public transport. Around 95% of global electric buses today operate in China (IEA, 2020f). China recently announced the extension of subsidy schemes for supporting electric buses to 2022 and plans to construct additional charging stations to support public transport electrification (MIIT, 2020). In the European Union, around 1 600 new electric buses were sold in 2019, implying a market share of only 4% (ACEA, 2020b). The average payback period of an electric bus is 9-11 years (based on an oil price of $30-60/barrel) and abatement costs range from $10-250/tCO2.9 Battery costs are expected to continue to fall, shortening the average payback period. Additional investments in electro-mobility infrastructure would further accelerate the electrification of the bus fleet.
A rapid adoption of electric trucks and vans would cut CO2 emissions and local air pollution. A growing number of countries and regions are introducing policies for electric trucks, including India, European Union, China and Latin America. More than 6 000 battery electric trucks were sold in China in 2019 and around 750 new electric trucks were registered in
9 Compared with a diesel bus, including tank-to-wheel emissions and indirect emissions from the power sector.
2
4
6
8
2014 2015 2016 2017 2018 2019
Mill
ion
cars
China Europe United States Other
Electric car fleet
100
200
300
400
500
600
2014 2015 2016 2017 2018 2019
Thou
sand
cha
rger
s
Public chargers
IEA.
All
right
s res
erve
d

Chapter 2 | Evaluation of possible recovery measures 67
2
Europe in 2019. Many major postal and package delivery companies have also pledged to expand their electric fleets: Amazon has pledged to have 100 000 electric delivery vans on the road by 2024, and DHL has committed to operating 70% of first- and last-mile delivery services with clean transport modes by 2025 (IEA, 2020f).
Public transport investment
Public transport allows efficient and affordable travel for all, and has been especially important during the Covid-19 crisis for transporting essential workers. Public transport systems, which employ 13 million globally, are under substantial duress because of Covid-19 (UITP, 2011). In Europe alone, a drop in revenue of around 40 billion dollars is expected in 2020 (IRJ, 2020).
Public transport has an important role to play in ensuring equal access to employment and education, and is an energy efficient means of transport. It provides important job creation opportunities: constructing new public transport lines can produce around 30% more jobs per dollar than investment in roads. Spending on transport projects in the American Recovery and Reinvestment Act of 2009 is estimated to have produced around 2.5 jobs per million dollars of investment (Smart Growth America, 2011).
Globally, over 8 000 km of metro and light rail have been commissioned and/or are under construction, and around the same amount is at an early planning stage. The estimated investment needed for these schemes at the early planning stage is over $350 billion, of which 60% is in low- and medium-income economies (UIC, 2017). This would create around 5 million jobs. Road space reallocation efforts could also bring “Bus-Rapid Transit” systems into cities that do not have them, which are less capital intensive than metros and have shorter construction periods (Loo, 2018).
Walking and cycling infrastructure
In regions that have eased their lockdowns, use of public transport has remained 50% lower than normal, while walking and biking levels have increased. Cities in the United States, including Chicago and Philadelphia, saw use of their bicycle share programmes nearly double during March 2020, while a number of European countries have seen an increase in bicycle count trends (Figure 2.16).
To maintain social distancing and avoid the negative impacts of increased car use, a number of cities – including Milan, Paris, Bogota and San Francisco – have reallocated road space to allow for increased walking and cycling. Making road space reallocation permanent by building bike lanes and expanded walkways could create over half a million local jobs globally in construction in the immediate to near term. The level of investment required is on the order of $40 billion. Additional jobs would be created through bicycle sales, repair and tourism, and could result in around 10 million new jobs across the manufacturing and retail sectors.
IEA.
All
right
s res
erve
d

68 World Energy Outlook 2020 | Special Report
Figure 2.16 ⊳ Increase in weekday bicycle activity in selected countries compared with pre-lockdown periods
A number of European countries have shown a large increase in recent bicycle activity.
Note: Compares activity in the week before lockdown measures were imposed and the third week of May 2020.
Source: Eco-Counter (2020).
Cities are also facilitating cycle use through incentives to repair existing bicycles and to purchase new ones. This has increased levels of local shopping: for example, establishing cycle paths in Manhattan, New York, was shown to increase local trade by up to 50% (Raje and Saffrey, 2016).
Payback periods for consumer purchase are typically less than six months for bicycles and up to two years for e-bikes. Abatement costs for investment in walking and cycling infrastructure are typically negative: estimates vary depending on emission factors of the modes they replace, the extent to which modal shift is from car or public transport, and the potential for induced travel. We estimate the abatement cost to be minus $100-50/tCO2.
Active travel also provides a range of health and societal benefits. One study indicated that for each dollar invested, the social benefits are over five-times higher (UK Department of Transport, 2014). Replacing the use of private vehicles with walking, cycling or public transport use brings air quality and noise reduction benefits and reduces congestion: this is particularly beneficial in cities with high pollution levels.
2.4 Buildings
Close to 10% of the global workforce today is involved in construction, manufacturing related to buildings and other related activities. The Covid-19 pandemic is resulting in drastic declines in construction and investment in the buildings sector because of disruptions to on-site working conditions, labour availability and material supply chains. More than 25 million jobs across the sector have been lost or are at risk in 2020.
20% 40% 60% 80% 100% 120%
France
Germany
Austria
United Kingdom
Italy
Finland
IEA.
All
right
s res
erve
d

Chapter 2 | Evaluation of possible recovery measures 69
2
Investment in energy efficiency in buildings is expected to fall by nearly 15% in 2020 from around $150 billion in 2019. With buildings accounting for more than 30% of global energy use today and 30% of energy-related CO2 emissions, investment needs to accelerate significantly if the world is to meet its sustainable development goals. Lack of access to clean cooking is a major inequality issue for the 2.6 billion people who currently lack access to it, and the decline in investment in 2020 is likely to slow progress towards achieving this sustainable development goal.
In this section we explore options that could stimulate job creation and provide a boost to the economy while also improving sustainability and resilience. Measures to promote energy efficiency, renewables and clean cooking access within the buildings sector could mitigate the impacts of the crisis, provide jobs and kick-start economic recovery, as well as bringing long-term benefits well beyond the buildings sector as savings from lower energy bill are reinvested, and as energy system resilience and sustainability is improved.
Retrofit existing buildings and more efficient new constructions: We estimate that 9-30 jobs would be created for every million dollars invested in energy efficiency measures in the buildings sector. Measures in this area often have short lead-times: existing efficiency programmes, for example, can be rapidly expanded and new projects can be shovel-ready within weeks or months. Targeting support to social housing and government buildings in the first instance could help kick-start efficiency improvement works, creating a pipeline of projects for the industry. Government investment in accelerating energy efficiency in buildings would bring long-lasting benefits: it would reduce energy bills for consumers, reduce energy poverty, improve health and comfort, and improve resilience in the face of climate events and price shocks.
More efficient and connected household appliances: Lower household incomes, disruption to global supply chains and the closure of retail outlets have resulted in the deferral or cancellation of many appliance purchases. This has slowed the rate of improvement in energy efficiency. Action to support the replacement of old appliances with new, highly efficient and connected appliances would create 7-16 jobs for every million dollars spent. Sales could be accelerated quickly, providing relief to the entire appliance supply chain, while increased use of smart connected appliances could reduce consumer bills and electricity system operation costs. Subsidies would also assist manufacturers in upgrading production lines to produce more efficient equipment, and support the effective disposal of old equipment. The safe recycling of old stock is particularly important for air conditioners and refrigerators, which contain powerful greenhouse gases.
Improve access to clean cooking: More than 2.6 billion people rely on the inefficient and polluting use of biomass, kerosene or coal as a primary cooking fuel. The resulting household air pollution causes around 2.5 million premature deaths every year, with Africa and Asia hardest hit. Recent progress to expand access to clean cooking has been slow and there are risks that the current crisis could further slow or reverse progress. Around 5 000-10 000 households would gain clean cooking access for every million dollars of spending. Beyond immediate health benefits, investing in access would create distribution and retail
IEA.
All
right
s res
erve
d

70 World Energy Outlook 2020 | Special Report
jobs. It would also reduce GHG emissions, with increases in CO2 emissions from the use of liquefied petroleum gas (LPG) offset by lower methane and nitrous oxide emissions from traditional uses of biomass. The use of clean cooking fuels would also avoid the average one-and-a-half hours that are spent every day collecting fuel wood and reduce the average four hours a day spent cooking, a burden that primarily falls on women.
Figure 2.17 ⊳ Investment impacts on employment, emissions and households gaining access to clean cooking
Increased investment in efficiency in buildings would create jobs, reduce emissions and improve access to clean cooking. Most CO2 abatement opportunities also save money.
Notes: tCO2 = tonnes of carbon dioxide. The range of emission reduction costs reflects the diversity of regional contexts and technology costs.
2.4.1 Retrofit existing buildings and more efficient new constructions
The Covid-19 pandemic is drastically reducing global construction and retrofit activity in the buildings sector. Investment in building construction may decline by 20% to 30% in major advanced economies in 2020, while also falling in China and India (IEA, 2020d). About 250 million people are employed in construction across the world: estimates suggest that over 10% of jobs have been or will be lost in 2020, and up to 80% of workers have been furloughed in some countries.
In some countries, existing buildings are expected to account for up to 80% of the stock in 2030; retrofits have an especially important part to play in improving energy efficiency. In countries where the building stock is expanding rapidly, it is particularly important to ensure that new buildings are constructed as efficiently as possible. Delays to construction and renovation activity will slow energy efficiency improvements, affecting energy use and related CO2 emissions in the buildings sector. This is especially the case for space heating and cooling, which account for almost 40% of energy use in buildings today and for 42% of CO2 emissions and over 60% of direct CO2 emissions in the sector.
10
20
30
40
50
Jobs
per
mill
ion
dolla
rs
Employment
3
6
9
12
15
Hou
seho
lds
per t
hous
and
dolla
rs
Clean cooking
- 200
- 100
0
100
200
300D
olla
rs p
er t
CO₂
Retrofits New buildings Appliances Clean cooking access Global average
Abatement costs
IEA.
All
right
s res
erve
d

Chapter 2 | Evaluation of possible recovery measures 71
2
Retrofits for existing buildings and efficient new constructions are the primary means of reducing energy demand in the sector. Where retrofits are needed, they are most effective at reducing demand and emissions when improvements are made to the building envelope, for example, adding insulation and improving glazing, and when there is a shift to more efficient equipment, such as heat pumps or heat solutions based on renewable resources, and to digital energy management. Building efficiency measures are central to achieving near zero energy building status in both new and existing buildings.
Average annual energy retrofit rates in buildings are currently less than 1% in most major markets, which is well below the level required to achieve sustainability objectives. Most buildings in advanced economies – where heating demand is concentrated –were built before there were effective building codes. Even today, less than one-third of countries globally have mandatory energy-related codes for new construction.
Selected policy approaches
Policy approaches to address the current Covid-19 crisis related circumstances include:
Increase incentives for building efficiency improvements, smart energy management solutions and on-site renewables, including by reducing administrative and processing times for approvals and addressing shortages of skilled providers.
Target efficiency improvement measures on those households and businesses most impacted by the crisis, such as low-income households, small businesses and hotels.
Use public procurement to catalyse activity, for example by commissioning efficiency retrofits of public assets such as social housing, schools, offices and healthcare facilities.
Provide guarantees to encourage energy service companies to invest in retrofits.
Accelerate or expand existing and planned efficiency programmes.
Economic implications
Around 9-30 jobs in manufacturing and construction would be created for every million dollars invested in retrofits or efficiency measures in new builds. Construction jobs would mostly be local, while manufacturing jobs in the wider industrial sector would be created by increased demand for building materials and equipment such as insulation, efficient glazing and heat pumps (Figure 2.18).
Improving the efficiency of buildings lowers energy bills for consumers, who can spend the savings on other goods and services, providing a further boost to the economy. Smart energy management systems can help customers further reduce bills and benefit from providing demand shifting services to electricity networks. The economic benefits of retrofits are likely to be highest when projects are focused on the least efficient buildings and include both building envelope improvements and heating equipment installation.
IEA.
All
right
s res
erve
d

72 World Energy Outlook 2020 | Special Report
Figure 2.18 ⊳ Job creation and household bill reduction potential to 2025 of investment in efficiency improvements in buildings
Retrofits in existing buildings and efficiency measures in new construction can create jobs and reduce consumer bills for space heating by as much as 15%.
Figure 2.19 ⊳ CO2 emissions abatement costs for space heating and annual avoided emissions by measure per million dollars invested
Many building envelope improvements deliver cost-effective emission reductions: gains are maximised when coupled with heat pumps or renewable heat solutions.
Notes: tCO2 = tonnes of CO2. Dots represent the global weighted average for various technologies within each grouping: insulation, glazing and weatherisation = loft and floor insulation, improved glazing, weatherproofing, cavity wall insulation and exterior insulation; heat pumps = air source and ground source heat pumps; biomass boilers = conventional boilers and condensing biomass boilers; solar thermal = flat plate collectors and evacuated tubes.
10
20
30
40
Jobs
per
mill
ion
dolla
rs
Employment intensity
Advanced economiesRest of world
Retrofits New buildings-20%
-15%
-10%
-5%
Household heating bills
European Union Canada United StatesJapan Russia China
- 100
- 50
0
50
100
150
0 2 000 4 000 6 000 8 000
Dol
lars
per
tCO
₂
tCO₂ emissions avoided per million dollars invested
Insulation, glazingand weatherisation
Heat pumps
Biomass boilers
Solar thermal
IEA.
All
right
s res
erve
d

Chapter 2 | Evaluation of possible recovery measures 73
2
Implications for emissions and resilience
Deep energy retrofits of old buildings can reduce energy demand linked to space heating by two-thirds or more: they can also reduce or eliminate emissions where they involve switching to renewables or decarbonised electricity. Retrofitting 20% of buildings in advanced economies over the next five years would reduce CO2 emissions from space heating by around one-fifth. Major cost-effective gains can be achieved by improving insulation and installing heat pumps (Figure 2.19).
More efficient buildings help to improve the security and resilience of energy systems by reducing energy use. Retrofits and efficient construction that encourage electrification and the use of smart energy management systems strengthen the security and resilience of electricity systems, boosted by the use of smart devices and on-site renewables that facilitate load management and support increased integration of variable renewables into electricity networks.
2.4.2 More efficient and connected household appliances
Appliances, such as refrigerators, washing machines, computers and mobile phones, account for nearly one-quarter of global electricity consumption today. Air conditioners account for a further 8% of total electricity demand and are one of the fastest sources of demand growth, having increased by nearly 25% between 2015 and 2019. Much of the recent growth has come from areas other than advanced economies, in particular from China and India.
The Covid-19 pandemic is leaving its mark on the appliance industry, with government restrictions on mobility and work practices significantly impacting appliance manufacturing, supply chains and consumer sales. Year-on-year sales of white goods in the European Union fell by 75% in March and April, with a 10-20% drop expected for 2020 as a whole. In the United States, electronics and appliance store sales fell by 65% in April 2020 relative to 2019 (US Census Bureau, 2020).
In contrast, ICT for remote working and home entertainment have seen an increase in sales during lockdown periods, with implications for electricity use in homes and beyond (Box 2.2). Continued teleworking could lead to permanent changes in energy demand: it is estimated that teleworking could increase household energy demand by 7-23%, depending on the location, season and efficiency of appliances and equipment (IEA, 2020g).
Declines in revenue from the sale of appliances create a risk of job losses across manufacturing, distribution and sales. There is also a risk of reduced investment in the upgrading of production facilities to increase appliance efficiency. Lower electricity prices and lower household incomes could decrease consumer interest in higher efficiency products. Some governments may seek to weaken or delay mandatory energy performance standards and labelling for appliances in an effort to stimulate sales. Maintaining – or strengthening – standards would however increase the economic impact of investments in the sector, while also creating long-term benefits for consumers and the economy.
IEA.
All
right
s res
erve
d

74 World Energy Outlook 2020 | Special Report
Government actions to support sales of efficient appliances and assist local appliance manufacturers to improve production facilities and worker skills would yield long-term benefits by improving the productivity, efficiency and competitiveness of local manufacturing, increasing appliance efficiency and reducing energy demand and emissions. The increased use of smart appliances could also improve services and increase economic gains by rewarding customers for providing services to electricity systems.
Box 2.2 ⊳ Energy footprint of the digital economy
Global internet traffic surged by almost 40% between February and mid-April 2020, driven by growth in teleworking, video streaming and conferencing, online gaming and social networking (Sandvine, 2020). The growth during Covid-19 comes on top of a 12-fold growth in global internet traffic since 2010 (Sumits, 2015; Cisco, 2018; ITU, 2020).
Rapid improvements in energy efficiency have helped to limit electricity demand growth from ICT, which consume around 800 terawatt-hours (TWh) per year, around 3.4% of global electricity use (Malmodin and Lundén , 2018). Global energy use in data centres has remained flat since 2010 at around 200 TWh, about 1% of global electricity use, despite a sevenfold growth in workloads (Masanet, 2020).
Demand for data and digital services is expected to continue its exponential growth, and the Covid 19 crisis may further accelerate these trends. Strong government and industry efforts on energy efficiency, renewables procurement, and RD&D could limit growth in ICT energy demand and emissions over the next decade (IEA, 2020h).
Selected policy approaches
The choice of policy approaches to stimulate employment and economic activity in the appliances area depends on the local context. Governments in economies with a significant appliance manufacturing industry may provide direct support to retain local employment, while others may intervene to stimulate sales and the economy. Policy options for both include:
Provide direct rebates or tax reductions to customers to trigger purchases. The largest subsidies could be offered to low-income households and for the purchase of the most efficient appliances.
Increase spending on appliances in the public sector, e.g. government buildings, schools, community centres, to replace low efficiency stock with best available technologies, including smart appliances where relevant.
Support appliance manufacturers to invest in retooling production lines and train workers to produce high efficiency appliances.
Support adopting efficiency standards in markets where demand for appliances is growing.
IEA.
All
right
s res
erve
d

Chapter 2 | Evaluation of possible recovery measures 75
2
Introduce requirements for appliances to be smart and connected, allowing appliances to provide demand-side management services to the benefit of consumers and the grid.
Expand international co-operation on appliance efficiency standards.
Economic implications
The majority of jobs related to appliances are in supply chains and sales rather than in direct manufacturing. Of the nearly 1 million jobs in the white goods appliance sector in Europe, only around one-quarter are direct manufacturing jobs. China, Mexico, Korea and Turkey are the largest appliance manufacturing centres globally today.
We estimate that 7-16 jobs would be created for every million dollars of spending, of which the majority would be in distribution and sales. This job creation effect is strongest when appliances are manufactured locally.
Figure 2.20 ⊳ Economic opportunities for investment in appliances
Incentives covering a small share of sale prices can cut payback periods in half for consumers.
Replacing old devices with new high efficiency appliances would cut consumer spending on electricity by around 30-50%. Depending on the type of appliance, and the additional features sold with more efficient appliances, payback periods range from under one year to more than ten years. A small subsidy could significantly reduce payback periods for consumers, accelerating the uptake of efficient appliances and reducing consumer bills (Figure 2.20). Bill savings are usually invested in more productive and labour-intensive sectors of the economy.
4
8
12
16
Jobs
per
mill
ion
dolla
rs
Employment intensity
Appliances
10%
20%
30%
40%
High efficiency (A+) Very high efficiency (A+++)
Subsidy/price ratio to halve payback period
Washing machine Refrigerator Air conditioner
IEA.
All
right
s res
erve
d

76 World Energy Outlook 2020 | Special Report
Implications for emissions and resilience
Energy demand and emissions savings created by appliance-related recovery measures depend on programme design, and on the level of efficiency specified or triggered. Replacing one-quarter of the world’s least efficient appliances would, however, be likely to reduce emissions by over 300 Mt CO2. The average cost of emissions saved depends on the appliance type and the carbon intensity of electricity in the service region, but CO2 emissions abatement costs are negative for many basic efficiency improvements in washing machines, refrigerators, televisions and lighting.
Refrigerants in older air conditioners and refrigerators are often hydrofluorocarbons (HFCs), which can have ozone depleting properties and are potent greenhouse gases. The Kigali Amendment to the Montreal Protocol calls for the eliminating the production and use of HFCs; phasing out old refrigerators is central to accomplishing its objectives. Various support initiatives are underway. For example, the Kigali Cooling Efficiency Program is funding the upgrading of refrigerator production lines in Argentina, Bangladesh and other countries to retool manufacturing lines for the production of more efficient appliances using less damaging refrigerants.
Box 2.3 ⊳ Appliance replacement programme for low-income households in Mexico
Following the 2008 financial crisis, Mexico had a programme in 2009-18 to replace non-efficient appliances in low-income households. It provided rebates for purchasing new energy efficient appliances that complied with mandatory efficiency standards. The primary aim was to reduce household electricity use, which was subsidised in over 95% of households. It was also an opportunity to reduce GHG emissions and ensure appropriate disposal of refrigerant gases.
Nearly 2 million refrigerators and air conditioners were replaced, as well as light bulbs, resulting in estimated savings of almost 700 gigawatt-hours (GWh) annually. All of the replaced appliances were more than ten years old and in low-income households that received electricity subsidies. The programme delivered subsidy savings of $22 million annually through avoided energy consumption. The payback period to the government was under four years, and the scheme created more than 1 600 new permanent jobs and 10 500 new temporary jobs. Energy savings avoided 3 400 kilotonnes of carbon-dioxide equivalent (kt CO2-eq) per year, while the programme captured, stored or destroyed ozone depleting refrigerant gases, thus avoiding a further 500 kt CO2-eq of emissions annually.
2.4.3 Improve access to clean cooking
Progress on improving access to clean cooking solutions has been slow over the past decade (Figure 2.21). In 2018, more than 2.6 billion people relied on traditional uses of biomass, coal or kerosene as a primary cooking fuel. Although improvements have been
IEA.
All
right
s res
erve
d

Chapter 2 | Evaluation of possible recovery measures 77
2
registered in a number of countries, mostly in developing Asia, population growth in sub-Saharan Africa has outpaced efforts to provide access, and four-out-of- five people do not have access to clean cooking solutions (IEA, 2019a). On the basis of current policies and trends, the UN Sustainable Development Goal (7.1.2) to achieve universal access to clean cooking by 2030 looks to be out of reach.
Figure 2.21 ⊳ Access to clean cooking and premature deaths from household air pollution in sub-Saharan Africa and Asia
While progress has been achieved in Asia, the number of people
without access to clean cooking solutions continues to rise in sub-Saharan Africa.
Sources: IEA and International Institute for Applied Systems Analysis (IIASA) analyses using World Health Organization (WHO) Household Energy Database (World Health Organization, 2019) .
The Covid-19 crisis and its economic implications risk could significantly slow progress in expanding access to clean cooking, and in some cases could lead to previous gains being reversed. Households may switch back to traditional uses of biomass if they cannot afford cleaner fuels or if there is disruption in supply chains. At the same time, many nascent companies developing new consumption modes (e.g. LPG pay-as-you-go smart meter technology), or projects in low-access areas (e.g. bioethanol, upgraded biomass fuels), could be forced to cease operations as a result of a drop in revenue. There is an urgent need to develop comprehensive programmes to support such innovative clean cooking providers and seize opportunities to expand access to clean cooking (IEA, IRENA, UNSD, World Bank, WHO, 2020).
Recent oil market disruption has resulted in international LPG prices reaching historic lows: in April and May 2020, they were down by around 40% compared to the 2019 average. This could make LPG much more affordable for households, provided that low prices are sustained, and that logistical or regulatory factors do not prevent lower prices being passed on to consumers. Nonetheless, potential LPG price volatility could be damaging for low-income customers, and price caps or targeted subsidies may be needed to support long-term use and avoid fuel stacking practices. With lower LPG prices, payback periods for LPG
0.5
1.0
0.4
0.8
1.2
1.6
2010 2018 2010 2018 2010 2018 2010 2018
Mill
ion
peop
le
Billi
on p
eopl
e
People without access People with access Premature deaths (right axis)
Sub-Saharan Africa India China Other Asia
IEA.
All
right
s res
erve
d

78 World Energy Outlook 2020 | Special Report
stoves could drop from around 3.5 years to 1 year for urban households reliant on paid fuel wood in sub-Saharan Africa. In many countries with a well-developed LPG sector, such as Brazil, Indonesia, India, Kenya, Morocco and South Africa, governments have moved quickly to ensure continuity of supply during the crisis, and have recognised LPG provision as an essential service. In India, the government guaranteed free LPG refills to poor households from April to June 2020.
Selected policy approaches
Strong government involvement and a comprehensive set of measures are needed to support the expansion of clean cooking access. Many opportunities exist today for policy makers to make short and medium-term progress on clean cooking:
Support affordability of clean cooking options through direct incentives for equipment acquisition and fuel consumption for the poorest households. Options include subsidies, tax or duty exemptions and pre-financing of upfront costs (e.g. for biogas digesters, which have high upfront cost but almost no operational costs).
Establish price mechanisms to ensure energy affordability for low-income households so as to increase household confidence in clean cooking solutions and reduce fuel stacking.
Develop markets for stoves and fuels, encourage industry participation and private equity investment. This includes enforcement of laws and regulations, financial incentives and protocols to certify efficiency, emissions, and safety (e.g. safe cylinder recirculation model).
Support the development of modern fuel infrastructure. This includes investment in the production or import of modern fuels, distribution of cooking equipment and transport infrastructure.
Support companies and non-governmental organisations to develop renewables-based electric cooking solutions, and innovative business models such as pay-as-you-cook using LPG, and to support increased use of non-fossil cooking fuels such as bio-LPG, bioethanol and other upgraded biomass fuels.
Economic implications
Expanding the use of clean cooking requires a diverse set of equipment and fuels, and would create different types of jobs in rural and urban areas. In countries with adequate resources, a biogas, bioethanol or upgraded biomass fuel industries would create employment in rural areas for transforming feedstock into modern biomass. In countries with existing manufacturing, the assembly and maintenance of modern cookstoves could provide a major source of employment. Expansion of LPG services, which already employs around 2 million people worldwide, could create 16-75 direct local jobs per million dollars spent, depending on the specificities of the LPG market. A strong push for LPG with safe cylinder circulation models would provide new jobs for bottling, distribution and retail, as well as in cylinder manufacturing. Between 5 000 – 10 000 households would be provided with access to clean cooking solutions for each million dollars invested.
IEA.
All
right
s res
erve
d

Chapter 2 | Evaluation of possible recovery measures 79
2
Fuel distribution pathways are evolving, with innovative business models making use of digital technologies and mobile money services that create demand for new skills and jobs in customer-care teleservices. The development of modern fuel industries would have an impact on existing traditional biomass value chains which can be very labour intensive. However, many of these jobs are informal, though measures could be implemented to avoid negative impacts. If regulations ensure that jobs in new value chains are created in the formal rather than the informal economy, the jobs created would be less vulnerable, while also contributing taxes, benefiting public finances and the whole economy.
For households that currently pay for inefficient and unsafe cooking fuels, shifting to modern cooking solutions can often lead to reduced energy bills, freeing income that can be reinvested in the economy. In particular, pre-financing the high upfront capital cost of biogas digesters would unlock savings, leading to major long-term benefits for households (IEA, 2020i).
Implications for emissions and resilience
Cooking activities account for 1 Gt CO2-eq globally. One-fifth of these emissions come from the inefficient combustion of wood or other fuels, which also produces methane (CH4), nitrous oxide and black carbon. Increasing access to clean cooking would reduce these GHG emissions as any increases in CO2 emissions from increased use of LPG or electricity would be more than offset by lower methane and nitrous oxide emissions (Figure 2.22): emissions from deforestation would also be reduced. While LPG is today one of the lowest CO2-eq emitting cooking fuels available at scale, the development of less-emitting fuels for cooking could further boost GHG emissions reductions in the long term. Biogas and bio-LPG look like promising solutions: they could draw on local agricultural resources, and could potentially be distributed in much the same way as LPG.
Figure 2.22 ⊳ Implications of spending 1 million dollars on clean cooking
Investing in access to clean cooking solutions saves lives, increases productivity
and reduces emissions.
20
40
60
80
100
Peop
le p
er y
ear
Reduction in premature deaths
- 2
- 1
- 0
1
2
CO₂increase
CH₄ and N₂Oreduction
Net
ktCO
₂-eq
GHG emissions
IEA.
All
right
s res
erve
d

80 World Energy Outlook 2020 | Special Report
Household air pollution resulting from polluting and inefficient cooking solutions is linked to around 2.5 million premature deaths every year. Achieving universal access to clean cooking solutions by 2030 could avoid around 1.9 million premature deaths per year.
Investing in clean cooking would also avoid the one-and-a-half hours that are currently spent on average every day collecting fuel wood, and reduce the four hours that are spent cooking on average. These are burdens that fall disproportionally on women.
2.5 Industry
The Covid-19 crisis has led to a sharp slowdown in industrial activity around the world (Table 2.3). This matters for both employment and emissions: one-in-four jobs globally are in the industry sector, which accounts for around 30% of final energy use. Demand growth for materials, such as cement was projected to be slow in 2020 even before the Covid-19 crisis, and now has been hit by a sudden halt in construction and other activities, plus an expected downturn in future projects. The slowdown in economic activity is likely to be disproportionately felt by small and medium enterprises (SMEs) in industry, which can be very cash-flow sensitive and are often dependent on providing services to larger industry players or acting as surge producers. Many companies have had to delay new projects and plant upgrades, as well as idle some capacity or accelerate its retirement.
Table 2.3 ⊳ Impact of Covid-19 crisis on industrial sectors
World China India European
Union United States
Share of GDP in 2019 Industry 28.2% 39.6% 29.2% 25.8% 18.4%
Production in 1st quarter 2020 (% year-on-year)
Industry -5.4% -9.4% -3.3% -5.8% -2.1%
Steel -1.4% 1.2% -5.3% -10.0% -1.0%
Cement -4.4% -23.9% -4.9% -0.5% 7.7%
Petrochemicals* -2.7% -5.0% -11.7% -4.4% -0.2%
Manufacturing -9.2% -7.7% 0.5% -5.6% -4.3%
Total jobs (million) Industry 797 220 126 48 33
Share of total employment Industry 23.0% 28.2% 25.6% 26.2% 19.8%
* Ethylene supply is taken as proxy for petrochemicals.
Sources: IEA (2019c); Trading Economics (2020a); Trading Economics (2020b); Trading Economics (2020c); Federal Reserve (2020); World Steel Association (2020); CEMNET (2020); CEIC (2020); S&P Global Platts (2020); Institute for Supply Management (2020); Statista (2020); IHS (2020b); ILO (2020).
Steel production remained relatively robust amid rising oversupply concerns due to contracting demand. Blast furnaces face technical limitations for flexible operation and production cuts were short-lived in China, the world’s largest producer. Production of petrochemical products has been affected by a growing overhang of capacity and a drop in demand muted by a surge in demand for packaging and sanitary materials. The crisis has also triggered delays or reversals to bans on single-use plastics, amid worries that reusable plastics could spread the virus, and there has been a slowdown in recycling activity.
IEA.
All
right
s res
erve
d

Chapter 2 | Evaluation of possible recovery measures 81
2
This section explores two particular measures to stimulate economic activity and generate jobs in the industry sector (Figure 2.23). Investment in innovative industrial technologies that could help develop new industrial capacity is also important in this context, which is discussed in section 2.7.
Improve energy efficiency and electrification: Investment in energy efficiency would create on average around 10 jobs per million dollars spent. These jobs could be created rapidly, would provide immediate support for retrofitting and energy service jobs, and would be effective in stabilising the ailing SME segment, where sizeable energy efficiency potential remains untapped. Investment in more energy efficient industrial electric motors, heat pumps for low-temperature process heat and agricultural irrigation pumps typically have attractive payback periods: they could quickly generate savings that would allow industry to increase expenditure on core business operations. Options for governments to promote such investment include: tax deductions, guaranteed lending, rebates, cash-for-replacement schemes incentives for energy management systems and training and hiring energy managers. In addition to the immediate increase in employment and positive long-term economic benefits, energy efficiency improves productivity, reduces import dependency, saves emissions and strengthens crisis resilience.
Expand waste and material recycling: Recycling has gained momentum in recent years, but is facing challenges from concerns about the re-use of plastics and from low prices for virgin material as a result of Covid-19. Waste collection and sorting could be ramped up quickly to provide support for jobs, with around 15-40 jobs created for every million dollars of spending. Existing waste management systems could be improved by facilitating sorting, improving product designs, and reforming taxes and levies.
Figure 2.23 ⊳ Performance of measures in the industry sector
Investment in energy efficiency, material recycling and innovative technologies would help the industrial sector to create jobs and boost GDP while cutting CO2 emissions.
Note: tCO2 = tonnes of CO2.
2
4
6
8
10
Year
s
Payback period
10
20
30
40
50
Jobs
per
mill
ion
dolla
rs
Industrial energy efficiencyMaterial recycling
Net job creation
-200
-100
0
100
200
Dol
lars
per
tCO
₂
Solar water pump Efficient electric motor Heat pump
Abatement cost
IEA.
All
right
s res
erve
d

82 World Energy Outlook 2020 | Special Report
2.5.1 Improve energy efficiency and increase electrification
Industrial efficiency gains make up a large share of the potential for total energy intensity improvements worldwide, and in recent years have seen annual investment of around $40 billion. Improvements in industrial energy efficiency, however, are likely to stay at relatively low levels in the short term, with low capacity utilisation and low fuel prices extending payback periods in the current crisis and its aftermath. SMEs are key stakeholders for realising wholesale changes in energy efficiency, but many are facing financial difficulties and cannot easily fund retrofits and investment.
Selected policy approaches
Industrial energy efficiency could be stimulated by direct financial incentives, tax deductions, accelerated depreciation and government-backed lending. Rebate and cash-for-replacement programmes could accelerate retrofits of industrial motors (e.g. to IE3+ worldwide, IE4 in advanced economies irrigation and heat pumps).10 SMEs should also be incentivised to adopt energy management systems and to improve the energy efficiency of their operations. Policy instruments could incentivise the achievement of energy savings by making support conditional on audited energy savings.
Economic implications
Energy efficiency is a cost-effective means of improving productivity in many industrial sectors. Payback periods for investment in electric motors, industrial low-temperature heat pumps and other industrial efficiency measures are generally attractive, even with the current low fuel prices. Energy efficiency measures would quickly create new jobs at retrofitters and energy service companies (ESCOs), especially in the ailing SME sector, and in manufacturing and installation. There would be some job losses in some segments over time, but the jobs created would greatly outnumber them (Figure 2.24). In aggregate, it is estimated that industrial energy efficiency measures would create around 10 jobs per million dollars invested.
Implications for emissions and resilience
Implementing all cost-effective industrial energy efficiency measures would reduce emissions in 2030 by around 2 Gt CO2 and would require around $50 billion additional investment per year. The use of more efficient electric motors, which can have very attractive payback periods, would provide around half of these savings and avoid more than 1 200 TWh of energy use in 2030. Increased energy efficiency would improve the resilience of local production to supply and price disruptions in the future, strengthen domestic value chains, improve international competitiveness and reduce import dependency.
10 Motors are benchmarked to the International Electro-technical Commission’s “International Efficiency” standards, which range from low (IE0) to super premium (IE4), with minimum efficiency requirements based on size and number of poles.
IEA.
All
right
s res
erve
d

Chapter 2 | Evaluation of possible recovery measures 83
2
Figure 2.24 ⊳ Job creation through investment in heat pumps
Investment in industrial heat pumps creates a net increase in jobs.
Box 2.4 ⊳ Irrigation pumps in agriculture
Agriculture is the single largest employer in the world. It sustains the livelihood of 3.1 billion people, many of them living in poverty. Increasing the productivity of this sector is widely recognised as an effective means of stimulating socio-economic development and fighting poverty. Every 10% increase in farm yield leads to an estimated 7% reduction in poverty in Africa and 5% reduction in poverty in Asia (UNEP, 2012).
Figure 2.25 ⊳ Estimated stock of agricultural irrigation pumps in India
India has a programme to boost deployment of solar-powered irrigation pumps in agro-industries. These offer large potential benefits for productivity and local jobs.
Sources: MNRE (2020); Mercom India (2020); Thouthang and Kumar (2019); Shakti Sustainable Energy Foundation (2017); India Times (2019); Garg (2018); TERI (2014); UN University (2014).
- 1
0
1
2
3
4
5
Fossil fuels Manufacturing Installation Maintenance
Jobs
per
mill
ion
dolla
rs
10
20
30
2010 2014 2018 2022
Mill
ion
units
Grid-connected
Solar
Diesel
IEA.
All
right
s res
erve
d

84 World Energy Outlook 2020 | Special Report
Energy efficiency measures offer a major opportunity for productivity gains and resource savings in agro-industries. Electrifying and improving the motors used in water pumps, ventilation and air circulation yields savings of up to 30%. India’s government programmes have added around 0.5 million new pumps each year since 2010, accounting now for around 20 million electrified pumps (Figure 2.25). Options to combine pumps with solar photovoltaics (PV) reduce payback periods and provide potential further benefits in terms of jobs, environmental impact and resilience, especially when accompanied by measures to tackle over-irrigation practices.
2.5.2 Expand waste and material recycling
The production of industrial materials is energy intensive, and accounts for around 30% of total final energy consumption worldwide. Implementing economically viable recycling technologies can shorten supply chains, increase resilience and create new jobs, while reducing additional demand for virgin materials. An increasing number of moves have been made in a number of countries and businesses to increase recycled plastic content and ban or reduce one-time use plastics. However, less than 20% of plastic is recycled today because of low collection rates and technical sorting challenges. Recycling rates are higher for metals and paper, but there are still huge variations in rates between countries. The Covid-19 crisis has added to the challenges. Lockdowns led to the temporary closure of waste and recycling operations in many countries; the halt in construction activity has affected scrap availability for secondary metal production; and the plastic recycling industry has been hit by policy changes and by a reduction in the value of recycled product as a result of low oil prices.
Selected policy approaches
In advanced economies, existing waste management systems can be enhanced by facilitating sorting, standardising and improving product designs to adequately account for end-of-life aspects, and reforming taxes and levies on waste and scrap. Well-designed “cash-for-clunkers” programmes have the co-benefit of increasing scrap availability for secondary electrified steel making, aluminium and petrochemicals.
In developing economies, where 15-20 million waste pickers work in the informal sector, progress could be made by equipping municipalities with the financial resources to take ownership of waste management. Also by encouraging the installation of new waste collection and sorting technologies and adopt best practices for collection.
Economic implications
Waste and material recycling has large job creation potential, especially in developing countries, where establishing recycling industries creates around 15-40 jobs per million dollars of investment (Figure 2.26). Measures to improve recycling would cost more than an additional $500 per tonne of waste processed (with variations across materials, but would bring benefits in terms of health, environment and reduced GHG emissions).
IEA.
All
right
s res
erve
d

Chapter 2 | Evaluation of possible recovery measures 85
2
Figure 2.26 ⊳ Net job creation of recycling per million dollars of spending
Increased recycling has large job creation potential, particularly in segments where collection and sorting is labour intensive.
Implications for emissions and resilience
Increasing global average recycling rates (for all materials) from around 41% today to 47% in 2030 would reduce emissions from material production by around 20% from today. Growth in recycling would be likely to come primarily from plastics and steel, where current rates are lower than for paper and aluminium. Recycling and scrap usage reduces environmental damage, adverse health effects and import dependency. It also reduces landfill disposal and incineration, and the costs associated with landfills. Today, 37% of global waste goes to landfills and the open burning of waste is associated with significant negative health impacts.
2.6 Fuels
Oil and natural gas meet more than half of global primary energy demand today and the oil and gas industries employ around 13 million people in upstream operations, refining and processing, transport and distribution and services. The Covid-19 pandemic has had a major impact on markets, particularly for oil, and oil demand is expected to be around 8.5% lower in 2020 than in 2019. There have also been sudden short-term shocks in both supply and demand that were well in excess of the industry’s near-term capacity to adapt: in April 2020, oil demand was around 25% lower than a year ago, and prices have been very volatile. A number of countries have responded to lower prices by building up their strategic petroleum reserves, while a number of companies have announced sharp downward revisions to investment plans. We expect global upstream oil and gas investment to fall by almost one-third from 2019 levels, and around 1.2 million workers in the oil and gas industry at risk of losing their jobs. The reduction in the oil price has made
10
20
30
40
50
Steel Aluminium Pulp and paper Plastic
Jobs
per
mill
ion
dolla
rs
IEA.
All
right
s res
erve
d

86 World Energy Outlook 2020 | Special Report
products such as LPG cheaper but alternative fuels such as sustainable biofuels more expensive. Biofuels have been hit harder than any other forms of renewable energy to date: demand is expected to fall by around 15% in 2020.
This section examines the implications of the Covid-19 crisis on methane emissions from oil and gas operations, fossil fuel subsidies and biofuels, and the extent to which sectors could contribute to an overall sustainable recovery programme.
Reduce methane emissions from oil and gas operations: We estimate that it is technically possible to reduce around three-quarters of the current 82 Mt of methane emissions that are released from oil and gas operations each year. Some of the skilled oil and gas workers at risk of being laid off because of Covid-19 could be re-trained to work on abatement programmes: we estimate that around 4 jobs would be created for every million dollars spent to reduce oil and gas-related methane emissions. The economics of monitoring, reduction, and methane prevention measures and programmes are likely to be impacted by the drop in natural gas prices. Continued and enhanced government support to address gaps in information, infrastructure and investment will be important to ensure the oil and gas industry tackles its methane emissions. It would be cost effective to deploy nearly all technically available abatement options at a GHG price of $15/tonne CO2-eq.
Reform fossil fuel subsidies: The global value of fossil fuel consumption subsidies in 2019 was around $320 billion. Without any changes to existing subsidy regimes, this is likely to fall to $180 billion in 2020 because of the drop in oil and gas prices. However, oil and gas income in producer economies in 2020 is likely to drop by nearly $800 billion – a reduction of 55% on 2019 levels. Phasing out inefficient fossil fuel subsidies would create new budget space, remove economic distortions and make room for more spending to boost long-term economic growth; the dramatic fall in oil and gas prices also offers opportunities to cut inefficient subsidies without increasing end-user prices. Reform programmes need to carefully consider national circumstances, not least the need to keep energy affordable for the poorest in society.
Support and expand the use of biofuels: The liquid biofuel industry employed around 2.1 million people in 2018, and is a critical employer of both low and high skilled workers across many countries. However, a significant share of production capacity has been idled or is operating at reduced capacity as a result of the slowdown in overall liquid fuel demand. New policies and targeted support – which should be closely linked to meeting appropriate sustainability criteria – could help stabilise the industry and create a large number of new jobs in a short period of time. We estimate that each million dollars of investment would create around 15-30 jobs, a significant proportion of which would be in rural areas (Figure 2.27). Investment in sustainable biofuel production and consumption infrastructure could also have other long-term benefits such as offsetting the need for oil imports and supporting demand for nationally important agricultural commodities. Sustainable biofuels also have a potentially important part to play in reducing emissions from sectors that are challenging for low-carbon electricity to reach such as heavy-duty vehicles, aviation and shipping.
IEA.
All
right
s res
erve
d

Chapter 2 | Evaluation of possible recovery measures 87
2
Figure 2.27 ⊳ Investment impacts on jobs, abatement costs and fossil fuel subsidies
There is scope to phase out inefficient fossil fuel subsidies, to intensify efforts
to tackle methane emissions and to support sustainable biofuels.
Notes: tCO2 = tonnes of carbon dioxide; 2020e = estimated value for 2020. Biofuels numbers are for fuel ethanol.
2.6.1 Reduce methane emissions from oil and gas operations
Estimates of methane emissions are subject to a high degree of uncertainty, but the most recent comprehensive estimate suggests that annual global methane emissions from human activity are around 350 Mt (Figure 2.5). The largest sources of anthropogenic methane emissions are the agriculture and energy sectors, which includes emissions from coal, oil, natural gas and bioenergy. We estimate that oil- and gas-related methane emissions in 2019 were around 82 Mt, equivalent to around 2.5 Gt CO2-eq (assuming that one tonne of methane is equivalent to 30 tonnes of CO2, the 100-year global warming potential.)
There is a great deal of uncertainty over what might happen to methane emissions in 2020. While global emissions of CO2 will fall this year, a similar reduction in methane emissions from oil and gas cannot be taken for granted. The drop in natural gas prices means that many reduction and prevention measures are now less cost effective to deploy than was previously the case. Declines in revenues from oil and gas operations may also mean that companies pay less attention to efforts to tackle methane emissions; regulatory oversight of oil and gas operations could also be scaled back.
10
20
30
40
Methane Biofuels
Jobs
per
mill
ion
dolla
rs
Jobs
- 50
0
50
100
150
Methane Biofuels
Dol
lars
per
tCO
₂-eq
Abatement costs
100
200
300
400
500
2015 2020e
Billi
on d
olla
rs
Fossil fuel subsidies
IEA.
All
right
s res
erve
d

88 World Energy Outlook 2020 | Special Report
Figure 2.28 ⊳ Sources of methane emissions
Agriculture and energy sectors are the two largest sources of anthropogenic
methane emissions: oil and gas operations caused around 82 Mt of emissions in 2019.
Sources: Non-energy data for the year 2012 (the latest year for which reliable estimates are available), Sauonis (2016); energy data for the year 2019, IEA (2020j).
Selected policy approaches
Continued and enhanced government support for reduction programmes will be important to ensure that methane emissions fall in the coming years. Strengthening efforts to reduce methane emissions could form an important part of any support that may be offered to the oil and gas industry. In Canada, for example, around US$550 million is included in a federal stimulus package to help oil and gas companies reduce methane emissions. Examples of policies and approaches to encourage or require methane emissions reductions include:
Encourage direct measurement: To improve understanding of the issue, help measure progress against goals, and develop and refine objectives and targets.
Ensure transparency on data and methods: Essential for credible reporting, which would be strengthened through third-party verification.
Introduce quantitative targets: Reduction commitments are included in some Nationally Determined Contributions (e.g. Canada) and their use could be expanded.
Establish well-designed regulations: Including how oversight will be carried out, the institutional arrangements for enforcement and penalties for non-compliance.
Economic implications
We expect oil and gas companies to cut upstream investment in 2020 by around one-third compared with 2019 levels. A large portion of the pain arising from this will be felt by companies providing oil field services and supplies. We estimate that around 1.2 million oil and gas jobs could be lost in 2020, or around 10% of the workforce. Jobs servicing the shale
50 100 150 200
Biomassburning
Waste
Energy
Agriculture
Other
Wetlands
Mt
Natural
Anthropogenic
Oil
Gas
Coal
Bioenergy
IEA.
All
right
s res
erve
d

Chapter 2 | Evaluation of possible recovery measures 89
2
sector would be hardest hit, but the effects would be widely felt across the industry. Incentivising reductions in oil and gas methane emissions could make use of some of the skilled members of the oil and gas service sector who are laid off. We estimate that it is technically possible today to reduce around 75% of current oil and gas methane emissions. Around $15 billion spending would be required annually to fully realise this reduction.
Figure 2.29 ⊳ Marginal abatement cost curve for oil- and gas-related methane emissions by mitigation measure, 2019
It is technically possible to reduce methane emissions from oil and gas operations by
nearly 60 Mt; many of these emissions could be avoided at no net cost.
Note: MBtu = million British thermal units.
Some of the opportunities for reducing oil and gas methane emissions can be quite labour intensive. For example, leak detection and repair programmes are required to identify and fix sources of fugitive (or accidental) methane emissions. There have been many recent advances in remotely detecting methane emissions through the use of satellites, planes and drones. This expedites the process of finding leaks but operators are still needed to repair these leaks. Similarly, vented emissions can occur during the normal operation of equipment along the oil and gas value chains, and dealing with these requires operators to replace or retrofit existing pieces of equipment. Taken together, around 4 jobs would be created on average globally for every million dollars invested in reducing fugitive and vented methane emissions.
While natural gas prices are generally much lower than in the past, we estimate, on the basis of 2019 prices, that around one-third of methane emissions from oil and gas operations could be avoided at no net cost. This is because the value of the captured methane is higher than the cost of deploying the measure. Around $5 billion spending would be required to mobilise these reductions, but these would end up saving natural gas worth nearly $10 billion each year.
-6
-4
-2
0
2
4
6
8
0 10 20 30 40 50 60
Dol
lars
per
MBt
u
Mt
Instrument air systemsPumpsElectric motorCompressor seal or rodEarly device replacement
Vapour recovery unitsBlowdown captureFlaresPlunger
UpstreamDownstream
Other
Replace existing devices
Install new devices
Leak detection and repair
IEA.
All
right
s res
erve
d

90 World Energy Outlook 2020 | Special Report
Implications for emissions and resilience
Many of the international oil companies as well as a number of national oil companies have set individual or collective targets to restrict methane emissions or the emissions intensity of production. However there are limits to what can be achieved by voluntary action because the pool of those willing to take such action is limited, and because the actions themselves may fall short of what is desirable from a public policy perspective. Because methane is a very potent greenhouse gas, even those measures that cost more money than they save are a very cost-effective way to reduce GHG emissions. For example, with a GHG price of only $15/tonne CO2-eq, it would be cost effective to deploy all abatement options, i.e. to reduce total emissions by around 75%. Governments will therefore play a critical role in helping to reduce methane emissions.
Methane emissions of 82 Mt are equivalent to around 145 billion cubic metres of natural gas. This represents less than 5% of global natural gas consumption, but reducing leaks and the flaring of natural gas could substantially improve the trade position of a number of natural gas producers and exporters. There is also increasing interest in differentiating sources of natural gas by the GHG emissions intensity of their production, and the level of methane emissions is the largest component of this. For natural gas exporters, ensuring that methane emissions are kept as low as possible could therefore be an important factor in ensuring the resilience of gas export markets. Natural gas importers could reinforce this incentive by announcing and implementing pathways towards procuring natural gas that entails the smallest possible methane leaks in production and transport.
2.6.2 Reform fossil fuel subsidies
Fossil fuel consumption subsidies lower the price of fossil fuels or fossil fuel-based electricity to end-use consumers. Many major oil and gas exporting countries have traditionally provided very cheap energy to their populations, though a number of importing countries also subsidise the use of fossil fuels. In 2019, the global value of fossil fuel consumption subsidies was around $320 billion. If there were to be no changes in pricing regimes, we estimate that total fossil fuel subsidies would fall to around $180 billion in 2020 because of the drop in oil and gas prices. However a number of countries have introduced additional price interventions, particularly in the electricity sector, to protect newly vulnerable consumers and so this number may increase.
Many of the world’s key producer economies cut oil production in response to the collapse in oil demand, and along with the fall in prices, this will have a major impact on their public finances. If the oil price were to remain at $30/barrel for the remainder of 2020, oil and gas income in economies with fossil fuel subsidies would be nearly $800 billion lower in 2020 than in 2019 (Figure 2.5). Beginning, or accelerating, reforms to inefficient fossil fuel subsidy regimes could provide some relief to their fiscal positions. While the reduction in oil and gas revenues may undercut some of the means of supporting these reforms, the dramatic fall in oil and gas prices presents an opportunity to cut subsidies without
IEA.
All
right
s res
erve
d

Chapter 2 | Evaluation of possible recovery measures 91
2
increasing end-use prices. The drop in oil and gas prices may also offer the opportunity for all countries to introduce or strengthen effective or real carbon prices (see Chapter 3).
Figure 2.30 ⊳ Net income from oil and gas production and fossil fuel consumption subsidies, 2015-2020
If there are no changes in pricing regimes, fossil fuel subsidies will fall by around $140 billion in 2020, but net income from oil and gas will fall by nearly $800 billion.
Notes: 2020e = estimated values for 2020. Net income is total revenue from oil and gas sales minus finding, development and operating costs, and domestic fossil fuel subsidies. Figures for 2020 based on an oil price of $30/barrel for 2020 and no changes in end-user pricing. Includes data for 41 countries with fossil fuel subsidy regimes.
Selected policy approaches
While there may be fiscal pressure to enact reforms to fossil fuel pricing regimes, there are also social and political sensitivities, not least the need to tackle energy poverty and keep energy affordable, especially in periods of crisis. National circumstances mean that there is no single path to follow when reforming inefficient fossil fuel subsidies, but governments may consider to:
Aim to ensure that prices reflect the full economic cost of the energy that is being supplied, and that pricing systems are transparent, well-monitored and enforced.
Introduce reforms in stages to avoid any abrupt or large price rises that may be difficult for some parts of the population to absorb.
Implement parallel reforms to protect vulnerable groups. For example, there might be a strong case for targeting conditional cash transfers to those who lack reliable access to clean cooking fuels and electricity (see section 2.4.3).
Accompany reforms with a comprehensive communication strategy that persuades citizens of the need for reform and that it is being implemented in a just manner.
500
1 000
1 500
2015 2016 2017 2018 2019 2020e
Billi
on d
olla
rs Net incomeafter subsidies
Consumptionsubsidies
IEA.
All
right
s res
erve
d

92 World Energy Outlook 2020 | Special Report
Economic implications
Many existing subsidies disproportionally benefit wealthier segments of the population that use more of the subsidised fuel. Such untargeted subsidy policies encourage wasteful consumption and increase pressure on budgets that in many cases are already under strain from dealing with the immediate health and economic crises. Phasing out fossil fuel subsidies would create new budget space and remove economic distortions thereby facilitating spending to flow to more productive uses and boost long-term economic growth. Many of the world’s key producer economies also have abundant wind and solar resources and removing inefficient fossil fuel subsidies would create a more level playing field for these energy sources.
Implications for emissions and resilience
If we assume that fossil fuel subsidies are fully phased out by 2030 in all regions except the Middle East (where the average subsidisation rate is reduced to around 25% by 2030 compared with around 55% today), then global CO2 emissions in 2030 would be around 700 Mt lower than they would have been otherwise (Figure 2.31). That could lead to even greater emissions savings if some of the financial savings are directed towards other efficiency and low-carbon measures.
Figure 2.31 ⊳ Emissions savings in 2030 from a gradual phase-out of fossil fuel consumption subsidies by region
Emissions would be around 700 Mt lower in 2030 with a phase-out of fossil fuel subsidies.
For exporting countries with large subsidy regimes, economic diversification into non-oil economic activities would improve their economic and social resilience. Given the importance of these countries to global oil and production, such diversification might also reduce commodity price volatility and aid the overall resilience of global energy markets. For importing countries, reducing fossil fuel subsidies would reduce domestic consumption
50
100
150
200
250
300
Middle East Africa Asia Latin America Eurasia andUkraine
Mt C
O₂
IEA.
All
right
s res
erve
d
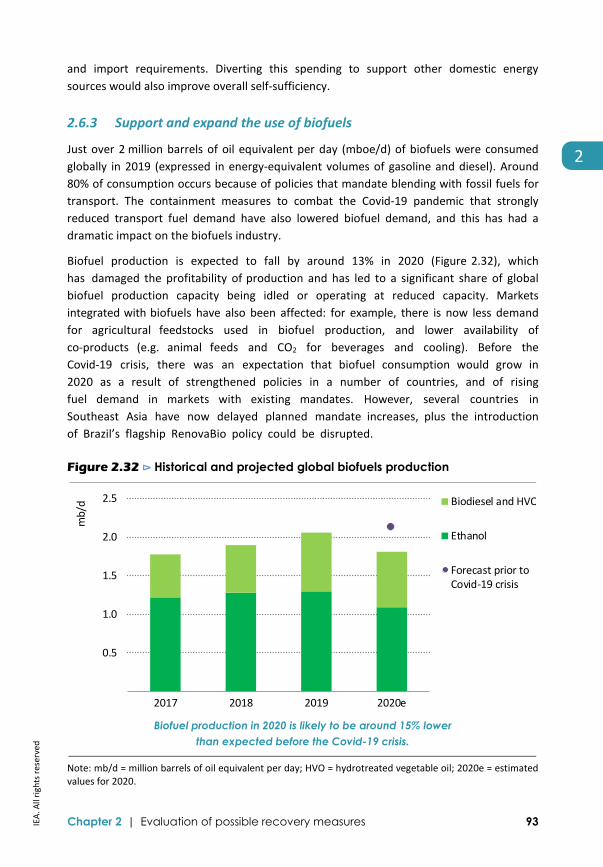
Chapter 2 | Evaluation of possible recovery measures 93
2
and import requirements. Diverting this spending to support other domestic energy sources would also improve overall self-sufficiency.
2.6.3 Support and expand the use of biofuels
Just over 2 million barrels of oil equivalent per day (mboe/d) of biofuels were consumed globally in 2019 (expressed in energy-equivalent volumes of gasoline and diesel). Around 80% of consumption occurs because of policies that mandate blending with fossil fuels for transport. The containment measures to combat the Covid-19 pandemic that strongly reduced transport fuel demand have also lowered biofuel demand, and this has had a dramatic impact on the biofuels industry.
Biofuel production is expected to fall by around 13% in 2020 (Figure 2.32), which has damaged the profitability of production and has led to a significant share of global biofuel production capacity being idled or operating at reduced capacity. Markets integrated with biofuels have also been affected: for example, there is now less demand for agricultural feedstocks used in biofuel production, and lower availability of co-products (e.g. animal feeds and CO2 for beverages and cooling). Before the Covid-19 crisis, there was an expectation that biofuel consumption would grow in 2020 as a result of strengthened policies in a number of countries, and of rising fuel demand in markets with existing mandates. However, several countries in Southeast Asia have now delayed planned mandate increases, plus the introduction of Brazil’s flagship RenovaBio policy could be disrupted.
Figure 2.32 ⊳ Historical and projected global biofuels production
Biofuel production in 2020 is likely to be around 15% lower than expected before the Covid-19 crisis.
Note: mb/d = million barrels of oil equivalent per day; HVO = hydrotreated vegetable oil; 2020e = estimated values for 2020.
0.5
1.0
1.5
2.0
2.5
2017 2018 2019 2020e
mb/
d Biodiesel and HVO
Ethanol
Forecast prior toCovid-19 crisis
IEA.
All
right
s res
erve
d

94 World Energy Outlook 2020 | Special Report
Selected policy approaches
New policies and a targeted support could help stabilise the biofuel industry and create a large number of new jobs in a short period of time. Blending shares could be raised in regions that are not yet at the technical limits of fuel blending in road transport, and support provided for fuels that are not subject to blending limits or that can be used in long-distance transport.11 Specific policies to support the biofuel industry, which should be closely linked to meeting appropriate sustainability criteria, include:
Change fuel tax regimes to boost the consumption of biofuel blends and markets for“drop-in” fuels (which can be used unblended or at high blend shares withoutmodifications to engines) and flex-fuel vehicles.
Extend programmes to supply biofuels at service stations.
Implement financial de-risking measures to modernise production facilities andconstruct new plants that produce biofuels from low-carbon wastes and residues.
Mobilise programmes for the collection and supply of sustainable waste and residuefeedstocks for hydrotreated vegetable oil (HVO).
Economic implications
Biofuels production is one of the most labour-intensive energy industries. The liquid biofuel industry employed around 2.1 million people in 2018 (IRENA, 2019), and was the second-largest source of renewable energy jobs after solar PV. Around $2.5 billion was invested in liquid biofuels in 2019, less than 20% of levels seen ten years ago. Job creation and production has grown despite this drop, in part because of increasing production in countries with labour-intensive agriculture. The number of people employed in the sector increased by around 40% between 2013 and 2018, while biofuel production increased by around 25%. In recent years, we estimate that around 15-30 jobs were created for every million dollars of investment.
Ethanol accounts for around 70% of total biofuel consumption today (by volume). In the United States, the world’s largest global producer, around 45% of employment is in agricultural activity to produce feedstock, 30% is in production facilities, and the remainder is in professional services and trade. In countries with less mechanised agriculture, the share of jobs in feedstock production is much higher.
Planting, harvesting and logistics jobs are seasonal in nature, and can be informal in many developing countries. Large-scale biofuel production facilities take around two to three years to build, requiring a large number of construction workers. Once commissioned, there are skilled permanent technical and professional staff associated with O&M and the logistics of fuel supply. Building a more extensive advanced biofuel industry would require
11 Bioethanol and biodiesel are generally blended with gasoline and diesel up to volumes of less than 10%, although there are some instances of blending of up to 30%.
IEA.
All
right
s res
erve
d

Chapter 2 | Evaluation of possible recovery measures 95
2
highly skilled research and development personnel as well as specialised roles to collect and pre-treat the waste and residue feedstocks that are used.12
Implications for emissions and resilience
A key benefit of biofuels is that they can reduce emissions compared with the use of oil products. Biofuels will be particularly critical to lowering emissions from transport modes where it is technically challenging to use low-carbon electricity such as heavy-duty vehicles, aviation and shipping.
The choice of feedstock and source of process energy used significantly affects the overall emissions reduction potential of biofuels. CO2 emissions from ethanol are between 30-70% lower than gasoline.13 In the United States and Brazil (which account for around 80% of global production), ethanol production has an abatement cost of $20-120/tCO2 for crude oil prices ranging from $30-60/barrel.
There is growing interest in the use of alternative feedstocks that can avoid the potential sustainability concerns associated with some conventional biofuels. Use of waste and residue feedstocks can also provide deeper emission reductions of around 80-90% compared with fossil fuels for transport. However the maturity of these technologies varies. Producing biodiesel and HVO from lipid feedstocks is a mature technology,14 and has an abatement cost of $150-250/tCO2 (for crude oil prices from $30-60/barrel). Other technologies, such as converting solid waste and residue biomass feedstocks into liquid biofuels, are not yet widely commercialised, although some plants do exist.
Support for conventional biofuels is strong in oil importing countries and regions where agriculture is an important contributor to GDP, as is the case in many countries in developing Asia. Biofuel blending can offset a share of import demand and therefore enhance security of supply, while also supporting demand for nationally important agricultural commodities and the associated jobs.
There are a number of additional co-benefits of developing bioenergy industries. Sustainable bioenergy can provide employment and income for rural communities, and health benefits from reduced air pollution and proper waste management. It can also promote sustainable forest and agricultural management and improve resource efficiency.
12 Advanced biofuels are produced from non-food crop feedstocks, result in significantly fewer GHG emissions than fossil fuels, do not compete with food for agricultural land, and do not adversely affect sustainability. 13 These figures exclude emissions from land-use change over which there is a large level of uncertainty. Including land-use change emissions would mean that bioethanol would reduce emissions by around 15-70% compared with gasoline. 14 Lipid feedstocks include waste and residue fats, oils and greases.
IEA.
All
right
s res
erve
d

96 World Energy Outlook 2020 | Special Report
2.7 Strategic opportunities in technology innovation
The lag time involved in bringing technologies to market mean that clean energy technology innovation remains a near-term priority to achieve longer term sustainability targets. Without innovation, the transition to modern, clean and resilient energy systems would be at risk. Governments have a major role to play in supporting innovation, especially in areas that the private sector perceives as being too risky. Clean energy technology innovation matters in the recovery from the Covid-19 pandemic and its economic aftermath because it can help with:
Energy resilience and security of supply: For governments, a broader technology portfolio is a means to build domestic resilience by diversifying the energy mix and energy supply chains. For energy industries, energy technology innovation is a means to diversify portfolios and anticipate changes in energy markets.
Future competitiveness: Innovation can help industries come out of the Covid-19 crisis better positioned to supply future domestic and international markets.
Emissions reductions: In sectors where few scalable decarbonisation options currently exist, such as heavy industry and long-distance transport, technology innovation has a vital role to play in helping to ensure that new clean energy technologies help countries reach emissions reduction goals.
Figure 2.33 ⊳ Global average jobs created per million dollars of capital spending for emerging technologies
Manufacturing of emerging technologies is not a near-term job engine, but employment effects can ripple through the supply chain and be future growth areas.
In this section, we examine four specific technology areas at different levels of maturity that could be important elements of a future technology portfolio and that require support in different ways: hydrogen technologies, which have a potentially important role in a wide
2
4
6
8
10
12
Hydrogen Batteries CCUS
Jobs
per
mill
ion
dolla
rs
IEA.
All
right
s res
erve
d

Chapter 2 | Evaluation of possible recovery measures 97
2
range of sectors; batteries, which are very important for electrification of road transport and the integration of renewables in power markets; small modular nuclear reactors, which have technology attributes that make them scalable as an important low-carbon option in the power sector; and carbon capture, utilisation and storage (CCUS), which could play a critical role in the energy sector reaching net-zero emissions. We also compare the near-term job creation potential of some of these measures (Figure 2.33).
Clean energy technology innovation is a complex and important topic, and it goes much wider than the question of support for specific technology areas. The IEA is preparing an Energy Technology Perspectives Special Report on Clean Energy Technology Innovation, which will be released in early July 2020. This report will examine in detail the ways in which governments can shape and support a broad research development and demonstration agenda in pursuit of the long-term decarbonisation of the energy sector.
2.7.1 Hydrogen technologies
Hydrogen is a versatile energy carrier that can be produced from fossil and low-carbon sources. A future more resilient energy sector could make use of clean hydrogen in industrial applications (such as iron and steel production or in the fertiliser industry), transport (directly in road vehicles such as trucks and cars, or as synthetic fuels in airplanes and ships) and buildings (for heating). It could also be used to store electricity over weeks or months. If hydrogen use is to become widespread, it needs targeted support for low-carbon production, and for efforts to stimulate hydrogen demand in sectors where the near-term opportunities are largest.
Most hydrogen production today takes place in industrial hubs such as ports using natural gas and coal as an input. Some industries are looking to adopt CCUS to reduce emissions from production: there are also a number of planned projects for hydrogen electrolysers which would produce hydrogen from decarbonised electricity. If these projects were to be completed, global electrolyser capacity would rise from 170 megawatts (MW) in 2019 to 730 MW in 2021. The Covid-19 crisis may put some of these plans at risk, although no project cancellations have yet been reported.
In the transport sector, current sales of hydrogen fuel cell vehicles are low and have been hit hard by the crisis: in the United States, sales fell by 65% year-on-year during January to April 2020; in China, they fell by 7% over January to March. In industry, the main near-term opportunities for growth come from the scope to blend hydrogen into commercial steel-producing assets and to use clean hydrogen in place of fossil fuel hydrogen in the production chemicals such as ammonia and methanol. A pilot for steel production with clean hydrogen is currently under construction. While pilots are at risk of being delayed due to the Covid-19 crisis, no delays have yet been announced.
IEA.
All
right
s res
erve
d

98 World Energy Outlook 2020 | Special Report
Selected policy approaches
Support for electrolyser manufacturing can usefully be paired with support for fuel cells and battery manufacturing, which use the same principles of electrochemistry as electrolysers and have several similar components. Support for the use of CCUS with existing fossil fuel-based hydrogen production would be best focused on industrial hubs to maximise synergies with the use of CO2 pipelines and related infrastructure. The opportunities for clean hydrogen production would be bolstered by support for new hydrogen demand through blending clean hydrogen into natural gas grids and support for increased use of hydrogen in transport, industry and buildings. Specific support measures for hydrogen might include:
Support for developing or expanding electrolyser manufacturing capacity through low-interest loans and blended finance for factories.
Support for clean hydrogen production through targets and quotas.
Maintain and reinforce market pull instruments for hydrogen end-use technologies and related infrastructure (e.g. hydrogen refuelling stations).
Introduce clear and quantifiable targets for the use of clean hydrogen in existing infrastructure (e.g. hydrogen blending in gas networks and for steel production).
Provide funding for research into fuel cell efficiency, and electrolyser efficiency and flexibility, together with funding for large electrolyser demonstration plants.
Economic and other implications
A readily available way to create new demand for clean hydrogen is to require its blending in natural gas pipelines. This would create predictable demand for clean hydrogen while reducing the emissions intensity of natural gas supplies. If hydrogen were blended into all natural gas use in the European Union at 5% (by volume), clean hydrogen demand would be boosted by 2.5 Mt per year. If this were supplied by electrolysers, then it would require almost 25 GW of relevant capacity. Electrolysers could also be used to provide clean hydrogen in industrial clusters, such as at ports. This would create jobs and provide measurable benefits throughout the industrial value chain. Other support to increase hydrogen demand in transport and other sectors could also have positive economic effects and create jobs, including in the development and maintenance of related infrastructure.
2.7.2 Batteries
The pace of battery manufacturing capacity growth has been rapid in recent years and there is enormous potential for batteries in an increasing number of sectors, including the power and road transport sectors. The cost of lithium-ion batteries, widely used in consumer electronics, has declined sharply in recent years. In 2019, sales-weighted electric car battery pack prices reached an average price of $160 per kilowatt-hour (kWh), down from more than $1 100/kWh in 2010 (BNEF, 2019). Governments in many countries have
IEA.
All
right
s res
erve
d

Chapter 2 | Evaluation of possible recovery measures 99
2
contributed to this progress through policies encouraging electric car sales, therefore indirectly stimulating innovation in battery manufacturing processes and performance.
Although the power sector now offers increasing opportunities for the use of batteries to support intra-day changes in demand and to help the integration of variable renewables, the current focus of battery manufacturing capacity for the energy sector is on electric cars. At present there is capacity to produce around 320 GWh of batteries globally each year. China is the world leader, accounting for around 70% of global capacity, followed by the United States (13%), Korea (7%), Europe (4%) and Japan (3%). In China, the outbreak of Covid-19 has affected battery production hubs in Hubei, Hunan and Guangdong; manufacturing has only resumed gradually.
Selected policy approaches
If existing announced targets for electric vehicle production by car manufacturers were to be met, around 1 000 GWh of battery manufacturing capacity would be needed by 2025 to supply electric cars alone. Announced targets by a number of leading battery manufacturers would provide around 2 100 GWh annual battery manufacturing capacity in 2030, but additional battery manufacturing capacity is nevertheless likely to be required to supply the growing demands of the power sector. Deployment of utility-scale battery storage systems is rapidly expanding, with an increasing number of auction schemes awarding long-term contracts for battery storage.
Public support for battery manufacturing would be bolstered if it were to be co-ordinated with plans for transport and power sectors to ensure a business case for batteries and to share lessons from experience in the manufacturing, use, recycling and repurposing of batteries. Specific support measures for battery manufacturing might include:
Support the expansion of battery manufacturing capacity and infrastructure for the collection, recycling and repurposing of batteries at the end of their lives through low-interest loans and blended finance.
Provide targeted support for battery demand to build industry confidence, for example by incentivising the roll-out of electric vehicles in the transport sector.
Provide RD&D funding for sustainable battery technologies, advances in battery chemistry and control systems to improve energy and power density as well as lifespan.
Economic and other implications
Batteries are set to play a crucial role in a wide range of sectors, with major implications for economic performance as well as for clean energy transitions. The development of local battery manufacturing capacity could also boost jobs in electric vehicle manufacturing and in the provision of support to energy storage systems.
IEA.
All
right
s res
erve
d

100 World Energy Outlook 2020 | Special Report
2.7.3 Small modular nuclear reactors
Difficulties in financing the construction of large-scale nuclear reactors are driving interest in small modular nuclear reactors (SMRs). SMRs are generally defined as nuclear reactors with an electrical capacity of less than 300 MW per module, which are built in a factory and then transported to the generation site. Several different types of SMRs are under development: light water-cooled SMR designs have achieved the highest technology and licensing readiness levels with several concepts under construction or advanced in the licensing process. The development of liquid metal-cooled SMRs, molten salt-cooled and gas-cooled SMR designs are less advanced. SMR designs are under development in countries such as Canada, China, Russia and the United States, although none has yet reached commercial maturity.
SMRs offer the possibility of providing low-carbon nuclear power with lower initial capital investment and better scalability than traditional larger reactors, and with the ability to use sites that would be unable to accommodate traditional large reactors. Construction lead-times are also expected to be much shorter as a result of factory manufacturing and the use of advanced modular construction techniques.
SMRs could help provide flexibility in countries with large electricity grids, or be used in countries or regions with small electricity grids that would not be appropriate for large baseload nuclear power plants. Given their lower expected costs, they may also be attractive to countries with no experience with nuclear power, especially those with small and less robust electricity grids. In some cases, notably where there are grid stability and reliability concerns, SMRs may be the only technically feasible nuclear technology option available.
Selected policy approaches
Support for SMRs would need to take due account of the general principles of low-carbon electricity market design with innovation policy support to facilitate early deployment. Examples of specific policy measures that could be employed include:
Provide investment support for pilot projects such as capital grants, loan guarantees and tailor-made long-term contracts.
Foster cost-sharing agreements for international collaboration, shared RD&D programmes, and national and international licensing frameworks.
Support regulatory authorities to accelerate the resolution of concerns on the validation of innovative safety features and factory assembly.
Economic and other implications
SMRs have the potential to provide an alternative pathway for the development of nuclear power, and could provide a large number of jobs in design, manufacturing, supply and construction activities. However, the prospects for SMRs will depend to a large extent on the successful deployment of prototypes and first-of-a-kind plants (NEA and OECD, 2016). An important goal is to establish standardised designs which would allow the development of value chains and accelerate economies of scale, learning and cost reductions.
IEA.
All
right
s res
erve
d
Chapter 2 | Evaluation of possible recovery measures 101
2
2.7.4 Carbon capture, utilisation and storage
Carbon capture, utilisation and storage technologies have an important role to play in the development of sustainable and resilient energy systems. They have the potential to support deep emissions cuts from existing power and industrial facilities and underpin energy transition pathways, for example by facilitating clean hydrogen production. Captured CO2 (from fossil or bioenergy sources) could be used as a feedstock for low-emission fuels, chemicals and building materials, while combining CO2 storage with bioenergy or direct air capture could provide the foundation for carbon removal or negative emissions.
The range of technologies and applications associated with CCUS presents significant and varied opportunities for innovation. Some CCUS elements are commercially mature: CO2 capture (via chemical absorption and physical separation) has been applied in industry for decades while the practice of injecting CO2 for enhanced oil recovery (CO2-EOR) dates back to the 1970s. Other CCUS applications, including cement and steel production, are at an earlier stage of development, as are technologies to convert CO2 into products such as chemicals and fuels. These less advanced applications will benefit from continued innovation and scaled demonstration to reduce costs and refine technologies.
There are 21 facilities today that capture CO2 in large volumes (between 0.6-8 Mt CO2 per facility per year); these either store the CO2 in dedicated geological formations or use the CO2 for EOR. Most of these facilities take CO2 from relatively high purity CO2 sources, such as natural gas processing or hydrogen production. There are two large-scale facilities that capture CO2 from coal-fired power generation and one that applies CCUS in steel production.
Recent interest in CCUS has been concentrated in the United States and Europe, where around 25 projects are in various stages of development. Plans for new facilities have been announced in the Middle East and Australia. As with other clean energy investments, these plans are subject to increased uncertainty and potential delays as a result of the Covid-19 related economic downturn. Almost all will rely on some form of policy support or incentive to move ahead, including access to the expanded “45Q” tax credits in the United States (which provide $50 /tCO2 for dedicated storage or $35 /tCO2 for EOR) and to programmes such as the European Innovation Fund.
Selected policy approaches
Support for CCUS following the 2008 global financial crisis was behind the successful commissioning of several projects in operation today. This includes the world’s first application of CCUS to bioethanol production at the Illinois Industrial CCUS project, the Petra Nova coal-fired power plant in Texas, the Quest facility capturing CO2 from hydrogen production in Canada, and the Alberta Carbon Trunk Line, which began operations in June 2020.
IEA.
All
right
s res
erve
d

102 World Energy Outlook 2020 | Special Report
CCUS facilities are typically large infrastructure investments with multi-year planning and construction schedules. Lower cost and less complex industrial CCUS applications, including retrofits of existing facilities, allow for faster deployment, alongside investment in shared CO2 transport and storage infrastructure.
Examples of policy measures to support CCUS deployment and innovation include:
Invest in shared CO2 transport and storage infrastructure, for example through public-private partnerships or a regulated asset base model, to reduce early integration risks for CCUS facilities.
Target capital and operational support in the form of grants, tax credits, feed-in-tariffs or contracts-for-difference for early commercial deployment. These measures could be complemented by carbon pricing or emissions standards.
Boost public procurement of low-carbon products, including building materials, chemicals or fuel, to provide a market signal for CCUS investment (including CO2 use). Such measures would need to be underpinned by rigorous lifecycle analysis and accounting to verify emissions reductions.
Support RD&D to reduce the cost of capture technologies and to scale-up demonstration of key applications, including steel and cement production with CCUS.
Economic and other implications
CCUS infrastructure is capital intensive with job creation concentrated in the construction phase. For example, the CCUS retrofit of the Boundary Dam coal plant in Canada involved 1 700 workers during construction (Townsend, Raji and Zapantis, 2020), while the planned Norwegian Full-Chain industrial CCS project will create around 4 000 jobs during development and construction, and around 170 O&M jobs (Northern Lights PCI, 2020).
CCUS investment would support job retention in key sectors and regions, including at existing industrial or power facilities, as well as job creation associated with equipment and technology production. Many of the job opportunities in CCUS will rely on the subsurface skills and experience currently available in the oil and gas sector. These include near-term employment needs associated with CO2 storage exploration, as well the more intensive phase of characterisation and development of new storage facilities.
CCUS offers a potential economic opportunity for oil- and gas-producing nations to play a leading role in the technology’s development and deployment. Using CO2 for EOR can boost oil production from existing assets as well as reduce overall emission intensity and avoid the need for new production infrastructure. Depleted oil and gas reservoirs also provide one of the lowest cost CO2 storage options, which could be a valuable resource in a future where hundreds of millions of tonnes of CO2 will need to be stored. The availability of low-cost natural gas and CO2 storage could also provide a comparative advantage in the production of clean hydrogen.
IEA.
All
right
s res
erve
d

Chapter 3 | A sustainable recovery plan for the energy sector 103
Chapter 3
A sustainable recovery plan for the energy sector
• We have designed a global sustainable recovery plan for the energy sector which hasthree goals: to maintain and create jobs, boost economic growth, and improveenergy sustainability and resilience. This plan, which is specific, detailed and time-limited, was developed using the quantitative assessments of potential energysector measures in Chapter 2. It takes account of the circumstances of individualcountries, as well as existing energy project pipelines and current market conditions.
• We estimate that the overall spending need for the plan is around $1 trillion peryear over the next three years: this represents about 0.7% of global GDP today, andincludes both public spending and private finance that would be mobilised by publicpolicies. The public spending required would be equivalent to less than 10% of fiscalexpenditure in recovery plans announced to date; after the 2008-09 financial crisis,green measures accounted for around 16% of total stimulus measures.
• Our modelling indicates that this plan would create nearly 9 million new energy-related jobs in construction and manufacturing over the next three years: thiscompares with a figure of 6 million jobs at risk from the Covid-19 crisis in energysupply, efficiency and vehicles. There would also be more than 0.5 millionpermanent jobs associated with operating and maintaining the assets constructedby the sustainable recovery plan.
• Analysis done jointly with the International Monetary Fund indicates that this planwould also increase global GDP by 1.1% in each of the next three years, and wouldlead to global GDP being 3.5% higher in 2023 that it would have been without aspending stimulus.
• A wide range of policies would be required to support the deployment of this planwith the aim of delivering shovel-ready clean energy projects that boost resilience;developing a strong pipeline of new projects; tailoring support for distressedindustries; mobilising large levels of private finance; and strengthening internationalco-operation.
• Energy systems would become more sustainable as a result of the plan. Globally,annual energy-related CO2 emissions would be nearly 3.5 Gt lower than they wouldhave been otherwise, and methane emissions would be cut by 0.8 Gt CO2-eq. Airpollutant emissions would be around 5% lower. In addition, around 420 millionpeople would gain access to clean cooking solutions in low-income countries, andnearly 270 million people would gain access to electricity.
• Energy systems would also become more resilient as a result of the plan. Investmentin better electricity grids and improved efficiency would improve electricity securityby lessening the risks of outages, boosting flexibility, reducing losses and helping tointegrate larger shares of variable renewables. Energy consumer bills would also belower across all regions, freeing resources for spending in other sectors.
S U M M A R Y
IEA.
All
right
s res
erve
d
104 World Energy Outlook 2020 | Special Report
3.1 Introduction
The enormity of the shock caused by the Covid-19 pandemic is prompting governments around the world to develop economic recovery plans that will shape infrastructure and industries for decades. There is a very strong case for the energy sector to play a central part in these plans:
The Covid-19 crisis has highlighted the importance of developing more resilient andsustainable energy systems that are capable of withstanding future shocks andimproving the health and well-being of citizens; but the disruptions occurring toenergy markets and investment trends has made this more difficult to achieve.
Investment in the energy sector can provide jobs and boost growth, whilestrengthening the resilience of energy systems and making energy more affordable,thereby supporting broad economic activity and jobs in all parts of the economy.Improved energy sector resilience and reliability would greatly reduce economic lossesand lost labour hours. Investment in energy is also needed to develop moresustainable systems, speed up clean energy transitions and reduce emissions in pursuitof the goals of the Paris Agreement and the UN Sustainable Development Agenda.A rebound in emissions as the global economy emerges from this crisis is very likelyunless action is taken to place clean energy transitions at the heart of economicrecovery.
Chapter 2 examined a range of measures, assessing their potential to create jobs and stimulate growth and their likely impact on energy security, emissions and air pollution. This chapter sets out a sustainable recovery plan for the energy sector based on these assessments and on countries’ specific circumstances. It is for governments to make their own decisions about what measures to adopt and how much to spend, but action on the basis of the measures in the plan would provide a major boost to the global economy, create millions of new jobs, and ensure that the recovery yields long-lasting benefits for energy sustainability and resilience.
3.2 Objectives and design of a sustainable recovery plan for energy
3.2.1 Goals of a global sustainable recovery plan for energy
In drawing up a sustainable recovery plan for energy, we have focused on three overarching objectives: to create jobs, to boost economic growth, and to improve resilience and sustainability. While some measures could contribute to all three objectives, there are inevitably some trade-offs. Taking into account country-specific circumstances and the world’s shared goals on sustainability, we have developed a practical, concrete and time-limited global sustainable recovery plan for the energy sector that would collectively deliver on all three objectives (Figure 3.1).
IEA.
All
right
s res
erve
d

Chapter 3 | A sustainable recovery plan for the energy sector 105
3
Figure 3.1 ⊳ Integrated goals of a sustainable recovery plan for the energy sector
The sustainable recovery plan provides an integrated approach to support jobs and boost the economy while improving the sustainability and resilience of energy sectors.
3.2.2 Sustainable recovery plan measures
Evaluation of measures
In evaluating the measures discussed in Chapter 2 in the context of the three objectives of the sustainable recovery plan, we have considered in particular:
Timeliness: Some measures can provide an immediate boost to jobs, either becausethey are relatively small-scale and do not require protracted planning processes orbecause they have already gone through these processes (projects of this kind areoften described as “shovel-ready”).
Near-term employment effects: The larger the number of jobs per unit of spending,the greater the immediate impact on employment and growth. This is assessed inTable 3.1 on the basis of the jobs multipliers discussed in Chapter 2 that indicate thenumber of jobs created per million US dollars of investment or spending.
Provision of jobs for displaced workers: Some measures would create jobs for workerswho were made redundant as a result of the Covid-19 crisis or who work in sectorswhere further job losses are likely. Some measures would also provide employmentrequiring similar skills to those used in jobs that have disappeared, minimising theneed for retraining.
IEA.
All
right
s res
erve
d

106 World Energy Outlook 2020 | Special Report
Long-term benefits: While a focus on near-term factors is central to the sustainablerecovery plan, some measures would support long-term economic growth andsignificantly improve energy system resilience and sustainability. This includes, forexample, measures that would expand energy access, reduce energy poverty andreduce carbon dioxide (CO2) emissions.
Current cost effectiveness of emissions reductions: Some measures provide muchlarger emissions reductions per unit of spending than others. This is assessed inTable 3.1 on the basis of the relative net present value of the costs and savings dividedby the CO2 emissions avoided over the lifetime of each measure.
There are certainly trade-offs between these factors. For example, there are some measures that would provide very cost-effective emission reductions but would not provide a major boost to jobs (Figure 3.2). Table 3.1 provides an overall assessment of how the measures compare. It is important to note, however, that the assessment of measures may vary from one country to another. For example, new gas-fired power capacity might lead to emission reductions in countries where it replaces coal, but might “lock-in” a higher level of emissions in countries that do not currently rely heavily on coal-fired power plants.
Figure 3.2 ⊳ Global average jobs created and cost effectiveness of emissions reductions for selected energy sector measures
Efficiency measures create a large number of jobs per unit of investment and many have negative abatement costs, yet there are trade-offs for some other measures.
Note: tCO2 = tonnes of carbon dioxide; PV = photovoltaic.
- 50
- 40
- 30
- 20
- 10
0
10
20
30
40
0 5 10 15
Dol
lars
per
tCO
₂
Jobs per million dollars
Electricity Buildings Transport Industry Fuels
Onshore and offshore wind
Industry efficiencyNuclear lifetime extension
Solar PV
Appliance efficiency
New efficient cars
Building efficiency
New electric cars
Hydro lifetime extension
Reduce oil and gas methane emissions
IEA.
All
right
s res
erve
d

Chapter 3 | A sustainable recovery plan for the energy sector 107
3
Table 3.1 ⊳ Assessment of measures for the sustainable recovery plan
Creates jobs
Boosts the economy
Improves energy sustainability and resilience
Timeliness Near-term
employment effects*
Provision of jobs for displaced workers
Long-term benefits
Current cost effectiveness of emissions reductions*
Electricity
Expand and modernise grids
Wind and solar PV Lifetime extensions of nuclear and hydro power
New unabated gas
New unabated coal
Transport New electric and high efficiency cars
High-speed rail
Urban infrastructure
Buildings Retrofits and more efficient new buildings
Appliance efficiency
Clean cooking
Fuels Reduce methane from oil and gas operations Reform inefficient fossil fuel subsidies
Biofuels
Industry
Efficiency
Material efficiency
Innovation
Hydrogen
Batteries
CCUS
SMRs
Good match Neutral match Poor match
*Based on relative levels of jobs created per unit of spending and dollars per tCO2-eq avoided.
Notes: PV = photovoltaic; CCUS = carbon capture, utilisation and storage; SMRs = small modular nuclear reactors, tCO2-eq = tonnes of carbon-dioxide equivalent. Suitability of the various measures will vary across different regions; levels shown provide a global perspective.
IEA.
All
right
s res
erve
d

108 World Energy Outlook 2020 | Special Report
Spending on measures
The spending associated with this plan is around $1 trillion for each of the next three years (i.e. from 2021 to 2023). This amounts to around 0.7% of global gross domestic product (GDP) in each year. This figure is based on the difference between spending on clean energy technologies in recent years and the spending needed to deliver the measures in the plan, taking account of current project pipelines, market conditions and the varying circumstances of countries. This spending would be additional to the annual levels of expenditure on clean energy measures that have occurred in recent years and includes both public spending and private finance that would be mobilised by public policies (section 3.2.3).
The plan envisages expenditure across six sectors:
Electricity measures would cover:
Support for electricity networks to strengthen resilience. They would help operatorsintegrate higher shares of variable renewables and could lead to a long-term reductionin consumer bills. In developing economies, investment in grids and off-grid solutionswould increase network reliability, reduce electricity losses and bring access to peoplewho currently lack it. Nearly $110 billion would be spent in each of the three years ongrid infrastructure and for investment in smart grids, the majority of which is spent onupgrades, modernisation and refurbishment.
Accelerated wind and solar PV deployment. These are two of the power technologiesthat most merit government support in many countries, given their short constructiontimes, declining costs, and, for solar PV, the large numbers of jobs it can create.Around $180 billion would be spent each year globally on new wind and solar PVprojects and projects to repower existing sites.
Modernising and upgrading existing nuclear and hydropower plants in countrieswhere licensing and approvals processes are in place. In countries where sitepermitting is already well advanced, new hydro and nuclear power plants would bringjobs and reduce emissions from power generation if displacing fossil fuel plants.Around $20 billion would be spent each year to support continued generation fromexisting and new hydroelectricity power plants. Around $15 billion would be spenteach year to support lifetime extensions of existing plants and build new nuclearpower plants.
Buildings measures can quickly create a large number of new local jobs, often with low or negative CO2 abatement costs. They can help to ensure that new buildings are constructed as efficiently as possible, and that existing buildings are made more efficient by insulating, air sealing, replacing inefficient appliances and installing heat pumps and renewable energy systems that use solar water heaters and biomass boilers. Around $250 billion would be spent on buildings measures each year (Figure 3.3).
IEA.
All
right
s res
erve
d

Chapter 3 | A sustainable recovery plan for the energy sector 109
3
Figure 3.3 ⊳ Average annual spending by sector and measure (billion dollars)
Nearly $1 trillion would be spent annually on clean, modern energy technologies for the next three years as part of the sustainable recovery plan.
Note: CCUS = carbon capture, utilisation and storage; SMRs = small modular nuclear reactors.
The transport sector was severely affected by the Covid-19 lockdowns across most countries. Governments could support jobs while also reshaping transport systems to be more modern and resilient while reducing air pollution and greenhouse gas (GHG) emissions. Around $150 billion would be spent each year on purchases of more efficient cars and electric vehicles (including electric cars, two/three wheelers, buses and light commercial vehicles).1 Nearly $90 billion would be spent each year on long-distance transport to boost high-speed rail and to improve the efficiency of trucks, airplanes and ships. A further $30 billion would be spent each year to accelerate deployment of recharging networks for electric vehicles, upgrade public transport, and improve walking and cycling infrastructure.
Industry measures offer considerable scope to improve efficiency, and by doing so to improve resilience and reduce emissions. Around $70 billion would be spent each year to improve the efficiency of existing industrial facilities through the deployment of improved electric motors, heat pumps and agricultural irrigation pumps, and wider implementation
1 Incentives for efficient and electric cars would likely encourage some consumers to change planned car purchases and some consumers to make new car purchases. In the former case, only the additional cost of the more efficient or electric car (compared with an inefficient equivalent) is included in the spending, in the latter case the full cost of the new car is included.
50 100 150 200
Wind and solar PVNetworks
Nuclear and hydro
Buildings efficiencyEnd-use renewables
AppliancesClean cooking
New electric vehiclesLong-distance transport
New efficient carsUrban infrastructure
Industry energy efficiencyMaterial efficiency
BiofuelsMethane reductions
Batteries, hydrogen, CCUS and SMRs
Electricity Buildings Transport Industry Fuels InnovationBillion dollars (2019)
IEA.
All
right
s res
erve
d

110 World Energy Outlook 2020 | Special Report
of energy management systems. An additional $10 billion would be spent each year to improve waste management and material efficiency.
Measures for fuels would cover:
Support for biofuel industries if they meet appropriate sustainability criteria. Biofuelindustries are important employers of both low and high skilled workers in manycountries that have been severely impacted by the slowdown in demand for liquidfuels. Around $20 billion would be spent on biofuels in each year of the sustainablerecovery plan.
Support for the upstream oil and gas sector could be focused on reducing methaneemissions. This would provide a new source of employment for oil and gas workersmade redundant by the crisis and would be a cost-efficient way to bring about animmediate reduction in GHG emissions. Any wider support for the upstream sectorwould need to take into account the investment levels needed to meet future oil andgas demand.
Support for innovation and the development of new technologies is unlikely to create a large increase in jobs or economic activity in the short term. In the longer term, however, targeted support to develop and deploy emerging clean energy technologies and boost the skills base of domestic workers could bring important benefits in terms of sustainability and resilience. It could also lead to the development of new industries. The current low cost of capital adds force to the case for supporting research and development, providing market incentives, promoting commercial demonstration plants and encouraging the scaling up of manufacturing capacity. Around $45 billion would be spent each year to accelerate the development and production of new projects and industrial capacity for clean energy technologies such as hydrogen, batteries, carbon capture, utilisation and storage (CCUS) and small modular nuclear reactors (SMRs).
Some important cross-cutting points:
Energy efficiency measures score highly in terms of effectiveness across the transport,industry and buildings sectors, and feature strongly in the plan. They improve self-sufficiency, reduce exposure to extended supply chains and reduce potential impactsof volatile commodity prices, while providing an immediate boost to local jobs. In total,one-third of the $1 trillion annual spending would be devoted to efficiency measures.
For low-income countries, it is critical to accelerate efforts to provide universal accessto electricity and clean cooking solutions. This would provide an immediate increasein local jobs and durable improvements to social well-being by modernising healthservices and food value chains: it would also support economic and social resilience.Around $45 billion would be spent each year improving access to electricity for peoplein low-income countries, (which is included in the spending levels discussed for theelectricity sector). An additional $5 billion would be spent each year to ensure andimprove access to clean cooking solutions.
IEA.
All
right
s res
erve
d

Chapter 3 | A sustainable recovery plan for the energy sector 111
3
The significant decline in fossil fuel prices presents an opportunity to further the process of reforming inefficient fossil fuel subsidies without increasing end-use prices.In producer economies, fiscal positions are under a great deal of strain given increasesin spending to deal with the health and economic crises, as well as the contraction inoil and gas revenues. Cutting expenditure on fossil fuel subsidies could help alleviatesome of this stress.
3.2.3 Policies to support the sustainable recovery plan
The sustainable recovery plan rests on five key policy pillars (Figure 3.4). Of course, the specific policies adopted will vary from country to country depending on their particular circumstances and needs. Examples of specific policies that could be adopted under each of the pillars are provided in Table 3.2.
Figure 3.4 ⊳ The five policy pillars that support the implementation of the sustainable recovery plan
Deliver shovel-ready clean energy projects that boost resilience. A number of projects that were under construction or had reached the advanced stages of planning were delayed or postponed as a result of the Covid-19 pandemic. Restarting and supporting these projects – while ensuring the health of workers – could provide an immediate boost in employment and economic output. However it is important that these projects are compatible with long-term energy security and environmental objectives.
Develop a strong pipeline of new projects. Developing a more modern and resilient energy system requires investment in longer term infrastructure and energy efficiency projects. A
IEA.
All
right
s res
erve
d

112 World Energy Outlook 2020 | Special Report
pipeline of such projects would help to maintain steady investment activity and create jobs. Alongside direct government expenditure, consideration could be given to supporting the development of a pipeline of projects by modifying incentive structures and streamlining planning laws and procedures, which could make investment in such projects more attractive to private finance.
Tailor support for distressed industries. Some sectors severely impacted by the Covid-19 crisis are likely to require government support to continue operations. A number of countries have announced support packages for their construction, vehicle manufacturing and airline industries, for example. Governments could make support for these industries conditional on progress towards long-term sustainability and resilience.
Mobilise private finance. Some of the spending on energy projects will need to be undertaken directly by governments. However, it is essential that public policies mobilise private spending on measures that are aligned with the goals of the sustainable recovery plan. In some cases, it may be possible to use direct government expenditure to underpin measures such as improving effective regulatory procedures, reforming energy taxes, setting or raising actual or effective carbon prices, and reducing risks for private investment.
International co-operation. There would be significant co-ordination gains if countries align their actions. For example, if a group of countries deploy a particular clean energy technology, its costs are likely to fall faster than if only one country deploys it, to the benefit of all. Cross-border collaboration could also be useful in helping to re-establish some international supply chains disrupted by the Covid-19 crisis.
Mobilising investment
Part of the sustainable recovery plan will need to be funded through direct government expenditure. One of the five key policy pillars of the sustainable recovery plan is the mobilisation of private financing to complement the direct government expenditure. Public policies have an essential part to play in facilitating the deployment of private capital through regulations, market frameworks and tax reforms (Table 3.2).
Private investment needs to be aligned with the goals of sustainability and resilience, and this could be facilitated by integrating sustainability risk considerations within financial regulatory frameworks and introducing or raising carbon prices, so as to direct private capital towards low-carbon options. There are increasing amounts of data available to allow markets to assess sustainability risks (TCFD, 2017), as well as measures that allow markets to recognise and reward sustainable investments (European Commission, 2020).
Where central banks are expanding the supply of money through the purchase of assets, the introduction of appropriate eligibility criteria (for example, a preference to purchase corporate bonds that meet certain conditions), would help to ensure that the finance is directed towards sectors and technologies that are aligned with the goals of the sustainable recovery plan (Matikainen, Campiglio and Zenghelis, 2017).
IEA.
All
right
s res
erve
d

Chapter 3 | A sustainable recovery plan for the energy sector 113
3
Table 3.2 ⊳ Selected policies that could be implemented alongside financial support as part of the sustainable recovery plan
Pillar Examples of policies
Deliver shovel-ready clean energy projects that boost resilience
• Undertake deep retrofits of government-owned buildings.• Ease regulatory approval procedures and extend tax credits schemes for
electricity from renewables and other clean energy projects. • Promote the use of energy management systems in light and heavy industries.
Develop a strong pipeline of new projects
• Provide a long-term vision on sustainability and resilience to guide investment decisions.
• Increase borrowing thresholds and provide tax credits or grants for newinfrastructure such as electricity networks.
• Promote auctions, grants and rebates that seek to improve the energy efficiency of new and existing buildings.
• Strengthen minimum energy performance standards for appliances supported by mandatory labelling and targeted rebates.
• Support the development of urban and public transport infrastructure such as high-speed rail and charging points for electric vehicles.
Tailor support for distressed industries
• Strengthen and widen energy efficiency goals and promote the use of zero-carbon fuels in car manufacturing industries.
• Accelerate renovation and construction activity by introducing or strengthening requirements for highly efficient or near-zero energy buildings.
• Introduce or strengthen rules on measuring and reducing methane emissions from oil and gas operations.
Mobilise private finance
• Establish public co-funding schemes to reduce upfront investment costs through grants, concessional loans, public procurement and feed-in-tariffs.
• Provide more long-term contracts and regulatory investment guarantees.• Provide insurance policies and guarantees to reduce the cost of capital.• Provide technical assistance and capacity building.
• Strengthen international finance institutions sustainable development lendingcriteria.
• Introduce or raise actual or effective carbon prices.
International co-operation
• Accelerate the re-establishment of disrupted energy supply chains.• Co-operate on cross-border energy efficiency standards to expand the market
size for more efficient goods and technologies. • For internationally traded goods and technologies, promote the alignment of
measures to support production with measures to stimulate demand. • Advance cross-border transport links and establish infrastructure that
provides hubs for alternative fuels for international travel and transport.
Within the sustainable recovery plan, direct government investment focusses mainly on areas where private investment is difficult to mobilise or where the levels of private investment seem likely to fall short of what is needed. The need for such investment should be carefully assessed; it should last only as long as necessary and it should be undertaken with a view to facilitate private finance where appropriate. The scale of the needed investment for the plan means that in practice most of it is going to have to come from the private sector. That portion to be funded by government will vary from country to country.
IEA.
All
right
s res
erve
d

114 World Energy Outlook 2020 | Special Report
There is, for example, likely to be a greater need for public financing in some developing economies, where state-owned enterprises tend to play a bigger role in overall energy spending than in advanced economies, especially in electricity generation and networks.
Globally, the sustainable recovery plan requires just under $300 billion of government spending each year over the period to 2023 (Figure 3.5). This direct expenditure, together with enabling policies, mobilises private spending of close to $700 billion.2
Figure 3.5 ⊳ Annual public and private spending in the sustainable recovery plan, 2021-2023
Around 70% of the $1 trillion annual spending comes from private sources, with direct financial public support and policy design critical to mobilising these funds.
Total government spending over the three years of the plan ($870 billion) would be equivalent to less than 10% of estimated fiscal expenditure in recovery plans that have been announced globally as of the end of May 2020 (Battersby, Lam and Ture, 2020). After the 2008-09 financial crisis, spending on clean energy technology and environmental management measures accounted for around 16% of total stimulus measures (as discussed in Chapter 1).
3.2.4 Recovery plans in developing economies
Many developing economies are at particular risk from the Covid-19 crisis. In terms of immediate health, unemployment and humanitarian implications, they often have inadequate healthcare capacity and weak social safety nets relative to some advanced economies. Many could also face particularly severe economic difficulties because of high
2 The public to private split is broadly based on historical investment ratios between state-owned enterprises and private firms across the various measures, with differing values for advanced economies and the rest of the world, but with allowance for the higher level of government support that may be needed in some sectors (such as transport). This may underestimate the level of public spending since the economic downturn may reduce the relative willingness or ability of private firms to invest at historical levels.
90 120 30 150 30 240 140 50 120 30 Billion dollars
20%
40%
60%
80%
100%
Elec
tric
ity
Build
ings
Indu
stry
Tran
spor
t
Oth
er
Elec
tric
ity
Build
ings
Indu
stry
Tran
spor
t
Oth
er
Private
Public
Advanced economies Rest of world
IEA.
All
right
s res
erve
d

Chapter 3 | A sustainable recovery plan for the energy sector 115
3
existing levels of public sector debt and high levels of informal or insecure jobs; in some cases these difficulties may be compounded by weakness in their institutions. Some rely on income from oil and gas exports and have seen a major drop in revenues. Many are boosted by remittances and direct aid from advanced economies that could be at risk because of the economic slowdown. For example, it is estimated that remittances in 2020 going to countries in sub-Saharan Africa could fall by almost 25% from 2019 levels, while remittances to countries in Latin America could fall by 19% (Ratha et al., 2020).
Many people in developing economies still lack access to modern energy and clean cooking. Globally, 860 million people did not have access to electricity in 2018, and around 60% of health services lack reliable access to electricity in most sub-Saharan countries (Cronk and Bartram, 2018). More than 2.6 billion people also relied on traditional uses of biomass, coal or kerosene as their primary cooking fuel in 2018. Household air pollution causes around 2.5 million premature deaths every year; progress on clean cooking would substantially reduce this. Innovative and more decentralised energy systems, making full use of local agricultural and energy resources (including modern bioenergy, such as biogas or bio-ethanol and solar PV), have an important part to play in improving access to electricity and progress on clean cooking. Modest levels of investment in these areas can often generate large social and environmental improvements, while at the same time boosting energy resilience and facilitating economic growth.
Accessing private financing could be a challenge for some countries considering sustainable recovery plans. There has been a major increase in capital outflows away from developing economies since the start of the Covid-19 crisis, and many countries have limited monetary policy options at their disposal. Not all countries have access to international capital markets, and those that do are facing higher financing costs because of increased sovereign risks (Spiegel, Schwank and Obaidy, 2020). International co-operation to mobilise concessional loans and provide debt restructuring or debt relief therefore will be critical (UN DESA, 2020).3
International finance institutions (IFIs), multilateral development banks (MDBs), and bilateral donors (e.g. the G20 countries) will have an important role to play in underpinning the sustainable recovery plan measures in some countries. They have provided emergency financial assistance and debt relief to a number of low-income countries during the unfolding of the pandemic. IFIs and MDBs have also been among the largest foreign direct investors in clean energy technologies in developing countries in recent years, offering short-term credit or guarantees (to improve risk-adjusted returns for private investors), helping to remove barriers to investment and providing technical assistance. Many IFIs and MDBs have announced financing goals or are refining frameworks to improve the alignment of their lending portfolios with sustainability objectives (for example, to limit or discourage emission-intensive technologies and infrastructure, and more broadly to integrate adaptation measures into project designs). This should help to boost the
3 Concessional loans have more generous terms than market loans, for example through lower interest rates or longer grace periods than those available on the market.
IEA.
All
right
s res
erve
d

116 World Energy Outlook 2020 | Special Report
development of new low emission and resilient infrastructure projects, attract private investors, expand markets, and support governments in reforming climate and investment policies (OECD/The World Bank/UN Environment, 2018).
Domestic policy frameworks and market designs play a key role in attracting private finance. Markets dominated by monopolies and state-owned enterprises are often less attractive to foreign investors. For example, in sub-Saharan African countries (excluding South Africa), every $1 of public funding in power generation attracted around $0.6 of private capital in recent years, much lower than the levels for South Africa ($4.5) and countries in Southeast Asia ($3.5). Governments can improve the prospects for mobilising private financing with targeted interventions to support risk sharing, liquidity support and take-out financing.
Recovery plans also need to take into account countries’ individual macroeconomic characteristics such as the size and robustness of supply chains, the degree of economic diversification and the extent of labour market flexibility. Governments with restricted fiscal space may want to pay special attention to mobilising private finance and focus on ensuring the delivery of shovel-ready clean energy projects. For maximum impact, projects should be carefully selected and appraised, backed by precise cost-benefit analysis and channelled through or overseen by adequately resourced public institutions, with a high degree of transparency throughout. Targeted engagement with the private sector and civil society can help improve transparency. An approach of this kind would also help to avoid the creation of asset bubbles.
3.3 Implications of the sustainable recovery plan
3.3.1 The economy
We estimate that this sustainable recovery plan would create nearly 9 million new energy-related jobs in construction and manufacturing on average over the next three years, and that there would be an additional 0.4 million job-years in later years from continued work on assets with long construction periods. In total, the plan would therefore directly produce around 27 million job-years worldwide.4 There would also be more than 0.5 million permanent jobs associated with operating and maintaining the assets constructed by the sustainable recovery plan.
We look first at the temporary construction and manufacturing jobs that would be created and then at the longer term operations, maintenance and management jobs.
Construction and manufacturing job creation
The near-term focus of the sustainable recovery plan is to stabilise existing projects to maintain jobs and to launch new projects with very short lead times to jump-start new employment. For example, energy efficiency retrofits can often be ramped up quickly, as
4 For information on the definitions for the jobs analysis conducted for this report and its methodology, please refer to Annex A.
IEA.
All
right
s res
erve
d

Chapter 3 | A sustainable recovery plan for the energy sector 117
3
can projects to install or improve urban transport infrastructure. New projects of this kind would provide some immediate opportunities for those who have lost or stand to lose jobs in construction and manufacturing because of the pandemic and its fallout.
If the sustainable recovery plan were to be implemented by all countries globally, this would lead to the creation of around 9 million full-time equivalent energy sector jobs in construction and manufacturing by the end of 2021 (Figure 3.6). Construction and manufacturing jobs only last as long as there is a steady stream of new projects, and at some point countries would need to assess the need to repopulate the project pipeline to sustain these jobs. The plan runs from 2021 to 2023, but countries could decide to maintain support for particular measures or to incentivise new activities beyond the three-year period considered here. Ideally those working on energy efficiency, for example, would return to a revived retrofit and construction economy or retrain for other fields. There would also be a small number of construction and manufacturing jobs that would last beyond the brief recovery plan period, largely from long-lead time and slow-to-build infrastructure projects in the power sector.
Figure 3.6 ⊳ Construction and manufacturing jobs created in the sustainable recovery plan by sector, 2021-2023
A large number of jobs are created during the period of recovery plan spending; many also continue thereafter, especially in long-distance transport and electricity networks.
Note: Takes into account the sequencing, planning and approval status of measures across countries, the types of jobs required for the various measures, and construction and manufacturing times.
Of the 27 million job-years created worldwide by the sustainable recovery plan, 35% are in energy efficiency projects in the buildings and industry sectors, and just over 25% are in the electricity sector. Jobs related to cars account for over 10%, and those arising from other transport measures are also about 10%. The remaining jobs are spread across fuels, renewables in end-uses, recycling and innovation (Figure 3.7).
Of the 9.5 million total job-years for energy efficiency in buildings and industry, just under 60% are for buildings retrofits and efficient new construction. Most regions have a
0
2
4
6
8
10
2021 2022 2023
Mill
ion
jobs Innovation
Fuels
Industry
Transport
Buildings
Electricity
IEA.
All
right
s res
erve
d

118 World Energy Outlook 2020 | Special Report
domestic supply chain to support construction material production and implementation, and so most of these jobs would be created within the regions where the investment takes place. Many efficiency measures would lead to consumer savings, often within a short period of time; they would also provide immediate improvements in the resilience of energy systems. In the power sector, 60% of the 7 million total job-years created would be in renewables. While the construction jobs for these investments would be created locally, some of the manufacturing jobs, which make up around 20% of the total job-years created, would be created outside the region making the investment.
Figure 3.7 ⊳ Annual average jobs created in constructing and manufacturing Annual average constructing and manufacturing jobs created in the sustainable recovery plan
Nearly 9 million new jobs would be created on average each year by the sustainable recovery plan; around 35% of these jobs would be in the buildings sector.
The drop in coal demand is expected to decrease employment in coal-based electricity generation by 0.2 million by 2021. To reduce the social impact of these job losses, well-resourced retraining, capacity building and regional revitalisation programmes will be required to enable workers and communities to find attractive alternative livelihoods.
The economic impact of Covid-19 is likely to be felt most profoundly by the poor and economically vulnerable segments of society. Around 5% of the jobs created by the
0.5 1.0 1.5 2.0
Wind and solar PVNetworks
Nuclear and hydro
Buildings efficiencyEnd-use renewables
AppliancesClean cooking
New electric vehiclesLong-distance transport
New efficient carsUrban infrastructure
Industry energy efficiencyMaterial efficiency
BiofuelsMethane reductions
Batteries, hydrogen, CCUS and SMRs
Electricity Buildings Transport Industry Fuels Innovation
Million jobs
IEA.
All
right
s res
erve
d

Chapter 3 | A sustainable recovery plan for the energy sector 119
3
sustainable recovery plan would be suitable for unskilled labour: a number of measures, like waste collection and biofuels support, would also be likely to support a significant number of workers in the informal economy. In low-income countries without full electricity access where many people rely on the traditional use of biomass for cooking, investment in grids, decentralised systems and clean cooking solutions could employ around 350 000 people globally on average in the period to 2023.
Many of the jobs created by the sustainable recovery plan would match the skills of workers who lost jobs during the crisis, or would require little retraining. For example, former manufacturing workers could work on assembling highly efficient commercial durable goods, and former construction workers could undertake building retrofits. However, we estimate that around 40% of the jobs created globally in the sustainable recovery plan would be in specialised positions, which would require substantial retraining programmes. For example, a large portion of the work on large civil construction projects (such as hydro or nuclear power) is highly technical. While workers may be available from overseas to fill immediate skills gaps, investment in retraining and capacity building would be essential to supply this segment of the labour market.
Some measures in the sustainable recovery plan would stimulate demand for imports of goods and services. Suppliers for high-tech goods and services (for example relating to power networks and high-speed rail) are often located in advanced economies, while basic fabrication materials and appliances are often manufactured outside of advanced economies. Countries could aim to maintain or develop a higher proportion of jobs by promoting local industries and developing domestic supply chains, although this would need to be balanced against the need to ensure competitiveness. International co-operation and trade agreements could help reduce potential areas of conflict.
Globally, males hold around 93% of construction jobs and more than 60% of manufacturing jobs. Unless gender occupational segregation is addressed, the jobs created by sustainable recovery plans are likely to be taken mainly by men. A multi-track approach is needed to close gender gaps and achieve equality in employment and remuneration (ILO, 2019). Rights at work should ensure that women and men have equal opportunities, are protected from discrimination and have access to maternity and parental leave allowances. Child-care policies, support for lifelong learning, an enabling environment for female entrepreneurs and social dialogue would also contribute to empowering women in the labour market.
Operations, maintenance and management job creation
Construction and manufacturing would account for the vast majority of the immediate jobs boost during the sustainable recovery plan, but long-lived capital assets built as a result of the plan would also give rise to continuing operation and maintenance (O&M) and management jobs. A much smaller number of these jobs would be created, but they would last for a much longer period. We estimate that nearly 0.5 million O&M and management jobs would be created by the measures realised in the sustainable recovery plan. The cost
IEA.
All
right
s res
erve
d

120 World Energy Outlook 2020 | Special Report
of sustaining these jobs is not included in the sustainable recovery plan: they would be funded from the operating revenues of firms using the assets developed under the plan.
The sustainable recovery plan would provide further long-term employment by “inducing” further jobs across the economy: spending by those in new jobs would lead to further job creation in other sectors. Many energy measures – in particular energy efficiency – would deliver savings for consumers and so increase household disposable income for other purposes, thereby supporting employment in other economic activities. Investment in new industries, such battery manufacturing and hydrogen production, could also provide an important runway for future job growth.
Economic growth
A critical aim of the sustainable recovery plan is to provide a boost to the global economy. The impacts of the sustainable recovery plan on global GDP have been estimated by the International Monetary Fund (IMF) using the Global Integrated Monetary and Fiscal (GIMF) model.5 The GIMF provides an estimate of the response in GDP over time across different regions to a surge in spending that is above the past five-year average levels of investment. The estimate assumes that monetary authorities do not raise nominal interest rates in response to the increases in activity and inflation resulting from the recovery plan: this provides additional impetus to activity by reducing real interest rates (Table 3.3). The estimate isolates the specific impacts of the sustainable recovery plan by comparing its results against a baseline that assumes no other increase in investment.
Table 3.3 ⊳ Impact of the sustainable recovery plan on selected global macroeconomic indicators
2021 2022 2023 2024 2025
Inflation 0.3 0.7 1.3 1.7 1.9
Real interest rate -0.5 -0.9 -1.4 -1.7 -1.8
Consumption 1.4 2.7 3.9 4.6 5.0
Notes: Inflation and real interest rate are percentage point differences from a baseline with no increase in investment. Inflation is the change in consumer price index; all other values are in real terms. Consumption is the percentage increase in aggregate spending by households and firms.
The sustainable recovery plan – with $1 trillion dollars of annual spending through 2023 – is estimated to lead to a 3.5% increase in real global GDP in 2023 above the level that it would have been without the spending (Figure 3.8). In terms of annual changes in GDP, this means that global economic growth each year to 2023 would be 1.1% higher on average than it would have been otherwise.
5 GIMF is a multi-country dynamic stochastic general equilibrium model used by the IMF for policy and risk analysis (Laxton et al., 2010; Anderson et al., 2013). It has been used to produce the IMF’s World Economic Outlook scenario analyses since 2008.
IEA.
All
right
s res
erve
d

Chapter 3 | A sustainable recovery plan for the energy sector 121
3
After the period of growth to 2023, the boost to the level of the global economy is maintained, despite the end of the spending and a tightening in the accommodative fiscal stance.6 This is because, in addition to the direct increase in GDP from the public and private spending in the energy sector, there are a number of other benefits that help amplify the boost to GDP. Investment in new infrastructure such as electricity networks and in energy efficiency increases the overall productivity of both workers and capital. This generates savings for households, firms and governments which can be reinvested. Improvements in health from reductions in air pollution and increases in the level of energy access in low-income countries also lead to additional medium- and long-term economic growth.
Figure 3.8 ⊳ Increase in real GDP as a result of the sustainable recovery plan
Global GDP would be 3.5% higher as a result of the sustainable recovery plan.
Note: Shows the increase in GDP in each year relative to a baseline that has no increase in investment; it takes the average of different methods to recuperate direct government expenditures.
Source: IEA analysis based on the IMF GIMF model.
The increase in GDP growth is less in advanced economies than in the rest of the world. This is partly because the amount of spending in advanced economies is less, but also because many of the indirect manufacturing jobs created are located outside of advanced economies. Many countries therefore benefit both from domestic recovery plan spending and (through exports) from the spending in advanced economies. A further point is that investment in energy supply infrastructure in advanced economies tends to be less labour intensive and to provide a less of a boost to productivity than is the case elsewhere.
6 There is a small degree of variation in the increase in global GDP in later years depending on how the near-term increase in government expenditure is assumed to be funded (e.g. through an increase in taxes or reduction in government consumption).
1%
2%
3%
4%
2020 2021 2022 2023 2024 2025
Advanced economies
Global average
Rest of world
IEA.
All
right
s res
erve
d

122 World Energy Outlook 2020 | Special Report
3.3.2 The energy sector
The sustainable recovery plan would begin the process of structurally reorienting countries’ energy sectors by accelerating the shift towards electricity and increasing the share of energy supplied by low-carbon energy sources (Figure 3.9). If all countries were to follow the proposals set out in the sustainable recovery plan:
An average of around 130 gigawatts (GW) of additional wind and solar PV globalcapacity would be installed each year from 2021 to 2023 (additional to the levels thatwould be installed in the absence of the recovery plan). This additional capacity wouldgenerate nearly 320 terawatt-hours (TWh) of electricity on average each year. Thiswould be underpinned by widespread grid extensions and improvements, includingsmart grids and energy storage. The $110 billion spending on grids in the sustainablerecovery plan would increase total spending on grids globally by around 40% fromlevels seen in recent years, boosting investment towards the levels needed for a moreresilient and sustainable electricity network.
Just over 30 GW of hydro and nuclear power capacity would benefit from lifetimeextensions each year to 2023. This enables 90 GW of hydro and nuclear capacity thatwould otherwise have been soon retired to continue to provide low-carbon power wellbeyond the end of the recovery plan.
Final energy consumption would be around 350 million tonnes of oil equivalent (Mtoe)lower than it would have been otherwise by the end of the spending period. Aroundone-third of this would be because of reductions in the traditional use of biomass as aresult of shifts to clean cooking solutions.
Global electricity demand would rise in the period of the recovery plan, but theincrease would be around 900 TWh (75 Mtoe) lower than it would otherwise havebeen. There would be deep retrofits of a large number of existing buildings, and anumber of new highly efficient buildings would be built. In total, the efficiency ofaround 20 million dwellings would be drastically improved each year as a result of therecovery plan. A number of end-uses in buildings could switch to renewable sources,such as solar water heaters and biomass boilers, to reduce fossil fuel and electricityuse. Incentives in the recovery plan would stimulate the purchase of more than350 million high efficiency appliances each year. A variety of efficiency improvementsin industrial processes would curb electricity use.
Oil consumption in transport would be around 2 million barrels per day (mb/d)(100 Mtoe) less. Around 12 million car purchases on average each year would bepurchases of more efficient internal combustion engine vehicles (ICEs) (includinghybrids), while around 6.5 million car purchases would be electric vehicles. Totalannual average electric cars sales between 2021 and 2023 would be around 8 million.Oil demand in transport would also be reduced from a shift in some light commercialvehicles sales to electric models and from improvements in the efficiency of trucks,airplanes and ships.
IEA.
All
right
s res
erve
d

Chapter 3 | A sustainable recovery plan for the energy sector 123
3
Figure 3.9 ⊳ Additional average annual deployment or maintenance of selected technologies as a result of the sustainable recovery plan, 2021-2023
The sustainable recovery plan boosts clean energy technologies in all sectors and regions.
Notes: EVs = electric vehicles; ICEs = internal combustion engines. Indicates additional levels from the sustainable recovery plan compared to a case with no increase in energy sector spending for: wind and solar PV power capacity installed; life extensions of hydro and nuclear power plants; changes in types of vehicles sold; high efficiency dwellings built or retrofit of existing buildings; and energy-efficient appliances sold.
3.3.3 The environment
The sustainable recovery plan would have a marked impact on GHG emissions. Emissions would be nearly 3.5 gigatonnes of CO2 (Gt CO2) lower by 2025 than they would have been without the recovery plan (Figure 3.10). It is estimated that CO2 emissions in 2020 will be around 2.6 Gt lower than they otherwise would have been as a result of the slowdown in activity and the contraction in the global economy related to Covid-19. The emissions reductions from the three years of the sustainable recovery plan would therefore provide a much higher level of CO2 emissions reductions than was caused by the Covid-19 crisis, but achieve this through structural changes in the way that society produces and consumes energy rather than by curtailing economic activity.
The sustainable recovery plan would kick-start the reductions needed to achieve the goals of the Paris Agreement. Nonetheless, in isolation, the recovery plan would not be sufficient; further actions would be needed to put the world on course to achieve the Paris Agreement goals.
30 60 90 120 150 180
Wind and solar PV
Hydro
Nuclear
Power
GW
2 4 6 8 10 12
Efficient ICEs
EVs
Transport
Million vehicles
60 120 180 240 300 360
Dwellings
Appliances
Buildings
Million units
IEA.
All
right
s res
erve
d

124 World Energy Outlook 2020 | Special Report
Annual CO2 emissions would be nearly 3.5 Gt lower and many measures would save money; a further 0.8 Gt CO2-eq would be avoided by reducing methane leaks.
Note: Mt CO2 = million tonnes of CO2; CO2-eq = carbon-dioxide equivalent (using 100-year global warming potentials for different greenhouse gases).
Energy efficiency measures deliver the largest overall reductions in emissions. Historical patterns show that efficiency measures have not attracted as much attention as they deserve; the unique set of circumstances created by Covid-19 mean that this could be an opportunity for their potential to be seized. Around one-third of the CO2 emissions reductions that would occur as a result of the sustainable recovery plan have negative abatement costs, meaning they would save emissions while also saving money. Most of the elements with negative abatement costs are efficiency measures in the industrial, buildings and transport sectors. While initial investment from the recovery plan is needed to stimulate action, the savings from the projects would accrue to firms and households, reducing short-term risks of energy insufficiency and income stress, and would eventually be reinvested to stimulate further economic activity and induce further job growth.
In addition to the reductions in energy-related CO2 emissions, investment in tackling methane leaks from oil and gas operations would yield immediate results by curtailing around 0.8 Gt CO2-eq emissions (assuming that one tonne of methane is equivalent to 30 tonnes of CO2). Unlike many of the other emission abatement opportunities, the spending on methane emissions reductions must be sustained each year to maintain the emissions reduction. For example, leak detection and repair (LDAR) is a cost-effective way to avoid fugitive methane emission. However, if LDAR programmes stop, new leaks that could occur would not be found and fugitive emissions would rise again. There would also be a small drop in methane emissions from replacing the traditional use of solid biomass in households with alternative fuel sources like liquefied petroleum gas (LPG) or with more modern cook stoves.
-50
-25
0
25
50
75
0 500 1 000 1 500 2 000 2 500 3 000
Dol
lars
per
tCO
₂
Mt CO₂
Electricity
Buildings
Transport
Industry
Fuels
Figure 3.10 ⊳ Emissions avoided as a result of the sustainable recovery plan
IEA.
All
right
s res
erve
d

Chapter 3 | A sustainable recovery plan for the energy sector 125
3
For countries that currently subsidise the use of fossil fuels, strengthening reform efforts
could curb fossil fuel consumption and thus reduce GHG emissions. As discussed in
Chapter 2, phasing out inefficient fossil fuel subsidies in nearly all regions would reduce CO2
emissions by around 700 million tonnes (Mt) by 2030. To date, there are few signs that the
fall in oil and gas prices is prompting an acceleration in efforts to phase out subsidies. In
fact, some countries have introduced additional price interventions to protect newly
vulnerable consumers, particularly in the electricity sector (IEA, 2020). Turning this around
and strengthening a process of reform would provide an additional boost to emissions
reductions from the sustainable recovery plan.
Figure 3.11 ⊳ Reductions in SOX, PM2.5 and NOX emissions as a result of the sustainable recovery plan
Levels of all three air pollutants would fall as a result of the sustainable recovery plan, leading to substantial improvements in air quality, especially in households and cities.
Note: Indicates the difference in air pollutant emissions from sustainable recovery plan relative to a case with no increase in energy sector spending.
The sustainable recovery plan would also lead to reductions in the levels of the three main
air pollutants (sulfur oxides [SOX], particulate matter [PM2.5], and nitrogen oxides [NOX])
compared with what would otherwise happen. These pollutants are largely responsible for
poor air quality and are a major public health hazard (Figure 3.11). The decline in the use of
coal, mostly for power generation, is the main cause of lower SOX emissions. The shift away
from the traditional use of biomass in cooking towards modern and clean alternatives is the
main factor leading to the large reductions in PM2.5. Lower oil use in transport is the main
cause of reduced NOX emissions.
Some of the measures, particularly those involving new infrastructure such as transmission
lines, power plants and roads for maintenance, would have an impact on biodiversity and
natural ecosystems. It is important that all new infrastructure should be developed in ways
that minimise environmental impacts.
‐6%
‐5%
‐4%
‐3%
‐2%
‐1%
PM2.5 NOXSOX
IEA.
All
right
s res
erve
d

126 World Energy Outlook 2020 | Special Report
3.3.4 Energy security and resilience
The sustainable recovery plan improves security and resilience in a number of ways. It stimulates investment in electricity networks and energy storage, which reduces the risk of supply disruptions; it helps to modernise grids, thus strengthening the ability to withstand and recover from shocks; and it increases affordable access to energy services, helps to integrate increasing shares of variable renewable electricity, and improves system reliability.
The resilience of low-income economies would be substantially improved by increased energy efficiency, better access to electricity and progress on clean cooking solutions. Such improvements would be particularly beneficial for women, who are generally responsible for collecting fuel and cooking, and who have the highest exposure to fine particulate matter. Investment in networks, mini-grids and residential standalone systems under the sustainable recovery plan mean that around 270 million people gain access to electricity over the period to 2023, while investment in modern and clean cooking solutions move around 420 million people away from the traditional use of biomass, significantly reducing premature deaths from air pollution (Figure 3.12).
Figure 3.12 ⊳ People gaining access to electricity and clean cooking as a result of the sustainable recovery plan
Nearly 270 million people gain access to electricity and 420 million gain access to clean cooking by the end of the recovery plan, mostly in sub-Saharan Africa, Asia and India.
The recent reduction in LPG prices substantially reduces the payback period for households switching to LPG cooking equipment, so long as savings are passed on to consumers and not accompanied by tax increases. Governments may wish to consider implementing price caps to avoid volatility in LPG prices affecting affordability for low-income consumers, or instituting targeted subsidies, as has been done in India. Establishing clean cooking infrastructure in rural areas would improve the ability of governments to reach and support these populations, particularly during times of crisis.
100
200
300
400
500
Gain access to electricity Gain access to clean cooking
Mill
ion
peop
le Other
Other Asia
India
Sub-Saharan Africa
IEA.
All
right
s res
erve
d

Chapter 3 | A sustainable recovery plan for the energy sector 127
3
Energy poverty and the affordability of energy is a critical concern for policy makers. Assuming that prices remain unchanged, there would be important reductions in consumer bills by the end of the sustainable recovery plan compared with a case without this spending as a result of fuel switching and energy efficiency measures (Figure 3.13).
Figure 3.13 ⊳ Reduction in consumer oil and electricity bills as a result of the sustainable recovery plan
Despite the need for upfront spending, consumer oil and electricity bills would be lower as a result of the sustainable recovery plan.
Note: Indicates the difference in consumer bills from the sustainable recovery plan relative to a case with no increase in energy sector spending.
-4%
-3%
-2%
-1%
Advanced economies Rest of world
Oil
Electricity
IEA.
All
right
s res
erve
d

IEA.
All
right
s res
erve
d

Annex A | Employment calculation methodology 129
Annex A
Employment analysis methodology
Jobs analysis
To estimate the employment impacts of the Covid-19 pandemic and the proposed economic recovery and stimulus packages, the IEA developed a new methodology to estimate employment in energy-related sectors. This analysis estimates:
The number of people employed before the Covid-19 crisis in major energy supply andend-use sectors, including electricity, oil, natural gas, coal and biofuels.
The number of jobs likely to be lost in these sectors due to the Covid-19 crisis and thenumber of jobs that could be created by government support for the energy sector inrecovery packages.
The analysis primarily relies on the use of “employment multipliers” which estimate how many jobs are created or maintained per million US dollars invested in new infrastructure or spent on certain goods. This technical annex describes:
How employment is defined and the scope of calculations, together with the rationalefor the approach adopted.
The methodology used to assess the multipliers.
How multipliers were developed.
The use of multipliers within the IEA World Energy Model.
Definition and scope of employment
The definitions used in this report are:
Direct: Jobs created to deliver a final project or product.
Indirect: Supply chain jobs created to provide inputs to a final project or product.
Induced: Jobs created by wages earned from the projects and spent in other parts ofthe economy, thereby creating additional jobs.
Cost savings re-spend: Jobs created by reduced customer energy costs being spentelsewhere in an economy. These jobs, also referred to as second-order jobs, can alsobe negative, if, for example, the cost of energy were to rise for consumers in the widereconomy, leading to a reduction in spending in other parts of an economy.
Employment encompasses all direct jobs and the indirect jobs from suppliers providing immediate inputs to the production of the primary sector. Induced jobs and jobs that may be created from re-spend are not included. This sets a clear boundary around the jobs that the upfront investment would pay for to deliver the project. Where possible, we highlight where jobs created are high paying and in low cost areas, meaning that there is likely to be a high level of induced jobs. We also highlight where investments pay back quickly and
IEA.
All
right
s res
erve
d

130 World Energy Outlook 2020 | Special Report
produce cost savings over their lifetime, potentially giving consumers increased scope for spending in higher value-added sectors.
Jobs are normalised to full-time employment (FTE) for consistent accounting. An FTE job represents one person’s work for one year at regulated norms (e.g. 40 hours a week for 52 weeks a year, excluding holidays). Two separate, six-month jobs would be counted as one FTE job.
Jobs are reported as either job-years or jobs. The “job-years” term is used to report the cumulative years of FTE over a period of time. The term “jobs” is used to report employment during a single year or an average over a period. Job-years accounts for total employment created directly by a project making comparable employment that may spike during construction phases, then level off at much lower levels during operation, which may continue for 20 years or more. Jobs indicate how many people will be employed in certain industries during a specified period of time.
The use of job-years or jobs does not imply anything about the permanency of the jobs. This is understandably important to policy makers who want to avoid creating jobs that disappear once recovery plan funding stops. We avoid classifying jobs as permanent or temporary because many jobs that are technically classified as temporary (i.e. predicated on the demand for projects and production or construction) may in fact offer long-term employment opportunities by leading to jobs working on future projects after the economic recovery spending dissipates.
Where possible, the jobs created are classified as:
Manufacturing: Jobs producing direct inputs to an energy project.
Construction: Jobs installing, constructing and commissioning energy projects.
Operations and maintenance (O&M): All ongoing jobs required to support the properoperation of an energy project.
Manufacturing and construction jobs are calculated over the lifetime of the production and construction phase of projects, while O&M jobs are calculated over the usable lifetime of the energy project. O&M jobs are always accounted for separately from the jobs created by economic stimulus spending, since they are not paid for by the initial stimulus investment.
We report only the gross number of job-years or jobs created. Gross effects include only the positive impact on employment associated with the investment. Net job creation considers job losses in other economic sectors that may occur by redirecting investment away from these areas. We focus on gross job creation to reflect the current job market, where job losses are occurring in many sectors, and where increased spending will likely be necessary to sustain jobs. The gross number of jobs created or sustained by spending in the energy sector provides a clear point of comparison to weigh job creation benefits in energy relative to other sectors.
IEA.
All
right
s res
erve
d

Annex A | Employment calculation methodology 131
A
Choice of methodology
Employment is most commonly calculated using one or a combination of three techniques:
Computable general equilibrium (CGE) modelling.
Input-output (I-O) modelling.
Employment multipliers.
We used employment multipliers because we wanted to provide detailed employment numbers for specific energy technologies, and CGE or I-O models are generally unable to provide this level of granularity. The use of employment multipliers also means that employment created by an investment can be isolated from other macroeconomic factors that could otherwise impact the levels of job creation.
Although employment multipliers were primarily used to calculate employment figures for this analysis, the other methods helped to calibrate employment multipliers for subsectors, and served as points of comparison. For example, I-O tables from the Organisation of Economic Co-operation and Development (OECD) were used to verify and provide estimates of indirect jobs in certain industries.
Employment multipliers
The database of multipliers was compiled based on existing literature, industry engagement, surveys of government statistical accounts and macroeconomic modelling. It represents a state-of-the-art database of subsectoral employment levels across the energy sector. The method to produce the full subset of multipliers is described below (data sources are listed by sector in section 1.3). Broadly, the method was based on:
Gathering employment multipliers at regional or global levels.
Filtering and adjusting multipliers to ensure consistency in the types of jobs included, adjusting for inflation and eliminating older references where prices and labour efficiency have changed significantly.
Estimating multipliers for regions and technology types where insufficient primary estimates exist.
Gathering multiplier input data
Measures use one of two types of multipliers: those whose denominators are in million US dollars invested, and those whose denominators are in million US dollars spent on final goods. The denominator used is dependent on the nature of the measure, and in particular whether it aims to encourage investment in assets or consumer purchases.
We focus on new employment multipliers. These give the number of new jobs created by an incremental investment of $1 million or an increase of $1 million in final goods. They differ from active employment multipliers, expressed as jobs per million dollars of existing revenue, which more closely reflect O&M employment.
IEA.
All
right
s res
erve
d

132 World Energy Outlook 2020 | Special Report
The primary sources used include:
I/O tables, employment requirement matrices and national accounts.
Academic, intergovernmental research and modelling results.
Individual company and industry group estimates.
Calculated multipliers from legal financial filings that provide information onemployment and revenue, cost breakdowns for projects and average wages.
I-O tables and government surveys of businesses were prioritised, when available withsufficient detail, to support the subsectoral analysis (e.g. the North American IndustryClassification System (NAICS) codes or the European Nomenclature of Economic Activities(NACE) codes), which provide detailed data at the level of pumps and compressormanufacturing). If these were not available, the master NAICS or equivalent codes wereused to guide our multipliers (e.g. is the multiplier for electric chargers within two standarddeviations of the generalised multiplier for electrical equipment manufacturing). Thesewere used to filter out other multipliers that vary too far from the average.
Employment and financial information were extracted from the annual reports of major companies in each sector. Data for different years were used to estimate how changes in investment levels (derived from the IEA’s World Energy Investment 2020 report1) impacted changes in employment. This method could only be used for sectors with a high degree of consolidation in major firms that are publicly listed.
Material from academic and industry sources was screened to ensure harmonised definitions and reference values were adjusted to adhere to the framework described. In other words, if there was insufficient information to make adjustments, sources that did not adhere to these definitions were removed. It is worth noting in particular that:
Direct component manufacturing is often included in direct employment instead ofindirect. Where possible, manufacturing jobs are reclassified as indirect, or have not made a distinction between direct and indirect jobs for that multiplier.
Estimates of indirect jobs sometimes include jobs created to support the operationand maintenance of the project or equipment. These are reported separately to clarifythat they are not paid for by the Covid-19 stimulus investment.
Indirect sometimes includes jobs “supported” by the purchase where the equipment isa key enabler for another job, for example, automobile manufacturing is a key enablerfor delivery and taxi driving jobs. These “supported” jobs are not included in ouranalysis.
Where values from these sources were unavailable, estimates were based on employment multipliers for similar technologies. Cost breakdowns for building new projects or the production of one unit were used to estimate how much of the million dollars spent went
1 https://www.iea.org/reports/world-energy-investment-2020.
IEA.
All
right
s res
erve
d

Annex A | Employment calculation methodology 133
A
to labour or materials. Based on available wage information for subsectors, direct labour was calculated by dividing total labour cost contribution by average wages. For indirect multipliers, the amount spent on materials in the original project was multiplied by an average multiplier from direct supplier industries. If it was not possible to isolate primary supplier industries, or their multipliers were not available, multipliers were used from higher level NAIC codes as a proxy for the indirect labour multiplier.
Once these multipliers were assembled, historic values were adjusted to express them in 2020 US dollars. Weighted averages of the full list of associated references were taken, basing those on the relevant and rigour the source material, to control for outliers.
Multipliers were tested with companies within IEA’s Energy Business Council, peer reviewers, experts from academia, industry groups and other international organisations (such as the International Monetary Fund and International Labour Organization).
Regional multipliers
Employment data is not available for all regions and so regional multipliers were constructed based on wage differences for the standard regions in the IEA World Energy Model (WEM).These regional multipliers were arrived at by a variety of means, but most were created through the use of wage adjustments. This process involved:
Identifying the cost contribution breakdown for $1 million spent on new projects or products for regions with existing multipliers (e.g. 10% labour, 50% materials, 10% equipment costs). These breakdowns were derived using detailed manufacturer surveys, primarily from the US Annual Manufacturer’s Survey data which provide information on the contribution to costs of average wages, labour and materials. Industry evaluation and heuristics were used to confirm breakdowns or provide more granular breakdowns for specific technology types.
Adapting the cost contribution breakdown to each region, taking specific account of how differences in wages and material costs shift the relative shares of labour and material. Average wages and basic material costs were indexed on the basis of US costs, and these were applied to the labour and material costs for a $1 million project or purchase to calculate how much that same purchase would cost to produce in a low-wage economy. For example, in the United States $1 million spent on batteries represents roughly $140 000 for labour costs, but when adjusting for low-wage economies, producing the same amount of batteries would only be $3 000 in labour costs. We then need to adjust the amount of batteries back up to arrive at a $1 million purchase in low-wage economies. If labour is much cheaper than project inputs, then the percent contributions of labour and material costs shift in low-wage economies. We provide an example calculation below in Table 1.1. We utilised local wages, average cost differential of input materials, share of imports in production and the costs of those imports to arrive at adjusted cost contribution breakdowns for various regions. These inputs were derived from the global balance of trade in value added. In
IEA.
All
right
s res
erve
d

134 World Energy Outlook 2020 | Special Report
lower cost economies, the labour index is lower than the material cost index, resulting in the proportion of total project or product cost accounted for by labour costs going down, and the proportion of total cost accounted for by input materials going up.
Finding average wages for relevant jobs in a region by using national average salaryinformation specific to a subsector. Where information on wages specific to asubsector was not available, average wages from salary reporting websites were used,splitting the labour costs to distinguish between those associated with production andmanufacturing and those associated with overheads (e.g. research and development,procurement and marketing). To calibrate the correct weighting of various salarytypes, average wages were used for generalised sectors (e.g. manufacturing of durablegoods, construction) to provide guidance. For technologies that have a relativelyglobalised market (e.g. solar photovoltaic panels), a global average of salaries isassumed based on each countries’ share of total production. This provides an indirectmultiplier that can be applied to all regions.
Calculating jobs per million dollars for the expenditure by dividing the portion spenton salaries by average salaries. The indirect multiplier for advanced economies wasused as a basis for indirect jobs, and the rectification multiplier for each country wasapplied to calculate indirect jobs. Since inputs for industries can be diverse across theentire economy, the rectification multiplier, which uses generalised wages, reflectseconomy-wide cost differences and does not need to apply specific wage types toarrive at more exact direct jobs numbers.
Table A.1 ⊳ Example calculation of labour contributions in different regions
Base ($ million)
Cost adjustment
index
Low-wage economies ($ million)
Low-wage economies, rescaled to $1 million
Labour 0.15 0.1 0.15*0.1= 0.015 (0.15+0.5)/(0.015+0.3)*0.015 = 0.031
Materials 0.5 0.6 0.50*0.6= 0.3 (0.15+0.5)/(0.015+0.3)*0.3 = 0.62
Calculating total employment
The final employment multipliers were integrated with the WEM by applying the multipliers to the appropriate sector and regional investments.
These multipliers were used to:
Support the calculation for total jobs pre-Covid-19 crisis in key energy sectors.
Calculate new jobs created by Covid-19 recovery and stimulus spending.
Calculate jobs lost or at risk due to decreased investment in subsequent years.
In all cases, the multipliers were applied to investment or changes in investment, not revenues or total assets, to calculate the number of jobs created by or necessary to support the level of new investment. When providing jobs within a single year, we considered for
IEA.
All
right
s res
erve
d

Annex A | Employment calculation methodology 135
A
how long and when an investment or purchase creates those jobs. For instance, investment in a new hydroelectric dam would create some jobs in the planning and preparation phase prior to the investment: when financial close occurs, these jobs disappear, but construction and equipment manufacturing jobs are created; when construction is completed, these jobs disappear, but O&M jobs begin. Jobs are assigned to the relevant years to understand total employment on an annual basis.
Pre-Covid-19 crisis jobs
Pre-Covid jobs include both O&M jobs associated with the existing asset base and jobs supporting the investments made in the preceding years:
O&M jobs associated with the existing asset base were estimated using employment surveys and census data, annual reports of major companies, academic research, and multipliers derived by estimating the number of employees associated with different facilities and scaling them up in line with total facilities globally. There were substantial gaps in current employment data, and these were estimated and these estimates were tested with experts.
Jobs supporting the investments made in previous years were calculated by applying the multipliers to new investment in the immediately preceding years, using data on new investment from the IEA’s World Energy Investment 2020 report This is used to estimate how many manufacturing and construction jobs were supported by projects underway or in the pipeline prior to Covid-19 related stimulus responses.
The two totals were added together to produce the total pre-Covid jobs figure for energy industries used in Chapter 1.
New jobs
Multipliers were applied to the level of investment included in the plan for each year to calculate total jobs in 2021, 2022, and 2023. Figures for the jobs created take account of the timing delays between investment and job creation for each subsector. They also take account of minimum lead times for projects already through the feasibility study phase to move from plan to financial close.
Investment numbers were produced for each region and subsector, and the corresponding multipliers were applied for each region. For investments in which figures for manufacturing, construction and O&M jobs are available, a breakdown was produced of the types of skills needed for those jobs and the regions where those jobs would be created. For technologies with a highly globalised supply chain, manufacturing jobs are divided across regions according to current production capacities. For technologies that have very localised production, such as building materials and biofuels, all manufacturing jobs were assumed to be created locally.
IEA.
All
right
s res
erve
d

136 World Energy Outlook 2020 | Special Report
Jobs lost
Multipliers were applied to the decline in the level of investment between 2019 and 2020 to calculate how many jobs in construction and manufacturing are likely to have been lost in the long-run due to structurally decreased demand if investment levels are not bolstered. These job numbers are different from many of the job numbers that have been reported in the press, which are often based on unemployment filings and reflect workers who may be on temporary furlough or whose wages are hourly and are forgone during lockdowns. Press reports also often use information from industry associations and companies, many of which report “jobs at risk” on the basis that projects that are stalled will not proceed after lockdowns have been lifted, and that all jobs connected with such stalled projects will be lost. These two types of numbers do not reflect structural losses, and are therefore not considered in our analysis. As a result, the jobs lost estimates provided are much lower than those that have been reported in the press. Our estimates provide a more accurate reflection of the number of jobs truly at risk as a result of decreased investment.
IEA.
All
right
s res
erve
d

Annex A | Employment calculation methodology 137
A
Data sources
General/cross-cutting
NASEO and EFI (National Association of State Energy Officials and Energy Futures Initiative) (2020), US Energy and Employment Report 2020, https://www.usenergyjobs.org/.
Eurostat (2020), Employment Statistics (database), European Commission. https://ec.europa.eu/eurostat, (accessed date month year).
U.S. Census Bureau (2020) (database), U.S. Census Bureau, https://data.census.gov/cedsci/, (accessed date month year).
National Bureau of Statistics of China, http://www.stats.gov.cn/english/, (accessed date month year).
ILO (International Labour Organization) Statistics (database), https://ilostat.ilo.org/, (accessed date month year).
OECD (Organisation for Economic Co-operation and Development) (2020), Trade in Value Added Tables, https://www.oecd.org/sti/ind/measuring-trade-in-value-added.htm, (accessed date month year).
OECD (2020), Input-Output Tables (database), http://www.oecd.org/sti/ind/input-outputtables.htm, (accessed date month year).
OECD (2020), STAN STructural Analysis STAN (database), www.oecd.org/ sti/ind/stanstructuralanalysisdatabase.htm, (accessed date month year).
Glassdoor (2020) Global wage benchmarks data, https://www.glassdoor.fr, (accessed date month year).
Payscale (2020), Global wage benchmarks data, https://www.payscale.com/, (accessed date month year).
Salary Expert.com and ERI. Accessed for various wage benchmarks globally June 2020. https://www.salaryexpert.com/.
World Bank (2020), Adjusted net national income per capita indicators, https://data.worldbank.org/indicator/NY.ADJ.NNTY.PC.CD, (accessed date month year).
OECD’s Average Annual Wages table. OECD, 2020. Accessed June 2020. https://stats.oecd.org/Index.aspx?DataSetCode=AV_AN_WAGE.
United Nations Economic commission for Europe. UNECE Statistical Database. Accessed May 2020. https://w3.unece.org/PXWeb2015/pxweb/en/STAT/STAT__20-ME__3-MELF/60_en_MECCWagesY_r.px/?rxid=0806c85a-23f8-4249-a4d0-10980df459d1.
Average income around the world. WorldData.info. https://www.worlddata.info/ average-income.php.
IEA.
All
right
s res
erve
d

138 World Energy Outlook 2020 | Special Report
Electricity
Note: Electricity network employment data was compiled from over 260 annual reports of grid operators and grid asset suppliers.
Cambridge Econometrics, (2013), Employment Effects of Selected Scenarios from the Energy roadmap 2050, final report for the European Commission, https://ec.europa.eu/energy/sites/ener/files/documents/2013_report_employment_effects_roadmap_2050_2.pdf.
Council on Energy, Environment and Water, Natural Resources Defense Council and Skill Council for Green Jobs (2019), Powering Jobs Growth with Green Energy, Council Issue Brief, July 2019, https://www.ceew.in/publications/powering-jobs-growth.
Council on Energy, Environment and Water, Natural Resources Defense Council and Skill Council for Green Jobs (2019), Future Skills and Job Creation with Renewable Energy in India: Assessing the Co-Benefits of Decarbonising the Power Sector, COBENEFITS Study, October 2019, https://www.ceew.in/sites/default/files/future.pdf.
GWEC (Global Wind Energy Council), forthcoming.
ESMAP (Energy Sector Management Assistance Program) (2019), Mini-Grids for Half a Billion People: Market Outlook and Handbook for Decision Makers, World Bank, Washington, DC., https://esmap.org/mini_grids_for_half_a_billion_people.
Eurelectric (2013), Power Distribution in Europe, Facts & Figures, https://cdn.eurelectric.org/media/1835/dso_report-web_final-2013-030-0764-01-e-h-D66B0486.pdf.
EurObserv’ER (2019), The State of Renewable Energies in Europe, 19th EurObserv’ER Report, https://www.eurobserv-er.org/19th-annual-overview-barometer/.
European Commission (2019), EU Energy in Figures Statistical Pocketbook 2019, https://ec.europa.eu/energy/data-analysis/energy-statistical-pocketbook_en.
GOGLA (Global Off Grid Lighting Association) (2018), Off-Grid Solar: A Growth Engine for Jobs, https://www.gogla.org/resources/off-grid-solar-a-growth-engine-for-jobs.
GOGLA (2020), Powering Opportunity: Energising Work, Enterprise and Quality of Life with Off-Grid Solar, https://www.gogla.org/resources/powering-opportunity-energising-work-enterprise-and-quality-of-life-with-off-grid-solar.
ILO (International Labour Organisation) (2018), The Transition in Play: Worldwide Employment Trends in the Electricity Sector, https://www.ilo.org/global/ research/publications/working-papers/WCMS_625865/lang--en/index.htm.
IRENA (International Renewable Energy Agency) (2019), Renewable Energy and Jobs Annual Review 2019, https://www.irena.org/-/media/Files/IRENA/Agency/Publication/ 2019/Jun/IRENA_RE_Jobs_2019-report.pdf.
Jenniches, S. (2018), “Assessing the Regional Economic Impacts of Renewable Energy Sources – A Literature Review”, Renewable and Sustainable Energy Reviews, Vol. 93, pp. 35-51, https://doi.org/10.1016/j.rser.2018.05.008.
IEA.
All
right
s res
erve
d

Annex A | Employment calculation methodology 139
A
Juchau, C. and D. Solan (2013), “Employment Estimates in the Energy Sector: Concepts, Methods and Results”, Energy Policy Institute, https://www.researchgate.net/ publication/256064651_Employment_Estimates_in_the_Energy_Sector_Concepts_Methods_and_Results.
Kammen, D. M., K. Kapadia and M. Fripp (2004), Putting Renewables to Work: How Many Jobs can the Clean Energy Industry Generate? Report of the Renewable and Appropriate Energy Laboratory, University of California, Berkeley, http://rael.berkeley.edu/old_drupal/sites/default/files/very-old-site/renewables.jobs.2006.pdf.
Lighting Global, GOGLA, ESMAP (2020), Off-Grid Solar Market Trends Report 2020, Washington, DC, https://www.lightingglobal.org/resource/2020markettrendsreport/.
National Bureau of Statistics of China (2018), China Economic Census Yearbook 2018, State Council 4th Economic Census Leading Group Office, http://data.cnki.net/ area/Yearbook/Single/N2020040370?z=D26.
NREL (US National Renewable Energy Laboratory) (2014), Jobs & Economic Development Impact Models, https://www.nrel.gov/analysis/jedi/models.html.
NEA (Nuclear Energy Agency) and IAEA (International Atomic Energy Agency) (2018), Measuring Employment Generated by Nuclear Power Sector, https://www.oecd-nea.org/ndd/pubs/2018/7204-employment-nps.pdf.
Nuclear Energy Institute (2014), Nuclear Energy’s Economic Benefits – Current and Future, https://workshop1.cases.som.yale.edu/sites/default/files/cases/the_future _of_nuclear_in_connecticut/NEI_Economic%20Benefits%20of%20Nuclear.pdf.
Pembina Institute (2015), British Columbia Clean Energy Jobs Map, Methodology Backgrounder, https://www.pembina.org/pub/british-columbia-clean-energy-jobs-map.
Power for All (2019), Powering Jobs Census 2019: The Energy Access Workforce, https://www.powerforall.org/application/files/8915/6310/7906/Powering-Jobs-Census- 2019.pdf.
Ram, M., A. Aaghahosseini and C. Breyer (2019), “Job Creation during the Global Energy Transition Towards 100% Renewable Power System by 2050”, Technological Forecasting & Social Change, Vol. 151, https://doi.org/10.1016/j.techfore.2019.06.008.
Rutovitz J., E. Dominish, and J. Downes (2015), Calculating Global Energy Sector Jobs: 2015 Methodology, prepared for Greenpeace International by the Institute for Sustainable Futures, University of Technology Sydney, https://opus.lib.uts.edu.au/bitstream/10453/43718/1/Rutovitzetal2015Calculatingglobalenergysectorjobsmethodology.pdf.
Samaras, C. et al. (2011), Characterizing the US Industrial Base for Coal-Powered Electricity, RAND Corporation, https://www.rand.org/pubs/monographs/ MG1147.html.
IEA.
All
right
s res
erve
d
140 World Energy Outlook 2020 | Special Report
Zhang, S. et al. (2017), “Employment Effects of Solar PV Industry in China: A Spreadsheet-based Analytical Model”, Energy Policy, Vol. 109, pp. 59-65, https://doi.org/10.1016/j.rser.2018.05.008.
Teske, S. (ed.) (2019), Achieving the Paris Climate Agreement Goals, https://doi.org/10.1007/978-3-030-05843-2.
The Brattle Group (2015), The Nuclear Industry’s Contribution to the US Economy, prepared for Nuclear Matters, https://brattlefiles.blob.core.windows.net/files/ 5921_the_nuclear_industry's_contribution_to_the_u.s._economy.pdf.
The Solar Foundation (2020), 10th Annual National Solar Jobs Census 2019, https://www.thesolarfoundation.org/solar-jobs-census/.
Wei, M., S. Patadia and D. Kammen (2010), “Putting Renewables and Energy Efficiency to Work: How many Jobs can the Clean Energy Industry Generate in the US?” Energy Policy, Vol. 38, pp. 919-931, https://doi.org/10.1016/j.enpol.2009.10.044.
Transport
New vehicles
ACEA (European Automobile Manufacturers Association) (2019), Employment trends in the EU automotive industry, https://www.acea.be/statistics/article/employment.
Bauer, W., Riedel, O., Hermann, F., Borrmann, D., and Sachs, C. (2018), Perspektiven des Wirtschaftsstandorts Deutschland in Zeiten zunehmender Elektromobilität (The Effects of Vehicle Electrification on Employment in Germany), Fraunhofer Institute for Systems and Innovation Research.
OICA (International Organization of Motor Vehicle Manufacturers) (2020), Employment in the automotive industry, http://www.oica.net/employment-in-the-automotive-industry/.
Soman, A., Ganesan, K. and Kaur, H. (2019), India’s Electric Vehicle Transition: Impact on Auto Industry and Building the EV Ecosystem, Council on Energy, Environment and Water, https://www.ceew.in/publications/india’s-electric-vehicle-transition.
Urban transport infrastructure
Blondiau, T. and van Zeebroeck, B. (2014), European Cyclists’ Federation - Cycling Works – Jobs and Job Creation in the Cycling Economy,
https://ecf.com/sites/ecf.com/files/141125-Cycling-Works-Jobs-and-Job-Creation-in-the-Cycling-Economy.pdf.
Garrett-Peltier H. (2011), Pedestrian and bicycle infrastructure: A national study of employment impacts, Political Economy Research Institute, University of Massachusetts, Amherst.
Grous A. (2011), The British Cycling Economy: Gross cycling product report, London School of Economics, http://eprints.lse.ac.uk/38063/1/BritishCyclingEconomy.pdf.
IEA.
All
right
s res
erve
d

Annex A | Employment calculation methodology 141
A
ITDP (Institute for Transportation & Development Policy) and the University of California, Davis (2015,. A Global High Shift Cycling Scenario: The Potential for Dramatically Increasing Bicycle and E-bike Use in Cities around the World, with Estimated Energy, CO2, and Cost Impacts, https://itdpdotorg.wpengine.com/wp-content/uploads/2015/11/A-Global-High-Shift-Cycling-Scenario_Nov-2015.pdf.
UIC (International Union of Railways) (2017) Analysis of Global Rail Infrastructure Investment, https://uic.org/IMG/pdf/analysis_of_global_rail_infrastructure_investment.pdf.
High speed rail
ARM (Advanced Resource Managers). 2020. HS2 Is Creating Rail Jobs, https://www.arm.co.uk/resources/blog/industry-news/it-may-be-controversial-but-hs2-is-creating-rail-jobs, (Accessed 6 May 2020).
Bloomberg, 2019, California's High-Speed Rail Cost Grows By About $2 Billion, https://www.bloomberg.com/news/articles/2019-05-01/california-s-high-speed-rail-line-cost-grows-by-about-2-billion, (Accessed 5 May 2020).
Economic Times (2017), India's bullet train might create 20,000 employment opportunities, https://economictimes.indiatimes.com/jobs/pm-modis-bullet-train-might-create-20000-employment-opportunities-sbi/articleshow/60516328.cms?from =mdr, (Accessed 8 May 2020).
Frontiers, 2019, The Total Social Costs Of Constructing And Operating A High-Speed Rail Line Using A Case Study Of The Riyadh-Dammam Corridor, Saudi Arabia, https://www.frontiersin.org/files/Articles/449077/fbuil-05-00079-HTML/image_m/ fbuil-05-00079-t005.jpg, (Accessed 11 May 2020).
Global Railway Review, 2019, California High-Speed Railway Project Creates 3,000 Construction Jobs, https://www.globalrailwayreview.com/news/87742/california-high-speed-authority-3000-jobs/, (Accessed 7 May 2020).
In The Black, 2015, Bullet Trains And The Economics Of High-Speed Railways, https://www.intheblack.com/articles/2015/09/01/bullet-trains-and-the-economics-of-high-speed-railways, (Accessed 11 May 2020).
Janic, M. (2016), A multi-dimensional examination of performances of HSR systems, TU Delft, https://doi.org/10.1007/s40534-015-0094-y, (Accessed 8 May 2020).
McCarthy, N., 2019, Infographic: The U.S. Trails The World In High-Speed Rail, Statista Infographics, https://www.statista.com/chart/17093/miles-of-high-speed-rail-track-in-operation-by-country, (Accessed 11 May 2020).
New York Times, 2010, China Sees Growth Engine In A Web Of Fast Trains, https://www.nytimes.com/2010/02/13/business/global/13rail.html?pagewanted=all, (Accessed 11 May 2020).
IEA.
All
right
s res
erve
d

142 World Energy Outlook 2020 | Special Report
Railway Technology, 2020, Tours–Bordeaux High-Speed Rail - Railway Technology,https://www.railway-technology.com/projects/toursbordeaux-high-speed-rail,(Accessed 6 May 2020).
The Star (2018), KL-Singapore High Speed Rail to generate 70,000 jobs, Singapore,https://www.thestar.com.my/business/business-news/2018/05/03/kl-singapore-high-speed-rail-to-generate-70000-jobs, (Accessed 6 May 2020).
UIC (2018), High Speed Rail: Fast Track to Sustainable Mobility,https://uic.org/IMG/pdf/uic_high_speed_2018_ph08_web.pdf, (Accessed 8 May2020).
UIC (Union Internationale des Chemins de Fer) (2020), High speed rail database andmaps, https://uic.org/passenger/highspeed/article/high-speed-database-maps,(Accessed 4 May 2020).
US Government Accountability Office (2009), High Speed Passenger Rail: FutureDevelopment Will Depend on Addressing Financial and Other Challenges andEstablishing a Clear Federal Role, https://books.google.fr/books?id=GoKmHiu35bQC&lpg=PA38&dq=lead%20times%20for%20high%20speed%20rail%20projects&hl=fr&pg=PA38#v=onepage&q=lead%20times%20for%20high%20speed%20rail%20projects&f=false, (Accessed 8 May 2020).
Buildings
Retrofits and new buildings
Anderson, D., Belzer, D. B., Livingston, O. V., and Scott, M. J. (2014), Assessing National Employment Impacts of Investment in Residential and Commercial SectorEnergy Efficiency: Review and Example Analysis (PNNL-23402, 1135715), PacificNorthwest National Laboratory. https://doi.org/10.2172/1135715.
Bell, C., J. Barret and M. McNerney (2015), Verifying Energy Efficiency Job Creation:American Council for an Energy-Efficient Economy, https://www.aceee.org/sites/default/files/publications/researchreports/f1501.pdf.
Booz Allen Hamilton (2015), Green Building Economic Impact Study, U.S. GreenBuilding Council, https://usgbcnj.org/wp-content/uploads/2016/03/Booz_Allen_Economic_Report.pdf.
Bremer Energie Institut, Institut Wohnen und Umwelt and Institut für Statistik derUniversität Bremen (2008), Effekte des CO2-Gebäudesanierungs-programms 2008,(Effects of the CO2 Building Renovation Program 2008).https://www.kfw.de/Download-Center/Konzernthemen/Research/PDF-Dokumente-alle-Evaluationen/Effekte-CO2-Geb%C3%A4udesanierung-2008.pdf.
Cambridge Econometrics (2015), Assessing the Employment and Social Impact ofEnergy Efficiency Vol. 1: Main report, https://ec.europa.eu/energy/sites/ener/files/documents/CE_EE_Jobs_main%2018Nov2015.pdf.
IEA.
All
right
s res
erve
d

Annex A | Employment calculation methodology 143
A
Cambridge Econometrics (2015), Assessing the Employment and Social Impact of Energy Efficiency Vol. 2: Appendices, https://ec.europa.eu/energy/sites/ener/files/ documents/CE_EE_Jobs_appendices%2018Nov2015.pdf.
DNV GL (2015), National evaluation of the state energy program: an evaluation of select activities conducted under the state energy program. Prepared for the US Department of Energy under the supervision of Oak Ridge National Laboratory, https://weatherization.ornl.gov/wp-content/uploads/pdf/SEPEvaluation/ SEPReportVolI.pdf.
Ehrhardt-Martinez, K. and J. Laitner (2008), The Size of the US Energy Efficiency Market, American Council for an Energy-Efficient Economy, https://www.aceee.org/sites/default/files/publications/researchreports/E083.pdf
Garrett-Peltier, H. (2011), Employment Estimates for Energy Efficiency Retrofits of Commercial Buildings, Political Economy Research Institute, University of Massachusetts, https://www.researchgate.net/publication/254455011_Employment_ Estimates_for_Energy_Efficiency_Retrofits_of_Commercial_Buildings.
Janssen, R. and D. Staniaszek (2012), How Many Jobs? A Survey of the Employment Effects of Investment in Energy Efficiency of Buildings, The Energy Efficiency Industrial Forum, https://euroace.org/wp-content/uploads/2016/10/2012-How-Many-Jobs.pdf.
Mitsidi Projetos (2019), Potencial de empregos gerados na área de Eficiência Energética no Brasil de 2018 até 2030, (Energy efficiency job creation potential in Brazil: 2018 to 2030), http://www.abrinstal.org.br/docs/empregos_mme.pdf.
Pollin, R., J. Heintz and H. Garrett-Peltier (2009), The Economic Benefits of Investing in Clean Energy, https://www.peri.umass.edu/fileadmin/pdf/other_publication_types/ green_economics/economic_benefits/economic_benefits.PDF.
Saheb, Y. (2016), Energy Transition of the EU Building Stock, https://www.openexp.eu/sites/default/files/publication/files/Reports/energy_transition_of_the_eu_building_stock_full_report.pdf.
Scheer, J. and B. Motherway (2011), Economic Analysis of Residential and Small-Business Energy Efficiency Improvements, Sustainable Energy Authority of Ireland, https://www.seai.ie/publications/Economic-Analysis-of-Residential-and-Small-Business-Energy-Efficiency-Improvements.pdf.
Tonn, B., Carroll, D., Rose, E. M., Hawkins, B. A., Pigg, S., Dalhoff, G., Blasnik, M., Eisenberg, J. F., Cowan, C., and Conlon, B. (2015), Weatherization Works II: Summary of Findings from the ARRA Period Evaluation of the US Department of Energy’s Weatherization Assistance Program, https://doi.org/10.2172/1223654.
Appliances
New Jersey Government (2009), State Energy Efficient Appliance Rebate Program Plan Narrative, https://www.nj.gov/bpu/pdf/announcements/EEARP.pdf.
IEA.
All
right
s res
erve
d

144 World Energy Outlook 2020 | Special Report
Office of Economic Opportunity, Virgin Islands Public Finance Authority (2012), Project-Energy Efficient Appliance Rebate Program, http://oeo.usvipfa.com/Home/ ProjectDetails/174.
Talan, R. (2018), Beyond Energy Savings: The Multiple Benefits of Mexico’s Household Appliances Phase-out Scheme, https://iea.blob.core.windows.net/assets/imports/ events/211/Day1_3RT.pdf.
Clean cooking
Budya H. and M. Y. Arofat (2011), “Providing cleaner energy access in Indonesia through the megaproject of kerosene conversion to LPG”, Energy Policy Vol. 39, pp. 7575–7586.
GLPGP (Global LPG Partnership) (2018), National Feasibility Assessment: LPG for Clean Cooking in Ghana, New York, http://glpgp.org/s/GLPGP-Clean-Cooking-for-Africa-Ghana-National-Assessment-2018.pdf.
GLPGP (2019), National Feasibility Assessment: LPG for Clean Cooking in Cameroon, New York, http://glpgp.org/s/GLPGP-Clean-Cooking-for-Africa-Cameroon-National-Assessment-2019.pdf.
GLPGP (2019), National Feasibility Assessment: LPG for Clean Cooking in Kenya, New York, http://glpgp.org/s/GLPGP-Clean-Cooking-for-Africa-Kenya-National-Assessment-2019.pdf.
IRENA (International Renewable Energy Agency) (2019), Renewable Energy and Jobs Annual Review 2019, https://www.irena.org/-/media/Files/IRENA/Agency/Publication/ 2019/Jun/IRENA_RE_Jobs_2019-report.pdf.
Lee, C.-J., R. Shirley, M. Otieno and H. Nyambura (year), Powering Jobs: The Employment Footprint of Clean Cooking Solutions in Kenya, Working Paper.
Lucon, O., S. T. Coelho and J. Goldemberg (2004), LPG in Brazil: lessons and challenges. São Paulo State Environmental Secretariat, São Paulo.
Industry
Industry efficiency
Cambridge Econometrics (2015), Assessing the Employment and Social Impact of Energy Efficiency Volume 1: Main report, https://ec.europa.eu/energy/sites/ener/ files/documents/CE_EE_Jobs_main%2018Nov2015.pdf.
Cambridge Econometrics (2015), Assessing the Employment and Social Impact of Energy Efficiency Volume 2: Appendices, https://ec.europa.eu/energy/sites/ener/ files/documents/CE_EE_Jobs_appendices%2018Nov2015.pdf.
EHPA (European Heat Pump Association (2018), Market Data, https://www.ehpa.org/market-data/.
IEA.
All
right
s res
erve
d

Annex A | Employment calculation methodology 145
A
EHPA (2018), Heat Pumps - Integrating technologies to decarbonise heating and cooling, .
European Commission (2019), Competitiveness of the heating and cooling industry and services, https://op.europa.eu/en/publication-detail/-/publication/b23af898-c48e-11e9-9d01-01aa75ed71a1/language-en.
Ehrhardt-Martinez, K. and J. Laitner (2008), The Size of the US Energy Efficiency Market, American Council for an Energy-Efficient Economy, https://www.aceee.org/sites/default/files/publications/researchreports/E083.pdf
Institute for Sustainable Futures (2009), Energy Sector Jobs to 2030: A Global Analysis, https://opus.lib.uts.edu.au/bitstream/10453/35047/1/rutovitzatherton2009greenjobs.pdf.
Recycling
Denison, R. A. and J. Ruston (1990), Recycling and Incineration – Evaluating the Choices, Island Press, Washington DC.
Marques, R. and N. da Cruz (2016), Recycling and Extended Producer Responsibility: The European Experience, Routledge, London and New York.
NRDC (Natural Resources Defense Council) (2014), From Waste to Jobs: What Achieving 75 Percent Recycling Means for California, https://www.nrdc.org/ sites/default/files/green-jobs-ca-recycling-report.pdf.
RDC-Environment and Pira International (2003), Evaluation of costs and benefits for the achievement of reuse and recycling targets for the different packaging materials in the frame of the packaging and packaging waste directive 94/62/EC, https://ec.europa.eu/environment/waste/studies/packaging/costsbenefitsannexes1_7.pdf.
US EPA (US Environmental Protection Agency) (2016), Collection Costs, https://archive.epa.gov/wastes/conserve/tools/localgov/web/html/collection.html.
Fuels
Oil and gas
China Academic Journal Electronic Publishing House (2020), “Urban units employment and total wages by sector 2017”, http://www.cnki.net.
Energy Futures Initiative and National Association of State Energy Officials (NASEO) (2020), 2020 US Energy and Employment Report (USEER). NASEO and EFI. Washington, DC. https://static1.squarespace.com/static/5a98cf80ec4eb7c5cd928c61/t/ 5e78b3c756e8367abbd47ab0/1584968660321/USEER+2020+0323.pdf.
European Commission, (2020) Eurostat 2019 Employment Report,. https://ec.europa.eu/eurostat/documents/3217494/5706635/KS-BW-09-001-02-EN.PDF/ddbbf39f-c03c-40d9-a1a2-f7f6d28d61d9, (accessed 5 June 2020).
IEA.
All
right
s res
erve
d

146 World Energy Outlook 2020 | Special Report
IBIS World (2019) Gas Stations Industry in China - Market Research Report, https://www.ibisworld.com/china/market-research-reports/gas-stations-industry/#:~:text=There%20are%20about%20101%2C104%20gas,government%20price%20controls%20on%20fuel.
ILO (International Labour Organization) (2020), Oil and Gas Production, https://www.ilo.org/inform/online-information-resources/research-guides/economic-and-social-sectors/energy-mining/oil-gas-production/lang--en/index.htm, (accessed 5 June 2020).
Ministry of Petroleum and Natural Gas (India), Indian Petroleum & Natural Gas Statistics 2017-2018, Economic & Statistics Division, http://petroleum.nic.in/ sites/default/files/ipngstat_0.pdf.
US Bureau of Labor Statistics (2019), Oil and Gas Extraction: North American Industry Classification System (NAICS) Code 211 https://www.bls.gov/iag/tgs/iag211.htm.
We relied on the annual reports from the following companies: Abu Dhabi National Oil Co., Apache, Bashneft, BHP Billiton, BP, Canadian Natural Resources, Chesapeake, Chevron, Cimarex, CNPC, CNOOC, Concho, ConocoPhillips, Continental Resources, Devon Energy Corp, Ecopetrol SA, Egyptian General Petroleum Corp., EnCana, Eni, EOG Resources, ExxonMobil, Freeport-McMoRan, Galp, Gazprom, Gazprom Neft, Hess Corp, Husky Energy Inc., Imperial Oil, Inpex, KazMunaiGas EP, KNOC, Kuwait Oil Company, Lukoil, Marathon, MOL Group, Murphy Oil Corp, National Iranian Oil Corporation, National Oil Corporation (Libya), Nexen, Nigerian National Petroleum Corp., Noble Energy, North Oil Company, Novatek, Occidental, OGDCL (Pakistan), OMV, ONGC (India), PDVSA, Pemex, Pertamina, Petro SA, Petrobras, Petrochina, Petroecuador, Petroleum Development Oman, Petronas, PetroVietnam, Pioneer Natural Resources, PTT Exploration & Production (Thai), Qatar Petroleum Company, Repsol, Rosneft, Royal Dutch Shell, Santos Ltd., Sasol Ltd (South Africa), Saudi Aramco, Sinopec, Socar, Sonangol, Sonatrach, Statoil, Suncor Energy Inc., Surgutneftegas, Total, Tullow, Uzbekneftegas, Williams Cos, Wintershall Holding, Woodside Petroleum, YPF, China National Petroleum Corporation, Valero Energy, National Iranian Oil Company, JX Holdings, Phillips66, China National Offshore Oil, Engie, Indian Oil Corporation, Reliance Industries, GS Caltex, Enterprise Products, Idemitsu Kosan, Bharat Petroleum, Hindustan Petroleum, PKN Orlen, Halliburton, Schlumberger, Hellenic Petroleum, Centrica, Motor Oil Hellas, CEPSA, Baker Hughes Company, FMC Technologies, US Weatherford LP, Now Inc., Iri International Corporation, Apergy Corportion, Shandong Kerui Petroleum Equipment, Technipfmc, Weatherford International.
Methane abatement
Datu Research (2014), The Emerging Methane Reduction Industry in the United States, Environmental Defense Fund. https://www.edf.org/sites/default/files/ us_methane_mitigation_industry_report.pdf.
IEA (International Energy Agency) (2020), Methane Tracker 2020, https://www.iea.org/reports/methane-tracker-2020.
IEA.
All
right
s res
erve
d

Annex A | Employment calculation methodology 147
A
US Census Bureau (2020), Annual Survey of Manufacturers -2018 data, https://www.census.gov/programs-surveys/asm.html.
Biofuels
ICA (International Civil Aviation Organization) (2019), Carbon Offsetting and Reduction Scheme for International Aviation (CORSIA) Default Life Cycle Emissions Values for CORSIA Eligible Fuels, https://www.icao.int/environmental-protection/CORSIA/ Documents/ICAO%20document%2006%20-%20Default%20Life%20Cycle%20Emissions .pdf.
IRENA (International Renewable Energy Agency) (2019), Renewable Energy and Jobs Annual Review 2019, https://www.irena.org/-/media/Files/IRENA/Agency/Publication/ 2019/Jun/IRENA_RE_Jobs_2019-report.pdf.
US Census Bureau (2018), Annual Survey of Manufacturers - 2018 data, https://www.census.gov/programs-surveys/asm.html.
US Department of Labor Statistics (2020), Careers in Biofuels, https://www.bls.gov/green/biofuels/biofuels.htm, (accessed May 2020).
Coal mining
Australian Bureau of Statistics (2020), Labour Account Australia, Annual Balanced: Subdivision, Division and Total All Industries (database), http://stat.data.abs.gov.au/Index.aspx?DatasetCode=ABS_LABOUR_ACCT#, (accessed 2 June 2020).
China Academic Journal Electronic Publishing House (2020). “Urban units employment and total wages by sector (2017)”, http://www.cnki.net.
European Commission (2018), EU coal regions: opportunities and challenges ahead, https://ec.europa.eu/jrc/en/publication/eur-scientific-and-technical-research-reports/eu-coal-regions-opportunities-and-challenges-ahead.
Mining Review Africa (2018), South Africa’s coal sector headed for major job losses, 2 November 2018, https://www.miningreview.com/news/coal-job-losses/.
Minerals Council South Africa (2020), Facts and Figures 2019 Pocketbook, https://www.mineralscouncil.org.za/industry-news/publications/facts-and-figures.
NASEO and EFI (National Association of State Energy Officials and Energy Futures Initiative) (2019), US Energy and Employment Report 2019, https://static1.squarespace.com/static/5a98cf80ec4eb7c5cd928c61/t/5c7f3708fa0d6036d7120d8f/1551849054549/USEER+2019+US+Energy+Employment+Report.pdf.
Pai, S., Zerriffi, H., Jewell, J. & Pathak, J. (2020), “Solar has greater techno-economic resource suitability than wind for replacing coal mining jobs”, Environmental Research Letters, Vol. 15, No. 3, https://iopscience.iop.org/article/10.1088/1748-9326/ab6c6d.
Samarina, V., Skufina, T., Samarin, A. & Ushakov, D. (2019), Modern conditions and prospects of Russia’s coal mining industry development, Revista Espacios, Vol. 40, No. 16, http://www.revistaespacios.com/a19v40n16/a19v40n16p06.pdf.
IEA.
All
right
s res
erve
d

148 World Energy Outlook 2020 | Special Report
Stockholm Environment Institute (2018), Contemporary coal dynamics in Indonesia, SEI working paper 2018-04, https://www.sei.org/wp-content/uploads/2018/06/ contemporary-coal-dynamics-in-indonesia.pdf.
US Bureau of Labor Statistics (2020), Employment, Hours, and Earnings from the Current Employment Statistics Survey (National) (database), https://data.bls.gov/ timeseries/CES1021210001, (accessed 2 June 2020).
Innovation
Batteries
ACEA (European Automobile Manufacturers Association) (2019), Employment trends in the EU automotive industry, https://www.acea.be/statistics/article/employment.
Bauer, W., Riedel, O., Hermann, F., Borrmann, D., and Sachs, C. (2018), Perspektiven des Wirtschaftsstandorts Deutschland in Zeiten zunehmender Elektromobilität (The Effects of Vehicle Electrification on Employment in Germany), Fraunhofer Institute for Systems and Innovation Research.
Benchmark Mineral Intelligence (2019), EV Battery Arms Race Enters New Gear with 115 Megafactories, Europe sees most rapid growth, https://www.benchmarkminerals.com/ev-battery-arms-race-enters-new-gear-with-115-megafactories-europe-sees-most-rapid-growth/.
The Faraday Institution (2020), UK electric vehicle and battery production potential to 2040, https://faraday.ac.uk/wp-content/uploads/2020/03/2040_Gigafactory _Report_FINAL.pdf.
IEA (International Energy Agency) (2017), Energy Technology Perspectives 2017, Paris.
Steen, M., Lebedeva, N., Di Persio, F., Brett L. (2017), EU Competitiveness in Advanced Li-ion Batteries for E-Mobility and Stationary Storage Applications – Opportunities and Actions, EUR 28837 EN, Publications Office of the European Union, ISBN 978-92-79-74292-7, doi:10.2760/75757, JRC108043.
Transport and Environment (2019), Electric surge: Carmakers‘ electric car plans across Europe 2019-2025. https://www.transportenvironment.org/sites/te/files/ publications/2019_07_TE_electric_cars_report_final.pdf.
US Census Bureau (2020), Annual Survey of Manufacturers: 2018 data, https://www.census.gov/programs-surveys/asm.html.
Hydrogen
H2FC Supergen: The Hydrogen and fuel cell research hub. (2017) The Economic Impact of Hydrogen and Fuel Cells in the UK. 2017. https://strathprints.strath.ac.uk/60503/1/Alabi_Turner_2017_employment.pdf.
IEA (International Energy Agency) (2017), Energy Technology Perspectives 2017, Paris.
IEA.
All
right
s res
erve
d

Annex A | Employment calculation methodology 149
A
Karen Turner, O. Alabi, M. Smith, J. Irvine, P. Dodds. (2018) Framing policy on low emissions vehicles in terms of economic gains: Might the most straightforward gain be delivered by supply chain activity to support refuelling? Energy Policy 119. https://pure.strath.ac.uk/ws/portalfiles/portal/81032437/Turner_etal_EP_2018_Framing_policy_on_low_emissions_vehicles_in_terms_of_economic_gains.pdf.
McKinsey and Company. (2017) Hydrogen: The next wave for electric vehicles? https://www.mckinsey.com/industries/automotive-and-assembly/our-insights/hydrogen-the-next-wave-for-electric-vehicles#.
US Department of Energy (2008), Effects of a Transition to a Hydrogen Economy on Employment in the United States, Report to Congress,. https://www.hydrogen.energy.gov/pdfs/epact1820_employment_study.pdf.
Carbon capture, utilisation and storage
Carbon Capture & Sequestration Technologies Group at MiT (2016), Boundary Dam Fact Sheet: Carbon Dioxide Capture and Storage Project, Massachusetts Institute of Technology, https://sequestration.mit.edu/tools/projects/boundary_dam.html.
The Carbon Capture and Storage Association and the Trades Union Congress (2014), Carbon capture storage technology will reduce bills and create jobs, Carbon Capture and Storage Association, https://www.tuc.org.uk/news/carbon-capture-storage-technology-will-reduce-bills-and-create-jobs
IEA (International Energy Agency) (2017), Energy Technology Perspectives 2017, Paris.
Orion Innovations (UK) Ltd. (2013), The Economic Benefits of Carbon Capture and Storage in the UK, The Trades Union Congress and Carbon Capture and Storage Association, https://www.tuc.org.uk/sites/default/files/carboncapturebenefits.pdf.
IEA.
All
right
s res
erve
d

IEA.
All
right
s res
erve
d

Annex B | Definitions 151
Annex B
Definitions This annex provides general information on terminology used throughout this report including: units and general conversion factors; definitions of fuels, processes and sectors; regional and country groupings; and abbreviations and acronyms.
Units Emissions Gt CO2-eq gigatonnes of carbon-dioxide equivalent (using 100-year global
warming potentials for different greenhouse gases) kg CO2-eq kilogrammes of carbon-dioxide equivalent g CO2/km grammes of carbon dioxide per kilometre g CO2/kWh grammes of carbon dioxide per kilowatt-hour
Energy boe barrel of oil equivalent toe tonne of oil equivalent ktoe thousand tonnes of oil equivalent Mtoe million tonnes of oil equivalent MBtu million British thermal units kWh kilowatt-hour MWh megawatt-hour GWh gigawatt-hour TWh terawatt-hour
Gas bcm billion cubic metres Mass kg kilogramme (1 000 kg = 1 tonne) kt kilotonnes (1 tonne x 103) Mt million tonnes (1 tonne x 106) Gt gigatonnes (1 tonne x 109)
Monetary $ million 1 US dollar x 106 $ billion 1 US dollar x 109 $ trillion 1 US dollar x 1012
Oil b/d barrels per day kb/d thousand barrels per day mb/d million barrels per day mboe/d million barrels of oil equivalent per day
Power W watt (1 joule per second) kW kilowatt (1 watt x 103) MW megawatt (1 watt x 106) GW gigawatt (1 watt x 109) TW terawatt (1 watt x 1012)
IEA.
All
right
s res
erve
d

152 World Energy Outlook 2020 | Special Report
General conversion factors for energy Convert to: TJ Gcal Mtoe MBtu GWh
From: multiply by:
TJ 1 238.8 2.388 x 10⁻⁵ 947.8 0.2778
Gcal 4.1868 x 10⁻³ 1 10-7 3.968 1.163 x 10⁻³
Mtoe 4.1868 x 10⁴ 107 1 3.968 x 10⁷ 11 630
MBtu 1.0551 x 10⁻³ 0.252 2.52 x 10⁻⁸ 1 2.931 x 10⁻⁴
GWh 3.6 860 8.6 x 10⁻⁵ 3 412 1
Note: There is no generally accepted definition of barrel of oil equivalent (boe); typically the conversion factors used vary from 7.15 to 7.40 boe per toe.
Currency conversion rates
We utilized the International Monetary Fund’s exchange rate archives1 by month to adjust stated currencies from the original currency into US dollars for the year the number was cited from. From there, we updated those figures to 2019 US dollars.
Definitions Abatement cost: Cost or savings associated with reducing greenhouse gas (GHG) emissions by one tonne of carbon-dioxide equivalent (CO2-eq). Based on the lifetime cost of deploying the measure and the savings that would be accrued to the consumer, discounted to the present, divided by cumulative CO2-eq emissions savings over the measure’s lifetime.
Advanced biofuels: Sustainable fuels produced from non-food crop feedstocks, which are capable of delivering significant lifecycle GHG emissions savings compared with fossil fuel alternatives, and which do not directly compete with food and feed crops for agricultural land or cause adverse sustainability impacts. This definition differs from the one used for “advanced biofuels” in US legislation, which is based on a minimum 50% lifecycle GHG reduction and which, therefore, includes sugar cane ethanol.
Back-up generation capacity: Households and businesses connected to the main power grid may also have some form of “back-up” power generation capacity that can, in the event of disruption, provide electricity. Back-up generators are typically fuelled with diesel or gasoline and capacity can be as little as a few kilowatts. Such capacity is distinct from mini-grid and off-grid systems that are not connected to the main power grid.
Biodiesel: Diesel-equivalent, processed fuel made from the transesterification (a chemical process that converts triglycerides in oils) of vegetable oils and animal fats.
Bioenergy: Energy content in solid, liquid and gaseous products derived from biomass feedstocks and biogas. It includes solid biomass, biofuels and biogas.
1 https://www.imf.org/external/np/fin/data/param_rms_mth.aspx.
IEA.
All
right
s res
erve
d

Annex B | Definitions 153
B
Biofuels: Liquid fuels derived from biomass or waste feedstocks and include ethanol and biodiesel. They can be classified as conventional and advanced biofuels according to the feedstocks and technologies used to produce them. Unless otherwise stated, biofuels are expressed in energy-equivalent volumes of gasoline and diesel.
Biogas: A mixture of methane, CO₂ and small quantities of other gases produced by anaerobic digestion of organic matter in an oxygen-free environment.
Buildings: The buildings sector includes energy used in residential, commercial and institutional buildings and non-specified other. Building energy use includes space heating and cooling, water heating, lighting, appliances and cooking equipment.
Bunkers: Includes both international marine bunkers and international aviation bunkers.
Capacity credit: Proportion of the capacity that can be reliably expected to generate electricity during times of peak demand for the grid to which it is connected.
Clean cooking facilities: Cooking facilities that are considered safer, more efficient and more environmentally sustainable than the traditional facilities that make use of solid biomass (such as a three-stone fire). This refers primarily to improved solid biomass cookstoves, biogas systems, liquefied petroleum gas stoves, ethanol and solar stoves.
Coal: Includes both primary coal (including lignite, coking and steam coal) and derived fuels (including patent fuel, brown-coal briquettes, coke-oven coke, gas coke, gas-works gas, coke-oven gas, blast-furnace gas and oxygen steel furnace gas). Peat is also included.
Concessional loans: Loans whose terms are substantially more generous than market loans, either by providing interest rates below those available on the market or by providing grace periods.
Cost savings re-spend jobs: Jobs created by reduced customer energy costs being spent elsewhere in an economy. These jobs can also be negative, for example, if the cost of energy were to rise for consumers in the wider economy, leading to a reduction in spending in other parts of an economy.
Construction: Jobs installing, constructing and commissioning energy projects.
Conventional biofuels: Fuels produced from food crop feedstocks. These biofuels are commonly referred to as first-generation and include sugar cane ethanol, starch-based ethanol, fatty acid methyl esther (FAME) and straight vegetable oil (SVO).
Decommissioning (nuclear): The process of dismantling and decontaminating a nuclear power plant at the end of its operational lifetime and restoring the site for other uses.
Demand-side integration: Consists of two types of measures: actions that influence load shape such as energy efficiency and electrification; and actions that manage load such as demand-side response measures.
Demand-side response: Describes actions which can influence the load profile such as shifting the load curve in time without affecting the total electricity demand, or load shedding such as interrupting demand for short duration or adjusting the intensity of demand for a certain amount of time.
IEA.
All
right
s res
erve
d

154 World Energy Outlook 2020 | Special Report
Direct jobs: Jobs created to deliver a final project or product.
Dispatchable: Dispatchable generation refers to technologies whose power output can be readily controlled - increased to maximum rated capacity or decreased to zero - in order to match supply with demand.
Electricity demand: Defined as total gross electricity generation less own-use generation, plus net trade (imports less exports), less transmissions and distribution losses.
Electricity generation: Defined as the total amount of electricity generated by power only or combined heat and power plants including generation required for own-use. This is also referred to as gross generation.
Employment multiplier: The number of jobs created per million US dollars capital investment or spent on final product.
Energy sector CO2 emissions: CO2 emissions from fuel combustion (excluding non-renewable waste). Note that this does not include fugitive emissions from fuels, CO2 transport, storage emissions or industrial process emissions.
Energy sector GHG emissions: CO2 emissions from fuel combustion plus fugitive and vented methane and nitrogen dioxide emissions from the energy and industry sectors.
Energy services: See useful energy.
Ethanol: Refers to bio-ethanol only. Ethanol is produced from fermenting any biomass high in carbohydrates. Today, ethanol is made from starches and sugars, but second-generation technologies will allow it to be made from cellulose and hemicellulose, the fibrous material that makes up the bulk of most plant matter.
Fiscal consolidation: Reducing government deficits and debt accumulation.
Full-time employment (FTE) job: A job that represents the work of one person for one year at regulated norms, for example 40 hours a week for 52 weeks a year, excluding holidays.
Heat (end-use): Can be obtained from the combustion of fossil or renewable fuels, direct geothermal or solar heat systems, exothermic chemical processes and electricity (through resistance heating or heat pumps which can extract it from ambient air and liquids). This category refers to the wide range of end-uses, including space and water heating, and cooking in buildings, desalination and process applications in industry. It does not include cooling applications.
Heat (supply): Obtained from the combustion of fuels, nuclear reactors, geothermal resources and the capture of sunlight. It may be used for heating or cooling, or converted into mechanical energy for transport or electricity generation. Commercial heat sold is reported under total final consumption with the fuel inputs allocated under power generation.
Hydropower: The energy content of the electricity produced in hydropower plants, assuming 100% efficiency. It excludes output from pumped storage and marine (tide and wave) plants.
IEA.
All
right
s res
erve
d
Annex B | Definitions 155
B
Indirect jobs: Supply chain jobs created to provide inputs to a final project or product.
Induced jobs: Jobs created by wages earned from projects and spent in other parts of the economy, thereby creating additional jobs.
Industry: The sector includes fuel used within the manufacturing and construction industries. Key industry branches include iron and steel, chemical and petrochemical, cement, and pulp and paper. Use by industries for the transformation of energy into another form or for the production of fuels is excluded and reported separately under other energy sector. Consumption of fuels for the transport of goods is reported as part of the transport sector, while consumption by off-road vehicles is reported under industry.
Investment: All investment data and projections reflect spending across the lifecycle of a project, i.e. the capital spent is assigned to the year when it is incurred. Investments for oil, gas and coal include production, transformation and transportation; those for the power sector include refurbishments, uprates, new builds and replacements for all fuels and technologies for on-grid, mini-grid and off-grid generation, as well as investment in transmission and distribution, and battery storage. Investment data are presented in real terms in year-2019 US dollars unless otherwise stated.
Job-years: One full-time employment job for one year.
Liquidity support: Providing individuals, firms or institutions lending or grants in order for a solvent institution to make agreed-upon payments in a timely fashion.
Liquids: Refers to the combined use of oil and biofuels (expressed in energy-equivalent volumes of gasoline and diesel).
Manufacturing: Jobs producing direct inputs to an energy project.
Mini-grids: Small grid systems linking a number of households or other consumers.
Modern energy access: Includes household access to a minimum level of electricity; household access to safer and more sustainable cooking and heating fuels and stoves; access that enables productive economic activity; and access for public services.
Modern renewables: Includes all uses of renewable energy with the exception of traditional use of solid biomass.
Modern use of solid biomass: Refers to the use of solid biomass in improved cookstoves and modern technologies using processed biomass such as pellets.
Natural gas: Comprises gases occurring in deposits, whether liquefied or gaseous, consisting mainly of methane. It includes both “non-associated” gas originating from fields producing hydrocarbons only in gaseous form, and “associated” gas produced in association with crude oil as well as methane recovered from coal mines (colliery gas). Natural gas liquids, manufactured gas (produced from municipal or industrial waste, or sewage) and quantities vented or flared are not included. Gas data in cubic metres are expressed on a “gross” calorific value basis and are measured at 15 °C and at 760 mm Hg (“Standard Conditions”). Gas data expressed in tonnes of oil equivalent, mainly for comparison reasons with other fuels, are on a “net” calorific basis. The difference between
IEA.
All
right
s res
erve
d

156 World Energy Outlook 2020 | Special Report
the net and the gross calorific value is the latent heat of vaporisation of the water vapour produced during combustion of the fuel (for gas the net calorific value is 10% lower than the gross calorific value).
Natural gas liquids (NGLs): Liquid or liquefied hydrocarbons produced in the manufacture, purification and stabilisation of natural gas. These are those portions of natural gas which are recovered as liquids in separators, field facilities or gas processing plants. NGLs include but are not limited to ethane (when it is removed from the natural gas stream), propane, butane, pentane, natural gasoline and condensates.
Non-energy use: Fuels used for chemical feedstocks and non-energy products. Examples of non-energy products include lubricants, paraffin waxes, asphalt, bitumen, coal tars and oils as timber preservatives.
Nuclear: Refers to the primary energy-equivalent of the electricity produced by a nuclear plant, assuming an average conversion efficiency of 33%.
Off-grid systems: Stand-alone systems for individual households or groups of consumers.
Offshore wind: Refers to electricity produced by wind turbines that are installed in open water, usually in the ocean.
Oil: Oil production includes both conventional and unconventional oil. Petroleum products include refinery gas, ethane, liquid petroleum gas, aviation gasoline, motor gasoline, jet fuels, kerosene, gas/diesel oil, heavy fuel oil, naphtha, white spirit, lubricants, bitumen, paraffin, waxes and petroleum coke.
Oil field services: Firms that provide services to the petroleum exploration and production industry but do not typically produce petroleum.
Operations and maintenance (O&M) and management: All ongoing jobs required to support the proper operation of an energy project.
Other energy sector: Covers the use of energy by transformation industries and the energy losses in converting primary energy into a form that can be used in the final consuming sectors. It includes losses by gas works, petroleum refineries, blast furnaces, coke ovens, coal and gas transformation and liquefaction. It also includes energy own-use in coal mines, in oil and gas extraction and in electricity and heat production. Transfers and statistical differences are also included in this category.
Payback period: The amount of time it takes to recover the cost of an investment.
Power generation: Refers to fuel use in electricity plants, heat plants and combined heat and power (CHP) plants. Both main activity producer plants and small plants that produce fuel for their own-use (auto-producers) are included.
Remittance flows: Money sent by migrant workers back to their home countries
Renewables: Includes bioenergy, geothermal, hydropower, solar photovoltaic (PV), concentrating solar power (CSP), wind and marine (tide and wave) energy for electricity and heat generation.
IEA.
All
right
s res
erve
d

Annex B | Definitions 157
B
Residential sector: Energy used by households including space heating and cooling, water heating, lighting, appliances, electronic devices and cooking equipment.
Self-sufficiency: Corresponds to indigenous production divided by total primary energy demand.
Services sector: Energy used in commercial (e.g. hotels, offices, catering, shops) and institutional buildings (e.g. schools, hospitals, offices). Energy use in the services sector includes space heating and cooling, water heating, lighting, equipment, appliances and cooking equipment.
Shale gas: Natural gas contained within a commonly occurring rock classified as shale. Shale formations are characterised by low permeability, with more limited ability of gas to flow through the rock than is the case with a conventional reservoir. Shale gas is generally produced using hydraulic fracturing.
Solid biomass: Includes charcoal, fuelwood, dung, agricultural residues, wood waste and other solid wastes.
Take-out financing: Long-term financing, typically to replace initial lending terms, that a lender promises to provide at a particular future date or when particular criteria for completion of a project are met.
Total final consumption (TFC): Is the sum of consumption by the various end-use sectors. TFC is broken down into energy demand in the following sectors: industry (including manufacturing and mining), transport, buildings (including residential and services) and other (including agriculture and non-energy use). It excludes international marine and aviation bunkers, except at world level where it is included in the transport sector.
Total final energy consumption (TFEC): Is a variable defined primarily for tracking progress towards target 7.2 of the Sustainable Development Goals. It incorporates total final consumption by end-use sectors but excludes non-energy use. It excludes international marine and aviation bunkers, except at world level. Typically this is used in the context of calculating the renewable energy share in total final energy consumption (Indicator 7.2.1 of the Sustainable Development Goals), where TFEC is the denominator.
Total primary energy demand (TPED): Represents domestic demand only and is broken down into power generation, other energy sector and total final consumption.
Traditional use of solid biomass: Refers to the use of solid biomass with basic technologies, such as a three-stone fire, often with no or poorly operating chimneys.
Transport: Fuels and electricity used in the transport of goods or persons within the national territory irrespective of the economic sector within which the activity occurs. This includes fuel and electricity delivered to vehicles using public roads or for use in rail vehicles; fuel delivered to vessels for domestic navigation; fuel delivered to aircraft for domestic aviation; and energy consumed in the delivery of fuels through pipelines. Fuel delivered to international marine and aviation bunkers is presented only at the world level and is excluded from the transport sector at a domestic level.
IEA.
All
right
s res
erve
d

158 World Energy Outlook 2020 | Special Report
Useful energy: Refers to the energy that is available to end-users to satisfy their needs. This is also referred to as energy services demand. As result of transformation losses at the point of use, the amount of useful energy is lower than the corresponding final energy demand for most technologies. Equipment using electricity often has higher conversion efficiency than equipment using other fuels, meaning that for a unit of energy consumed electricity can provide more energy services.
Variable renewable energy (VRE): Refers to technologies whose maximum output at any time depends on the availability of fluctuating renewable energy resources. VRE includes a broad array of technologies such as wind power, solar PV, run-of-river hydro, concentrating solar power (where no thermal storage is included) and marine (tidal and wave).
Waste storage and disposal: Activities related to the management of radioactive nuclear waste. Storage refers to temporary facilities at the nuclear power plant site or a centralised site. Disposal refers to permanent facilities for the long-term isolation of high-level waste, such as deep geologic repositories.
Regional and country groupings Advanced economies: OECD regional grouping and Bulgaria, Croatia, Cyprus1,2, Malta and Romania.
Africa: North Africa and sub-Saharan Africa regional groupings.
Asia Pacific: Southeast Asia regional grouping and Australia, Bangladesh, China, India, Japan, Korea, Democratic People’s Republic of Korea, Mongolia, Nepal, New Zealand, Pakistan, Sri Lanka, Chinese Taipei and other Asia Pacific countries and territories.3
Caspian: Armenia, Azerbaijan, Georgia, Kazakhstan, Kyrgyzstan, Tajikistan, Turkmenistan and Uzbekistan.
Central and South America: Argentina, Plurinational State of Bolivia (Bolivia), Brazil, Chile, Colombia, Costa Rica, Cuba, Curaçao, Dominican Republic, Ecuador, El Salvador, Guatemala, Haiti, Honduras, Jamaica, Nicaragua, Panama, Paraguay, Peru, Suriname, Trinidad and Tobago, Uruguay, Bolivarian Republic of Venezuela (Venezuela), and other Central and South American countries and territories.4
China: Includes the (People's Republic of) China and Hong Kong, China.
Eurasia: Caspian regional grouping and the Russian Federation (Russia).
Europe: European Union regional grouping and Albania, Belarus, Bosnia and Herzegovina, North Macedonia, Gibraltar, Iceland, Israel5, Kosovo, Montenegro, Norway, Serbia, Switzerland, Republic of Moldova, Turkey and Ukraine.
European Union: Austria, Belgium, Bulgaria, Croatia, Cyprus1,2, Czech Republic, Denmark, Estonia, Finland, France, Germany, Greece, Hungary, Ireland, Italy, Latvia, Lithuania, Luxembourg, Malta, Netherlands, Poland, Portugal, Romania, Slovak Republic, Slovenia, Spain, Sweden and United Kingdom.
IEA.
All
right
s res
erve
d

Annex B | Definitions 159
B
Figure B.1 ⊳ World Energy Outlook SR main country groupings
Note: This map is without prejudice to the status of or sovereignty over any territory, to the delimitation of international frontiers and boundaries and to the name of any territory, city or area.
IEA (International Energy Agency): OECD regional grouping excluding Chile, Iceland, Israel, Latvia, Lithuania and Slovenia.
Latin America: Central and South America regional grouping and Mexico.
Middle East: Bahrain, Islamic Republic of Iran (Iran), Iraq, Jordan, Kuwait, Lebanon, Oman, Qatar, Saudi Arabia, Syrian Arab Republic (Syria), United Arab Emirates and Yemen.
Non-OECD: All other countries not included in the OECD regional grouping.
Non-OPEC: All other countries not included in the OPEC regional grouping.
North Africa: Algeria, Egypt, Libya, Morocco and Tunisia.
North America: Canada, Mexico and United States.
OECD (Organisation for Economic Co-operation and Development): Australia, Austria, Belgium, Canada, Chile, Czech Republic, Denmark, Estonia, Finland, France, Germany, Greece, Hungary, Iceland, Ireland, Israel, Italy, Japan, Korea, Latvia, Lithuania, Luxembourg, Mexico, Netherlands, New Zealand, Norway, Poland, Portugal, Slovak Republic, Slovenia, Spain, Sweden, Switzerland, Turkey, United Kingdom and United States.
OPEC (Organisation of the Petroleum Exporting Countries): Algeria, Angola, Republic of the Congo (Congo), Equatorial Guinea, Gabon, Islamic Republic of Iran (Iran), Iraq, Kuwait, Libya, Nigeria, Saudi Arabia, United Arab Emirates and Bolivarian Republic of Venezuela (Venezuela), based on membership status as of April 2020
Southeast Asia: Brunei Darussalam, Cambodia, Indonesia, Lao People’s Democratic Republic (Lao PDR), Malaysia, Myanmar, Philippines, Singapore, Thailand and Viet Nam. These countries are all members of the Association of Southeast Asian Nations (ASEAN).
IEA.
All
right
s res
erve
d

160 World Energy Outlook 2020 | Special Report
Sub-Saharan Africa: Angola, Benin, Botswana, Cameroon, Republic of the Congo (Congo), Côte d’Ivoire, Democratic Republic of the Congo, Eritrea, Ethiopia, Gabon, Ghana, Kenya, Mauritius, Mozambique, Namibia, Niger, Nigeria, Senegal, South Africa, South Sudan, Sudan, United Republic of Tanzania (Tanzania), Togo, Zambia, Zimbabwe and other African countries and territories.6
Country notes 1 Note by Turkey: The information in this document with reference to “Cyprus” relates to the southern part of the Island. There is no single authority representing both Turkish and Greek Cypriot people on the Island. Turkey recognises the Turkish Republic of Northern Cyprus (TRNC). Until a lasting and equitable solution is found within the context of the United Nations, Turkey shall preserve its position concerning the “Cyprus issue”. 2 Note by all the European Union Member States of the OECD and the European Union: The Republic of Cyprus is recognised by all members of the United Nations with the exception of Turkey. The information in this document relates to the area under the effective control of the Government of the Republic of Cyprus. 3 Individual data are not available and are estimated in aggregate for: Afghanistan, Bhutan, Cook Islands, Fiji, French Polynesia, Kiribati, Lao People’s Democratic Republic (Lao PDR), Macau (China), Maldives, New Caledonia, Palau, Papua New Guinea, Samoa, Solomon Islands, Timor-Leste and Tonga and Vanuatu. 4 Individual data are not available and are estimated in aggregate for: Anguilla, Antigua and Barbuda, Aruba, Bahamas, Barbados, Belize, Bermuda, Bonaire, British Virgin Islands, Cayman Islands, Dominica, Falkland Islands (Malvinas), French Guiana, Grenada, Guadeloupe, Guyana, Martinique, Montserrat, Saba, Saint Eustatius, Saint Kitts and Nevis, Saint Lucia, Saint Pierre and Miquelon, Saint Vincent and Grenadines, Saint Maarten, Turks and Caicos Islands. 5 The statistical data for Israel are supplied by and under the responsibility of the relevant Israeli authorities. The use of such data by the OECD and/or the IEA is without prejudice to the status of the Golan Heights, East Jerusalem and Israeli settlements in the West Bank under the terms of international law.
6 Individual data are not available and are estimated in aggregate for: Burkina Faso, Burundi, Cabo Verde, Central African Republic, Chad, Comoros, Djibouti, Equatorial Guinea, Kingdom of Eswatini, Gambia, Guinea, Guinea-Bissau, Lesotho, Liberia, Madagascar, Malawi, Mali, Mauritania, Réunion, Rwanda, Sao Tome and Principe, Seychelles, Sierra Leone, Somalia and Uganda.
Abbreviations and Acronyms BEV battery electric vehicles CCGT combined-cycle gas turbine CGE computable general equilibrium (models) CH4 methane CO carbon monoxide CO2 carbon dioxide CO2-eq carbon-dioxide equivalent DER distributed energy resources DSI demand-side integration DSR demand-side response EOR enhanced oil recovery EU European Union EU ETS European Union Emissions Trading System EV electric vehicle GDP gross domestic product
IEA.
All
right
s res
erve
d

Annex B | Definitions 161
B
GHG greenhouse gases GIMF Global Integrated Monetary and Fiscal (model) HFO heavy fuel oil IAEA International Atomic Energy Agency ICE internal combustion engine ICT information and communication technologies IEA International Energy Agency IFI international finance institutions IIASA International Institute for Applied Systems Analysis IMF International Monetary Fund IMO International Maritime Organization IOC international oil company IPCC Intergovernmental Panel on Climate Change LCV light-commercial vehicle LDAR Leak detection and repair LNG liquefied natural gas LPG liquefied petroleum gas MDBs multilateral development banks NAICs North American Industry Classification System NACE Nomenclature of Economic Activities NEA Nuclear Energy Agency (an agency within the OECD) NOX nitrogen oxides OECD Organisation for Economic Co-operation and Development PHEV plug-in hybrid electric vehicles PLDV passenger light-duty vehicle PM particulate matter PM2.5 fine particulate matter PPP purchasing power parity PV photovoltaics R&D research and development RD&D research, development and demonstration SDS Sustainable Development Scenario SME small and medium enterprises SMR small modular nuclear reactor SO2 sulfur dioxide T&D transmission and distribution TFC total final consumption TFEC total final energy consumption TPED total primary energy demand UN United Nations UNDP United Nations Development Programme UNEP United Nations Environment Programme US United States VRE variable renewable energy
IEA.
All
right
s res
erve
d

162 World Energy Outlook 2020 | Special Report
WEM World Energy Model WEO World Energy Outlook WHO World Health Organization
IEA.
All
right
s res
erve
d

Annex C | References 163
Annex C
References Chapter 1: Covid-19 and energy: setting the scene
Agrawala, S., D. Dussaux and N. Monti (2020), "What policies for greening the crisis response and economic recovery? Lessons learned from past green stimulus measures and implications for the COVID-19 crisis", OECD Environment Working Papers, No. 164, Organisation for Economic Co-operation and Development, Paris, https://doi.org/10.1787/c50f186f-en.
Battersby, B., W. Lam and E. Ture (2020), “Tracking the $9 trillion global fiscal support to fight covid-19”, (blog) International Monetary Fund, https://blogs.imf.org/2020/05/20/ tracking-the-9-trillion-global-fiscal-support-to-fight-covid-19/.
Cambridge Econometrics (2011), Assessing the Implementation and Impact of Green Elements of Member States’ National Recovery Plans, Final Report for the European Commission (DG Environment), Cambridge, United Kingdom, https://ec.europa.eu/ environment/enveco/growth_jobs_social/pdf/studies/green_recovery_plans.pdf.
Conticini, E., B. Frediani and D. Caro (2020), “Can atmospheric pollution be considered a co-factor in extremely high level of SARS-CoV-2 lethality in Northern Italy?”, Environmental Pollution Vol. 261, https://doi.org/10.1016/j.envpol.2020.114465.
Cui, Y. et al. (2003), “Air pollution and case fatality of SARS in the People's Republic of China: an ecologic study”, Environmental Health Vol. 2 (15), https://doi.org/10.1186/1476-069X-2-15.
Elgin, C., G. Basbug and A. Yalaman (2020), “Economic policy responses to a pandemic: developing the covid-19 economic stimulus index”, Covid Economics: Vetted and Real Time Papers, Issue 3, pp. 40-54, Centre for Economic Policy Research Press 2020, http://web.boun.edu.tr/elgin/COVID_19.pdf.
Gentilini, U. et al. (2020), “Social protection and jobs responses to Covid-19: a real-time review of country measures”, Living Paper, ver. 7, 1 May 2020, World Bank, Washington, DC.
IATA (International Air Transport Association) (2020), 25 Million Jobs at Risk with Airline Shutdown, 7 April 2020, Geneva.
IEA (International Energy Agency) (2020a), Global Energy Review 2020, Paris.
IEA (2020b), “Energy market turmoil deepens challenges for many major oil and gas exporters”, Paris, https://www.iea.org/articles/energy-market-turmoil-deepens-challenges-for-many-major-oil-and-gas-exporters.
IEA (2020c), Oil Market Report - May 2020, Paris.
IEA (2020d), World Energy Investment 2020, Paris.
IEA.
All
right
s res
erve
d

164 World Energy Outlook 2020 | Special Report
IEA (2020e), “As the Covid-19 crisis hammers the auto industry, electric cars remain a bright spot”, Paris, https://www.iea.org/commentaries/as-the-covid-19-crisis-hammers-the-auto-industry-electric-cars-remain-a-bright-spot.
IEA (2019), Africa Energy Outlook, Paris.
IEA (2019b), World Energy Outlook-2019, Paris.
IEA (2018), Outlook for Producer Economies, Paris.
IEA (2015), Making the Energy Sector More Resilient to Climate Change, Paris, https://www.iea.org/reports/making-the-energy-sector-more-resilient-to-climate-change.
International Institute for Labour Studies (2011), “A review of global fiscal stimulus”, EC-IILS Joint Discussion Paper Series No. 5, https://www.ilo.org/inst/research/addressing-crisis-challenges/discussion-paper-series/WCMS_194175/lang--en/index.htm.
ILO (International Labour Organization) (2020), ILO Monitor: COVID-19 and the World of Work, Third edition, ILO, Geneva.
IMF (International Monetary Fund) (2020a), IMF World Economic Outlook, April 2020: The Great Lockdown, Washington DC.
IMF (2020b), IMF World Economic Outlook Database, April 2020 Edition, Washington DC.
Mundaca, L. and J. Richter (2015), “Assessing 'green energy economy' stimulus packages: Evidence from the US programs targeting renewable energy”, Renewable and Sustainable Energy Reviews, Vol. 42, pp. 1174-1186, https://doi.org/10.1016/j.rser.2014.10.060.
OECD (Organisation for Economic Co-operation and Development) (2020), OECD Economic Outlook, June 2020, Paris.
OECD (2017), Enhancing the Contributions of SMEs in a global and digitalised economy, Meeting of the OECD Council at Ministerial Level, 7-8 June 2017, Paris, https://www.oecd.org/industry/C-MIN-2017-8-EN.pdf.
Setti, L. et al. (2020), “Searching for SARS-COV-2 on particulate matter: a possible early indicator of covid-19 epidemic recurrence”, Int. J. Environ. Res. Public Health, 17(9), https://doi.org/10.3390/ijerph17092986.
TomTom International (2020), TomTom Traffic Index, https://www.tomtom.com/en_gb/ traffic-index/.
Wong, C. (2011), “The fiscal stimulus programme and public governance issues in china”, OECD Journal on Budgeting, Vol. 11/3, http://dx.doi.org/10.1787/16812336.
World Bank (2020), “Covid-19 Crisis through a Migration Lens”, Washington DC.
IEA.
All
right
s res
erve
d

Annex C | References 165
C
Chapter 2: Evaluation of possible recovery measures
ACEA (European Automobile Manufacturers Association) (2020a), Commercial vehicle registrations: -34.5% four months into 2020; -67.0% in April (press release), 26 May 2020, https://www.acea.be/press-releases/article/commercial-vehicle-registrations-34.5-four-months-into-2020-67.0-in-april.
ACEA (2020b), Automakers and electricity sector call for rapid action on charging points under EU recovery plan, 9 June 2020, https://www.acea.be/press-releases/article/fuel-types-of-new-buses-diesel-85-hybrid-4.8-electric-4-alternative-fuels-6.
AIE (European Association of Electrical Contractors) (2018), Powering a New Value Chain in the Automotive Sector: Job Potential of Transport Electrification, AIE, Brussels, https://download.dalicloud.com/fis/download/66a8abe211271fa0ec3e2b07/c572c686-f52f-4c0d-88fc-51f9061126c5/Powering_a_new_value_chain_in_the_automotive_sector_-_the_job_potential_of_transport_electrification.pdf.
Benchmark Minerals (2020), EV battery arms race enters new gear with 115 megafactories, Europe sees most rapid growth, https://www.benchmarkminerals.com/ev-battery-arms-race-enters-new-gear-with-115-megafactories-europe-sees-most-rapid-growth/.
Bieker, G. and P. Mock (2020), Green vehicle replacement programs as a response to the COVID-19 crisis: Lessons learned from past programs and guidelines for the future, International Council on Clean Transportation, Washington DC, https://theicct.org/ publications/vehicle-replacement-programs-covid-19-may2020.
BNEF (Bloomberg New Energy Finance) (2019), Battery Pack Prices Fall As Market Ramps Up With Market Average At $156/kWh In 2019, https://about.bnef.com/blog/battery-pack-prices-fall-as-market-ramps-up-with-market-average-at-156-kwh-in-2019/
Boursier (2020), Coronavirus : après la RATP, la SNCF rembourse aussi les abonnements en avril (Coronavirus: after RATP, SNCF also reimburses subscriptions in April), https://www.boursier.com/actualites/economie/coronavirus-apres-la-ratp-la-sncf-rembourse-aussi-les-abonnements-en-avril-43549.html.
CEIC (2020), India Cement: Production, CEIC Data, https://www.ceicdata.com/en/india/ infrastructure-industries-index-201112100/cement-production.
CEMNET (2020), “China’s cement industry expected to lead economic recovery”, International Cement Review, https://www.cemnet.com/News/story/168723/china-s-cement-industry-expected-to-lead-economic-recovery.html.
Cisco (2018), Cisco Visual Networking Index Complete Forecast Update, 2017–2022, Cisco, San Jose, CA., https://www.cisco.com/c/dam/m/en_us/network-intelligence/service-provider/digital-transformation/knowledge-network-webinars/pdfs/1213-business-services-ckn.pdf.
Citymapper (2020), Citymapper Mobility Index (database), https://citymapper.com/cmi.
IEA.
All
right
s res
erve
d

166 World Energy Outlook 2020 | Special Report
Ecocounter (2020), Understand the impact of the pandemic on cycling, https://www.eco-compteur.com/en/covid19-dashboard/.
EEA (European Energy Agency) (2018), Electric Vehicles from Lifecycle and Circular Economy Perspectives, EEA, Copenhagen, https://www.eea.europa.eu/publications/ electric-vehicles-from-life-cycle.
ESMAP (Energy Sector Management Assistance Program) (2020), Off-Grid Solar Market Trends Report 2020, World Bank, Washington DC., https://www.esmap.org/off-grid-solar-market-trends-report-2020.
ESMAP (2019), Mini Grids for Half a Billion People, World Bank, Washington DC., https://www.worldbank.org/en/topic/energy/publication/mini-grids-for-half-a-billion-people.
Federal Reserve (US) 2020, Industrial Production Index, https://fred.stlouisfed.org/ series/INDPRO.
FES (Friedrich Ebert Stiftung) (2015), The Future of the German Automotive Industry, Structural Change in the Automotive Industry: Challenges and Perspectives, https://library.fes.de/pdf-files/wiso/12165.pdf.
GOGLA (Global Off-Grid Lighting Association) (2020), Powering opportunity, https://www.gogla.org/powering-opportunity.
IEA (International Energy Agency) (2020a), Global Energy Review, Paris, https://www.iea.org/reports/global-energy-review-2020.
IEA (2020b), Renewable Energy Market Update, Paris,https://www.iea.org/reports/ renewable-energy-market-update.
IEA (2020c), “Clean energy progress after the Covid-19 crisis will need reliable supplies of critical minerals”, Paris, https://www.iea.org/articles/clean-energy-progress-after-the-covid-19-crisis-will-need-reliable-supplies-of-critical-minerals.
IEA (2020d), World Energy Investment 2020, Paris, https://www.iea.org/reports/world-energy-investment-2020.
IEA (2020e), “As the Covid-19 crisis hammers the auto industry, electric cars remain a bright spot”, Paris, https://www.iea.org/commentaries/as-the-covid-19-crisis-hammers-the-auto-industry-electric-cars-remain-a-bright-spot.
IEA (2020f), Tracking Clean Energy Progress: Truck and Buses, Paris, https://www.iea.org/fuels-and-technologies/trucks-buses.
IEA (2020g), “Working from home can save energy and reduce emissions. But how much”?, Paris, https://www.iea.org/commentaries/working-from-home-can-save-energy-and-reduce-emissions-but-how-much.
IEA.
All
right
s res
erve
d
Annex C | References 167
C
IEA (2020h), Tracking Buildings: Data Centres and Data Transmission Networks, Paris, https://www.iea.org/reports/tracking-buildings/data-centres-and-data-transmission-networks.
IEA (2020i), Outlook for Biogas and Biomethane: Prospects for Organic Growth, Paris, https://www.iea.org/reports/outlook-for-biogas-and-biomethane-prospects-for-organic-growth.
IEA (2020j), Methane Tracker, Paris, https://www.iea.org/reports/methane-tracker-2020/interactive-country-and-regional-estimates.
IEA (2019a), Africa Energy Outlook, Paris, https://www.iea.org/reports/africa-energy-outlook-2019.
IEA (2019b), Nuclear Power in a Clean Energy System, Paris, https://www.iea.org/ reports/nuclear-power-in-a-clean-energy-system.
IEA (2019c), World Energy Outlook 2019, Paris, https://www.iea.org/reports/world-energy-outlook-2019.
IEA (2019d), The Future of Rail, Paris, https://www.iea.org/reports/the-future-of-rail.
IEA, IRENA, UNSD, World Bank, WHO (2020), Tracking SDG 7: The Energy Progress Report, World Bank, Washington DC, https://www.irena.org/-/media/Files/IRENA/Agency/ Publication/2019/May/2019-Tracking-SDG7-Report.pdf.
HIS (2020a), IHS US Manufacturing PMI, IHS Markit, https://www.fxempire.com/macro/ united-states/manufacturing-pmi.
HIS (2020b), Global commercial vehicle to drop 22 percent, IHS Markit, https://ihsmarkit.com/research-analysis/global-commercial-vehicle-production-expected-to-drop-22-perce.html.
ILO (International Labour Organization) (2020), ILOSTAT Database, Geneva, https://ilostat.ilo.org/.
India Times (2019), “India installed 181,000 solar power pumps for irrigation in three years under PM-KUSUM scheme”, https://energy.economictimes.indiatimes.com/news/ renewable/india-installed-181000-solar-power-pumps-for-irrigation-in-three-years-under-pm-kusum-scheme/73030827.
Institute for Supply Management (2020), PMI Composite Index, https://www.quandl.com/ data/ISM/MAN_PMI-PMI-Composite-Index.
IRENA (International Renewable Energy Agency) (2020), Renewable Power Generation Costs in 2019, Abu Dhabi.
IRENA (2019), Renewable Energy and Jobs Annual Review 2019, Abu Dhabi.
IEA.
All
right
s res
erve
d

168 World Energy Outlook 2020 | Special Report
IRJ (International Rail Journal) (2020), “UITP projects €40bn hit for European public transport in 2020”, https://www.railjournal.com/financial/uitp-projects-e40bn-hit-for-european-public-transport-in-2020/.
ITU (International Telecommunication Union) (2020), ICT Statistics, https://www.itu.int/ en/ITU-D/Statistics/Pages/stat/default.aspx.
Loo, B. P. (2018), Unsustainable Transport and Transition in China, Routledge,https://doi.org/10.4324/9781315677941.
Malmodin, J. and D. Lundén (2018), “The energy and carbon footprint of the global ICT and E&M sectors 2010–2015”, Sustainability Vol. 10(9), pp. 3027.
Masanet, E. et al., (2020), “Recalibrating global data center energy-use estimates”, Science Vol. 367(6481), pp. 984-986, doi: 10.1126/science.aba3758.
Mercom India, (2020), Over 181,000 Solar Water Pumps Installed in India, Mercom, https://mercomindia.com/over-181000-solar-water-pumps-installed/.
MIIT (Chinese Ministry of Industry and Information Technology) (2020), 关于完善新能源汽
车推广应用财政补贴政策的通知 (Notice regarding the improvement of the promotion
and application of financial subsidy policies for new energy vehicles Caijian), http://www.gov.cn/zhengce/zhengceku/2020-04/23/content_5505502.htm.
MNRE (Ministry of New and Renewable Energy - India) (2020), Annual Report 2019-2020, Delhi, https://mnre.gov.in/knowledge-center/publication.
Moovit (2020), Moovit (database), https://moovitapp.com/.
NEA (Nuclear Energy Agency) and OECD (Organisation for Economic Co-Operation and Development) (2016), Small Modular Reactors: Nuclear Energy Market Potential for Near-term Deployment, NEA/OECD, Paris, https://www.oecd-nea.org/ndd/pubs/2016/7213-smrs.pdf.
Northern Lights PCI (Project of Common Interest) (2020), CCS and the EU Covid-19 Recovery Plan, https://northernlightsccs.com/assets/documents/Northern-Lights-PCI-Memorandum-Value-of-a-European-CCS-Ecosystem-in-Green-Recovery.pdf.
Peace, B. (2020), Covid-19 Updated Impact Assessment, International Aviation Transport Association, Montreal, https://www.iata.org/en/iata-repository/publications/economic-reports/covid-fourth-impact-assessment/.
Railway Technology (2018), The world’s biggest railway operators in 2018, https://www.railway-technology.com/features/worlds-biggest-railway-operators-2018/.
Raje, F. and A. Saffrey (2016), The Value of Cycling, UK Department for Transport, London, https://assets.publishing.service.gov.uk/government/uploads/system/uploads/attachment_data/file/509587/value-of-cycling.pdf.
IEA.
All
right
s res
erve
d

Annex C | References 169
C
Romer, C. and C. Carroll (2009), Economic Analysis of the Car Allowance Rebate System ("Cash for clunkers"), US Executive Office of the President, Washington DC, https://obamawhitehouse.archives.gov/blog/2010/04/05/did-cash-clunkers-work-intended.
S&P Global Platts (2020), Olefins Outlook, New York, https://www.spglobal.com/platts/ plattscontent/_assets/_files/en/specialreports/oil/platts_2020_outlook_report.pdf.
Sandvine (2020), The Global Internet Phenomena Report COVID-19 Spotlight May 2020, Sandvine, Tokyo https://www.sandvine.com/hubfs/Sandvine_Redesign_2019/Downloads/ 2020/Phenomena/COVID%20Internet%20Phenomena%20Report%2020200507.pdf.
Saunois et al. (2016), “The Global Methane Budget 2000–2012”, Earth System Science Data, VOL. 8, pp. 697–751.
Shakti Sustainable Energy Foundation (2018), Solar for Irrigation – A Comparative Assessment of Deployment Strategies, Council on Energy, Environment and Water, Dehli, https://shaktifoundation.in/report/solar-irrigation-comparative-assessment-deployment-strategies/?psec=Mg==#NjIzMw==
Smart Growth America (2011), Recent Lessons from the Stimulus: Transportation Funding and Job Creation, Washington DC, https://smartgrowthamerica.org/app/legacy/ documents/lessons-from-the-stimulus.pdf.
Statista (2020), Manufacturing Purchasing Managers' Index (PMI) in China from April 2018 to April 2020, https://www.statista.com/statistics/271770/china-manufacturing-purchasing-managers-index/.
Sumits, A. (2015), The History and Future of Internet Traffic, Cisco, San Jose, CA, https://blogs.cisco.com/sp/the-history-and-future-of-internet-traffic.
TERI (The Energy and Resources Institute) (2014), The Energy and Resources Institute Energy and Environment Data Directory and Yearbook, New Delhi.
Thouthang, L. and R. Kumar (2019), Can India’s 30m grid/diesel irrigation pumps go solar?, Energypost.eu,https://energypost.eu/can-indias-30m-grid-diesel-irrigation-pumps-go-solar/.
Townsend, A., N. Raji and A. Zapantis (2020), The Value of Carbon Capture and Storage, Global Carbon Capture and Storage Institute, Docklands, www.globalccsinstitute.com/ resources/publications-reports-research/the-value-of-carbon-capture-ccs/.
Trading Economics (2020a), China growth, https://tradingeconomics.com/china/industrial-production.
Trading Economics (2020b), India growth, https://tradingeconomics.com/india/industrial-production.
IEA.
All
right
s res
erve
d

170 World Energy Outlook 2020 | Special Report
Trading Economics (2020c), Eurozone industrial production, https://tradingeconomics.com/ euro-area/industrial-production.
UIC (International Union of Railways) (2017), “Analysis of regional differences in global rail projects by cost, length and project stage”, https://uic.org/IMG/pdf/ analysis_of_global_rail_infrastructure_investment.pdf.
UITP (Union Internationale des Transports Publics) (2011), Employment in public transport: 13 million people worldwide!, Brussels, https://www.uitp.org/sites/default/files/cck-focus-papers-files/Employment_in_PT_13Mio_2011.pdf.
UK Department of Transport (2014), Value for Money Assessment for Cycling Grants, UK DfT, London https://assets.publishing.service.gov.uk/government/uploads/system/ uploads/attachment_data/file/348943/vfm-assessment-of-cycling-grants.pdf.
UN University (2014), “India plans to convert water pumps from diesel to solar”, https://ourworld.unu.edu/en/india-plans-to-convert-water-pumps-from-diesel-to-solar.
UNEP (UN Environment Programme) (2012), Green Economy Briefing Paper Poverty Reduction, Nairobi, https://www.greengrowthknowledge.org/sites/default/files/ downloads/resource/Green_economy_briefing_paper_poverty_reduction_UNEP.pdf.
US Census Bureau (2020), Advance monthly sales for retail and food services, Washington DC, https://www.census.gov/retail/marts/www/marts_current.pdf.
US GAO (United States Government Accountability Office) (2010), Auto Industry Lessons Learned from Cash for Clunkers Program, Washington DC, https://www.gao.gov/ products/GAO-10-486.
Wietschel M. et al. (2017), Perspektiven des Wirtschaftsstandorts Deutschland in Zeiten zunehmender Elektromobilität (The Effects of Vehicle Electrification on Employment in Germany), Fraunhofer ISI, Karlsruhe, https://www.isi.fraunhofer.de/content/dam/isi/ dokumente/sustainability-innovation/2017/WP09-2017_Perspektiven-Automobilindustrie-Elektromobilitaet_Wietschel-et-al.pdf.
World Health Organization (2019), Household Energy Database, World Health Organization, Geneva, https://www.who.int/airpollution/data/household-energy-database/en/
World Steel Association (2020), Crude steel production, Brussels, https://www.worldsteel.org/media-centre/press-releases/2020/March-2020-crude-steel-production.html.
WSDOT (Washington State Department of Transportation) (2020), “Declining ridership due to COVID-19 brings change to Amtrak Cascades trains”, https://www.wsdot.wa.gov/ news/2020/03/25/declining-ridership-due-covid-19-brings-change-amtrak-cascades-trains.
IEA.
All
right
s res
erve
d

Annex C | References 171
C
Chapter 3: A sustainable recovery plan for the energy sector
Anderson et al. (2013), Getting to know GIMF: The Simulation Properties of the Global Integrated Monetary and Fiscal Model, International Monetary Fund, Washington, DC, https://www.imf.org/external/pubs/ft/wp/2013/wp1355.pdf.
Battersby, B., W. , R. Lam and E. Ture (2020), “Tracking the $9 trillion Global fiscal support to Fight COVID-19”, International Monetary Fund, Washington, DC, https://blogs.imf.org/ 2020/05/20/tracking-the-9-trillion-global-fiscal-support-to-fight-covid-19/.
Cronk, R. and J. Bartram (2018), “Environmental conditions in health care facilities in low and middle-income countries: coverage and inequalities”, International Journal of Hygiene and Environmental Health, Vol. 221, Issue 3, pp. 409-422.
European Commission (2020), Taxonomy: Final report of the Technical Expert Group on Sustainable Finance, EU Technical Expert Group on Sustainable Finance, Brussels, https://ec.europa.eu/knowledge4policy/publication/sustainable-finance-teg-final-report-eu-taxonomy_en.
IEA (International Energy Agency) (2020), “Low fuel prices provide a historic opportunity to phase out fossil fuel consumption subsidies”, Paris, https://www.iea.org/articles/low-fuel-prices-provide-a-historic-opportunity-to-phase-out-fossil-fuel-consumption-subsidies.
ILO (International Labour Organization) (2019), A Quantum Leap for Gender Equality: For a Better Future of Work for All, Geneva, https://www.ilo.org/wcmsp5/groups/public/---dgreports/---dcomm/---publ/documents/publication/wcms_674831.pdf.
IMF (International Monetary Fund) and World Bank Group (2020), Background Note for Mobilizing with Africa, High-Level Virtual Event on Mobilizing with Africa, https://meetings.imf.org/~/media/AMSM/Files/SM2020/mobilizing-with-africa-background-note.ashx?la=en.
Laxton, D. et al. (2010), The Global Integrated Monetary and Fiscal Model (GIMF) – Theoretical Structure, International Monetary Fund, Washington, DC, https://www.imf.org/ ~/media/Websites/IMF/imported-full-text-pdf/external/pubs/ft/wp/2010/_wp1034.ashx.
Matikainen, S., E. Campiglio and D. Zenghelis (2017), “The climate impact of quantitative easing”, London School of Economics, London, DOI: 10.13140/RG.2.2.24108.05763.
OECD/The World Bank/UN Environment (2018), "Rethink development finance for climate", in Environment, Financing Climate Futures: Rethinking Infrastructure, Organisation for Economic Co-operation and Development, Paris.
Ratha, D. et al. (2020), "COVID-19 Crisis through a Migration Lens", Migration and Development Brief, No. 32, World Bank Group, Washington, DC.
Spiegel, S., O. Schwank and M. Obaidy (2020), UN/DESA Policy Brief #72: COVID-19 and Sovereign Debt, 14 May 2020, United Nations Department of Economic and Social Affairs, New York.
IEA.
All
right
s res
erve
d

172 World Energy Outlook 2020 | Special Report
UN DESA (United Nations Department of Economic and Social Affairs) (2020), New York, https://www.un.org/development/desa/dpad/publication/un-desa-policy-brief-72-covid-19-and-sovereign-debt/.
TCFD (Task force for Climate-related Financial Discolure) (2017), Recommendations of the Task Force on Climate-Related Financial Disclosures, London, https://www.fsb-tcfd.org/publications/final-recommendations-report/.
IEA.
All
right
s res
erve
d

Sustainable Recovery World Energy Outlook Special Report
This publication reflects the views of the IEA Secretariat but does not necessarily reflect those of individual IEA member countries. The IEA makes no representation or warranty, express or implied, in respect of the publication’s contents (including its completeness or accuracy) and shall not be responsible for any use of, or reliance on, the publication. Unless otherwise indicated, all material presented in figures and tables is derived from IEA data and analysis.
This publication and any map included herein are without prejudice to the status of or sovereignty over any territory, to the delimitation of international frontiers and boundaries and to the name of any territory, city or area.
IEA. All rights reserved. IEA Publications International Energy Agency Website: www.iea.org Contact information: www.iea.org/about/contact
Revised version, July 2020. Information notice found at:www.iea.org/corrigenda/
Typeset and printed in France by IEA - June 2020 Cover design: IEA Photo credits: Sutterstock
