sustainable optimization for thermal comfort and building
TRANSCRIPT
Zeinb El-Razaz/Engineering Research Journal 166 ( June 2020 ) A18-A 34
A18
Sustainable Optimization for thermal comfort and
building energy efficiency in Cairo
Sahar Mohamed Abd El-Rahman a, Sobhy Ibrahim Esmail b , Husam Bakr Khalilc, Zeinab
El-Razaz d a Ph.D. Student , Architecture Department, Faculty of Engineering Mattaria , Helwan University. Teaching Assistant at Modern
Academy. b Ph.D. Student , Teaching Assistant , Architecture Department, Faculty of Engineering Mattaria , Helwan University. c Professor of Architecture , Architecture Department, Faculty of Engineering, The British University in Egypt (BUE). d Professor of Architecture , Architecture Department, Faculty of Engineering Mattaria, Helwan University .
Abstract Globally, a significant proportion of the building energy is consumed for
achieving the required thermal and optical comfort. The building form and the other
associated factors heavily affect the indoor thermal comfort and the lighting energy
of any air-conditioned or naturally ventilated building. The most important
parameters affecting the thermal comfort and lighting energy requirement of the
indoor environment are the building shape, orientation and the window to wall ratio
(WWR) of the building. These parameters are interrelated and a proper combination
is required to achieve the optimal thermal comfort and energy efficiency.
Keywords: Optimization - thermal and optical comfort - Energy efficiency -
Building energy simulation.
The aim of this study is to determine the thermal performance of office
buildings with Optimizing the shape, orientation and the window to wall ratio
(WWR) of the building.
1. Introduction
The development in computer technology have improved capacity of handling
complex simulation models have enabled more accurate calculations of the energy
performance. This can hopefully be used as a design tool already at an early stage,
making it possible to design an optimal envelope Building performance simulations
are an integral part of the design process for energy efficient and high-performance
buildings, since they help in investigating design options and assess the
environmental and energy impacts of design decisions. Energy efficient buildings aim
to reduce the overall energy consumption necessary for their operation. High-
performance buildings are designed to improve the overall building performance,
besides energy usage, such as improving occupants’ thermal, visual and acoustic
comfort.
2. Choose simulation programs to evaluate proposal models
2.1 Tools selection criteria
The simulation community at large is thinking about and discussing at least
five major challenges. As shown in Figure 02 they are namely, the (1) Usability and
Information Management (UIM) of interfaces, (2) Integration of Intelligent design
Knowledge-Base (IIKB), (3) Accuracy of tools and Ability to simulate Detailed and

Zeinb El-Razaz/Engineering Research Journal 166 ( June 2020 ) A18-A 34
A19
Complex and building Components (AADCC), (4) Interoperability of Building
Modelling (IBM) and the (5) Integration with Building Design Process (IBDP) [1].
2.2 Comparison of the existing environmental analysis tools for Rhino/Grasshopper
There are currently five environmental analysis tools, for Rhino/Grasshopper,
available to the public .Table 1 compares the existing environmental analysis tools
for Rhino/Grasshopper based on the analysis types that they provide during the
different stages of an environmental design process. As it is shown in Table 1, none
of the tools provide the full spectrum of the environmental studies, and there is almost
no support for weather data analysis. [2]
2.3 Define the chosen tools for thermal simulation and Optimization
Grasshopper
In recent years, the design professions have begun experimenting with
parametric design tools such as Grasshopper which was developed by David Rutten
at Robert McNeel& Associates in 2007 as a parametric modelling plug-in for
Rhinoceros 3D modeling software . [3] Grasshopper is a graphical algorithm editor
that allows designers with no formal scripting experience to quickly generate
parametric forms from the simple to the awe-inspiring [4] as there are components
within Grasshopper that allow custom scripts to be written in VB.NET. [5]
Ladybug and Honeybee
Ladybug and Honeybee are efforts to support the full range of environmental
analysis in a single parametric platform. Its create interactive 2D and 3D graphics for
weather data visualization to support the decision making process during the initial
stages of design, and the components evaluate initial design options for implications
to the design from radiation and sunlight-hours analyses results. Its also provide
energy and daylighting modeling by using validated simulation engines such as
EnergyPlus (US Department of Energy), Radiance [6], and Daysim [7].
Fig.( 1). The five selection criteria . Source : edited by author .
Table (1). Comparison of the existing environmental analysis tools for Rhino/Grasshopper. Processes Analysis Tools
Heliotrope Geco Ladybug Gerilla Diva
Climate
Analysis
Analysis ✓
Visualization ✓** ✓
Massing Study ✓ ✓ ✓
Orientation Study ✓ ✓ ✓
Energy Modeling ✓ ✓ ✓*
* Limited to one thermal zone ** Only daily sun path diagram

Zeinb El-Razaz/Engineering Research Journal 166 ( June 2020 ) A18-A 34
A20
Genetic optimization algorithms
Optimization in building design is an interesting point of study because of the
integrated nature of both environmental and energy performance.It is used to
extensively search the design alternatives looking for high performance solutions in
terms of specified goals. The simulation-based optimization can overcome the
drawbacks of evaluative trial and error approach. In order to combine parametric
modeling with an optimization technique to support design explorations and form
finding, Genetic algorithms (GAs) have been considered. GAs can perform a series
of simulations in a multi-dimensional search space, increasing the relevance of the
cases simulated. They are used to find the configuration that best matches desired
performance goals. [8]
Genetic algorithms were shown to be effective in presenting new solutions to
optimize light penetration and shading, taking into account many different aspects
that influencing the performance of a façade [9].
The prediction of daylight levels by model-fitting was addressed by Coley and
Crabb [10] using genetic algorithms. Park et al. [11] also maximized day lighting from
a double-skin facade using non-linear programming. The principle was then
developed into a real-time optimization program using genetic algorithms [12].
3. Research Methodology
The optimization process begins in 3D modeling software Rhinoceros [13],
[3] and its parametric modeling plug-in Grasshopper. The building geometry is built
with all the predetermined variables, whose values can be adjusted through sliders.
The range of each design variable is determined based on designer’s experience. The
initial value of each design variable is set as the median value in the range, and the
initial design geometry is generated. [14]
Fig.(2). Ladybug & Honeybee connects Grasshopper3D to validated simulation engines for building energy,
comfort, day lighting and lighting simulation.. Source : https://www.food4rhino.com/app/ladybug-tools (Accessed 2-1-2020) .

Zeinb El-Razaz/Engineering Research Journal 166 ( June 2020 ) A18-A 34
A21
Grasshopper plugins Ladybug and Honeybee [2] provide the functions of
thermal , daylight and energy modeling. In the modeling process, the parametric
building geometry is connected to the materials component in the Radiance [15]
program, Then the building materials are connected to daylighting simulation
component, with the input of weather files, daylighting sensor placement,and other
simulation settings.
The building performance optimization process and the required software are
illustrated in Fig. 3. There are four main steps in this approach. The first step is to
identify design variables to be examined and to build a parametric design model. The
second step is the development of thermal, daylight and energy model. The third step
is integrated thermal, day lighting and energy simulation. The fourth step is the multi-
objective optimization. After the optimization is terminated, the simulation data and
optimized design solutions are further analyzed. [23]
Fig.(3). Research Methodology framework for optimization process. Source : the researcher.
Rhino
Galapagos
Rhino
Grasshopper
Ladybug & Honeybee
Energy Plus
Parametric design variables
Initial Geometry
Energy simulation
Energy simulation
result
Radiance
Daylight simulation
Daylight
simulation result
Energy model Daylight model
Updated
lighting
schedule
Optimized design options
Genetic Input Fitness Input
Optimization
Termination
Ste
p 1
S
tep
2
Ste
p 3
S
tep
4
Yes
No
Zeinb El-Razaz/Engineering Research Journal 166 ( June 2020 ) A18-A 34
A22
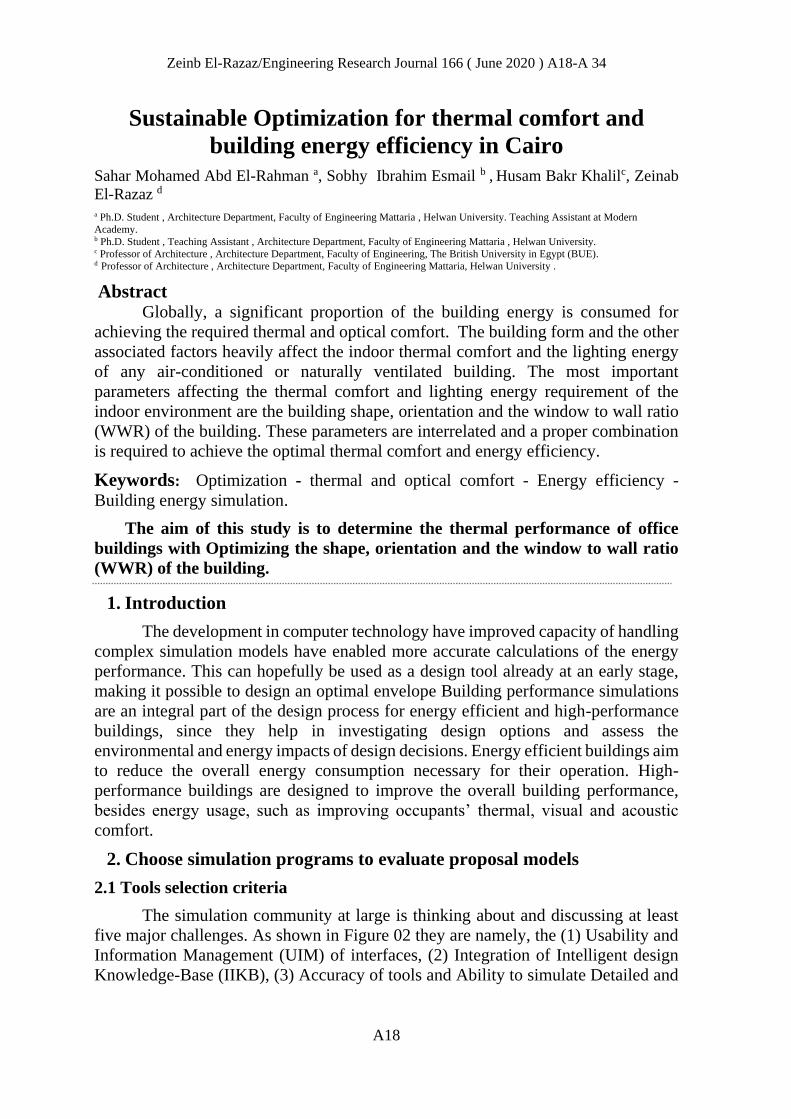
4. Model Setup
Rhino/Grasshopper is one of the most widely used platforms that are used by
designers today. There are already a number of environmental plugins developed for
Rhino/Grasshopper. However, Ladybug offers several advantages that are currently
not offered by existing Rhino/Grasshopper related environmental design plugins. The
base case model is built in Grasshopper based on Rhinoceros 3D. [16]
The case study was chosen to be located in the city of Cairo, Egypt (30° N-
31° E). Also, as Cairo is the capital of Egypt and the center of industrial and
administration work in Egypt, many fully glazed office buildings were built in the
last few decades following the International Style. Cairo is characterized by a clear
sunny sky for almost all the year round [16].
For the purpose of this study, the simulations were conducted using the
standard Energy plus Weather data files (.EPW) of Cairo.
The occupancy schedule was chosen to be from 8:00 am till 5:00 pm, for five
working days/week, which are the official working hours for the governmental sector
as well as many private companies in Egypt.
The research proposes using an office unit with an area of about 100 m2 and
a height of 4 m as a measurement model for research ideas to reach a building with
thermal and energy efficiency.
Table (2) : Simulation of the base case steps in Honeybee- Grasshopper plug-in to caculate enregy
consumption and Evaluate indoor thermal comfort factors.
1- Define honeybee Zone : office building 2- Customize Glazing Properties I suggest
glazing ratio before optimization
3- Customize Building materials for wall,
window, Roof .
4- Visualizing building components
Wall Materials
Window Materials
Roof Materials
Zeinb El-Razaz/Engineering Research Journal 166 ( June 2020 ) A18-A 34
A23
5- Add HB zone occupancy schedule 6- Add zone Loads & HVAC properties
7- Setting simulation outputs/analysis
period
8- Import EPW file and run energy
simulation
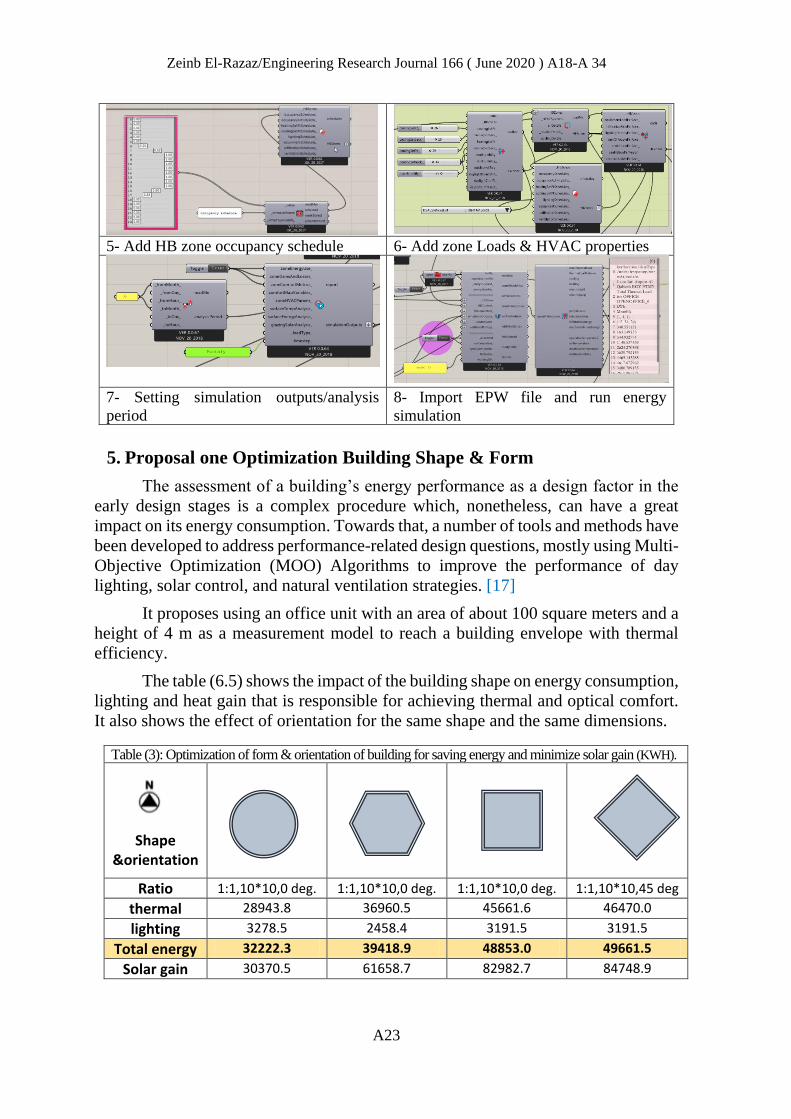
5. Proposal one Optimization Building Shape & Form
The assessment of a building’s energy performance as a design factor in the
early design stages is a complex procedure which, nonetheless, can have a great
impact on its energy consumption. Towards that, a number of tools and methods have
been developed to address performance-related design questions, mostly using Multi-
Objective Optimization (MOO) Algorithms to improve the performance of day
lighting, solar control, and natural ventilation strategies. [17]
It proposes using an office unit with an area of about 100 square meters and a
height of 4 m as a measurement model to reach a building envelope with thermal
efficiency.
The table (6.5) shows the impact of the building shape on energy consumption,
lighting and heat gain that is responsible for achieving thermal and optical comfort.
It also shows the effect of orientation for the same shape and the same dimensions.
Table (3): Optimization of form & orientation of building for saving energy and minimize solar gain (KWH).
Shape &orientation
Ratio 1:1,10*10,0 deg. 1:1,10*10,0 deg. 1:1,10*10,0 deg. 1:1,10*10,45 deg
thermal 28943.8 36960.5 45661.6 46470.0
lighting 3278.5 2458.4 3191.5 3191.5
Total energy 32222.3 39418.9 48853.0 49661.5
Solar gain 30370.5 61658.7 82982.7 84748.9
Zeinb El-Razaz/Engineering Research Journal 166 ( June 2020 ) A18-A 34
A24
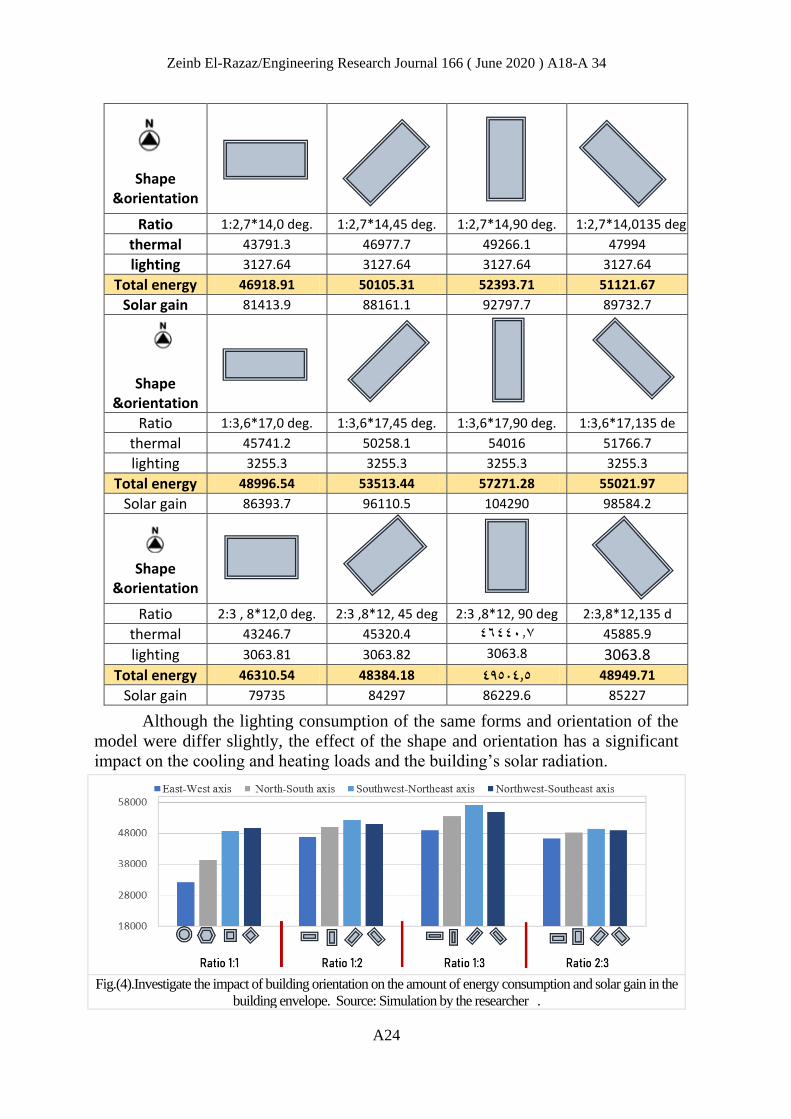
Although the lighting consumption of the same forms and orientation of the
model were differ slightly, the effect of the shape and orientation has a significant
impact on the cooling and heating loads and the building’s solar radiation.
Shape &orientation
Ratio 1:2,7*14,0 deg. 1:2,7*14,45 deg. 1:2,7*14,90 deg. 1:2,7*14,0135 deg
thermal 43791.3 46977.7 49266.1 47994
lighting 3127.64 3127.64 3127.64 3127.64
Total energy 46918.91 50105.31 52393.71 51121.67
Solar gain 81413.9 88161.1 92797.7 89732.7
Shape &orientation
Ratio 1:3,6*17,0 deg. 1:3,6*17,45 deg. 1:3,6*17,90 deg. 1:3,6*17,135 de
thermal 45741.2 50258.1 54016 51766.7
lighting 3255.3 3255.3 3255.3 3255.3
Total energy 48996.54 53513.44 57271.28 55021.97
Solar gain 86393.7 96110.5 104290 98584.2
Shape &orientation
Ratio 2:3 , 8*12,0 deg. 2:3 ,8*12, 45 deg 2:3 ,8*12, 90 deg 2:3,8*12,135 d
thermal 43246.7 45320.4 4.44464 45885.9
lighting 3063.81 3063.82 3063.8 3063.8
Total energy 46310.54 48384.18 5.40594 48949.71
Solar gain 79735 84297 86229.6 85227
Fig.(4).Investigate the impact of building orientation on the amount of energy consumption and solar gain in the
building envelope. Source: Simulation by the researcher .

Zeinb El-Razaz/Engineering Research Journal 166 ( June 2020 ) A18-A 34
A25
The study verified that the best shape is round, followed by the hexagon, as
they have a smaller perimeter to area ration, are less exposed to the sun, and thus gain
less heat. When examining the buildings to reach thermally efficient office Building
envelope in Egypt requires that the form is prevalent in the design of administrative
buildings in Egypt (as shown in Fig 7). So that the research can address the problems
of buildings already in the design stage or make an adjustment to the existing ones in
order to reduce the cooling load. Therefore, the rectangular shape was chosen.
Therefore, for the orientation optimization, the rectangular shape was chosen.
For this step different orientations were examined (North-South, East-West and
Northwest-Southeast, Southwest-Northeast).
The solar gains chart (Fig. (9)) indicates that greater exposure of the facade
towards the east and west directions leads to increased solar gains, since the incidence
angle is small, thus the solar radiation penetrates the whole floor plan. On the other
Fig.(5).Annual total thermal loads for cooling
and Heating loads rankings for different plan
shapes.Source : Simulation by the researcher .
Fig.(6).Annual solar gain rankings for different
plan shapes.
Source : Simulation by the researcher .
Fig.(7).Illustrate the widespread use of rectangular shape of plan for different models of office buildings in
Cairo. Source : https://www.google.com.eg/ (Accessed 2-2-2020) .
Fig.(8).Annual total thermal loads for cooling and
Heating loads rankings for different plan shapes.
Fig.(9).Annual solar gain rankings for different
plan shapes. Source: by the researcher .
22000 32000 42000 15000 35000 55000 75000
25000 26500 28000 75000 79000 83000 87000
NW-SE
N-S
NE-SW
E-W
NW-SE
N-S
NE-SW
E-W
Zeinb El-Razaz/Engineering Research Journal 166 ( June 2020 ) A18-A 34
A26
hand exposure of the long side of the facade towards the south leads to diminished
solar gains due to the fact that the steep incidence angle of the solar radiation limits
the radiation from reaching deep in the floor-plan.
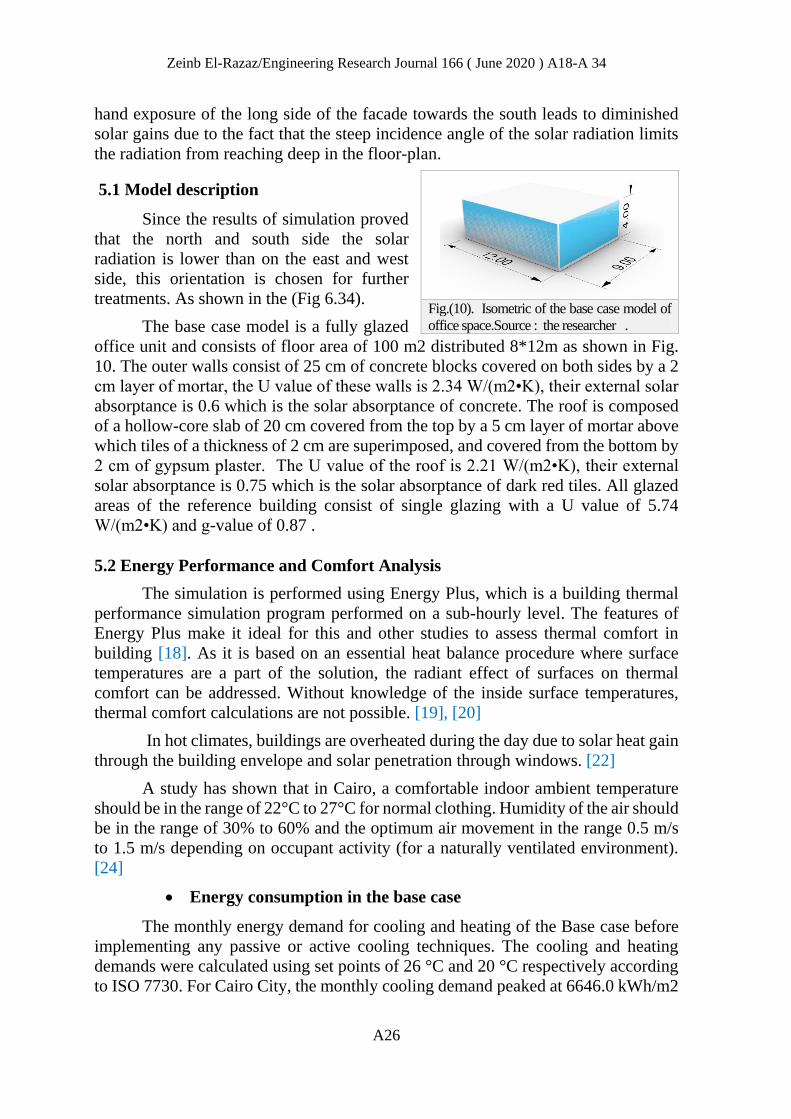
5.1 Model description
Since the results of simulation proved
that the north and south side the solar
radiation is lower than on the east and west
side, this orientation is chosen for further
treatments. As shown in the (Fig 6.34).
The base case model is a fully glazed
office unit and consists of floor area of 100 m2 distributed 8*12m as shown in Fig.
10. The outer walls consist of 25 cm of concrete blocks covered on both sides by a 2
cm layer of mortar, the U value of these walls is 2.34 W/(m2•K), their external solar
absorptance is 0.6 which is the solar absorptance of concrete. The roof is composed
of a hollow-core slab of 20 cm covered from the top by a 5 cm layer of mortar above
which tiles of a thickness of 2 cm are superimposed, and covered from the bottom by
2 cm of gypsum plaster. The U value of the roof is 2.21 W/(m2•K), their external
solar absorptance is 0.75 which is the solar absorptance of dark red tiles. All glazed
areas of the reference building consist of single glazing with a U value of 5.74
W/(m2•K) and g-value of 0.87 .
5.2 Energy Performance and Comfort Analysis
The simulation is performed using Energy Plus, which is a building thermal
performance simulation program performed on a sub-hourly level. The features of
Energy Plus make it ideal for this and other studies to assess thermal comfort in
building [18]. As it is based on an essential heat balance procedure where surface
temperatures are a part of the solution, the radiant effect of surfaces on thermal
comfort can be addressed. Without knowledge of the inside surface temperatures,
thermal comfort calculations are not possible. [19], [20]
In hot climates, buildings are overheated during the day due to solar heat gain
through the building envelope and solar penetration through windows. [22]
A study has shown that in Cairo, a comfortable indoor ambient temperature
should be in the range of 22°C to 27°C for normal clothing. Humidity of the air should
be in the range of 30% to 60% and the optimum air movement in the range 0.5 m/s
to 1.5 m/s depending on occupant activity (for a naturally ventilated environment).
[24]
Energy consumption in the base case
The monthly energy demand for cooling and heating of the Base case before
implementing any passive or active cooling techniques. The cooling and heating
demands were calculated using set points of 26 °C and 20 °C respectively according
to ISO 7730. For Cairo City, the monthly cooling demand peaked at 6646.0 kWh/m2
Fig.(10). Isometric of the base case model of
office space.Source : the researcher .

Zeinb El-Razaz/Engineering Research Journal 166 ( June 2020 ) A18-A 34
A27
in July and the total yearly cooling demand reached 43150.8 kWh/m2. While the
heating demand is predominating with a peak monthly heating demand of nearly 29
kWh/m2 in January and a total yearly heating demand of 74.4kWh/m2.
Therefore, the research focused from its beginning on the cooling techniques,
also simulation proved that the heating loads were not as important as the cooling
loads in a warm climate like Cairo.
It is observed in Fig (11) that total energy consumption increases in May, June,
July, August, September, and October due to increasing solar radiation in these
months . The total yearly energy consumed by the base case model, is 46289.18
kWh/y shows also that the energy consumption in summer period is the highest
consumption of energy.
Temperature
Figure 9 shows outdoor and indoor temperatures for the hottest day of summer
which are the 21th of August for Cairo. These hottest day was determined according
to indoor temperatures. Note that the temperature of the Base case peaked at 37 °C.
which is very uncomfortable. During the coldest day of winter peaked at 16.5 °C.,
which is the 8th of January for model studied, the outdoor temperature reached a
minimum of 15 °C .The coldest day was determined according to indoor
temperatures.
Discomfort Hours
In this study, thermal comfort was assessed through the calculation of
discomfort hours caused by overheating and overcooling in addition to unhealthy
relative humidity. For the model, Results of simulation shows that the number of
overheating hours was about 6041 from 8760 hours over the year. On the other hand,
the sum of overcooling hours over a year was about only 336 hours per year.
6. Proposal Two Optimization Window to Wall Ratio
Window to Wall Ratio (WWR)L: Glazing percentage stands for the amount of
the glazing area to the area of the wall which is very effective in the heat transfer of
Fig.(11).The base case simulation results that show Monthly Energy Consumption For base case and
maximum energy consumption during May to October (cooling period) .
Source : Simulation by the researcher (Accessed 21-7-2019) .
618.9 493.39
2717.47
4018.65
5551.16079.53
6934.73
6332.27
5586.82
4755.14
2253.54
947.52
0
1000
2000
3000
4000
5000
6000
7000
8000
Jan Feb Mrch April May June Jul Augs Sept Oct Nov Dec
CO
NSU
MP
TIO
N K
WH
MONTHES
Zeinb El-Razaz/Engineering Research Journal 166 ( June 2020 ) A18-A 34
A28
buildings. In case this amount is reduced, less heat will be transferred outside (heat
loss). On the other hand, greater percentage of glazing lets more solar radiation in
which leads to a greater heat gain. Although it is the main source of natural lighting,
there should be an optimal amount so that the amount of heat gain is minimized,
without sacrificing proper level of natural lighting. [25]
6.1 Model description
In order to determine the optimum percentage of window size in the external
facades of an office model, the model dimensions were considered to be 8 m x 12 m
with a height of 4 m; this model has an eastern-western orientation axis, as illustrated
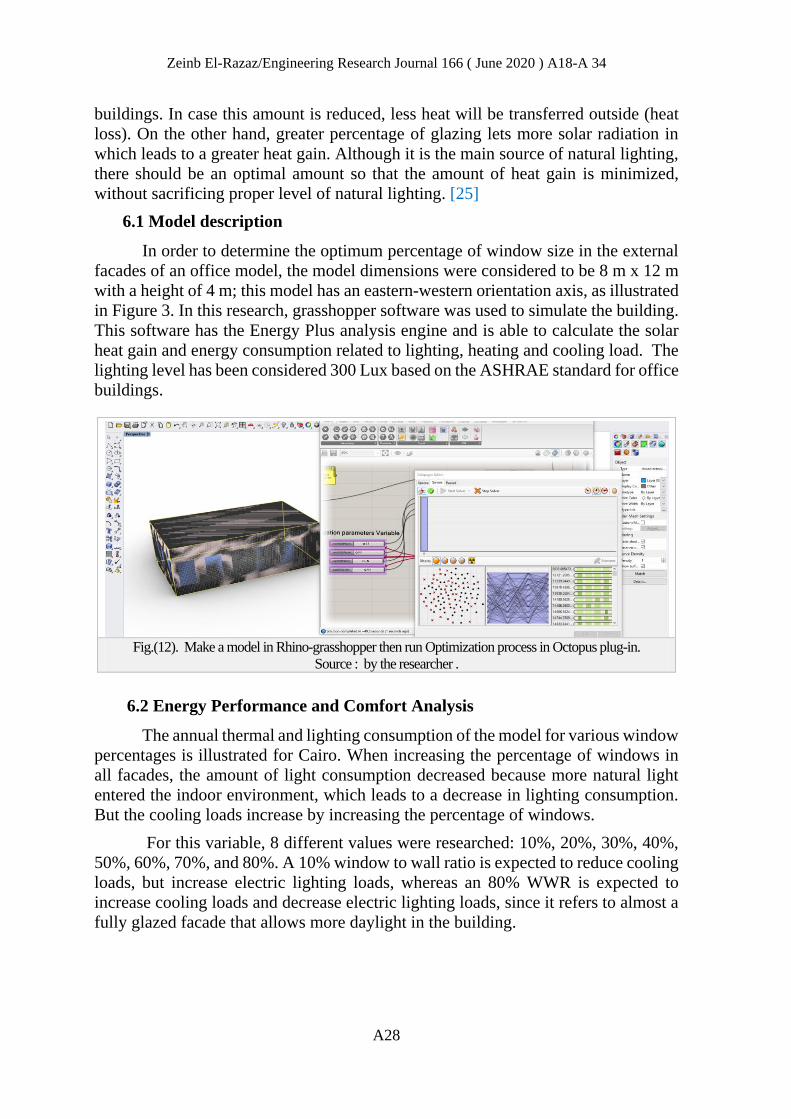
in Figure 3. In this research, grasshopper software was used to simulate the building.
This software has the Energy Plus analysis engine and is able to calculate the solar
heat gain and energy consumption related to lighting, heating and cooling load. The
lighting level has been considered 300 Lux based on the ASHRAE standard for office
buildings.
6.2 Energy Performance and Comfort Analysis
The annual thermal and lighting consumption of the model for various window
percentages is illustrated for Cairo. When increasing the percentage of windows in
all facades, the amount of light consumption decreased because more natural light
entered the indoor environment, which leads to a decrease in lighting consumption.
But the cooling loads increase by increasing the percentage of windows.
For this variable, 8 different values were researched: 10%, 20%, 30%, 40%,
50%, 60%, 70%, and 80%. A 10% window to wall ratio is expected to reduce cooling
loads, but increase electric lighting loads, whereas an 80% WWR is expected to
increase cooling loads and decrease electric lighting loads, since it refers to almost a
fully glazed facade that allows more daylight in the building.
Fig.(12). Make a model in Rhino-grasshopper then run Optimization process in Octopus plug-in.
Source : by the researcher .

Zeinb El-Razaz/Engineering Research Journal 166 ( June 2020 ) A18-A 34
A29
Tab
le (4)
: Optim
izat
ion
of W
WR
of th
e m
odel
and
its
effe
ct o
n so
lar ra
diat
ion
and th
us
on
the
buildi
ng's e
ner
gy c
onsu
mption
.
80%
43173.1
3
73.5
9
3063.8
1
46310.5
4
79735.0
70%
40902.6
5
72.4
0
3390.3
1
44365.3
6
69775.7
60%
38481.9
1
74.4
0
3600.5
2
42156.8
3
59821.8
50%
35915.9
7
81.5
1
3829.4
6
39826.9
4
49874.2
40%
33193.3
3
94.8
2
4124.6
7
37412.8
2
39919.5
30%
30314.1
0
121.3
8
4577.4
8
35012.9
5
29942.3
20%
27308.7
8
172.4
9
4719.2
2
32200.4
9
19961.1
10%
24200.2
1
279.5
9
5084.7
1
29564.5
1
9981.1
WW
R
cooli
ng
Hea
tin
g
Lig
hti
ng
Tota
l
ener
gy
S
ola
r gain
10
%
20
%
30
%
40
%
50
%
60
%
70
%
80
%

Zeinb El-Razaz/Engineering Research Journal 166 ( June 2020 ) A18-A 34
A30
The glazing ratio is the same for all directions for this first optimization round.
The chart (Fig. 13) illustrates the effect of WWR on the energy demand and comfort
levels. Small windows have a positive effect on reducing energy demand, but also
increasing comfort levels in a building, since they lead to reduced solar heat gains
and thus reduced cooling loads.
The percentage of windows area in the four north, south, east, and west facades
of the building has been investigated from 10% to 80% with a 10% step. In order to
determine the optimum percentage of a building facade, at first all facades were
considered the percentage of the window on that facade was changed and the data of
solar heat gain, cooling load, heating load, and the annual lighting consumption of
each mode were determined.
Usually, in the design of static buildings to decrease the amount of solar heat
gain, at the southern facade small windows are used and at the northern facade large
windows are utilized. The impact of increasing the northern window areas and
reducing the southern windows in static buildings was examined. The results of this
study revealed that the dimensions of the energy-efficient window had a high impact
on the cooling load [24] .
Fig.(13).Annual total energy loads for cooling ,
Heating loads rankings for different WWR.
Fig.(14).Annual total Lighting loads for different
WWR.
Results of the multi-objective optimization.
The dark color represents the non-dominated
solutions from the last generation, the light
color represents all other evaluated solutions.
Choose different alternatives method for
optimization to reach the best alternative
from thousands of solutions .
The data is aggregated of cooling load
&heating load and the annual lighting
consumption of each mode were
determined.
Fig.(15). Optimization process to reach the optimum window-to-wall ratio. Source : by the researcher .
North West South East 90%
80%
70%
60%
50%
40%
30%
20%
10%
00%
10%
10%
26000 36000 46000
1 0 %
2 0 %
3 0 %
4 0 %
5 0 %
6 0 %
7 0 %
8 0 %
Annual Total energy Loads (kWh/y )
2400 2900 3400 3900 4400 4900
1 0 %
2 0 %
3 0 %
4 0 %
5 0 %
6 0 %
7 0 %
8 0 %
Annual Lighting Loads (kWh/y )

Zeinb El-Razaz/Engineering Research Journal 166 ( June 2020 ) A18-A 34
A31
Algorithms optimization is used to optimize the envelope design of buildings.
In simulations that were conducted with optimization, the genetic algorithm is
coupled to a building engine in order to select optimal values for window-to-wall
ratio (WWR) parameters for the minimum energy consumption of buildings. The
optimum WWR in a building it was 60% in the north façade but 40% in the south
façade and 50% in the West and East façade.
Energy consumption in the proposal two
After reaching the optimum WWR, The results of the proposal should be
compared to the previous situation and verification of energy saving towards thermal
comfort. By comparing the total energy for cooling, heating and lighting energy
demands of the new model to the Base case model. The cooling energy demand
reduced by 18.1%, but it increased the heating demand by 16%. However, the lighting
remains constant due to the achievement of the required levels of natural lighting, and
it was not called to operate the artificial lighting.
Table (5). Comparing the energy consumption for cooling, heating and lighting energy demands of the new
model to the Base case model.
Model Cooling heating light
Base Case 43173.13 73.59 3063.8
Optimized WWR model 35343.67 89.04 3063.8
The total yearly energy consumed by the base case model for thermal energy
(cooling and heating), was 46289.18 kWh/y and after optimizing the glazing ration
became 38496.53 kWh/y. the next fig(16) shows Monthly Energy Consumption For
thermal energy (cooling and heating) for previous situation and new proposal model
. This saved energy by 16.8 %. These results show that regarding the total energy
demand, how the optimal design of the proportions of the building envelope openings
is important.
Fig.(16).Monthly total Energy Consumption for (cooling, heating and lighting) for previous situation (Base
case) and new proposal model (model optimized WWR) . source : the researcher.
Jan Feb Mrch April May June Jul Augs Sept Oct Nov Dec
Base case 618.9 493.4 2717.54018.75551.16079.56934.76332.35586.84755.12253.5 947.5
optimized WWR 445.5 329.9 1908.53244.74829.75376.96241.45606.64700.23703.21572.0 537.9
0.0
1000.0
2000.0
3000.0
4000.0
5000.0
6000.0
7000.0
CO
NSU
MP
TIO
N K
WH

Zeinb El-Razaz/Engineering Research Journal 166 ( June 2020 ) A18-A 34
A32
Temperature
The results show an offset of the maximum indoor air temperature in the
Optimized WWR model was reached 32.1°C as shown in fig16, where a decrease of
5 °C was observed compared to the base case model. On the other hand, the minimum
temperature peaked at 18.1 °C was increased by 1.6 °C.
Discomfort Hours
Table 22 shows the number of overheating hours of the model after
optimization of glazing ratio, the researcher noted that there are 5300 hours of
overheating (based on 27°C) and that the temperature exceeds 30 °C only 1022 hours
throughout the year compared to 6041 hours of overheating for the base model which
shows a clear improvement of the thermal comfort.
On the other hand, the table also shows that the number of overcooling hours
is about 411hours compared to the base model which has 336 hours of overcooling,
this leads to the conclusion that even if the energy demand for heating is greatly
reduced, the number of hours when the temperature is below 20 °C has not been
improved. But the researcher noted from the results that many temperatures may
reach between 18 and 19 degrees, so the difference is no longer significant .
Table (6) count discomfort hours in new model to measure achieving thermal comfort.
Model Overheating Hours >27°C Overheating Hours >30°C Overcooling Hours < 20°C
Base Case 6041 2231 336
WWR model 5300 1022 411
7. Results and discussion
The results indicate that the proportion of openings have a major impact on
reducing energy consumption and reducing discomfort hours in the building. It also
affected improving temperatures by 5 degrees.
Fig.(17).The simulation results show Max & Min Indoor Temp for Hottest & coldest day to compare with
Thermal comfort range and after optimized WWR . Source : by the researcher .
14.0
17.0
20.0
23.0
26.0
29.0
32.0
35.0
38.0
1 2 3 4 5 6 7 8 9 10 11 12 13 14 15 16 17 18 19 20 21 22 23 24
Coldest day for Base case Hottest day for Base case
Hottest day after optimized WWR model Coldest day after optimized WWR model
16.5 °C
37°C
32.1°C
18.1 °C
Thermal comfort Range

Zeinb El-Razaz/Engineering Research Journal 166 ( June 2020 ) A18-A 34
A33
8. Conclusion
In the pursuit of a sustainable society, the improvements of environmental
performance in buildings have a critical impact. It is essential to have suitable tools
available at the conceptual design stage to assist designers to find efficient alternative
designs. This paper proposed optimization model that can be used to determine
optimum or near optimum shape, orientation and the window to wall ratio (WWR) of
the building in office model in Cairo climate.
Finally, the optimization results of the building design multi-objective
optimization model for the case study show significant improvements of the energy
performance, and insignificant improvement of indoor thermal and optical comfort
performance.
The simulation results suggest that the building design multi-objective
optimization model is an effective tool for building optimization design.
References
[1] Attia, S. (2010). Building performance simulation tools: selection criteria and user survey. Architecture et climat..
[2] Roudsari, M. S., Pak, M., & Smith, A. (2013, August). Ladybug: a parametric environmental plugin for grasshopper to help designers create an environmentally-conscious design. In Proceedings of the 13th international IBPSA conference held in Lyon, France A.
[3] McNeel, R. (2010). Grasshopper-Generative Modeling with Rhino, McNeel North America, Seattle, USA..
[4] Day, M. (2010). 2000-2010. Rhino Grasshopper, AEC Magazine, X3DMedia..
[5] Lagios, K., Niemasz, J., & Reinhart, C. F. (2010). Animated building performance simulation (ABPS)–linking Rhinoceros/Grasshopper with Radiance/Daysim. Proceedings of SimBuild, 4(1), 321-327..
[6] Ward, G. J. (1994, July). The RADIANCE lighting simulation and rendering system. In Proceedings of the 21st annual conference on Computer graphics and interactive techniques (pp. 459-472)..
[7] Reinhart, C. F., & Walkenhorst, O. (2001). Dynamic RADIANCE-based Daylight Simulations for a full-scale Test Office with outer Venetian Blinds. Energy & Buildings, 33(7), 683-697..
[8] Turrin, M., Von Buelow, P., & Stouffs, R. (2018). Design explorations of performance driven geometry in architectural design using parametric modeling and genetic algorithms. Advanced Engineering Informatics, 25(4), 656-675..
[9] Zemella, G., De March, D., Borrotti, M., & Poli, I. (2011). Optimised design of energy efficient building façades via evolutionary neural networks. Energy and Buildings, 43(12), 3297-3302..
[10] Soong, B. H., Kandasamy, N. K., Karunagaran, G., Spanos, C., & Tseng, K. J. (2018). Smart lighting system using ANN-IMC for personalized lighting control and daylight harvesting..
[11] Park, C. S., Augenbroe, G., & Messadi, T. (2013, August). Daylighting optimization in smart facade systems. In Proceedings of the Eighth International IBPSA Conference (Vol. 107)..
[12] Yoon, S. H., Park, C. S., & Augenbroe, G. (2011). On-line parameter estimation and optimal control strategy of a double-skin system. Building and Environment, 46(5), 1141-1150..

Zeinb El-Razaz/Engineering Research Journal 166 ( June 2020 ) A18-A 34
A34
[13] Srisamranrungruang, T., & Hiyama, K. (2020). Balancing of natural ventilation, daylight, thermal effect for a building with double-skin perforated facade (DSPF). Energy and Buildings, 109765..
[14] Fang, Y., & Cho, S. (2019). Design optimization of building geometry and fenestration for daylighting and energy performance. Solar Energy, 191, 7-18..
[15] Grande, E., Imbimbo, M., & Tomei, V. (2018). Role of global buckling in the optimization process of grid shells: Design strategies. Engineering Structures, 156, 260-270..
[16] Hammad, H., Abd Elkader, M., & Fagal, A. (2017). Investigating the Thermal Comfort Conditions in an Existing School Building in Egypt. submitted to Assiut Engineering University Journal..
[17] Peel, M. C., Finlayson, B. L., & McMahon, T. A. (2007). Updated world map of the Köppen-Geiger climate classification. Hydrology and earth system sciences discussions, 4(2), 439-473..
[18] Touloupaki, E., & Theodosiou, T. (2017). Optimization of building form to minimize energy consumption through parametric modelling. Procedia environmental sciences, 38, 509-514..
[19] Zhang, J. (2020, January). Research on building energy efficiency based on energyplus software. In IOP Conference Series: Earth and Environmental Science (Vol. 432, No. 1, p. 012013). IOP Publishing..
[20] Zhu, J., Tong, L., Li, R., Yang, J., & Li, H. (2020). Annual thermal performance analysis of underground cave dwellings based on climate responsive design. Renewable Energy, 145, 1633-1646..
[21] Teixeira, H., Gomes, M. G., Rodrigues, A. M., & Pereira, J. (2020). Thermal and visual comfort, energy use and environmental performance of glazing systems with solar control films. Building and Environment, 168, 106474..
[22] Somasundaram, S., Chong, A., Wei, Z., & Thangavelu, S. R. (2020). Energy saving potential of low-e coating based retrofit double glazing for tropical climate. Energy and Buildings, 206, 109570..
[23] Standard, A. S. H. R. A. E. (2010). Standard 55-2010, Thermal environmental conditions for human occupancy. American Society of Heating, Refrigerating and Air Conditioning Engineers..
[24] Gan, V. J., Lo, I. M., Ma, J., Tse, K. T., Cheng, J. C., & Chan, C. M. (2020). Simulation Optimisation towards Energy Efficient Green Buildings: Current Status and Future Trends. Journal of Cleaner Production, 120012..
[25] Wang, Y., Wang, R., Li, G., & Peng, C. (2020). An investigation of optimal window-to-wall ratio based on changes in building orientations for traditional dwellings. Solar Energy, 195, 64-81..
[26] M. V. B. P. &. S. R. Turrin, " Design explorations of performance driven geometry in architectural design using parametric modeling and genetic algorithms ," Advanced Engineering Informatics, vol. 25, no. 4, pp. 656-675., 2018.
[27] Abdullah, H. K., & Alibaba, H. Z. (2020). Window Design of Naturally Ventilated Offices in the Mediterranean Climate in Terms of CO2 and Thermal Comfort Performance. Sustainability, 12(2), 473..