sustainable livelihood approach: a critical analysis of ... · sustainable livelihood approach: a...
TRANSCRIPT

Sustainable Livelihood
Approach: A critical
analysis of theory and
practice.
Stephen Morse, Nora McNamara
and Moses Acholo
Geographical Paper No. 189

1
Sustainable Livelihood Approach: A critical
analysis of theory and practice.
Geographical Paper No. 189
Stephen Morse
Department of Geography, University of Reading, UK
Nora McNamara and Moses Acholo
Diocesan Development Services (DDS), Idah, Kogi State,
Nigeria
November 2009
Series Editor: A.M.Mannion

2
Contents
Section Page number
1. Introduction 4
2. The SLA context; two villages in Nigeria. 16
3. The SLA space 18
4. Practice of SLA 21
5. Human capital: the households 23
6. Natural capital: land and farming 29
7. Natural capital: Trees 37
8. Social capital: Networks 40
9. Physical capital: assets for income generation 44
10. Financial capital: household budgets 52
11. Vulnerability context 56
12. Did SLA succeed? 58
13. Some conclusions 63
14. Acknowledgements 64
15. References 64

3
Abstract
Sustainable Livelihood Analysis (SLA) has since the 1990s become the dominant
approach to the implementation of development interventions by a number of major
international agencies. It is defined in terms of the ability of a social unit to enhance
its assets and capabilities in the face of shocks and stresses over time. SLA first seeks
to identify the important assets in livelihood, their trends over time and space as well
as the nature and impacts of shocks and stresses (environmental, economic and social)
upon these assets. Following this, and after taking cognisance of the wider context
(e.g. political, legal, economic, institutions, infrastructure etc.), interventions are
designed to address any vulnerability of enhance livelihoods perhaps by
diversification of income streams. Thus SLA could be said to be a practical
framework for evidence-based intervention and has much logic resting behind it,
especially in a world undergoing rapid change and where resources to support
development interventions are inevitably limited. However, putting SLA into practice
is not as easy as it may so often appear, and there are many overlaps with the
problems long-reported of making policy in general more evidence-based.
Surprisingly there are relatively few reported attempts to take a more critical stance as
to the feasibility of SLA and its ability to help deliver real change for people in the
developing world.
This paper critically assesses SLA from the perspective of putting it into practice in
one place: the middle belt of Nigeria. This experience is dovetailed into the existing
literature on SLA and to a lesser extent evidence-based policy to explore where
problems occurred and how they can be addressed. The Nigerian case study is based
on the work of a Catholic Church development organisation (Diocesan Development
Services; DDS) and its use of SLA to help provide the basis for changes it was
planning to an existing intervention, namely micro-credit. The SLA was piggy-backed
onto work it was contracted to do for the Department for International Development
(DFID) and indeed the planned changes to the micro-credit scheme were also partly to
ensure longer-term impact arising out of the DFID project. Thus the context was one
where the SLA was to some extent constrained by decisions that had already been
taken and the audience was at least in part other aid agencies that DDS was
approaching to help support the micro-credit scheme. However, DDS had over 30
years experience of working in the region and a wealth of expertise of engaging in
such village-level work. Further advantages were provided by a decision to focus
only on two „representative‟ villages and to implement the work over a two year
period in parallel with its evolution of the micro-credit scheme. Despite these
advantages the implementation of SLA posed many problems and issues, and
questions need to be asked as to whether the approach really is a feasible basis for
intervention or whether it is nothing more than a convenient label.
4
1. Introduction
The Sustainable Livelihood Approach (SLA) to development intervention has been in
vogue since the late 1990s and formed a central concept of the UK‟s Department for
International Development‟s (DFID) strategy during the early years of the New
Labour government in the UK. The call for emphasis on sustainable livelihoods was
set out in the 1997 White Paper on international development as follows:
“…refocus our international development efforts on the elimination of poverty
and
encouragement of economic growth which benefits the poor. We will do this
through support for international sustainable development targets and policies
that create sustainable livelihoods for poor people, promote human
development and conserve the environment”
DFID (1997: Summary, page 6).
What exactly are these „sustainable livelihoods‟ that DFID intends to help create? One
definition is provided by Chambers and Conway (1992) some 5 years before the
White Paper:
“A livelihood comprises the capabilities, assets (stores, resources, claims and
access) and activities required for a means of living; a livelihood is sustainable
which can cope with and recover from stress and shocks, maintain or enhance
its capabilities and assets, and provide sustainable livelihood opportunities for
the next generation; and which contributes net benefits to other livelihoods at
the local and global levels and in the short and long-term.”
Chambers and Conway (1992, page 7).
In this definition a number of strands coalesce. On the one hand there is a requirement
for livelihood to be able to recover from “stress and shocks” but also to be able to
“maintain and enhance” capabilities and assets into the future. A central element in
this „resilience‟ to stress and shocks is the diversification of elements that comprise
„livelihood‟.
Just prior to publication of the White Paper Carney (1998) provides a simpler vision
but also one which has resonance with that of Chambers and Conway:
“A livelihood comprises the capabilities, assets (including both material and
social resources) and activities required for a means of living.”
and, when merged with sustainability
“A livelihood is sustainable when it can cope with and recover from stresses
and shocks and maintain or enhance its capabilities and assets both now and in
the future, while not undermining the natural resource base.”
SLA is an example of the „multiple capital‟ approach where sustainability is
considered in terms of available capital (natural, human, social, physical and
financial) and an examination of the vulnerability context (trends, shocks and
stresses) in which these assets exist. An outline of SLA and suggestions for putting it
into practice can be found in „guidance notes‟ produced by DFID (available at

5
www.nssd.net/references/SustLiveli/). Five principal assets (or capitals) are
suggested as important to livelihood and they are presented as a pentagon in Figure 1.
Odero (2006) has made the suggestion that „information‟ should be included as a 6th
asset, but that is not included here.
Figure 1. The five capitals of sustainable livelihood (after Scoones 1998)
Natural capitalnatural resource stocks (soil, water, air, genetic resources etc.) and
environmental services (hydrological cycle, pollution sinks etc)
Human capitalskills, knowledge, labour
(includes good health and
physical capability)
Economic or financial capitalcapital base (cash, credit/debt, savings, and other
economic assets)
Social capital social resources (networks, social
claims, social relations, affiliations,
associations)
Physical capital Infrastructure (buildings, roads),
production equipment and
technologies)
Some of the capitals are straightforward i.e. buildings, machinery, land, cash and so
on – while some are less immediately obvious – social networks, knowledge and good
health are examples. All are important although clearly the balance will change from
household to household and over time. Thus even a relatively simple diagram such as
Figure 1 has much embedded complexity.
Once these assets have been identified and assessed in terms of the contribution they
make (or could make) it is necessary to explore the vulnerability context in which
they exist; what are the trends, shocks and stresses? Thus it is not only a matter of
knowing what is happening now but also what the trends are and what could happen
in the future. Some of the assets may change little over time (e.g. land and buildings)
while others such as cash and social networks can be volatile and depend upon
movement of people into and out of the household. Vulnerability to shocks can also
vary. A drought for example will impact upon natural capital and in turn reduce crop
yields, but may have little if any effect on other capitals. In the longer term, of course,
a severe drought could impact on a wide range of capitals, including social and human
as people emigrate. Similarly, flooding may damage physical and natural capital
while having little impact on the others. Thus the capitals will vary in terms of their
resilience to different types of shock and the intensity of that shock.
Moreover it is necessary to examine the policy and institutional context within which
these capitals exist. While some capitals may be vulnerable to certain shocks it may
be that authorities are able to act and limit any damage which occurs or perhaps
provide recompense. While assets may be damaged by flooding there may be
publically owned structures in place to reduce the likelihood of the disaster occurring.
Similarly, there may be publically funded extension services available which can
supplement the knowledge base of farmers or provide advice and help with irrigation

6
systems. It is not only government services which need to be considered here as they
may be non-governmental or even private agencies at hand that can provide support
for livelihoods. Only when all of this is considered can it be possible to develop
strategies that help enhance livelihood (i.e. generate positive livelihood outcomes).
The assumption is that these planned outcomes would feedback to enhance livelihood
assets and make them more resilient.
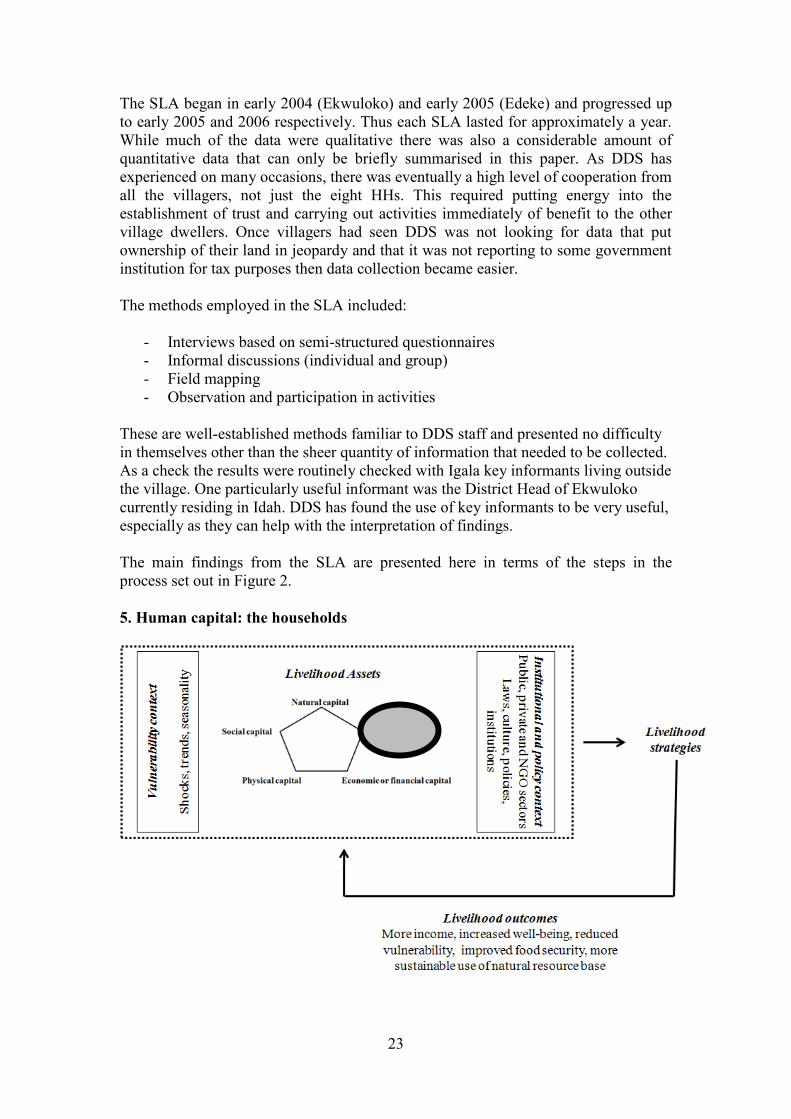
The logic outlined above is the basis for SLA and is typically represented as set out in
Figure 2. Thus SLA can be considered in a number of different ways (Farrington,
2001):
1. a set of principles guiding development interventions (whether community-led
or otherwise). The fundamental issue here is the notion that an intervention
has to be evidence-based rather than instigated in top-down fashion without
adequate knowledge of the community.
2. an analytical framework to help understand what „is‟ and what can be done.
Thus the logic as set out here is to appreciate the capitals which are present,
their vulnerability and the involvement of institutions. The logic provides a
framework which can serve as the basis for an analysis.
3. an overall developmental objective. In this case development is the
improvement of livelihood sustainability, perhaps by making capital less
vulnerable or by enhancing the contributions that some capitals can make or
even by improving the institutional context.
It is these three – a set of principles, an analytical framework and an objective - which
help explain the popularity of SLA. However like all initiatives in post-Second World
War development SLA did not come out of a vacuum but from the evolution of a
number of older trends and ideas. There are echoes here of an influence from the
UNDPs Human Development approach, which itself was influenced by the work of
economist Amartya Sen and his writing on capability (Sen, 1984, 1985). Indeed
„human development‟ took as central tenant the importance of enhancing capability:
“Human development is a process of enlarging people’s choices. In principle,
these choices can be infinite and change over time. But at all levels of
development, the three essential ones are for people to lead a long and healthy
life, to acquire knowledge and to have access to resources needed for a decent
standard of living. If these essential choices are not available, many other
opportunities remain inaccessible”.
UNDP HDR (1990; page 10); emphasis added
Enlarging choices can be achieved by widening the capital base, for example by
education. There are also nods in the direction of sustainable development albeit with
an unambiguous focus on people:
“the development process should meet the needs of the present generation
without compromising the options of future generations. However, the concept
of sustainable development is much broader than the protection of natural
resources and the physical environment. It includes the protection of human
7
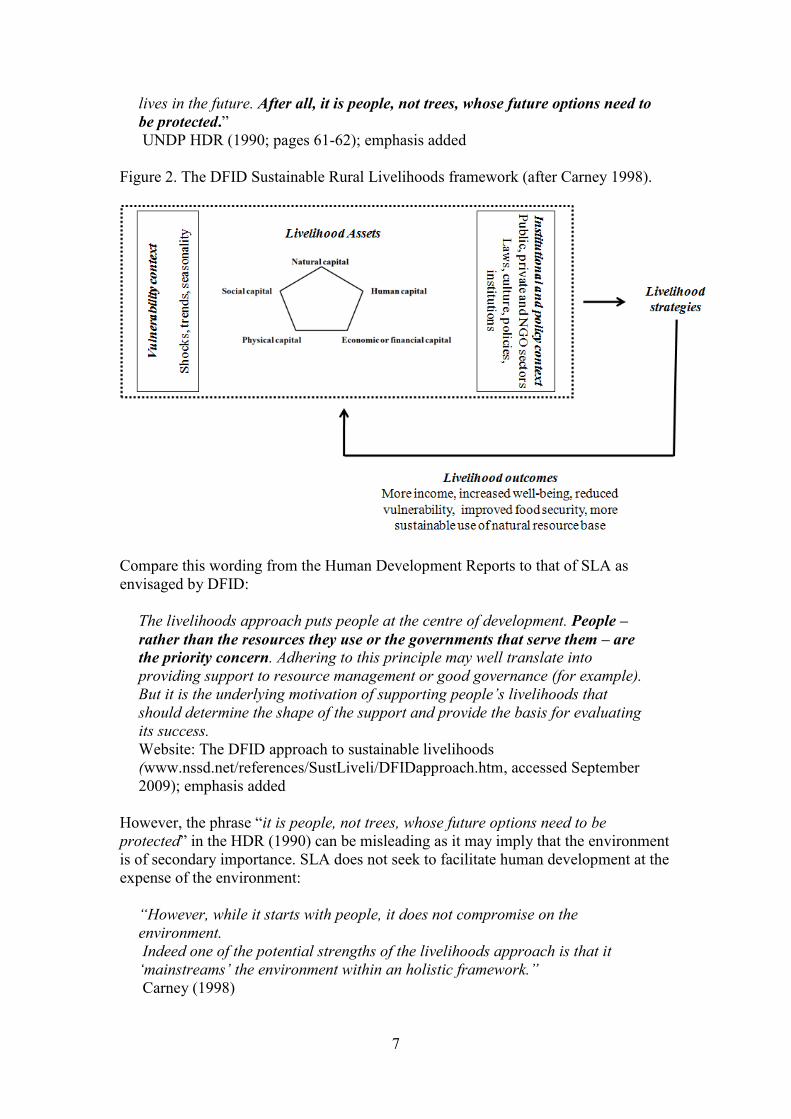
lives in the future. After all, it is people, not trees, whose future options need to
be protected.”
UNDP HDR (1990; pages 61-62); emphasis added
Figure 2. The DFID Sustainable Rural Livelihoods framework (after Carney 1998).
Compare this wording from the Human Development Reports to that of SLA as
envisaged by DFID:
The livelihoods approach puts people at the centre of development. People –
rather than the resources they use or the governments that serve them – are
the priority concern. Adhering to this principle may well translate into
providing support to resource management or good governance (for example).
But it is the underlying motivation of supporting people‟s livelihoods that
should determine the shape of the support and provide the basis for evaluating
its success.
Website: The DFID approach to sustainable livelihoods
(www.nssd.net/references/SustLiveli/DFIDapproach.htm, accessed September
2009); emphasis added
However, the phrase “it is people, not trees, whose future options need to be
protected” in the HDR (1990) can be misleading as it may imply that the environment
is of secondary importance. SLA does not seek to facilitate human development at the
expense of the environment:
“However, while it starts with people, it does not compromise on the
environment.
Indeed one of the potential strengths of the livelihoods approach is that it
„mainstreams‟ the environment within an holistic framework.”
Carney (1998)

8
“Short-term survival rather than the sustainable management of natural capital
(soil, water, genetic diversity) is often the priority of people living in absolute
poverty.
Yet DFID believes in sustainability. It must therefore work with rural people to
help them understand the contribution (positive or negative) that their
livelihoods are making to the environment and to promote sustainability as a
long-term objective.
Indicators of sustainability will therefore be required.”
Carney (1998)
It is sometimes said that human development as encouraged by UNDP has more in
common with the earlier „basic needs‟ approaches to poverty measurement and
alleviation than to Sen‟s vision of capabilities (Srinivasan, 1994; Ravallion, 1997).
„Basic needs‟ is a generic term which covers approaches based on the notion that
human beings need a basic set of resources (food, water, clothing, shelter etc.) to
survive. Exactly what these are can vary depending upon who is defining „basic
needs‟. Sen makes a clear distinction between „basic needs‟ and capabilities (Sen,
1984; pages 513-515), but even so the influence of human development on SLA is
clear. Nonetheless, the origins of SLA predate the origin of UNDP‟s human
development (de Haan, 2005), and includes an influence from what was called „new
household economics‟ in the 1980s and its focus on household labour, income
generation and expenditure, even if there were recognized limitations to seeing
households in such mechanical terms:
“The major shortcoming of structural-functional and economic approaches to
the household is the neglect of the role of ideology. The socially specific units
that approximate „households‟ are best typified not merely as clusters of task-
oriented activities that are organized in variable ways, not merely as places to
live/eat/work/reproduce, but as sources of identity and social markers. They are
located in structures of cultural meaning and differential power.”
Guyer and Peters (1987, page 209). Cited in de Haan (2005, page 3)
There are also resonances from the more macro-scale field of „integrated rural
development‟ (IRD) which was very much in vogue during the 1960s and 1970s
amongst major funders such as the World Bank (Yudelman, 1976; D'Silva and Raza,
1980). The literature on IRD is substantial and does not need to be reviewed in depth
here. An early review is provided by Ruttan (1984). For some recent discussions of
successes/failures the interested reader is referred to Gaiha et al. (2001) for IRD in
India, Zoomers (2005) for IRD supported by the Netherlands' Directorate-General for
International Cooperation (DGIS) and carried out between 1975-2005 in Asia, Africa
and Latin America, and Fenichel and Smith (1992) for IRD in Zambia. The
manifestation of IRD often took the form of large projects implemented over 5 years
or so and covering regions of a nation state with staff seconded from government
agencies; a form of decentralisation. The „integration‟ in the title usually means a
consideration of multiple sectors and how they interact. Thus agricultural
development also requires effective infrastructure such as roads and adequate health
care. The latter in turn depends upon good quality and quantity of water supply and so
on, and the IRD project will address them all. The key assumption is that a sector
cannot be taken in isolation but has to be a part of an integrated whole. If the word

9
sector is replaced by asset or capital then IRD would appear to have much in common
with SLA. After all, Figure 1 embodies this same sense of interaction.
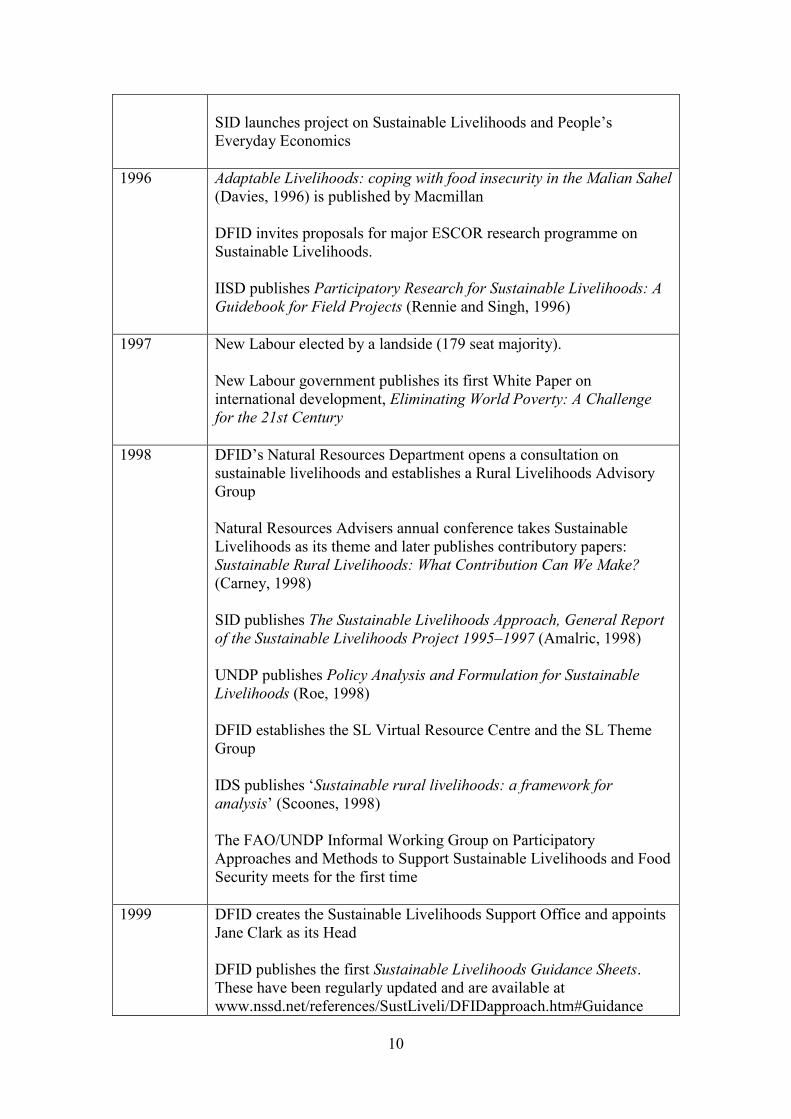
Indeed there are so many influences which have helped spawn SLA that it is helpful
to set them out as a chronology. Table 1 is based upon a chronology set out by
Solesbury (2003) covering the period 1984 to 2002.
Table 1 Sustainable Livelihoods Chronology (after Solesbury, 2005, pages 3-4)
1960s/1970s Integrated Rural Development projects funded by the World Bank and
others
1984 1980s sees the rise of New Household Economics
Long refers to „livelihood strategies‟ in his book „Family and work in
rural societies‟
1985 Amartya Sen‟s book Commodities and Capabilities is published by
Oxford University Press.
1987 The World Commission on Environment and Development (WCED)
publishes its report: Our Common Future (often referred to as the
„Brundtland Commission report‟)
1988 IIED publishes papers from its 1987 conference: The Greening of Aid:
Sustainable Livelihoods in Practice (Conroy and Litvinoff, eds., 1988)
1990 UNDP publishes the first Human Development Report which included
the Human Development Index (HDI); an amalgam of income, life
expectancy and education regarded as important components within
capability.
1992 UN holds Conference on Environment and Development (Earth
Summit 1992)
IDS publishes „Sustainable Rural Livelihoods: Practical concepts for
the 21st century‟ (Chambers and Conway, 1992)
1993 Oxfam starts to employ SLA in formulating overall aims, improving
project strategies and staff training
1994 CARE adopts household livelihoods security as a programming
framework in its relief and development work
1995 UN holds World Summit for Social Development
UNDP adopts Employment and Sustainable Livelihoods as one of five
priorities in its overall human development mandate, to serve as both a
conceptual and programming framework for poverty reduction
IISD publishes Adaptive Strategies and Sustainable Livelihoods (Singh
and Kalala, 1995), the report of a UNDP-funded programme
10
SID launches project on Sustainable Livelihoods and People‟s
Everyday Economics
1996 Adaptable Livelihoods: coping with food insecurity in the Malian Sahel
(Davies, 1996) is published by Macmillan
DFID invites proposals for major ESCOR research programme on
Sustainable Livelihoods.
IISD publishes Participatory Research for Sustainable Livelihoods: A
Guidebook for Field Projects (Rennie and Singh, 1996)
1997 New Labour elected by a landside (179 seat majority).
New Labour government publishes its first White Paper on
international development, Eliminating World Poverty: A Challenge
for the 21st Century
1998 DFID‟s Natural Resources Department opens a consultation on
sustainable livelihoods and establishes a Rural Livelihoods Advisory
Group
Natural Resources Advisers annual conference takes Sustainable
Livelihoods as its theme and later publishes contributory papers:
Sustainable Rural Livelihoods: What Contribution Can We Make?
(Carney, 1998)
SID publishes The Sustainable Livelihoods Approach, General Report
of the Sustainable Livelihoods Project 1995–1997 (Amalric, 1998)
UNDP publishes Policy Analysis and Formulation for Sustainable
Livelihoods (Roe, 1998)
DFID establishes the SL Virtual Resource Centre and the SL Theme
Group
IDS publishes „Sustainable rural livelihoods: a framework for
analysis‟ (Scoones, 1998)
The FAO/UNDP Informal Working Group on Participatory
Approaches and Methods to Support Sustainable Livelihoods and Food
Security meets for the first time
1999 DFID creates the Sustainable Livelihoods Support Office and appoints
Jane Clark as its Head
DFID publishes the first Sustainable Livelihoods Guidance Sheets.
These have been regularly updated and are available at
www.nssd.net/references/SustLiveli/DFIDapproach.htm#Guidance

11
DFID also publishes Sustainable Livelihoods and Poverty Elimination
(DFID, 1999) and Livelihoods Approaches Compared (Carney et al.,
1999)
Presenters at the Natural Resources Advisers‟ Conference report
progress in implementing SL approaches and DFID later publishes
these in Sustainable Livelihoods: Lessons from Early Experience
(Ashley and Carney, 1999)
ODI publishes „Sustainable Livelihoods in Practice: early application
of concepts in rural areas‟ (Farrington et al., 1999)
DFID establishes the Sustainable Livelihoods Resource Group of
researchers/consultants
Amartya Sen‟s book Development As Freedom is published
2000 DFID commissions and funds Livelihoods Connect, a website serving
as a learning platform for SLA
FAO organises an Inter-agency Forum on Operationalising Sustainable
Livelihoods Approaches, involving DFID, FAO, WFP, UNDP, and
IFAD
DFID publishes Sustainable Livelihoods – Current thinking and
practice (DFID, 2000a); Sustainable Livelihoods – Building on
Strengths (DFID, 2000b); Achieving Sustainability:Poverty
Elimination and the Environment (DFID, 2000c); and more SL
Guidance Sheets
The Sustainable Livelihoods Resource Group establishes a subgroup
on PIP (Policy, Institutions and Processes)
IDS publishes „Analysing Policy for Sustainable Livelihoods‟
(Shankland, 2000), the final report from its ESCOR programme
Oxfam publishes Environments and Livelihoods: Strategies for
Sustainability (Neefjes, 2000)
Mixing it: Rural livelihoods and diversity in developing countries
(Ellis, 2000) is published
The UK government publishes its second White Paper, Eliminating
World Poverty: Making Globalisation Work for the Poor (DFID,
2000d)

12
2001 Millennium Development Goals established.
New Labour wins election
DFID commissions research on further development of the SLA
framework; practical policy options to support sustainable livelihoods
Sustainable Livelihoods: Building on the Wealth of the Poor (Helmore
and Singh, 2001) is published
DFID organises SLA review meeting of officials, researchers and
practitioners
2002 World Summit on Sustainable Development (Earth Summit 2002)
takes place in Johannesburg, South Africa.
Indeed given this long history it can reasonably be asked as to what is new about
SLA? The focus on households is not new and neither is the attempt to integrate
aspects of livelihood. Even the „sustainable‟ in the name of SLA has a long heritage.
Perhaps it is the bringing of all these together within a single framework that is the
major leap forward, though this is easier said than done.
SLA has certainly helped establish the principle that successful development
intervention, even if led internally, must begin with a reflective process of deriving
evidence and this has to be broad in vision and not limited to what may seem like a
good „technical‟ fix. This may be a surprising advance given that the logic upon
which SLA is based seems clear – before development can take place there must be
some idea what needs to be done, how and why. Have not project planners been doing
just this for many years? Sadly the history of development is replete with top-down
projects planned to deliver change to a population without really thinking through
feasibility and thus after much spend in terms of resource and time there was little to
show for it. SLA is meant to change all that by ensuring that interventions will bring
about meaningful change. In that sense there is a deep resonance of SLA with the
broad field of „evidence-based‟ intervention and policy that has been in vogue in a
wide range of fields, especially health care, since the 1990s, although surprisingly the
SLA literature doesn‟t often make this link. The argument is certainly alluring; given
the inevitable constraints on resources that always exist any intervention or policy
must be assured to „work‟ otherwise the resource would be wasted or could even be
counter-productive. Evidence-based policy has thus been described as a modernist-
rationalist project, as was particularly in vogue with the New Labour government of
the 1990s (Sanderson, 2002), the same government that promoted SLA:
“New Labour proclaims the need for evidence-based policy, which we must
take to mean that policy initiatives are to be supported by research evidence
and that policies introduced on a trial basis are to be evaluated in as
rigorous a way as possible.”
Plewis (2000; cited in Sanderson, 2002, page 4)

13
It is perhaps no accident that SLA as an „evidence-based‟ set of principles achieved
the status it did under New Labour, although de Haan (2005, page 4) suggests that
there were other resonances with the ethos of New Labour at that time:
“the proactive, self-help image of the sustainable livelihoods approach in
improving the lives of the poor fitted very well with the image the new
administration wanted to project.”
The „evidence-based‟ literature is substantial and cannot be explored here in depth,
and neither is it limited to development in the Global South. The problem is that while
„evidence-based‟ interventions and policy have a logic they are often not the reality
and this has been the cause of much frustration in the literature. Huston (2008, page 1)
speaking of the difficulty of making „evidence-based‟ approaches a reality makes the
following observation:
“Most social scientists believe that strong evidence should lead policymakers to
adopt effective programs and to eschew those that are demonstrably ineffective,
but policies sometimes seem to fly in the face of data. The unpredictable and
volatile world of social policy has led some researchers to renounce efforts to
inform it because they believe that decisions are entirely political and that data
are invoked at best only to support a position that someone has already decided
to endorse.”
Huston (2008) lists the following „I‟s‟ as factors influencing policy makers: Ideology,
Interests, Information and Institutional contexts. The reader should note that only one
of these „I‟s is „information‟, and the others are much more elusive. Unsurprisingly
the „rationality-modernity‟ which underlies such „evidence-based‟ approaches, of
which SLA is an example, has been critiqued from a number of angles most notably
from the constructivist/interpretivist position. Ironically if anything such post-
modernist stances only highlight the complexities of the social world and hence the
need for some guidance to human action otherwise it is a recipe for complete
abstention from any attempt at intervention, including policy (Sanderson, 2002).
Nevertheless it is not possible to avoid the complexity of social systems as a major
problem in deriving evidence that can form the basis for interventions (Tavakoli et al,
2000), and some authors discuss the role of the expert in knowledge generation and
call for co-operative knowledge management (Bruckmeier and Tovey, 2008). This
brief overview of the „evidence-based‟ literature indicates a wide field and has been
reviewed by Pawson (2006).
A further attraction of SLA is that it is people-centred in a direct sense, and depends
upon the involvement of those meant to be helped by change. Indeed this is both a
principled and practical stance as it is hard to imagine being able to carry out an SLA
without the involvement of these people. Thus SLA forces an engagement with those
meant to be helped by an intervention or policy. It cannot be done from an office. In
line with participatory approaches in general this provides opportunities for
community-based learning where people can learn from each other as well as from
outsiders (Butler and Mazur, 2007). As a result SLA builds upon the long history of
the participatory movement in development, and techniques and methods homed over
years of application in stakeholder participation can also be used within SLA.
14
Thirdly, SLA represents an acceptance that multiple-sectors have to be considered i.e.
it is holistic. Thus rural and urban contexts interact as indeed does agriculture and
transport. The approach combines consideration of social, economic and natural assets
and mirrors the broader field of sustainable development and indeed integrated rural
development in that regard. Life and livelihood does combine all those things and an
attraction of SLA is that this holism is built-in from the very start rather than being an
add-on. Thus SLA builds from this existing knowledge and experience-base rather
than taking a new direction.
Fourthly there is an assumption that change happens and livelihoods are dynamic
rather than being static. Thus history is important in helping to appreciate why things
are the way they are and why people do what they do. Intrinsic within this is the
nature of decision making and the inevitable trade-offs and conflicts that can occur.
The inclusion of such dynamics from the outset as a part of the analytical framework
provides SLA with a clear advantage, although in practice the piecing together of
historical context may not be easy.
Finally, SLA sets out what the objective of an intervention should be; need for
diversification for example as a means of limiting exposure to risk. Once all this has
been accepted SLA sets out a process by which that „broad vision‟ can be gleaned.
There are no detailed schematics, blueprints or precise methods that „must‟ be used,
only a framework. Thus SLA is a very flexible approach that can be implemented in
many different ways depending upon local context and expertise of those doing the
analysis.
SLA, like evidence-based approaches in general, has had its critics, and some of these
are set out as follows. Some are not unique to SLA.
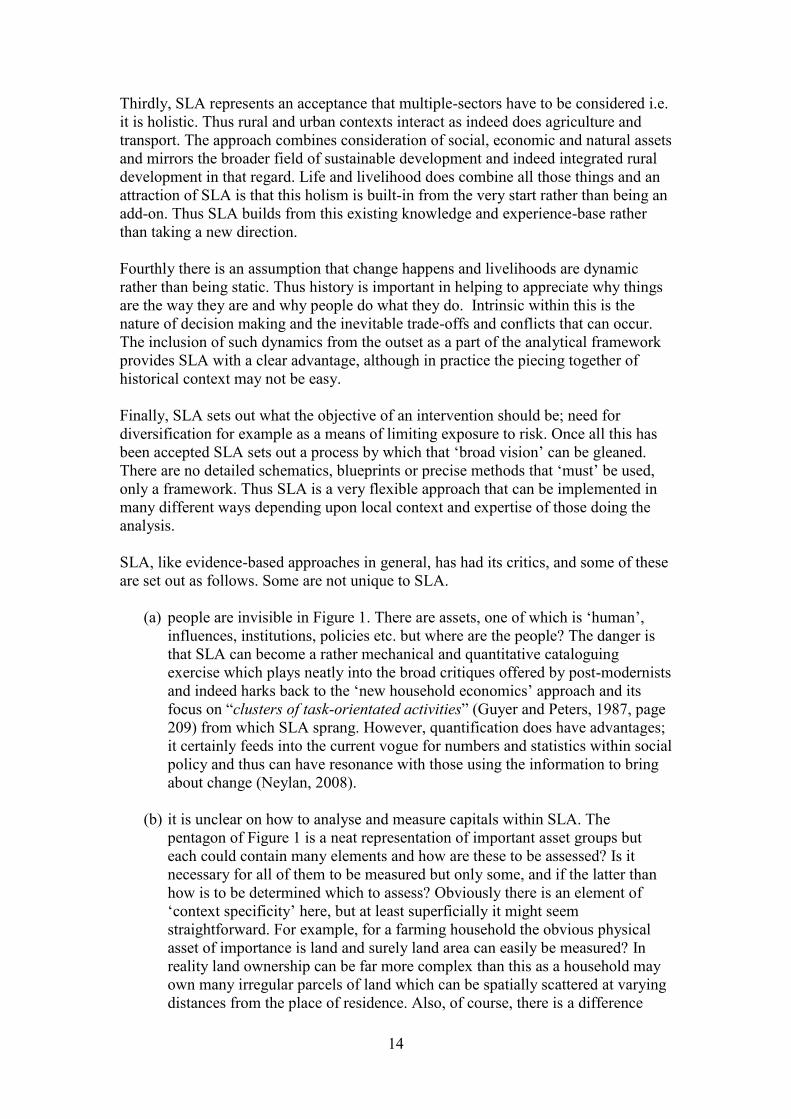
(a) people are invisible in Figure 1. There are assets, one of which is „human‟,
influences, institutions, policies etc. but where are the people? The danger is
that SLA can become a rather mechanical and quantitative cataloguing
exercise which plays neatly into the broad critiques offered by post-modernists
and indeed harks back to the „new household economics‟ approach and its
focus on “clusters of task-orientated activities” (Guyer and Peters, 1987, page
209) from which SLA sprang. However, quantification does have advantages;
it certainly feeds into the current vogue for numbers and statistics within social
policy and thus can have resonance with those using the information to bring
about change (Neylan, 2008).
(b) it is unclear on how to analyse and measure capitals within SLA. The
pentagon of Figure 1 is a neat representation of important asset groups but
each could contain many elements and how are these to be assessed? Is it
necessary for all of them to be measured but only some, and if the latter than
how is to be determined which to assess? Obviously there is an element of
„context specificity‟ here, but at least superficially it might seem
straightforward. For example, for a farming household the obvious physical
asset of importance is land and surely land area can easily be measured? In
reality land ownership can be far more complex than this as a household may
own many irregular parcels of land which can be spatially scattered at varying
distances from the place of residence. Also, of course, there is a difference

15
between ownership of land and access to land through rent or gift. The latter
can be volatile and thus constitute a capital one year but not the next.
(c) related to point (b) is the importance of trust. An SLA is reliant upon the
participation of those at the centre of the analysis yet the questions being
asked, for example asset ownership, can be sensitive for all sorts of reasons
and it would not be surprising if households withhold information if they felt
that the questions are suspicious. Again, if land ownership is taken as a
seemingly straightforward example, in many countries tax payments are
positively related to land area. It would thus not be surprising if a household
withheld information about the area of land owned and that asset could be
grossly under-estimated as a result. That may not matter, of course, but then
again it might. The same sensitivity could apply to asset ownership in general
and thus potentially distort the outcome of an SLA.
(d) an SLA could result in much detailed analysis but how is this to be translated
into interventions, policy for example, that will help people? The claim that
the process is liberating for participants only holds if those same people have
power to bring about change. However power can be a highly skewed
property. Some households may be able to adapt to help improve their lot
following an SLA while others – frankly – may be able to do very little if
anything. An SLA, of course, should be able to detect such heterogeneity
between households provided the „sample‟ size is large enough and the
sampling has been designed to pick up such potential variation. Thus SLA
does not avoid the key concern of representation and the „myth of community‟
inherent within all participatory methods. The problem is that different actors
are involved in the various arrows and neat boxes of Figure 2 and those
involved in doing the SLA are not usually the same actors involved in using
the information to bring about change, be it through allocation and monitoring
of resources or perhaps policy. The danger, of course, is that SLAs become an
end in themselves and do little more than form the basis for lengthy reports
and papers in academic journals.
(e) While there is an attempt to assess vulnerability (shocks, trends etc.) there is
obviously much unpredictability here, especially at macro-scales. This has
become all too clear from the „credit crunch‟ of 2008/2009 and its global
ramifications, but could also cover more national „shocks‟ such as coup d‟etat,
rampant inflation as a result of political instability and even outbreak of
disease. Such shocks can have massive impacts at household scales, including
abandonment of land and migration, but are impossible to predict except at
relatively short time scales.
(f) As a result of the above there is much complexity in SLA. The diagram maybe
a neat and simple representation but people‟s lives are complex. Putting aside
the need to consider the wider policy and institutional contexts, and these are
complex enough, the first steps of identifying livelihood assets and their
vulnerability contexts are „non-trivial‟. If there is to be a „quick‟ analysis then
the danger is that it could also be a „dirty‟ one driven by the needs of those
doing the SLA. Ironically the response of the UNDP when designing their
attempt to measure capability with the Human Development Index (HDI)

16
focussed on just 3 elements which they deemed to be of central importance;
income, health care (proxied by life expectancy) and education. In an SLA the
information generated may be substantial and decisions have to be made not
only about the analyses and interpretation but also presentation to those that
need to make use of it all.
Some of the above has received remarkably little attention within the SLA literature,
which is perhaps surprising given that some of these points are well-known within
critical analyses of the „evidence-based‟ approach in general (Sanderson, 2002;
Pawson, 2006). Thus while there is an undeniable logic to being aware of the assets
available to a household and their vulnerability as a starting point for the framing of a
basis for intervention, the creation of this knowledge amongst those engendering the
intervention is a significant challenge; not simply in terms of a technical issue like
measurement but also participation and trust. Any snapshot in time, a catalogue of
what assets are present, may be misleading for a variety of reasons. An incomplete
„asset pentagon‟ may not provide a good foundation and this is before trends in assets
are considered. Is there evidence of them increasing, decreasing or remaining the
same? Again, some trends may be obvious. For example, land may be divided into
smaller parcels as a result of population growth and result in some classic indicators
of cropping intensity. For others this may be more complex as there may be a reliance
on memory.
This paper seeks to illustrate some of the difficulties involved with SLA, and thus
provide a critical perspective on its use in development. It will do this by drawing
upon the experience of applying SLA within a specific Nigerian context. The
intention is to tell a story of how SLA was put into practice in two quite different
villages, and to tell this story using the SLA diagram in Figure 2. Each step will be
highlighted in the diagram so the reader can see where the story has reached and what
needed to be done to get there. In effect the story will seek to highlight some answers
to the criticisms listed above, at least as to how SLA was implemented in this one
place. These answers are not „right‟ or „wrong‟ in any normative sense of the words
but they reflect what happened.
While the SLA employed in the study reported here is basically that of DFID in their
„guidance notes‟ there were some deviations as a result of the local context. This is
perfectly acceptable, of course, as SLA is not meant to be a rigid set of check boxes
but should be flexible. Also, not all of the data collected can be reported in a paper as
necessarily short as this.
2. The SLA context; two villages in Nigeria.
The paper presents the methodology and main findings of an SLA conducted in two
villages in Igalaland – a region of Kogi State, Nigeria. This region has been selected
for one main reason; it is the project area for a major Catholic Church development
organisation called the Diocesan Development Services (DDS). DDS is the
development arm of the Catholic Diocese of Idah (which has almost the same
physical boundary as Igalaland) and is special in that it has been in existence since the
early 1970s. Thus at the time of writing DDS has a development history in just one
place - Igalaland - of nearly 40 years. Few development organisations can claim such
a sustained presence in one relatively small location. During that time DDS has
17
operated a financial services scheme (micro-savings and credit) as well as being
involved in rural infrastructure (water supply, bridge building), primary health care
and agricultural development. It has worked with literally tens of thousands of
households and has a proven track record which has earned it the trust and respect of
many in the area and outside. It can reasonably be assumed that trust will be a major
advantage in any SLA and thus the involvement of DDS can only be seen as
beneficial. Igala people know that DDS is a part of the Catholic Church and not linked
to government. Secondly, the grassroots mode in which DDS has functioned since the
1970s does mean that its Igala staff have much experience of working with Igala
households and are well-known to them. They come from the same culture and will
have extensive knowledge of both language and livelihoods. This local experience
and knowledge will provide further advantages in conducting an SLA. Thus given this
history and presence DDS should be the ideal organisation for implementing an SLA
and if it does not succeed here then it is hard to imagine where it would. The SLA
described here is not initiated by a group of experts parachuted in from overseas for a
short period but is grounded within the community which DDS seeks to serve and will
be there as long as the Catholic Church is there.
The two villages selected for the SLA are Ekwuloko and Edeke (Figure 3). In the
early years of the 21st century DDS was considering a review of its existing micro-
credit scheme, especially in terms of making it more based on „business plans‟.
During the 1990s in particular there was a worrying trend of households borrowing
money from DDS but not necessarily using the funds to develop livelihoods. Instead
the money seemed to be used for other purposes, such as paying off other loans or for
ceremonies. This had always happened since the 1970s when DDS began the scheme
but the situation had noticeably deteriorated during the 1990s, perhaps as a result of
Structural Adjustment Policies (SAP) implemented in Nigeria during the late 1980s.
As a result DDS began to think about ways in which micro-credit could be more
firmly linked to enhancement of livelihood. For example by encouraging the use of
loans to improve crop production, quality of produce or processing. Before
implementing pilot schemes DDS decided to select two villages located in quite
different contexts within which to test the desirability and feasibility of such
„livelihood‟ credit, and this was piggy-backed onto research funded by DFID to
explore the feasibility of clean seed yam production in various locations in southern
Nigeria. Two of the DFID research sites were located in Ekwuloko and Edeke and the
opportunity to link this to SLA studies in those two villages was too good to miss. In
effect the SLAs could hit two birds with one stone. On the one hand they could
provide a basis for exploring the contributions that clean yam seed could make to
livelihood and in addition provide insights for the „livelihood‟ credit intervention. Of
course the two are not unrelated; clean seed yam production could be a desirable
enterprise to fund with DDS credit, especially as this would provide a source of seed
for the whole community. In this report the seed yam work, of which the SLAs were a
strand, will not be presented and instead the emphasis will be entirely upon the
implementation of the SLAs and how it relates to the DDS credit intervention.
Therefore the work discussed here was a set of SLAs planned with an intervention in
mind (micro-credit) which takes into account the institutional context of DDS and its
long experience with micro-finance. From the point of view of DDS the objective was
to explore ways in which its micro-credit delivery and effectiveness could be
enhanced, but it did have an open mind as to the answers to these questions.

18
Figure 3. Map of Igalaland showing some of the main towns.
3. The SLA space
DDS was anxious to select two villages that were representative of the many villages
in which it worked but at the same time could capture some of the variation that
existed between villages. It was not feasible to select more than two villages given the
resources that would be involved so DDS felt that the best compromise in the
circumstances was to select two villages but make sure that they were as different as
possible. There were a number of criteria behind the eventual choice, including a
desire to look at one place where DDS has been established since the 1970s and
within a particular context of agricultural specialisation. Edeke fitted the bill given its
19
strong reliance on yam (Dioscorea rotundata and D. alata) and rice (Oryza sativa)
crops for income as well as subsistence. Edeke was also relatively close to Idah, the
capital of Igalaland, and the headquarters of DDS thereby simplifying the logistics of
the SLA. DDS staff had been engaged in various SLA-style approaches over the years
and they were only too aware of the significant logistics involved. Thus Edeke was
selected as an exemplar of the many villages in the Ibaji District of Igalaland, south of
Idah, which had a long involvement with DDS extending back to the 1970s, and
which given the rich riverine soil were specialist growers of a number of high-
economic value crops.
Edeke lies a few kilometres south of Idah along the fertile flood plains of the Niger
River; far to close for it to be discernible on the map in Figure 3. It is only accessible
by road during the dry season but river transport comes naturally to Edeke inhabitants.
The population of Edeke is approximately 40,000. Six clans that were initially
indigenes of Idah own the land and they can trace their ancestry back 400 years. There
are nineteen Madaki (chieftency) areas. There are many migrants from outside Edeke
that now live in the village, and a good number of them hail from the wider Igala area.
Non-Igala‟s includes Hausa, Igbo, Fulani, Yoruba, Nupe, Urobo, Isoko, Igbirra,
Kakanda and many others. Migrants found their way to Edeke mainly because of the
potential for farming, fishing, hunting and livestock. While not so important now
cattle were more central to the Edeke economy at one stage and still remembered by
local inhabitants as an island is called after the cattle and recently a primary school
bears the name Alla Okwuno (The Cattle Island). Edeke has a natural divide that
mirrors the divide of Igalaland as a whole - the uplands and flood plains. The latter
are completely flooded during the rainy season while the uplands enjoy plenty
moisture but are never completely flooded. The main crops grown in Edeke are yams,
sweet potato, maize, pepper and small areas of rice. Agriculture is practiced in the
uplands along with hunting to supplement income and protein intake; fishing takes
pride of place in the lowlands. A limited number of trees are grown in the uplands,
which the lowlands cannot support due to the seasonal flooding. Oil palm is the most
popular though for the most part these are self-seeded rather than planted. Fruit trees
especially the improved varieties are now to be found especially oranges, guava and
mango. Calabash trees are also popular due to their role in the local fishing industry.
Bamboo can be found everywhere and is considered vital to the lives of fishermen and
women. It serves as useful material for the construction of kitchens, yam barns,
atakpas (meeting places) and houses. Atakpas clearly identify Igala residents who use
the top part of the building as a yam store and the lower region as a parlour thereby
making a statement about the status of yams in Edeke.
The annual flooding of land around Edeke replenishes the soils and enables a virtual
monoculture of yams. Yams can be grown continuously in the same site for as long as
six years and given their relatively high market value the crop is understandably the
most popular one produced in Edeke. There is an established rotation system in the
uplands - cereals to root crops to green legumes to vegetables and on to fallow – and
there is intense cultivation with more land planted in the early part of the growing
season before the waters rise. Indeed, cultivation especially of yams, rice and
vegetables begins in November which is much earlier than for the plateau area of
Igalaland where the planting season begins with the onset of rains in March/April. As
would be expected given the proximity of the river fishing is commonplace in Edeke.
Women purchase fish from the fishermen and preserve it through smoking before

20
selling. Most processed fish is sold in Idah market in special stalls. Women also assist
with credit facilities for the fishing business. Women also lead in early cropping
activities especially with rice, pepper and other vegetable production, while yam tends
to be a male crop. Women are recognizing the advantages of rice over pepper. Pepper
is now more susceptible to disease and yields are decreasing while rice production
results in more income. Women who are already well acquainted with rice have
engaged with it on a new footing and a new name given to the process namely Ane
tomi-ubi which means transplanting of rice seedlings along the flood plains. The
money earned from rice is provided as credit to male yam growers. Currently the
interest rate is in the region of 100%. In theory this might appear good for the women
but in practice can be problematic as the male borrowers have difficulty in repaying.
The second criterion applied by DDS was a desire to include a village from the
plateau region of Igalaland, inland from the two main rivers (Niger and Benue) but
one which had less involvement with DDS but could represent an area for potential
growth in membership. Ekwuloko fitted this requirement, and like Edeke was
relatively easy to access from Idah. Ekwuloko is close to the Igbo border and
therefore hosts farmers, traders and others in search of land and opportunities scarce
in their own state (Enugu State). As a result the population of the village is a mix of
Igala and Igbo, with Igbos in the majority. Almost all would speak Igbo but there is
also a dialect of Igala. English is their second or even third language.
Ekwuloko is in Avrugo district of Igalamela/Odolu Local Government Area. It is the
name of a gago area (a traditional administrative unit) created by the British Colonial
Administration in 1918. Today due to the creation of more Local Government
Council Areas in the state, more gago areas were created at Local Government
Council level. As a result the former large Ekwuloko gago area was split into 12 gago
areas. Idah and Igalamela/Odolu local government councils made this new division
between 1996 and 2002. In 1977, Ekwuloko became part of the Avrugo Local
Government Council ward, but in 1996 when the Igalamela/Odolu council/ward was
created Avrugo council/ward was split into two namely Avrugo and Ekwuloko wards.
As a result, what we know as Ekwuloko today did not have a name before 1918.With
the introduction of the office of gago villages in the same area with a similar history
were grouped together and given the same name. The name Ekwuloko was chosen for
many reasons. It was the most dominant of the villages, with the largest population
and centrally located. It was the focal point for all land routes in the region as roads
from Avrugo, Ameke, Obinagu, Agbatebe, Odolu, Okpotokwu and Ukpabioko
villages all converge there. It continues to be a dominant village. It has a primary
school established in 1976 and a community secondary school established in 2002.
What makes it interesting for this study is that it has the largest food market in the
Odolu area, and has become the political and social center for the region and thus of
potential interest to DDS in its desire to expand its provision of credit.
Before 1918 the whole area now known as Ekwuloko gago was a series of farm
settlements run by Igbo farmers from Nimbo that now forms part of the Uzo-Uwani
local government in Nsukka, Enugu state. They named these settlements after their
home villages in Igboland. Igalas were the second group to migrate into this region;
Igbo settlements attracted Igala hunters, farmers and traders. All settled peacefully
and intermarriage was common between the two groups. At the time that both these
migrations were taking place from Nimbo and Idah the Attah of Igala (the King of the
21
Igala) and the Achadu controlled the whole of the Nsukka area; the Igala kingdom
having spread as far as Nsukka. The chiefs of Nimbo, living in Ukpabi, were installed
by the Attah at Idah where they obtained their beads of office (their status as chiefs).
The Attah controlled all the land and production as people moved freely around the
Igala-Igbo border. However this situation changed when the colonial powers fixed
artificial boundaries between Nsukka and Igala divisions, and this resulted in the
Igbos gradually withdrawing from Ekwuloko and Igalas taking over administration of
the area. Igbo names were changed slightly so as to have an Igala meaning and the
Igalas became politically dominant. This was understandable as the Igalas had
connections to the Royal clans at Idah. Indeed, today Ekwuloko is one of the villages
in Igalaland occupied by a royal clan of Idah - the Ochai Atta clan - with connections
to Angwa in Idah, and Igbos cannot own land in the village.
Ekwuloko‟s first gago, Oruma Ameh, became the Attah‟s councillor for court and
chieftaincy affairs. During his reign (c1926) Ekwuloko became prosperous and one of
the most powerful chiefs in Odolu district. Ekwuloko was well connected in the past
and its Royal links and powerful chief served it well. During the Nigerian civil war
(1968-1970) Igbos left the village (Igalaland was Federal territory) but began to return
to Ekwuloko once the war had ended. Igbos constitute almost 70% of the present
population of Ekwuloko. Indeed, the current district head of Avrugo attributes the
success of the market in Ekwuloko to the return of the Igbos. Without them the
market would not stand as they provide the bulk of the yam, cassava and cocoyam. In
more recent times Ekwuloko has benefited from other major interventions in
Igalaland. Of great importance has been the roads built by the Anyigba Agricultural
Development Project (AADP), a World Bank sponsored Integrated Rural
Development project, in 1977. The idea was to open up roads to the nearby forest
reserve and this literally put Ekwuloko on the map. Although roads are still poor the
construction of the road through Ekwuloko joined it to Avrugo and Odolu and
northwards to Akpanya and on to Alloma and Anyigba.
4. The Practice of SLA
DDS was well aware from previous experience that SLAs are demanding in terms of
resources and this was the main factor in its decision to focus upon only two villages
described in the previous section. However, even with this limitation the populations
of Ekwuloko and Edeke are substantial, comprising hundreds of households (herein
referred to as HH). It was simply not possible to include all of them and a decision
was made to focus on just four HH in each village. The size of an optimal „sample‟ in
SLA is a moot point. The demands of the process put pressure to use smaller sample
sizes for best quality while the competing demand for „representation‟ demands larger
samples. Thus the decision to focus on four HH was inevitably a compromise and one
that could be readily criticised.
Village meetings were convened in Ekwuloko and Edeke to help select the four HHs
and to explain what DDS was trying to achieve with its reorganisation of the micro-
credit scheme. A key issue, and one that is always something of a conundrum for
DDS, relates to the hierarchical nature of Igala society. This demands that the
„seniors‟ lead while others follow. In Ekwuloko this meant the programme had to
include the village chief (gago) and of course the most senior Igbo given the historical
context of that place. As the SLA in Ekwuloko could only include four participating

22
HHs this immediately limited choices for the remaining two. Out of deference to the
ethnic composition of the village population another Igala and Igbo HH were selected
in cooperation with the villagers. Relative unfamiliarity with DDS in a direct sense
proved to be something of a problem in Ekwuloko.
However, none of the selection problems present in Ekwuloko occurred in Edeke,
largely because the village had a much longer and deeper interaction with DDS and
the people were far more familiar with how DDS works and the nature of its credit
scheme. The four HH were selected as being long-standing members of the DDS
credit scheme and were also regarded as being „opinion leaders‟ in the community.
The SLA in Ekwuloko and Edeke was based on similar work already undertaken by
DDS in other villages in Igalaland since the 1970s and would of course concentrate on
HHs as the social unit. Thus SLA was a familiar concept to DDS and its staff had
much experience, albeit in other Igala villages. Although it was clear that there were
some tangible differences between Edeke, Ekwuloko and the other villages in which
DDS had worked the same working definition of household, albeit with some
modification, was adopted:
A HH is a clearly distinguishable social unit under the management of a
household head (HHH). The HH shares a community of life in that they
are answerable to the same HHH and share a common source of food.
In the past the HHH was usually male but this has changed and continues to change
reflecting conditions in Nigeria especially the trend of male migration to urban
centres. Female HHH are far more common than they were. Although a HH may
typically comprise blood relatives, many other relatives live elsewhere in Igalaland or
Nigeria. HHs can be „volatile‟ in the sense that size can vary substantially during the
year and between years, and include friends as well as relatives. A HH typically
occupies a collection of buildings for habitation and storage referred to in Nigeria as a
„compound‟.
Having established the HHs in Ekwuloko and Edeke and agreed upon the definition to
be applied the steps involved in the SLA were broadly as follows:
Mapping of cultivation and fallow farm plots of selected farmers.
HH human capital (household composition, education and skills)
HH natural capital (land and farming)
HH income and expenditure
HH assets.
Tree crop production.
Village mapping and census
To some extent the process was guided by knowledge which DDS already had of the
two villages. The existing land use by the HHs, their physical assets,
income/expenditure, human and social capital were included in order to appreciate
what livelihood options were open to the HHs. A further important dimension to this
study was to obtain a grasp of social networks and how they could aid the distribution
of information about livelihood options and credit.
23
The SLA began in early 2004 (Ekwuloko) and early 2005 (Edeke) and progressed up
to early 2005 and 2006 respectively. Thus each SLA lasted for approximately a year.
While much of the data were qualitative there was also a considerable amount of
quantitative data that can only be briefly summarised in this paper. As DDS has
experienced on many occasions, there was eventually a high level of cooperation from
all the villagers, not just the eight HHs. This required putting energy into the
establishment of trust and carrying out activities immediately of benefit to the other
village dwellers. Once villagers had seen DDS was not looking for data that put
ownership of their land in jeopardy and that it was not reporting to some government
institution for tax purposes then data collection became easier.
The methods employed in the SLA included:
- Interviews based on semi-structured questionnaires
- Informal discussions (individual and group)
- Field mapping
- Observation and participation in activities
These are well-established methods familiar to DDS staff and presented no difficulty
in themselves other than the sheer quantity of information that needed to be collected.
As a check the results were routinely checked with Igala key informants living outside
the village. One particularly useful informant was the District Head of Ekwuloko
currently residing in Idah. DDS has found the use of key informants to be very useful,
especially as they can help with the interpretation of findings.
The main findings from the SLA are presented here in terms of the steps in the
process set out in Figure 2.
5. Human capital: the households
24
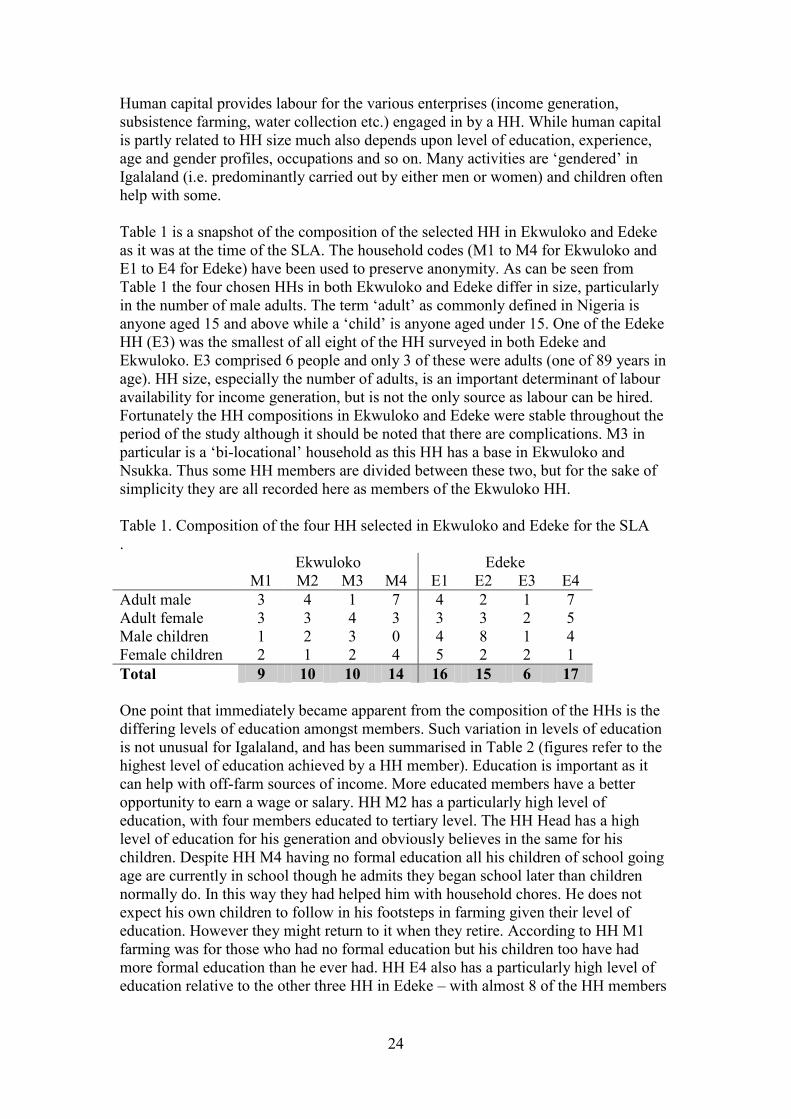
Human capital provides labour for the various enterprises (income generation,
subsistence farming, water collection etc.) engaged in by a HH. While human capital
is partly related to HH size much also depends upon level of education, experience,
age and gender profiles, occupations and so on. Many activities are „gendered‟ in
Igalaland (i.e. predominantly carried out by either men or women) and children often
help with some.
Table 1 is a snapshot of the composition of the selected HH in Ekwuloko and Edeke
as it was at the time of the SLA. The household codes (M1 to M4 for Ekwuloko and
E1 to E4 for Edeke) have been used to preserve anonymity. As can be seen from
Table 1 the four chosen HHs in both Ekwuloko and Edeke differ in size, particularly
in the number of male adults. The term „adult‟ as commonly defined in Nigeria is
anyone aged 15 and above while a „child‟ is anyone aged under 15. One of the Edeke
HH (E3) was the smallest of all eight of the HH surveyed in both Edeke and
Ekwuloko. E3 comprised 6 people and only 3 of these were adults (one of 89 years in
age). HH size, especially the number of adults, is an important determinant of labour
availability for income generation, but is not the only source as labour can be hired.
Fortunately the HH compositions in Ekwuloko and Edeke were stable throughout the
period of the study although it should be noted that there are complications. M3 in
particular is a „bi-locational‟ household as this HH has a base in Ekwuloko and
Nsukka. Thus some HH members are divided between these two, but for the sake of
simplicity they are all recorded here as members of the Ekwuloko HH.
Table 1. Composition of the four HH selected in Ekwuloko and Edeke for the SLA
.
Ekwuloko Edeke
M1 M2 M3 M4 E1 E2 E3 E4
Adult male 3 4 1 7 4 2 1 7
Adult female 3 3 4 3 3 3 2 5
Male children 1 2 3 0 4 8 1 4
Female children 2 1 2 4 5 2 2 1
Total 9 10 10 14 16 15 6 17
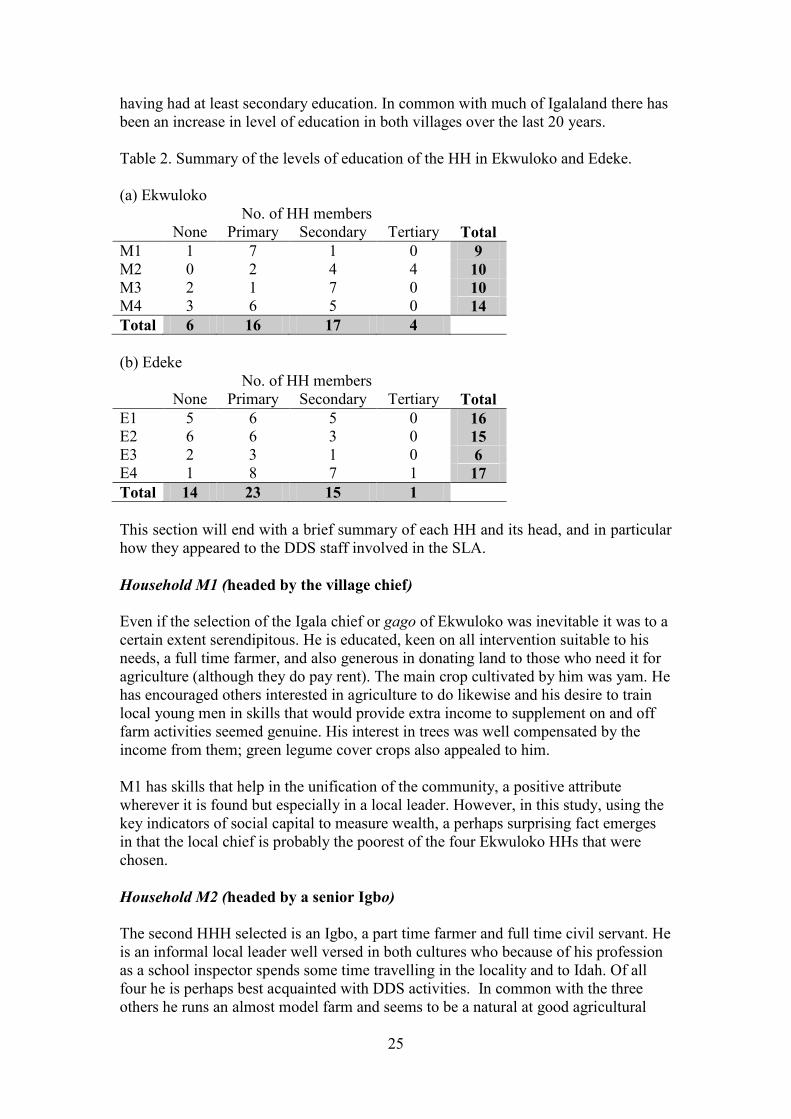
One point that immediately became apparent from the composition of the HHs is the
differing levels of education amongst members. Such variation in levels of education
is not unusual for Igalaland, and has been summarised in Table 2 (figures refer to the
highest level of education achieved by a HH member). Education is important as it
can help with off-farm sources of income. More educated members have a better
opportunity to earn a wage or salary. HH M2 has a particularly high level of
education, with four members educated to tertiary level. The HH Head has a high
level of education for his generation and obviously believes in the same for his
children. Despite HH M4 having no formal education all his children of school going
age are currently in school though he admits they began school later than children
normally do. In this way they had helped him with household chores. He does not
expect his own children to follow in his footsteps in farming given their level of
education. However they might return to it when they retire. According to HH M1
farming was for those who had no formal education but his children too have had
more formal education than he ever had. HH E4 also has a particularly high level of
education relative to the other three HH in Edeke – with almost 8 of the HH members
25
having had at least secondary education. In common with much of Igalaland there has
been an increase in level of education in both villages over the last 20 years.
Table 2. Summary of the levels of education of the HH in Ekwuloko and Edeke.
(a) Ekwuloko
No. of HH members
None Primary Secondary Tertiary Total
M1 1 7 1 0 9
M2 0 2 4 4 10
M3 2 1 7 0 10
M4 3 6 5 0 14
Total 6 16 17 4
(b) Edeke
No. of HH members
None Primary Secondary Tertiary Total
E1 5 6 5 0 16
E2 6 6 3 0 15
E3 2 3 1 0 6
E4 1 8 7 1 17
Total 14 23 15 1
This section will end with a brief summary of each HH and its head, and in particular
how they appeared to the DDS staff involved in the SLA.
Household M1 (headed by the village chief)
Even if the selection of the Igala chief or gago of Ekwuloko was inevitable it was to a
certain extent serendipitous. He is educated, keen on all intervention suitable to his
needs, a full time farmer, and also generous in donating land to those who need it for
agriculture (although they do pay rent). The main crop cultivated by him was yam. He
has encouraged others interested in agriculture to do likewise and his desire to train
local young men in skills that would provide extra income to supplement on and off
farm activities seemed genuine. His interest in trees was well compensated by the
income from them; green legume cover crops also appealed to him.
M1 has skills that help in the unification of the community, a positive attribute
wherever it is found but especially in a local leader. However, in this study, using the
key indicators of social capital to measure wealth, a perhaps surprising fact emerges
in that the local chief is probably the poorest of the four Ekwuloko HHs that were
chosen.
Household M2 (headed by a senior Igbo)
The second HHH selected is an Igbo, a part time farmer and full time civil servant. He
is an informal local leader well versed in both cultures who because of his profession
as a school inspector spends some time travelling in the locality and to Idah. Of all
four he is perhaps best acquainted with DDS activities. In common with the three
others he runs an almost model farm and seems to be a natural at good agricultural

26
practices. Of all four HHs he was the most highly educated (to third level). He
regretted not being able to avail of DDS projects in the past because of lack of
finance. He was referring specifically to economic trees.
Household M3 (Igbo community leader)
The third person chosen was the first to register as a DDS credit scheme member. He
is both a politician and a community leader which is not too unusual in Nigeria. His
interest, ability and skills in agriculture are obvious but he is an entrepreneur in the
broader sense of having both on and off-farm enterprises within Ekwuloko and in his
native village close to Nsukka. He is an Igbo, an immigrant and rents land. He is
proud of being totally assimilated into all socio-cultural and political activities in the
village. His two wives are educated and in paid employment, and one takes charge of
their affairs in Nsukka where some of the children are in school. It is obvious he lacks
capital since some of his resources, for example a palm nut cracker, cannot be
utilized, as he needs money to commission it.
Household M 4 (farmer and business man)
The fourth HHH selected in Ekwuloko has no formal education but again using the
indicators employed in this work he is likely to be the wealthiest of the four. He is a
driver by profession and this has brought him to all parts of the country – north, south,
east and west – and well beyond the borders of Nigeria. Like many of his Igala
counterparts who also travelled to other African countries he came back with skills,
equipment and materials that he in turn adapted to local conditions. Although as he
puts it he “did not savvy book – he savvy the things inside the book” (meaning that he
has little education but knows much) he is a born entrepreneur. An Igala with an Igbo
first name and two Igbo wives who are much junior to him he is hopeful his sons will
eventually succeed him in farming. He admits to having enjoyed the “better life”
(referred to in local parlance as “playing guy”) for many years before returning to
Ekwuloko. As a multi skilled worker and widely travelled he seems fit to adapt to all
situations with the highest of standards. Judging by what has been studied and
observed so far he farms extensively with a high standard of husbandry. His method
of organising his farm labour force is unusual and innovative for Igalaland in that he
has families staying with him (“friends”) who provide labour. This accounts for the
relatively large number (7) of adult males in his HH. Everybody appears to be happy
with the arrangement.
He is ready for any intervention that will be to his advantage as he has the capacity to
investigate all angles of a situation. Everyone in the community will watch him
carefully.
Household E1(farmer and vigilante)
HHH E1 in Edeke is a person who combines farming, fishing and hunting in this
order. He is the only one of the four Edeke HHH selected for the SLA who is not
from Edeke but from the nearby local government area of Ibaji. He also heads the
vigilante groups, which earns him income from the local council. As the vigilante
chairman, prominent people from outside Edeke donate money to him because of his
ability to mobilise village groups to protect Edeke from crime and maintain peace.
27
Politicians also offer cash assistance for peace keeping during their political tours. He
assists the Madaki in settling local cases, which no doubt earns him some „tokens‟. As
a landowner in areas outside Edeke, he takes part in sharing farmland and arranging
rent. The wives are into farming, trading and other income generating businesses.
Many of his children are in schools and still readily available for farm labour. Fishing
is vital to his income generating business for the children extra to their parents‟
support. The wives purchase part of the fish harvested by both children and husband,
which also means an addition to household income. Sales from farm produce cover all
household requirements but the money made from sales do not cover costs of planting
materials for the forthcoming planting season. Farmers begin each planting season
with a debt namely the cost of planting materials for the forthcoming rainy season.
Local debt is a crippling factor as farmers live in a state of perpetual indebtedness.
Moneylenders are not the sharks many think they are. Rather they often lose
considerable capital and are regularly the victims of bad debt.
The family are entirely Muslim with wives and children belonging to the one Muslim
denomination in their village of Ojigagala-Edeke and Idah. As a Muslim he has three
wives, six sons and four daughters. He also has a son in law and daughter in law all of
whom live happily together. He spends the evening line fishing having the reputation
of having a good daily catch. He dashes part of this to his friends who have not the
opportunity to fish. There is no reciprocity here as beneficiaries are mainly widows
and older women.
Household E2 (Madaki of Edeke)
An Igala from an Idah clan this household head was born in Edeke. As he has three
wives his children are many. His education lasted to primary five after which he had
to assume family responsibilities. He married while in primary school, as e was older
when he commenced primary education. His first wife, who is illiterate, is the same
age as himself. His second wife is literate as are all his children. His third wife is
literate. They too like household number one embrace the Islamic faith as have the
family for generations. He is first a farmer, fisherman and herbalist. The three wives
farm extensively and the second wife engages in the fish industry.
The household head is also the Madaki of the village with responsibility for a number
of clans. (More accurate information to be found in the census).None of his children
are old enough to be employed so there are many expenses still to be met in this HH.
He belongs to a number of social groups in the village and this membership enables
him to benefit from group labour, credit facilities in cash and kind. His second wife
also assists him with food ingredients as she trades in a number of different locations
thereby securing bargains that help the household economy.
Household E3 (farmer and fisherman)
The household head here is the youngest and the more educated of the four
respondents. His ancestry can be traced to an Idah clan hat migrated to Edeke almost
four hundred years ago. On completing his secondary education in Idah he obtained a
white-collar job in Kaduna. He remained in Kaduna for five years after which time he
returned home as by this time his father had died and his mother was old. His only
option was farming for which he had to borrow money to get started. His choice was

28
yam production. Since this time he has engaged in tree crop production taking a lead
role in initiating tree crop maintenance in the locality.
He prides himself in being a skilled fisherman also. To take care of his responsibilities
effectively he engages in hired labour for which he gets paid. He also gets help from
the Ayilo group (rotational labour organisation) of which he is a member. He
participates in ten other social groups that benefit him mainly in agriculture. He
registered as a member of the ruling party in Nigeria, namely the People‟s Democratic
Party (PDP).
His only wife is literate and not from Edeke or Idah. A friend who married from the
same village as his wife introduced him to her. His children of school going age
attend the local primary school. The youngest is only a year old. He takes care of his
aged mother who is now blind.
He has been secretary to the DDS credit scheme programme (the main vehicle for the
micro-credit scheme) in Edeke since 1998 and applauded for the work done there.
Household E4 (Madaki in Edeke)
This household head is the most senior of the four respondents. He too has Madaki
status in his village and has held the post since 1992.His jurisdiction extends to seven
clans. He attended adult education classes fifteen years ago and obtained a certificate
following his three years course in Edeke. He belongs to many social groups and
assumes lead roles within some of these. Currently he chairs the Achekaje yam
producer‟s association, Idah branch. Responsibilities here embrace such matters as
market research; ensuring yams are sold where prices are best. This particular
association ensures no particular group has monopoly over yam purchase from local
yam producers. They also regulate supply to local markets so that there is never a glut
that would cause prices to fall. They also settle cases related to loan defaulters
especially in relation to yam. Because of his long-term proficiency in yam production
he has earned a special Igala title that means he has produced a certain number of seed
yam varieties that completely fill a barn. This title is known as Egwele (Onwa), a
highly coveted title in Igalaland, and the meeting of seed yam producers is called
Ujeju Onwa. Only farmers who have reached a certain level of proficiency are
admitted to the Ujeju Onwa meetings the Egwele attends. He has long been a member
of the Ayilo group from where he has enjoyed labour benefits on many occasions.
He prides himself in farming but has other strings to his career connected with
agriculture. Foremost among these is his profound knowledge of herbal treatments
which makes him the custodian of many secrets and much indigenous knowledge.
The younger members of his family, both female and male now engage with him in
the herbal business and becoming privy to many of his secrets. His renown as a
herbalist has resulted in him being engaged as a consultant nation wide. His father
who was an expert in his time passed on the gift to him. He claims he has inherited
extra power in hunting and fishing also and is keen that his family inherit this legacy.
A skilled hunter and fisherman he supplements his farm income from these activities.
As he had five wives at one point he has many children all of whom have been to
primary and secondary school as well as some who have been to tertiary level. A

29
number of his children are now in gainful employment but each of them, especially
the men, have an attachment to agriculture, herbal treatments, fishing and hunting.
6. Natural capital: land and farming
Given that all Igala households are engaged with agriculture then land is obviously an
important natural resource in both Ekwuloko and Edeke. Indeed any analysis of
livelihood in Igalaland has to begin with this, so it is of no surprise that agriculture
and land were important foci of the SLAs implemented by DDS. Based upon a field
mapping exercise the total land area which the HH have access to is given in Table 3.
Also provided are the number of plots and the average plot size (and standard
deviation). The latter are important as they give clues regarding the extent of
fragmentation. In Ekwuloko the two Igala HHs (M1 and M4) have the largest land
area and most number of plots and they own their land. The two Igbo HHs (M2 and
M3) have smaller areas of land and fewer plots, although this is more noticeable for
M3, and they rent land. This pattern is not surprising given that Ekwuloko is an Igala
village and the Igbo HH are, in effect, immigrants and thus unable to own land. What
is perhaps surprising is that the area farmed by M2 is quite close in size to M1 who
actually owns his land. M4 is substantially ahead of the other three farmers in terms of
land ownership. Average plot sizes for M1 and M2 are similar (as indeed is the
standard deviation; SD). The average plot size for M3 is small, less than 500 m2,
while for M4 it is 1.5 ha. The selection of these four farmers certainly introduced the
desired diversity at least in terms of land ownership, and there is a link with ethnicity.
In contrast to the Ekwuloko HH in Edeke all four HH, all of them Igala, rented land
rather than owned it. This is linked to the pattern of land ownership in that place and
the fact that most of the HH have migrant origins. Also, while the number of plots per
farmer (18 to 39) for Edeke were similar to Ekwuloko the total land area (cultivated
and fallow) resulting in the average plots size being much higher in Edeke than in
Ekwuloko. The only Ekwuloko farmer comparable to the Edeke respondents in this
regard was M4.
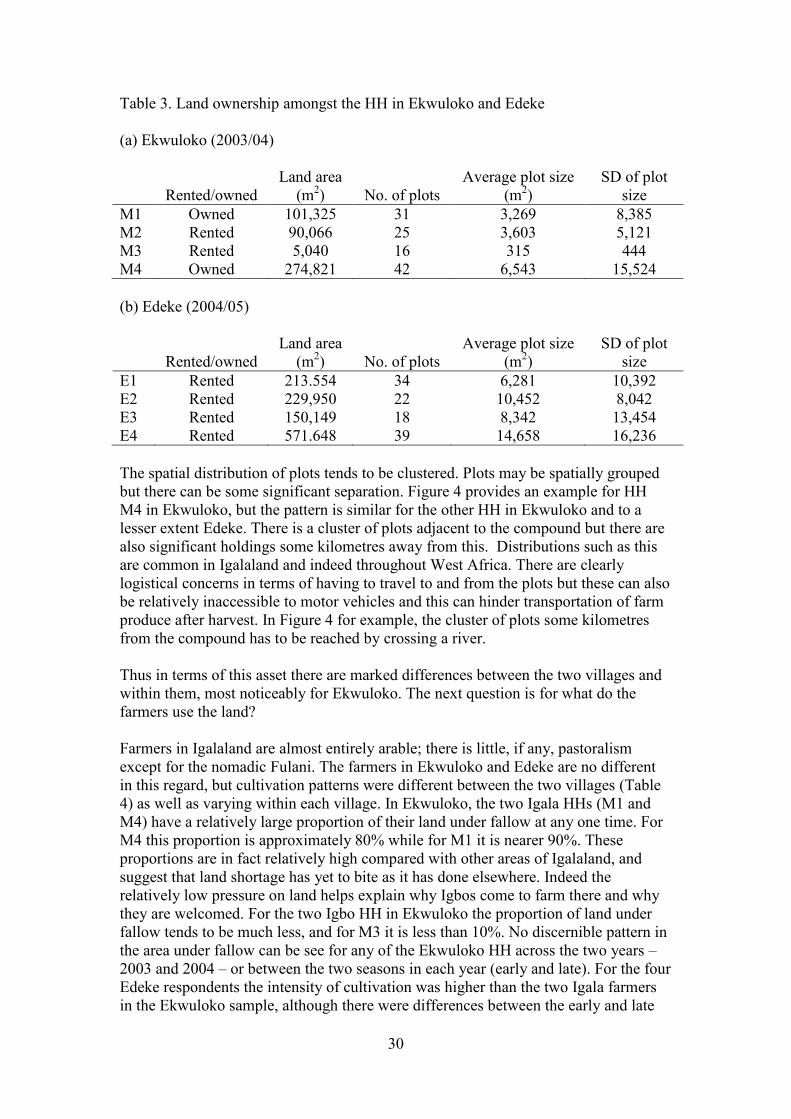
30
Table 3. Land ownership amongst the HH in Ekwuloko and Edeke
(a) Ekwuloko (2003/04)
Rented/owned
Land area
(m2)
No. of plots
Average plot size
(m2)
SD of plot
size
M1 Owned 101,325 31 3,269 8,385
M2 Rented 90,066 25 3,603 5,121
M3 Rented 5,040 16 315 444
M4 Owned 274,821 42 6,543 15,524
(b) Edeke (2004/05)
Rented/owned
Land area
(m2)
No. of plots
Average plot size
(m2)
SD of plot
size
E1 Rented 213.554 34 6,281 10,392
E2 Rented 229,950 22 10,452 8,042
E3 Rented 150,149 18 8,342 13,454
E4 Rented 571.648 39 14,658 16,236
The spatial distribution of plots tends to be clustered. Plots may be spatially grouped
but there can be some significant separation. Figure 4 provides an example for HH
M4 in Ekwuloko, but the pattern is similar for the other HH in Ekwuloko and to a
lesser extent Edeke. There is a cluster of plots adjacent to the compound but there are
also significant holdings some kilometres away from this. Distributions such as this
are common in Igalaland and indeed throughout West Africa. There are clearly
logistical concerns in terms of having to travel to and from the plots but these can also
be relatively inaccessible to motor vehicles and this can hinder transportation of farm
produce after harvest. In Figure 4 for example, the cluster of plots some kilometres
from the compound has to be reached by crossing a river.
Thus in terms of this asset there are marked differences between the two villages and
within them, most noticeably for Ekwuloko. The next question is for what do the
farmers use the land?
Farmers in Igalaland are almost entirely arable; there is little, if any, pastoralism
except for the nomadic Fulani. The farmers in Ekwuloko and Edeke are no different
in this regard, but cultivation patterns were different between the two villages (Table
4) as well as varying within each village. In Ekwuloko, the two Igala HHs (M1 and
M4) have a relatively large proportion of their land under fallow at any one time. For
M4 this proportion is approximately 80% while for M1 it is nearer 90%. These
proportions are in fact relatively high compared with other areas of Igalaland, and
suggest that land shortage has yet to bite as it has done elsewhere. Indeed the
relatively low pressure on land helps explain why Igbos come to farm there and why
they are welcomed. For the two Igbo HH in Ekwuloko the proportion of land under
fallow tends to be much less, and for M3 it is less than 10%. No discernible pattern in
the area under fallow can be see for any of the Ekwuloko HH across the two years –
2003 and 2004 – or between the two seasons in each year (early and late). For the four
Edeke respondents the intensity of cultivation was higher than the two Igala farmers
in the Ekwuloko sample, although there were differences between the early and late
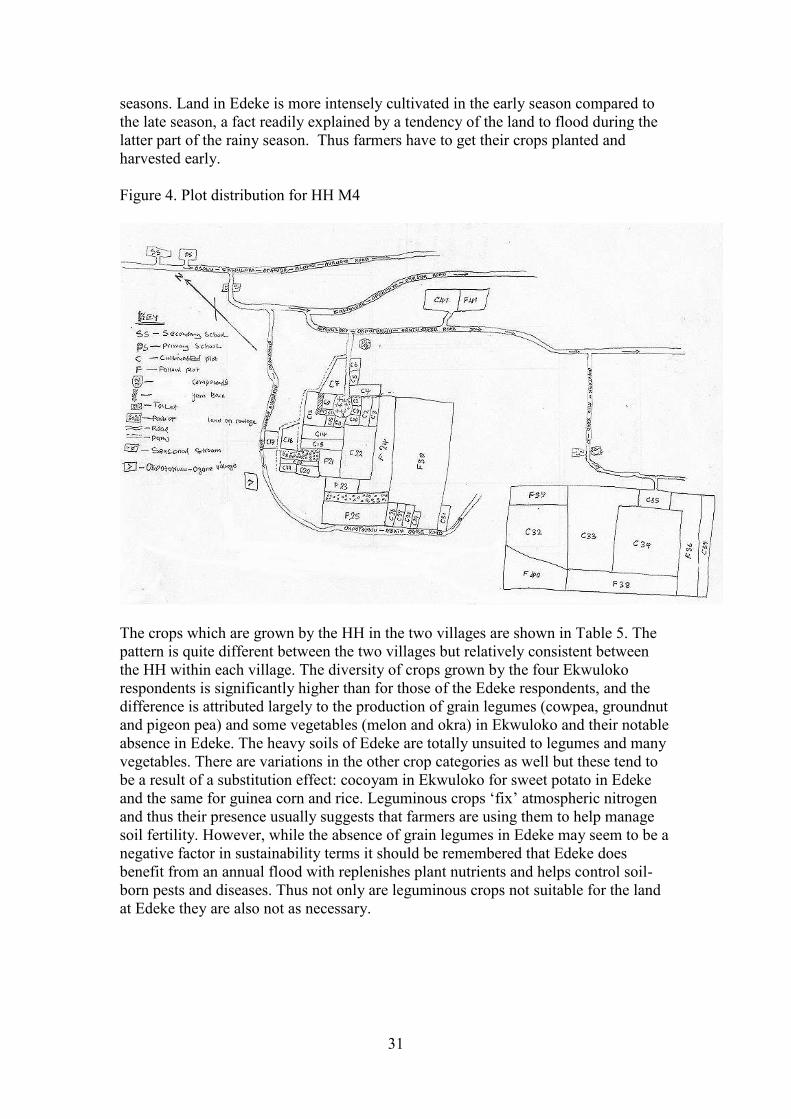
31
seasons. Land in Edeke is more intensely cultivated in the early season compared to
the late season, a fact readily explained by a tendency of the land to flood during the
latter part of the rainy season. Thus farmers have to get their crops planted and
harvested early.
Figure 4. Plot distribution for HH M4
The crops which are grown by the HH in the two villages are shown in Table 5. The
pattern is quite different between the two villages but relatively consistent between
the HH within each village. The diversity of crops grown by the four Ekwuloko
respondents is significantly higher than for those of the Edeke respondents, and the
difference is attributed largely to the production of grain legumes (cowpea, groundnut
and pigeon pea) and some vegetables (melon and okra) in Ekwuloko and their notable
absence in Edeke. The heavy soils of Edeke are totally unsuited to legumes and many
vegetables. There are variations in the other crop categories as well but these tend to
be a result of a substitution effect: cocoyam in Ekwuloko for sweet potato in Edeke
and the same for guinea corn and rice. Leguminous crops „fix‟ atmospheric nitrogen
and thus their presence usually suggests that farmers are using them to help manage
soil fertility. However, while the absence of grain legumes in Edeke may seem to be a
negative factor in sustainability terms it should be remembered that Edeke does
benefit from an annual flood with replenishes plant nutrients and helps control soil-
born pests and diseases. Thus not only are leguminous crops not suitable for the land
at Edeke they are also not as necessary.

32
Table 4. Proportions of land under cultivation and fallow for the HH in Ekwuloko and
Edeke.
Figures for 2 years (2003 and 2004) are provided and for the early and late seasons
within each year.
(a) Ekwuloko (2003/04)
2003 2004
Early Late Early Late Average
M1 Fallow 91 89 88 90 90
Cultivated 9 11 12 10 11
M2 Fallow 72 72 56 51 63
Cultivated 28 28 44 49 37
M3 Fallow 7 7 6 3 6
Cultivated 93 93 94 97 94
M4 Fallow 86 86 79 80 83
Cultivated 14 14 21 20 17
Average Fallow 64 64 57 56
Cultivated 36 36 43 44
(b) Edeke (2004/05)
2004 2005
Early Late Early Late Average
E1 Fallow 51 71 44 57 56
Cultivated 49 29 56 43 44
E2 Fallow 63 63 41 53 55
Cultivated 37 37 59 47 45
E3 Fallow 3 69 20 79 43
Cultivated 97 31 80 21 57
E4 Fallow 69 83 68 83 76
Cultivated 31 17 32 17 24
Average Fallow 47 72 43 68
Cultivated 53 28 57 32
In common with many places in Igalaland and indeed West Africa cropping in
Ekwuloko and Edeke tends to be dominated by intercropping; growing of more than
one crop on the same piece of land at the same time. Intercropping is popular in the
local context largely because it provides an element of insurance if one or more of the
components fails. All of the effort expended in clearing and land preparation are not
wasted. But at the same time intercropping is an intensification of resource use; more
crops on the same piece of land does result in more intensive use of resources such as
light, water and soil nutrients. Thus the extent of intercropping can be an indicator of
many factors such as pressure on land, volatile markets, relative shortage of labour or
simply the crops grown as some will not do well under intercropping.
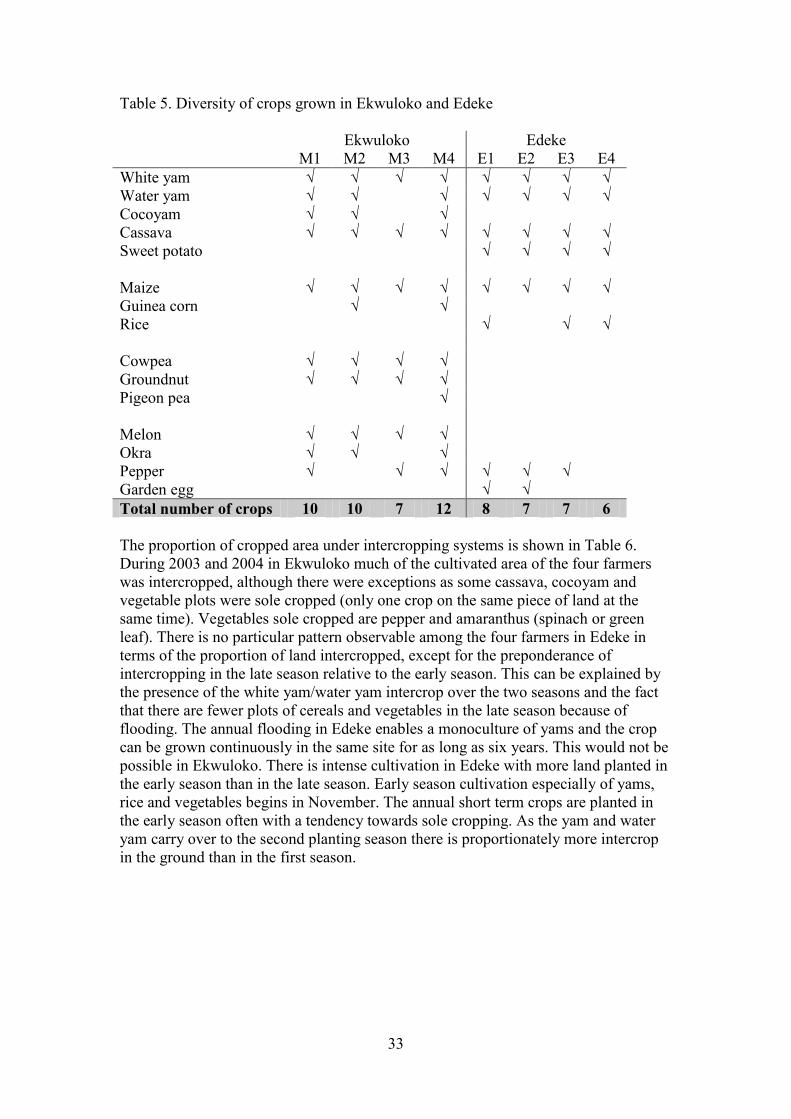
33
Table 5. Diversity of crops grown in Ekwuloko and Edeke
Ekwuloko Edeke
M1 M2 M3 M4 E1 E2 E3 E4
White yam √ √ √ √ √ √ √ √
Water yam √ √ √ √ √ √ √
Cocoyam √ √ √
Cassava √ √ √ √ √ √ √ √
Sweet potato √ √ √ √
Maize √ √ √ √ √ √ √ √
Guinea corn √ √
Rice √ √ √
Cowpea √ √ √ √
Groundnut √ √ √ √
Pigeon pea √
Melon √ √ √ √
Okra √ √ √
Pepper √ √ √ √ √ √
Garden egg √ √
Total number of crops 10 10 7 12 8 7 7 6
The proportion of cropped area under intercropping systems is shown in Table 6.
During 2003 and 2004 in Ekwuloko much of the cultivated area of the four farmers
was intercropped, although there were exceptions as some cassava, cocoyam and
vegetable plots were sole cropped (only one crop on the same piece of land at the
same time). Vegetables sole cropped are pepper and amaranthus (spinach or green
leaf). There is no particular pattern observable among the four farmers in Edeke in
terms of the proportion of land intercropped, except for the preponderance of
intercropping in the late season relative to the early season. This can be explained by
the presence of the white yam/water yam intercrop over the two seasons and the fact
that there are fewer plots of cereals and vegetables in the late season because of
flooding. The annual flooding in Edeke enables a monoculture of yams and the crop
can be grown continuously in the same site for as long as six years. This would not be
possible in Ekwuloko. There is intense cultivation in Edeke with more land planted in
the early season than in the late season. Early season cultivation especially of yams,
rice and vegetables begins in November. The annual short term crops are planted in
the early season often with a tendency towards sole cropping. As the yam and water
yam carry over to the second planting season there is proportionately more intercrop
in the ground than in the first season.

34
Table 6. Proportion of cropped land under intercropping-based systems.
(a) Ekwuloko
2003 2004
Early Late Early Late
M1 22 32 54 9
M2 83 3 69 53
M3 100 0 100 17
M4 98 82 71 44
(b) Edeke
2004 2005
Early Late Early Late
E1 55 70 76 51
E2 66 53 51 53
E3 35 58 25 0
E4 79 88 57 90
As intercropping is common in Igalaland it is understandable that the land allocated to
individual crops will not add up to 100% (a plot size of 2000 m2 grown to maize and
cassava will be recorded as that area for both crops – not half each). While such
proportions are crude measures they can however be instructive. Indeed a comparison
between Ekwuloko and Edeke as shown in Table 7 provides some interesting insights.
The percentage of cultivated land will, of course, fluctuate as the area under
cultivation fluctuates, but it is a reasonable indicator of the importance placed on a
crop by a farmer. Cropping systems in both villages are predominantly root crop-
based which is reflected in the relatively high percentages for yam, cassava, sweet
potato and cocoyam, but this is more so for Edeke than Ekwuloko.
Maize is also important in Ekwuloko as indeed are the legumes.
Cassava-based systems marginally dominate over yams in Ekwuloko while in Edeke
systems yams dominate (white yam, D. rotundata, and water yam, D alata). For all
four Ekwuloko HHs white yam occupies a significant proportion of the cultivated area
of land, although the variation is from 13 to 60% (typically higher in the late season
as most cropping is concentrated in the early season). For the farmers in Edeke this
percentage is much higher, with on average some 60% (early season) and 90% (late
season) of the cultivated land being planted to white yam. Yam is clearly important to
these farmers although bit is not the only crop they covet. In Edeke the figures for
cassava are much lower than in Ekwuloko. These differences can be easily explained.
Cassava requires much less labour than many other crops and is useful as a last crop
in a rotation before returning land to fallow (cassava can do well on poor land). The
production costs of cassava are also low compared with those of yam. However,
cassava products regularly fetch a low price in local markets and are low in nutritional
value, comprising little protein but high in carbohydrate. Cassava is relatively new in
Igalaland and hitherto yam was considered the staple. With declining soil conditions,
the disappearance of many varieties of white yams as well as their high production
and maintenance costs cassava grew in popularity in Igala. Its biggest problem is the
fluctuating market price. In Edeke where the land is good due to annual renewal from
flooding, the farmers have less motivation to resort to cassava. For them yam has
better nutritional value and brings a far higher market price.
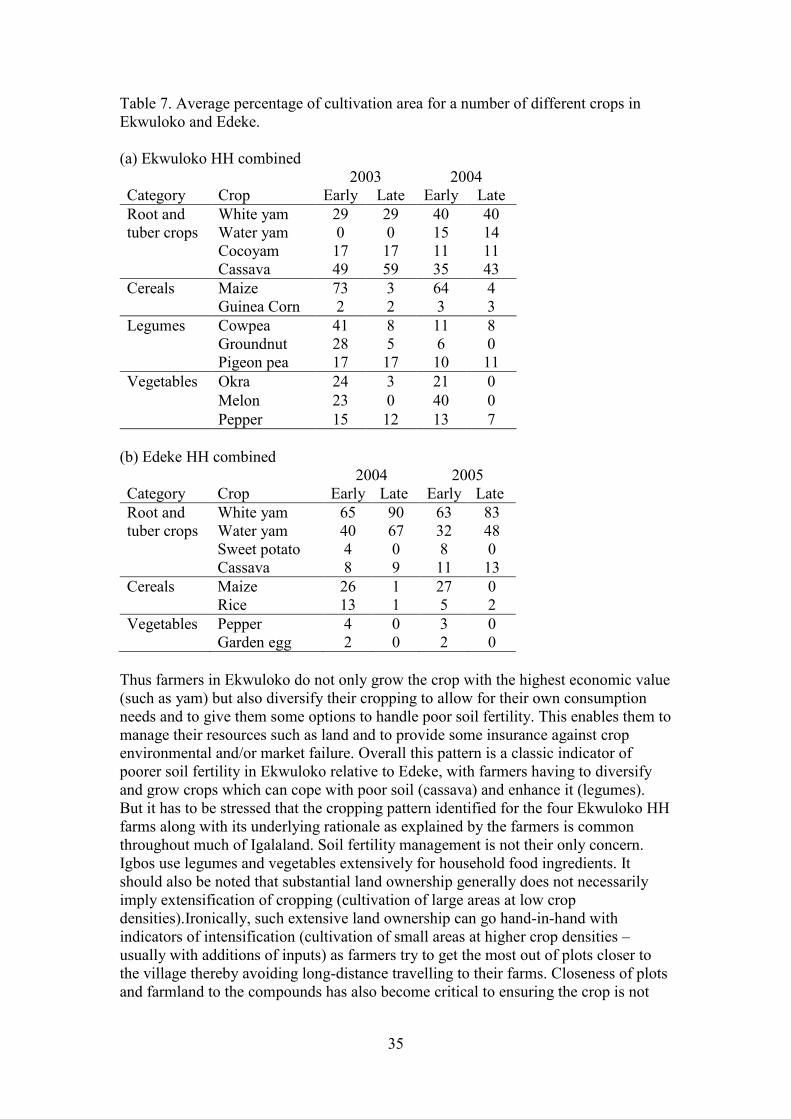
35
Table 7. Average percentage of cultivation area for a number of different crops in
Ekwuloko and Edeke.
(a) Ekwuloko HH combined
2003 2004
Category Crop Early Late Early Late
Root and
tuber crops
White yam 29 29 40 40
Water yam 0 0 15 14
Cocoyam 17 17 11 11
Cassava 49 59 35 43
Cereals Maize 73 3 64 4
Guinea Corn 2 2 3 3
Legumes Cowpea 41 8 11 8
Groundnut 28 5 6 0
Pigeon pea 17 17 10 11
Vegetables Okra 24 3 21 0
Melon 23 0 40 0
Pepper 15 12 13 7
(b) Edeke HH combined
2004 2005
Category Crop Early Late Early Late
Root and
tuber crops
White yam 65 90 63 83
Water yam 40 67 32 48
Sweet potato 4 0 8 0
Cassava 8 9 11 13
Cereals Maize 26 1 27 0
Rice 13 1 5 2
Vegetables Pepper 4 0 3 0
Garden egg 2 0 2 0
Thus farmers in Ekwuloko do not only grow the crop with the highest economic value
(such as yam) but also diversify their cropping to allow for their own consumption
needs and to give them some options to handle poor soil fertility. This enables them to
manage their resources such as land and to provide some insurance against crop
environmental and/or market failure. Overall this pattern is a classic indicator of
poorer soil fertility in Ekwuloko relative to Edeke, with farmers having to diversify
and grow crops which can cope with poor soil (cassava) and enhance it (legumes).
But it has to be stressed that the cropping pattern identified for the four Ekwuloko HH
farms along with its underlying rationale as explained by the farmers is common
throughout much of Igalaland. Soil fertility management is not their only concern.
Igbos use legumes and vegetables extensively for household food ingredients. It
should also be noted that substantial land ownership generally does not necessarily
imply extensification of cropping (cultivation of large areas at low crop
densities).Ironically, such extensive land ownership can go hand-in-hand with
indicators of intensification (cultivation of small areas at higher crop densities –
usually with additions of inputs) as farmers try to get the most out of plots closer to
the village thereby avoiding long-distance travelling to their farms. Closeness of plots
and farmland to the compounds has also become critical to ensuring the crop is not
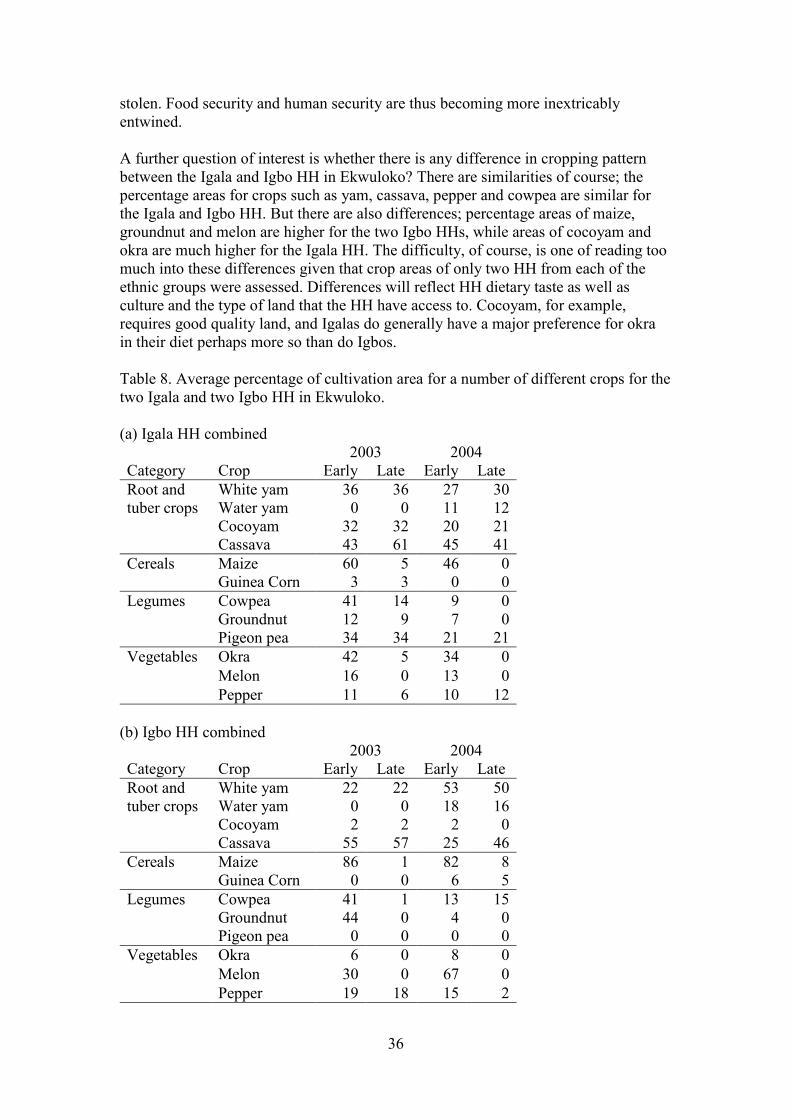
36
stolen. Food security and human security are thus becoming more inextricably
entwined.
A further question of interest is whether there is any difference in cropping pattern
between the Igala and Igbo HH in Ekwuloko? There are similarities of course; the
percentage areas for crops such as yam, cassava, pepper and cowpea are similar for
the Igala and Igbo HH. But there are also differences; percentage areas of maize,
groundnut and melon are higher for the two Igbo HHs, while areas of cocoyam and
okra are much higher for the Igala HH. The difficulty, of course, is one of reading too
much into these differences given that crop areas of only two HH from each of the
ethnic groups were assessed. Differences will reflect HH dietary taste as well as
culture and the type of land that the HH have access to. Cocoyam, for example,
requires good quality land, and Igalas do generally have a major preference for okra
in their diet perhaps more so than do Igbos.
Table 8. Average percentage of cultivation area for a number of different crops for the
two Igala and two Igbo HH in Ekwuloko.
(a) Igala HH combined
2003 2004
Category Crop Early Late Early Late
Root and
tuber crops
White yam 36 36 27 30
Water yam 0 0 11 12
Cocoyam 32 32 20 21
Cassava 43 61 45 41
Cereals Maize 60 5 46 0
Guinea Corn 3 3 0 0
Legumes Cowpea 41 14 9 0
Groundnut 12 9 7 0
Pigeon pea 34 34 21 21
Vegetables Okra 42 5 34 0
Melon 16 0 13 0
Pepper 11 6 10 12
(b) Igbo HH combined
2003 2004
Category Crop Early Late Early Late
Root and
tuber crops
White yam 22 22 53 50
Water yam 0 0 18 16
Cocoyam 2 2 2 0
Cassava 55 57 25 46
Cereals Maize 86 1 82 8
Guinea Corn 0 0 6 5
Legumes Cowpea 41 1 13 15
Groundnut 44 0 4 0
Pigeon pea 0 0 0 0
Vegetables Okra 6 0 8 0
Melon 30 0 67 0
Pepper 19 18 15 2

37
7. Natural capital: Trees
Trees are an important natural asset in Igalaland for a number of reasons. Amongst
other benefits they can be an important source of income, particularly for women,
help maintain biodiversity by providing a range of habitats, provide shade and help
protect the soil. Some of these advantages are directly linked to livelihood whereas
others, such as maintenance of biodiversity, are indirect. Indeed the main cash crop of
Igala is arguably the oil palm (Elaeis guineensis) rather than a field crop. Oil palm has
its centre of domestication in the Niger/Benue flood plains, and once slavery had been
abolished it was the presence of oil palm in Nigeria that was a major reason for the
continued interest of British companies. Oil palms provide the raw material and by-
products for a range of local industries suitable for women, and like yam it is a
significant cash crop in the local economy. Much of the produce is also consumed
locally. Indeed a much sought after delicacy is boiled yam eaten with a palm oil
sauce.
Traditionally, tree crops can be a contentious resource as they relate to land ownership
– ownership of trees can imply ownership of the land upon which they grow.
Economic trees are a long-term investment and most tree crops can take years to reach
full maturity (even the fast-maturing oil palm varieties can take up to 5 years).
However, once established they require little maintenance, produce can be lucrative
and in most cases they have a high nutritional value. Women in particular are
interested as they do the marketing of the tree crop produce; they like to use some of
them for example oranges and palm oil to improve nutrition at household level. These
resources provide back-up income for school fees and other essential household needs
(medical and clothing) where income from arable crops has proved incomplete.
Other studies of tree crops in Igalaland facilitated by DDS show that fathers were
planting tree crops especially oranges, bush mango and oil palms for their daughters
and sisters. Women have access to such trees long after their fathers had passed away
even though women in the society are not able to own land. However access to the

38
produce of such trees extended only to the lifetime of that woman. In trying to make
provision for their daughters and sisters men saw that trees were a reliable source of
income and their initiatives have given rise to cultural transformations within many
villages.
A summary of tree crop ownership and revenues for the HH in 2004 (Ekwuloko) and
2005 (Edeke) are provided as Table 9. These figures refer to the fruit trees (orange,
guava etc.) and also oil palm, the two types of locust bean and trees such as gmelina
and teak which are a source of timber. There are a number of interesting points that
emerge from this table. Firstly, the Ekwuloko HH had far more trees than Edeke HH.
In Edeke the average ownership of tree crop stands was 60 while in Ekwuloko it was
1,065. The difference was largely accounted for by oil palm; the Ekwuloko farmers
often had many stands while the Edeke farmers had none. The regular flooding of
riverine soils does not provide a conducive environment for oil palm. However, it can
be difficult for farmers to estimate the exact number of stands of some species (locust
beans) as they regenerate themselves. Hence figures here for Ekwuloko in particular
could well be underestimated. The good news in terms of sustainable livelihoods is
that all the trees mentioned in Ekwuloko and Edeke are low cost to produce as well as
fast growing and thus provide a viable alternative source of food and revenue for the
HH.
Table 9. Tree crop ownership and revenue for Ekwuloko and Edeke.
Trees contributing to revenue in both villages include orange, guava, mango, cashew,
banana and pawpaw.
Number of stands
(04)
Revenue (04) Other trees also economically
important in the local context
M1 1,148 55,000
oil palm, locust bean, gmelina, teak M2 79 39.700
M3 1,099 None
M4 1,935 18,500
Number of stands
(05)
Revenue (05)
E1 24 None
bamboo E2 37 35,200
E3 49 24,000
E4 130 17,500
As expected in Ekwuloko, the two Igala HHs (M1 and M4) have the largest holding
of tree crops compared to the two Igbo HHs (M2 and M3). This links immediately to
land ownership referred to earlier. People who rent land are often loath to plant tree
crops, as these would automatically become the property of the landlord. Yet
surprisingly all four farmers referred to themselves as „owners‟ of the tree crops. This
is unusual, and that is the reason why people distinguish between the „owner‟ of trees
and „controller‟. A controller is someone who has access to and control over the
produce and gets the full benefit of planting the trees for him/herself, although they
may not necessarily own the trees. Hence a husband would „own‟ the trees and the
wife would „control‟ them. In Ekwuloko the Igbos have planted trees for themselves
and control their management and produce but if they leave, ownership of these trees
39
reverts to the landowner. No relative can come back to claim them later. In Edeke tree
crop ownership was more uniform across the four households.
While much of the produce from tree crops was consumed by the HH it has to be
noted that income from trees was significant for some of the households (up to
N55,000 in the year). Another surprise is the local nature of the markets. Ekwuloko
respondents reported selling their produce through their local market and this was
unexpected given that the market didn‟t look that big (markets in Igalaland – like
much of Nigeria – operate on a four day cycle). It was anticipated that more of the
produce would be sold in the larger markets of Odolu or perhaps even Idah and
Nsukka. However, upon further questioning it was clear that Ekwuloko market is
deceptively large. Indeed, it is the only major market for some distance and Igala and
Igbo traders travel there to purchase agricultural produce and manufactured goods
such as pestles and mortars. The Edeke HH had the advantage of proximity to Idah
and that market, one of the largest in Igalaland, unsurprisingly featured heavily in
their responses.
The complete absence of kola nut from the tree crop culture was a further surprise,
especially in Ekwuloko. The Edeke soil is not conducive to kola nut but the
environment in Ekwuloko certainly is. Kola nut is an important tree crop from a
traditional perspective, given as a sign of welcome at traditional feasts and meetings.
For a village where it might have been abundant its absence was a mystery. When
questioned the farmers referred to a lack of know how in planting such trees. Given
the Igbo presence in Ekwuloko it was also surprising to discover the low numbers of
banana/plantain stands. Bananas and plantain are important as they can form part of
the staple diet, and local growing conditions seemed suitable. The main reason
proffered for not producing it was that land was rented. Other oddities include the
absence of bush mango and low numbers of locust beans in Ekwuloko. Even the most
soil-depleted places in other areas where DDS has studied have more of these tree
crops than does Ekwuloko. A rather aggressive bush clearance must have taken place
at some time. There is a mere semblance of teak and gmelina and fuel wood will
surely be a problem for the future as the population grows. For a more balanced future
economy, fast growing fuel trees need to be encouraged as they are a source of
income and contribute to the overall well being of the economy and the environment.
The household head of HH M4 has already indicated he is taking up this challenge.
While there may be gaps in local knowledge of tree crop planting and maintenance
the composition of the community may not be conducive to tree planting. Fixity of
tenure does not exist for a significant proportion of the Ekwuloko population - the
Igbos. The results show HHH M1 as benefiting well from his tree crops. The Igbo
household (HH M2) grew fruits with a view to improving diet and subsequently sold
the balance. HHH M3 (Igbo) was not as committed to such matters as he had less land
and the family bi-locate between houses in Ekwuloko and Nsukka.
Tree crops grown in Edeke are related to the economy of hunting and fishing and
particularly the latter. A limited number of trees are grown in the uplands, which the
lowlands cannot support, and it should be noted that all four HH in the SLA rented
their land. Oil palm is the most popular in the more elevated parts of Edeke though for
the most part these are self-seeded. Fruit trees especially the improved varieties are
now to be found especially oranges, guava and mango. Cashew is also found but for
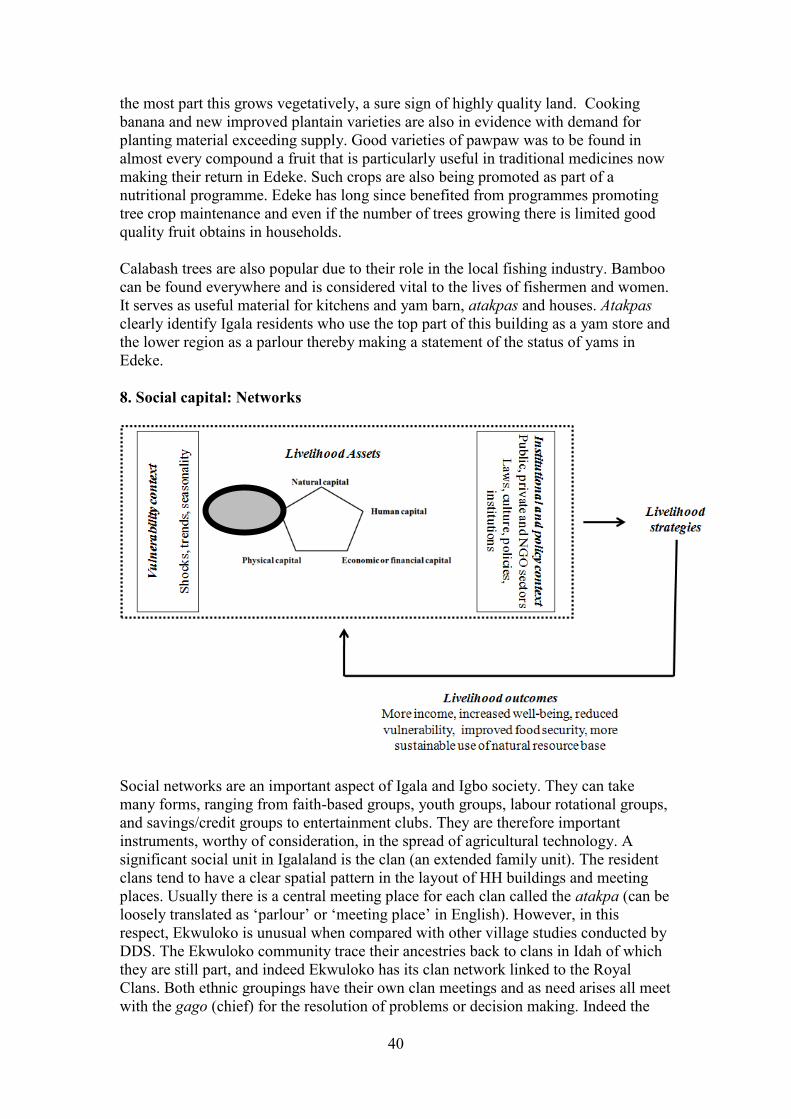
40
the most part this grows vegetatively, a sure sign of highly quality land. Cooking
banana and new improved plantain varieties are also in evidence with demand for
planting material exceeding supply. Good varieties of pawpaw was to be found in
almost every compound a fruit that is particularly useful in traditional medicines now
making their return in Edeke. Such crops are also being promoted as part of a
nutritional programme. Edeke has long since benefited from programmes promoting
tree crop maintenance and even if the number of trees growing there is limited good
quality fruit obtains in households.
Calabash trees are also popular due to their role in the local fishing industry. Bamboo
can be found everywhere and is considered vital to the lives of fishermen and women.
It serves as useful material for kitchens and yam barn, atakpas and houses. Atakpas
clearly identify Igala residents who use the top part of this building as a yam store and
the lower region as a parlour thereby making a statement of the status of yams in
Edeke.
8. Social capital: Networks
Social networks are an important aspect of Igala and Igbo society. They can take
many forms, ranging from faith-based groups, youth groups, labour rotational groups,
and savings/credit groups to entertainment clubs. They are therefore important
instruments, worthy of consideration, in the spread of agricultural technology. A
significant social unit in Igalaland is the clan (an extended family unit). The resident
clans tend to have a clear spatial pattern in the layout of HH buildings and meeting
places. Usually there is a central meeting place for each clan called the atakpa (can be
loosely translated as „parlour‟ or „meeting place‟ in English). However, in this
respect, Ekwuloko is unusual when compared with other village studies conducted by
DDS. The Ekwuloko community trace their ancestries back to clans in Idah of which
they are still part, and indeed Ekwuloko has its clan network linked to the Royal
Clans. Both ethnic groupings have their own clan meetings and as need arises all meet
with the gago (chief) for the resolution of problems or decision making. Indeed the
41
large diversity of societal membership in Ekwuloko and Edeke is striking, and it is
instructive to mention a few of them here and what they do.
The Catholic Women‟s Organisation (CWO) is an active organisation of Catholic
women with branches in every diocese and parish throughout the country. It links
with its sister organisations in Europe and the USA and there are exchange visits
between parishes in Idah diocese and parishes in Germany. In Ekwuloko the CWO
has representatives from both of the ethnic groups. The main purpose of the CWO is
to help its members be more Christian and Catholic through learning about and
putting into practice the principles of the Christian and Catholic faith.
The Catholic Youth Organisation of Nigeria (CYON) is also to be found in every
parish and diocese throughout the Federation of Nigeria. It too has international links
but is usually most active in secondary schools and sometimes in tertiary institutions.
Membership of such organisations are seen as a means of helping with character
formation and instilling life coaching skills which will help youth help themselves and
others for the rest of their lives. They become aware in theory at least that on going
formation is essential if one is to live Christian life to the full.
Besides the CWO and CYON there are six other active Catholic organisations within
the Ekwuloko community. These are the Knights of St. John, the Knights of St.
James, the Legion of Mary, St Anthony De Padua Society, St. Augustine Society and
St. Teresa‟s Society. The Knights of St. James and the Legion of Mary are part of the
Catholic International network. The others are to be found in practically every parish
and diocese, although there are often more than just those found in Ekwuloko. The
paucity of numbers of such societies would indicate that Catholics are fewer in
number than the Protestants in the village. Society members help in Church
maintenance and have different duties depending on what activities are happening.
There is no Catholic Priest in the village (Ekwuloko comes under Akpanya Parish)
but there is a resident catechist. One of MM2‟s sons is a seminarian.
Many of the non-faith based organisations have branches in Idah and throughout Kogi
State. Ufedo kpai Udama is an example of such an organisation. There are
approximately seven women‟s organisations within Ekwuloko, and these are for the
most part groupings of women who have come from villages close by and who form a
solidarity group for their own well-being. Such women‟s groups are to be found in
every town and village in the country as a whole.
Youth clubs and associations were mentioned by a number of respondents. Youth
clubs assist the villagers in what is known locally as „credit labour‟. Any farmer in
need of hired labour but short of capital can engage a youth group especially
organised by members of both ethnic groups. The members are paid at harvest in cash
and the price agreed upon at the time of hiring. This money is reserved for Christmas
celebrations. These same groups provide communal labour for land clearance or
harvesting free of monetary charges but are compensated by the community with food
and drinks at Christmas. There are two such groups in Ekwuloko; one is named the
Christian youth group the other Ekwuloko youth club. Age of membership is between
15 and 40 years of age. However there is a preponderance of members in the upper
age limits, a common phenomenon throughout this region.

42
The Protestant groups are extensions of national evangelical churches some with an
international link. Members meet each Sunday for service and other activities such as
Bible studies. They do not seem to engage with any specific social activities.
A summary of societal membership in Ekwuloko and Edeke is provided as Table 10
where groups have been pooled under some broad headings. The three headings
chosen here are faith-based and secular (non-faith based) groups, local to the village
and non-local (national for example) and agricultural and non-agricultural. The only
HH in both villages with a relative paucity of membership in groups is that of M3, but
the situation here may be because his wives and older children do not for the most
part reside in the village. The other Igbo HH of M2 appears to be much more
embedded in the local, although still with a predominance of membership in non-local
groups. Table 10 also shows the findings of a Chi-square statistical test designed to
look for significant differences between the villages in terms of the pattern of societal
membership.
Table 10. Summary of group membership in Ekwuloko and Edeke.
Table shows membership in three different types of group: faith-based, local and
agricultural.
Type of group
Faith-based Non-faith based Local Non-local Agric. Non-agric.
M1 3 9 10 2 1 11
M2 9 6 4 11 1 14
M3 1 1 1 1 0 2
M4 6 7 6 7 1 12
Total 19 23 21 21 3 39
E1 2 20 15 7 6 16
E2 2 23 17 8 2 23
E3 1 15 11 5 3 13
E4 0 41 16 25 8 33
Total 5 99 59 45 19 85
Chi-square = 35.6 ***
df = 1
Chi-square = 0.55 ns
df = 1
Chi-square = 2.89
P = 0.089
df = 1
„M‟ refers to Ekwuloko
„E‟ refers to Edeke
Chi-square test performed on the group totals (shaded cells).
ns P > 0.05
*** P < 0.001
There are some interesting differences between Ekwuloko and Edeke group
membership highlighted in Table 10. This is particularly noticeable with regards to
membership of faith-based groups where the difference was statically significant, and
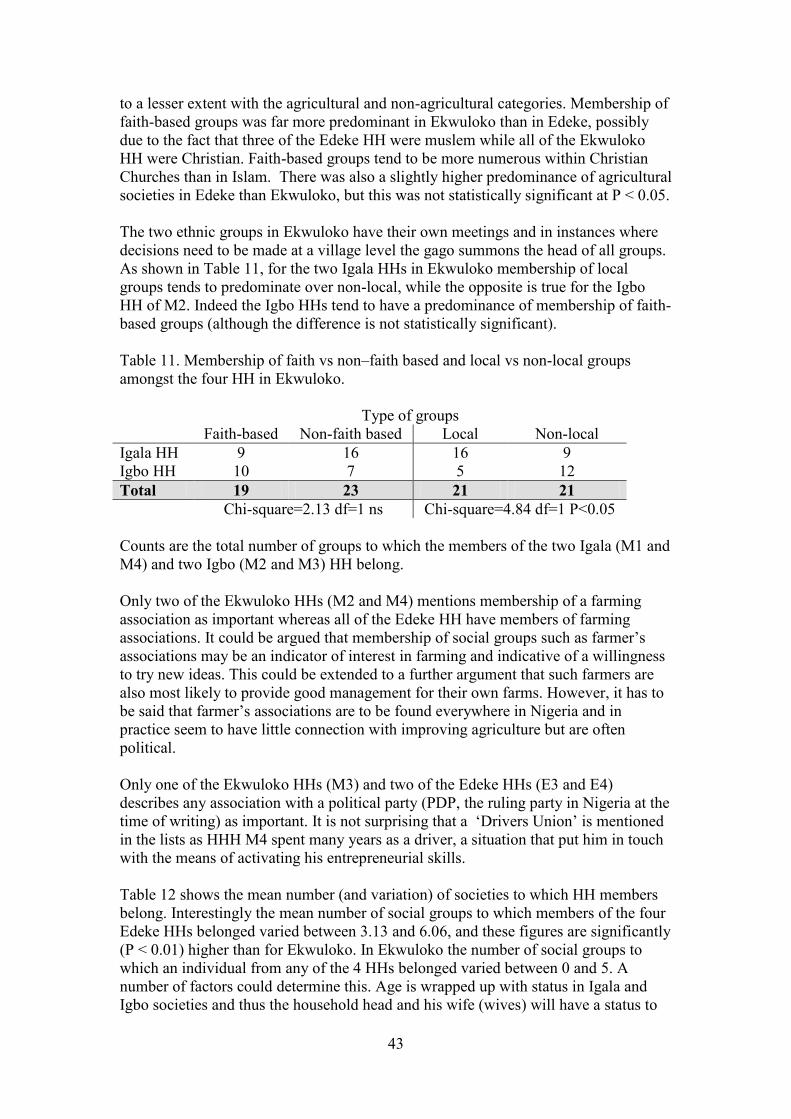
43
to a lesser extent with the agricultural and non-agricultural categories. Membership of
faith-based groups was far more predominant in Ekwuloko than in Edeke, possibly
due to the fact that three of the Edeke HH were muslem while all of the Ekwuloko
HH were Christian. Faith-based groups tend to be more numerous within Christian
Churches than in Islam. There was also a slightly higher predominance of agricultural
societies in Edeke than Ekwuloko, but this was not statistically significant at P < 0.05.
The two ethnic groups in Ekwuloko have their own meetings and in instances where
decisions need to be made at a village level the gago summons the head of all groups.
As shown in Table 11, for the two Igala HHs in Ekwuloko membership of local
groups tends to predominate over non-local, while the opposite is true for the Igbo
HH of M2. Indeed the Igbo HHs tend to have a predominance of membership of faith-
based groups (although the difference is not statistically significant).
Table 11. Membership of faith vs non–faith based and local vs non-local groups
amongst the four HH in Ekwuloko.
Type of groups
Faith-based Non-faith based Local Non-local
Igala HH 9 16 16 9
Igbo HH 10 7 5 12
Total 19 23 21 21
Chi-square=2.13 df=1 ns Chi-square=4.84 df=1 P<0.05
Counts are the total number of groups to which the members of the two Igala (M1 and
M4) and two Igbo (M2 and M3) HH belong.
Only two of the Ekwuloko HHs (M2 and M4) mentions membership of a farming
association as important whereas all of the Edeke HH have members of farming
associations. It could be argued that membership of social groups such as farmer‟s
associations may be an indicator of interest in farming and indicative of a willingness
to try new ideas. This could be extended to a further argument that such farmers are
also most likely to provide good management for their own farms. However, it has to
be said that farmer‟s associations are to be found everywhere in Nigeria and in
practice seem to have little connection with improving agriculture but are often
political.
Only one of the Ekwuloko HHs (M3) and two of the Edeke HHs (E3 and E4)
describes any association with a political party (PDP, the ruling party in Nigeria at the
time of writing) as important. It is not surprising that a „Drivers Union‟ is mentioned
in the lists as HHH M4 spent many years as a driver, a situation that put him in touch
with the means of activating his entrepreneurial skills.
Table 12 shows the mean number (and variation) of societies to which HH members
belong. Interestingly the mean number of social groups to which members of the four
Edeke HHs belonged varied between 3.13 and 6.06, and these figures are significantly
(P < 0.01) higher than for Ekwuloko. In Ekwuloko the number of social groups to
which an individual from any of the 4 HHs belonged varied between 0 and 5. A
number of factors could determine this. Age is wrapped up with status in Igala and
Igbo societies and thus the household head and his wife (wives) will have a status to

44
maintain and membership of social groups may be one vehicle for doing this. Such
status might be of less importance for sons and daughters and perhaps even less again
for friends who are only temporarily residing in the village.
Generally the diversity of social networks in Ekwuloko and Edeke is encouraging and
is no doubt an asset in terms of making livelihoods sustainable. They provide an
immediate and efficient means of communication where there is informal discussion
and problems and possibilities highlighted
Table 12. Mean, Standard deviation (SD) and median number of groups to which the
HH members belong in Edeke and Ekwuloko.
Group membership for each HH
HH size Mean SD Median
Ekwuloko M1 9 2.89 1.36 3
M2 10 2.2 1.69 2
M3 10 1.8 0.63 2
M4 14 1.93 1.64 1.5
Edeke E1 16 4.38 4.13 4
E2 15 3.13 3.0 3
E3 6 3.17 4.12 1.5
E4 17 6.06 3.68 6
Kruskall-Wallis test of median group membership per HH for Ekwuloko (median =
2.0, N=43) and Edeke (median = 4.0, N=54): H = 8.32 (adjusted for ties) P < 0.01.
9. Physical capital: assets for income generation

45
Access to land for agriculture is obviously important within a largely agrarian society.
Also important is what people can do with that land. The soil types and local
environmental conditions are quite different between the two villages and thus it is
not surprising to see differences in crops and cropping systems. However HH do have
access to other ways of making an income besides agriculture. Salaried income has
already been discussed but there are other options within the village. All the HH
included in the SLA talked about income generation outside of agriculture as being
important and were willing to provide examples such as trading and income from
rental of land and machinery but judging how important these are can be more
difficult as the information tends to be sensitive. As a result it is necessary to
triangulate such information with observation and one specific method of addressing
this within the context of an SLA is to catalogue physical assets (tools, vehicles,
machinery, livestock, buildings etc.) available to the HH and assume that this is
related to the options available. It will also provide a measure of wealth. A summary
of the total value of the HH assets is provided as Table 13.
Table 13. Assets of the four Edeke HH compared with the four Ekwuloko HH
HH Total asset value (Naira,2004) HH Total asset value (Naira, 2005)
M1 170,000 E1 963,000
M2 2,890,399 E2 1,015,300
M3 2,556,100 E3 1,121,700
M4 6,834,700 E4 1,437,800
The most striking point to emerge from Table 13 is the low value of assets for M1
compared with the other HH in Ekwuloko and Edeke. With a total asset value of less
than N200,000 this HH would appear to have only a fraction of the wealth of the other
three HHs. It should be noted, however, than M1 has extensive areas of land which he
rents. Currently he has 15 tenants who pay him Naira 1,500 rent each per annum.
These tenants also do compulsory labour for him each year. Secondly, the value of the
Edeke HH assets is far below those of the Ekwuloko HH with the one exception of
HH M1. Much of this difference is due to HH M2, M3 and M4 owning many
buildings within and outside Ekwuloko. By way of contrast the Edeke HH are more
„fixed‟ in Edeke, with few (if any) assets outside the village. It is worthy of note that
the variation between the four Edeke HH in terms of their asset value is much less
than that of the Ekwuloko villages. The difference between E1 and E4 is some
N800,000 while the difference between M1 and M4 is more than N6.5 million. Even
between M4 and M2 (ranked 1st and 2
nd respectively in asset value) the difference is
N4 million, and M4 is by no means the richest HH in Ekwuloko.
The wealthiest HH of all the eight in the SLA is M4, whose combined assets are
worth more than the total of the other three HHs in Ekwuloko put together and the
same would be true of the four Edeke HH. One visit to his house is sufficient to
confirm this. The HHH of M4 is an entrepreneur par excellence. He is as well a
perfectionist as could be evidenced in his farming practices. He is very committed to
this business so it is easy to see how he could accumulate wealth; he is painstaking
and thorough in all he does and was not one to miss out on any opportunity. However,
it should be noted that the high value of M4 assets is in part due to the HHH owning a
house in Idah. He traces his ancestry to one of the clans in Idah so he makes the most
of that opportunity by having a house there. Houses in Idah now have a high monetary
46
value. The Idah house is valued at N3,000,000; therefore nearly half of M4‟s assets
are tied up in the Idah house. Nevertheless, even without this asset the valuation of
M4‟s assets is more than any of the other three HHs. Much of the differences can be
attributed to differing valuations of houses between Idah and Ekwuloko. The term
„house‟ is a loose one and would typically cover a number of buildings not just one.
While individuals would naturally tend to perhaps over-value their own buildings the
DDS researchers confirmed valuations via a neutral source.
A second complication with asset valuation is linked to location. This point has
already been noted for HH M4 with regard to the ownership of the house in Idah. The
same is true to a lesser extent of the two Igbo households in Ekwuloko, but especially
that of M3. The house valuation of nearly M2,000,000 covers two properties: one in
Ekwuloko and one in Nsukka. Also, the valuation of N150, 000 for two grinding mills
covers the value of one at Ekwuloko and one at Nsukka. This further highlights the
„bi-locational‟ nature of three of the HHs included in the study. The only one with a
sole presence in Ekwuloko is M1.
It can be instructive to take houses and buildings out of the equation and compare
what could be referred to as „productive‟ capital although this is not an easy
distinction in the Igala context where many assets are flexible in the sense that they
can be used to generate income – if only in kind. Also, of course, valuation of an asset
may not be directly linked to its potential for income generation. Even so it can be
instructive and here it has been taken in a narrow meaning of agricultural equipment,
livestock/fishing, transport (necessary for marketing, paid employment etc) and
processing. The valuation of „productive‟ assets under five categories is provided as
Table 14. The greater comparative wealth of some of the four Ekwuloko HH (notably
M2 and M4) compared to Edeke is again evident with the „productive‟ assets. Indeed
the productive assets of M4 are almost equivalent in value to the combined productive
assets of all four Edeke HH. However, Edeke HH have more in the way of
agricultural assets, and this reflects the larger land areas they farm and the dominance
of agricultural products in HH income, a point that will be returned to later. In
Ekwuloko the valuation of agricultural tools is much the same across the four HHs,
with the high value of N152,100 for M4 being explained by the inclusion of one item
- a motor saw. M4 clearly has much less livestock than the other 3 HHs probably
further confirming the part-time nature of his farming activities. However, both M3
and M4 have a great deal of investment in transport, which confirms their greater
mobility. These two HHs also have a strong investment in processing.

47
Table 14. Valuation of „productive‟ assets within the categories of agricultural tools
(cutlass, hoe, saw), livestock (hens, goats, sheep), transport (bicycle, motor bike,
wheel barrow, canoe), processing (oil palm trough, grinding mill) and fishing (nets,
hooks, spears).
(a) Ekwuloko (Naira; 2004 value)
Household
Category M1 M2 M3 M4
Agricultural tools 6,300 10,100 5,100 152,100
Livestock 23,100 95,000 2,000 28,100
Transport 5,000 73,000 145,000 217,700
Processing 2,400 0 150,000 160,000
Total 36,800 178,100 302,100 557,900
Note: the high value of agricultural assets for HH M4 can be explained by the
ownership of one single tool - a power saw.
(b) Edeke (Naira; 2005 value)
Household
Category E1 E2 E3 E4
Agricultural tools 37,000 27,800 8,400 14,000
Livestock 10,000 66,800 4,000 9,000
Transport 21,000 73,000 6,000 155,000
Processing 4,000 40,000 0 0
Fishing 10,000 31,000 20,700 32,200
Total 82,000 238,600 39,100 210,200
How does this pattern of asset ownership compare to the rest of the two villages? It
was neither possible nor necessarily desirable to carry out the same detailed
assessment as presented here for the whole village, but it was possible to use some
indicators of wealth across HHs in Ekwuloko to allow a comparison with the four
HHs. This was not logistically possible in Edeke. A summary of the wealth ranking
exercise for Ekwuloko is presented as Table 15. The three indicators of wealth
employed were:
1. Total number of buildings owned by the HH (dwellings, kitchen, toilet, goat
houses, processing buildings etc.)
2. Car ownership
3. Ownership of motorcycles and grindings mills (combined)
These indicators are in order of importance. Both the choice of indicators and their
relative ranking were as determined by people in Ekwuloko and not by the
researchers.
Table 15 presents the ranking of the 111 HHs in Ekwuloko based upon the three
indicators. The range from top to bottom, particularly with the first indicator (number
of buildings occupied by the HH) is substantial. Here it ranges from 1 to 10 buildings.
However, it should also be noted that many of the Igbo HHs in particular rent the
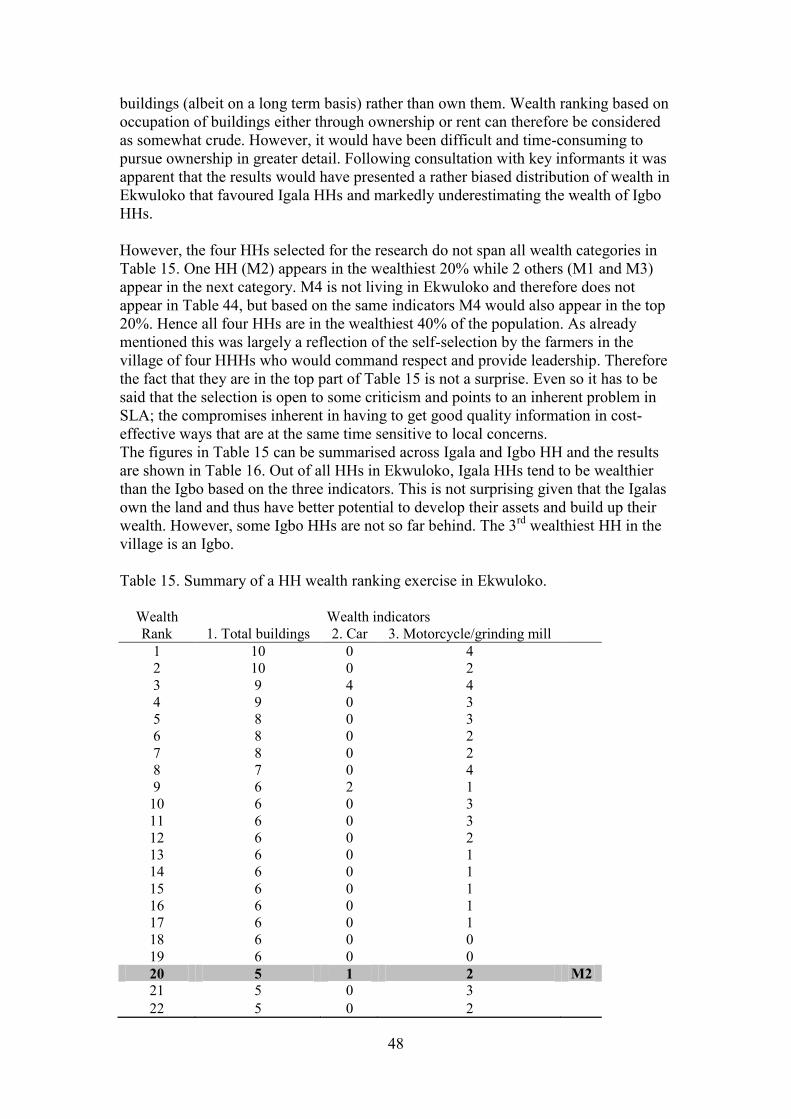
48
buildings (albeit on a long term basis) rather than own them. Wealth ranking based on
occupation of buildings either through ownership or rent can therefore be considered
as somewhat crude. However, it would have been difficult and time-consuming to
pursue ownership in greater detail. Following consultation with key informants it was
apparent that the results would have presented a rather biased distribution of wealth in
Ekwuloko that favoured Igala HHs and markedly underestimating the wealth of Igbo
HHs.
However, the four HHs selected for the research do not span all wealth categories in
Table 15. One HH (M2) appears in the wealthiest 20% while 2 others (M1 and M3)
appear in the next category. M4 is not living in Ekwuloko and therefore does not
appear in Table 44, but based on the same indicators M4 would also appear in the top
20%. Hence all four HHs are in the wealthiest 40% of the population. As already
mentioned this was largely a reflection of the self-selection by the farmers in the
village of four HHHs who would command respect and provide leadership. Therefore
the fact that they are in the top part of Table 15 is not a surprise. Even so it has to be
said that the selection is open to some criticism and points to an inherent problem in
SLA; the compromises inherent in having to get good quality information in cost-
effective ways that are at the same time sensitive to local concerns.
The figures in Table 15 can be summarised across Igala and Igbo HH and the results
are shown in Table 16. Out of all HHs in Ekwuloko, Igala HHs tend to be wealthier
than the Igbo based on the three indicators. This is not surprising given that the Igalas
own the land and thus have better potential to develop their assets and build up their
wealth. However, some Igbo HHs are not so far behind. The 3rd
wealthiest HH in the
village is an Igbo.
Table 15. Summary of a HH wealth ranking exercise in Ekwuloko.
Wealth
Rank
Wealth indicators
1. Total buildings 2. Car 3. Motorcycle/grinding mill
1 10 0 4
2 10 0 2
3 9 4 4
4 9 0 3
5 8 0 3
6 8 0 2
7 8 0 2
8 7 0 4
9 6 2 1
10 6 0 3
11 6 0 3
12 6 0 2
13 6 0 1
14 6 0 1
15 6 0 1
16 6 0 1
17 6 0 1
18 6 0 0
19 6 0 0
20 5 1 2 M2
21 5 0 3
22 5 0 2
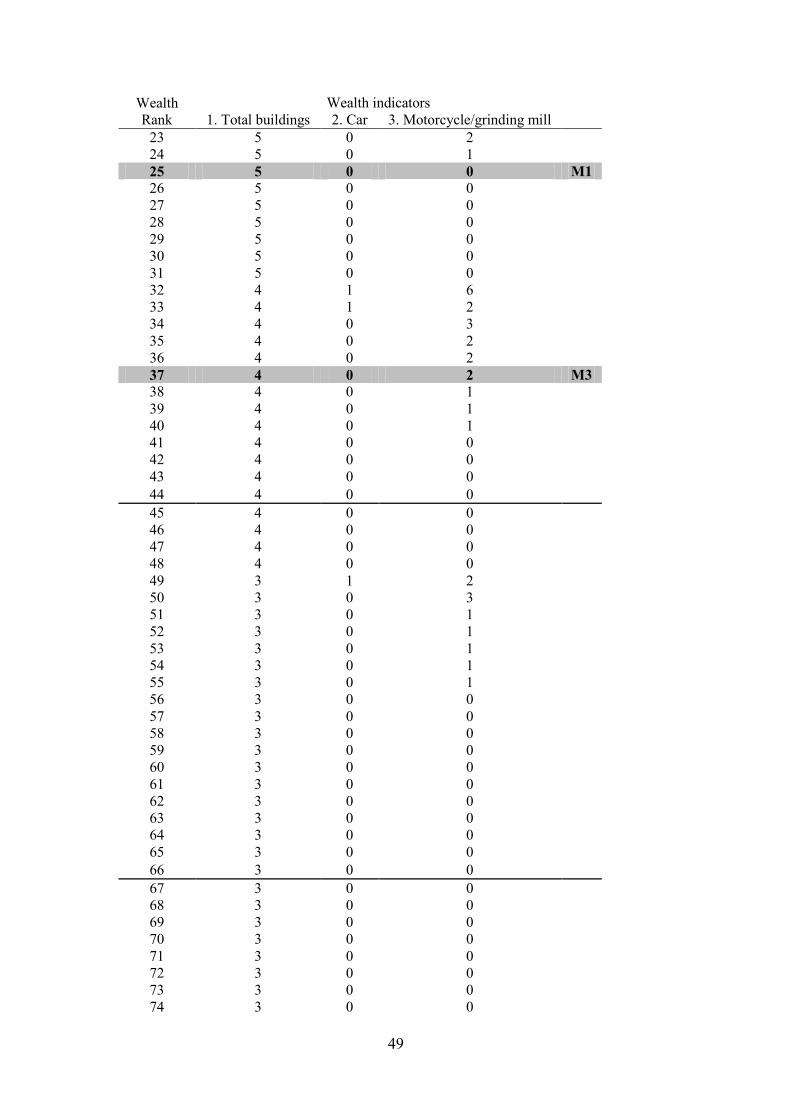
49
Wealth
Rank
Wealth indicators
1. Total buildings 2. Car 3. Motorcycle/grinding mill
23 5 0 2
24 5 0 1
25 5 0 0 M1
26 5 0 0
27 5 0 0
28 5 0 0
29 5 0 0
30 5 0 0
31 5 0 0
32 4 1 6
33 4 1 2
34 4 0 3
35 4 0 2
36 4 0 2
37 4 0 2 M3
38 4 0 1
39 4 0 1
40 4 0 1
41 4 0 0
42 4 0 0
43 4 0 0
44 4 0 0
45 4 0 0
46 4 0 0
47 4 0 0
48 4 0 0
49 3 1 2
50 3 0 3
51 3 0 1
52 3 0 1
53 3 0 1
54 3 0 1
55 3 0 1
56 3 0 0
57 3 0 0
58 3 0 0
59 3 0 0
60 3 0 0
61 3 0 0
62 3 0 0
63 3 0 0
64 3 0 0
65 3 0 0
66 3 0 0
67 3 0 0
68 3 0 0
69 3 0 0
70 3 0 0
71 3 0 0
72 3 0 0
73 3 0 0
74 3 0 0

50
Wealth
Rank
Wealth indicators
1. Total buildings 2. Car 3. Motorcycle/grinding mill
75 3 0 0
76 3 0 0
77 3 0 0
78 3 0 0
79 3 0 0
80 2 2 0
81 2 0 1
82 2 0 1
83 2 0 1
84 2 0 1
85 2 0 0
86 2 0 0
87 2 0 0
88 2 0 0
89 2 0 0
90 2 0 0
91 2 0 0
92 2 0 0
93 2 0 0
94 2 0 0
95 2 0 0
96 2 0 0
97 2 0 0
98 2 0 0
99 2 0 0
100 2 0 0
101 2 0 0
102 2 0 0
103 2 0 0
104 2 0 0
105 1 0 3
106 1 0 1
107 1 0 0
108 1 0 0
109 1 0 0
110 1 0 0
111 1 0 0
Table 16. Distribution of Igala and Igbo HHs (based on ethnicity of HHHs) amongst 5
wealth categories.
Ethnic group
Wealth category Igala Igbo Total
1 (wealthiest) 12 (6.94) 10 (15.06) 22
2 8 (6.94) 14 (15.06) 22
3 8 (6.94) 14 (15.06) 22
4 5 (6.94) 17 (15.06) 22
5 (poorest) 2 (7.25) 21 (15.75) 23
Total 35 76 111
Expected counts in parentheses
Chi-square = 12.22 df = 4 P < 0.05

51
Also of import is that there is no difference in distribution between male and female
headed HHs for wealth indicators (Table 17). Females head some 14% of HHs in
Ekwuloko, and as mentioned already the trend in Igalaland is towards having more
female HHH as males migrate out looking for work. Although only two wealth
categories are shown in Table 17 in order to facilitate the Chi-square analysis there is
no apparent association between wealth category and gender. Female-headed HHs are
as likely to be classified as wealthy or poor as are male headed HHs. The explanation
for this equality is relatively straightforward. In Igala and Igbo culture a female-
headed HH can arise when the husband is working away from the village, perhaps in
paid employment elsewhere or when the husband dies. If the husband dies then assets,
including land, are passed to the eldest son if he is old enough, who, strictly speaking
is the new HHH. However, if the eldest son is too young to assume this responsibility,
the family of the late husband is entitled to take all assets. Nowadays this law is being
relaxed as education increases and as there is no guarantee that the deceased
husband‟s family will take care of the widow and her family. The „acting‟ HHH is
then the eldest female, typically the wife. If the husband is living away he is still
technically the HHH but the wife acts in that capacity. In either case it is unlikely that
the wealth indicators will detect any difference.
Table 17. Distribution of male and female HH (based on gender of HHH) amongst
two wealth categories.
Gender
Wealth category Male Female Total
1 (wealthiest) 40 (38.05) 4 (5.95) 44
2 (poorest) 56 (57.95) 11 (9.05) 67
Total 96 15 111
Expected counts in parentheses
Chi-square = 1..22 df = 1 P = 0.27
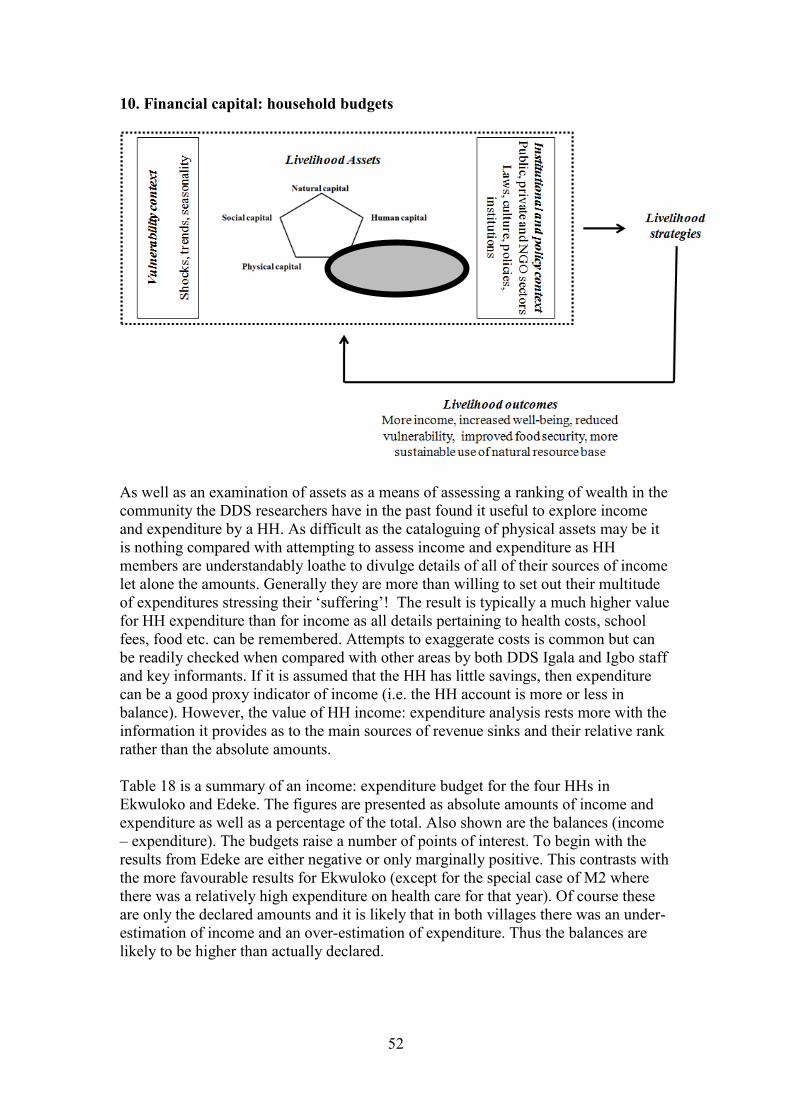
52
10. Financial capital: household budgets
As well as an examination of assets as a means of assessing a ranking of wealth in the
community the DDS researchers have in the past found it useful to explore income
and expenditure by a HH. As difficult as the cataloguing of physical assets may be it
is nothing compared with attempting to assess income and expenditure as HH
members are understandably loathe to divulge details of all of their sources of income
let alone the amounts. Generally they are more than willing to set out their multitude
of expenditures stressing their „suffering‟! The result is typically a much higher value
for HH expenditure than for income as all details pertaining to health costs, school
fees, food etc. can be remembered. Attempts to exaggerate costs is common but can
be readily checked when compared with other areas by both DDS Igala and Igbo staff
and key informants. If it is assumed that the HH has little savings, then expenditure
can be a good proxy indicator of income (i.e. the HH account is more or less in
balance). However, the value of HH income: expenditure analysis rests more with the
information it provides as to the main sources of revenue sinks and their relative rank
rather than the absolute amounts.
Table 18 is a summary of an income: expenditure budget for the four HHs in
Ekwuloko and Edeke. The figures are presented as absolute amounts of income and
expenditure as well as a percentage of the total. Also shown are the balances (income
– expenditure). The budgets raise a number of points of interest. To begin with the
results from Edeke are either negative or only marginally positive. This contrasts with
the more favourable results for Ekwuloko (except for the special case of M2 where
there was a relatively high expenditure on health care for that year). Of course these
are only the declared amounts and it is likely that in both villages there was an under-
estimation of income and an over-estimation of expenditure. Thus the balances are
likely to be higher than actually declared.
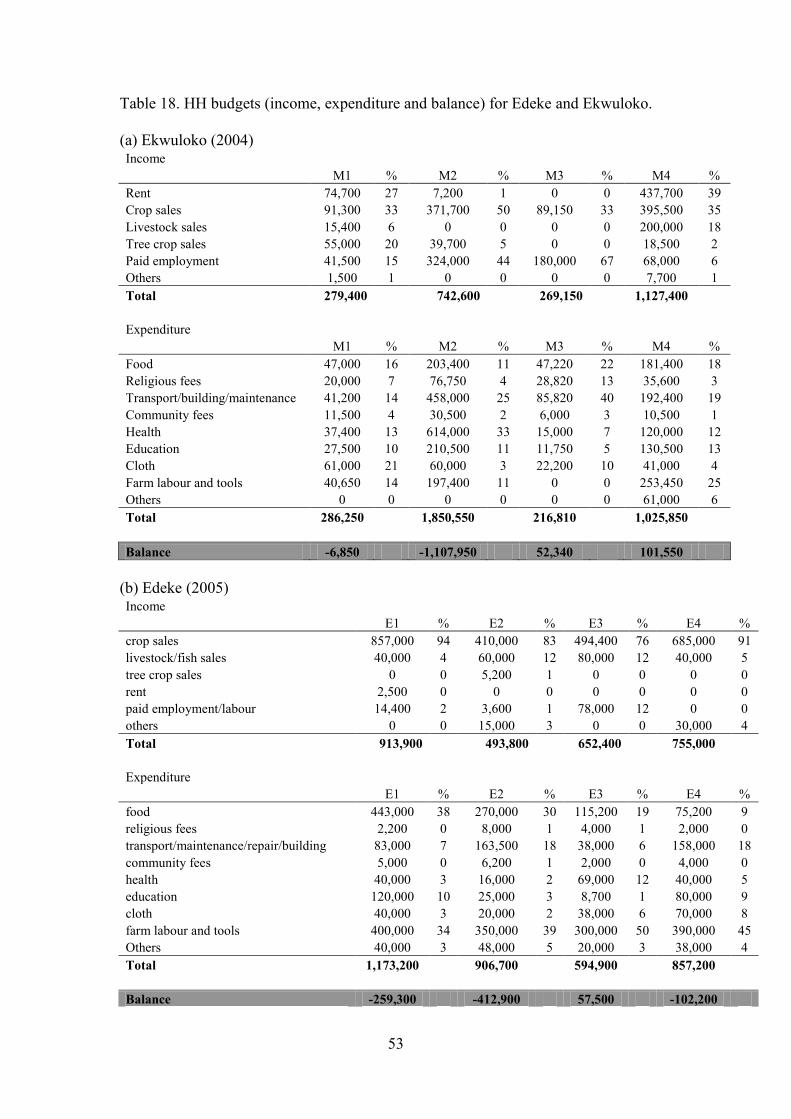
53
Table 18. HH budgets (income, expenditure and balance) for Edeke and Ekwuloko.
(a) Ekwuloko (2004) Income
M1 % M2 % M3 % M4 %
Rent 74,700 27 7,200 1 0 0 437,700 39
Crop sales 91,300 33 371,700 50 89,150 33 395,500 35
Livestock sales 15,400 6 0 0 0 0 200,000 18
Tree crop sales 55,000 20 39,700 5 0 0 18,500 2
Paid employment 41,500 15 324,000 44 180,000 67 68,000 6
Others 1,500 1 0 0 0 0 7,700 1
Total 279,400 742,600 269,150 1,127,400
Expenditure
M1 % M2 % M3 % M4 %
Food 47,000 16 203,400 11 47,220 22 181,400 18
Religious fees 20,000 7 76,750 4 28,820 13 35,600 3
Transport/building/maintenance 41,200 14 458,000 25 85,820 40 192,400 19
Community fees 11,500 4 30,500 2 6,000 3 10,500 1
Health 37,400 13 614,000 33 15,000 7 120,000 12
Education 27,500 10 210,500 11 11,750 5 130,500 13
Cloth 61,000 21 60,000 3 22,200 10 41,000 4
Farm labour and tools 40,650 14 197,400 11 0 0 253,450 25
Others 0 0 0 0 0 0 61,000 6
Total 286,250 1,850,550 216,810 1,025,850
Balance -6,850 -1,107,950 52,340 101,550
(b) Edeke (2005) Income
E1 % E2 % E3 % E4 %
crop sales 857,000 94 410,000 83 494,400 76 685,000 91
livestock/fish sales 40,000 4 60,000 12 80,000 12 40,000 5
tree crop sales 0 0 5,200 1 0 0 0 0
rent 2,500 0 0 0 0 0 0 0
paid employment/labour 14,400 2 3,600 1 78,000 12 0 0
others 0 0 15,000 3 0 0 30,000 4
Total 913,900 493,800 652,400 755,000
Expenditure
E1 % E2 % E3 % E4 %
food 443,000 38 270,000 30 115,200 19 75,200 9
religious fees 2,200 0 8,000 1 4,000 1 2,000 0
transport/maintenance/repair/building 83,000 7 163,500 18 38,000 6 158,000 18
community fees 5,000 0 6,200 1 2,000 0 4,000 0
health 40,000 3 16,000 2 69,000 12 40,000 5
education 120,000 10 25,000 3 8,700 1 80,000 9
cloth 40,000 3 20,000 2 38,000 6 70,000 8
farm labour and tools 400,000 34 350,000 39 300,000 50 390,000 45
Others 40,000 3 48,000 5 20,000 3 38,000 4
Total 1,173,200 906,700 594,900 857,200
Balance -259,300 -412,900 57,500 -102,200

54
Even so, the negative balances suggest that the four Edeke HH are relying on credit to
maintain their production and indeed conversations with the HH suggest that is indeed
the case. All of them stressed the importance of credit for farming and fishing far
more often that did respondents in the Ekwuloko HH. During the interviews the four
Edeke HHH claim to have borrowed the following amounts for farming for the 2005
growing season:
E1 N300,000
E2 N300,000
E3 N250,000
E4 N40,000
These figures are broadly in tune with the negative balances for the HH, although it
should be noted that interest payments on loans are very high – often as much as
100%. Debt is known to be a particular problem in Edeke. With the exception of M2
in Ekwuloko who was facing an especial problem of ill health in the family and hence
was likely to have borrowed money, the HH in Ekwuloko were not in debt. The small
negative balance for M1 is more likely to indicate a small positive balance once
allowance is made for under/over reporting.
The second point of interest in Table 18 relates to the source of income in Ekwuloko
and Edeke. HH income in Ekwuloko is spread between a range of sources and crop
sales represented between 30 and 50% of total income. The rest was largely made up
from land rental and paid employment as well as sales of tree products and livestock.
This illustrates the importance of non-agricultural income in Ekwuloko, although it is
difficult to extrapolate to the whole village the interviews with respondents suggest
that this balance was broadly the case for the area. In Edeke crop sales (mostly yam)
comprised 70 to 95% of total income of the four HH, with income from fishing and
livestock also being significant (4 to 12%). The income from tree crop sales and rent
are of little importance, and this is also generally true with regards to paid
employment with the notable exception of E3.
With expenditures there are also differences between the two villages. In Ekwuloko
the percentage spent on food (11 to 22%), religious fees (4 to 13%), community fees
(1 to 4%), education (5 to 13%) are comparable. Expenditure on transport, building
and maintenance are particularly high for the two Igbo HH (especially M3). For M4
the largest single sink of expenditure is farm labour and tools. Neither M2 or M3
mentioned rent payments, although the land they farm is not theirs. HHs M2 and M3
rent land from M1 at the rate of N1,500 per area per annum. M2 is also renting land
from M4. In Edeke the two largest expenditures tend to be food (9 to 38%) and farm
labour (34 to 50%). This would appear to be contradictory. After all, if these are
farming HH spending much of their income on hired labour then why the relatively
high expenditure on food? This can be explained by the relatively narrow crop base of
Edeke, and especially the inability to grow certain vegetables. The four farmers are
growing their crops largely for revenue and not for home consumption. This is
especially the case for yam, the crop that forms the mainstay of the production and
income (some 87 to 97% of total crop income is from yam). Expenditure on building,
maintenance and transport for the four Edeke HH is lower than that of Ekwuloko at
between 6 and 18%. This is not surprising given that all four Edeke HH are fixed in

55
Edeke rather than earning salaries from outside the village and none of them have
many buildings to maintain. While comparisons are problematic with some of the
lower figures (i.e. those below 10%) it does appear that proportional expenditures on
health and education are comparable across the two villages once the especial case of
M2 is taken out of the equation. It also appears as if the expenditures on community
and religious fees are significantly lower for the four HH in Edeke relative to those of
Ekwuloko,
Income for the two Igala HHs (M1 and M4) is dominated by rental of land and
income from sales of crop, livestock and tree products. For M1 86% of income comes
from these sources while for M4 the figure is even higher at 94%. For the two Igbo
HHs (M2 and M3) income is far less dominated by rental and sales of farm products.
The figures are 56% and 33% for M2 and M3 respectively. For these two HHs paid
employment is important (44 and 67% of total income).
Expenditure is very high for M2 and M4. For M2 expenditure on health care is
particularly high as one of his daughters fell seriously ill in 2004 – hence the
expenditure of N614,000 for the year and a net deficit in the HH budget. For all HH
the percentage spent on food (11 to 22%), religious fees (4 to 13%), community fees
(1 to 4%), education (5 to 13%) are comparable. Expenditure on transport, building
and maintenance are particularly high for the two Igbo HH (especially M3). For M4
the largest single sink of expenditure is farm labour and tools. Neither M2 or M3
mentioned rent payments, although the land they farm is not theirs. HHs M2 and M3
rent land from M1 at the rate of N1,500 per area per annum. M2 is also renting land
from M4.
The difference between income and expenditure suggests that the two are broadly in
balance, although HH M2 clearly has problems related to the sickness of one of the
daughters. This illustrates how medical treatment can seriously upset the HH budget
and indeed lead rapidly to debt if the balance has to be borrowed. However, in general
there are few surprises in here regarding the main sources of income and expenditure
sinks. The authors have long been aware of the importance of education and health
care as important expenditure sinks. The budgets add further confirmation that M4 is
the wealthiest of the HH and, allowing for the unusual circumstances of M2, M1 is
the poorest.

56
11. Vulnerability context
The sections above have already described some of the trends and shocks which can
be found in the two villages, and some of this was a familiar story to DDS. Increasing
population in Igalaland is putting more pressure on land, and there is a general
withdrawal of the younger generation from farming especially as younger men tend to
migrate looking for work. Fallow periods are generally in decline and crops such as
cassava which do well on depleted soil are increasing in acreage. Flooding, while
positive if it occurs at the right time, can be highly damaging to livelihoods in Edeke
if it occurs at times when crops are still growing. Added to all this is the more macro-
scale uncertainty generated by the economic and political situation in Nigeria, with
local government workers, teachers, pensioners and so on often not being paid for
months. Thus it is not difficult to imagine the problems of trying to survive in villages
like Ekwuloko and Edeke. This tapestry is common not just within Igalaland or
Nigeria but throughout West Africa and indeed beyond. However, the two villages
also represent some interesting variations on the broad theme.
Ekwuloko is a village of two communities; Igala and Igbo. The Igbos are immigrants
to the village, even if they have not come from very far away (the Igboland border is
within a few miles of Ekwuloko). In Ekwuloko there did seem to be plenty of land
and that explains why Igbos have migrated there. Thus the two populations have
different asset bases. The Igalas have access to more land which they own while the
Igbos have to rent. The HH are generalists. They grow a variety of crops and trees and
engage in off-farm activities, including paid employment. In Edeke the less diverse
cropping system with a dominance of rice and yam has led to greater specialisation
and as yam is an expensive crop to grow an elaborate system of seed supply and credit
has arisen which generates peaks and troughs of finance availability throughout the
year. The HH budgets in Edeke paint a picture of credit dependency, and those HH
also have a smaller asset base that those in Ekwuloko. The Edeke HH rent their land
and need to have access to credit and good quality seed yam planting material. The

57
sources of these have changed over the years and will probably change again in the
future.
Social networks appear to be more diverse in Edeke and HH in that place have a
higher degree of membership of such groups. Agriculture-based groups seem to be
especially strong in Edeke. In theory, such networks should provide a valuable
support-base for livelihood. Information can be exchanged and as some of the groups
are state or national in scale then they could provide a valuable basis for feeding into
policy. There is no evidence to suggest that such groups are under threat and, if
anything, the diversity and extent of such groups has increased rather than diminished.
To what extent they provide real support in terms of livelihoods is difficult to say, but
it seems reasonable to suggest that membership is advantageous and the diversity of
the groups seen in both villages is a positive contribution to livelihood.
So how do these differences affect vulnerability to shocks? This is a difficult question
to answer despite all of the information that has been collected. In Edeke the
livelihood base is more specialised (narrower) than Ekwuloko and this would suggest
that they are more vulnerable to shocks. A catastrophic flood event does cause much
damage and will wreck livelihoods at least for a time. Given the changes being
brought about by global warming it is possible that river levels will rise and thus
damaging flood events may increase in both frequency and intensity. Also, it is not
just the natural shocks which need to be considered. The reliance on but a few crops
for the bulk of HH income puts them at the mercy of price fluctuations. Up till now
the price of yam has remained relatively high as many farmers in Igalaland and
elsewhere have found it increasingly difficult to cultivate and have tended to switch to
cassava. The yam specialists of Edeke can do well in these circumstances especially
as yam remains a highly coveted food, but this may change. Do they have other
options for replacing yam if prices crash? Given the nature of their land the answer is
probably not. Other crops can be grown but they will not be as financially lucrative as
yam, and fishing is also not a good substitute. One approach would be for them to
reduce the costs of growing yam, and one of the major costs is seed material which
they import each year from specialist seed yam growers along the western bank of the
Niger river, but this is not an easy option and credit is critical. The dominance of the
river in the lives of the people is indeed a mixed blessing. It „gives‟ in terms of land
replenishment, income from fishing and ease of transport but it can „take‟ in terms of
its ferocity.
In Ekwuloko the wider base of livelihood would suggest a greater ability to deal with
shocks and that village has certainly survived for a long time. Its links to the Igala
ruling families also seems to add to a greater sense of resilience. The hybridisation of
Igala and Igbo cultures provides a unique sense of looking towards both Igalaland and
the much larger Igbo populations of the South east of Nigeria. Transportation links are
being improved with the construction of a major highway linking Idah with Nsukka
and on to Enugu. The cropping system is diverse relative to Edeke and drops in some
crop prices can readily be accommodated by a shift to other crops or indeed forms of
income. Despite all this the problems faced by Ekwuloko are probably the same as
elsewhere – primarily the danger of losing its younger generations as they seek
incomes elsewhere.
58
12. Did SLA succeed?
The final section of the paper will put the pieces of the SLA picture together and
evaluate the advantages and disadvantages of the approach as well as outline what
DDS could learn from it so as to inform changes to their credit scheme. Did the
analysis succeed in terms of informing in terms of producing a story that DDS could
use as the basis for change?
It must be noted that any SLA is by definition unique to the specific context within
which it is applied. Thus there are facets of the Ekwuloko and Edeke analyses which
inevitably only apply to those places. Ekwuloko is a border village in every sense of
the term. It rests near to a border between Kogi and Enugu States but more
importantly rests within an area of ethnic mixing. Many of the villages in that zone
have the same mix of Igala and Igbo and to the west of Igalaland the border there with
Benue State has villages with mixed Igala and Idoma communities. Nigeria is a
country of 140 million people and there are hundreds of ethnic groups. Social borders
between all of these groups are fuzzy. Thus while on the one hand any attempt to
generalise the findings from Ekwuloko village may easily be resisted this should not
be taken too far. Similarly, the village of Edeke is representative of thousands of such
villages along the banks of that great river but they are obviously far different in
context from the hundreds of thousands of villages that exist away from the two main
rivers. Dismissal of any attempt to generalise from the Edeke results is all too
tempting and to some extent is warranted but care does need to be taken to avoid
rejecting any wider lessons that may be gleaned.
Nonetheless the case-study foundation of much of the SLA literature can be
problematic precisely because it is so easily dismissed as being „site specific‟. While
it is „analysis‟ in a real sense such studies can also be labelled with that most deadly
of terms – being descriptive. In terms of the central import of SLA as a means of
bringing about change this frankly does not matter, but there is a case to be made for
enhancing the potential for comparative research with SLA so as to identify patterns
(de Haan, 2005). In this study an attempt has been made to compare two villages that
were expected to be quite different but this was not so much to identify a pattern, not
possible with just two places in any case, but for DDS to learn about two extremes
and how a new credit scheme may apply. While a more meta-SLA approach may be
attractive in theory the practice may not be so easy. First there are issues of
commonality in approach (or lack of it). SLA is a broad banner that covers many
disparate practices even if the underlying philosophy is constant, and this may not
help comparisons. Secondly, there is a „lower common denominator‟ issue. Some
SLAs are in greater depth than are others, thus the additional knowledge from some
SLAs may be wasted as comparisons are not possible with other places where that
knowledge was not gleaned. Therefore the danger is one of only being able to identify
somewhat large-scale patterns that are almost meaningless; for example, that
„agriculture is an important component of livelihood in many places‟!
Similar issues over representation arise within the villages. Only four HH were
assessed in each place and they obviously represent a very small proportion of the
village populations. In Ekwuloko there was an attempt to locate the four HH within
the population in terms of some socio-economic indicators and results suggest that the
four HH were at the upper end (better off) of the spectrum. In Edeke it was not

59
possible to do this for logistical reasons. Thus even with a better spread of HH within
the spectrum in Ekwuloko, and perhaps even more of them, there is always the
criticism that those selected are unrepresentative of the village population as a whole.
Community is indeed a myth and populations are not homogeneous. Conclusions
drawn from the SLA on the four HH in Ekwuloko can always be contradicted by
talking with another HH in a different compound along the same road. If one is only
attempting to help those four HH then it may not matter, but if the aim is to draw out
generalities that apply to a lot more HH then diversity will always win and some will
either not be affected at all by any planned intervention and some could even be
disadvantaged.
What do the SLAs say about the two villages? It is clear that Edeke is a quite different
agro-ecological and socio-economic environment to Ekwuloko but that is not
surprising as after all Edeke was chosen with precisely that in mind. It would have
been astonishing if the results for the two places had been similar. Credit was clearly
an important issue in Edeke and less so in Ekwuloko. Some of the women (and men)
money lenders will reside outside of Edeke and they do wield much power. In a focus
group discussion one of the four HHH said that he was wary of upsetting the money
lenders by not borrowing from them in one year as after all what happens the
following year when he may need credit? Breaking the HH out of such a credit trap is
not easy given that whatever is done has to ensure sustainability so that the farmers
and their families do not fear having to go back to the money lenders almost on their
knees. Confidence is a critical ingredient for sustainable livelihood.
Can it be said that Ekwuloko is more sustainable than Edeke? Asking this question
and indeed attempting to answer it is certainly tempting, but can it be done? At one
level it may seem that Ekwuloko is the more sustainable of the two given that it has
greater diversity in livelihood, at least in terms of the HH that were assessed.
However the Edeke agricultural system works well even if the HH have to source
expensive yam planting material from some distance away along the banks of the
Niger and there is some reliance on credit. If sustainability is taken to be the ability of
the system to resist and survive shocks then Ekwuloko would arguably be in a better
position to switch between livelihood options. What would the HH in Edeke do if
credit was no longer available from current sources at a reasonable cost? The problem
with such hypothetical questions is that markets can shift. Why would the Edeke HH
not be able to source credit from elsewhere as they have done in the past? It would
take a major upheaval, such as rising river levels as a result of climate change, to
bring about a major disruption to their way of life and that would also impact on
millions of others. Therefore any attempt to empirically compare Edeke and
Ekwuloko in terms of some normative definition of sustainability is problematic to
say the least.
With regard to the SLA methodology it has to be stressed that the work involved,
even when looking at relatively few households as in this case, was substantial. DDS
expected this and hence during the process of village selection care was taken to think
through the costs and the logistics involved. The awareness of DDS on the part of
village HH in both places, but more so at Edeke, was of immense help and findings
could be checked constantly with those who knew the villages well. DDS has key
informants at all levels in Igala society from the Attah of Igala (the Chief of all Igala
people) from the complex system of area and village chiefs to civil servants, business
60
men and women, religious groups (Christian and Muslem) and ordinary folk. Thus
findings can be readily checked. The trust in DDS staff was also evident amongst the
households. But even with all of these advantages and a relatively narrow focus on a
few households the SLA was far from being easy or cheap. At its height DDS had one
member of its staff dedicated almost full-time to the two SLA‟s (a total of 2 years)
and sometimes up to 4 of its other staff were drafted in to help. Add to this the cost of
transport and subsistence in the field as well as processing data and the costs are
significant.
As important as the logistics are even more important is the fact that to be effective an
externally-led SLA, such as here, depends upon the quality and quantity of
information supplied by those taking part. Indeed one of the criticisms often levelled
at SLA is that it ends up being a cataloguing exercise which generates long lists of
figures and can lessen the importance of „people‟. There is an important element of
trust and the need to „truth‟ information which HH‟s supply. In both cases, but
especially in Ekwuloko, there was a tendency on the part of respondents to downplay
their ownership of assets. In the case of farmer M4, for example, he purposely did not
mention that he owned a much larger tract of land than he originally claimed. This, of
course, would have a significant impact on an assessment of his asset base and hence
options for improving livelihood sustainability. There are various reasons why HH
would want to do this. For example:
1. Tax (or other government intervention). A fear that those engaged in SLA will
report the findings back (directly or indirectly) to government officials who
may then seek to increase taxes.
2. Theft. Revealing the ownership of assets may make the HH a target for
thieves. It should ne noted that armed robbery in Nigeria is now widespread
and with the opening up of Igalaland with new roads this has even spread to
areas that had been relatively free of armed robbery. Given that Ekwuloko is
more vulnerable in this sense, being far more accessible to vehicles, this was
more of an issue in that place than Edeke.
3. Development. Claiming that the HH had less assets than they actually have
could be seen as a means of enhancing the chances of more development
coming to the village, or more precisely to the HH. The perception here might
be that claiming relative wealth would be detrimental; any resources would go
elsewhere.
Thus it should be noted that HH do have motives for not providing information or for
exaggerating or downplaying some facts. This does not mean, of course, that skilled
SLA facilitators can compensate to some extent for this. For example, it was clear to
the DDS staff engaged in the Ekwuloko SLA that farmer M4 was „hiding something‟
and thus it was possible to tease out from him at least some of the additional land he
owned. Observation can go a long way to identifying assets and this process can in
turn engender better cooperation as respondents realise that some aspects of HH
livelihood cannot be hidden or exaggerated. Thus the benefits of cataloguing assets
are not simply the numerical lists that are generated at the end, although there are
limits to what even the most skilled external observer can glean.
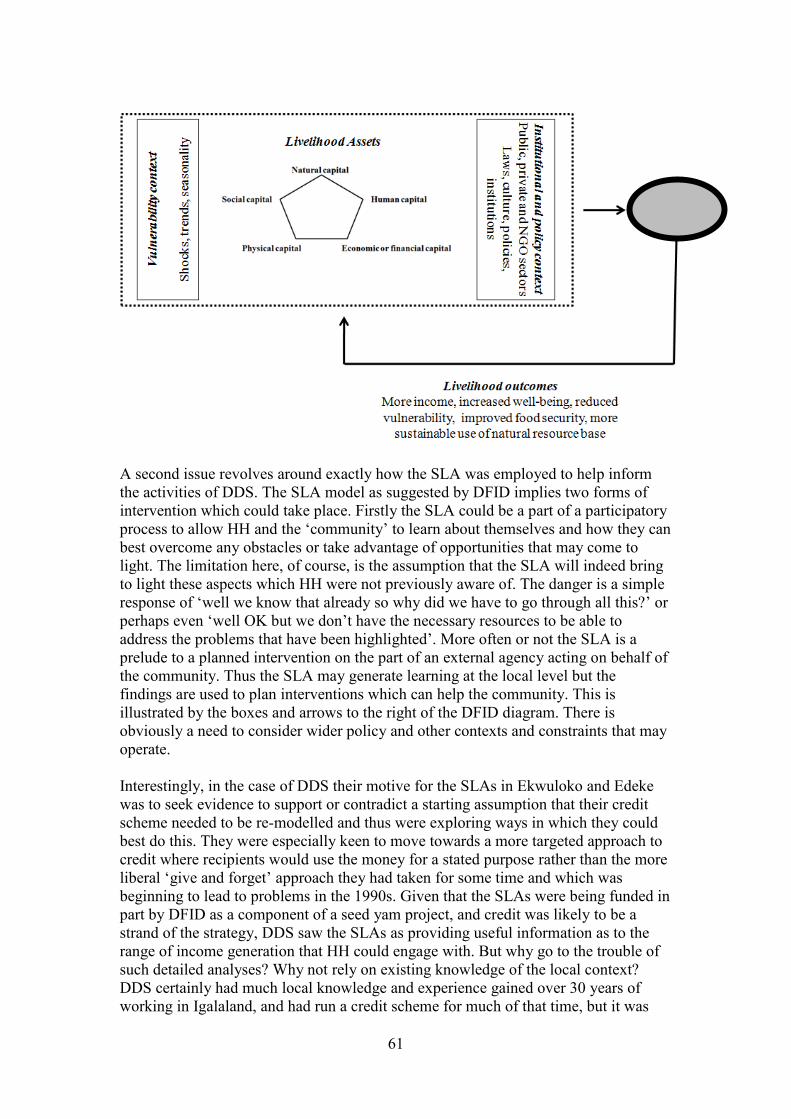
61
A second issue revolves around exactly how the SLA was employed to help inform
the activities of DDS. The SLA model as suggested by DFID implies two forms of
intervention which could take place. Firstly the SLA could be a part of a participatory
process to allow HH and the „community‟ to learn about themselves and how they can
best overcome any obstacles or take advantage of opportunities that may come to
light. The limitation here, of course, is the assumption that the SLA will indeed bring
to light these aspects which HH were not previously aware of. The danger is a simple
response of „well we know that already so why did we have to go through all this?‟ or
perhaps even „well OK but we don‟t have the necessary resources to be able to
address the problems that have been highlighted‟. More often or not the SLA is a
prelude to a planned intervention on the part of an external agency acting on behalf of
the community. Thus the SLA may generate learning at the local level but the
findings are used to plan interventions which can help the community. This is
illustrated by the boxes and arrows to the right of the DFID diagram. There is
obviously a need to consider wider policy and other contexts and constraints that may
operate.
Interestingly, in the case of DDS their motive for the SLAs in Ekwuloko and Edeke
was to seek evidence to support or contradict a starting assumption that their credit
scheme needed to be re-modelled and thus were exploring ways in which they could
best do this. They were especially keen to move towards a more targeted approach to
credit where recipients would use the money for a stated purpose rather than the more
liberal „give and forget‟ approach they had taken for some time and which was
beginning to lead to problems in the 1990s. Given that the SLAs were being funded in
part by DFID as a component of a seed yam project, and credit was likely to be a
strand of the strategy, DDS saw the SLAs as providing useful information as to the
range of income generation that HH could engage with. But why go to the trouble of
such detailed analyses? Why not rely on existing knowledge of the local context?
DDS certainly had much local knowledge and experience gained over 30 years of
working in Igalaland, and had run a credit scheme for much of that time, but it was

62
also conscious of the need to link proposed change to evidence. Thus the SLAs were a
part of an attempt to revise an existing intervention rather than about creating a new
one. DDS certainly felt that it learned a great deal from the SLAs and its new credit
scheme – FEED – does indeed have a much stronger emphasis on recipients to show
how the credit helps to enhance their livelihood. Pining down a cause-effect
relationship between the SLA and FEED is not easy given that DDS went into the
SLA process with an underlying „feel‟ that their credit scheme needed to be targeted
and be better linked to investment. In fact the evolution of the new approach to credit
occurred in parallel with the SLA rather than at the end. Reliance on credit in Edeke
was especially worrying and DDS has reviewed its credit provision to the riverine
communities, although the matter is complicated given the presence of many local
credit providers.
Nonetheless the question has to be asked as to whether a more „quick and dirty‟
approach would have succeeded better than was achieved by DDS? Frankly while this
would have been a great deal cheaper and quicker it is doubtful whether it would have
been any more successful in these circumstances and may well have been less so.
Indeed did DDS need to do an SLA at all given their extensive knowledge of
Igalaland. Could FEED have been designed without any resort to SLA? The fact that
DFID was providing some funding for the SLAs may well have influenced the
decision of DDS to widen the remit of the work, but such „what if‟ scenarios are not
easy to dissect. DDS senior staff were certainly adamant that their redesign of the
credit scheme would have to be based on “village level studies” as to what is required
irrespective of DFIDs involvement. To some extent, of course, the fact that DDS
underwent the SLAs as a basis for redesigning the credit scheme does provide them
with a great deal of credibility and it has to be remembered that DDS obtains funding
from a number of overseas aid agencies (Catholic Church-based and secular). These
agencies constantly require DDS to provide arguments for its planned interventions,
and DDS was seeking support from a major Irish aid agency to provide a „kick start‟
? ?

63
from FEED. Indeed herein rests a dilemma? How is „success‟ to be assessed with
SLA? Is it with the quality of the analysis, whatever that may mean, or quality of the
analysis as a trade off with cost? Alternatively should „success‟ be gauged in terms of
any change which followed the SLA rather than the SLA itself? Presumably all three
of these stances could be adopted, albeit with greater emphasis upon what was finally
achieved, and take the DFID model in its entirety, perhaps as part of a formal
planning framework with indicators to measure success. DDS certainly saw the SLAs
in Ekwuloko and Edeke as a success, and the farmers involved, especially those in
Edeke, continue to engage in DDS projects. During interviews with senior DDS staff
at the end of 2008 they maintained that the FEED programme is working well but that
is where the story stops. It is not possible here to talk about how the credit scheme has
impacted upon HH livelihoods and in turn enhanced (or not) the asset base.
13. Some conclusions
It has to be reiterated that despite the criticisms mentioned in the paper SLA does
represent a significant step forward in development thinking. It is not so much that the
methods are new but the philosophy that an intervention has to be founded on holistic
thinking and be based on evidence and a sound understanding of constraints may
sound obvious but SLA did help to crystallise all of this under one heading. The
desire for evidence-based intervention and policy is still something of a Holy Grail
even if it has received much attention in recent years. SLA is a manifestation of that
desire but still has to operate within the maelstrom of other influences that typically
come to bear on the nature of interventions and policies. There are always concerns of
cost and practical feasibility to consider, of course, but there are other factors as well.
In this case study the SLAs were undertaken with an intervention already very much
in mind – credit. DDS has a long history of working in micro-credit provision and is
institutionally geared towards implementation in terms of its staff training, experience
and systems. Credit is undoubtedly important in Igalaland, as evidenced by the
experiences of the Edeke HH, but here we have a situation where the SLA wasn‟t the
starting point but employed instead as a means of enhancing the function of an
existing intervention. One can‟t help but wonder how widespread this is within
sustainable development? Are SLAs employed as genuine starting points which in
effect exist on a blank canvass of interventions or are they implemented within a
context of interventions already been identified (even if only loosely)? No doubt this
would be an interesting area of research.
Thus as with all such attempts to bring about evidence-based approaches the
implementation is a significant step up from theory (Singh and Gilman, 2002). The
examples illustrated here show how much effort SLAs can demand and how
vulnerable they can be to a good supply of quality information. These same issues
have dogged „evidence-based‟ approaches. The two SLAs described here „worked‟ in
the sense that much was learnt by all involved and DDS has gone on to use that
information to help frame its new credit scheme. Indeed it is interesting to note how
the development of FEED took place in parallel with the SLAs as a sort of dynamic
learning process rather than waiting till the end of the SLAs. However the cost was
high and even at the end there are still many questions left unanswered. SLA is also
trying to address a moving target. A new set of SLAs with the same HH in Ekwuloko
and Edeke would no doubt generate quite different results even if undertaken only a
few years later.
64
SLA is an example of an approach founded on good theory driven by an
understandable desire to link intervention to evidence, but there can be a tendency for
good theory to obscure the equal need for good practice based upon that theory.
14. Acknowledgements
The authors would like to begin by acknowledging the support of the late Bishop of
Idah Diocese, Dr E. S. Obot, and for encouraging this type of intervention.
Within DDS, there are many who deserve mention including Remigius Ikkah, Gerard
Obaje, Raphael Akubo, Clement Agada, Sunday Onakpa, Stephen Okanebu and last
but certainly not least Sr Felicitas Ogbodo.
This work was partly funded by the Department for International Development
(DFID) of the UK (ZA0566). Trocaire (Ireland) and Gorta (Ireland) deserve a big
thank you for without their assistance the work would not have been possible. The
views expressed in this report are the views of the authors and not necessarily the
views of the Crop Protection Programme managed on behalf of DFID by NRIL or the
views of DFID, Trocaire or Gorta.
15. References
Amalric F (1998) The Sustainable Livelihoods Approach: General Report of the
Sustainable
Livelihoods Project 1995–1997. Society for International Development, Rome.
Ashley C and Carney D (1999) Sustainable Livelihoods: Lessons from early
experience. Department for International Development, London.
Bruckmeier K and Tovey H (2008). Knowledge in sustainable rural development:
From forms of knowledge to knowledge processes. Sociologia Ruralis 48(3), 313-
329.
Butler LM and Mazur RE (2007). Principles and processes for enhancing sustainable
rural livelihoods: Collaborative learning in Uganda. International Journal of
Sustainable Development and World Ecology 14(6), 604-617
Carney D (ed.) (1998), Sustainable rural livelihoods. What contribution can we make?
Department of International Development. Russell Press Ltd, Nottingham.
Carney D, Drinkwater, M, Rusinow, T, Neefjes, K, Wanmali, S and Singh, N (1999).
Livelihoods Approaches Compared. Department for International Development,
London.
Chambers, R and Conway, GR (1992). Sustainable rural livelihoods: Practical
concepts for the 21st century. IDS Discussion Paper No. 296. IDS, Brighton.
Conroy, C and Litvinoff, M (eds.) (1988) The Greening of Aid: Sustainable
Livelihoods in
Practice. Earthscan Publications Ltd. London.

65
Davies, S (1996) Adaptable Livelihoods: Coping with Food Insecurity in the Malian
Sahel.
Macmillan, London.
Department for International Development (DFID) (1997). Eliminating World
Poverty: A Challenge for the 21st Century. White Paper on International
Development. HMSO, London. Available at
www.dfid.gov.uk/Pubs/files/whitepaper1997.pdf
Department for International Development (DFID) (1999) Sustainable Livelihoods
and Poverty Elimination. Department for International Development, London.
Department for International Development (DFID) (2000a) Sustainable Livelihoods –
current thinking and practice. Department for International Development, London.
Department for International Development (DFID) (2000b) Sustainable Livelihoods –
building on strengths. Department for International Development, London.
Department for International Development (DFID) (2000c) Achieving Sustainability:
Poverty Elimination and the Environment, Strategies for Achieving the International
Development Targets. Department for International Development, London.
Department for International Development DFID (2000d) Eliminating World Poverty:
Making Globalisation Work for the Poor, White Paper on International Development.
London: Stationery Office.
D'Silva, BC and Raza MR (1980). Integrated rural development in Nigeria: The
Funtua project. Food Policy 5(4), 282-297.
Ellis, F (2000) Mixing It: Rural Livelihoods and Diversity in Developing Countries.
Oxford University Press, Oxford.
Farrington, J, Carney, D, Ashley, C and Turton, C (1999). Sustainable livelihoods in
practice: early application of concepts in rural areas. Natural Resources Perspectives
42. Overseas Development Institute, London.
Farrington, J (2001). Sustainable livelihoods, rights and the new architecture of aid.
Natural Resource Perspectives 69. Overseas Development Institute, London.
Fenichel, A and Smith B (1992). A successful failure - integrated rural-development
in Zambia. World Development 20(9), 1313-1323
de Haan, LJ (2005). How to research the changing outlines of African livelihoods.
Paper presented at the 11th General Assembly of CODESRIA, 6-10 December 2005,
Maputo 2005.
Gaiha R, Imai K, Kaushik PD (2001). On the targeting and cost-effectiveness of anti-
poverty programmes in rural India. Development and Change 32(2), 309-342.

66
Guyer, J and Peters, P (1987), Introduction. Conceptualizing the household: issues of
theory and policy in Africa. Development and Change Special Issue 18(2), 197-214.
Helmore, K and Singh N (2001) Sustainable Livelihoods: Building on the Wealth of
the Poor. Kumarian Press, Connecticut, USA.
Huston, AC (2008). From research to policy and back. Child Development 79(1), 1-
12.
Long, N (1984), Family and work in rural societies. Tavistock Publications, London.
Neefjes, K (2000) Environments and Livelihoods: Strategies for Sustainability.
Oxfam, Oxford.
Neylan, J (2008). Social policy and the authority of evidence. The Australian Journal
of Public Administration 67(1), 12-19.
Odero, KK (2006). Information capital: 6th asset of sustainable livelihood framework.
Discovery and Innovation 18(2), 83-91.
Pawson, R (2006). Evidence-based policy: A realist perspective. Sage Publications
Ravallion M (1997). Good and bad growth: The Human Development Reports. World
Development 25 (5), 631-638.
Rennie, K and Singh, N (1996) Participatory Research for Sustainable Livelihoods: a
Guidebook for Field Projects. International Institute for Sustainable Development,
Manitoba, Canada
Roe, EM (1998) Policy Analysis and Formulation for Sustainable Livelihoods. New
York: United Nations Development Programme.
Ruttan, VW (1984). Integrated rural development programmes: A historical
perspective. World Development 12(4), 393-401.
Sanderson, I (2002). Evaluation, policy learning and evidence-based policy making.
Public Administration 80(1), 1-22.
Scoones, I (1998) „Sustainable Rural Livelihoods: A Framework for Analysis‟,
Working Paper 72, Brighton, UK: Institute for Development Studies.
Sen AK (1984). Resources, Values and Development. Harvard University Press,
Cambridge, Mass.
Sen AK (1985). Commodities and Capabilities. Oxford University Press, Oxford.
Sen AK (1999). Development as freedom. Oxford University Press, Oxford.
Shankland, A (2000) „Analysing Policy for Sustainable Livelihoods‟, Research
Report 49,
Brighton, UK: Institute of Development Studies.
67
Singh, N and Kalala, P (1995) Adaptive Strategies and Sustainable Livelihoods:
Community and Policy Studies for Burkino Faso, Ethiopia, Kenya, South Africa and
Zimbabwe. International Institute for Sustainable Development. Manitoba, Canada.
Singh, N and Gilman, J (2002). Making Livelihoods more Sustainable. International
Social Science Journal 51(162), 539-545.
Solesbury, W (2003). Sustainable Livelihoods: A Case Study of the Evolution of
DFID Policy. Working Paper 217, Overseas Development Institute, London.
Srinivasan TN (1994). Human development: A new paradigm or reinvention of the
wheel? The American Economic Review 84 (2), 238-243.
Tavakoli, M, Davies HTO and Thomson R (2000). Decision analysis in evidence-
based decision making. Journal of Evaluation in Clinical Practice 6(2), 111-120.
United Nations Development Programme (1990). Human Development Report 1990.
UNDP, Human Development Report Office, New York
World Commission on Environment and Development (WCED) (1987) Our Common
Future, Oxford University Press, Oxford.
Yudelman, M (1976). The role of agriculture in integrated rural development projects:
the experience of the World Bank Sociologia Ruralis 16(3), 308-325.
Zoomers A (2005). Three decades of rural development projects in Asia, Latin
America, and Africa - Learning from successes and failures. International
Development Planning Review 27(3), 271-296.