sustainable lake management plan wilkinson lake ramsey ... · sustainable lake management plan ....
TRANSCRIPT

Sustainable Lake Management Plan Wilkinson Lake
Ramsey County, MN
Prepared by: Kristine Jenson
Vadnais Lake Area Water Management Organization November 2011

Wilkinson Lake Sustainable Lake Management Plan ‐ 2011 Page 2
Table of Contents 1. Acknowledgements......................................................................................................................................... 5 2. Introduction .................................................................................................................................................... 6 3. Watershed Features ........................................................................................................................................ 7
A. History ........................................................................................................................................................................................ 7 B. Wilkinson Lake Drainage Area ............................................................................................................................................. 11 C. Soils ........................................................................................................................................................................................... 12 D. Wetlands .................................................................................................................................................................................. 13 E. Wildlife Observations ............................................................................................................................................................ 14
4. Lake Features ................................................................................................................................................ 15 A. Shoreline Inventory ................................................................................................................................................................ 15 B. Lake Depth .............................................................................................................................................................................. 15 C. Lake Sediments........................................................................................................................................................................ 16 D. Aquatic Plants ......................................................................................................................................................................... 18 E. Fishery Status ........................................................................................................................................................................... 18 F. Water Quality Summary ......................................................................................................................................................... 19
5. Setting Water Quality Goals for Wilkinson Lake .......................................................................................... 21
Wilkinson Lake Sustainable Lake Management Plan ‐ 2011 Page 3

Wilkinson Lake Sustainable Lake Management Plan ‐ 2011 Page 4

1. Acknowledgements
VLAWMO wishes to thank the following: • The North Oaks Company, specifically Gary Eagles, for providing lake history, previous lake studies, and
assistance with VLAWMO staff to gain access to the lake for monitoring activities. Much of the historical information was taken from the Wilkinson Lake Management Plan that was prepared for the North Oaks Company in June 1994 by Professional Engineering Consultants Incorporated.
• Chris Mann for collecting water samples as part of the Citizen’s Lake Monitoring Program. • Skip Mott for his information about wildlife observations since 2007.
The cornerstone of VLAWMO’s success is our vital partnerships; without the help of all those listed above, we would not be able to fulfill our mission. We appreciate all of your work and assistance.
Wilkinson Lake Sustainable Lake Management Plan ‐ 2011 Page 5

2. Introduction
Wilkinson Lake is located in North Oaks, Ramsey County and lies within the Vadnais Lake Area Water Management Organization. Wilkinson is a 94 acre shallow lake with a depth of only 4.5 feet. The lake is part of the Pleasant Lake chain which has water pumped in from the Mississippi River which eventually ends in East Vadnais Lake. This water is the drinking water reservoir for the City of St. Paul and other surrounding communities. Wilkinson has a fish barrier on the western end which was installed in the 1994 for the intention of controlling the water level in Wilkinson from the Mississippi River water that is pumped into the Pleasant Lake Chain of lakes and to reduce the influx of rough fish such as carp. Gary Eagles with the North Oaks Company stated in 2010 that he hasn’t seen any back flow of Mississippi water into Wilkinson since the installation of the barrier. Flow is seen in the canal between Deep Lake and Wilkinson Lake but the barrier seems to prevent it from getting into Wilkinson. The lake is part of the Minnesota Land Trust which preserves land in a natural condition. The City of North Oaks requires a 150 foot buffer between the lake edge and any structures. Figure 1: Location Map
Wilkinson Lake Sustainable Lake Management Plan ‐ 2011 Page 6

3. Watershed Features
A. History (much of this information was taken from the Wilkinson Lake Management Plan, prepared by Professional Engineering Consultants Inc. in 1994.) The City of North Oaks was settled by the Hill family prior to the 1900’s and many drainage projects were undertaken to enhance farming activities. Ditches and drain tile drained much of the land and connected many of the natural water bodies which previously had natural separation. In the late 1800’s, the St. Paul Water Utility (SPWU) was established to provide a reliable water resource for the residents of the City. The Pleasant Lake chain was entrusted to the SPWU to accomplish this objective. Water conduits were extended from the Mississippi River to augment the water supply through the chain of lakes. Prior to the dike installation in the 1990’s, rapid fluctuation of the water levels in the Pleasant Lake chain has caused black-flushing into Wilkinson Lake. The shallow lake, directly connected to the Pleasant Lake chain and, consequently, the Mississippi River, was deluged with a rough fish population. The bottom of Wilkinson was continuously stirred up from rough fish. The North Oaks Company has spent considerable time and effort to restore the lake including the installation of a fish barrier to attempt to keep the rough fish from destroying the natural vegetation and waterfowl habitat. A dike and control structure was constructed in 1994 at the outlet on the western side of Wilkinson Lake in an attempt to restore the lake and remove the rough fish influx to the lake. When the structure was put in, the lake was drawn down and many fish died. The main fish found were dogfish, bullheads and carp. The 2 goals of the 1994 restoration project were: 1. Improve the water quality of Wilkinson Lake 2. Improve the wetland habitat of Wilkinson Lake for wildlife. The lake has also had two draw downs to kill the carp. The efficacy of the fish barrier is a yearly battle. A fish survey could give information as to how well the barrier is working currently. Aerial Photo History Figure 2: 1940 Aerial photo of Wilkinson Lake
Wilkinson Lake Sustainable Lake Management Plan ‐ 2011 Page 7

In 1940, the area is largely undeveloped and Interstate 35E has not been constructed yet. The roads now known as County Road J and Centerville Road were constructed. To the east and north of the lake, there is agricultural land. The “island” in Wilkinson Lake is considerably larger in 1940 than it is currently, perhaps due to lower water levels. Figure 3: 1953 Aerial photo of Wilkinson Lake
In 1953, there is still no development around the lake. It appears the water levels are higher due to more open water. Figure 4: 1974 Aerial photo of Wilkinson Lake
Wilkinson Lake Sustainable Lake Management Plan ‐ 2011 Page 8
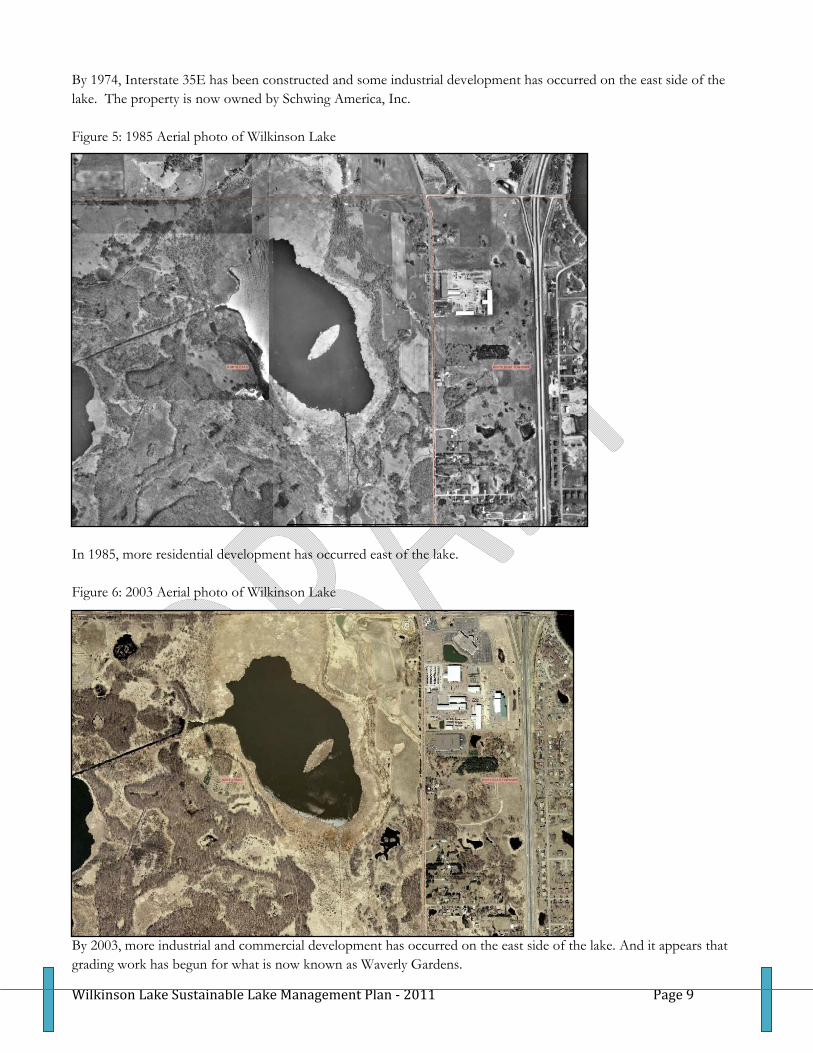
By 1974, Interstate 35E has been constructed and some industrial development has occurred on the east side of the lake. The property is now owned by Schwing America, Inc. Figure 5: 1985 Aerial photo of Wilkinson Lake
In 1985, more residential development has occurred east of the lake. Figure 6: 2003 Aerial photo of Wilkinson Lake
Wilkinson Lake Sustainable Lake Management Plan ‐ 2011 Page 9
By 2003, more industrial and commercial development has occurred on the east side of the lake. And it appears that grading work has begun for what is now known as Waverly Gardens.

Figure 7: 2009 Aerial photo of Wilkinson Lake
By 2009, Waverly Gardens has been constructed as well as the office area for the North Oaks Company and Tria Restaurant. Residential development is also going in south of Waverly Gardens and beginning on the west side of the lake.
Wilkinson Lake Sustainable Lake Management Plan ‐ 2011 Page 10

B. Wilkinson Drainage Area Wilkinson receives water from various sources. Some water is from storm sewer systems that collect water from 35E and the commercial and industrial area located between Centerville Road and 35E. Much of this water goes through storm ponds and natural low lying areas before it enters the lake itself. Another area that water comes from is on the north side of lake, which is a mixture of commercial, residential and agricultural. Finally water comes in through a creek on the south side of Wilkinson. Much of the land in this area is low density residential.
Figure 8: Wilkinson Lake Drainage Area and Flow Patterns
Wilkinson Lake Sustainable Lake Management Plan ‐ 2011 Page 11

Wilkinson Lake Sustainable Lake Management Plan ‐ 2011 Page 12
C. Soils The soil directly around Wilkinson Lake is Seelyeville which is an organic muck. The soils near the lake are of the mucky types (Rifle, Markey, Cathro). Soils on the upland areas include Hayden, Zimmerman, Isanti, and Anoka which are all fine sandy loams which are good for parkland and for building on. Figure 9: Soils around Wilkinson Lake
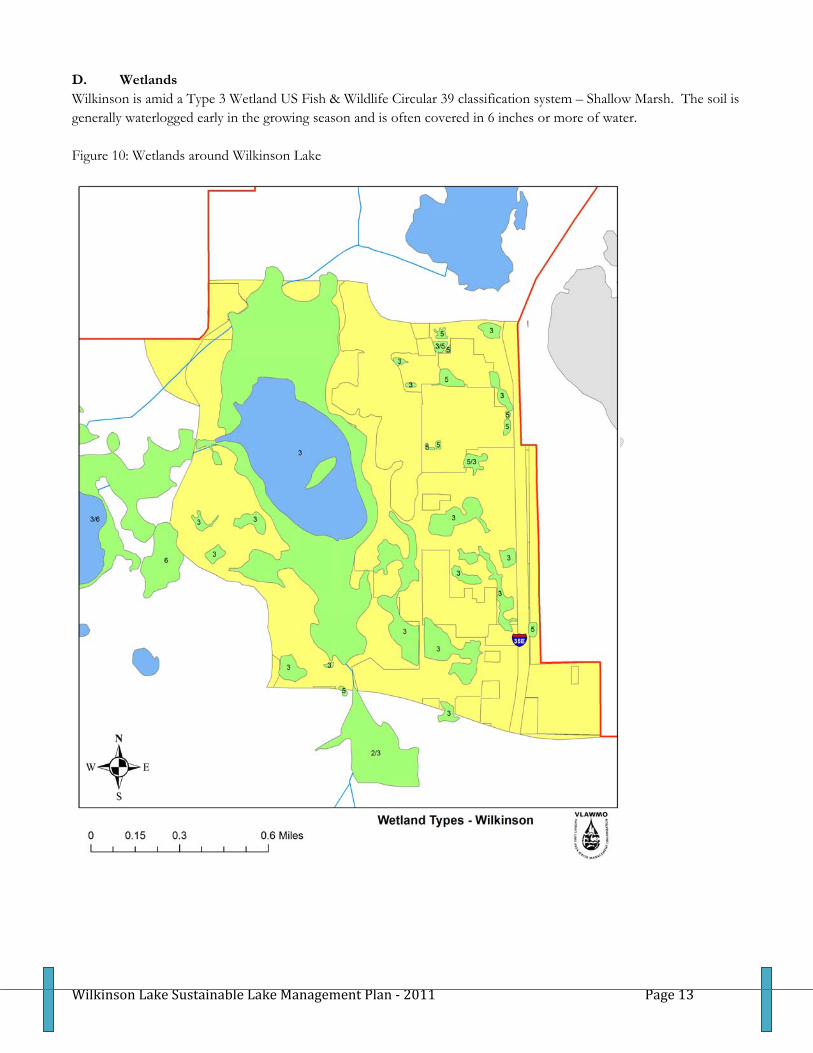
D. Wetlands Wilkinson is amid a Type 3 Wetland US Fish & Wildlife Circular 39 classification system – Shallow Marsh. The soil is generally waterlogged early in the growing season and is often covered in 6 inches or more of water. Figure 10: Wetlands around Wilkinson Lake
Wilkinson Lake Sustainable Lake Management Plan ‐ 2011 Page 13

E. Wildlife Observations Skip Mott, a resident on Wilkinson Lake submitted his wildlife observations since 2007. Most notably, Trumpeter Swans return to the lake each year and have babies (cygnets). In 2009 & 2010, none of the babies survived. Mortality is unknown but it is guessed that they were preyed upon by mink or other predators. In March 2010, 40 bald eagles were spotted on the ice of the lake, feeding on dead fish. The lake has diving ducks that use the lake in the fall as a stopover on their way south. Species noted include: Common Goldeneye, Bufflehead, Hooded Merganser, Northern Shoveler, Gadwall, and Mallard. Additionally, an osprey nest is located on the northwestern side of the lake. When VLAWMO staff did a lake depth study in May 2010, we noted the presence of 2 Trumpeter Swans, 2 Loons, 1 Painted Turtle, a Wood Duck, several Canada Geese and hundreds of dragonflies. Additionally, beavers have been spotted in a pond just south of the lake. Sandhill Cranes have been observed but have not nested on the lake. Black Tern have been observed feeding at the lake. In November, it has been observed that 100s of diving birds and ducks use the lake
Wilkinson Lake Sustainable Lake Management Plan ‐ 2011 Page 14

4. Lake Features A. Shoreline Inventory The land surrounding Wilkinson Lake is under a conservation easement and therefore no development directly abuts the lake. There is multi-family housing and commercial to the east of the lake, agriculture and residential to the north, and residential to the west and south. Much of the water that runs off into Wilkinson goes through ponds or drainage areas so direct runoff is low. B. Lake Depth On May 19, 2010, a survey was done to determine the depth of Wilkinson. We knew that Wilkinson was a shallow lake without much change. Our survey found that the deepest part was no more than 4.5 feet. The majority of the lake is 2-3 feet deep. This means the lake most likely freezes completely in the winter. Figure 11: Wilkinson Lake Depth
Wilkinson Lake Sustainable Lake Management Plan ‐ 2011 Page 15

C. Lake Sediment Survey A survey was conducted by VLAWMO staff on February 25, 2010 and the samples were submitted to the University of Minnesota Soils Lab for analysis. There is nothing to indicate any major issues with the sediments of Wilkinson Lake. A more intensive analysis could be done in the future that would look at whether there is internal loading of phosphorus in the lake and whether the particle size of the sediments make the lake water more susceptible to being cloudy and murky. Figure 12: Sediment Collection Locations
Wilkinson Lake Sustainable Lake Management Plan ‐ 2011 Page 16

Table 1: Wilkinson Soil Sample Results
Wilkinson Soil Sample Results
location Organic Matter %
soluble salts mmhos/cm pH Nitrate
ppm Phosphorus
ppm P Potassium
ppm K Copper ppm Cu
W1 49.4 2.08 7.4 <1.1 4 47 0.5 W2 55.3 2.6 7.3 1.9 4 87 1.6 W3 54.3 2.79 7.2 <1.1 5 78 1.7 W4 56.9 2.26 7.3 <1.1 5 73 1.7 W5 66.3 1.48 6.2 <1.1 15 44 1.6 W6 14.6 2.16 7.4 <1.1 5 39 0.6 W7 51.5 2.27 7.1 <1.1 16 68 1.1 W8 57 2.78 7.2 <1.1 5 73 1.3 W9 56.6 2.23 7 <1.1 7 65 0.8 W10 33.2 1.92 7.6 1.3 4 37 0.6
Table 2: Summary of Soil Sample Results
pH pH was at optimum-acceptable levels for all samples. Soluble Salts Samples appear to be acceptable but salt levels should be monitored. A few samples were
approaching the possible problem level suggesting contamination, possibly coming from salted streets, parking lots, and sidewalks.
Nitrate This is an essential plant nutrient. Most northern lakes have concentrations of less than 4ppm. Levels within Wilkinson are acceptable.
Potassium Since natural levels of sodium and potassium ions in soil and water are very low, their presence may indicate lake pollution caused by human activities. Sodium is often associated with chloride. It finds its way into lakes from road salt, fertilizers, and human and animal waste. Potassium is the key component of commonly used potash fertilizer and is abundant in animal waste. Soils retain sodium and potassium to a greater degree than chloride or nitrate, therefore sodium and potassium are not as useful as pollution indicators. Increasing sodium and potassium values over time can mean there are long term effects caused by pollution. Although no normally toxic themselves, these compounds strongly indicate possible contamination from more damaging compounds. Wilkinson ranges from 37-87ppm which is low to medium levels of potassium.
Phosphorus Phosphorus is the key nutrient affecting algae and weed growth. Phosphorus originates from a variety of sources, many of which are related to human activities. Major sources include human and animal wastes, soil erosion, detergents, septic systems and runoff from farmland or lawns. Wilkinson ranges between 4-16ppm, which is a low to medium range.
Copper Copper is a relatively common metal in the environment. Average copper concentration in lakes is 15-30ppm. Copper is applied on many lakes to control algae and weeds and over time can accumulate in lake sediment to levels that can become toxic to fish and other organisms. Wilkinson ranges from 0.5-1.7ppm which is very low but indicative of the fact that there haven’t been any copper treatments done to the lake.
Wilkinson Lake Sustainable Lake Management Plan ‐ 2011 Page 17
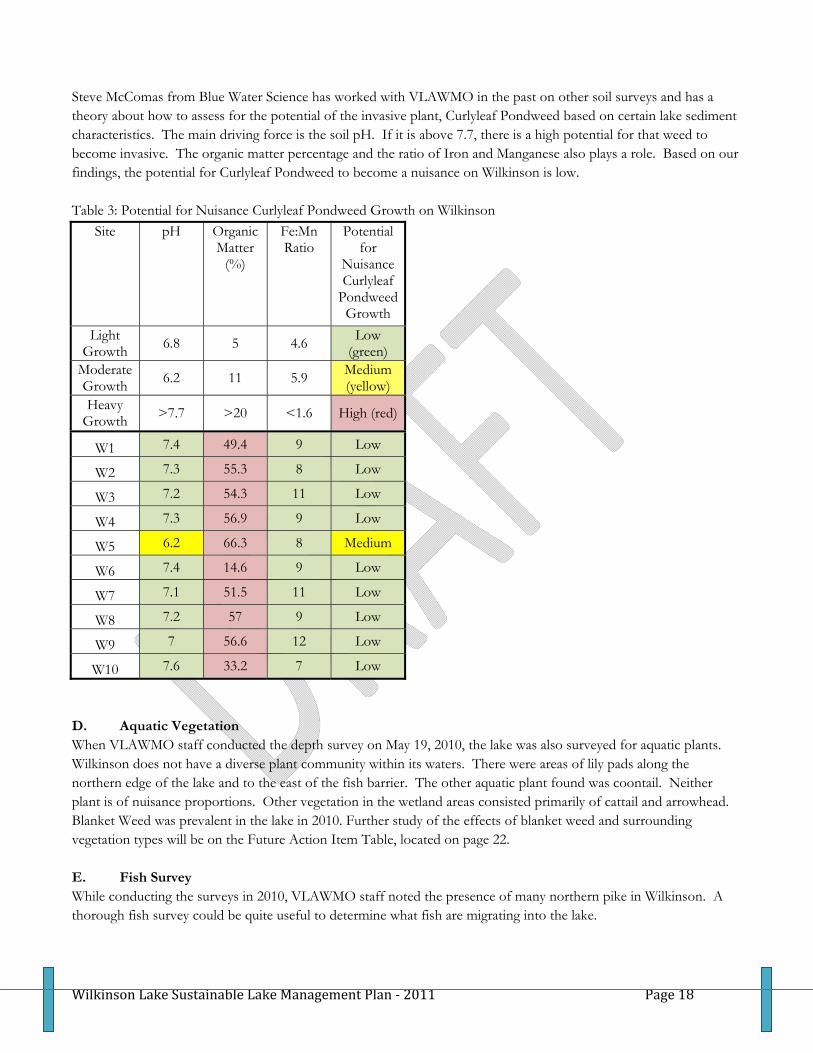
Steve McComas from Blue Water Science has worked with VLAWMO in the past on other soil surveys and has a theory about how to assess for the potential of the invasive plant, Curlyleaf Pondweed based on certain lake sediment characteristics. The main driving force is the soil pH. If it is above 7.7, there is a high potential for that weed to become invasive. The organic matter percentage and the ratio of Iron and Manganese also plays a role. Based on our findings, the potential for Curlyleaf Pondweed to become a nuisance on Wilkinson is low. Table 3: Potential for Nuisance Curlyleaf Pondweed Growth on Wilkinson
Site pH Organic Matter
(%)
Fe:Mn Ratio
Potential for
Nuisance Curlyleaf
Pondweed Growth
Light Growth 6.8 5 4.6 Low
(green) Moderate Growth 6.2 11 5.9 Medium
(yellow) Heavy
Growth >7.7 >20 <1.6 High (red)
W1 7.4 49.4 9 Low
W2 7.3 55.3 8 Low
W3 7.2 54.3 11 Low
W4 7.3 56.9 9 Low
W5 6.2 66.3 8 Medium
W6 7.4 14.6 9 Low
W7 7.1 51.5 11 Low
W8 7.2 57 9 Low
W9 7 56.6 12 Low
W10 7.6 33.2 7 Low D. Aquatic Vegetation When VLAWMO staff conducted the depth survey on May 19, 2010, the lake was also surveyed for aquatic plants. Wilkinson does not have a diverse plant community within its waters. There were areas of lily pads along the northern edge of the lake and to the east of the fish barrier. The other aquatic plant found was coontail. Neither plant is of nuisance proportions. Other vegetation in the wetland areas consisted primarily of cattail and arrowhead. Blanket Weed was prevalent in the lake in 2010. Further study of the effects of blanket weed and surrounding vegetation types will be on the Future Action Item Table, located on page 22. E. Fish Survey While conducting the surveys in 2010, VLAWMO staff noted the presence of many northern pike in Wilkinson. A thorough fish survey could be quite useful to determine what fish are migrating into the lake.
Wilkinson Lake Sustainable Lake Management Plan ‐ 2011 Page 18

F. Water Quality Summary Water quality data has been collected on Wilkinson since 1998 and the yearly averages are shown in Table 1. Samples from the lake are collected every two weeks from May through September and tested for Total Phosphorus (TP) and Chlorophyll A (Chl A) at the Ramsey County Lake Management Lab and a Secchi Depth Transparency (SDT) measurement is taken. Wilkinson is a eutrophic lake and the levels of TP and Chl A are consistently higher than the lake nutrient criteria established by the MPCA while the SDT is consistently lower than the MPCA criteria. Those results highlighted in red denote years where state standards were exceeded. Wilkinson is on the State of Minnesota’s Impaired Waters List due to the high level of nutrients (phosphorus) in the water. A Total Maximum Daily Load (TMDL) study is being done currently to assess possible sources of phosphorus and develop ways to help reduce the amount coming into Wilkinson Lake. Table 4: Wilkinson Lake Water Quality Annual Averages
Wilkinson Lake Historical Avg TP/Chl A/SDT Year TP (ug/L) Chl A (ug/L) Secchi (m) 1998 48 26 1.1 1999 62 8 0 2000 38 34 0 2001 299 99 0.2 2002 107 40 0 2003 130 18 0 2004 72 0 0 2005 183 52 0 2006 96 10 0 2007 104 18 0.9 2008 64 8 0.3 2009 125 17 1 2010 140 31 0.8
Phosphorus (TP) is the primary cause of excessive plant and algae growth in lake systems. Phosphorus originates from a variety of sources, many of which are human related. Major sources include human and animal wastes, soil erosion, detergents, septic systems and storm water runoff. There can also be internal loading of phosphorus in a lake from the sediment. The standard level set by the MPCA is less than 60 ug/L. Chl A is a green pigment in algae. Measuring Chl A concentration gives an indication of how abundant algae are in a waterbody. The MPCA standard for Chl A is less than 20 ug/L. In 2010, three storm samplers were installed within the drainage area to study the level of pollutants and nutrients as water enters the Wilkinson watershed. One was placed north of the lake off of County Road J; one was place south of the lake in a stream within the Hill Farm; and the last one was placed at a storm sewer east of the lake near Waverly Gardens. In 2011, four samplers were placed; three in the same areas as in 2010 as well as one south of the immediate subwatershed which will collect water coming from the Tamarack Nature Center area as well as the industrial area on the east side of Centerville Road. The averages for 2010 and 2011 are in Table 5. The storm samples were tested for the following: TP, Total Kjehdahl Nitrogen (TKN), Nitrates (NO3), Ammonia (NH3), and Total Suspended Solids (TSS).
Wilkinson Lake Sustainable Lake Management Plan ‐ 2011 Page 19

Figure 13: Storm Sampler Locations
Wilkinson Lake Sustainable Lake Management Plan ‐ 2011 Page 20
TKN is the sum of organic nitrogen and Ammonia (NH3) . High measurements of TKN typically results from sewage and manure discharges to water bodies. The average TKN for a lake in this ecoregion is 600-1200 ug/L. High NO3 levels are often caused by over application of fertilizers that leach into waterbodies. Unused NO3 turns into NO2 which is poisonous to fish (75ug/L will stress fish; over 500 ug/L can be toxic). Typical levels of NO3 in this ecoregion less than 100 ug/L. NH3 is a form of nitrogen contained in fertilizers, septic system effluent and animal waste. It is also a product of bacterial decomposition of organic matter. Typical levels of NH3 could not be found for this report. However, high levels of unionized NH3 can be toxic to aquatic organisms. TSS indicates the presence of very small particles in the water column. TSS interferes with light penetration, buildup of sediment, and the solids could carry nutrients that cause algal blooms and other toxic pollutants that are harmful to fish. Typical TSS in this ecoregion is 2-6 mg/L.

Table 5: Wilkinson Lake Storm Sampler Averages (2010-2011)
2010 2011
TP (ug/L) Co Road J 612 625 Hill Farm 370 421
Storm Sewer 193 162 Centerville 137
TKN (ug/L)
Co Road J 6277 2772 Hill Farm 2341 2584
Storm Sewer 1257 1420 Centerville 2164
NO3 (ug/L) Co Road J 1558 648 Hill Farm 136 409
Storm Sewer 169 234 Centerville 49
NH3 (ug/L) Co Road J 3436 385 Hill Farm 205 242
Storm Sewer 87 200 Centerville 77
TSS (mg/L)
Co Road J 32.5 130.3 Hill Farm 23.7 87.7
Storm Sewer 5.21 7.48 Centerville 53.4
In 2010, we were able to collect 3-7 samples from the locations. In 2011, we collected 5 samples from each location. Based on these limited results, it can be assumed that the runoff coming from the culvert at County Road J has the highest amount of pollutants in it. These results are not definitive but offer some insight into where pollutant loading may be coming from. As the water moves to Wilkinson, the runoff is dispersed and filtered in wetland areas and spreads out within the water body. Samples taken from the lake water and tested for TP, TKN, NO3 and NH3 showed the following: Table 6 : Samples from Wilkinson tested for runoff pollutants
Date TP (ug/L) TKN (ug/L) NO3 (ug/L) NH3 (ug/L)5/3/2010 61 1210 20 106/7/2010 103 1450 20 177/12/2010 142 1990 20 108/9/2010 211 2240 20 109/14/2010 208 2760 20 10
Avg 145 1930 20 11 Table 6 shows that as the summer season progresses, TP and TKN rise to levels that are over the typical levels for lakes in this region.
Wilkinson Lake Sustainable Lake Management Plan ‐ 2011 Page 21

Wilkinson Lake Sustainable Lake Management Plan ‐ 2011 Page 22
5. Lake Management Plan for Wilkinson Lake As stated previously in this report, Wilkinson Lake’s water quality is poor. Since the land immediately surrounding the lake is largely natural, the stakeholders must brainstorm ways that the water in these lakes could be improved. The table below lists various action items that will expand on the current knowledge of the lake and watershed and possibly enhance the water quality. The table also lists who the lead for each item could be as well as a cost range for each item. Please keep in mind that the TMDL study currently being done will also provide guidance on ways the lake can be enhanced and protected. Table 8: Action List for Wilkinson Lake Action Item Description Leader Cost Estimate
$ = <$1000 $$ = $1000-$2500 $$$ = $2500-$5000 $$$$ = >$5000
Continued Lake Monitoring
Continue current monitoring program of twice monthly lake sampling to measure nutrient levels, dissolved oxygen and temperature levels.
VLAWMO $
Enhanced Lake Monitoring
Add zooplankton and phytoplankton to monitoring program. Ramsey Co Lake Management Lab can ID diatoms.
VLAWMO & Ramsey Co
$
Fish Survey Document the type and amount of fish in Wilkinson VLAWMO, others?
$$$
Wildlife Survey Implement daily tracking of birds and wildlife seen in and around the lake.
Residents? $
Macroinvertebrate Survey
Macroinvertebrates can give information about pollution levels in a lake.
VLAWMO $
Enhanced Studies Work with all stakeholders and possibly consultants to do a Phosphorus and/or water budget for Wilkinson.
VLAWMO, North Oaks, Ramsey Co
$$
Enhanced Sediment Studies
Conduct testing on soil samples to better assess water quality within the lake and possible internal loading of Phosphorus; utilize consultants to complete this task.
VLAWMO $$$-$$$$
Continued/Enhanced Storm Monitoring
Continue to collect storm samples within the Wilkinson subwatershed.
VLAWMO $
Partnership is vital to achieving our goals in this watershed. VLAWMO will continue to work with the City of North Oaks, Ramsey County, and the North Oaks Company to move forward with the action items listed in this SLMP with the goal of protecting and enhancing Wilkinson Lake’s water quality.