sustainable green growth in developing economies
TRANSCRIPT
DOI: 10.4018/JGIM.20221101.oa1
Journal of Global Information ManagementVolume 30 • Issue 6 • November-December 2022
This article published as an Open Access article distributed under the terms of the Creative Commons Attribution License(http://creativecommons.org/licenses/by/4.0/) which permits unrestricted use, distribution, and production in any medium,
provided the author of the original work and original publication source are properly credited.
*Corresponding Author
1
Sustainable Green Growth in Developing Economies:An Empirical Analysis on the Belt and Road CountriesRuoyu He, Beijing Institute of Graphic Communication, China
Tomas Baležentis, Lithuanian Centre for Social Sciences, Lithuania
https://orcid.org/0000-0002-3906-1711
Dalia Štreimikienė, Lithuanian Centre for Social Sciences, Lithuania
https://orcid.org/0000-0002-3247-9912
Zhiyang Shen, Beijing Institute of Technology, China
https://orcid.org/0000-0002-5126-6461
ABSTRACT
The Belt and Road Initiative (BRI) initiated by the Chinese government could be regarded as a systematic framework for promoting economic cooperation and development among the countries along the Belt and Road and China. This paper attempts to analyze economic and environmental performance in 61 developing countries along Belt and Road. An additive total factor productivity growth measure allows aggregating contributions of individual countries along the BRI to construct a reasonable measure. Both desirable and undesirable outputs are considered. The growth in the total factor productivity is decomposed with respect to the economic and environmental contributions. The annual average growth rate of green productivity is 3.1%, and the disparity of economic and environmental performance could be observed among countries. Some countries show robust economic growth while environmental performance slows down green growth. This indicates that developing economies should pay attention to environmental impacts and promote sustainable development by sharing emission-reduction technologies.
KEywoRDSAggregate Directional Distance Function, Belt and Road Initiative, By-Production Model, Total Factor Productivity
1. INTRoDUCTIoN
Since the 20th century, driven by the revolution in both science and technology, the population and economy in countries the world over have increased rapidly. The excessive exploitation and use of natural resources have led to over-consumption of energy and deterioration of the environment. The emission of greenhouse gases threatens the living space of all humanity. In order to alleviate the impact of global climate change and achieve sustainable development, countries around the world
Journal of Global Information ManagementVolume 30 • Issue 6 • November-December 2022
2
are attaching more importance to green development. Under the background of energy shortage, the government of China has brought up the Belt and Road Initiative to strengthen cooperation among countries and promote global energy security and sustainable economic development. In 2015, the Chinese government issued Vision and Proposed Actions Outlined on Jointly Building Silk Road Economic Belt and 21st-Century Maritime Silk Road, and this has provided an effective platform for countries along the route of the initiative to achieve in-depth cooperation. In 2017, the Chinese government had put forward Vision and Actions on Jointly Building Silk Road Economic Belt and 21st-Century Maritime Silk Road. In 2018, Action Plan for Harmonization of Standards for Jointly Building the Belt and Road (2018-2020) was issued. The last two documents provided an opportunity for countries along the route of the initiative to realize in-depth cooperation and precisely match energy resources at a strategic level, and pointed out the direction of energy cooperation among countries along the route of the initiative. In October 2018, China and 17 countries jointly issued the Joint Declaration on the Establishment of the Belt and Road Initiative Energy Partnership, this further strengthened the energy cooperation between China and countries along the route of the initiative. (Hu et al., 2020). The energy cooperation among countries is beneficial to promote resource exchange, break down energy barriers, optimize energy structure and gradually improve green factor productivity in general (Liu and Yin, 2019).
Against such a backdrop, the Belt and Road Initiative has received responses from more than 100 countries, and 61 countries have signed cooperation agreement with China. The founding of the initiative is beneficial to the coordinated development between China and countries along the route of the initiative, since it extends from China’s border areas to Asia-Pacific and central Europe. Thus, the initiative is not only conducive to promoting in-depth cooperation between China and other regions but also to competitiveness and world influence of the enterprises in various countries, thereby reconstructing the relationship between world industries from the perspective of global industrial chain system (Rivera et al., 2019).
The countries participating in the initiative are mainly developing countries, different from the developed ones in terms of productivity, employment structure, utilization of resources and level of science and technology. Developing countries mainly have extensive economy, as well as high consumption of human resources and energy and great environmental pollution. With the gradual decrease of dividends in labor and natural resources, it has become a new direction for developing countries to upgrade science and technology and carry out green and sustainable economic development (Julia et al., 2020).
This paper tries to find out the main reasons that restrict the growth of green economy by studying the change of total factor productivity (TFP) in countries along the belt and road initiative. Traditional TFP analysis method does not consider energy consumption and pollution emissions, while green TFP growth not only considers traditional factors such as labor, capital, and GDP, but also takes economic green development indicators such as energy consumption and pollution emissions into the scope of investigation. Green TFP not only reflects the economic growth rate of each country, but also measures the coordinated development level of the economy and environment of each country. There are two main categories that can be used to calculate distance functions: a parametric method which mainly includes Dow Burggras model, transcendental logarithmic model, and the quadratic model that has parametric settings for production function (Zhou et al., 2014). However, the biggest problem with these models is that they all use presupposition, and they need to set up the production function first, but the real production function is unknown. The second category is a non-parametric method, including data envelopment analysis (DEA) and free disposal hull (FDH). Compared with the first, the second method’s advantage is that it does not require any presupposition. Therefore, the complete green total factor production index mentioned in this paper is an index-based by-product production technology (by-production) and directional distance function (DDF), all based on the data of the 61 countries participating in the belt and road initiative (2000-2017).
Journal of Global Information ManagementVolume 30 • Issue 6 • November-December 2022
3
The main contributions of this paper are as follows: first, at the methodological level, this paper constructs a difference-based TFP indicator, instead of using the previous Malmquist-index or Luenberger-indicator or Malmquist-Luenberger index. O’Donnell. (2012) and Abad and Ravelojaona (2017) argue that these production indexes are incomplete and cannot be used to calculate the total factor productivity. Secondly, the article divides the total productivity into economic productivity and environmental productivity, and compares the impact of environmental pollution on economic growth.
This paper is divided into four parts: the first being literature review, then research data and methods before results analysis, and finally, conclusion and relevant policy recommendation.
2. LITERATURE REVIEw
The research on the growth of green total factor production and its influencing factors mainly focuses on the three following aspects: First, the common methods of measuring the growth of green TFP. Green TFP considers the environmental pollution included in the measurement framework of TFP in addition to the traditional productivity growth factors such as labor, capital, and economic output. Efficiency analysis is mainly divided into static calculation and dynamic calculation. Generally, most people adopt dynamic efficiency when studying efficiency. Malmquist method proposed by Caves et al. (1982) is a commonly seen method in dynamic efficiency measurement, but it only considers input factors and expected output, so there is a certain deviation in the calculated results. Based on Malmquist method, Fare et al. (1994) combined DEA with Malmquist index, compared decision-making unit with the optimal frontier, and calculated the green TFP index. Chung (1997) put forward Malmquist-Luenberger method after further considering and combining Malmquist on the basis of his predecessors. Fare et al. (2001) further decomposed ML index into technical efficiency index and technical progress index. However, ML method calculates the ML index of period T, and the benchmark technology it faces is based on the observation of period T, which leads to different benchmark technologies in different periods and a problem of non-circulation. Therefore, Oh (2010) proposed the Global ML (GML) method based on the ideas of Pastor and Lovell (2005) in GM index method. GML index is calculated based on the same benchmark technology in all periods. GML index method has certain advantages in dealing with multi-input and multi-output variables especially when unexpected output variables are included, expanding the types of data envelopment analysis methods under resource constraints. Chen and Golley (2014) added carbon dioxide as an unexpected output to the industrial growth model of total factor production in industrial sector. Chen et al. (2018) obtained the heterogeneity characteristics of green TFP in China’s industrial sector through GML index.
The second is the convergence analysis of green TFP growth. The most used convergence methods are mainly divided into absolute convergence at the same level and relative convergence at different levels. The common methods of absolute convergence include σ convergence and absolute β convergence (Baumol,1986; Barro and Sala-I-Martin,1995); the common method of relative convergence is relative β convergence (Miller and Upadhyaya, 2002). However, conventional convergence can only examine global convergence or individual convergence, and absolute convergence is a sufficient and unnecessary condition for absolute convergence (Quah, 1993; Lichtenberg, 1994), the results of σ convergence and absolute β convergence cannot be used as the basis for mutual proof (Huang and Ma, 2018). At the same time, the conventional convergence ignores the club convergence, that is, the convergence differences among small groups in the whole population. Therefore, Phillips and Sul (2007) put forward a club convergence method. Club convergence has been widely used in recent years, for example, Mariam et al. (2013) measured the convergence of ecological efficiency. Tian (2016) used conventional convergence to study the potential of grain production, and found that the convergence results were contradictory. Finally, club convergence method was chosen to get accurate results. Yuan et al. (2020) used the green TFP and its convergence to detect China’s patent-intensive industries and found that the overall level of green TFP in patent-intensive industries was higher and showed an upward trend, with the greatest contribution to technological progress. The
Journal of Global Information ManagementVolume 30 • Issue 6 • November-December 2022
4
whole industry and strong patent-intensive industries converge towards common steady state and self-steady state, while weak patent-intensive industries only converge towards self-steady state.
The third is the analysis of the influencing factors of green TFP growth. From the international research results, foreign direct investment, industrial structure, energy structure, infrastructure and other factors will have a certain impact on the growth of green TFP (Mulder and de Groot, 2012; Sineviciene et al., 2017; Philip et al., 2018). Stern (2012) found that technological change is the most important factor affecting the green growth rate; Cullmann (2009) found that Sweden, Germany, and the United States are effective R&D countries by studying the R&D expenditure and the number of people in OECD countries. Driffield (2012) pointed out that both technical OFDI and efficiency-seeking OFDI can promote the country’s total factor growth rate. Herzer (2009) found that there is a significant positive correlation between German enterprises’ foreign investment and domestic TFP. Yang (2013) pointed out that foreign investment activities in Taiwan have positively promoted technological progress and efficiency in this region. The research results in China show that government intervention, foreign trade, industrial structure, spatial agglomeration, technological progress, infrastructure, administrative division, and energy endowment are the main factors that affect the inter-provincial green productivity. Industry research found that resource mismatch is the key factor that weaken the growth of green total factor production, whereas optimizing resource allocation can greatly improve the growth level of green TFP. In terms of the research results of the Belt and Road Initiative, Han et al. (2018) thought that trade and regional cooperation could effectively improve the growth of green TFP, while Cui and Yu (2017) thought that improving the infrastructure of countries along the route of the initiative to a certain extent would help alleviate the current situation of resource allocation, and then promote the level of green total factor growth. Ren (2019) confirmed that the agglomeration of production industry, service industry and manufacturing industry can significantly promote the promotion of green TFP. Li et al. (2018) pointed out that government decision-making and policy decisions in different fields play an important role in accelerating the promotion of green TFP and achieving the double goals of China’s economic and sustainable development and environmental improvement.
3. METHoDoLoGy
3.1 Production Technology with Undesirable outputsThe production technology of the Belt and Road countries can be represented by the production set. Each country can be considered as a decision-making unit (DMU) and totally K sample countries are included in estimation. As the undesirable output is introduced into the production technology, namely environmental production technology, this paper assumes that the production can be modelled in the sense of the by-production technology devised by Russell (2002) and Murty (2012). Assume that N P+ inputs can generate M J+ outputs. Among the outputs, M desirable (good) outputs contribute to increase in the welfare, whereas J undesirable (bad) outputs are the by-products of the production process and pose damage to the environment and society. Correspondingly, there are N inputs that do not induce unintended environmental effects (i.e., non-polluting inputs) while being utilized in the production process alongside P inputs that not only contribute to generation of the desirable outputs but also render environmental damage or other unintended outcomes (i.e., pollution-generating inputs).
The inputs and outputs of different types are mapped among themselves by exploiting the two graphs: the economic sub-technology (TEco) and environmental sub-technology (TEnv). The former one relates all the inputs to the desirable outputs, whereas the latter one only focusses on the pollution-generating inputs and undesirable outputs. Let there be quantities of pollution generating inputs and non-pollution generating ones represented by non-negative vectors x Rn N∈ + and x Rp p∈ + , respectively. In addition, let the quantities of desirable and y Rm M∈ + and z Rj J∈ + be the vectors of

Journal of Global Information ManagementVolume 30 • Issue 6 • November-December 2022
5
desirable and undesirable vectors, respectively. Therefore, one can define the by-production technology in terms of the input and output quantities. Specifically, the by-production technology is constructed as an intersection of the aforementioned sub-technologies as follows:
T T T
x x y z R x x can proBP Eco Env
n p m j N P M J n p
== ∈
∩
++ + + ( , , ) : ( ,, ) dduce y x can generate z
T x x y R x
m p j
Econ p m N P M f
;
( , )
;
, | (
{ }= ∈ +
+ + nn p m
Envp j P J p j
x y
T x z R x zg
, )
( )
, ;
, | ( ) .
≤
= ∈ ≤{ }{ }+
+
0
(1)
where f(.) and g(.) are functions that exhibit continuous derivatives. TBP
satisfies the joint disposability (Ray et al., 2018) as a result of the imposition of the free disposability for inputs and desirable outputs in TEco (A1) and costly disposability for pollution-related inputs and undesirable outputs in TEnv (A2). Formally, these assumptions are given as
A if x x y z then x x y z forn p m jEco
n p m jEco
T T1: ( , , , ) , ( , , , ) ∈ ∈� � � �
all x x y x x y
A if x z th
n p m n p m
p jEnvT
( , , ) ( , , );
: ( , ) ,
− − ≤ − −
∈
� � �
2een x z for all x z x zp j
Envp j p jT ( , ) ( , ) ( , ).� � � �∈ − ≤
(2)
In addition, constant returns to scale are assumed for the by-production technology and the two sub-technologies as we look at the aggregate-level performance.
3.2 Aggregate Directional Distance FunctionAs described by Chambers et al. (1996), the directional distance function fully characterizes the underlying production technology. The directional distance function can take different approaches towards optimizing the observed production plans. In the most comprehensive case, the simultaneous expansion of outputs and contraction of inputs are governed by the generalized directional distance function. This corresponds to maximization of the profit function. According to maximization of economic and environmental benefits, the desirable output could be expanded while undesirable output and input could be reduced. The directional distance function for environmental production technology is defined as:
D x y z g g g x g g g Tx y z x y zy z( , ) max , : ( ), ; , , , ,= ∈ − ∈+ + −{ }δ θ δ θ θ� (3)
where the direction of optimization of an observed production plan is defined in terms of vector ( ), ,g g gx y z
≥ 0 and the extent of changes in the input/output quantities (i.e., inefficiency) is given by δ . Compared to existing setting of directional vector in literature, an aggregate vector of input/output values is introduced to estimation. The benefit of such setting is that the inefficiency score (1%) implies (1%) potential reduction of input or undesirable output, or (1%) potential expansion of desirable output in terms of total sample. As the inefficiency score is additive, the contribution of TFP growth is possible to be allocated to each DMU. The generalized proportional aggregate directional distance vector is defined as:
( ) ( , , ), , , ,g g g gxn
xp
ym
zj
kn
k
K
kp
k
K
km
k
K
kj
k
K
x x y z== = = =∑ ∑ ∑ ∑
1 1 1 1
(4)
Thus, the relative measures of efficiency can be aggregated across the observations.

Journal of Global Information ManagementVolume 30 • Issue 6 • November-December 2022
6
3.3 Environmental TFP Measure and Its DecompositionThis study applies the LHM productivity indicator that satisfies the conditions for decomposable measures of the TFP as outlined by O’Donnell (2012). The LHM TFP indicator relies on the directional distance functions that entail distances to the frontiers of different time periods. The combinations of the distances result in the terms of the productivity measure that are additively related. The LHM indicator requires changing the input or output levels during the analysis besides the changes in the reference technology that are necessary for the other productivity measures (e.g., Malmquist index).
Let there be the two consecutive time periods t and t +1 . The LHM TFP indicator can be established by treating each of these two periods as the base one. The base period defines the reference technology and the input or output quantities that are assumed to be time-invariant during the calculations. Thus, the LHM TFP indicators for base periods t and t +1 are defined as:
LHM D x y z g g D x y z gt tkt
kt
kt
yt
zt t
kt
kt
kt
yt= − + + +[ ( , , ; , , ) ( , , ; ,0 01 1 1,, )]
[ ( , , ; , , )
g
D x y z g Dzt
tkt
kt
kt
xt t
+
+ +− −
1
1 1 0 0 (( , , ; , , )]x y z gkt
kt
kt
xt 0 0
, (5)
LHM D x y z g g D x y zt tkt
kt
kt
yt
zt t
kt
kt
kt+ + + + + += −1 1 1 1 1 10[ ( , , ; , , ) ( , , ++ + +
+ + +−
1 1 1
1 1 1
0; , , )]
[ ( , ,
g g
D x y zyt
zt
tkt
kt
kt ++ + + + +−1 1 1 1 10 0 0 0; , , ) ( , , ; , , )]g D x y z g
xt t
kt
kt
kt
xt
. (6)
Indeed, one cannot prefer either of the time periods as the base one. Therefore, the generalized (with respect to the base period) measures of the productivity growth can be applied by taking the average of Eqs. 5 and 6. Then, the resulting LHM ind9icator takes the following form:
TFP LHM LHM
D x y z g
t t t t
tkt
kt
kt
,
[ ( , , ; ,
+ += +( )
=
1 11
2
1
2
0
yyt
zt t
kt
kt
kt
yt
zt
tkt
kt
g D x y z g g
D x y
, ) ( , , ; , , )]
[ ( , ,
−
−
+ + + +
+
1 1 1 1
1
0
zz g D x y z g
D x y zkt
xt t
kt
kt
kt
xt
tkt
kt
; , , ) ( , , ; , , )]
[ ( , ,
+
+ +
−
+
1
1 1
0 0 0 0
kkt
yt
zt t
kt
kt
kt
yt
zt
t
g g D x y z g g
D
; , , ) ( , , ; , , )]
[
0 01 1 1 1 1 1−
−
+ + + + + +
+11 1 1 1 1 1 1 10 0 0( , , ; , , ) ( , , ; ,x y z g D x y z gkt
kt
kt
xt t
kt
kt
kt
xt+ + + + + + +− ,, )]0
. (7)
As one is generally interested in the sources of TFP growth, the TFP indicators are decomposed into certain terms. The basic decomposition focuses on the two terms representing observation-specific gains in efficiency and sample-wide movement of the production frontier:
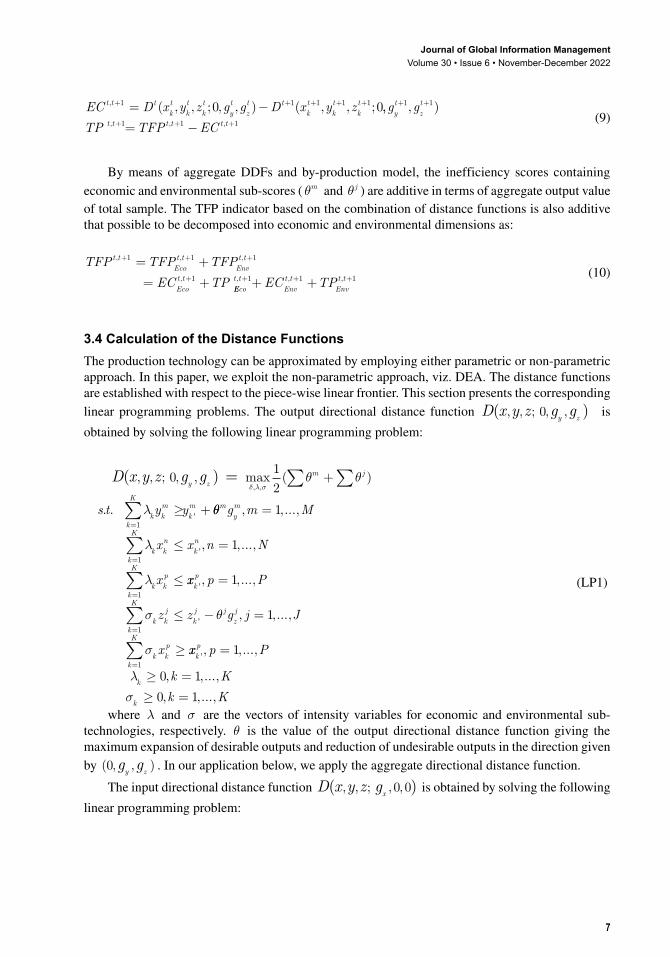
TFP EC TPt t t t t t, , ,+ + += +1 1 1 (8)
We adopt an output-oriented decomposition of TFP measure. Thus, efficiency change, EC, is the difference between technical inefficiencies over time t and t+1. As the production technology is under the assumption of constant returns to scale, the component of technological progress, TP, is the residual.
Journal of Global Information ManagementVolume 30 • Issue 6 • November-December 2022
7
EC D x y z g g D x y zt t tkt
kt
kt
yt
zt t
kt
kt
kt, ( , , ; , , ) ( , , ;+ + + + += −1 1 1 1 10 0,, , )
, , ,
g g
TP TFP ECyt
zt
t t t t t t
+ +
+ + += −
1 1
1 1 1 (9)
By means of aggregate DDFs and by-production model, the inefficiency scores containing economic and environmental sub-scores (θm and θ j ) are additive in terms of aggregate output value of total sample. The TFP indicator based on the combination of distance functions is also additive that possible to be decomposed into economic and environmental dimensions as:
TFP TFP TFP
EC TP
t tEcot t
Envt t
Ecot t
, , ,
,
+ + +
+
= +
= +
1 1 1
1 EEcot t
Envt t
Envt tEC TP, , ,+ + ++ +1 1 1 (10)
3.4 Calculation of the Distance FunctionsThe production technology can be approximated by employing either parametric or non-parametric approach. In this paper, we exploit the non-parametric approach, viz. DEA. The distance functions are established with respect to the piece-wise linear frontier. This section presents the corresponding linear programming problems. The output directional distance function D x y z g g
y z( ), , ; , ,0 is
obtained by solving the following linear programming problem:
D x y z g gy z
m j
k km
k
K
kms t y y
( ), , ; , , max ( )
. .
, ,
'
01
2
1
= ∑ ∑
∑
+
≥ +=
δ λ σθ θ
λ θθ
λ
λ
mym
kk
K
kn
kn
kk
K
kp
g m M
x x n N
x
, ,...,
, ,...,'
=
≤ =
≤
=
=
∑
∑
1
11
1
xx p P
z z g j J
x
kp
k kj
k
K
kj j
zj
k kp
'
'
, ,...,
, ,...,
=
≤ − =
≥
=∑
1
11
σ θ
σ xx p P
k K
k K
kp
k
K
k
k
', ,...,
, ,...,
, ,...,
=∑ =
≥ =
≥ =
1
1
0 1
0 1
λ
σ
(LP1)
where λ and σ are the vectors of intensity variables for economic and environmental sub-technologies, respectively. θ is the value of the output directional distance function giving the maximum expansion of desirable outputs and reduction of undesirable outputs in the direction given by ( , , )0 g g
y z. In our application below, we apply the aggregate directional distance function.
The input directional distance function D x y z gx
( ), , ; , ,0 0 is obtained by solving the following linear programming problem:

Journal of Global Information ManagementVolume 30 • Issue 6 • November-December 2022
8
D x y z gx
k km
k
K
kms t y y m M
( ), , ; , , max
. . , ,...,
, ,
'
0 0
11
=
≥ ==∑
δ λ σδ
λ
λ δ
λ δ
kk
K
kn
kn
xn
kk
K
kp
kp
xp
x x g n N
x x g p
=
=
∑
∑
≤ − =
≤ − =
1
1
1'
'
, ,...,
, 11
1
1
1
1
,...,
, ,...,
,
'
'
P
z z j J
x x p
k kj
k
K
kj
k kp
kp
k
K
σ
σ
=
=
∑
∑
≤ =
≥ = ,,...,
, ,...,
, ,...,
P
k K
k Kk
k
λ
σ
≥ =
≥ =
0 1
0 1
(LP2)
where δ is the value of the input directional distance function which measures the maximum contraction of inputs in the direction specified by ( , , )g
x0 0 .
4 DATA AND RESULTS
This article selects data from 61 countries along the Belt and Road from 2000 to 2017, covering Asia, Europe and Africa. According to the geographical location and economic scale of the sample, the 61 countries can be divided into six regions: Europe, Asia except West Asia, North Africa and West Asia, China, India, and Russia. Because China, India and Russia have relatively large land area, population and economic size in the sample countries, they are separately listed as one region. The data come from the Penn World Table 9.1 and the International Energy Agency, and further sorted and calculated by ourselves.
The data used in this paper includes three inputs and two outputs. The two clean inputs are labor force and capital stock, while the other dirty input is energy consumption. The two outputs are GDP and carbon dioxide. The latter will damage the environment and produce a greenhouse effect. In the “Vision and proposed actions outlined on jointly building Silk Road Economic Belt and 21st-Century Maritime Silk Road”, the Chinese government clearly pointed out that cooperation between countries should” promote green and low-carbon infrastructure construction and operation management and take into full account the impact of climate change on the construction”. Moreover, we should “promote ecological progress in conducting investment and trade, increase cooperation in conserving eco-environment, protecting biodiversity, and tackling climate change, and join hands to make the Silk Road an environment-friendly one”. Therefore, this paper takes the pollutant carbon dioxide as a substitute variable for bad output and integrates the effectiveness of energy conservation and emission reduction into the evaluation system of the green productivity growth of potential international cooperation countries.
Table 1 shows the average annual growth rates of input and output in the sample countries. Of the six regions, only Europe showed a decline in energy consumption, as did carbon dioxide emissions. This shows that the level of environmental protection in Europe has improved from 2000 to 2017. By contrast, China’s energy consumption and carbon dioxide emissions increased the most, followed by India’s. At the same time, it can be seen that the labor resources in Europe are decreasing, while the labor force growth in Asia and West Africa is the fastest.
Table 2 presents the trend of annual average cumulative green total factor productivity in the all sample countries and regions. On the whole, the average annual growth rate of green total factor

Journal of Global Information ManagementVolume 30 • Issue 6 • November-December 2022
9
productivity is 3.074% in the countries along the Belt and Road. Among them, the economic TFP is 4.752%, which shows that the sample countries have a faster economic development during the sample period; however, the average annual growth rate of environmental TFP is -1.678%, which shows that environmental performance has dragged down the growth of green TFP. To some extent, the economic development of the countries along the Belt and Road has come at the expense of the environment. Among the three largest economies, China (1.484%), Russia (0.776%) and India (0.671%) are the countries with the fastest total factor productivity growth, but China (-1.492%) and India (-0.395%) environmental performance has dragged down TFP. Regardless of the environmental costs, China has the fastest total factor growth rate. However, once environmental costs are included in the performance review, China’s TFP barely increases (-0.009%). On the contrary, thanks to better environmental protection, Russia’s environmental TFP growth rate was 0.329%, and the TFP growth rate reached 1.105%, making Russia overtake China as the country with the fastest green growth.
From the perspective of countries in other regions, Ukraine, Poland and the Czech Republic are the three fastest growing green countries in Europe, with 0.216%, 0.091% and 0.066% respectively; In Asia except west Asia, Indonesia (0.140%), Thailand (0.104%), and Kazakhstan (0.050%) are the top three countries for green growth; In North Africa and west Asia, Saudi Arabia (0.201%) has the fastest growth, followed by Iran (0.149%) and Egypt (0.021%).In terms of environmental TFP, except for China and India, the growth rates of Indonesia, Turkey and Vietnam are -0.082%, -0.061% and -0.038% respectively, which also significantly drag down the overall growth.
In addition, total factor productivity can be decomposed into EC (efficiency change) and TP (technological progress). Economic TP (5.401%) significantly drives overall economic growth, but environmental TP (-1.991%) drags down economic growth.
The upper left of Fig. 1 shows that from 2000 to 2017, TFP showed an overall growth trend. And it shows economic TFP has grown rapidly, while environmental TFP has shown a rapid downward trend, dragging down the overall TFP growth. The lower left of Fig. 1 shows the changing trend of regional TFP. Except for China, other countries have positive growth. Among them, Russia is the fastest growing country in TFP, and its growth rate has greatly exceeded other regions. China’s TFP has declined since 2001 and reached its lowest point in 2009. From 2009 to 2017, the decline trend of China’s TFP slowed down and leveled off in 2017.
The upper right of Fig. 1 shows that after 2009, regional economic TFP shows club convergence. In addition, China has been growing at a high speed, especially after 2009, its growth rate has increased, and it has opened a large gap with other countries. After 2008, Russia’s economic growth rate declined and gradually converged with other regions. This may be affected by the global financial crisis. The bottom right of Fig. 1 shows the change in environmental TFP growth. It can be seen that except for Russia and Europe, other regions have negative growth. In addition, China’s environmental TFP has a clear downward trend, which has also dragged down the overall growth of countries along the
Table 1. Average annual growth rates of input and output (%, 2000-2017)
Region Labor Capital Energy GDP CO2
Europe -0.244 4.759 -0.691 3.896 -1.188
Asia except West Asia 2.082 10.269 3.070 7.480 3.740
North Africa and West Asia 2.889 8.938 4.363 7.188 4.146
China 0.473 13.226 6.281 7.416 6.873
India 1.149 12.393 4.574 8.602 5.952
Russia 0.367 3.937 0.936 6.919 0.336
Total 1.097 9.958 4.026 7.194 4.575

Journal of Global Information ManagementVolume 30 • Issue 6 • November-December 2022
10
Table 2. Average annual growth rates of cumulative TFP indicator (%, 2000-2017)
No Country TFP TFPeco ECeco TPeco TFPenv ECenv TPenv
Europe 0.633 0.409 0.188 0.221 0.224 0.241 -0.017
1 Albania 0.003 0.003 0.000 0.003 0.000 0.001 0.000
2 Belarus 0.032 0.023 0.011 0.012 0.009 0.008 0.001
3 Bosnia and Herzegovina 0.001 0.002 -0.001 0.003 -0.001 0.001 -0.002
4 Bulgaria 0.009 0.006 -0.005 0.011 0.003 0.008 -0.005
5 Croatia 0.012 0.008 0.003 0.006 0.003 0.004 0.000
6 Czech Republic 0.066 0.042 0.023 0.019 0.024 0.025 -0.001
7 Estonia 0.007 0.005 0.001 0.004 0.003 0.002 0.000
8 Greece 0.034 0.012 -0.003 0.014 0.022 0.020 0.002
9 Hungary 0.031 0.020 0.003 0.017 0.011 0.012 -0.001
10 Latvia 0.006 0.005 0.001 0.004 0.001 0.001 0.000
11 Lithuania 0.007 0.006 0.002 0.004 0.001 0.002 -0.001
12 Montenegro 0.001 0.001 0.000 0.001 0.000 0.000 0.000
13 North Macedonia 0.005 0.003 0.001 0.002 0.002 0.002 0.000
14 Poland 0.091 0.057 0.010 0.046 0.035 0.050 -0.015
15 Republic of Moldova 0.006 0.005 0.002 0.003 0.002 0.001 0.000
16 Romania 0.045 0.034 0.014 0.020 0.012 0.019 -0.008
17 Serbia 0.030 0.019 0.010 0.010 0.011 0.009 0.002
18 Slovakia 0.021 0.014 0.005 0.009 0.007 0.007 -0.001
19 Slovenia 0.008 0.006 0.002 0.004 0.003 0.003 0.000
20 Ukraine 0.216 0.139 0.110 0.029 0.077 0.065 0.012
Asia except West Asia 0.562 0.762 -0.057 0.819 -0.200 0.080 -0.281
21 Bangladesh -0.005 0.021 -0.013 0.034 -0.026 -0.003 -0.023
22 Brunei Darussalam 0.001 0.001 0.000 0.002 0.000 0.001 -0.001
23 Cambodia 0.001 0.003 -0.002 0.005 -0.003 0.000 -0.002
24 Indonesia 0.140 0.222 -0.043 0.264 -0.082 0.019 -0.101
25 Kazakhstan 0.050 0.059 0.022 0.037 -0.009 0.000 -0.009
26 Kyrgyzstan 0.004 0.004 0.001 0.003 -0.001 0.000 -0.001
27 Malaysia 0.041 0.055 0.007 0.048 -0.014 0.008 -0.022
28 Mongolia 0.004 0.005 0.001 0.004 -0.001 0.000 -0.001
29 Myanmar 0.007 0.017 -0.002 0.019 -0.009 0.000 -0.009
30 Nepal 0.038 0.024 -0.001 0.026 0.013 0.000 0.013
31 Pakistan 0.037 0.059 -0.017 0.075 -0.021 0.009 -0.030
32 Philippines 0.035 0.044 -0.001 0.045 -0.009 0.005 -0.014
33 Singapore 0.025 0.026 0.005 0.021 -0.001 0.007 -0.008
34 Sri Lanka 0.006 0.012 0.000 0.012 -0.006 0.001 -0.006
35 Tajikistan 0.005 0.005 0.001 0.004 0.000 0.000 0.000
36 Thailand 0.104 0.115 0.003 0.112 -0.011 0.019 -0.031
37 Turkmenistan 0.018 0.019 0.005 0.014 -0.001 0.003 -0.004
38 Uzbekistan 0.049 0.030 0.005 0.024 0.019 0.022 -0.003
continued on next page

Journal of Global Information ManagementVolume 30 • Issue 6 • November-December 2022
11
No Country TFP TFPeco ECeco TPeco TFPenv ECenv TPenv
39 Viet Nam 0.004 0.041 -0.027 0.068 -0.038 -0.010 -0.028
North Africa and West Asia 0.507 0.650 0.032 0.618 -0.143 0.077 -0.220
40 Armenia 0.002 0.003 0.001 0.002 0.000 0.000 -0.001
41 Azerbaijan 0.017 0.016 0.007 0.009 0.002 0.004 -0.003
42 Bahrain 0.008 0.009 0.001 0.008 -0.001 0.001 -0.002
43 Cyprus 0.003 0.002 0.000 0.001 0.001 0.001 0.000
44 Egypt 0.021 0.051 -0.001 0.052 -0.030 0.006 -0.036
45 Georgia 0.004 0.005 0.002 0.003 -0.001 0.000 -0.001
46 Iran 0.149 0.148 0.016 0.132 0.000 0.028 -0.028
47 Iraq 0.012 0.032 0.002 0.031 -0.020 0.002 -0.022
48 Israel 0.014 0.010 -0.001 0.011 0.004 0.009 -0.004
49 Jordan 0.006 0.008 0.002 0.006 -0.002 0.001 -0.003
50 Kuwait 0.006 0.013 0.001 0.012 -0.007 0.003 -0.009
51 Lebanon 0.006 0.008 0.001 0.007 -0.002 0.001 -0.002
52 Oman 0.000 0.010 -0.006 0.017 -0.010 -0.002 -0.008
53 Qatar 0.008 0.023 -0.002 0.025 -0.015 -0.003 -0.012
54 Saudi Arabia 0.201 0.191 0.011 0.180 0.011 0.000 0.010
55 Syrian Arab Republic 0.020 0.015 0.000 0.015 0.006 0.009 -0.003
56 Turkey 0.009 0.070 0.000 0.070 -0.061 0.013 -0.074
57 United Arab Emirates 0.014 0.031 0.000 0.031 -0.017 0.000 -0.018
58 Yemen 0.004 0.005 0.000 0.006 -0.001 0.003 -0.003
59 China -0.009 1.484 -0.945 2.429 -1.492 -0.303 -1.189
60 India 0.276 0.671 -0.247 0.917 -0.395 -0.028 -0.367
61 Russia 1.105 0.776 0.379 0.397 0.329 0.246 0.083
Total 3.074 4.752 -0.649 5.401 -1.678 0.313 -1.991
Table 2. Continued

Journal of Global Information ManagementVolume 30 • Issue 6 • November-December 2022
12
Belt and Road. To a certain extent, this shows that China’s economic TFP growth is at the expense of environmental TFP.
5. CoNCLUSIoNS AND DISCUSSIoNS
This paper analyzes the growth of green TFP in 61 countries along the Belt and Road, using the by-production model and LHM TFP indicators. Compared with the existing literature, the biggest innovation of this paper is to rely on aggregate directional distance function., and all countries use a uniform direction vector as a measurement standard. Thus, TFP growth can be broken down into the contribution of each region and each country. Then it can continue to be decomposed into efficiency change and technological progress. This new decomposition method which is more detailed than other decomposition methods can trace the contribution of each country and region to total TFP growth.
The empirical analysis of this article has the following three results: First, in the countries along the Belt and Road, all countries have positive economic TFP growth, but some countries have negative environmental TFP growth, concentrated in Asia and Africa, especially China and India. Second, economic technological progress in the sample countries significantly contributed to TFP growth, but environmental TP dragged down the growth. Third, the disparity of economic and environmental performance can be observed among countries. Among them, Russia has benefited from the positive growth of environmental TFP. Therefore, among the sample countries, Russia is the country with the fastest green growth.
Based on the above main conclusions, we give the following suggestions: First, although the sample countries have rapid economic growth, some countries have poor environmental performance. These countries should pay attention to environmental improvement and improve environmental TFP through energy conservation and emission reduction. Second, countries can introduce high-tech energy-saving technologies from developed countries through international cooperation and exchanges to promote the growth of TFP. Third, the economies and environments of the countries along the Belt and Road are quite different. They should be more united and formulate cooperation policies to achieve the goal of common progress.
Figure 1. Cumulative TFP indicator and its decomposition (2000-2017)

Journal of Global Information ManagementVolume 30 • Issue 6 • November-December 2022
13
The shortcomings and improvement of this paper are as follows: first, due to the lack of data, there are only 61 samples instead of covering all the Belt and Road countries. Second, in terms of methods, if the parameter estimation method is used in future studies, the influence of extreme values on the estimation results can be reduced.

Journal of Global Information ManagementVolume 30 • Issue 6 • November-December 2022
14
REFERENCES
Barro, J., & Sala-I, X. (1995). Martin. McGraw.
Baumol, W. (1986). Productivity, growth, convergence and welfare: What the long-run data show. The American Economic Review, 76(5), 1872–1885.
Caves, D. W., Christensen, L. R., & Diewert, W. E. (1982). The economic theory of index numbers and the measurement of input, output, and productivity. Econometrica, 50(6), 1392–1414. doi:10.2307/1913388
Chambers, R. G., Chung, Y., & Färe, R. (1996). Benefit and distance functions. Journal of Economic Theory, 70(2), 407–419. doi:10.1006/jeth.1996.0096
Chen, C., Lan, Q., Gao, M., & Sun, Y. (2018). Green total factor productivity growth and its determinants in China’s industrial economy. Sustainability, 10(4), 1052. doi:10.3390/su10041052
Chung, Y. H., Fare, R., & Grosskopf, S. (1997). Productivity and undesirable outputs: A directional distance function approach. Journal of Environmental Management, 51(3), 229–240. doi:10.1006/jema.1997.0146
Cui, Y., & Yu, J. P. (2017). China’s foreign direct investment on “The Belt and Road” countries infrastructure. Forum of World Economics & Politics, 2017(05), 135–152.
Cullmann, A., Ehmcke, J. S., & Zloczysti, P. (2009). Innovation, R&D efficiency and the impact of the regulatory environment: a two stage semi-parametric DEA approach. DIW.
Fare, R., Grosskopf, S., & Knox Lovell, C. A. (1994). Production frontiers. Cambridge University Press.
Fare, R., Grosskopf, S., & Pasurka, C. (2016). Technical change and pollution abatement costs. European Journal of Operational Research, 248(2), 715–724. doi:10.1016/j.ejor.2015.07.040
Fare, R., Grosskopf, S., & Pasurka, C. A. Jr. (2001). Accounting for air pollution emissions in measures of state manufacturing productivity growth. Journal of Regional Science, 41(3), 381–409. doi:10.1111/0022-4146.00223
Han, L. B., Han, B., Shi, B., & Su, X. (2013). Energy efficiency convergence across countries in the context of China’s Belt and Road initiative. Applied Energy, 112–122.
Hu, C. P. (2020). Labor productivity growth and factor decomposition along “the Belt and Road” countries:2000-2017”—Based on the comparisons of 53 countries. China Academic Journal Electronic Punishing House, (3), 71–84.
Huang, J.-Y., & Ma, C. (2018). Energy efficiency convergence in China. Lock-In and Regulatory Uniformity, 70(1), 107–130.
Li, X. Y., Zhao, H. L., & Lin, T. L. (2018). The green innovation efficiency of Chinese industry. Journal of Capital University of Economics and Business, 20(3), 41–49.
Lichtenberg, F. R. (1994). Testing the convergence hypothesis. The Review of Economics and Statistics, 76(3), 576–579. doi:10.2307/2109982
Liu, Z. M., & Yin, K. (2019). Green total factor efficiency growth in countries along the Belt and Road: Based on club convergence. Journal of Environmental Economics, 4(03), 48–72.
Mariam, S., Juana, C., Andres, J. P. T., & Cecilio, T. (2013). Eco-efficiency and the convergence hypothesis. Environmental and Resource Economics, 55(1), 87–106. doi:10.1007/s10640-012-9616-9
Miller, S., & Upadhyay, M. (2002). Total factor productivity and the convergence hypothesis. Journal of Macroeconomics, 24(2), 267–286. doi:10.1016/S0164-0704(02)00022-8
Mulder, P., & de Groot, H. L. F. (2012). Structural change and convergence of energy intensity across OECD countries. Energy Economics, 36(4), 1910–1921. doi:10.1016/j.eneco.2012.07.023
Murty, S. (2012). On the theory of by-production of emissions. Economics Department, University of Exeter Business School.
O’Donnell, C. J. (2012). An aggregate quantity framework for measuring and decomposing productivity change. Journal of Productivity Analysis, 38(3), 255–272. doi:10.1007/s11123-012-0275-1
Journal of Global Information ManagementVolume 30 • Issue 6 • November-December 2022
15
Zhiyang Shen is the corresponding author, email: [email protected]; [email protected].
Oh, D. H. (2010). A global Malmquist-Luenberger Productivity Index. Journal of Productivity Analysis, 34(3), 183–197. doi:10.1007/s11123-010-0178-y
Philip, K. A., Kwaku, A., Kennedy, A., & Christopher, Q. (2018). Estimate of transient and persistent energy efficiency in Africa: A stochastic frontier approach. Energy Conversion and Management, 166, 556–568. doi:10.1016/j.enconman.2018.04.038
Philip, P., & Sul, D. (2007). Transition modeling and econometric convergence tests. Econometrica, 75(6), 1771–1855. doi:10.1111/j.1468-0262.2007.00811.x
Quah, D. (1993). Galton’s fallacy and tests of the convergence hypothesis. The Scandinavian Journal of Economics, 95(4), 427–443. doi:10.2307/3440905
Ray, S. C., Mukherjee, K., & Venkatesh, A. (2018). Nonparametric measures of efficiency in the presence of undesirable outputs: A by-production approach. Empirical Economics, 54(1), 31–65. doi:10.1007/s00181-017-1234-5
Sineviciene, L., Sotnyk, I., & Kubatko, O. (2017). Determinants of energy efficiency and energy consumption of Eastern Europe post-communist economics. Energy & Environment, 28(8), 870–884. doi:10.1177/0958305X17734386
Stern, D. I. (2012). Modeling international trades in energy efficiency. Energy Economics, 36(4), 2200–2208. doi:10.1016/j.eneco.2012.03.009
Yang, C. C., Hsiao, C. K., & Yu, M. M. (2008). Technical efficiency and impact of environmental regulations in farrow-to-finish swine production in Taiwai. Agricultural Economics, 39(1), 51–61. doi:10.1111/j.1574-0862.2008.00314.x
Yuan, X., Wu, L. H., & Zhang, P. (2020). Research on measurement and convergence of green total factor productivity in Chinese Patent-Intensive industries. Science & Technology Progress and Policy, 2020(7), 76-85.
Zhou, P., Zhou, X., & Fan, L. W. (2014). On estimating shadow prices of undesirable outputs with efficiency models: A literature review. Applied Energy, 130, 799–806. doi:10.1016/j.apenergy.2014.02.049