sustainable energy vision bulgaria note 2010
TRANSCRIPT

A vision for Bulgaria based on INFORSE's Sustainable Energy Vision, -Background note,
21/11-08, update 14/12 2010
This background note gives an overview of the potentials for renewable energy and energy efficiency that is used in the sustainable energy vision developed by International Network for Sustainable Energy (INFORSE) – Europe and ZaZemiata. The vision includes growth in most sectors. The energy unit used is PJ (Petajoule = 1000 TJ – Terrajoule = 0.278 TWh)All comments are welcome.
Table of Contents1. General Information on Bulgaria.................................................................................................3
1.1 Population data..........................................................................................................................31.2 Natura 2000 Nature Protection areas.........................................................................................3
2 Renewable Energy...........................................................................................................................42.1 Official Renewable Energy Potentials ......................................................................................42.2 Windpower:...............................................................................................................................42.3 Solar Energy..............................................................................................................................52.4 Biomass....................................................................................................................................10
2.4.1 Solid Biomass..................................................................................................................102.4.2 Liquid Bio-fuel.................................................................................................................142.4.3 Biogas...............................................................................................................................152.4.4 Energy Crops....................................................................................................................15
2.5 Geothermal energy...................................................................................................................162.6 Hydropower.............................................................................................................................18
3. Energy Efficiency Potentials........................................................................................................203.1 Factor 4 Increase in Energy Efficiency....................................................................................203.2 Efficiency of heating................................................................................................................213.3 Efficiency in Energy Supply....................................................................................................22
4. Demand for energy services.........................................................................................................254.1 Heat and Fuel Use....................................................................................................................254.2 Electricity Use..........................................................................................................................264.3 Transport..................................................................................................................................27
5. Fuel shift etc..................................................................................................................................295.1 Fossil fuels...............................................................................................................................29
6. Energy Storages............................................................................................................................30About this note .................................................................................................................................30
The main updates in 2010 are: - new statistical data until 2008 have been included as basis - power demand forecasts from Bulgarian Academy of Science have been included. This has lead to two scenarios: one with Bulgarian Academy of Science forecasts for 2010 only and one with these forecasts until 2030. The Bulgarian Academy of Science forecasts include less energy effiicency than the INFORSE scenario and no transition to electric transport.
1

2

1. General Information on Bulgaria
1.1 Population data
World Bank data
Population, total (millions):1990: 8,71995: 8,42000: 8,12006: 7,7
Life expectancy at birth, total (years): 73 (in 2006)Fertility rate, total (births per woman):1,4 (in 2006)Child mortality rate, infant (per 1,000 live births): 12 (in 2006)Mortality rate, under-5 (per 1,000): 14 (in 2006)Employment to population ratio, 15+, total (%): 41 (in 2006)
1.2 Natura 2000 Nature Protection areas
Natura 2000- map: Green areas are existing NATURA2000 areas, grey areas are under consideration as additional NATURA2000 areas. http://www.natura2000bg.org/natura/bg/documents/SPA_novemvri_2007_BG_ptici.pdfSource: Ministry of Environment and Waters, Bulgaria
3

2 Renewable Energy
2.1 Official Renewable Energy Potentials
Accessible potential- renewable energy sources, BulgariaRES Accessible potential
- - ktoe
Hydro power 26 540 GWh 2 282Biomass 113 000 TJ 2 700Solar energy 4 535 GWh 390Wind energy 3 283 GWh 283Geothermal energy 14 667 TJ 350TOTAL - - 6 005Source: Ministry of Economy and Energy, Bulgaria
Bulgaria has a target of 16% renewable energy by 2020, equal to almost 70 PJ. In Bulgarias Renewable Energy Action Plan, the plan to fulfill the target, the renewable energy use by 2020 is expected to be:
Heat, electricity, transport combined ktoe PJWood from forests etc. 892 37,3Crops for energy 130 5,4Agri by-products for energy, use of 50% of unused straw 39 1,6Liquid biofuels 200 8,4Industrial waste 80 3,3Sewage sludge 4 0,2Solar heating 21 0,9Geothermal heating 9 0,4PV 39 1,6Windpower 194 8,1Hydro 340 14,2Total 1948 81,6Excess 290 12,1The tabel is compiled from NATIONAL RENEWABLE ENERGY ACTION PLAN, Prepared by the Ministry of Economy, Energy and Tourism of Bulgaria and others, June 30, 2010, tables 4a, 8a,11b, 12, 13. Values in table 8a (biomass supply) are used for biomass for electricity, heating, and cooling. Variations are less than 1% of total.
4

If this expected development is met, Bulgariaa will have fulfilled its renewable energy obligation to the EU renewable energy directive of 16% renewable energy by and have an excess of 12 PJ.
Of this the expected renewable electricity by 2020 is:
Renewable electricity GWh PJPV 454 1,6Windpower 2260 8,1Hydro-power 3951 14,2Biogas power 357 1,3Power from solid biomass 514 1,9Total 7536 27,1
In the scenario and vision we do not use the official plans, but we compare our estimates with them.
2.2 Windpower:
Officially there are good pontentials for windpower in some limited mountain ranges and in the Bulgarian coast north of Varna (average wind speed above 5 m/s 10 m above ground). Areas with average windspeed 4-5 m/s cover larger areas of the Black Sea coast.
Some of these areas are Natura2000 bird protection areas, but not all. Some areas, also outside the Natura2000 areas, are bird migration routes. Still there is substantial areas with good wind conditions for windpower outside these nature protections interests.
One estimate of windpower potential is that the economic potential is 14.752 PJ, equal to 4.1 TWh or about 16.8% of the Bulgarian electricity supply.With an estimated average number of equivalent full-load hours of 2000, this will require the installation of 2050 MW of windpower.Source: National energy saving study of Bulgaria. SAVE II project. Study on the possibility for theimplementation of a widespread energy saving programme in Bulgaria. Vienna: E.V.A. SEEA,E.V.A. and I.C.E. 2001.
In addition to above-mentioned potentials, it is possible to make off-shore windpower park in the Black Sea.
In the current version of the vision is used a windpower potential of 2050 MW with 2000 full load hours on land, following the National Energy Saving Study of Bulgaria (2001). This gives an annual windpower production of 4 TWh (3000 GWh). After 2030 is included the opportunity to have an additional 1000 MW off-shore.
By the end of 2007 there was 70 MW of installed windpower capacity and of this 34 MW were installed during the year of 2007, according to European Wind Energy Association (EWEA).There is interest from a number of investors to continue the development and the expectation for thecoming years are that there will be installed at least as much as in 2007. For this vision is expected that there will be installed 50 MW/year until 2010 and that installation then will increase to 150
5

MW/year until the potential of 2050 MW is reached in 2022. Then is proposed to expand further e.g. using the off-shore capacities.
Thus, the total installed capacity is expected to be: 220 MW in 2010 1700 MW in 2020 3000 MW in 2030 and later, using above potential + offshore developmentThe capacity factor is expected to be 2000 full-load hours.
The offical renewable energy action plan includes 2260 GWh of windpower by 2020 and a capacityfactor of 1500 - 1800 full-load hours, equal to about 1400 MW windpower.
Source: Ministry of Economy and Energy, Bulgaria
2.3 Solar Energy
The energy in solar radiation in Bulgaria is around 1450 kWh/m2 on a horizontal surface, ranging from 4 to 4,25 kWh/m2 /day (from 1450 to 1500 kWh/m2 /year) for different locations.
6

The mid-term economical potentials for solar hot nergy use have been estimated to:
- Solar hot water systems: total heat capacity in MW: 202.72. (about 300,000 m2 of solar collectors, producing about 180 GWh/year)
Solar photovoltaic power systems : Total power capacity in MW: 12.43. (about 125,000 m2 of PV panels producing about 20 GWh/year)
Source: “National Project/Programme on Renewable Energy Sources (NPPRES) in Republic of Bulgaria 2004 – 2014”. Energy Efficiency Agency. MEER
Another estimatien to the economic potential of Economical potential of solar power is 34 PJ equal to 63 mill. m2 of solar PV cells.
Source: National energy saving study of Bulgaria. SAVE II project. Study on the possibility for theimplementation of a widespread energy saving programme in Bulgaria. Vienna: E.V.A. SEEA,E.V.A. and I.C.E. 2001.Source: Ministry of Economy and energy of Bulgaria, 2004
The fraction of the energy demands that can be covered by solar energy depends on the variations inthe solar radiation over the year. The below graph shows this variation. The graph shows monthly variation of the energy in the solar radiation for Sofia, where the total annual solar energy input is a bit below the Bulgarian average..Scale: kWh/m2 on horizontal surfaceSource: Ministry of Economy and Energy, Bulgaria
7

Solar radiation on South slopes 0 – 90' in Sofia. Bulgarian Meteorological Institute, http://www.meteo.bg/projects/projects/solarrad_bg/tsr.html
The area used for solar energy is divided between: Solar collectors for hot water (directly used domestically for service sector, industrial heat
demand or eventually district heating) with an annual yield of 600 kWh/year (about 40% efficiency) and
Solar electric cells (PV-cells) with an annual yield of 150 kWh/year (about 10% efficiency).
Because of the seasonal variations in solar radiation, solar energy cannot cover the entire heat demand, except for a few applications in e.g tourist facilities that are not used during the winter. In the most sunny parts of Bulgaria, solar heating can cover most of the heat consumption, while the following estimation of coverage is based on above-given weather data for Sofia.
For consumption with a constant demand over the year, such as production of hot water, solar heating can cover a large fraction, while for uses with highest demand in the winter, in particular space heating, solar heating can only cover a smaller fraction.
In Bulgaria there is increasing demand for summer cooling (air conditioning), and there are good prospects for systems that can deliver heat in the winter and cooling in the summer. Such systems, driven by solar energy, do exist in Europe; but are not commercialised at prices that can compete in Bulgaria. We have therefore not included them. Instead we have included solar heating for space-heating with the expectation that they in the future also will deliver energy for summer cooling, but without including energy output for cooling in the calculations.
For energy uses with constant demand over the year, the fraction that can be covered with solar energy can be calculated with help of the following table:
Solar Radiation (kWh/month*m2)
Fraction of constant demand covered by solar
jan 75 42%
feb 100 56%
mar 135 75%
8

apr 145 81%
may 155 86%
jun 155 86%
jul 180 100%
aug 180 100%
sep 165 92%
oct 125 69%
nov 95 53%
dec 70 39%
Average
132 73%
Table: Monthly coverage of constant heat demand with solar heating system that can cover 100% ofsummer demand and thereby fully use the solar heating production, panels facing south 40' angle from horizontal, location: Sofia. The system must have heat storage to cover demand in the occasional dark days in the summer, heat storage for at least storage 24 hours.
Solar heating systems to cover space heating cannot be used fully as they will produce heat that cannot be used outside the heating season. In below table is shown the fraction the solar heating system can cover, if it has a capacity to cover respectively 100% and 50% of the January heat load with the solar insulation in July. In January the solar radiation is only 42% of the solar radiation in July, so they will only cover 42% respectively 21% of the heat demand in January.
Solar Radiation(kWh/month*m2)
Fraction of constant demand covered by solar
Outdoor temp.
Heat demandHeat from 100%system
Heat from 50% system
jan 75 42% -1,5 1 42% 21%
feb 100 56% 1 0,86 56% 28%
mar 135 75% 5 0,65 65% 38%
apr 145 81% 10 0,38 38% 38%
may 155 86% 14,5 0,14 14% 14%
jun 155 86% 18 0 - -
jul 180 100% 20 0 - -
aug 180 100% 20 0 - -
sep 165 92% 17 0 - -
oct 125 69% 11,5 0,3 30% 30%
nov 95 53% 5,5 0,62 53% 26%
dec 70 39% 0,5 0,89 39% 19%
Average 132 73% 10,1 - 69,00% 44,00%Table: Fraction of heating that can be covered by solar heating with systems that can produce the equivalent of 100% and 50% of the January heat demand in July. Assumptions: no limit of storage within each month, collector facing south, 40' slope, location: Sofia.
9

The above “100%” system can cover 69% of annual heat demand under the assumption that all heatproduced each month can be used (no limit of storage within each month). The system will only use38% of the heating that it produces1. Because of limits of storage the actual fraction covered is reduced with 20% to 55% and the annual energy used to 30% = 180 kWh/m2 solar collector (30% of 600 kWh/m2).The reduction is necessary to take into account days without sunshine, that are also often those with most need of heating.
The above “50%” system can cover 44% of heat demand under the assumption that all heat produced each month can be used (no limit of storage). The system will only use 49% of the heatingthat it produces2. Because of limits of storage the actual fraction covered is reduced with 20% to 36% and the annual energy used to 40% = 240 kWh/m2 solar collector (40% of 600 kWh/m2).
The use of solar heating with full use of the heating produced is limited to:- 73% of hot water demand for domestic and service sector buildings. Hot water demand is assumedto be 25% of heat demand of dwelling and 15% of service sector'. This is a high fraction for current existing buildings, but with the decreasing space demand that is foreseen with increasing energy efficiency, it is assumed to be a good average over the period. In this way solar heating with full useof heat produced can cover 18% of heat and fuel demands in dwellings and 11% in service sector buildings.
-for chemical industry is expected that 50% of fuel and heat demand are of low enough temperature to be covered with solar heating. Because of the seasonal variation of the solar energy, 36% of fuel and heat demand can then be covered with solar
-for paper, pulp and wood is expected that 80% of fuel and heat demand are of low enough temperature to be covered with solar heating. Then 58% can be covered with solar heating
-for other industries is expected that 50% of fuel and heat demand are of low enough temperature tobe covered with solar heating. Because of the seasonal variation of the solar energy, 36% of fuel and heat demand can then be covered with solar
In addition solar heating can be used for space heating without full use of the solar heat produced. This is expected from 2030 with possible additional use for cooling and generally higher energy prices. With the above-mentioned “50% system”, 36% of space heating of dwellings and office space can be covered with solar, increasing the max solar heat fraction of total heat and fuel demandto respectively 45% and 42%.
The solar heating installations can be used for low to medium temperature heat demand (below 150'C) and district heating. Normal flat-plate solar collectors will be limited to supply heat below 90’C, while higher temperatures can be achieved with use of vacuum tube solar collectors.
1Fraction of heat covered is calculated by adding monthly production and dividing it with total heat demand. Heat production used is calculated as average fraction divided of average fraction for solar collector with constant load.2Fraction of heat covered is calculated by adding monthly production and dividing it with total heat demand. Heat production used is calculated as average fraction divided of average fraction for solar collector with constant load.
10

The area of living floorspace in Bulgaria is about 250 mill. M2 = 250 km2 of which 40% are in highbuildings (blocks). With the assumption that the higher buldings are in average 6 floors and the others in average 2 floors, there are 108 km2 of roof area on residential buildings. It is assumed that half of this area can be used for solar energy collection: roofs facing south +/- 45'C and flat roofs. That gives and an area of 54 km2 that could be used to harness solar energy. To that should beadded roof areas on service sector buildings. It is therefore expected that a total area of 75 km2 of solar heating and solar electricity (PV) panels can be installed on roofs in Bulgaria.
For this vision is expected that 26 PJ is covered with solar heating. This is divided in 15 PJ that covering constant heat loads with 7 mill. m2 of solar collectors and 11 PJ that is covering space heating with 13 mill. m2. The total area of solar heating will then be 20 km2.
The development of solar energy installations today is limited This is expected to continue until 2010; and the development of solar heating is then expected to increase and then follow a path like:-2010 – 2020: 100,000 m2/year for constant heat loads (total 1,000,000 m2 installed in 2020)-2020 – 2030: 400,000 m2/year for constant heat loads (total 5,000,000 m2 installed in 2030)-after 2030: 1,000,000 m2/year including remaining 2 mill. m2 for constant heat load and 11 mill. m2 for space heating until above-mentioned taget is reached
The potential for PV is then the 75 mill. M2 of available roofs minus 20 mill.m2 used for solar heating equal to 55 mill. M2.The installed area for solar electric generation (PV) is only expected to take off from 2020 with installation of 100,000 m2/year. After 2030 it is expected to expand stronger than solar thermal, leading to most of the potential area used in 2050 (49 mill. m2 of 55 mill. m2.
With this development, there will be 10 m2/person for solar energy use in 2050 in total, primarily on roofs. This area is of course not a maximum and it leaves room for additional solar installations after 2050.
2.4 Biomass
2.4.1 Solid Biomass
The potential for solid biomass consists of wood and straw available for energy purposes. In addition there are potentials for bio-fuel for transportation, biogas and energy plantations; they are all treated separately below.Municipal waste is hardly used for energy in Bulgaria, while there is some use of industrial waste and today the biomass used is in practice wood, mainly firewood. There has been a steady increase in the use of biomass and waste for energy, as the table below shows:
Wood is already used to a large extent today, mainly for domestic heating. From use of 23 PJ (6.4 TWh, IEA statistics) in 2000 it has increased to 31 PJ in 2005 (8.7 TWh, IEA Statistics) and to 32 PJ in 2008, including industrial waste(IEA Statistics). The potential is 46 PJ according to official estimates of. The trend from 2005 to 2010 is expected to continue till 2010, where the use then will be 39 PJ. Then is expected that of the potential 100% is used in 2020.
11

year 19941995199619971998199920002001200220032004 2005Biomass & Wastes
Bulgaria 171 219 250 251 412 406 550 547 643 691 737 743Source: Eurostat
Graph: Biomass- instaled capacity, MW, 2006
Source: EBRD, Bulgaria- Country profile, 2006г.
There are 4.1 mill. Ha of forests in Bulgaria.
In 2006 the fellings were 7.2 mill. M3 of which 6 mill. M3 was used including 3.4 mill. M3 for firewood. Fellings have increased 36% since 2002.
Forest statistics 2006
Fellings, mill.m3
Firewood mill. M3
Other use, mill. m3
For energy, mill. M3
Energy content(MWh/m3)
Energy potential(PJ)
Conicerous 2,78 0,48 1,65 1,22 2,5 11,0
Leafy 4,44 2,93 0,93 3,45 3,4 42,3
Total 53,2Energy potential estimation based on forest statistics 2006. It is included that half of the currently unused fellings are sued for for energy and that 25% of “other use” is used for energy as cuttings etc. from timber production.
Agricultural residues that can be used for energy is mainly straw from barley and wheat, but also includes prunings from fruit trees, straw from maize and others. A part of this is burned on the fields today, and to change this practice to collection is likely to have environmental benefits.
Cereal Straw, 2006 Grain(mill. Tons) Straw(mill. Tons)50% for energy(mill. Tons)
Energy(PJ)
Wheat 3,3 4,29 2,15 31,7
Barley 0,55 0,44 0,22 3,2
Total 34,9
12
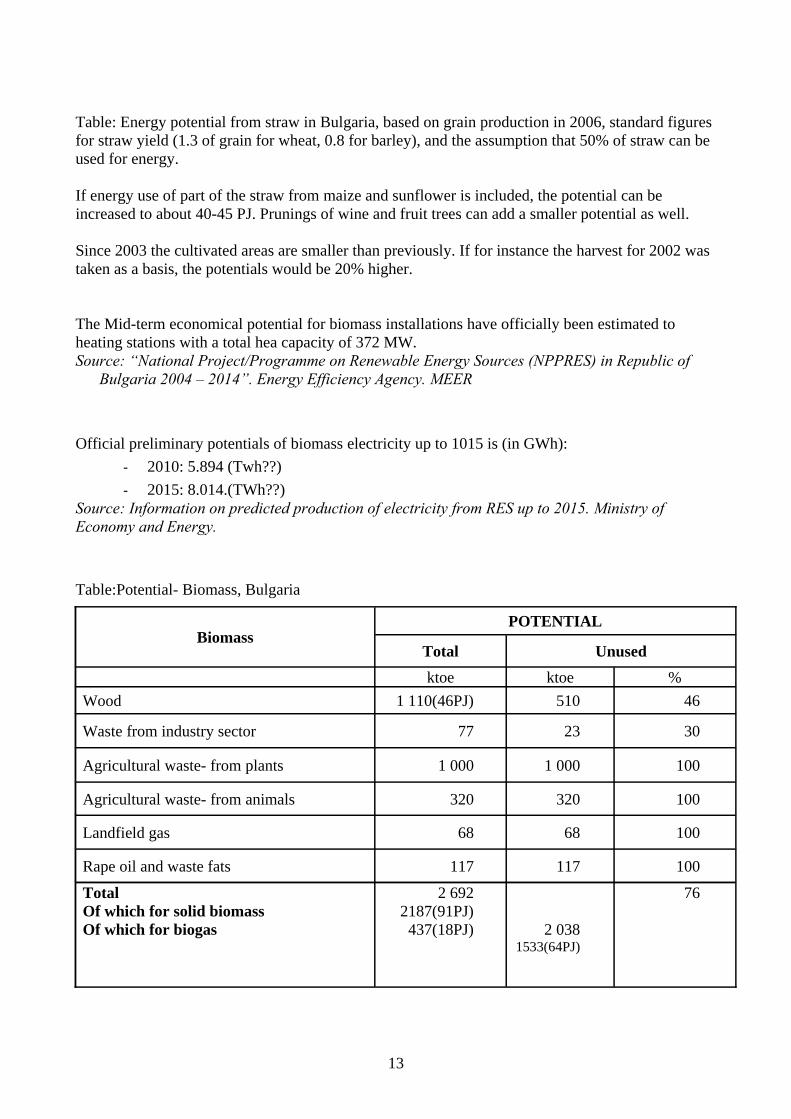
Table: Energy potential from straw in Bulgaria, based on grain production in 2006, standard figures for straw yield (1.3 of grain for wheat, 0.8 for barley), and the assumption that 50% of straw can be used for energy.
If energy use of part of the straw from maize and sunflower is included, the potential can be increased to about 40-45 PJ. Prunings of wine and fruit trees can add a smaller potential as well.
Since 2003 the cultivated areas are smaller than previously. If for instance the harvest for 2002 was taken as a basis, the potentials would be 20% higher.
The Mid-term economical potential for biomass installations have officially been estimated to heating stations with a total hea capacity of 372 MW.Source: “National Project/Programme on Renewable Energy Sources (NPPRES) in Republic of
Bulgaria 2004 – 2014”. Energy Efficiency Agency. MEER
Official preliminary potentials of biomass electricity up to 1015 is (in GWh):
- 2010: 5.894 (Twh??)
- 2015: 8.014.(TWh??)Source: Information on predicted production of electricity from RES up to 2015. Ministry of Economy and Energy.
Table:Potential- Biomass, Bulgaria
BiomassPOTENTIAL
Total Unused
ktoe ktoe %
Wood 1 110(46PJ) 510 46
Waste from industry sector 77 23 30
Agricultural waste- from plants 1 000 1 000 100
Agricultural waste- from animals 320 320 100
Landfield gas 68 68 100
Rape oil and waste fats 117 117 100
TotalOf which for solid biomassOf which for biogas
2 6922187(91PJ)437(18PJ) 2 038
1533(64PJ)
76
13

Source: Ministry of Economy and Energy, 2002
Theoretical potential- biomass, by region:
Region Agriculturalandbiologicalwaste
Industrialand woodwaste
Urbansolidwaste
Woodforheating
Naturalfilaments
Agricultural liquidwaste
Paper Total,for theregion
TJ/y TJ/y TJ/y TJ/y TJ/y TJ/y TJ/y TJ/y
Northwest,Vidin
4310 6.7 666.4 633.7 1.6 919.3 0.6 6537.9
North-central,Ruse
17710 190.5 3202 1190 42.2 2462 69.5 24865.7
Northeast,Varna
25513 64 1493 1785 2.3 2551 2.7 31410.25
Southeast,Bourgas
10819 26.2 781.2 1328 1413 9 14376.6
South-central,Plovdiv
15138 113.6 3679 2146 12.1 2768 189.5 24046.5
Southwest,Sofia
3630 32.8 2776 1326 21.6 1268 26.4 9080.1
TOTAL: 77118 433.8 12598 8408 79.8 11382 297.7 110317.1
Source: Ministry of Economy and Energy, Bulgaria
14

Energy potential- biomass, by region:
Region Total for the region Total for the region
TJ/y GWh/y
Northwest, Vidin 6537.9 1816.229
North-central, Ruse 24865.7 6907.691
Northeast, Varna 31410.25 8725.767
Southeast, Bourgas 14376.6 3993.819
South-central, Plovdiv 24046.5 6680.118
Southwest, Sofia 9080.1 2522.452
TOTAL: 110317.1 30646.08
Source: Ministry of Economy and Energy, Bulgaria
There is a potential for straw and other agricultural residues for energy use in Bulgaria, even thoughthis source is not used today. The total energy production from this is is 42 PJ (1 Mtoe) according toabove official estimate. That is taken as a technical potential for energy use of straw. Straw is hardly used today for energy today in Bulgaria. This is not expected to change before 2010;while the full potential of 42 PJ is expected to be used in 2020 in this vision.
With this, the total solid biomass potential is 88 PJ combining the 46 PJ of wood, 42 PJ of straw and other agricultural residues.
2.4.2 Liquid Bio-fuel
There is a potential for production of liquid biofuels. Biofuel production has started and the area for oil plants other than sunflower (mainly rape-seed) increased strongly from 2005 to 2006 to cover 22,000 ha (from 13,000 ha in 2005), but the level is still low.
15

Use of liquid biofuel is not included in this vision because of its low level and potential adverse effects. It would be possible to use some of the land proposed for energy plantations for oil plants, but the environmental impacts would have to be assessed, as oil plants usually needs more fertilizer and pesticides than energy plantations for solid biomass.
2.4.3 Biogas
Official mid-term economical potential: Biogas and natural gas installations:
- Envisaged investment costs in Million, USD: 251.96;
- Total power capacity in MW: 244.26
- Total heat capacity in MW: 125.98 .Source: “National Project/Programme on Renewable Energy Sources (NPPRES) in Republic of
Bulgaria 2004 – 2014”. Energy Efficiency Agency. MEER
Preliminary potentials- biogas (in GWh):
- 2010: 57.84;
- 2015: 1,764 (6PJ).Source: Information on predicted production of electricity from RES up to 2015. Ministry of Economy and Energy.
For the potential for biogas (from waste water, agriculture etc.) is used the above official figure of 13 PJ (0.32 Mtoe) from animal (farm) manure and 3 PJ from landfill gas, in total 16 PJ. The officialwaste fat and rape-seed oil potential of 5 PJ (0.117 Mtoe) is added to the biogas potential. The use of the waste fat in biogas plants can improve the process compared with “pure” animal manure. The total potential is then 21 PJ of which 20% (4 PJ) is estimated to be used for own consumption in biogas plants leaving 17 PJ for energy use.
When waste incineration is not used, as in Bulgaria, the organic fraction of waste should preferably be treated separately to avoid methane generation in landfills. This separated waste can give an additional biogas potential, but is not included in the current estimation.
In this vision the biogas is expected to be used for CHP plants, and to a smaller extent for traction inagriculture and construction.We expect a large-scale development to start after 2010 and that the the potential for biogas is fully utilised by 2030.
2.4.4 Energy Crops
The potential for energy crops is dependant of the excess land of agriculture. According to statistics there were 0.43 mill. Ha of fallow land plus 0,519 milll. Ha of unused agricultural land in 2006. It isestimated that at least half of this land can be used for energy purposes, equal to 4.2 mill ha (4200 km2).
We expect the development of energy plantation is starting in 2020 and that 35% of the potential (1500 km2) is used by 2030 and later. The plantations are expected to be native European tree
16

species that can have a yield of up to 15 t of dry matter per ha. In this estimation is used an average figure of 9 t/ha.
2.5 Geothermal energy
Economical potential- geothermal energy:
- Value, TJ/year: 9,261;
- Share, %: 10.6.Source: National energy saving study of Bulgaria. SAVE II project. Study on the possibility for the
implementation of a widespread energy saving programme in Bulgaria. Vienna: E.V.A. SEEA,
E.V.A. and I.C.E. 2001.
Mid-term economical potential- geothermal energy:
- Envisaged investment costs in Million, USD: 393.22;
- Total heat capacity in MW: 786.44 (equal to 14 PJ of energy with 5000 hours/year of utilisation).
Source: “National Project/Programme on Renewable Energy Sources (NPPRES) in Republic of Bulgaria 2004 – 2014”. Energy Efficiency Agency. MEER
Preliminary potentials- geothermal energy (in GWh):
- 2010: 408;(1.5 PJ)
- 2015: 3,145.(11 PJ)Source: Information on predicted production of electricity from RES up to 2015. Ministry of Economy and Energy.
Theoretical potential- geothermal energy, by regions:
Region Geothermal energy
TJ/y MWh Toe/y
Northwest, Vidin 260 8.3 6190
North-central, Ruse 2213 70.2 52690
17

Northeast, Varna 3996 126.7 91142
Southeast, Bourgas 453 14.4 10786
South-central, Plovdiv 3277 103.8 87119
Southwest, Sofia 3657 115.9 87072
TOTAL: 13856 439.3 325903
Source: Ministry of Economy and Energy, Bulgaria
In large parts of of Bulgaria, there is a potential for geothermal heat in deep water layers with an energy potential content of about 14 PJ according to the above official mid-term estimate. This potential can be used for heating.
We expect that 35% of the potential is used in 2020 for district heating and that the usse is incrreasing to 65% until 2030.. It can be useful for low-temperature heat demand in industries as well, but that is not included in this vision.
18

Source: Ministry of Economy and Energy, Bulgaria
2.6 Hydropower
Primary production: hydropower (1 000 toe): 230 in 2000 and 373 in 2005.year 19941995199619971998199920002001200220032004 2005
Hydro PowerBulgaria 70 151 232 238 266 237 230 149 189 260 272 373Source: Eurostat
Economical potential- Small Hydro Power Plants:
- Value, TJ/year: 1,992;
- Share, %: 2.3.Source: National energy saving study of Bulgaria. SAVE II project. Study on the possibility for the
implementation of a widespread energy saving programme in Bulgaria. Vienna: E.V.A. SEEA,
E.V.A. and I.C.E. 2001.
Mid-term economical potential- Small and medium hydro PSs up to 10 MW :
- Envisaged investment costs in Million, USD: 151.77 ;
- Total power capacity in MW: 101.18.Source: “National Project/Programme on Renewable Energy Sources (NPPRES) in Republic of
Bulgaria 2004 – 2014”. Energy Efficiency Agency. MEER
19

Preliminary potentials- Hydro PP (in GWh):
- 2010: 2,813;
- 2015: 3,248 .Source: Information on predicted production of electricity from RES up to 2015. Ministry of Economy and Energy.
Theoretical potential- hydroenergy (MHPP), by regions:
Region Hydroenergy
Theoreticalpotential,GWh/y
Theoreticalpotential,ktoe
Theoreticalpotential,GWh/y
Theoreticalpotential, MW
Northwest, Vidin 356 28.48 196 62
North-central, Ruse 274 21.92 158.3 50
Northeast, Varna 25 2 12.6 4
Southeast, Bourgas 139 11.12 75.8 24
South-central, Plovdiv 273 21.84 120 38
Southwest, Sofia 460 36.8 192.8 61
TOTAL: 1527 122.16 755.5 250
Source: Ministry of Economy and Energy, Bulgaria
The hydropower production was 9.6 PJ (2.7 TWh) in 2000 and 15,6 PJ (4.3 TWh)(IEA statistics). This is not because of large construction of new hydropower, but an effect of annual variations in hydropower production. The potential for additional hydropower on small rivers has been estimatedat 2 PJ (above). In addition there is discussed hydropower dams on lag rivers. We have not includedthe development of hydropower on large rivers in this vision for environmental reasons, and have also not included the very small potential on smaller rivers. Therefore we have just included continued use of current hydropower use. The actual figure is the average of the last three years (2005: 4.34 TWh, 2006: 4.50 TWh, 2007: 2,45 TWh), which is 3.8 TWh equal to 13.5 PJ
20

3. Energy Efficiency Potentials
3.1 Factor 4 Increase in Energy Efficiency
For the vision is used the finding that the efficiency can be increased a factor 4-10 with known technologies. This has been shown to be possible for Western European energy consuming sectors, see e.g. "Factor 10 Club" (www.factor10.de). Even though the increase of efficiency is cost effective, it will not happen by itself, as the decision-makers, e.g. the designers and manufacturers of equipment are not dedicated to supply and install energy-efficient products for a number of reasons. The increase in efficiency can be measured as decrease in the specific amount of energy used to provide a certain energy service (heated floor space, transported persons or amount of goods, amount of industrial production, use of electric appliances etc.)
For transport, electric appliances, and industrial production, construction, energy consuming vehicles and equipment will be changed several times during the 45 years that the vision covers. Thus, there are not technical limitations to raise the efficiency a factor of 4 or more. The following increase in efficiency is included in the vision for industrial appliances (heat, fuels and electricity), electricity and road freight to reach a factor 4 efficiency increase 2000 - 2050:
2000 – 2010 5% in total (10% for road freight, domestic and service electricity use, industry)
2010-2020: 2%/year (less for road freight, domestic and service electricity use, industry) 2020-2030: 3%/year 2030-2040: 4%/year 2040-2050: 4%/year
The increasing use of air-conditioning is increasing energy demands in houses unnecessarily. Whilethe increasing summer temperatures require actions to reduce indoor temperatures, there are many much energy efficient ways to do that than present use of air-conditioning. First of all the cooling demand can be reduced substantially by shading sun away from windows during the warm part of the year, by trees that have a cooling effect, and most of the year also by ventilation during night time. Then the cooling demand can be met with the most energy efficient air-conditioning systems, including larger systems for larger houses. These measures combined can reduce electricity demandfor air-conditioning by a factor 4 or more. Additionally can also be considered cooling via the ground, active solar cooling, and district cooling systems for denser cities. The strong increase in efficiency in electricity use must include measures to reduce cooling demand and make air-conditioning more energy efficient.
In housing and service sector there is also considerable use of electric heating. Gradual replacing of this with solar heating and other forms of heating will also be part of the way to use electricity moreefficient in these sectors.
In the transport sector the realisation of the efficiency will require a technological shift from presentinternal combustion engines with 15-20% efficiency to hydrogen fuel cells with >60% efficiency and electric vehicles with about 80% efficiency, including battery charging cycle losses. In addition is expected implementation of technologies to regain brake-energy from vehicles.
21

For agriculture, construction, rail and water transport the following efficiency increases are includeduntil 2050: 40% for agriculture and 50% for construction, 65% for rail transport (partly achieved with additional electrification), and 25% for navigation. Also for these sectors the start is expected to be slow: 5% increase 2000 – 2010 for agriculture and construction and no increase in efficiency in rail transport and navigation.
3.2 Efficiency of heating
In Bulgaria , heat and fuel consumption of dwellings has been increasing since the year 2000:
Heat and fuel for households
2000 2005 trend
Solid fossils(coaletc.), PJ
7,8 10,0 27%
Oil products, PJ 0,7 1,0 45%
Natural gas, PJ 0,0 0,6 7135%
Solid biomass, PJ 21,0 25,1 19%
District heating, PJ
21,4 18,3 -14%
Total, PJ 50,9 55,0 8%
The table shows a large increase in energy consumption. This can partly be explained by the decrease in use of district heating and the replacement with coal and wood that has considerable losses in the boilers. This can explain about half of the increase while the rest can be explained by new construction, increasing the area. It is also possible that heating levels are incresing.
Housing statistics show an increasing construction of new dwelling until 2006:
2002 2003 2004 2005 2006 2007
Total dwelling area(mill. M2), end of year
234,46 234,98 235,65 236,59 237,64 239,12
Increase (mill. M2)
0,52 0,67 0,94 1,05 1,48
Increase(%) 0,22% 0,29% 0,40% 0,44% 0,62%
New dwellings constructed(mill m2)
0,56 0,56 0,73 0,99 1,09
Dwelling stock and construction according to National Statistical Institute, Sofia
22

Comparing energy demand and increase of dwelling area it is clear that the trend in energy use per m2 is that there is not improvement in energy efficiency. To calculate the specific heat consumptionof heated floorspace, the above total dwelling area is reduced with half of the 22% of “accessory /auxillary floorspace” that is included in the statistics for total,useful dwelling area (this includes heated and unheated rooms: room below 4 m2, corridors, vestibules, bathrooms, drying rooms, laundries, and balconies. The specific energy consumption for 2005 can be then be calculated to an average of 73 kWh/m2. This specific heat demand is low compared with European average. One reason for this low heat demand is the mild climate in parts of Bulgaria: Southern parts, Black Sea coast. Other explanations can be use of electric heating that is not included in the statistics above, and low heating levels.
For this vision we assume that reduction of the specific heat demand including hot water productionof 1.5%/year from 2010 until 2050. Then the consumption including hot water will be 55% of the 2000-level. This can be achieved with requirements for building materials and renovations similar to Western European countries.
In addition to heat demand, there is an increasing cooling demand that is discussed above under efficiency of electricity use.
This gives the following specific heat demand and heating system efficiencies of buildings, compared with 2000:
Specific heat demand 2000 100 %2010 100 % 2020 86 %2030 74 % 2040 64%2050 55 %
For the service sector we assume the same development as for the housing sector: no increase in efficency 2000 – 2010 and then 1.5%/year.
3.3 Efficiency in Energy Supply
For energy supply we expect an increase in the conversion efficiency in the electricity and heat sector, leading to a decrease in the average loss in power and CHP plants.
from IEA Statistics can be estimated the efficiencies of Bulgarian power plants divided in sources for 2000:
2000 Coal Oil Gas Nuclear
Power only Electric eff.
29% 32% 30% 33%
23

CHP Electric eff.
19% 34% 20%
CHP Total eff. 58% 46% 56%
Heat plant eff. 92% 82% 86%Efficiencies including own consumption, year 2000
The efficiencies for 2005 based on IEA figures show little change, and the estimation is that efficiencies will only increase slightly until 2010, with a small increase with the replacement of one unit of the lignite power plants, adding an estimated 1.6% to the efficiencies of power only plants. After 2010 large increases in power plant efficiencies are expected with reconstruction of power plants and construction of new, biomass based power plants.
We use the following efficiencies for power plants in the vision:CHP plant efficiencies
2010 2020 2030 2040 and later
Electric 15,5%/31,7* 40%/33%* 43% 44%/55%*
Heat 37% 35% 35% 35%/0*
Total 60% 75% 78% 79%/55%*
* Figures for power-only plants, for 2010 and 2020 including the Kuzluduy nuclear power plant.
The electric efficiencies are based on power plant efficiency data used for Danish energy planning for new plants (Danish Energy Authority, “Technology Data forElectricity and Heat Generating Plants” from www.ens.dk), with reductions due to only partial replacement of power plants. The Danish energy efficiencies data are:
Power plant efficiencies, new plants* 2010 2020 and laterGas-fired combine-cycle, 100 – 400 MW
Electric (at 100% load) 58-62% (no heat prod.)53-58% (full heat)6% lower at 50% load
59-64% (no heat prod.)54-60% (full heat)6% lower at 50% load
Total (at full heat) 90% 91%Gas-fired combine-cycle, 10 – 100 MW
Electric (at full heat) 47-55% (100% load) 48-56% (100% load)Total (at full heat) 90% 91%
Gas engine 1-5 MW Electric 41-44% (100% load) as 2010Total 88-96% as 2010
Large biomass-fired steam turbine plant, 400 MW
Electric 46.5% (100% load)2.5% lower at 50% load
48.5% (100% load)2.5% lower at 50% load
Total 90% as 2010Straw-fired steam turbine, 5-15 MW**
Electric 29-30%(>75%load) as 2010Total 90% as 2010
Wood gasification, 1-20 MW
Electric 35-40%5% lower at 50% load
37-45%0-5% lower at 50% load
Total 103%*** 103%***
24

*Net efficiencies, adjusted for own consumption** Larger installations have larger electric efficiencies*** With flue gas condensation
The electric efficiency of the CHP plants in 2020 (40%) can be achieved with CHP power plants with a combination of gas engines for biogas and other small CHP (41-44% efficiency, wood gasification (35-40%), large biomass and fossil fuel fired CHP, e.g for Sofia (44-46% efficiency, and some older fossil fuel power plants and smaller wood and straw power plants with lower efficiencies.
Also the efficiency of the electricity network is expected to increase. The losses were in 2000 26% of consumption (equal to 15% of power production) but had decreased to 19% of consumption in 2005 (11% of production). We assume that the 2005 losses will continue to 2010 and then will be decreased to 15% of consumption (8% of consumption)to until 2020. This include losses in pump storage operation equal to 1% of power production that is expected to continue. Normal losses in eletric grids in Western European as fraction of production have been around 7% for more than a decade (without losses for in pump storage).The losses in heat grid was 20% of consumption in 2000 decreased to 15% in 2005 according to IEA statistics. We expect this level to remains constant in the future.
A phase-out of nuclear power is included in this vision with the closures of blocks in Kozluduy in 2006. The remaining two block are then closed in 2025. No nuclear new build is included.
25

4. Demand for energy services
4.1 Heat and Fuel Use
In this model is not included an automatic link of economic development (GDP growth) and energy consumption. Instead is included expected growth of energy consuming factors, such as heated floor area, transport, production in volume, not in value. These drivers are referred to as energy service demands.
The demand for energy services (heated floorspace, transport etc.) is expected to increase as follows:
Heating (district heating + fuels) in housing:According to housing statistics, the housing area has increased 0.22 – 0.65%/year since 2002. There was a building boom in 2007-2009, mainly because of foreign investments, so the increase upto 0.65% is not expected to continue. While the increase was still 0.65% in 2009, the area applied for in building permits fell dramatically with 2/3 from 2007 to 2010.
From the statistics the total increase in the period 2000 – 2010 is estimated to 4%.This increase is expected to continue until 2050. This will give the following area compared with 2000:
2000: 100%2010: 104%2020: 108%2030: 113%2040: 118%2050: 124% In housing is some change of fuel from district heating to biomass and fossil fuels (mainly coal and various briquettes, with gas use fast increasingly on a very low level). From 2000 to 2005 biomass replaced district heating as the largest heat supply in Bulgaria.
The service sector area increased twice as fast as the housing area 2004 - 2010. This is expected to continue until 2050. This will give the following area compared with 2000:
2000: 100%2010: 108%2020: 116%2030: 126%2040: 136%2050: 148%
Heat and fuel demand of the service sector (public and privat service) has increased faster than heat demand for dwellings, see table below:
Heat and fuel, service sector
2000 2005 trend
26

Solid fossils(coal etc.)
0,0 0,3 0%
Oil products 4,0 1,3 -67%
Natural gas 0,5 1,8 243%
Solid biomass 0,4 0,6 44%
District heating 4,0 6,9 72%
Total 8,9 10,8 21%
It is expected that no increase in efficiency has taken place, so the increase in energy consumption equals increase in heated floor area.
Industry have had no development in overall energy demands from 2000 to 2005, but considerable fuel shift from fossil fuels to electricity, district heating, and biomass. This is expected to reflect the assumed increase in efficiency if 5% and an increase in production volume of 5%. This production increase is expected to continue until 2020 (to 120% of the 2000 level) and then the production volume is expected to remain flat (but the production value continue to go up with development of increasingly advanced products as it has in the period 2000 - 2005)The fuel shift 2000 – 2005 is also included in the vision.
From 2000 to 2005 the fuel shift to district heating in industry and service sectors have overshadowed the decline in household use, so the overall district heat use have increased 7% in theperiod.
Agricultural production is expected to increase 1%/year 2000 – 2010, to re-establish an agricultural production level similar to the food demand in Bulgaria.Then the level is assumed to be stable on 110% of the 2000 – level. With this assumption also the reductions in production 2000 – 2005 will be reversed.
Construction has doubled 2000 – 2006, so we assume that the sector’s energy demand has doubled as well. It is expected to remain constant on the current higher level, which is equal to the expected future development in the housing sector.
4.2 Electricity Use
We expect the following development of electricity use: Household Sector: we expect household use of electric appliances to increase 20% more
than the increase in floor space, with half of this additional increased achieved in 2010. This will lead to an energy service level in 2050 of 144% of the 2000 level.
Service sector: We also expect use of electric appliances to grow 20% more than floor space, leading to a level in 2050 of 318% of the 2000 level.
Industry and and farming: We assume increase of 2%/year above fuel demands until 2020 (because of increased mechanisation), then stable. Compared with 2000 the level for industry will then be 120% in 2010 and 140% in 2020 and 120% respectively 130% for agriculture.
27
Construction: We expect doubling 2000-2010 because of increased activity, then stable on new higher level
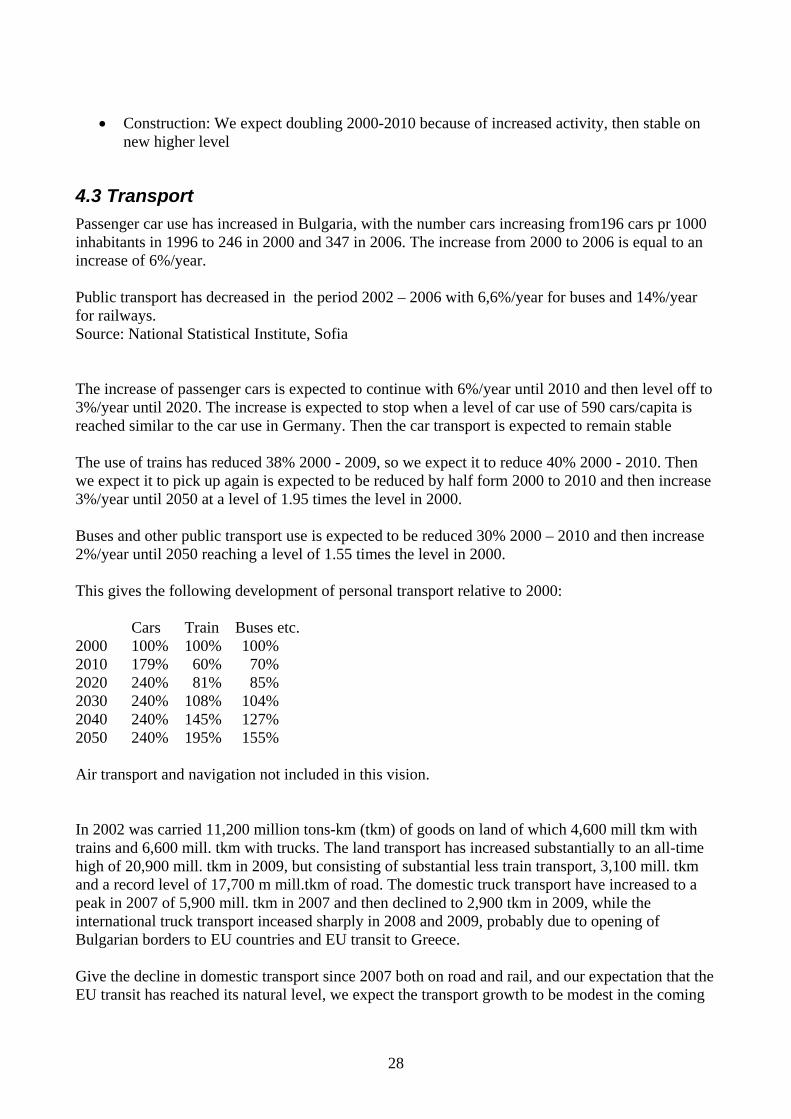
4.3 Transport
Passenger car use has increased in Bulgaria, with the number cars increasing from196 cars pr 1000 inhabitants in 1996 to 246 in 2000 and 347 in 2006. The increase from 2000 to 2006 is equal to an increase of 6%/year.
Public transport has decreased in the period 2002 – 2006 with 6,6%/year for buses and 14%/year for railways. Source: National Statistical Institute, Sofia
The increase of passenger cars is expected to continue with 6%/year until 2010 and then level off to 3%/year until 2020. The increase is expected to stop when a level of car use of 590 cars/capita is reached similar to the car use in Germany. Then the car transport is expected to remain stable
The use of trains has reduced 38% 2000 - 2009, so we expect it to reduce 40% 2000 - 2010. Then we expect it to pick up again is expected to be reduced by half form 2000 to 2010 and then increase 3%/year until 2050 at a level of 1.95 times the level in 2000.
Buses and other public transport use is expected to be reduced 30% 2000 – 2010 and then increase 2%/year until 2050 reaching a level of 1.55 times the level in 2000.
This gives the following development of personal transport relative to 2000:
Cars Train Buses etc.2000 100% 100% 100%2010 179% 60% 70% 2020 240% 81% 85%2030 240% 108% 104%2040 240% 145% 127%2050 240% 195% 155%
Air transport and navigation not included in this vision.
In 2002 was carried 11,200 million tons-km (tkm) of goods on land of which 4,600 mill tkm with trains and 6,600 mill. tkm with trucks. The land transport has increased substantially to an all-time high of 20,900 mill. tkm in 2009, but consisting of substantial less train transport, 3,100 mill. tkm and a record level of 17,700 m mill.tkm of road. The domestic truck transport have increased to a peak in 2007 of 5,900 mill. tkm in 2007 and then declined to 2,900 tkm in 2009, while the international truck transport inceased sharply in 2008 and 2009, probably due to opening of Bulgarian borders to EU countries and EU transit to Greece.
Give the decline in domestic transport since 2007 both on road and rail, and our expectation that theEU transit has reached its natural level, we expect the transport growth to be modest in the coming
28

decade, 3%/year compared to almost 10%/year since 2000. After 2020 we expect an increase of 1%/year increase 2020- 2040, and stable 2040 – 2050.We expect that the railway will pick up and increase to the 2000 level in 2020 and then increase 4%/year
This gives the following land freight transport relative to 2000:Year Rail Truck Total
mill.tkm Relative mill. tkm Relative mill.tkm Relative2000 5538 100 5262* 100 10800* 1002002 5212 94 6018 114 11229 1042005 5163 93 14371 273 19534 1812009 3144 57 17741 337 20885 1932010 3100 56 17800 338 20900 1942020 5500 99 25437 483 30937 2862030 8141 147 26032 495 34174 3162040 12051 218 25698 488 37749 3502050 17839 322 19910 378 37749 350
* Estimated values
The bold figures are used in the scenario calculations.
Pipeline use: Is expected to be stable until 2020, then reducing because of less European oil and gasdemand till 70% of today’s level in 2050.
29

5. Fuel shift etc.Fuel shift is in general limited to max 3%/year increase or decrease for a specific energy source in aspecific sector, but the total can be more as more fuel shifts can happen simultaneously. In a few instances are foreseen more rapid fuel shift:-
Fuel shift in transport In 2030 we expect that railways will be more electrified, covering 80% of rail transport (from 50% in 2005) while we also expect that electricity will cover 20% of energy demand on roads, via the use of electric vehicles.In 2040 we expect that the use of electricity in rail and road transport will increase to respectively 90% and 40%. We expect that hydrogen will cover 10% of road transport needs.In 2050 we expect that the railways will be 90% electrified with the rest covered by hydrogen. Roadtransport energy is expected to be covered by 70% electricity and 30% hydrogen.
Fuel shift in electricity: the nuclear production is expected to be reduced to 12 - 13 TWh of electricity (140 PJ of primary energy with efficiency of 33%). Most of this reduction happened until2007 with the closure the nuclear reactors Kozloduy 3 and 4. The nuclear is the expected to be phased out around 2025 after 35-40 years lifetime of the remaining two reactors.
Export of electricity is expected to fall to 15 PJ (about 4.1 Twh) in 2010 from a top of 30 PJ in 2005. This reduction already almost happened with a fall of export to 4.5 TWh in 2007. The export is the phased out until 2020. There will still be electricity exchange with neighbouring countries.
5.1 Fossil fuels
The small remaining oil production is expected to reduce 25% until 2010 and then decrease to zero until 2020.
The gas production is expected to continue on the 2005 level to 2010 and then decrease to zero until2020.
The coal and lignite production declined 9% 2000 – 2005. The reduction is not included in the 2010production, but then a large reduction is expected: 47% reduction 2010 - 2020, as lignite is replacedwith other fuels in power production, and then a further 18% reduction until 2020 and another 75% reduction until 2040. Then the mines are expected to be closed until 2050. With this reduction, lignite import and export will be limited as today. We expect that the remaining fossil fuel is covered by imports.
30

6. Energy StoragesHigh reliance on intermittent renewable energy – wind and solar- can require energy storages and flexible energy use. The total fraction of intermittent electricity production in 2020 is 10% raising to26% in 2030 and further to 43% in 2050. From 2030 this requires special electricity storages; but use of the current hydro pump-storage should be sufficient until 2040. It is also helpful for regulation before 2030. The closure of nuclear power will free the existing hydro pump-storage capacity.
In the electricity sector is also introduced some flexible consumptions: hydrogen production for transport. electric cars with batteries that can be charged at different times at night
For the CHP plants is recommended daily/weekly heat storages (water tanks) to de-couple electricity and heat deliveries on short-term basis.
The use of the energy from the solar collectors could be increased with seasonal storages, but this isnot included in this vision.
About this note This note was developed by Gunnar Boye Olesen, INFORSE-Europe in cooperation with Venelina Velichkova, Za Zemiata for the Sustainable Energy Vision for Bulgaria. Read more about the vision for other countries at www.inforse.org/europe. Please send comments to [email protected].
The work on this paper and the sustainable energy vision for Bulgaria is partly paid with funding received from the Bankwatch Network. It express the findings and the views of the authors and of INFORSE-Europe.
31