sustainable development report - swire.com · 2 2017 sustainable development report message from...
TRANSCRIPT

2017 Sustainability Report
500
Water & Ingredients
Packaging
Manufacturing
Distribution
Refrigeration
Workplace
Community
Waste Management
2017Sustainable Development Report

Message from our Managing Director 2
Our Business 4
Approach to Sustainable Development 8
Environment 14
Water Stewardship 14
Carbon 25
Packaging and Waste Management 38
Product Responsibility 50
Product Choice 51
Product Labelling and Marketing 54
Procurement and Sourcing 55
Food Safety and Product Quality 57
Workplace 58
Safety 58
Gender Equality 64
Compliance and Management Systems 68
Community Engagement 69
New Territories 74
About this Report 75
Awards and Recognitions 76
GRI Standards Index Table 78
Performance Tables 82
Glossary 84
2017 Sustainable Development Report
CONTENTS

2
2017 Sustainable Development Report
MESSAGE FROM OUR MANAGING DIRECTOR
Why has Swire Beverages decided to start reporting on its sustainable development performance?
2017 was a transformational year for Swire
Beverages. We completed planned acquisitions in
Mainland China and the U.S. which have expanded
the scale of our business from around HK$25 billion
to approximately HK$40 billion in annual revenues,
cementing our position as one of the largest
global bottling groups in The Coca-Cola System. A
major restructuring programme is also underway
in Taiwan which will substantially improve the
profitability of our business in that market.
The most exciting aspect of these dramatic changes
is not the results we have achieved, impressive
though these are. Rather, it is the solid platforms
we have established in all markets (Hong Kong,
Mainland China, Taiwan, and the U.S.) from which
we will launch a new wave of growth. Refranchising
in both the U.S. and Mainland China has not only
created much larger franchise territories for Swire
Beverages, but has done so within an optimised
Coca-Cola System which is ideally positioned for
the future.
The Swire Group has been in business for over two
hundred years, and we have been part of the global
Coca-Cola System for over fifty years. We remain
firmly focused on the long-term sustainability of
our business and the communities we serve. We
are truly committed to sustainable development.
We do not pay lip service. We state the facts. We
must build a sustainable business which supports
sustainable communities living in a sustainable
environment.
Reporting on our sustainable development is
consistent with that approach. This is our first
formal sustainability performance report. We will
continue to improve on this annual report, taking
into account feedback from all our stakeholders.
What are Swire Beverages’ achievements and progress?
We focus on what matters most and where we have
the biggest impact. We identify a small number
of core priorities we measure and monitor our
progress and we partner with stakeholders where
doing so may improve our performance.
Patrick Healy, Managing Director of Swire Beverages

3
2017 Sustainable Development Report
What are the challenges ahead for Swire Beverages?
We are firmly focused on the following four priorities, which represent what we believe are the most significant
challenges for us in the foreseeable future:
1. Primary packaging: the circular economy We must transition to 100% recyclable packaging for all our products. We must also increase recycled
content in the packaging we use. We will collaborate with multiple stakeholders to develop effective, efficient sorting, collection and recycling infrastructures to maximise the percentage of packaging which
is recycled across all our markets.
2. Water We will continue to improve our Water Use Ratio. We will continue to invest with our partners in water
replenishment projects in all our markets. We are proud to say we are “water positive” in both the U.S. and
Greater China. We will continue to invest to ensure we stay that way.
3. Greenhouse gas emissions We will accurately measure our carbon footprint. We will work with partners to identify opportunities to
reduce our carbon intensity and minimise our carbon footprint.
4. Gender equality We will achieve gender equality in all our workplaces by providing equal opportunities to male and female
staff. We will launch a Swire Beverages Gender Equality Steering Committee in 2018 to develop strategies and define performance indicators to promote gender equality across the organisation.
Highlights include:
• Through continuous improvements in water efficiency across our production environments, we have improved our Water Use Ratio1 from 1.81 in 2010 to 1.77 in 2017.
• As part of The Coca-Cola System, we support water replenishment projects in water-stressed areas of Mainland China and the U.S. In partnership with nonprofits, governments and other key stakeholders, The Coca-Cola System replenished 22.93 billion litres of water in Greater China, and 31.18 billion litres of water in the U.S. by the end of 2017. In all our markets, therefore, The Coca-Cola System remained “water positive” in 2017 (see page 23).
• We initiated a three-year research programme in partnership with Tsinghua University to explore innovative solutions to improve our energy efficiency and reduce our greenhouse gas emissions. The programme will begin with
1 Water Use Ratio is the amount of water used to produce one litre of beverage2 https://www.coca-colacompany.com/content/dam/journey/us/en/private/fileassets/pdf/2017/2016-sustainability-update/2016-Sustainability-
Report-The-Coca-Cola-Company.pdf & https://www.coca-colacompany.com/content/dam/journey/us/en/private/fileassets/pdf/2017/TCCC_2016_
Replenish_Quantification_Report_2017_April_with_Appendices.pdf
This report demonstrates our progress towards a more sustainable future. This is a condition of our
social license to operate and our long-term profitability.
on-site monitoring and analysis, leading to the adoption of energy-saving standards and operational guidelines across all facilities.
• Single-use plastics are a global environmental concern. Too much plastic ends up in our oceans and in landfills. We joined the New Plastics Economy, a global initiative of the Ellen MacArthur Foundation, to tackle the growing environmental problems caused by plastic waste. We are collaborating with a range of stakeholders to identify opportunities to reduce plastic entering our natural environment.
• In line with The Coca-Cola Company’s global commitment2, we continued to diversify our portfolio to include more low-sugar and sugar-free beverage options to cater to changing consumer preferences.

4
2017 Sustainable Development Report
OUR BUSINESS
Swire Beverages has exclusive rights to
manufacture, market and distribute products of The
Coca-Cola Company (TCCC) in Hong Kong, Taiwan,
eastern and southern Mainland China, and the
western U.S. Across these four markets, the scope
of our business covers manufacturing, packaging,
distribution and refrigeration of 60 beverage brands.
Swire Beverages is wholly owned by Swire Pacific
Limited (Swire Pacific), a public company listed on
the Stock Exchange of Hong Kong. Swire Pacific
acquired its first Coca-Coca franchised bottling
plant in 1965.
In 2017, Swire Beverages completed the acquisition
and realignment of new Coca-Cola franchise
territories in Mainland China and the U.S. which
significantly increased our footprint in these
markets and will nearly double the size of our
business. By the end of 2018, it is expected that
our revenues will have grown from HK$24 billion
to HK$40 billion, and our products are expected to
serve 708 million consumers. We will become the
fifth largest bottler by sales volume in the global
Coca-Cola System3 .
Throughout this report, bottling plants owned and
operated by Swire Beverages prior to the 2017
acquisition are referred to as “legacy” plants or
operations. Newly acquired plants are referred to as
“new territories”. Co-packers are third party contract
manufacturers who produce and supply beverages
under contract to Swire Beverages according to
our standards and specifications. As part of the
realignment in Mainland China, Swire Beverages
ceased to operate in Shaanxi Province from July 2017
and therefore Shaanix data has been excluded from
legacy plant data in this report.
3 Under The Coca-Cola System, TCCC sells concentrates to bottling partners who manufacture and distribute the finished beverages to customers and vending partners. TCCC owns the brands and is responsible for consumer brand marketing initiatives.

5
Our B
usiness
2017 Sustainable Development Report
Producing an additional 14.4 billion servings of beverages by the end of 2018
Consumers Served Unit Cases
Employees
449 million 708 million 1.6 billion
31,00020,000
Revenues
HK$40 billionHK$24 billion
1 billion
Before and After Realignment: Expected Business Growth by the end of 2018
+58%
+55%
+60%
+67%
Note: 1 unit case = 24 x 8 oz servings or 5.678 litres 600 million unit cases at 24 eight ounce servings equals 14.4 billion servings

6
2017 Sustainable Development Report
Operating Locations in Greater China
Hainan
Jiangxi
Henan
Guangxi
Zhejiang
Shanghai
Yunnan
Anhui
Jiangsu
Hong Kong
MainlandChina
TaiwanGuangdong
Zhanjiang, Guangdong
Hubei
Fujian
Shaanxi
Legacy Territories
Other Bottlers
New Territories
Hong Kong - Headquarters
1 bottling plant(legacy)
1,449 employees
20 beverage brands
316.4 million litres in production volume
Taiwan
2 bottling plants(legacy)
918 employees
16 beverage brands
1 distribution centre
146.4 million litres in production volume
Mainland China
18 bottling plants(10 legacy & 8 new territories)
20,027 employees
17 beverage brands
181 distribution centres
5,337 million litres in production volume
Mainland China Before acquisition After acquisition
Number of bottling plants 8 18
Number of co-packers 5 12
Number of CCBMH bottling plants 6 6
Number of distribution centres 134 181
Number of provinces and municipalities served 6 12
Note: CCBMH stands for Coca-Cola Bottlers Manufacturing Holdings Limited, which is 41% owned by Swire Beverages

7
Our B
usiness
2017 Sustainable Development Report
Per Capita Consumption in Our Franchise Territories
Franchise population (millions) (end 2017)
GDP per capita (US$)
Sales volume (million unit cases)
Per capita consumption of Coca-Cola Beverages (8oz servings)2017 2007
Mainland China 664.1 9,915 1,112 500
Hong Kong 7.4 45,050 65 55
Taiwan 23.6 25,119 53 46
U.S. 28.7 46,223 282 86
20072017
0 50 100 150 200 250 300 350
Operating Locations in the U.S.
U.S. Before acquisition After acquisition
Number of bottling plants 2 6
Number of distribution centres 26 48
Number of states served 11 13
Legacy Territories
New Territories
Washington
Oregon IdahoWyoming
SouthDakota
Nebraska
KansasColorado
New Mexico
Arizona
California
Nevada
Utah
United States
U.S.
6 bottling plants(2 legacy & 4 new territories)
6,674 Employees
31 beverage brands
48 distribution centres
1,485 million litres in production volume
Note: (1) A unit case comprises 24 8oz servings. (2) Mainland China and the U.S. per capita consumption in 2017 includes annualised consumption figures for the new territories acquired during the year.

8
2017 Sustainable Development Report
Franchise population (millions) (end 2017)
GDP per capita (US$)
Sales volume (million unit cases)
Per capita consumption of Coca-Cola Beverages (8oz servings)2017 2007
Mainland China 664.1 9,915 1,112 500
Hong Kong 7.4 45,050 65 55
Taiwan 23.6 25,119 53 46
U.S. 28.7 46,223 282 86
APPROACH TO SUSTAINABLE DEVELOPMENT
Swire Beverages is committed to continual improvement and acting responsibly to support a better future
for our employees, customers, the natural environment and the communities in which we operate and live.
Our approach to sustainable development aligns with the values and commitments set out by our parent
company, Swire Pacific. We aim to create long term value for our shareholders. Achieving this depends on the
sustainable development of our businesses and the communities in which we operate.
To achieve sustainable development, we aim to:
• Minimise our impact on the environment
• Cause zero harm
• Excel as corporate citizens

9
2017 Sustainable Development Report
Approach To S
ustainable Developm
ent
Embedding SwireTHRIVE
SwireTHRIVE4 is the new group-wide environmental
sustainability strategy launched by Swire Pacific in
2016. It was created by the Swire Group Sustainability
Committee (SGSC), comprising the Sustainable
Development Office and representatives from all
major operating companies in John Swire & Sons5
and Swire Pacific6 .
With the understanding that when the environment
in which we operate thrives, so do we, six target
areas for improvement have been identified. They
are: Carbon, Waste, Water, Sustainable Materials,
Biodiversity and Climate Resilience.
In the future, we will develop a more detailed plan
which incorporates the six priority areas as part
of our sustainability strategy. These goals are due
for delivery by 2030, with initial emphasis on 2020
milestones.
The Coca-Cola Company’s Approach
As a member of The Coca-Cola System, we embed
the same sustainability values and performance
metrics as TCCC into our operations. In line with
TCCC's approach, we offer a diverse portfolio of
beverages based on the taste preferences of our
local consumers. We also align our environmental
and social focus areas with those of TCCC.
Reporting and Disclosure
We track key environmental and social performance
indicators to report to Swire Pacific and TCCC. Swire
Beverages, has historically reported as part of Swire
Pacific’s annual sustainable development reports.
With the change in the scale of our business this
year, and in response to the mainstreaming of non-
financial reporting among leading businesses, we
have decided to start producing our own external
report on an annual basis. This report adopts the
latest Sustainability Reporting Standards issued by
the Global Reporting Initiative (GRI), and endeavours
to provide a balanced and honest account of our
approach and performance.
This year, the scope of the data in this report covers
primarily our legacy operations (excluding the bottling
plant in Shaanxi, China, which is no longer operated
by Swire Beverages as of July 2017). We have tried
to present multi-year historic data, where available, to
allow readers to determine year-on-year progress. To
provide clarity for the reader, we have explained the
scope and boundary for most of the quantitative data
in the chapters in which it is presented.
4 http://www.swirepacific.com/en/sd/environment.php 5 http://www.swire.com/en/global/home.php 6 http://www.swirepacific.com/en/global/home.php

10
2017 Sustainable Development Report
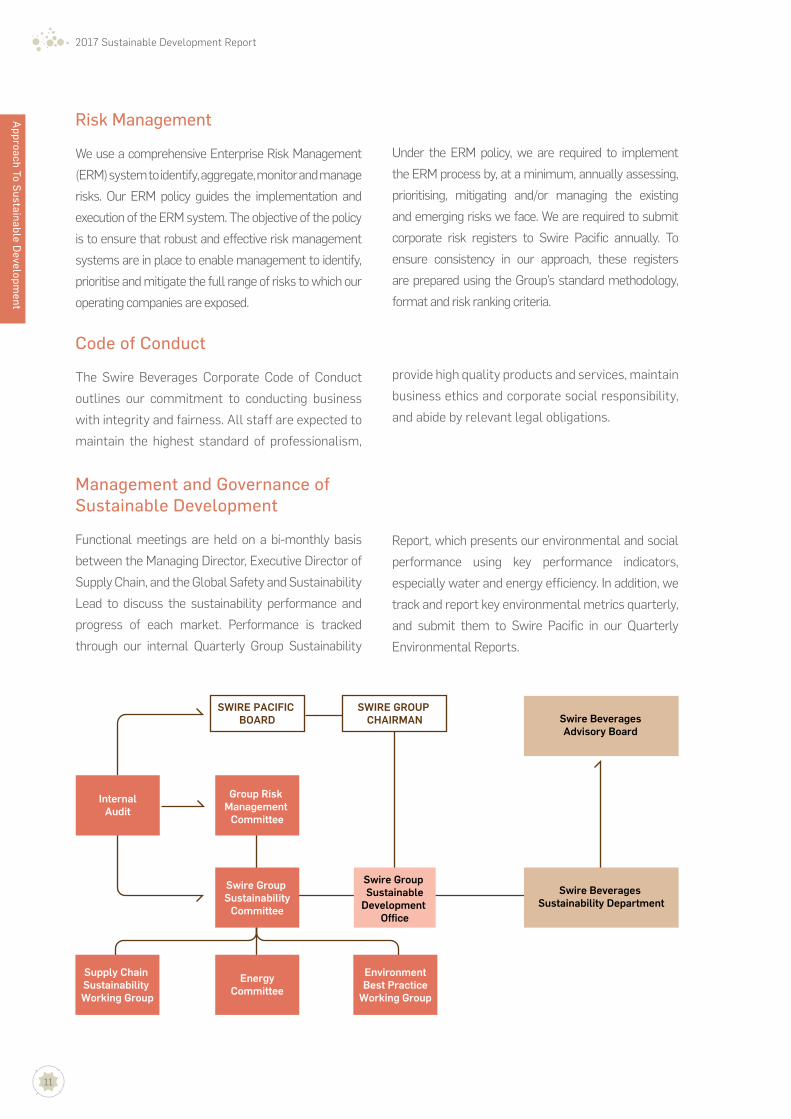
Corporate Governance
The Swire Pacific Board (the Board), led by its
Chairman, is ultimately accountable for matters
relating to sustainable development. Information
on pertinent issues such as climate change and the
performance of Swire Group companies is reported
to the Board through the Group Risk Management
Committee (GRMC), chaired by Swire Pacific’s
Finance Director. The GRMC is advised by the SGSC
and by working groups, such as the Environmental
Best Practice Working Group.
The Board and management of each division are
Swire Pacific’s Internal Audit Department audits
operating companies under the Swire Group,
including Swire Beverages. It provides assurance
that the risk management and internal control
systems are properly implemented and operating
effectively, and that the associated risks are being
properly identified, monitored and managed.
also responsible for identifying and analysing
the economic and sustainability risks underlying
the achievement of business objectives, and for
determining how such risks should be managed and
mitigated. Swire Beverages is an operating company
of Swire Pacific, and therefore is represented in all
the below committees and working groups.
Swire Pacific Board
Group Risk Management Committee(GRMC)
InternalAudit
FinanceCommittee
InformationTechnology
Health & Safety
HumanResources Legal Sustainability
(SGSC) EnergyInsurance
CyberSecurity
China Health& Safety Insurance
Enterprise-wideRisk
Management
Supply Chain
Sustainability
EnvironmentBest
Practices
U.S. RiskManagement
Working Group
Committee
Swire Pacific complies with the Corporate
Governance Code in Appendix 14 to The Rules
Governing the Listing of Securities on The Stock
Exchange of Hong Kong Limited. For more details,
please refer to the Corporate Governance section of
the Swire Pacific 2017 Annual Report.
11
2017 Sustainable Development Report
Swire BeveragesAdvisory Board
Swire Beverages Sustainability Department
InternalAudit
Group Risk Management
Committee
Swire Group Sustainability
Committee
EnergyCommittee
Supply Chain Sustainability Working Group
EnvironmentBest Practice
Working Group
Swire Group Sustainable
Development Office
SWIRE PACIFIC BOARD
SWIRE GROUP CHAIRMAN
Code of Conduct
The Swire Beverages Corporate Code of Conduct
outlines our commitment to conducting business
with integrity and fairness. All staff are expected to
maintain the highest standard of professionalism,
Management and Governance of Sustainable Development
Functional meetings are held on a bi-monthly basis
between the Managing Director, Executive Director of
Supply Chain, and the Global Safety and Sustainability
Lead to discuss the sustainability performance and
progress of each market. Performance is tracked
through our internal Quarterly Group Sustainability
Approach To S
ustainable Developm
ent
Report, which presents our environmental and social
performance using key performance indicators,
especially water and energy efficiency. In addition, we
track and report key environmental metrics quarterly,
and submit them to Swire Pacific in our Quarterly
Environmental Reports.
provide high quality products and services, maintain
business ethics and corporate social responsibility,
and abide by relevant legal obligations.
Risk Management
We use a comprehensive Enterprise Risk Management
(ERM) system to identify, aggregate, monitor and manage
risks. Our ERM policy guides the implementation and
execution of the ERM system. The objective of the policy
is to ensure that robust and effective risk management
systems are in place to enable management to identify,
prioritise and mitigate the full range of risks to which our
operating companies are exposed.
Under the ERM policy, we are required to implement
the ERM process by, at a minimum, annually assessing,
prioritising, mitigating and/or managing the existing
and emerging risks we face. We are required to submit
corporate risk registers to Swire Pacific annually. To
ensure consistency in our approach, these registers
are prepared using the Group’s standard methodology,
format and risk ranking criteria.
12
2017 Sustainable Development Report
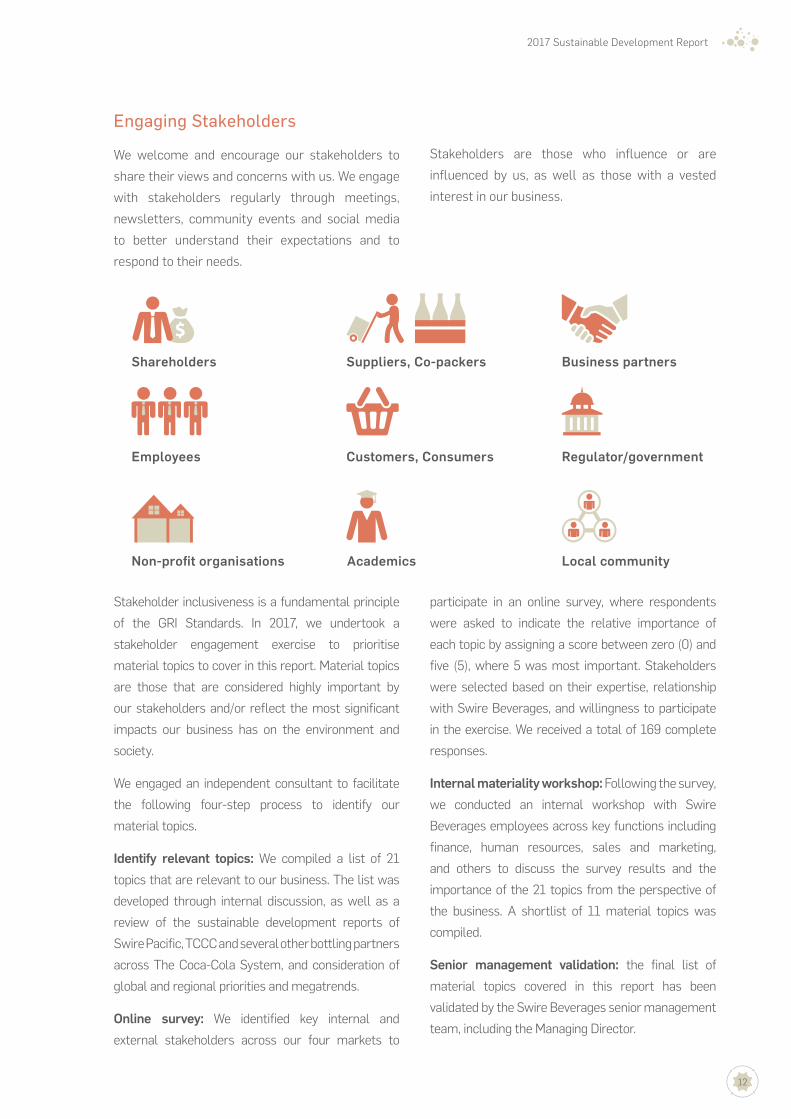
Shareholders
Customers, Consumers
Business partners
Non-profit organisations
Suppliers, Co-packers
Regulator/governmentEmployees
Academics Local community
Engaging Stakeholders
We welcome and encourage our stakeholders to
share their views and concerns with us. We engage
with stakeholders regularly through meetings,
newsletters, community events and social media
to better understand their expectations and to
respond to their needs.
Stakeholder inclusiveness is a fundamental principle
of the GRI Standards. In 2017, we undertook a
stakeholder engagement exercise to prioritise
material topics to cover in this report. Material topics
are those that are considered highly important by
our stakeholders and/or reflect the most significant
impacts our business has on the environment and
society.
We engaged an independent consultant to facilitate
the following four-step process to identify our
material topics.
Identify relevant topics: We compiled a list of 21
topics that are relevant to our business. The list was
developed through internal discussion, as well as a
review of the sustainable development reports of
Swire Pacific, TCCC and several other bottling partners
across The Coca-Cola System, and consideration of
global and regional priorities and megatrends.
Online survey: We identified key internal and
external stakeholders across our four markets to
Stakeholders are those who influence or are
influenced by us, as well as those with a vested
interest in our business.
participate in an online survey, where respondents
were asked to indicate the relative importance of
each topic by assigning a score between zero (0) and
five (5), where 5 was most important. Stakeholders
were selected based on their expertise, relationship
with Swire Beverages, and willingness to participate
in the exercise. We received a total of 169 complete
responses.
Internal materiality workshop: Following the survey,
we conducted an internal workshop with Swire
Beverages employees across key functions including
finance, human resources, sales and marketing,
and others to discuss the survey results and the
importance of the 21 topics from the perspective of
the business. A shortlist of 11 material topics was
compiled.
Senior management validation: the final list of
material topics covered in this report has been
validated by the Swire Beverages senior management
team, including the Managing Director.

13
2017 Sustainable Development Report
Impo
rtan
ce to
sta
keho
lder
s
Importance to Swire BeveragesHighLow
High
• Customer engagement• Employee development• Internal communications• Ethics and integrity• Consumer satisfaction
WaterPrimary packaging and waste managementSafetyCompliance and management systemsProduct Labelling
• Biodiversity• Economic value distributed• Climate change• Information privacy• Ingredients
Gender equalityProduct choiceFood safetyProcurementCarbonCommunity engagement
Materiality Matrix
Material Topics
This report covers the 11 most important topics for
our business and stakeholders in five categories:
Environment, Product Responsibility, Workplace,
Compliance and Management Systems and
Community Engagement. Environmental topics,
especially water and packaging, reflect areas where
our business has a significant impact and where
our stakeholders expect us to be managing those
impacts and disclosing our performance. Other
issues such as safety, compliance and food safety
Approach To S
ustainable Developm
ent
can affect our ability to be in business. We have
decided to focus our sustainable development
report on topics located in the two quadrants
on the right hand side of the materiality matrix.
Other topics such as ethics and integrity, consumer
engagement and employee development, though
important, are not the focus of this report.
Information on our policies and approach to
managing these issues is communicated through
other channels.

2017 Sustainable Development Report
14
ENVIRONMENT
Data Capture
With the realignment of territories over 2017 in Mainland China and the U.S. mentioned in Our Business, we do
not have a full year’s worth of data for these new territories and bottling plants. Their performance information
is presented separately in the New Territories section, at the end of this report. In each section of this report,
further clarification on the data scope has been given under Scope, as it may differ. For clarity, Shaanxi Province,
a legacy territory which was part of Swire Beverages until mid-2017, has been excluded.
7 http://www.un.org/waterforlifedecade/scarcity.shtml
continue to have access to safe, clean and affordable water. By investing in water efficiency and encouraging best practice in water use, we also have an opportunity to reduce costs and reinforce our reputation as a responsible company.
Water stress is often experienced locally. Therefore, managing water resources demands a customised approach at a local watershed level. Understanding local policies on water creates opportunities to engage with local stakeholders and demonstrates our intention to collaborate to achieve a common goal. Our approach to sustainable water use has been integrated into our Source Vulnerability Assessment and Source Water Protection Plans.
With the world’s natural resources becoming increasingly scarce and the consequences of climate change intensifying in recent years, we need to not only be responsible for addressing our environmental footprint,
but also investigate opportunities to create positive impacts along our value chain.
As a business partner of TCCC and an operating division under Swire Pacific, our approach and environmental management systems align with the environmental commitments of both companies. We adopt the SwireTHRIVE strategy and aim to mitigate operational risks and build long-term resilience by driving higher
standards, greater efficiency, and increased innovation in key areas.
Water use, energy consumption, and primary packaging and waste management, are our key environmental
concerns today.
WATER STEWARDSHIP Water is one of the world’s most precious and vital resources. Our communities and ecosystems require water, and our business depends on a reliable supply of clean water. It is the main ingredient in our products and used extensively in our manufacturing process.
Globally, a growing population, changing climate patterns and increasing water pollution, are all putting ever-increasing demands on our sources of drinking water. According to the United Nations, two-thirds of the world’s population are expected to face water shortages by 20257. As a significant consumer of water, we have a responsibility to ensure the communities in which we operate

2017 Sustainable Development Report
15
Environm
ent
Understanding Our Water Risks
Water availability or scarcity is highly dependent
on local climate conditions. Our operations in the U.S. and Mainland China experience different risks. In our U.S. operations, mostly located in more arid areas, water scarcity is a result of limited rainfall and depletion of groundwater sources. For our Mainland China operation, however, it is water quality issues resulting from high population density and contamination from industry that are the dominant risks.
Agriculture and manufacturing are the major water consumers in Mainland China. With the presence of manufacturing industries, water pollution is the biggest threat to water security in southern and
Fujian
Zhejiang
Shanghai
Taiwan
Guangdong
Hong Kong
MainlandChina
Guangxi
Jiangxi
AnhuiHubei
Yunnan
Henan
Hainan
Jiangsu
Low risk <10%
Low to medium risk 10-20%
Medium to high risk 20-40%
High risk 40-80%
Extremely high risk >80%
Legacy bottling plants Coca-Cola Bottlers Manufacturing Holdings LimitedNew territories bottling plants
Co-packers
Overall Water Risk Map for Greater China
8 http://civic-exchange.org/wp-content/uploads/2017/05/Water-Report-English-final.pdf9 Guangdong Yue Gang Water Supply Company Limited has exclusive rights to supply Hong Kong’s freshwater
eastern Mainland China where we operate. Hong Kong sources most of its water from the Dongjiang River8 in Guangdong Province9, and is dependent on the availability of water from Mainland China. Northern Taiwan experienced a drought in 2015, and is considered to be of medium-to-high overall water risk.
The majority of our operations in Mainland China are considered to experience medium overall water risk with some pockets in high risk areas. In northern China, outside of our operating region, high overall water risk could potentially impact our business if water stress continues to worsen.

16
2017 Sustainable Development Report
The western U.S. is known for its vulnerability to
droughts and has historically experienced lengthy
periods of drought that can last up to 10 years or more. Although the situation in 2017 improved relative to the preceding five years (since 2011) due to higher recorded rainfall, the long term water security of this region is still at risk with contributing factors such as population growth and unpredictable levels of precipitation.
10 Physical quantity risk includes baseline water stress, inter-annual variability, seasonal variability, flood occurrence, drought severity, upstream storage, and groundwater stress.
11 Regulatory and reputational risk includes media coverage, access to water and threatened amphibians.12 AQUEDUCT Water Risk Atlas: http://www.wri.org/our-work/project/aqueduct
Overall Water Risk Map for the U.S.
As a result, groundwater has also been identified as an important source of freshwater in this region, but demand for water is slowly depleting groundwater
aquifers.
The Overall Water Risk maps presented in this
report take into account the physical quantity
risk10, regulatory and reputational risk11 categories assessed by the World Resources Institute12 .
United States
Washington
OregonIdaho
Nevada Utah
Arizona New Mexico
Colorado
Wyoming
Montana
California
Low risk <10%
Low to medium risk 10-20%
Medium to high risk 20-40%
High risk 40-80%
Extremely high risk >80%
Legacy bottling plants
New territories bottling plants
SouthDakota
Nebraska
Kansas

2017 Sustainable Development Report
17
Environm
ent
Low to Medium
Medium to High
X2
High
* Whilst the bottling plant in Hong Kong is located in a high risk area, its water supply is mostly sourced from the Dongjiang River which is located in a medium to high water risk area.
X2 X3X5 X5
X3X2
X5
X2 X2X5
Legacy bottling plants New territories bottling plants Co-packers
X4
Coca-Cola Bottlers Manufacturing Holdings Limited
Our Approach to Water Management
Our goal is to return to communities and nature the same amount of water that we take out for our beverages
(sales volume), and to improve the communities and environments which house our bottling plants. Our
approach focuses on three guiding principles: Reduce by incremental water efficiency gains, Recycle by
reusing water where we can in the manufacturing process, and having wastewater treatment facilities at all
our bottling plants, and Replenish water via community and watershed management projects with TCCC.
Level of Overall Water Risk
We are committed to wastewater treatment standards which require returning all water that is used in our bottling processes to the environment at a level that supports healthy aquatic life.
We are committed to achieving world class water use performance in each of our bottling locations.
Working with external partners, we are committed to supporting programmes to ensure healthy watersheds and sustainable water for communities with a goal to balance the water used in our finished beverages.
Note: Co-packers are third-party contract bottlers who produce beverages ordered by us.
Bottling plant location
Choosing the right location for our bottling plants
is a critical first step in our water stewardship
responsibility. Before deciding on a location, we
conduct hydrogeological assessments to better
understand water quality and availability risks.
Source Vulnerability Assessments are conducted
by independent experts to determine the potential
risks regarding water quality and availability to our
bottling operations, the local community, as well
as the ecosystem. The findings are then integrated
into our Source Water Protection Plans at each
facility. These plans are reviewed and updated
every five years, or as necessary, to ensure their
validity.

2017 Sustainable Development Report
18
13 Swire Beverages own 41% of CCBMH14 https://www.coca-colacompany.com/press-center/press-releases/the-coca-cola-company-signs-letters-of-intent-to-implement-national-product-
supply-system-in-the-united-states
ScopeWe use water in our finished beverages and in our manufacturing processes. We track comprehensive water metrics for facilities we own and operate. Across our four markets, we sometimes use co-packers, which are third party contract manufacturers. Co-packers must adhere to our strict quality standards.
In Mainland China, we use two types of co-packers. Coca-Cola Bottlers Manufacturing Holdings Limited (CCBMH)13, which operate six self-owned bottling plants as well as a number of production lines in our bottling plants and third party bottlers, and traditional third party co-packers.
In the U.S., we are a member of the National Product Supply Group (NPSG)14. The purpose of this group is to optimise collaboration among all bottlers within the Coca-Cola System in the U.S.
The water stewardship performance data presented in this report is limited to the bottling
Helps to ensure sufficient present and future water supply
Gains understanding of source water quality
Protects company reputation
User
Helps to ensure sufficient water supply for nearby freshwater habitats and their associated organisms
Prevents deterioration of water quality in water features within the basin
Ecosystem
Demonstrates respect for water rights of other stakeholders
Fosters good relationships with surrounding communities and government with a common goal for water stewardship
Community
Benefits of Conducting Source Vulnerability Assessments
Proportion of Production Volume by Co-packers
plants owned and operated by Swire Beverages in 2017, excluding of Shaanxi and also all co-packers, CCBMH included.
In addition to our own bottling facilities, in 2017 we also sourced beverages from nine co-packers, six CCBMH co-packers, as well as being part of the NPSG system. In total this equated to 1,016.8 million litres of beverage product for us in 2017, which accounted for 24% of our in-house production volume.
Market No. of Co-packers
No. of CCBMH
Swire Beverages Production Volume
(million litres)
Co-packer Production Volume
(million litres)
CCBMH Production
Volume (million litres)
Co-packer Proportion %
(including CCBMH)
Hong Kong 0 0 316.4 23.1 4.26 8.6%
Mainland China 6 6 3,376.4 330 500.6 24.6%
Taiwan 3 0 146.4 64.2 0 43.9%
U.S. 0 0 400.3 94.6 0 23.6%
TOTAL 9 6 4,239.5 511.9 504.9 24%

2017 Sustainable Development Report
19
Environm
ent
Water use
Our facilities use water in a variety of production
processes including washing equipment, heating
and cooling, water treatment and other processes.
The key factors affecting how much water is used
during the manufacturing process include the
number of product types produced, the number of
changeovers on the production line, the amount
We track our water efficiency by calculating our water use ratio (WUR), which is the amount of water we need to produce one litre of our beverages. The relatively high WUR in 2016 can be explained by the introduction of the Fuzhou, Hefei and Wenzhou bottling plants to our business. New beverage production lines at these plants required higher water use for cleaning and product trials. Additionally, the increased frequency of changes in product line due to the increased product mix also contributed to the increased WUR in 2016. To mitigate this, we carried out water practice and performance
15 http://www.coca-colacompany.com/stories/2016-water-stewardship
Total Production Volume of Co-packers
= 511.9 million litres
Total Production Volume of
CCBMH
= 504.9 million litres
Total Production Volume of Swire Beverages Bottling Plants
= 4,239.5 million litres76%
12%
12%
Note: (1) Does not include recently acquired plants (2) Groundwater is used at our recently acquired bottling plant in Hainan
Water Supply by Volume and Type (in million litres)
Hong Kong Mainland China(1) Taiwan U.S.(1) Total
Municipal Water 770 5,647 373.3 702.6 7,493
Groundwater - -(2) - - 0
Markets
Water supply type
of water reused on-site, leakage rates, and the
use of hot fill and or aseptic lines. For our legacy
operations, the majority of our water supply
comes from municipal water with a small portion
from recycled water, which we treat and reuse
on-site.
assessments to identify water efficiency opportunities throughout the manufacturing and cleaning process. With established focus groups, we reviewed and improved the accuracy of water meters and optimised meter efficiency. The Coca-Cola System’s goal is to improve WUR by 25% by 2020 through operational improvements, from a 2010 baseline WUR of 2.26. Swire Beverages in 2017 had an overall WUR of 1.77, which is 0.07 from the System’s desired 2020 goal15. Since 2010, we have successfully reduced our WUR by 2.2%, while increasing our production volume by 32%.

2017 Sustainable Development Report
20
1.78
1.76
1.82
1.80
1.81 1.81
1.75 1.751.76
1.77 1.77
1.70
1.741.74
1.72
1.70
1.68
1.66
20122013
20102011
20142015
20162017
3.50
3.00
4.50
4.00
2.50
2.00
1.50
1.00
0.50
Tota
l Pro
duct
ion
Volu
me
(bill
ion
litre
s)
Year
WUR rate Production volume
Wat
er U
se R
atio
(litr
es/ l
itres
of p
rodu
ct)
Sw
ire
Bev
erag
es B
asel
ine
-2.2%+32%
TCCCSystem’s
2020WURGoal1
(1) TCCC System's WUR goal is calculated based on a 25% reduction compared with the 2010 baseline WUR of 2.26
Mainland China
1.67Litres
3,376.4million litres Taiwan
146.4 million litres
2.55 Litres
U.S.
400.3 million litres
1.76 Litres
Hong Kong
316.4million litres
2.43 Litres
WUR(Litres of water used to produce 1 litre of beverage)
Production Volume (Litres)
2017 Water Use Ratio by Market for Legacy Operations:
Water Use Ratio and Production Volume
When broken down by market, our WUR rates in
Mainland China and the U.S. are comparatively
low compared to Hong Kong and Taiwan. The
high WUR rates seen in Hong Kong and Taiwan
can be explained by the diverse mix of products,
which require increased frequencies for cleaning
2016 WUR Rates from Published Sustainability Reports
Bottling Partner WUR Rate
Coca-Cola Amatil 2.08
FEMSA 1.72
Coca-Cola European Partners 1.61
Coca-Cola Hellenic Bottling Company 1.93
The Coca Cola System (overall) 1.96
and rinsing as we change over the product line
more often. This product mix includes a number
of hot fill products (teas, herbal drinks, juice and
milk products), which require more water during
the change process compared to concentrate
beverages, which dominate Mainland China.
Note:

2017 Sustainable Development Report
21
Environm
ent
In 2017, we used approximately 7.5 billion litres16 of water to produce 4.2 billion litres of beverages across
our four markets.
Reduce - Water Efficiency
To increase water efficiency, we apply innovative
water-substituting technologies. Dry lubricants
are used on bottle conveyors in place of soapy
water to move cans and bottles along production
lines. Rather than using water to rinse bottles and
cans, ionised air is used in our air rinse systems as
a substitute. All of our legacy bottling plants in
Mainland China currently use this ionised air system
to rinse bottles.
Switching production lines from manufacturing
of one beverage type to another requires cleaning
and sanitation of tanks and pipes. This is known as
cleaning in place (CIP). This process is responsible
for 2% to 10% of our overall water consumption,
and is viewed as key opportunity to improve our
WURs. Through alternative rinsing methods, such
as pulse rinsing and the use of on/off spray rinse
(instead of continuous spray), we can minimise the
amount of water and energy used. To ensure we
are maintaining sufficiently hygienic conditions that
meet the requirements of both local regulations
and TCCC, we established automatic settings in our
facilities to apply the appropriate amount of water
and cleaning agents.
This year, the U.S. has seen material increases in
the WUR of all production facilities compared with
2016. The WUR rose from 1.71 in 2016 to 1.76 in 2017
2017 Total Water Use
Manufacturing volume: 3.3B litres of water7.5billion litres
Production volume: 4.2B litres of waterManufacturing volume: 3.3B litres of water
7.5billion litres
Production volume: 4.2B litres of water
Note: Sales volume in 2017 was 5.8B litres. The production volume is less than the sales volume due to the contribution of co-packers and the arrangement with the National Product Supply Group in the U.S. See page 18.
16 One billion litres is equal to 1,000 million litres.
due to an increased
number of beverage
flavours and packaging
sizes, which require
more changeovers of
production line and
greater CIP requirements. In 2018, we will work
with each bottler as well as TCCC to identify other
water-saving opportunities to mitigate these WUR
rises.
Across our production facilities, we also invest in
equipment maintenance and upgrades such as
fixing pipes to prevent water leaks and the use of
epoxy floors to reduce amount of water needed for
cleaning.
Recycle – Water Reuse
With proper treatment of what would otherwise
be considered wastewater, we have identified
ways to reduce our consumption of freshwater by
recycling wastewater on-site. Wastewater is reused
in cooling towers, cleaning, irrigation, and toilet
flushing. Depending on the existing water quality
of the wastewater and its intended purpose for
reuse, we will consider the need to treat the water
on-site prior to reuse. All wastewater discharged
by us adheres to TCCC, local, and World Health
Organisation (WHO) standards.

2017 Sustainable Development Report
22
ACHIEVEMENTS & SET BACKS IN 2017
Through CIP optimisation in Hong Kong and Fuzhou, we saved
16.7 million litres of water per year, compared to 2016.
In Mainland China, we save 121.5 million litres of water every year since 2016 by
reusing reverse osmosis water at our Hangzhou, Zhengzhou, Wenzhou, Xiamen and Hefei
bottling plants.
The use of dry lubricants in place of soapy water saves approximately 1.1 million litres of water per year when compared to 2014, however this figure is dependent on the length of
the conveyor.
Reclamation of steam condensation water for cleaning of cooling towers in Hong Kong,
Zhengzhou and Taiwan saved 14.72 million litres of water per year, compared to 2015.
In the U.S., the WUR rose from 1.71 in 2016 to 1.76 in 2017 due to an increased number of
flavours and packaging sizes, which require more changeovers of production line and greater
CIP requirements.
Reuse of CIP rinsing water and PET / aluminium can rinsing water in Taiwan saved
35.3 million litres of water per year, compared to 2014.
1
2
3
4
1
5
Across Hong Kong, Taiwan and Mainland China,
we collected and reused 691 million litres of
recycled water in our manufacturing processes.
This represents a decrease of 214 million litres,
compared to 2016, or 24%. We installed an
integrated system in which PET bottles are blown
and filled in the same machine that rinses bottles
with purified air instead of water. The volume of
untreated water reused in 2017 was therefore less
than in 2016. This mechanism was implemented
across ten bottling plants in Mainland China in
2017, such as, Hefei, Fuzhou and Wenzhou.
The two bottling plants in the U.S. reused over 10
million litres of water within the manufacturing
process in 2017. The bottling plant in Utah sends
backwash water to the condensing tower. Pump
seal cooling lines and the ozone generator cooling
also send water to the condensing tower for reuse.
Together, these two water reuse applications save
approximately 10.2 million liters of water per year.
The bottling plant in Idaho reuses water from
pumps in the syrup room to vaporize carbon dioxide.
The same water is reused again for removing heat
from ammonia compressors. While originally
designed as an energy efficiency project, the project
in Idaho presented an opportunity to save water
while also saving energy. The Idaho plant reuses up
to approximately 360,000 liters of water per year.

2017 Sustainable Development Report
23
Environm
ent
Mainland China
Water Replenishment at Lianhu Park Wetland –
Zhengzhou (2011 onwards)
Since 2011, our Zhengzhou bottling plant has been
partnering with the local community to replenish
a nearby city park. After the construction of
Lianhu wetland in this city park, it suffered
from insufficient water supply and poor water
quality. To mitigate these conditions, we began
replenishing this wetland with treated water.
Every year, approximately 160 million litres
of treated water is diverted to the wetland by
our bottling plant. After more than 10 years of
replenishment work, the project has replenished
the aquifer and restored the habitats and
biodiversity of this degraded urban wetland.
Replenish
Together, TCCC and Swire Beverages’ ambition is that
for every drop of water that goes into our beverages
(sales volume), we will return an equal amount of
clean water back to the local water system – achieving
a net zero impact. Replenishment projects can include
supporting sustainable watershed programmes, such
as source water protection, sustainable agriculture,
water and soil erosion control, and wetland protection
and recovery.
Watershed restoration ensures the long-term
sustainability of water sources in our locations of
operation. Not only is this good for the community
and ecosystem, it is also vital to the viability of our
business. In conjunction with TCCC, Swire Beverages
The Coca-Cola System’s 2017Water Replenishment Ratio
Total Water Usage
In 2017, the Coca-Cola System
replenised 155% of the water used in its global sales volume
ManufacturingVolume
Total Sales Volume
invests in water replenishment projects. Our water
replenishment work allows us to engage with local
stakeholders. Most of these projects are done in
collaboration with TCCC.
In 2017, the entire Coca-Cola System successfully
replenished 155% (257 billion litres) of the water
used in all beverages sold globally. Whilst Swire
Beverages contributed to this accomplishment, our
replenishment rate for projects solely funded by us
has not yet reached the goal of returning 100% of our
sales volume to the local water system.
It has also helped alleviate short-term water
shortages in the city by providing reclaimed
water for alternative uses, reducing the burden
on the municipal water supply. This project has
successfully replenished 3.3% of water used in
our operations in Mainland China in 2017.

2017 Sustainable Development Report
24
Looking Forward
With our acquisitions and re-alignment in Mainland
China and the U.S., it is expected that our production
volume will approximately increase by two-thirds in
2018 compared to 2017.
Whilst our WURs in the U.S. are expected to remain
broadly the same, in Mainland China, our WURs
could rise as the product mix and number of unit
cases (SKUs) expand. This could be partially offset
by incremental improvements being made by water
metering projects and other innovative technologies
adopted, which lead to small but meaningful
incremental gains. In Hong Kong, both total water
consumption and WUR are expected to remain the
same, while in Taiwan with the closure of our plant
in Kaohsiung in mid-2018 - and this volume being
largely moved to our co-packers - total production
volume will fall and WUR will remain consistent
with 2017 levels.
As for our co-packers, including CCBMH, we intend
to commence the engagement process in 2018 to
encourage them to report their WURs, as well as
to share best practices in water efficiency. This
will be a two-way process. For Mainland China
and the U.S., this process is expected to take a
number of years due to our large footprint in these
markets. As for Taiwan, we anticipate this could
take place relatively quickly. We intend to report
some co-packer WURs in our 2018 Sustainable
Development Report.
U.S.
Chalk Creek – Utah / Jesse Creek–Idaho
Replenishment Projects (2013 onwards)
Through collaboration with Bonneville Environmental
Foundation, Trout Unlimited and The Nature
Conservancy, we restored stream flows in Chalk
Creek, Utah and Jesse Creek, Idaho. The trout
migration route had been obstructed by man-made
physical barriers, which were removed to restore
ecosystem connectivity. The irrigation system of
surrounding farmland was upgraded to facilitate
water replenishment. The restoration works protect
thousands of juvenile Bonneville Cutthroat Trout
from being trapped in canals by restoring stream
flows during their migration season. Each year Swire
Beverages contributes by replenishing approximately
272.1 million litres of water, approximately 48% of
water used in our U.S. legacy operations.
Skunk Creek Replenish Project / Fraser
Replenish roject – Colorado (2017 onwards)
Swire Beverages and TCCC jointly invested in
a water replenishment project led by Colorado
Water Trust to restore Skunk Creek, a tributary to
the upper Fraser River watershed in Colorado. The
10-year project will restore water flows to Skunk
Creek and downstream tributaries during low-flow
periods in the summer months. After five years, the
project has replenished an average of 316 million
litres of water annually, equivalent to around 55%
of replenishment for our U.S. legacy operations.

2017 Sustainable Development Report
25
Environm
ent
Our GHG Emissions Profile
TCCC has estimated the share of carbon emissions
across its value chain to produce the "drink in your
hand17". In 2016, the proportion of emissions at each
stage is estimated to come from:
• Ingredient 20%-25%• Packaging 25%-30%• Manufacturing 10%-15%• Distribution 5%-10%• Cold drink equipment 30%-35%
Swire Beverages only has direct control over the
emissions from core business operations. Our
emission sources are shown on the following chart.
CARBON
There is unequivocal evidence that increasing
concentrations of carbon dioxide and other greenhouse
gases (GHGs) in our atmosphere, in part from human
activity, are leading to rising global temperatures. A
changing climate has serious implications for society
and business, with expected impacts including more
frequent extreme weather events, greater water
scarcity and reduced crop yields.
In the face of this challenge, 175 governments have
ratified the Paris Agreement and committed to climate
change mitigation, adaptation and financing, to keep
temperature rises to well below two degrees above
pre-industrial levels. As national targets for emissions
reduction are set, it is imperative that businesses
establish their own decarbonisation plans and targets.
17 https://www.coca-colacompany.com/2016-sustainability-report
Estimated Share of Carbon Across The Coca-Cola System’s Value Chain
Cold drink equipment
30%-35%
Ingredient
20%-25%Packaging
25%-30%Manufacturing
10%-15%
Distribution
5%-10%

2017 Sustainable Development Report
26
2017 SWIRE BEVERAGES CARBON EMISSIONS
Core business operations1,991,316 tonnes CO2e
Not
mea
sure
dSe
e sc
ope
on P
.27
Not
mea
sure
d
11.2%Manufacturing
1.9%Distribution
86.9%Cold drink
equipment (CDE)
222,498 tonnes
37,796 tonnes
1,731,022 tonnes
Supply chain
Ingredients
Packaging - all types
Collection, Recovery and Recycling
Consumers

2017 Sustainable Development Report
27
Environm
ent
To reduce the emissions over which we have direct control, we must accurately capture and measure our GHG footprint, explore opportunities to improve energy efficiency, and maximise our use of renewable energy. In line with SwireTHRIVE, our long-term ambition is to become a sector leader in energy efficiency and emissions reductions.
We monitor our performance in energy efficiency by tracking our energy use ratio (EUR), the amount of energy needed to produce one litre of beverage. This is a performance metric which TCCC requires its global bottling partners to monitor.
We also recognise our responsibility to reduce emissions across the entire lifecycle of our products, and work to positively influence and collaborate with our suppliers, customers and other stakeholders in our value chain.
Scope & Methodology of Calculation
The data disclosed in this report covers only part of our Core Business Operations for 2017 legacy operations only, segmented under manufacturing, distribution and CDE. This can be clarified as follows:
Scope 1: direct emissions generated from fuel combustion in the boilers in our owned and managed bottling plants, owned and operated vehicles, and fugitive emissions from refrigerants used in our CDE.
Scope 2: indirect emissions, which include emissions from purchased electricity in all owned and operated bottling plants and warehouses. Our Scope 2 calculations omit emissions from purchased steam (see Energy Source for Boilers in Mainland China table on P. 31), purchased electricity in our owned and managed distribution centre’s, co-packers, CCBMH, contractors and other third parties involved in distribution. It also excludes the electricity consumed by our CDE at our customers' premises.
Energy and Carbon in our Four Markets
The fuel types used to generate electricity will influence the carbon footprint of electricity users. More fossil fuels mean more GHG emissions generated per unit of electricity. The fuel mix differs in each of our operating markets. While coal is the most used energy source in the western U.S.18 , several states generate a significant proportion of their electricity from renewables including hydroelectric, solar, wind, geothermal and biomass. These states include Idaho, Nevada, Oregon and Washington.
Hong Kong, Mainland China and Taiwan also generate most of their electricity from coal. Each of these markets has its own national emissions reduction targets. In Hong Kong, the Climate Action Plan 2030+ includes phasing out coal and replacing it with natural gas and other cleaner, non-fossil fuel sources19.
Mainland China’s 2020 climate goals aim to reduce emissions by capping coal consumption and speeding up the development of clean energy20. In Taiwan, the New Energy Policy and GHG Emission Reduction and Management Act aim to reduce emissions by 50% by 2050 and increase the amount of renewable energy generated by 202521.
Scope 3: Other indirect GHG emissions as a consequence of the activities of the company, but occuring from sources not owned or controlled by the company. Currently we do not capture this data.
Calculation methods: For Scope 1 and 2 emissions which we capture, we use the calculation methodology from The Greenhouse Gas Protocol. For the fugitive emissions from refrigerants used in our CDE, we use the methodology from ifeu (Institut
Fur Energie – und umweltforschung heidelberg).
EUR is a metric solely capturing the Scope 1 and Scope 2 emissions within the four walls of our owned and managed bottling plants from Scope 1 and 2 parameters as mentioned above.
18 Includes Swire Beverages’ operating area in the western U.S., covering Arizona, California, Colorado, Idaho, Nebraska, Nevada, New Mexico, Oregon,
South Dakota, Utah, Washington and Wyoming.19 http://www.enb.gov.hk/sites/default/files/pdf/ClimateActionPlanEng.pdf20 http://unfccc.int/files/national_reports/non-annex_i_parties/biennial_update_reports/submitted_burs/application/pdf/chnbur1.pdf21 https://www.moea.gov.tw/mns/ietc_e/content/Content.aspx?menu_id=21511

2017 Sustainable Development Report
28
Data sources:
Hong Kong: Environment Bureau (Data from 2012):
http://www.enb.gov.hk/sites/default/files/en/node2605/Consultation%20Document.pdf
Mainland China: MDPI (2017) - data extracted for 11 provinces and Shanghai Municipality:
http://www.mdpi.com/2071-1050/9/11/2115/pdf
Taiwan: U.S. Energy Information Administration (Data from 2015):
https://www.eia.gov/beta/international/analysis.cfm?iso=TWN
Western U.S.: U.S. Energy Information Administration (2015) – data extracted for 13 States:
https://www.eia.gov/state/
Energy Mix in our Four Markets where We Operate
Southern Mainland ChinaEnergy consumption (Excluding Zhanjiang)
TaiwanTotal electricity generation
Hong KongFuel mix
Western U.S.Energy Production
Nuclear and renewables14%
Nuclear electric power3%Biofuels
2%
Renewable energy13%
Coal37%
Natural Gas29%
Crude oil16%
Natural Gas9%
Petroleum19%
Coal58%
Others10%
Nuclear power14%
Natural gas31%
Coal45%
Others2%
Nuclear power23%Natural gas22%
Coal53%

2017 Sustainable Development Report
29
Environm
ent
Energy Use Ratio and Production Volume
0.31
0.29
0.320.31
0.32
0.31
0.340.33
20122013
20102011
20142015
20162017
Tota
l Pro
duct
ion
Volu
me
(bill
ion
litre
s)
Year
Ener
gy U
se R
atio
(meg
ajou
les/
litre
of p
rodu
ct) +6.5%
EUR rate Production volume
0.35
0.34
0.33
0.32
0.31
0.30
0.29
0.28
0.27
0.26
4.50
4.00
3.50
3.00
2.50
2.00
1.50
1.00
0.50
Reducing Emissions from our Core Business Operations
Manufacturing
22 Leadership in Energy and Environmental Design (LEED) is a rating system devised by the United States Green Building Council
Manufacturing contributes 11.2% of the total GHG
emissions from our operations, and is responsible
for 45% of our total direct energy consumption.
Energy used in the manufacturing process is
primarily purchased electricity, a small amount
of natural gas and purchased steam. In 2017, we
continued converting all boilers to natural gas and
upgrading facilities to take advantage of energy
recovery. We use renewable energy in some of our
plants, and are exploring better design for new
bottling plants by aiming for LEED green building
certification22.

2017 Sustainable Development Report
30
Historic Energy Use Ratio by Market
Ener
gy U
se R
atio
(meg
ajou
les/
litre
of p
rodu
ct) 1.0
0.9
0.8
0.7
0.6
0.5
0.4
0.3
0.2
0.1
0
TaiwanHong Kong U.S.Mainland China
2010 2011 2012 2013 2014 2015 2016 2017
Since 2010, our overall EUR has increased by 6.5%.
In 2017, our EUR across all markets was 0.33
megajoules per litre of product. Energy efficiency
in all markets remained relatively stable over the
last seven years.
Our bottling plants in Mainland China and the
U.S. have lower EUR rates compared to those
in Taiwan and Hong Kong. This is a result of the
simpler product profile, which require less energy
during production. In Hong Kong and Taiwan, our
product profile includes teas, which require more
energy in the production process for cleaning and
pasteurisation.
Hong Kong
0.54EUR (MJ/L)
316.4million litres
Mainland China
0.30EUR (MJ/L)
3,376.4million litres
Taiwan
0.77EUR (MJ/L)
146.4million litres
U.S.
0.23EUR (MJ/L)
400.3million litres
EUR (Megajoules of energy used to produce 1 litre of beverage)
Production Volume (Litres)
2017 Energy Use Ratio by Market

2017 Sustainable Development Report
31
Environm
ent
Converting Boilers from Oil to Natural Gas
Boilers are a critical piece of equipment within
manufacturing plants. Hot water is needed for
dissolving sugar, producing teas and soya bean-based
drinks, and in the CIP processes. Our boilers are
powered by a dedicated fuel source23 . Over the past
decade, we have been gradually converting oil-fired
boilers to run on natural gas. This conversion process
has significantly reduced the GHG emissions
and air pollutants generated. As of 2017, most of
the bottling plants have been converted. Five of
our bottling plants purchase a certain amount of
steam from a third party to supplement their boiler
capacity, when required.
Energy Source for Boilers in Mainland China
Guangdong Zhejiang Anhui Jiangsu Fujian Henan
Guangzhou Huizhou Hangzhou Wenzhou Hefei Nanjing Xiamen Fuzhou Zhengzhou Luohe
No. of Bottling Plants
1 1 1 1 1 1 1 1 1 1
Natural Gas (2)
Purchased Steam(1)
Note:
(1) Our energy supplier generates steam from coal, which is then piped to our bottling plants upon purchase
(2) Our Huizhou plant has two boilers, its main boiler was converted from biomass to natural gas in 2017, the backup boiler remains diesel powered
As the conversion process took place incrementally
over several years, we were unable to fully quantify
the associated emissions reductions. Using our
Xiamen bottling plant as a test case, we calculated
that converting from oil to natural gas boilers
enabled us to reduce carbon emissions by 593 tonnes
annually. Another benefit of this upgrade is the
annual reduction of sulphur dioxide and nitrogen oxide
PARTNERSHIP WITH TSINGHUA UNIVERSITY
In 2017, Swire Beverages partnered with the Building Research Centre of Tsinghua University
to launch a three-year programme to explore energy efficiency opportunities within our bottling
plants. With RMB 1 million of funding from Swire Beverages, Tsinghua University is providing
on-site monitoring, analysis and research on electricity use for five of our bottling plants across
Mainland China in Hangzhou, Huizhou, Luohe, Guangdong and Nanjing.
Initial studies at the Huizhou plant show that significant improvements can be made in the areas of
refrigeration and high-pressure air compressor production areas (PET blowing, PET preform and
production line). These account for around 68% of the energy consumption of the plant.
23 Hong Kong uses electricity at night and natural gas during the day as this is the most economical
emissions, which were reduced by 8.2 tonnes and 1.5
tonnes respectively.
In Taiwan and Zhengzhou, Mainland China, condensed
water from steam generated by the boilers is fed back
into the boiler system rather than being discharged
into drains. As this water is already warm, less energy
is required to heat it, reducing energy consumption.

2017 Sustainable Development Report
32
Tsinghua University Study: 2016 Electricity Consumption at Huizhou Plant
Efficient Lighting and Air Conditioning Systems
For operations of our scale, seemingly minor
systems such as lighting and air conditioning can
substantially impact our overall environmental
performance if not properly managed. Each bottling
plant is responsible for managing the efficiency of
its own systems. Measures implemented to improve
lighting efficiency include the use of LED and T5
lights. For air conditioning systems, some bottling
plants conduct energy efficiency assessments, and
if energy efficiency is below 80% we will engage
the manufacturer to conduct maintenance work to
improve energy efficiency.
Using Renewable Energy
The renewable energy we use at bottling plants
is generated on-site. Currently, we have 4 bottling
plants that use at least one type of renewable
energy. Solar energy from photovoltaic panels
is the most common. In addition to photovoltaic
panels, solar heater systems are used to use the
sun’s energy to heat water. For some bottling plants
in Mainland China, methane gas is captured from
the wastewater treatment process and used to
produce steam, minimising the amount of energy
purchased for our boilers.
4 bottling plants
Saving
HK$ 748,000 every year
Generating approximately
6 million kilowatt hour of renewable energy per year
30
25
35
14%
5%
2%1%
20
15
10
05
001% 1%
6%
68% of electricity consumption
Ref
rige
rati
on
Low
Pre
ssur
e C
ompr
esso
r
Ligh
ting
Sug
ar D
isso
lvin
g
Wat
er T
reat
men
t
11%
29%28%
PE
T B
ottl
e B
low
ing
Man
ufac
turi
ng
PE
T B
ottl
e pr
efor
m
Fork
lift
Cha
rgin
g
Com
mon
Are
as
Col
d S
tora
ge
2%Perc
ent o
f Ele
ctric
ity C
onsu
med

2017 Sustainable Development Report
33
Environm
ent
Applying for LEED Certification
LEED, or Leadership in Energy and Environmental Design, is an internationally recognised standard to evaluate the environmental performance of a building and encourage market transformation towards sustainable design. Luohe is our first certified bottling plant which received
LEED Platinum certification in 2011. Since then, three more bottling plants have obtained Silver and Gold level certifications, one bottling plant in the U.S. and two in Mainland China. Through this process, we incorporate a number of different improvements in our energy and other environmental performance areas during both construction and operation of the plant.
Bottling Plant LEED Certification
Level
Performance Highlights
Luohe, Mainland China Platinum Emission reduction of CO2 is equivalent to 1,200 – 1,500 tonnes per year and conserves 25,000 tonnes of water annually.
Hefei, Mainland China GoldBuilding design incorporates sustainable components including energy efficiency and careful sourcing of construction materials. Solar roof panels are installed to provide clean energy to be used on-site.
Draper, Utah, U.S. SilverSixty-two percent of building materials are manufactured and extracted within 805km from the bottling plant. Thirty-one percent of the building materials were made from recycled materials.
Fuzhou, Mainland China Silver Uses green materials, such as grass planting brick and permeable brick to minimise and reflect heat from the outside.
Upgrading our Vehicle Fleet
With the support of a Hong Kong government subsidy for electric vehicles (EVs), eight vehicles owned and operated by Swire Beverages in Hong Kong have been converted to hybrids and EVs.
Currently, Hong Kong is the only market that owns Euro VI trucks. Recognising the improved environmental performance when compared with other vehicle models, we hope to convert older trucks to Euro VI in all markets.
DistributionDistribution covers our owned and managed vehicles that we use for primary transport associated with delivering our beverages from bottling plants to our distribution centres or customers. None of our GHG emissions associated with the operations in our distribution centres, third party distribution centres, third party primary transportation and all secondary transportation (i.e. from our customers to the end consumer) are measured. Distribution under what we measure, as laid out under Scope, is responsible for 1.9% of our overall carbon emissions. Bottling Plant
Electric 2 0 0 0
Hybrid 6 0 0 46
EURO V / Tier2
129 57 24 723(1)
EURO VI / Tier3
11 0 0 97(1)
U.S.Taiwan
The U.S. uses different vehicle classifications under the U.S. Environmental Protection Agency. The Tier 2 regulation introduced more stringent numerical emission limits relative to the previous Tier 1 requirements, and a number of additional changes that made the standards more stringent for larger vehicles. Under the Tier 2 regulation, the same emission standards apply to all vehicle weight categories, i.e. cars, minivans, light-duty trucks, and sport utility vehicles have the same emission limit.
Hong Kong Mainland China
Note:
(1)
Number of Vehicles by Type at each Market

2017 Sustainable Development Report
34
PARTNERSHIP WITH THE HONG KONG POLYTECHNIC UNIVERSITY
Through collaboration with Hong Kong Polytechnic University’s Electrical Engineering Department and Green Power Industrial Limited, we have developed and installed solar panels on four of our trucks to power the air conditioning systems. In summer, the air conditioning systems use solar power to keep temperatures inside the truck cool for drivers. As the trucks move, solar panels collect and store energy in a battery to power a stand-alone electric air conditioner that can be engaged when the engine stops. Batteries allow solar energy to be stored, allowing the system to operate on cloudy or rainy days.
Route Optimisation
“Road Show” is a transport route optimisation software we use across all markets to improve the time and fuel efficiency of our beverage transportation process. By inputting delivery locations and volumes of products to be delivered, this software maps out the shortest total distance for the route.
Cold Drink EquipmentCold Drink Equipment (CDE) covers coolers, vending machines and fountain equipment. Carbon emissions associated with CDE result from electricity used to power these machines24 and in the older models the ozone-depleting substances (ODS) they use as refrigerants25, including chlorofluorocarbons (CFCs) and hydrofluorocarbons (HFCs). In a total lifecycle picture of carbon emissions from CDE, build and end-of-life management would also be taken into account. The emissions generated from our CDE under what we measure, as laid out under Scope in this section, is responsible for 86.9% of our overall carbon footprint.
24 The electricity used by these machines is paid for by our customers and therefore we do not capture these emissions.25 We capture the emissions of the ozone-depleting substances given off by these machines.
6
5
7
8
9
4
3
2
1
0
CO2/100 NOX
NOX to CO2 ratio
75% reduction of NOx from Euro I to Euro V
I II III IV V VI
Euro Standard
NO
x (g
/kw
h)
3
2.5
3.5
4
4.5
5
2
1.5
1
0.5
0
g/km
Euro V
4.8%
Euro VI
0.2%
NOx Emission Requirements for Euro Standard Trucks
Comparing Real-world Gaseous Emissions from Euro V and Euro VI Diesel Trucks
Data Source:https://www.dieselnet.com/standards/eu/hd.php
Data Source:“European Union: Emissions of toxic nitrogen oxides by Euro 6 diesel passenger cars are more than double modern diesel trucks”. https://www.theicct.org/news/press-release-EU-NOx-emissions-HDV-LDV-comparison
Note:In normal and everyday operation, Euro VI diesel trucks emit less NOX and CO2 than Euro V diesel trucks. The introduction of Euro VI standards effectively controls exhaust emissions and reducing the environmental impacts of transport.

2017 Sustainable Development Report
35
Environm
ent
Upgrading Coolers and Vending Machines
Older models of coolers contain CFC and HFC refrigerants which are ODS and considered potent GHGs. Since 2008, we have been phasing out CDE which use CFCs and HFCs, but today this equipment still makes up 74% of our total CDE. We align our procurement process with TCCC's 2011 policy, which states: by the end of 2015, new CDE purchases of cooler size larger than 300L, vending machines and fountains should be 100% HFC-free; by the end of 2017 new purchases that are larger than 150L should be 100% HFC-free; and by the end of 2020 all new purchases should be 100% HFC-free. Today this means CDE which use hydrocarbons (HCs) as refrigerants, combined with lower electricity usage.
Number of Cold Drink Equipment by Type in Each Market in 2017
Hong Kong Mainland China Taiwan U.S.
Coolers 4,635 426,071 11,904 8,705
Vending machines 6,418 6,435 3,728 20,614
Dispensers 1,560 12,519 4,961 6,746
TOTAL 12,613 445,025 20,593 36,065
Proportion of CDE 2% 87% 4% 7%
HCsNH3 CO2
HFC
Future? Natural refrigerants
CO2 NH3
SO2 HCs
HCFCCFCNH3
1834ethyl-ether
(R610)
KyotoProtocol1997 2017
MontrealProtocol1987
1990CFC
NH3 CO2
HCs
HFC(CFC)HCFC
NH3
1930
1950
methyl-chloride
Market CFC HCFC HFC CO2 HC No Refrigerant
Total
Hong Kong 1,665 1,216 5,980 2,870 39 1,121 12,891
Mainland China (Legacy only) 0 0 34,598 110,427 0 0 445,025
Taiwan 0 0 17,048 4,511 40 0 21,599
U.S. (Legacy only) 13,693 0 77,678 979 107 34,990 127,447
Total 15,358 1,216 435,304 118,787 186 36,111 606,962
Market % of CDE with HC or CO2
% of CDE with HFCs
Hong Kong 23% 69%
Mainland China (Legacy only) 25% 75%
Taiwan 21% 79%
U.S. (Legacy only) 1% 72%
Total 20% 74%
Performance Highlights
Generating approximately
6 million kilowatt-hour of electricity per year from renewable sources on-site
Four LEED Certified plants (three in Mainland China and one in the U.S.)
26%of cold drink equipment (CDE) are HFC and CFC-free
Data source
Refrigerants: There is still no vision for sustainable solutionshttps://www.sciencedirect.com/science/article/pii/S0140700717305066
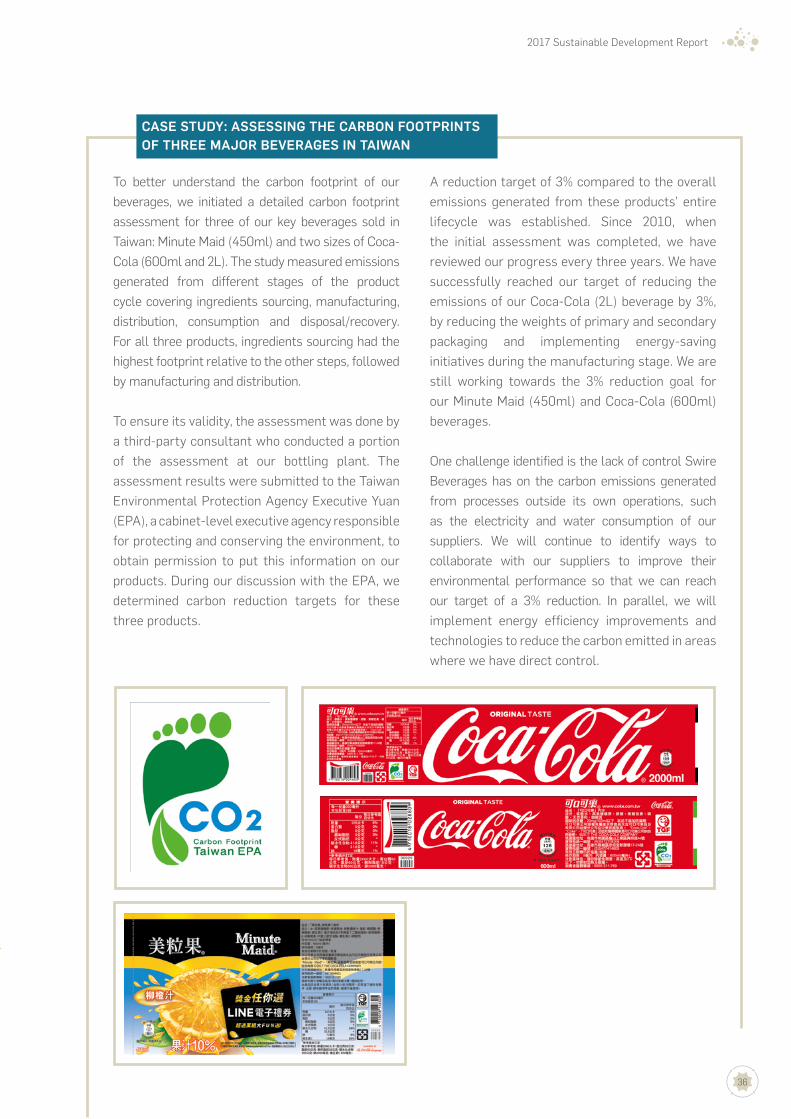
2017 Sustainable Development Report
36
CASE STUDY: ASSESSING THE CARBON FOOTPRINTS OF THREE MAJOR BEVERAGES IN TAIWAN
To better understand the carbon footprint of our beverages, we initiated a detailed carbon footprint assessment for three of our key beverages sold in Taiwan: Minute Maid (450ml) and two sizes of Coca- Cola (600ml and 2L). The study measured emissions generated from different stages of the product cycle covering ingredients sourcing, manufacturing, distribution, consumption and disposal/recovery. For all three products, ingredients sourcing had the highest footprint relative to the other steps, followed by manufacturing and distribution.
To ensure its validity, the assessment was done by a third-party consultant who conducted a portion of the assessment at our bottling plant. The assessment results were submitted to the Taiwan Environmental Protection Agency Executive Yuan (EPA), a cabinet-level executive agency responsible for protecting and conserving the environment, to obtain permission to put this information on our products. During our discussion with the EPA, we determined carbon reduction targets for these three products.
A reduction target of 3% compared to the overall emissions generated from these products’ entire lifecycle was established. Since 2010, when the initial assessment was completed, we have reviewed our progress every three years. We have successfully reached our target of reducing the emissions of our Coca-Cola (2L) beverage by 3%, by reducing the weights of primary and secondary packaging and implementing energy-saving initiatives during the manufacturing stage. We are still working towards the 3% reduction goal for our Minute Maid (450ml) and Coca-Cola (600ml) beverages.
One challenge identified is the lack of control Swire Beverages has on the carbon emissions generated from processes outside its own operations, such as the electricity and water consumption of our suppliers. We will continue to identify ways to collaborate with our suppliers to improve their environmental performance so that we can reach our target of a 3% reduction. In parallel, we will implement energy efficiency improvements and technologies to reduce the carbon emitted in areas where we have direct control.

2017 Sustainable Development Report
37
Environm
ent
Moving Forward
Through our partnership with Tsinghua University,
we have identified ways to reduce our manufacturing
energy footprint through appropriate capital
expenditure around improvements in chillers, an
expanded energy metering system, and retrofitting
of equipment around high-pressure air compressor
production (blowing, preforms).
We also plan to start expanding the coverage of
the data we collect to include co-packers and third
party hauliers.
For our CDE, we expect to make positive steps to
speed up the phase out of all CFC and HFC CDE,
and order only the most energy efficient HFC-
free equipment – namely hydrocarbon-based
CDE. We will encourage the original equipment
manufacturers (OEMs) to embrace high levels of
recyclability in the components of the equipment,
models which need less electricity to operate, as
well as looking to put in place an audited end-of-life
management programme across all four territories.
Finally, in Hong Kong and Mainland China, expected
shifting of the fuel mix from coal to natural gas,
nuclear and renewables will have a large positive
impact on our overall carbon footprint.

2017 Sustainable Development Report
38
PACKAGING AND WASTE MANAGEMENT
The speed at which public concern over plastic
pollution in our oceans has resulted in actions from
businesses and policymakers is unprecedented.
Recent studies have revealed the extent of the
problem - an estimated 8 million tonnes of plastic
waste leaks into our oceans every year, posing a
threat to marine life that become entangled or
mistake it for food, and ultimately finding its way
into our global food system. There is a need for
radical change. Rather than being discarded after
use, plastics can be recovered and recycled to be
used as raw materials for new products, creating a
circular economy.
Swire Beverages will place a great deal of
attention in managing the impact we, as a
beverage bottler, have in plastics consumption.
Packaging is an integral part of our business and
is used at all stages of manufacturing, distribution,
merchandising and storage of our beverages. We
need packaging not only to protect beverage quality
and ensure consumer safety, but also as a medium
for transporting small beverage containers in bulk.
Working as part of The Coca-Cola System, we
recognise that mitigating the environmental impacts
of packaging requires a holistic approach across
our greater value chain. Going beyond innovative
packaging design and further lightweighting, we
are engaging consumers, and participating in
policy advocacy and partnerships along our value
chain to address this issue26 . Faced with growing
volumes and shrinking serving sizes, both resulting
in increased packaging, these measures help
minimise the recyclable materials that end up in
landfills and in the natural environment.
26 https://www.coca-colaindia.com/stories/sustainability/packaging-recycling/our-approach-to-sustainable-packaging

2017 Sustainable Development Report
39
Environm
ent
Our Packaging Types and Limitations in Recovery after Use
Primary packaging
Material that first envelops the product and holds it. It applies to product volumes of up to 3L. This level of packaging has direct contact with the beverage content – i.e. bottle, label, closure, closure ring.
Secondary packaging
Used to group individual beverage containers together
Other
Other packaging materials, including festive merchandise packaging and giveaways during holiday periods and marketing materials associated with shop signage, calendars, notebooks, clothing, umbrellas, and others.
Tertiary packaging
Packaging that is used for bulk handling (steel drums for juices, slip trays, pallets, hard plastic crates, etc.), warehouse storage and shipping.
We have four main categories of packaging: primary, secondary, tertiary and 'other' to ensure product safety and uphold beverage quality.

2017 Sustainable Development Report
40
27 There would be some loss in both secondary and tertiary packaging in and around third party managed distribution and warehousing. 28 This includes a mix of tin and steel29 PET, type 1 and PP, type 5
Primary and 'other' packaging are the most difficult
to manage and track at the end of their lifecycle,
which falls outside of our direct control. Doing so
would require collecting accurate verifiable data on
the discarded volume, method of discard, collection
and recovery rates and volume loss into the
environment. It would also require integrating local
municipal waste collection with recovery systems
for recyclables. This must then be supported by
processes that convert these materials back into
raw materials to be reused.
Secondary and tertiary packaging recovery rates
within our manufacturing facilities are relatively
easier to manage and track as they fall under our
direct control27. We ensure these materials are
separated by type at our bottling plants, and then
given or sold to recyclers.
ScopeWe capture data for all primary, secondary and tertiary packaging used in the manufacturing and distribution process, by type, volume and market in the operations managed by us. Outside primary packaging, packaging information of our co-packers is not captured. Currently, we do not have accurate data for ‘other’ packaging, nor for what happens to the single-use primary packaging once the beverage has been consumed. In this section, we will report on the packaging information for our legacy operations only, and state what we can verify is the status on sold packaging post consumption.
2017 Primary Packaging Volumes
The raw materials used in our packaging include a
range of plastics, paper and cardboard, aluminium, tin
plate28 and glass. Aluminium and plastic, in the form of
Polyethylene terephthalate (PET) and Polypropylene
(PP)29 , are our most commonly sourced materials for
primary packaging. This is directly correlated with our
beverage container mix, which is dominated by plastic
bottles and aluminium cans. In 2017, our business
sourced 149,813 tonnes of raw materials to produce
our primary packaging.

2017 Sustainable Development Report
41
Environm
ent
2017 Overall Proportion of Primary Packaging based on Sales Volume
Note: Steel cans used in cold coffees are excluded as these products are manufactured by our co-packers. (1) Trade names: Tetra Pak and Combibloc
(2) RGB: Returnable Glass Bottles, NRG: Non-returnable Glass Bottles
Plastic Aluminium Can
Aseptic Fibre Pack(1)
RGB + NRG(2)
50%42% 1%
7%
2017 Total Material Used for Primary Packaging
120,000
100,000
80,000
60,000
40,000
20,000
0
Wei
ght (
tonn
es)
111,293
PET PP
10,3694,290
New Glass Bottle
22,434
AluminiumCan
Aseptic Fibre Pack
1,427
120,000
100,000
80,000
60,000
40,000
20,000
0
110,051
PET Plant PET
438 804
rPET
10,369
PP
22,434
AluminiumCan
1,427
Tetra PakNew Glass bottle
4,290
Wei
ght (
tonn
es)
Material Type
Material Type

2017 Sustainable Development Report
42
Note:
(1) RBG: Returnable Glass Bottles; NRG: Non-returnable Glass Bottles
(2) Post Mix BIB: Post Mix Bag in Box, is a plastic bladder made with type 4 LDPE Polythyelene in a cardboard box.
2017 Primary Packaging Type by Weight
Market PET HDPE PP RGB/NRG(1) Aluminium can
Aseptic fibre packs
Post Mix BIB(2)
Hong Kong 38% 4% 5% 4% 36% 12% <1%
Mainland China 78% 5% 7% 3% 8% - -
Taiwan 66% - 1% 8% 22% 3% <1%
U.S. 36% - 6% - 50% - 1%
Overall Legacy Operations 70% 4% 7% 3% 14% 1% <1%
Just less than 80% of our container mix30 for primary packaging is composed of plastics (PET, and PP),
followed by a smaller portion (14%) of aluminium cans, and finally with glass and aseptic fibre packs,
together making up of less than 5%.
30 Calculated by the volume of materials purchased to manufacture packaging

2017 Sustainable Development Report
43
Environm
ent
Total Materials Used for Secondary and Tertiary Packaging
Mainland China
Hong Kong
Taiwan U.S.
Corrugated Box, Paper Tray 10,223 3,620 2,927 0
Shrink film 9,325 507 412 194
12,000
10,000
8,000
6,000
18,000
16,000
14,000
4,000
2,000
0
Wei
ght (
tonn
es)
Corrugated Box, Paper Tray Shrink film
MainlandChina
Hong Kong
Taiwan
MainlandChina
Hong Kong
Taiwan
U.S.
2017 Proportion of Primary Packaging Compared with Secondary Packaging (Tonnes)
Total Weight of Materials Used for Secondary and Tertiary Packaging (Tonnes)
Proportion of Primary Packaging Compared with Secondary Packaging (Metric Tonnes)
Primary PackagingSecondary Packaging
27,208
148,386
Proportion of Primary Packaging Compared with Secondary Packaging (Metric Tonnes)
Primary PackagingSecondary Packaging
27,208
148,386

2017 Sustainable Development Report
44
2017 Details on Primary Packaging Types Used in Hong Kong
Is it technically recyclable?
Percent of recycled
content used
Collection & Recovery rate
Is there local recycling
infrastructures?
Is it crushed locally?
Is it baled and exported for recycling?
Returnable Glass Bottle Yes 0% 95% partial 5% -
Non-returnable Glass Bottle
Not produced in Hong Kong
PET Yes 0% 7% No - 7%
Carboy Yes 0% 95% No - -
Aseptic fibre pack Partial 0% - No - -
Tin Yes 0% - No - -
Aluminium Can Yes 50-60%
informal sector - thought to be approximately
50%, but unverifiable
No - ~50%
Post mix BIB No 0% - No - -
Pouch No 0% 0% No - -
Recyclability of Primary Packaging
100% Recyclability
Our aim is for all of our primary packaging to be 100% recyclable by 2025. Today, most of the packaging we use is 100% recyclable, except for aseptic fibre packs31 and post mix bag in box (BIB). The challenge is that even if our packaging can technically be recycled, without sufficient local infrastructure and consumer awareness or incentives, the packaging may not be recovered and hence not recycled.
In the tables below, we have tried to map out the recycling landscape in our four markets based on publicly available information. We do not have reliable data on post consumption collection and recovery outside of the RGB and carboy we recover ourselves by reverse logistics. We have left blanks where we were unable to identify a reliable data source.
Note: (1) The loss in collection and recovery of RGB and Carboy is due to breakage, unacceptable scuffing or loss by customer
(2) With the implementation of Operation National Sword on January 1, 2018, Hong Kong can no longer export baled PET to Mainland China
(3) Tetra Pak, one of the brands of aseptic fibre pack, is FSC approved in Hong Kong
(4) The Hong Kong Environmental Protection Department (EPD) only has municipal solid waste data published up to 2016 (http://www.epd.
gov.hk/epd/english/environmentinhk/waste/data/stat_treat.html) and it does not provide clarity on PET exported volumes. 157 tonnes per
day of PET (bottles, trays etc) go to landfill, and through our field research, we believe 10 tonnes per day were exported for recycling
predominately into flake/pellets, which is being consumed by the polyester industry.
(5) RGB is given to a glass recycler who crushes it. The glass is not part of a closed loop, but is down-cycled.
(6) We do not produce or sell products packaged in pouch
31 Inclusive of the plastic straw, straw bag and associated glue to keep the bag on the aseptic fibre pack.

2017 Sustainable Development Report
45
Environm
ent
2017 Details on Primary Packaging Types used in Mainland China
2017 Details on Primary Packaging Types used in Taiwan
Is it technically recyclable?
Percent of recycled content used
Collection & Recovery rate
Is there local recycling
infrastructures?
Recyclable Glass Bottle Yes 0% 95% Yes
Non-recyclable Glass Bottle Not produced in Mainland China
PET Yes 0%informal sector -
thought to be high, but unverifiable
Yes - to be pellet and flake - mainly for the
polyester industry
Carboy Yes 0% 95% Yes - informal
Aseptic fibre pack - 0% 0% partial
Tin Yes 0% 0% Yes
Aluminium Can Yes 0%informal sector -
thought to be high, but unverifiable
Yes
Post mix BIB No 0% - -
Pouch - - - -
Is it technically recyclable?
Percent of recycled content used
Collection & Recovery rate
Is there local recycling
infrastructures?
Recyclable Glass Bottle Yes 0% 99% Yes
Non-recyclable Glass Bottle Not produced in Taiwan Yes
PET Yes 0% 74% Yes
Carboy Yes 0% 99% Yes
Aseptic fibre pack - 0% 25% - official data, it should be higher;
mainly for paper-
Tin Yes 0% 95% -
Aluminium Can Yes 0% 95% -
Post mix BIB No 0% 0% No
Pouch - - - -
Note: (1) CCBMH, one of our co-packers, produces beverages in asceptic fibre pack and coffees in tin cans (2) The loss in collection and recovery in RGB and Carboy is due to breakage, unacceptable scuffing or loss by customer (3) Food grade packaging laws prohibit the use of recycled materials (4) Collection and recovery of RGB and Carboy is done by ourselves. The figures provided are based on our calculations (5) We do not produce or sell products packaged in pouch
Note: (1) The loss in collection and recovery in RGB and Carboy is due to breakage, unacceptable scuffing or loss by customer (2) Food grade packaging laws prohibit the use of recycled materials (3) We do not produce or sell products packaged in pouch

2017 Sustainable Development Report
46
2017 Details on Primary Packaging Types used in U.S.
Is it technically recyclable?
Percent of recycled content used3
Collection & Recovery rate4
Is there local recycling
infrastructures?
Recyclable Glass Bottle - - - -
Non-recyclable Glass Bottle Yes 26% 40% Yes
PET Yes 4% 30% No
Carboy - - - -
Aseptic fibre pack - - - -
Tin - - - -
Aluminium Can Yes 70% 49% No
Post mix BIB No 0% - No
Pouch - - - -
Note: (1) The loss in collection and recovery in RGB and Carboy is due to breakage, unacceptable scuffing or loss by customer (2) in our operations we manufacture no glass packaging's, but do sell NGB. (3) Coca-Cola Bottlers Sales and Service (CCBSS) is the source for recycled content. (4) American Beverage Association is the source for recovery percentage (U.S. average). (5) We do not produce or sell products packaged in pouch
Use of Recyclable Materials in our Primary Packaging
One of the ways that we can promote recycling is by creating a market for recycled materials. We can do this by using recycled input materials to make our primary packaging. Today, in Mainland China and Taiwan, the use of recycled materials in food grade packaging is forbidden. In our other two markets, Hong Kong and the U.S., it is allowed, but to date is only used in our aluminium cans. We are looking at changing this, and specifically in the use of recycled PET (rPET) in Hong Kong and the U.S. A secondary benefit in the use of rPET and / or recycled aluminium, is a reduction in the carbon emissions over a lifecycle basis.
Reduce: Innovative Primary Packaging Design
Over the past decade, TCCC has been engaging suppliers and universities to explore ways to reduce the overall amount of material used in our primary packaging. This process is known as ‘lightweighting’. In Hong Kong, Mainland China and the U.S., we have successfully decreased the weight of our PET containers, bottle caps and bottleneck lengths for packaged water.
The lightweighting results for bottles varies between brands and beverage volume. As each beverage container of three water brands, Bonaqua (Hong Kong), Ice Dew (Mainland China) and Dasani (U.S.) has a slightly different shape, the lightweighting results differ. By volume, generally small bottles (up to 500ml) tend to yield a higher reduction when compared bottle sizes larger than 500ml.
There are fewer opportunities for lightweighting for containers which hold sparkling beverages and hot fill products (those which require heating, including teas), due to the high pressure exerted on these

2017 Sustainable Development Report
47
Environm
ent
containers from carbonation or heating, significant lighweighting reductions would compromise safety and quality of the product. That said, moving from hot fill lines to alternative manufacturing
In Hong Kong, to reduce the amount of aluminium used, we redesigned our cans to make them lighter composition. Shortening the diameter of the can reduced its weight by 22.2% while maintaining the same product volume. This has saved approximately 1g of aluminium per can, an annual savings of 289 tonnes of aluminium.
Container Weight Reduction after Lightweighting Since 2010
23-45%Lighter
WaterHong Kong, Mainland China, U.S.
5-12%Lighter
Hot fill (teas)Hong Kong
16-66%Lighter
Bottle capHong Kong, Mainland China, Taiwan
2-23%Lighter
SparklingHong Kong, Mainland China, Taiwan
25-38%Lighter
Bottleneck lengthHong Kong, Mainland China, Taiwan
22.2% Weight reduced
6.5cm
Aluminium CanHong Kong, Mainland China, TaiwanReducing Secondary and
Tertiary Packaging For manufacturing processes in Hong Kong and the U.S., we have replaced empty can paper separator to reusable plastic separator. In the transport phase, wooden pallets are rented from third party contractors. This arrangement helps to facilitate a high reuse rate.
5.9cm
technologies – aseptic lines which do not require heating of beverages – would eliminate the challenges that heating presents, and therefore making lightweighting possible.

2017 Sustainable Development Report
48
Sludge from Wastewater
Most of the sludge we generate is discarded at landfills, this is the case in Hong Kong and most bottling plants in Mainland China. All sludge generated from our Taiwan bottling plants and a small portion from Mainland China bottling plants is collected by recyclers.
We currently do not have information on the waste generated from vending machines, coolers and fountains that are beyond economic repair and discarded vehicles from our own fleet. As for organic waste, sludge from wastewater treatment processes and waste from our offices, we track the volume we generate to monitor performance, sludge being the most material of these.
Waste ManagementTo complete the picture of the materials discarded from our business operations, we have identified five other categories of waste. These are:
• Organic waste generated from the production of certain beverages
• Sludge generated from our wastewater treatment plants
• Vending machines, coolers and fountains beyond economic repair
• Discarded vehicles
• Waste generated from offices
Policy Advocacy and Partnerships To influence our value chain, we partner with relevant stakeholders, especially on a market level, to identify opportunities and solutions to minimise impacts.
In Hong Kong in 2017, we helped form a broad representative group of stakeholders, named #Drink Without Waste, including academia, NGOs, key soft drink producers, key retailers, recyclers and a think tank. The group drew up a request for proposal for a consultant to study and advise, and produce a list of pragmatic recommendations which could be adopted by the Hong Kong Government and other key stakeholders, to keep single-use soft drink packaging from landfill, and ideally processed into a resource. The research and recommendations are due in mid-2018.
CIRCULAR ECONOMY
Together with TCCC, Swire Beverages supports
the circular economy concept to address post-
consumption plastic. This concept can significantly
reduce the amount of waste which ends up in
the natural environment. A circular economy, by
definition, is a restorative and regenerative design
that looks beyond the ‘take, make and dispose32 ’
consumption model. This year, we joined the Ellen
MacArthur Foundation's New Plastics Economy
(NEPC)33, a global initiative committed to reducing
the environmental footprints of plastics through
innovation in packaging, as well as engaging
consumers in better recycling solutions. This
approach will require ongoing collaboration with
stakeholders along our value chain.
Market Volume of Sludge Generated (tonnes)
Hong Kong 280
Mainland China(1) 2,700,826
Taiwan(2) 476
U.S.(3) 0
Note: (1) 34% is collected by recyclers and is not discarded at landfills (2) All sludge is collected by recyclers (3) There are no wastewater treatment facilities at our
bottling plants in the U.S. as water is discharged to municipal wastewater treatment systems
32 https://www.ellenmacarthurfoundation.org/circular-economy 33 https://swirenews.swire.com/2017-09/Newswire/Swire-Beverages-Joins-Global-Initiative.html

2017 Sustainable Development Report
49
Environm
ent
Organic Waste
Hong Kong is the only market where organic waste is generated as a result of our product mix, which includes tea and soya milk. In 2017, 104 tonnes of organic waste and sludge was generated and sent to local landfills. In 2018, Hong Kong will open an Organic Waste Treatment Facility where all our tea
Our focus and challenges ahead are vast and will require a holistic approach. First, we need to be able to measure and verify the volume of post-consumer packaging that is collected, recovered and recycled, which often has a substantial lag time element and source data that can vary in accuracy, so we can better understand the baseline situation to identify suitable solutions. Second, we need to explore with TCCC further improvement opportunities for primary packaging design, which includes increasing the proportion of recycled materials in our primary packaging.
Moving Forward
In January 2018, Mainland China introduced the new Operation National Sword policy, to ban imports of certain types of waste. This will have a global impact, especially on countries which export a significant portion of baled recyclables to Mainland China. Our operations in Hong Kong and the U.S. will be affected. We hope that, as a consequence of this declaration,
leaf and soya bean residue will be sent. Organic waste sent to this facility will be treated and converted into compost. Biogas generated from this process will be collected and used as renewable energy.
For secondary and tertiary packaging, we will launch reduction programmes.
Third, we need to engage the authorities in Mainland China and Taiwan regarding the use of recyclable material in food grade packaging. This will be done in conjunction with TCCC and other relevant stakeholders and is expected to be a lengthy process.
Lastly, we need to improve the quality of our data on other types of waste and aspire towards operating in a way where no waste is sent to landfills.
34 http://www.coca-colacompany.com/stories/world-without-waste
local markets will develop policies to address waste separation, collection and recovery.
In parallel, TCCC launched its primary packaging strategy, World Without Waste34 , in January 2018. This strategy outlines three goals for The Coca-Cola System to deliver:
1. By 2025, 100% of primary packaging will be recyclable
2. By 2030, 50% of all primary packaging will comprise of 50% recycled packaging content
3. By 2030, for every bottle which is placed into the environment, one will be taken out
We will be heavily involved in this effort, and will work closely with TCCC on the mechanics of how to achieve this.

50
2017 Sustainable Development Report
PRODUCT RESPONSIBILITY
Providing high-quality beverage options to our consumers requires research and transparency through all
stages of the bottling process. From sourcing high-quality raw ingredients, monitoring sugar content in our
products, to transparent labelling, we provide consumers with information to make decisions with the peace
of mind that our products are made from high-quality ingredients.

51
Product R
esponsibility
2017 Sustainable Development Report
35 https://www.coca-colacompany.com/stories/our-way-forward
PRODUCT CHOICE
TCCC and Swire Beverages support the current
recommendation by several leading health
authorities, including the World Health Organisation
(WHO), that people should limit their intake of
added sugar to no more than 10% of their total
energy/calorie consumption. We are committed to
providing beverage choices to consumers to enable
them to manage calorie intake without giving up the
great tastes they love. In line with TCCC’s Our Way
Forward strategy35 , and in response to the evolving
preferences of customers worldwide, The Coca-
Cola System is making improvements both inside
and outside the bottle.
TCCC controls all the beverages formulations
that Swire Beverages, as a bottling partner,
manufactures, distributes and sells. Inside the
bottle, TCCC is rethinking many of its recipes to
reduce calories and sugar, and looking for ways to
make beverages more nutritious by adding vitamins,
minerals and electrolytes. Swire Beverages is
supporting TCCC’s aims by increasing low and
no-sugar beverage options, using new sweetener
alternatives, and providing a broader range of
different drinks including teas, juices and purified
water.
Outside the bottle, we are offering smaller
packaging sizes, making it easier to control sugar
intake, and more accessible calorie information so
consumers can make informed choices.
Hong Kong Mainland China Taiwan U.S.
32% 27% 39% 39%
Market
Percent of No- and Low-Sugar Beverages by Sales Volume

52
2017 Sustainable Development Report
As per the above, today’s volume in Mainland China and the U.S. is dominated by sparkling, followed by water,
with a small portion of juices, teas, energy drinks and other still. This data takes into consideration of both
legacy and new territories and reflects the actual data from 2017 sales.
Note: (1) One unit case is equal to 5.678 litres of beverages. It is a measurement equal to 24 eight-ounce servings of beverages. (2) This information is taken the Swire Pacific 2017 Annual Report
The Category Mix in Our Two Largest Territories
600
500
400
300
700
200
100
0
Mill
ion
unit
case
Mainland China
Tea Energy drinksSparkling Juice Other still(excluding water)
Water
200
150
100
50
0
Mill
ion
unit
case
U.S.
Tea Energy drinksSparkling Juice Other still(excluding water)
Water
2016 2017
2016 2017

53
Product R
esponsibility
2017 Sustainable Development Report
26% Coca-Cola Trademark
35% Sparkling flavours
2% Dairy/soy, coffee, herbal drinks
22% Waters
7% Juices (including Vitamin Water)
6% Teas
2% Energy, sports drinks, others
Next-Generation Sweetener Innovation
TCCC’s quest for alternative sweeteners has expanded beyond their own research and development
team. This year, the External Technology Acquisition Team invited people around the world to share
ideas of naturally sourced, safe, low- or no-calorie compounds that have a similar taste to sugar37 .
36 The Codex Alimentarius international food standards, guidelines and codes of practice contribute to the safety, quality and fairness of this international food trade. Consumers can trust the safety and quality of the food products they buy and importers can trust that the food they ordered will be in accordance with their specifications.
37 http://www.coca-colacompany.com/stories/coca-cola-launches-crowdsourcing-challenges-to-find-next-generat
Together with TCCC, we have begun a journey toward a goal of reducing sugar content in our beverages
without compromising flavour. Across all markets, we offer a wide range of beverage products with Coca-
Cola trademark and sparkling being the most dominate in terms of sales volume. Currently, 31% of our
overall product portfolio by sales volume is low and no sugar beverages. There is no universal definition of
low-sugar, but internally we use the most common metric from CODEX36 . Low sugar for liquid food is defined
as products containing no more than 5 g of sugar per 100 ml of liquid.
Inside our beverages, we have identified alternative sweeteners that allow us to maintain our signature
flavours. These alternatives are chosen because they are safe to consume and maintain the refreshing
flavour of our beverages. We continually look for ways to improve our beverages through adding vitamins,
minerals, and electrolytes.
2017 Overall Product Mix by Sales Volume

54
2017 Sustainable Development Report
PRODUCT LABELLING AND MARKETING
We want to help consumers make informed dietary choices. Across all four markets, we clearly label
each beverage with a list of ingredients, additives and flavours used. We are transparent about sugar and
caffeine content, calories per serving, and provide other nutritional information in total and as a percentage
of daily value to give consumers guidance on how
much of their recommended daily allowance one
serving represents. We voluntarily provide easy-
to-find calorie information so consumers can
make informed decisions easily. We endeavour to
ensure that all nutritional information is factual,
meaningful, easy to understand, and that all of our
product labels fully comply with local regulations
and requirements.
In the U.S., we support an industry-wide initiative by
providing caffeine along with calories-per-serving,
serving-per-container and front-of-pack calorie
information.
In 2018, the Hong Kong Government will launch a
new labelling scheme for pre-packaged food to help
consumers make healthier choices and improve
dietary habits. A designated label will be added to
products that qualify as no-sugar and low-sugar
under the scheme. We will support this scheme and
all qualifying no- and low-sugar products will carry
these labels when the scheme is launched.
Responsible Marketing
We abide by TCCC’s Responsible Marketing Policy and will not market directly to children under the age of 12.
Our advertisements are not designed to appeal specifically to children, and we do not directly target children
in our campaigns, for example, we will not advertise our products in primary schools.
330ml
can of Coca-Cola contains
138.6 calories
6.92%
daily value
Product Label from the U.S.

55
Product R
esponsibility
2017 Sustainable Development Report
PROCUREMENT & SOURCING
With our consumers’ demand for accountability,
there is a need for us to be transparent with our
commitments to integrity and quality within
our value chain. We take responsibility to only
source goods that are obtained in a way that does
not degrade the natural environment, and only
procure services from those who utilise workplace
accountability practices.
TCCC’s Suppliers Guiding Principles (SGP) provide
an overarching set of standards we expect from our
suppliers covering workplace policies, health and
safety, human rights, environmental protection and
business integrity. All bottlers within The Coca-Cola
System, including Swire Beverages, must follow
DIRECTFollows Coca-Cola’s SGP
Ingredients and materials needed for beverages and packaging
• Sugar
• CO2
• Concentrate
• Water
INDIRECTFollows Coca-Cola’s SGP & Swire Pacific’s Supplier Corporate Social Responsibility Code of Conduct
Manufacturing equipment and coolers
• Vending machines
• Fountain dispensers
• Coolers
• Machinery parts
Marketing and sales material
• Merchandising goods
the SPG. This governance model helps to ensure
supply chains within The Coca-Cola System uphold
the pledge of quality, safety and sustainability
awareness beyond legal compliance.
We categorise procured goods into two groups.
Direct goods include raw materials which are
used for manufacturing or packaging, and indirect
goods are items for marketing these beverages.
The procurement of both direct and indirect goods
involving TCCC must follow the SGP. In addition, all
raw materials are sourced from a list of suppliers
that have been approved by TCCC to better ensure
manufactured beverages meet TCCC’s standard.

56
2017 Sustainable Development Report
Under The Coca-Cola System, our major suppliers
must undergo third-party audits to assess their
sustainability performances. This audit process is
simultaneously intended to encourage improved
performance over time. The comprehensiveness
of the audit process helps us to better understand
our suppliers’ sustainability progress whilst
simultaneously encouraging improved performance
over time.
In addition to the SGP, we abide to the Swire
Pacific Supplier Corporate Social Responsibility
Code of Conduct. We apply these two documents
in parallel given their similarities: both documents
address regulatory compliance, forced/child
labour, health and safety, environmental issues,
and compensation and working hours. Beyond the
SGP, under the Swire Pacific Supplier Corporate
Social Responsibility Code of Conduct, suppliers
are also encouraged to provide clear, accurate and
appropriate reporting of their progress towards
achieving their own sustainable development
objectives.
WORLD CLASS OPERATIONS
To bridge the gaps between ourselves and our suppliers’ operational processes, management
approach, culture and expectation for quality, we introduced the “World Class Operations” (WCO)
management and benchmarking system in June 2017. The WCO is our own pursuit of continuous
improvement in seven areas with our suppliers: supply risk & continuity, finance, sustainability,
capability & productivity, quality & customer service, innovation, and regulatory & social
responsibility amongst our suppliers. It supports a shared vision and common language to achieve
end-to-end supply chain interactions, enhancing our supplier’s overall performance and help
achieve zero defects.
To kick off the programme, we held the first World Class Operation Summit on 14th June 2017,
where 34 of our suppliers participated, all of which were interested in participating in the WCO
management and benchmarking system. By the end of 2017, 22 suppliers have completed
the first site visit with initial assessment, seven of which have signed contracts committed to
implementing the WCO management and benchmarking system.
Collaboration with other bottlers in Mainland China
In 2004, Swire Beverages formed a consortium
with neighbouring bottlers in Mainland China
to collaboratively manage suppliers and the
procurement process. Its objective is to pool
resources and knowledge between bottlers to
better manage the procurement process. This
arrangement encourages transparency amongst
bottlers where supplier information is shared
to prioritise those who are acting in line with the
SGP. Through this agreement, full transparency
of information from all participating companies
becomes mandatory and decisions for actions must
be in full agreement with all parties.

57
Product R
esponsibility
2017 Sustainable Development Report
FOOD SAFETY AND PRODUCT QUALITY
The quality of our products and safety of our
consumers is of utmost importance. We avoid
food safety risk factors by eliminating reliance
on fragmented supply chains, unnecessary use
of additives and limiting human contact exposure
during the manufacturing process. Through the
combined efforts of our procurement process and
implementation of compliance and management
systems, we ensure the quality of our products
comply with relevant local rules and regulations
as well as standards outlined in the Coca-Cola
operating Requirements (KORE). More details
can be found in the Compliance and Management
Systems and Procurement and Sourcing sections.
To check that proper measures are in place, product
quality and safety compliance are assessed
through unannounced, internal and external audits
at our bottling plants38. Unannounced audits ensure
bottling plants are “audit-ready” at all times. Any
food safety concerns flagged during audits will
result in removal from production line.
All bottling plants follow the ISO 22000 system
to ensure our products remain safe throughout
the manufacturing process. This system increases
Total Product Management
The Total Product Management (TPM) system is
integrated across our entire operations including
procurement, manufacturing, warehousing, and
distribution to consumers. It identifies the necessary
processes to protect products from being damaged
or contaminated. First, the performance of bottling
plants regarding how products are managed
and handled at different operational stages is
assessed. Then, management uses these findings
to derive annual TPM plans. These plans outline
the leading personnel, team actions, required
training, governance structure and review process
necessary for better handling and management of
products to ensure quality and product safety.
the transparency and traceability of our products
from the source by facilitating communication
with suppliers and consumers both upstream and
downstream of the value chain.
In November 2017, our bottled water in Mainland
China failed a random quality sampling test by the
Food and Drug Administration of Fuyang City. The
incident is currently still under further investigation,
once results are confirmed, more information will
be provided in the following report.
38 http://www.coca-colacompany.com/stories/quality#Ingredient

58
2017 Sustainable Development Report
SAFETY
Swire Beverage aspires to have zero incidents across
all operations. Staff at bottling plants, warehouses,
distribution centres and even our sales staff can
face safety risks if awareness is lacking. Fostering a
safety culture has been our continued focus as we
strive for zero harm.
We operate across four territories which differ in
culture, operating procedures, scale and use of
contractors. Whilst we have strict procedures in
place to manage safety inside our bottling plants,
distribution centres and warehouses, it can be
challenging to manage potential safety risks outside
of these spaces. By integrating an open and honest
safety reporting culture, adopting forward looking
leading safety indicators, embracing technology
where necessary and adapting our standards to the
local culture, we can better prevent incidents.
Scope
Our safety data covers all employees – this includes
both employees and contractors working within our
owned and managed manufacturing, warehouse,
distribution, sales and marketing facilities. We
further strive to track all serious injuries39 and
fatalities from transportation, warehouse and
distribution contractors which we do not own or
manage, and all fatalities caused by our employees
or contractors which affect the general public.
The data presented in this section covers a full
year’s worth of data in 2017 for both our legacy and
new territories.
39 Serious injuries are defined as incidents that require hospitalisation of an employee or contractor and/or an incident that may result in
investigation by external parties.
WORKPLACE

59
Workplace
2017 Sustainable Development Report
Safety Governance Structure
Swire Pacific Board
Swire Pacific Group Risk Management Committee
(GRMC)
Swire Pacific Health and Safety Committee(Made up of representatives from
Swire Beverages and operating companies)
Swire BeveragesManaging Director
Swire Beverages Global Safety & Sustainability Lead
Bottling plantsFollow OHSAS 18001
Environmental, Health and Safety Committee Safety Committee
Mainland ChinaHong Kong
Environmental, Health and Safety Committee
Swire Safety, Environment,
Sustainability Team
Taiwan U.S.
Swire BeveragesSwire Pacific
Swire Beverages’ overall safety performance is
governed by the Swire Pacific Health and Safety
Committee, which is comprised of members
from different operating companies of the Group,
including Swire Beverages, as well as the GRMC. This
committee is responsible for developing group-level
health and safety policies, monitoring performance,
promoting education and training, sharing best
practices and developing internal capabilities.
At an operating company level, safety governance
is integrated within our sustainability governance
process. Performance is tracked through our Monthly
Safety Report, where information on each market is
reported to the Global Safety and Sustainability Lead.
It is consolidated and sent to all senior management
in all four territories for commentary. Bi-monthly
functional meetings are held between our Managing
Director, Executive Director of Supply Chain and the
Global Safety and Sustainability Lead to discuss
performance and progress. This information is then
reported to the Swire Beverages’ Advisory Board.
At the regional-level, the health and safety
governance structures differ slightly across the four
markets, where each market has established their
own health and safety committees or equivalent that
meet on a regular basis. Their role is to determine
the best approach to track safety performance as
well as to identify the appropriate framework for
compliance on relevant regulations and standards.
Within bottling plants, management is responsible
for implementing the Occupational Health and
Safety Assessment Series standard OHSAS 18001,
which outlines the requirements set by the Swire
Pacific Health and Safety Committee. Each bottling
plant has an assigned safety manager to address
concerns and identify areas for improvement.

60
2017 Sustainable Development Report
Workplace Health and Safety Events
Every year, we participate in the John Swire
& Sons and Swire Pacific Health and Safety
Conference. This is a group-level event where
operating companies gather to share best practices
on management techniques and to learn about
innovations in the health and safety landscape
across the entire portfolio of businesses.
The Coca-Cola Company Safety Council holds
annual meetings with members of TCCC and
bottlers of the Coca-Cola System to discuss health
and safety. Swire Beverages’ involvement goes
Safety Performance Metrics
Considering the relative scale of our operations in
each market, the majority of incidents naturally
occur in Mainland China. For example, a high
number of sales staff means that more staff are
commuting to customer locations and thus there is
a higher probability of traffic-related incidents.
Leading Indicators
We began reporting leading indicators in 2017
to measure the frequency of proactive activities
to prevent injuries. In contrast to our historical
reporting on lagging indicators, leading indicators
Metrics Mainland China Hong Kong Taiwan U.S.
Total Employees 20,027 1,284 897 6,674
Number of Sales Staff 12,125 502 264 4,663
Number of Bottling Plants 18 1 2 6
Number of Distribution Centres 201(1) 0 1(2) 48
Number of Owned Vehicles 950 240 109 2,027
Market First Aid Reports Near Miss Reports Raised
Safety Observation & Communication
Workplace Safety Inspections
Mainland China 205 73 9,403 325
Hong Kong 188 36 114 64
Taiwan 45 3 371 55
U.S. 92 0 0 0
TOTAL 530 112 9,888 444
Note:
(1) Includes 113 distribution centres managed/owned by Swire Beverages and 88 managed/owned by third party
(2) Distribution centre is managed/owned by Swire Beverages
2017 Safety Performance Relating to Leading Indicators
beyond attending the meeting every year – our
Executive Director of Supply Chain is currently the
Joint-Chair of the Council.
measure activities carried out that help prevent or
control injury. We intend to enhance the quality and
focus of our reporting on leading indicators going
forward.

61
Workplace
2017 Sustainable Development Report
Lagging Indicators
Lagging Indicator performance is tracked across four indicators:
• Lost time injury rate40 (LTIR), is an indicator of incident frequency
• Lost day rate41 (LDR), indicates the severity of incidents
• Total incident rate42 (TIR), measures the frequency of reporting
• The number of fatalities
Although we are experienced with recording lagging
indicators, there is a need to further encourage
monitoring at bottling plants where reporting rates
(TIR) are low.
There has been an overall decreasing trend in the
LTIR and LDR over the last two years. This, however,
is off-set by peaks seen in and around the busiest
times of the year (as depicted by the dotted brown
circles in the graph below). These peaks correspond
with the highest production volumes in the warm
summer months, in all four markets. The peak
depicted in the winter of 2017 was primarily driven
by snow and icy conditions in Mainland China.
0.60
0.50
0.80
0.70
0.90
1.00
0.40
0.30
0.20
0.10
0.00
12-month rolling LTIR Monthly LTIR Peak incident months
Lost
Tim
e In
jury
Rat
e
Lost Time Injury Rate Performance (Frequency): 2015 to 2017
40 LTIR calculated by (Number of LTIs x 200,000) / (Number of Hours Worked in the reporting period). The calculation is based on 200,000 hours
(100 direct employees working 40 hours per week for 50 weeks)41 LDR is calculated by (Number of Workday lost x 200,000) / (Number of Hours Worked in the reporting period). The LDR is an indication of Lost
Days per 200,000 hours and not the number of Lost Days per LTI.42 TIR is the Number of [(Medical Treatment Cases + LTIs) x 200,000] / (Number of Hours Worked in the reporting period)

62
2017 Sustainable Development Report
The 12-month rolling LTIR rate in December 2017 was 0.50, which is low when compared to similar bottling
and distribution type businesses43. As increased reporting frequency yields higher LTIR, this low number is a
reflection of the work we have to do to further encourage reporting specifically in Mainland China, which has
the single greatest effect on these metrics.
60.00
50.00
40.00
30.00
20.00
10.00
0.00
12-month rolling LTIRMonthly LTIR
Lost
Day
Rat
e
Lost Day Rate Performance Chart (Severity): 2015 to 2017
43 Coca Cola European Partners has a LTIR of 1.66 in 2016. Amatil has a LTIR of 1.7 in 2016.

63
Workplace
2017 Sustainable Development Report
2017 Fatalities
After recording zero work-related fatalities in 2015
and 2016, we unfortunately had two fatalities in
2017, both of which were traffic related.
Road Safety in Mainland China
We deliver packaged beverages to our customers
as part of our operations. In Mainland China, we
transport 17.8 million litres44 of beverages every day
from our bottling plants to retailers and customers’
warehouses. Aside from beverage delivery, our
12,125 sales representatives and contract sales
representatives commute to customer locations,
mostly on electric motorbikes. As a result, road
safety is one of our primary concerns in our
Mainland China operations.
44 In 2017, we transported approximately 3.9 million litres with Swire Beverages owned vehicles and our hired contractors transport around 13.9
million litres.
When addressing motorbike safety, local legislation
often lacks mandatory requirements for helmet
use. To help achieve zero harm, we provide free,
certified and weather-appropriate helmets to all
employees who commute via motorbikes. Different
helmet types are provided at different times of the
year so that drivers can stay warm during winter and
cool in the summer. We are further implementing
relevant courses on safe driving, including a series
of classroom lessons and defensive driving training
to all sales representatives. We encourage staff
to extend their safety awareness and to use their
helmets outside of working hours.
Another challenge lies in the high turnover rate for
sales representatives which requires more training
to be provided to new joiners.
To encourage and give recognition to our bottling
plants with good traffic safety performance, our
“Gold Helmet Award” was introduced in 2017.
This award is given to bottling plants with no
accidents for 100, 200 and 365 days. Our bottling
plant in Guangdong West, Mainland China received
this award in 2017 in recognition of its success in
achieving 411 consecutive days without an incident.

64
2017 Sustainable Development Report
Traffic Management inside our facilities in Mainland China
In Nanjing and Hangzhou bottling plants, we created two traffic management pilot projects.
Its objective is to implement an organised system to direct onsite pedestrians and traffic safely,
with a long-term goal of introducing the system across all bottling plants in Mainland China.
Measures include: single direct fleet flow, reverse parking for cars, fleet in/out checklist, full 5S45
in and around the outdoor area within the perimeter of the plant, improving light levels in the
areas of manual work, training, provision of road signs and providing physical barriers between
fleet and area where people operate on-ground within the loading areas.
Moving Forward
Our focus is to encourage open and honest reporting on health and safety across all markets. With this
information, we can better identify specific preventative measures and reduce the number of incidents. We
will launch two programmes in 2018 to directly address the most common incidents in Mainland China and
the U.S. In Mainland China, we will focus on improving traffic safety for sales and distribution staff, especially
for electric motorbikes. In the U.S., where ergonomic injuries caused by moving heavy objects and other
warehouse-related tasks are most common, we will launch an intensive ergonomics program with Pristine
Condition46.
45 5S is a system to reduce waste and optimize productivity through maintaining an orderly workplace. The term refers to five steps – sort, set in
order, shine, standardize, and sustain.46 http://pristinecondition.com/

65
Workplace
2017 Sustainable Development Report
Scope
The information presented in this section covers all our employees in both legacy and new territories
operations.
Percentage of Workforce by Gender
19%of top / senior management
23%of middle / junior management and supervisory
15%of non-customer facing operational / technical staff
23%of customer facing staff
24%of total staff
60%of supporting functions (human resources, public affairs, finance, etc.)
Male
Female
47 https://www.mckinsey.com/business-functions/organization/our-insights/why-diversity-matters48 http://news.mit.edu/2014/workplace-diversity-can-help-bottom-line-1007 49 Women In the Workplace 2017 by McKinsey & Company and LeanIn.Org
In 2015, Swire Pacific launched its Swire Women’s Network, offering a platform for all Swire Pacific
operating companies to share insights on gender equality. The network aims to attract and groom
female talent by supporting their career advancement. It offers employees capacity-building and
mentorship programmes, and forums for discussion.
GENDER EQUALITY
Studies have shown that better gender diversity is correlated with improved financial returns47and improved efficiency48. Despite the best efforts of leading companies, statistics show that women today often remain underrepresented in the corporate workplace49. Swire Beverages is committed to gender equality and understands that diversity leads to better business outcomes. We are working towards achieving gender equality in our business by creating an unbiased work
environment, increasing the proportion of women in our workforce, and establishing an inclusive culture.
All Swire Beverages employees are given access to
the same resources and opportunities regardless
of their gender. This is achieved when there is
an equal salary for the same level of experience,
equal opportunities for leadership roles, and the
elimination of discrimination and institutional
barriers in the workplace.

66
2017 Sustainable Development Report
14%
86%
U.S.
6,674
Total no. of employees
Mainland China
20,027
Total no. of employees
27%
73%
Hong Kong
1,449
Total no. of employees
27%
73%
Taiwan
918
Total no. of employees
26%
74%
Male
Female
Percentage of Workforce by Gender in Each Market
Gender Equality Initiatives
Our approach to achieving gender equality differs
between markets, as each region is unique in its
workforce size and legislation. The majority of our
employees are located in Mainland China. Across
all markets, we monitor the proportion of female
staff by age and by function at all employment
levels. Our operations in all markets follow and
comply with local laws and regulations relevant to
gender equality.
Our vision in Mainland China is to create an unbiased
work environment by improving the female
proportion of our workforce, and establishing an
inclusive culture. As part of our Mainland China
Diversity & Inclusion System Assessment in 2017,
we identified 3 key areas of focus:
Improving the female ratio
among sales representatives
and senior leadership
1. 2. 3.Developing our female staff Creating and
communicating
female-friendly working
environment

67
Workplace
2017 Sustainable Development Report
Moving Forward
As part of our commitment to gender equality,
we will be establishing the Swire Beverages
Gender Equality Steering Committee in 2018. This
committee will be established by our Divisional
Executive Board and chaired by our Managing
Director. It will be responsible for the development
The Equal Employment Opportunity Commission
(EEOC) in the U.S. requires the consideration of both
gender and ethnicity diversity in hiring. Under the
rules of the EEOC, hiring and employment trends
must match the gender and ethnicity demographics
of the state. With our expansion in mid-2017,
2017 Training Initiatives and Programmes in Mainland China
• Swire Beverages Women’s Network launched its WeChat platform for Mainland China staff to share individual stories as a source of inspiration and empowerment.
• Every two years, we host a Female Leadership Forum. All female managers are invited to the forum to learn from each other through workshops and seminars. The event offers the opportunity for them to form a stronger network.
• Our Gender Equality Workshop invites our sales teams, sales and marketing directors, regional sales managers, sales officers and supervisors to improve their awareness on gender diversity.
This year, staff from seven legacy bottlers in Mainland China joined the workshops. We have plans to expand this training to include seven new territories bottlers in 2018.
• “Be the Best You Can Be” is a training programme to help female leaders increase their awareness on the issues around gender equality and the need to empower other women around them. Sixty female leaders from 14 bottling plants were trained to be trainers for other female colleagues. Our goal is to train over 300 leaders in 2018.
of strategies and defining of key performance
indicators (KPIs) to promote gender equality across
the organisation, as well as setting up project teams
working on developing action plans for recruitment
and fostering a female-friendly workplace.
our new operating locations now cover different
demographics. As part of our plan to meet the
EEOC requirements, our human resources team in
the U.S. has hired an external consultant to prepare
an Affirmation Action Plan (AAP) to be finalised in
March 2018.

68
2017 Sustainable Development Report
Our compliance and management systems
across all markets follow the manufacturing
and distribution policies of TCCC. This quality
management programme, referred to as the Coca-
Cola Operating Requirements (KORE), governs
the quality of our beverages to meet TCCC’s
standards. KORE outlines requirements and
policies, specification and programmes to ensure
product safety and quality, occupational safety
and health and environmental standards50. This
programme promotes the highest performance in
these categories with endorsement from leadership
throughout The Coca-Cola System. It is reviewed
regularly to ensure standards are relevant and up-
to-date. In addition to abiding to the requirements of
TCCC, we ensure compliance with local regulations
and standards of our operating markets.
As an operating company under Swire Pacific, our
compliance and management systems are also
COMPLIANCE AND MANAGEMENT SYSTEMS
aligned with Swire Pacific’s standards. We report
our performance to both Swire Pacific and TCCC.
We implement ISO 14001 environmental
management system across all of our owned and
manage bottling plants across all markets. This
system facilitates our efforts in minimising negative
impacts to the environment arising from our
operations, along with compliance with applicable
laws and regulations. Other management systems
to control quality include ISO 17001 and ISO 9001.
Our occupational health and safety management
system follows the Occupational Health and Safety
Assessment Series (OSHSA) 18001. For product
safety, all bottling plants are certified under the
Food Safety System Certification ISO 2200.
Our co-packers are also required to obtain the same
ISO and OSHA certifications as us.
50 http://www.coca-colacompany.com/stories/quality

69
Com
munity E
ngagement
2017 Sustainable Development Report
COMMUNITY ENGAGEMENT
Positively influencing the local community where we operate is a key component of our sustainability efforts.
Our community initiatives are guided by our community engagement CSR policy, which outlines our five core
areas for community initiatives. These core areas reflect our business’s corporate culture and values, and we
contribute to addressing these themes through partnerships, employee volunteers, and donations.
WATER STEWARDSHIP AND
ENVIRONMENTAL PROTECTION
EMERGENCY RELIEF
WOMEN EMPOWERMENT
YOUTH DEVELOPMENT
ACTIVE LIVING

70
2017 Sustainable Development Report
Under our CSR policy, we have an established
framework for each bottling plants to set aside
funds to put towards programmes and projects
related to these five core areas. In 2017, Swire
Beverages including legacy and new territories
operations, contributed HK$3.89 million to the
communities across our four markets. These
donations were spread across 54 charity events,
involving 4,374 employee volunteers.
Swire Group Charity Trust
Each year, we donate a portion of our profits to the Swire Group Charitable Trust, from which
funds are disbursed to non-profit organisations in Hong Kong and Mainland China. In 2017, Swire
Beverages contributed HK$2.53 million to this fund.
Water Stewardship and Environmental Protection
Water is a key ingredient in our products and vital
to communities and ecosystems. To protect this
precious resource, we partner with governments
and NGOs to develop and implement projects that
preserve important river basins, watersheds and
wetlands along with their associated biodiversity.
In addition to water stewardship, we support
projects related to other key environmental issues,
such as research and awareness building for
communities regarding waste management as well
as energy conservation.
Mini-Wetland Project (Mainland China)
The residents of Shitang Village in Jiangsu Province
have experienced significant economic benefits
from agritourism. During peak season, the village
plays host to up to 20,000 daily visitors, and the
wastewater generated presented a significant
threat to the local environment and the people.
In response, Swire Beverages and TCCC launched
the Mini-Wetland Project in 2016, which uses an
artificial wetland to purify wastewater generated
from the farmhouses in the village. The man-
Water Stewardship Project (Taiwan)
2017 marks the ten-year anniversary of our Water
Stewardship Project in Taiwan. Initially this project
began as a public education campaign to raise water
conservation awareness. Ten years later, we are
now exploring opportunities to invest in innovative
technologies to conserve water in mountainous
areas of rural Taiwan.
Over the last ten years, the project has successfully
raised awareness of water scarcity among the
public, and delivered education classes to more
than 10,000 primary students. We contribute to this
project through sponsoring community initiatives,
partnership with NGOs, and participating in river
clean-ups and awareness-building activities.
Aside these projects described above, we are also
involved in water replenishment projects in the
U.S. which are discussed in the Water Stewardship
section.
made ecosystem mimics the biological processes
in nature to absorb pollutants and filter the water,
treating up to 180 tonnes of wastewater per day.
The project passed final inspection and has been
accepted by the Nanjing Water Affairs Bureau.
The project is an example of a successful “golden
triangle” partnership between government, civil
society and business. In conjunction with the China
International Centre for Economic and Technological
Exchanges of the Ministry of Commerce, and the
United Nations Development Program, we can
successfully implement this project.

71
Com
munity E
ngagement
2017 Sustainable Development Report
Active living
Swire Beverages promotes active and healthy living
for both consumers and employees, through its
support of sporting events and other activities.
Women Empowerment – 5by20
Releasing the potential of women across the globe
is essential in achieving sustainable development.
Women around the world provide significant
contributions to The Coca-Cola System and in
recognition of the challenges they face, TCCC
developed the 5by20 initiative to improve the
economic empowerment of five million women
entrepreneurs within the global value chain by
2020. This initiative offers women access to
business skills training courses, financial services
and connections with peers or mentors, giving them
the tools and skills to build a successful business.
Entrepreneurial skills and professional training
organised by Swire Beverages were provided in
junction with relevant organisations, including the
Zhengzhou Women Entrepreneur Association. To
date, 13 of our bottling plants in Mainland China
have provided 443 education programmes and
development opportunities for 150,000 women in
the beverage supply chain.
Xiamen’s Run (Mainland China)
The Xiamen Run is a charity event that has been
organised by our Xiamen bottling plant since 2014.
This event attracts athletes from government,
media and private companies to participate in a
20km run. The donations collected are put towards
purchasing and installing water purifying systems
in local schools to provide clean water to children.
Over the past three years, we have installed 143
water purifying systems across 87 schools.
Hunger Run (Hong Kong)
The Aquarius HUNGER RUN is an annual charity
running event organised by the social enterprise,
FOODSPORT. This unique event counts calories
burnt by participants during the run, which are
converted into the equivalent amount of food for
donation to Food Angel, a local charity providing
food assistance for people in need in Hong Kong.
The Coca-Cola Hope School (Mainland China)
Since 1993, TCCC has built over one hundred
Hope Schools under Project Hope. Over RMB
150 million has been invested in helping 100,00
children in rural areas of Mainland China. Under
this project, Swire Beverages has helped to build
28 Hopes Schools across Mainland China in the
last 20 years. These schools provide education
The Coca-Cola Scholars Foundation (U.S.)
The Coca-Cola Scholars Foundation invests in
exceptional high school students who are dedicated
to leadership, and actions that positively impact
others. Each year, this foundation sends 150 bright,
young innovators into post-secondary education
with a US$20,000 scholarship. Swire Beverages
has supported this foundation through donations
for more than 30 years.
Youth Development
We believe education is fundamental for a growing
community and that by educating the younger
generation they become positive and engaging
members of society. We assist the communities
we serve by offering youth with special needs the
support and infrastructure for education.
to disadvantaged youth in rural areas. The
project supports the construction costs to build
Hope Libraries, e-learning centres and multimedia
classrooms across Mainland China.

72
2017 Sustainable Development Report
Disaster relief
When natural disasters strike and impact the
livelihood of the communities we serve, very often
affected citizens will suffer from shortages of
reliable and safe drinking water. In situations like
these, TCCC and Swire Beverages support the
local communities by providing bottled water to
affected citizens in a timely manner as part of the
Clean Water 24 emergency plan. Within 24 hours
of a natural disaster, Swire Beverages will identify
the nearest warehouse and arrange for delivery. In
collaboration with local governments, supporting
organisations and NGOs, we can successfully
deliver water to affected areas in a timely manner.
Swire Beverages has been participating in this
programme for five years, during this time we have
GLOBAL HEART OF AMBASSADOR AWARD
Li Yan Xia, our administrative manager at Swire
Coca-Cola Yunnan Beverages was awarded
the Global Heart of Ambassador Award for her
passionate and selfless actions when a magnitude
6.5 earthquake struck her home province of
Yunnan. Yan Xia visited the region and started a
campus aid programme at the Coca-Cola Hope
Primary School in Wujixiang. Her work not only
helped those in need, her motivation inspired
her colleagues to participate in the programme.
delivered 6.5 million bottles of water to more than
1.6 million people with an average response time of
10.5 hours.
We also participate in proactive measures to
address challenges posed by natural disasters.
Yunnan, Mainland China, has been known to
experience a high number of natural disasters
and because of this, management forums have
taken place to discuss cooperation mechanism
to overcome challenges when natural disasters
strike. Swire Beverages, in conjunction with local
governments, volunteers, media and experts
gathered at the, “Disaster Management Forum” to
identify potential solutions in 2017.
Together with the support of the local government
and media, families in crisis were invited to spend
Chinese New Year with the Coca-Cola team. Yan
Xia welcomed two children in crisis to stay at her
house for the festivities during Chinese New Year
and has created a lifelong relationship with these
children whom she is still in contact with regularly.

73
Com
munity E
ngagement
2017 Sustainable Development Report
Coca-Cola Pavilion and Plant Tours
Our bottling plants in Hong Kong, Taiwan and
Mainland China carry a collection of Coca-Cola
artefacts that are showcased at the Coca-Cola
Museum of each plant. The museums offer a preview
on the history of Coca-Cola through displays of
bottles and souvenirs from different periods of the
past. As a way to engage local communities, our
museums are opened to visitors free-of-charge.
During the tour, visitors get a snapshot of our
beverage production line and learn about how we
manage our key environmental issues, packaging,
water and energy consumption throughout the
manufacturing process.
Moving forward
Aligning our legacy community initiatives with new territories operations in Mainland China and the U.S. will
be an area of focus in 2018. Through creating synergy between existing and new bottling plants, we can
encourage sharing of best practices amongst our bottlers to better support the communities we serve with
what they need. We will continue to collaborate with government and NGOs to build long-lasting partnerships
to ensure that the work we do will have long-term positive impacts.

74
2017 Sustainable Development Report
During the reporting year, Swire Beverages acquired
a number of new bottling plants in Mainland China
and the U.S. The environmental performances of
new bottling plants were not included in this report
because we did not have full operating control
during the reporting year. In some cases, data was
not collected for some bottling plants prior to its
acquisition.
From the information that was collected, we
determined the performances of the three key areas,
water use ratio (WUR), energy use ratio (EUR) and
waste generation ratio (WGR) of new bottling plants
and compared it with our legacy plants in Mainland
In 2018, we will align the data collection process for our new bottling plants and will begin reporting all data
with a consistent format. We will have obtained one full year’s worth of data at our new bottling plants, by
the next Sustainable Development Report and data from the new bottling plants will be integrated into our
overall performance.
NEW TERRITORIES
China and the U.S. The performance of new bottling
plants is similar to our legacy operations with slight
variations in terms of which areas performed better
or worse. For example, WUR in Mainland China’s
legacy plants performed better than new bottling
plants with a WUR of 1.70 compared with 1.77. On
the other hand, when comparing their WGR, we saw
that new bottling plants performing slightly better.
Based on this information, we anticipate the overall
post-acquisition performance would remain similar
to our existing conditions, assuming there are no
major changes in product mix.
Water Use Ratio Energy Use Ratio Waste Generation Ratio
Legacy New Territories Legacy New Territories Legacy New Territories
Mainland China 1.70 1.77 0.30 0.30 2.60 2.20
U.S. 1.76 1.60 0.23 0.29 3.16 5.20

75
About this R
eport
2017 Sustainable Development Report
This is Swire Beverages Limited’s first Sustainable Development Report, covering the period between 01 January 2017 and 31 December 2017. This report has been prepared in accordance with the GRI Standards: Core Option. The scope includes bottling plants owned and operated by Swire Beverages in Hong Kong, Mainland China, Taiwan and the western U.S.
Due to the dramatic increase in the size of our business, the data we have reported in this report is largely derived from our legacy operations (excluding Shaanxi, which departed our Mainland China territory in July 2017). In many of the sections we present this against previous year’s data, providing absolute and ratio comparisons.
ABOUT THIS REPORT
For more information, comments or suggestions,
please contact our safety and sustainability team
at:
• Email: William Davies, Global Safety and Sustainability Lead at [email protected]
• Mail: Scholastica Sze Wan Tsoi, Manager – Health and Safety at 33/F Dorset House, Taikoo Place, 979 King’s Road, Hong Kong Island, Hong Kong
William Davies Scholastica Sze Wan Tsoi
Global Safety and Sustainability Lead
Manager Health and Safety
Credits: This report was prepared in collaboration with CSR Asia, Urban Air, and Etienne Leung.

76
2017 Sustainable Development Report
AWARDS AND RECOGNITIONS
Market Year Bottling Plant / project type / location
Name of Award / Recognition Awarding Organisation
Mainland China 2011 Luohe bottling plant LEED Platinum Certification U.S. Green Building Council
Mainland China 2013 Fujian bottling plant LEED Silver Certification U.S. Green Building Council
Mainland China 2016 Sustainability projects based in: Fujian, Guangdong, Liaoning, Shangdong, Zhejiang
Sustainability - Best Project Award The Coca-Cola Company
Mainland China 2016 Community projects based in: Henan, Hunan, Liaoning, Shangdong, Shaanix, Yunnan
Sustainability - Best Communicator Award The Coca-Cola Company
Mainland China 2016, 2017
Guangdong, Huizhou, Zhengzhou, Wenzhou, Zhejiang, Hefei, Jiangsu, Xiamen, Luohe, Zhanjiang, Jiangxi
Outstanding Enterprises in Water and Energy Conservation in China Beverage Industry
China Beverage Industry
Mainland China 2016
Zhengzhou
Second Place in the Environment and Safety Victory Cup of Coca-Cola China
The Coca-Cola Company
Mainland China 2016 Advanced Collectives in “World Water Day” and “World Water Week”
Development Zone Water Saving Office
Mainland China 2016 Advanced Unit of Solid Waste Management in Zhengzhou City
Zhengzhou Environmental Protection Bureau
Mainland China 2016 Level 2 Enterprise of Safe Production Standardisation
Henan Province Safety Supervision Bureau
Mainland China 2016 Wenzhou Harmonious Enterprise in Wenzhou City Wenzhou City Leading Group on Building a Harmonious Labor Relations
Mainland China 2016
Luohe
2016 Advanced Unit for Safe Production in Development Zone
Management Committee of Luohe Economic and Technological Development Zone
Mainland China 2016 2016 Advanced Worker for Safe Production in Development Zone
Management Committee of Luohe Economic and Technological Development Zone
Mainland China 2016 2016 Advanced Unit for Occupational Health in Luohe City
Luohe Safety Production Committee
Mainland China 2016 Jiangxi Advanced Unit for Safety Culture in Jiangxi Province
Jiangxi Provincial Bureau of Safe Production Supervision
Mainland China 2016 Guangxi Model Unit for Occupational Health in Nanning City
Nanning Safe Production Supervision Bureau
Mainland China 2016 Kunming Advanced Unit for Safe Production, Model Unit for Safety Hazard Investigation
Management Committee of Kunming National Hi-tech Industrial Development Zone
Mainland China 2017 Jinxiu bottling plant, Hefei LEED Gold Certification U.S. Green Building Council
Mainland China 2017 Guangdong, Huizhou Hong Kong - Guangdong Cleaner Production Excellent Partner (Manufacturing)
Guangdong Provincial Economic and Information Commission. The Environment Bureau of the Hong Kong SAR Government

77
2017 Sustainable Development Report
Aw
ards and Recognitions
Market Year Bottling Plant / project type / location
Name of Award / Recognition Awarding Organisation
Mainland China 2017 Wuhan “Environmental Protection Green Label Enterprises” in Hubei Province
Hebei Provincial Environment Protection Department
Mainland China 2017 Wuhan Outstanding Cleaner Production Enterprises in Wuhan City
Wuhan Municipal Development and Reform Commission, Wuhan Municipal Environment Protection Bureau
Mainland China 2017 Guangdong, Huizhou Safety Model Enterprise in Guangdong Province
Guangzhou Municipal Public Security Bureau
Mainland China 2017 Wenzhou District’s Advanced Unit in Safe Production Development Zone Safety Supervision Bureau
Mainland China 2017
Hefei
Model Enterprises for Safety Culture in Hefei City
Hefei Safe Production Supervision Bureau
Mainland China 2017 Enterprises with A-level Comprehensive Performance in Hefei Economic and Technological Development Zone
Hefei Economic and Technological Development Zone
Mainland China 2017
Jiangsu
Advanced Unit for Special Equipment Management in Nanjing City
Municipal Bureau of Quality Supervision
Mainland China 2017 Advanced Unit for Safe Production in High-tech Zone
High-tech Zone Management Committee
Mainland China 2017 Xiamen, Guangxi, Shenmei Jinqiao, Shenmei Minhang
Level 2 Enterprise of Safe Production Standardisation
Xiamen Safe Production Management Association, Guangxi Zhuang Autonomous Region Safety Production Supervision Bureau,Shanghai Safe Production Association
Mainland China 2017 Zhanjiang 2016 Advanced Unit for Safe Production in Development Zone
Safe Production Committee of Zhanjiang Economic and Technological Development Zone
Mainland China 2017 Wuhan 2016 Outstanding Unit for Safe Production (Development Zone)
Management Committee of Wuhan Economic and Technological Development Zone, Hannan District People's Government
Hong Kong 2016
Hong Kong
Quality Food Traceability Scheme 2016 - Gold Enterprise Winner
GS1 Hong Kong
Hong Kong 2016 Friends of EcoPark 2015/16 Environmental Protection Department
Hong Kong 2016 Consumer Caring Scheme 2016 GS1 Hong Kong
Hong Kong 2016 Caring Company 2016 The Hong Kong Council of Social Service
Hong Kong 2017 Quality Food Traceability Scheme 2017 - Diamond Enterprise Winner
GS1 Hong Kong
Hong Kong 2017 Certificate of Excellence - Hong Kong Sustainability Award 2017/18
Hong Kong Management Association
Hong Kong 2017 Consumer Caring Scheme 2017 GS1 Hong Kong
Hong Kong 2017 Caring Company 2017 The Hong Kong Council of Social Service
Hong Kong 2017 Energy Saving Charter Electrical and Mechanical Services Department
Taiwan 2016Taiwan
Taiwan Enterprise iSport Award Taiwan iSport
Taiwan 2017 Taiwan Enterprise iSport Award Taiwan iSport
Taiwan 2017 Hefei Model Home of Workers for Anhui Province Anhui General Labour Union
U.S. 2013 Draper (Utah) LEED Silver Certification U.S. Green Building Council
U.S. 2016
Utah
Utah Green Business Award Utah Business Magazine
U.S. 2017 Best of State – Beverage Industry Best of State - Utah
U.S. 2017 Water Champion Salt Lake Chamber

78
2017 Sustainable Development Report
GRI Standard
Disclosure Number and Title Section Page no./ explanation/ reasons for omissions
GRI 101: Universal Disclosures 2016
GRI 102: General Disclosures 2016
102-1 Name of the organisation About this Report P.75
102-2 Activities, brands, products, and services Our Business P.4
102-3 Location of headquarters Our Business P.6
102-4 Location of operations Our Business P.6-7
102-5 Ownership and legal form Our Business P.4
102-6 Markets served Our Business P.6-7
102-7 Scale of the organisation Our Business P.5-7
102-8 Information on employees and other workers Our Business P.6-7
102-9 Supply Chain Product Responsibility - Procurement & Sourcing
P.55-57
102-10 Significant changes to the organisation and its supply chain
Our Business There are no significant changes to the supply chain as a result of the acquisition of new territories bottling plants
102-11 Precautionary principle or approach Approach to Sustainable Development - Corporate Governance & Sustainability Management and Governance
P.11
102-12 External initiatives Performance Tables P.82
102-13 Membership of associations Performance Tables P.82-83
102-14 Statement from senior decision maker Message from our Managing Director
P.2-3
102-16 Values, principles, standards, and norms of behaviour
Approach to Sustainable Development
P.8-13
102-18 Governance structure Approach to Sustainable Development - Corporate Governance
P.10-11
102-40 List of stakeholder groups Approach to Sustainable Development - Sustainability Management and Governance - Engaging Stakeholders
P.12
102-41 Collective bargaining agreements - In Hong Kong, there is no legal framework for collective bargaining with trade unions. In Mainland China, we are normally required to liaise with official trade unions. Employees can present grievances and report improprieties and breaches of the Code of Conduct through established channels.
GRI STANDARDS INDEX TABLE

79
2017 Sustainable Development Report
GR
I Standards Index Table
GRI Standard
Disclosure Number and Title Section Page no./ explanation/ reasons for omissions
102-42 Identifying and selecting stakeholders Approach to Sustainable Development - Sustainability Management and Governance - Engaging Stakeholders
P.12
102-43 Approach to stakeholder engagement Approach to Sustainable Development - Sustainability Management and Governance - Engaging Stakeholders
P.12-13
102-44 Key topics and concerns raised Approach to Sustainable Development - Sustainability Management and Governance - Engaging Stakeholders & Material Issues
P.13
102-45 Entities included in the consolidated financial statements
- Please see Swire Pacific's Annual Report 2017 for more details
102-46 Defining report content and topic boundaries Approach to Sustainable Development - Sustainability Management and Governance - Material Issues
The boundary and scope of material issues are decribed in each section
102-47 List of material topics Approach to Sustainable Development - Sustainability Management and Governance - Material Issues
P.13
102-48 Restatements of information - No applicable
102-49 Changes in reporting - This is Swire Beverages's first report.
102-50 Reporting period About this Report P.75
102-51 Date of most recent report About this Report P.75
102-52 Reporting cycle About this Report P.75
102-53 Contact point for questions regarding the report
About this Report P.75
102-54 Claims of reporting in accordance with the GRI Standards
Approach to Sustainable Development
P.9
102-55 GRI content index GRI Standards Index Table P.78-81
102-56 External assurance - No external assurance for report content
Material Topics
GRI 200: Economic Topics 2016
GRI 204: Procurement Practices 2016
GRI 103 Management Approach 2016 Product Responsibility - Procurement & Sourcing
P.55-57
204-1 Proportion of spending on local suppliers - Under The Coca-Cola System, Swire Beverages's supplier list is already been predetermined by The Coca-Cola Company. Swire Beverages selects suppliers from this list only.
GRI 300: Environmental Topics 2016
GRI 301: Materials 2016
GRI 103 Management Approach 2016 Environment - Packaging and Waste Management
P.38
301-1 Materials used by weight or volume "Environment - Packaging and Waste Management
P.41-43

80
2017 Sustainable Development Report
GRI Standard
Disclosure Number and Title Section Page no./ explanation/ reasons for omissions
GRI 302: Energy 2016
GRI 103 Management Approach 2016 Environment - Carbon P.32-34
302-1 Energy consumption within the organisation Performance Tables P.84-85
302-3 Energy intensity Environment - Carbon P.32-34
GRI 303: Water 2016
GRI 103 Management Approach 2016 Environment - Water Stewardship
P.17
303-1 Water withdrawal by source Environment - Water Stewardship; Performance Tables
P.19 ; P.85
303-3 Water recycled and reused Environment - Water Stewardship; Performance Tables
P.21-22 ; P.85
GRI 305: Emissions 2016
GRI 103 Management Approach 2016 Environment - Carbon P.27
305-1 Direct (Scope 1) GHG emissions Performance Tables P.84
305-2 Energy indirect (Scope 2) GHG emissions Performance Tables P.85
305-6 Emissions of ozone-depleting substances (ODS)
Performance Tables P.85
GRI 306: Effluents and Waste 2016
GRI 103 Management Approach 2016 Environment - Water Stewardship Environment - Packaging and Waste Management
P.21-24 ; P.46-49
306-2 Waste by type and disposal method Performance Tables P.85-86
GRI 307: Environmental Compliance 2016
GRI 103 Management Approach 2016 Compliance and Management Systems
P.68
307-1 Non-compliance with environmental laws and regulations
Food safety and Product Quality
P.57
GRI 400: Social Topics 2016
GRI 403: Occupational Health and Safety 2016
GRI 103 Management Approach 2016 Workplace - Safety P.58
403-2 Types of injury and rates of injury, occupational diseases, lost days, and absenteeism, and number of work-related fatalities.
Workplace - Safety Performance Tables
P.60-63 ; P.87

81
2017 Sustainable Development Report
GRI Standard
Disclosure Number and Title Section Page no./ explanation/ reasons for omissions
GRI 405: Diversity and Inclusion 2016
GRI 103 Management Approach 2016 Workplace - Gender Equality P.65-67
405-1 Diversity of governance bodies and employees Performance Tables P.88
GRI 413: Local Communities 2016
GRI 103 Management Approach 2016 Community Engagement P.69-70
413-1 Operations with local community engagement, impact assessments, and development programs
Community Engagement Performance Tables
P.70-73 ; P.88
GRI 417: Marketing and Labeling 2016
GRI 103 Management Approach Product Responsibility - Product Labelling and Marketing
P.54
417-1 Requirements for product and service information and labelling
Product Responsibility - Product Labelling and Marketing
P.54
GRI 419: Socioeconomic Compliance 2016
GRI 103 Management Approach 2016 Compliance and Management Systems
P.68
419-1 Non-compliance with laws and regulations in the social and economic area
- There were no reported cases of non-compliance during the reporting period.
Additional materials topics not covered by the topic-specific Standards
Sugar
GRI 103 Management Approach 2016 Product Responsibility - Product Choice
P.51
Indicator Percent of portfolio with low sugar options in each market
Product Responsibility - Product Choice
P.53
Food Safety and Product Quality
GRI 103 Management Approach 2016 Product Responsibility - Food Safety and Product Quality
P.57
Indicator Non-compliance with relevant laws and regulations
- There were no reported cases of non-compliance during the reporting period.
GR
I Standards Index Table

82
2017 Sustainable Development Report
PERFORMANCE TABLES
Hong Kong
Energy Saving Charter 2017 on Indoor Temperature 2017
Hong Kong Green Organisation 2015 to 2017
Hong Kong
The Hong Kong Beverages Association Limited Executive Committee Member
GS1 - The Global Language of Business Board Member
Efficient Consumer Response Chairman
Green Cross Group Member
Grocery Trade Magazine Honour Advisory Board Member
Mainland China
Anhui Provincial Foreign Investor Association Member
China Beverage Industry Association Member; Executive Director
Jiangsu Province Food Safety Association Member
Nanjing Business Association Executive Director
Nanjing Foreign Investment Association Vice President
Nanjing Food Industry Association Vice President
Nanjing Food Association Vice President
Mainland China
Guangdong Food Safety Society (member) 2017
China Beverages Association (director) 2017
Shanghai Food Safety Federation 2013
Shanghai Pudong Food Safety Management Association 2011
Shanghai Association for Food & Cosmetic Quality Safety Management 2009
U.S.Clean Utah, a program of Utah DEQ 2016
Rain Barrel Project, with TCCC and The River Network 2017
External initiatives
Membership of associations

83
2017 Sustainable Development Report
Perform
ance Tables
Mainland China
Xiamen Printing Association Member
Standardization Technical Committee for Plastic Products of Fujian Province
Member
Fujian Food Science and Technology Society Member
Guangzhou Circular Economy Cleaner Production Association Member
Zhengzhou Food Safety Association Member
Mainland China
Henan Association for Foreign Investment Vice President
Henan Enterprise Association Vice President
Zhengzhou Enterprise Association Vice President
Zhengzhou Food Industry Association Vice President
U.S.
American Beverage Association Member
State Beverage Associations Member
Coca-Cola Bottling Association Member
Various governance boards of TCCC Member
Bonneville Environmental Foundation Partner
Utah Open Lands Partner
Trout Unlimited Partner
The River Network Partner
Colorado Water Trust Partner
UCAIR (Utah Clean Air Partership) Partner
Business for Water Stewardship Partner
Change the Course Member
Taiwan
Taiwan Beverage Industry Association Director
Taiwan Food Industry Development Association Executive Director
American Chamber of Commerce in Taipei Member
European Chamber of Commerce Taiwan (joined under the name Swire Beverages)
Member

84
2017 Sustainable Development Report
Legacy Territories New Territories OVERALL TOTAL
Unit TOTAL Hong Kong Mainland China
Taiwan U.S. TOTAL Mainland China
U.S.
Energy - Direct
Stationary source
Diesel GJ - - - - - 2,169 2,169 - 2,169
Towngas GJ 71,331 71,331 - - - - - - 71,331
Natural gas GJ 193,779 - 75,576 65,644 52,558 217,276 64,561 152,715 411,055
Liquid petroleum gas GJ 14 - 14 - - 8,282 8,282 - 8,296
Mobile source
Diesel GJ 394,957 31,478 74,035 17,568 271,8761 64,795 64,795 - 459,752
Gasoline GJ 136,266 3,725 7,082 8,055 117,403 4,632 4,632 - 140,898
Energy - Indirect
Towngas GJ 70,331 70,331 - - - - - - 70,331
Electricity GJ 2,660,716 99,224 2,479,591 41,858 40,043 588,343 431,203 157,140 3,249,059
Steam GJ 7,370 7,370 - - 85,490 85,490 - 92,860
Direct energy consumption by primary source
GJ 796,348 106,535 156,708 91,267 441,838 297,154 144,439 152,715 1,093,502
Indirect energy consumption by primary source
GJ 2,738,417 169,554 2,486,961 41,858 40,043 673,833 516,693 157,140 3,412,250
Total GJ 3,534,765 276,089 2,643,668 133,126 481,881 970,987 661,132 309,854 4,505,752
Carbon
Scope 1 - Direct GHG Emissions from Stationary Source
Diesel Litres 58,851 - 58,851 - - 60,243 60,243 - 119,094
Towngas MJ 71,331,024 71,331,024 - - - - - - 71,331,024
Natural gas MJ 193,779,274 - 75,576,477 65,644,418 52,558,379 217,275,656 64,560,955 152,714,701 411,054,930
Liquid petroleum gas MJ 303 - 303 - - 180,053 180,053 - 180,356
Subtotal CO2e 13,720 3,794 3,888 3,353 2,685 16,837 9,034 7,803 30,557
Scope 1 - Direct GHG Emissions from Mobile Source
Diesel Litres 10,971,037 874,396 2,056,532 487,991 7,552,1181 1,799,858 1,799,858 - 12,770,895
Gasoline Litres 4,167,159 113,925 216,576 246,342 3,590,316 141,657 141,657 - 4,308,816
Subtotal CO2e 37,842 2,616 5,794 1,819 27,613 123,061 95,448 27,613 160,903
Environmental Performance Table
Note:1 The figure presented includes both legacy territories and new territories.
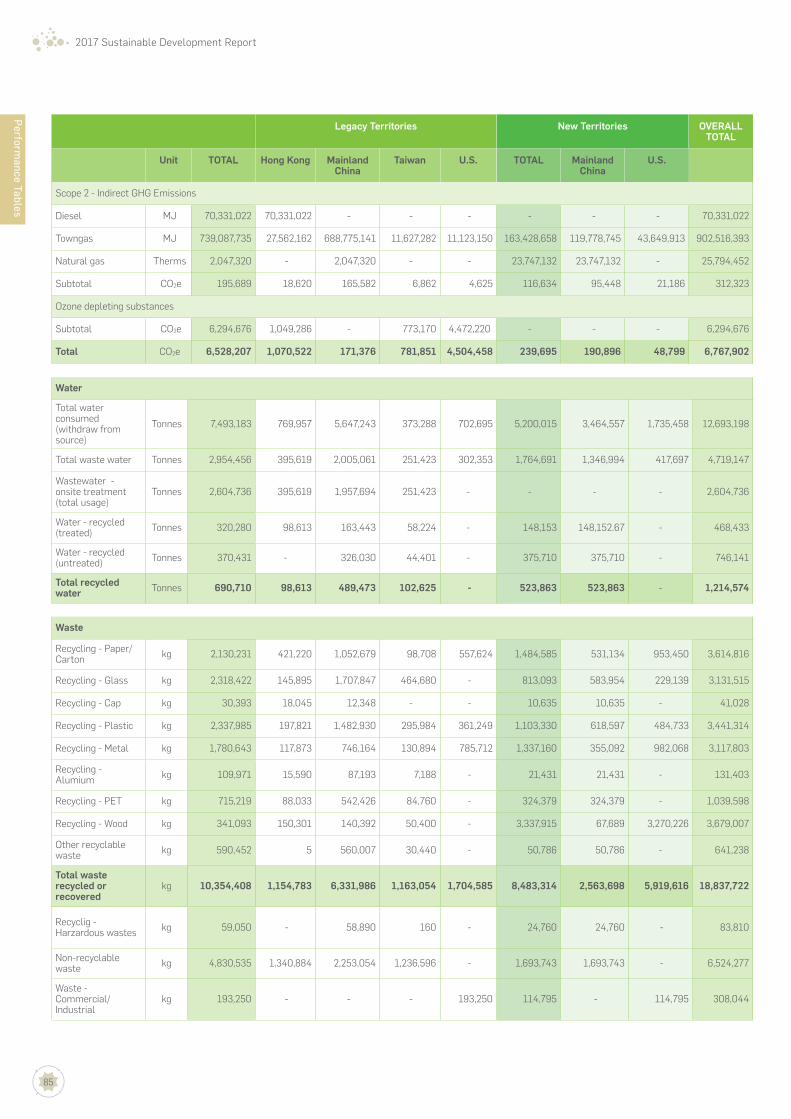
85
2017 Sustainable Development Report
Water
Total water consumed (withdraw from source)
Tonnes 7,493,183 769,957 5,647,243 373,288 702,695 5,200,015 3,464,557 1,735,458 12,693,198
Total waste water Tonnes 2,954,456 395,619 2,005,061 251,423 302,353 1,764,691 1,346,994 417,697 4,719,147
Wastewater - onsite treatment (total usage)
Tonnes 2,604,736 395,619 1,957,694 251,423 - - - - 2,604,736
Water - recycled (treated) Tonnes 320,280 98,613 163,443 58,224 - 148,153 148,152.67 - 468,433
Water - recycled (untreated) Tonnes 370,431 - 326,030 44,401 - 375,710 375,710 - 746,141
Total recycled water Tonnes 690,710 98,613 489,473 102,625 - 523,863 523,863 - 1,214,574
Legacy Territories New Territories OVERALL TOTAL
Unit TOTAL Hong Kong Mainland China
Taiwan U.S. TOTAL Mainland China
U.S.
Scope 2 - Indirect GHG Emissions
Diesel MJ 70,331,022 70,331,022 - - - - - - 70,331,022
Towngas MJ 739,087,735 27,562,162 688,775,141 11,627,282 11,123,150 163,428,658 119,778,745 43,649,913 902,516,393
Natural gas Therms 2,047,320 - 2,047,320 - - 23,747,132 23,747,132 - 25,794,452
Subtotal CO2e 195,689 18,620 165,582 6,862 4,625 116,634 95,448 21,186 312,323
Ozone depleting substances
Subtotal CO2e 6,294,676 1,049,286 - 773,170 4,472,220 - - - 6,294,676
Total CO2e 6,528,207 1,070,522 171,376 781,851 4,504,458 239,695 190,896 48,799 6,767,902
Waste
Recycling - Paper/Carton kg 2,130,231 421,220 1,052,679 98,708 557,624 1,484,585 531,134 953,450 3,614,816
Recycling - Glass kg 2,318,422 145,895 1,707,847 464,680 - 813,093 583,954 229,139 3,131,515
Recycling - Cap kg 30,393 18,045 12,348 - - 10,635 10,635 - 41,028
Recycling - Plastic kg 2,337,985 197,821 1,482,930 295,984 361,249 1,103,330 618,597 484,733 3,441,314
Recycling - Metal kg 1,780,643 117,873 746,164 130,894 785,712 1,337,160 355,092 982,068 3,117,803
Recycling - Alumium kg 109,971 15,590 87,193 7,188 - 21,431 21,431 - 131,403
Recycling - PET kg 715,219 88,033 542,426 84,760 - 324,379 324,379 - 1,039,598
Recycling - Wood kg 341,093 150,301 140,392 50,400 - 3,337,915 67,689 3,270,226 3,679,007
Other recyclable waste kg 590,452 5 560,007 30,440 - 50,786 50,786 - 641,238
Total waste recycled or recovered
kg 10,354,408 1,154,783 6,331,986 1,163,054 1,704,585 8,483,314 2,563,698 5,919,616 18,837,722
Recyclig - Harzardous wastes kg 59,050 - 58,890 160 - 24,760 24,760 - 83,810
Non-recyclable waste kg 4,830,535 1,340,884 2,253,054 1,236,596 - 1,693,743 1,693,743 - 6,524,277
Waste - Commercial/Industrial
kg 193,250 - - - 193,250 114,795 - 114,795 308,044
Perform
ance Tables

86
2017 Sustainable Development Report
Legacy Territories New Territories OVERALL TOTAL
Unit TOTAL Hong Kong Mainland China
Taiwan U.S. TOTAL Mainland China
U.S.
Total waste generated 15,437,242 2,495,667 8,643,930 2,399,810 1,897,835 10,316,611 4,282,200 6,034,411 25,753,854
Recycled solid waste % 67% 46% 73% 48% 90% 82% 60% 98% 73%
Packaging Footprint - Primary Packaging
vPET Tonnes 110,051 4,102 96,492 4,064 5,393 - - - 110,051
BioPET Tonnes 438 122 - - 316 - - - 438
rPET Tonnes 804 - - - 804 - - - 804
Glass Tonnes 4,290 403 3,406 481 - - - - 4,290
Aluminium Tonnes 22,434 3,842 9,616 1,371 7,605 8,158 5,918 2,240 30,592
Caps/closures: PP Tonnes 10,369 506 8,836 53 974 4,245 4,245 - 14,614
Aseptic fibre packs Tonnes 1,427 1,238 - 189 - 352 - 352 1,779
Packaging Footprint - Secondary & Tertiary Packaging
Corrugated Box, Paper Tray Tonnes 16,770 3,620 10,223 2,927 - - - - 16,770
Shrink foil Tonnes 10,438 507 9,325 412 194 5 - 5 10,443
Total weight of material used Tonnes 177,021 14,340 137,898 9,497 15,286 12,760 10,163 2,597 189,781

87
2017 Sustainable Development Report
Social Performance Table
Workforce Legacy Territories New Territories
Hong Kong Mainland China
Taiwan U.S. Mainland China
U.S.
Number of employees under permanent contract
Male 937 9,441 646 1,716 5,200 4,023
Female 374 2,979 213 292 2,407 643
Total 1,311 12,420 859 2,008 7,607 4,666
Number of employees under temporary and fixed term contract
Male 124 0 11 0 0 0
Female 14 0 17 0 0 0
Total 138 0 28 0 0 0
Total number of employees including permanent and temporary & fixed contracts
Total 1,449 12,420 887 2,008 7,607 4,666
Gender and Diversity Legacy Territories New Territories
Hong Kong Mainland China
Taiwan U.S. Mainland China
U.S.
Number of female in workforce 388 2,979 230 292 2,407 643
Percent of female in workforce 27% 24% 26% 15% 32% 14%
Hong Kong Mainland China Taiwan U.S.
Proportion of workforce by age group
>30 17.7% 27.4% 9.2% 28.3%
30-50 69.1% 68.3% 69.2% 51.8%
50+ 13.2% 4.3% 21.7% 19.9%
Proportion of workforce by employment category
Top/senior management 1.5% 0.5% 1.3% 0.8%
Middle/junior management and supervisory 23.1% 7.0% 22.7% 26.0%
Customer facing staff 10.8% 56.3% 22.5% 45.0%
Non-customer facing operational/technical staff 56.1% 29.4% 29.0% 28.2%
Other 8.5% 6.9% 24.6% 0.0%
Employee Safety Legacy Territories New Territories
Hong Kong Mainland China
Taiwan U.S. Mainland China
U.S.
Total number of work-related fatalities 0 1 0 1 1 0
Lost time injury rates 1.44 0.3 0.32 0.831 0.34 0.831
Perform
ance Tables
Note:1 Includes both legacy territories and new territories.

88
2017 Sustainable Development Report
Community Engagement Legacy Territories New Territories
Hong Kong Mainland China
Taiwan U.S. Mainland China
U.S.
Cash donations (HKD$) 410,670.00 589,551.25 119,072.00 2,278,723.00 487,286.16 N/A
No. of charity events 11 15 6 10 12 0
Number of employees on volunteering team 96 2,888 279 0 1,111 0
Volunteering hours outside of office hours 2,166.75 3,408 1,116 0 1,055 0
Volunteering hours during office hours 14.5 5,564 0 0 5,257 0
Total volunteering hours 2,181.25 8,972 1,116 0 6,312 0
Gender and Diversity Legacy Territories
Hong Kong Mainland China Taiwan U.S.
Proportion of female employees by employment catorgory
Top/senior management 35.0% 13.5% 27.3% 18.5%
Middle/junior management and supervisory 41.6% 26.9% 29.2% 16.2%
Customer facing staff 54.6% 28.7% 21.2% 8.5%
Non-customer facing operational/technilca staff 11.3% 14.1% 9.6% 20.7%
Other 72.3% 61.1% 41.7% 0.0%
Number of Board Members
By gender
Female 1
Male 7
By age group
Under 30 0
30-50 years old 2
Over 5- years old 6

89
2017 Sustainable Development Report
Glossary GLOSSARY
Aseptic Fibre Pack A type of primary packaging which is multi-layer (paper and other). This packaging type can go by the trade names of Tetra Pak and Combibloc among others.
Aseptic line Aseptic processing is a process by which a product is sterilized and then filled in a sterile container and filling conditions at cold temperature.
Beyond Economic Repair When the cost of repair in financial terms exceeds the cost of replacement.
BIB Bag in box (BIB) refers to the packaging material containing beverage syrup used in fountain dispensers. Type LDPE - type 4 - plastic bladder in a cardboard box.
Carboy Primary packaging for large volumes of water used in water dispensers. Type 7 plastic.
CDE Cold Drink Equipment (CDE) includes vending machines, coolers and fountains.
CFC Chlorofluorocarbons (CFC) are fully halogenated paraffin hydrocarbons that contain only carbon, chlorine, and fluorine, produced as volatile derivative of methane, ethane, and propane. They are also commonly known by the DuPont brand name Freonare. Many CFCs have been widely used as refrigerants, propellants (in aerosol applications), and solvents. Because CFCs contribute to ozone depletion in the upper atmosphere, the manufacture of such compounds has been phased out under the Montreal Protocol, and they are being replaced with other products such as hydrofluorocarbons (HFCs) (e.g., R-410A) and R-134a.
CIP Clean in place (CIP) refers to the cleaning and sanitation of production equipment when switching production lines from manufacturing one beverage type to another.
Climate Action Plan 2030+ The Hong Kong Government's long-term action plan in combating climate change, including carbon emission reduction targets for 2030.
CO2 Carbon Dioxide, and in the context of cold drink equipment, it is an alternate form of refrigerant that does not contribute to ozone depletion.
Co-packer Third party contract bottlers who produce and supply beverages.
Collection A logistic process of redirecting waste to a place where is can be recovered.
COP Conference of Parties
Direct Goods A category of raw materials which are sourced for manufacturing or packaging beverages.
EPA Taiwan Environmental Protection Agency Executive Yuan
ERM Enterprise Risk Management
EUR Energy Use Ratio (EUR) is the amount of energy used to produce one litre of beverage. It is a Coca-Cola metric.
GHG Greenhouse gases (GHG) are types of gases that trap heat in the atmosphere.
GRI Global Reporting Initiative (GRI) is an international independent standards organisation that helps businesses understand and communicate their impacts on environmental and social issues.
GRM Group Risk Management
GRMC Group Risk Management Committee
HFC Organic compounds that contain fluorine and hydrogen atoms, they, are the most common type of organofluorine compounds. They are commonly used in air conditioning and as refrigerants in place of the older chlorofluorocarbons such as R-12 and hydrochlorofluorocarbons such as R-21. They do not harm the ozone layer as much as the compounds they replace; however, they do contribute to global warming. Their atmospheric concentrations and contribution to anthropogenic greenhouse gas emissions are rapidly increasing, causing international concern about their radiative forcing. In September 2016, the New York Declaration on Forests urged a global reduction in the use of HFCs. On 15 October 2016, due to these chemicals' contribution to climate change, negotiators from 197 nations meeting at the summit of the United Nations Environment Programme in Kigali, Rwanda reached a legally-binding accord to phase out hydrofluorocarbons (HFCs) in an amendment to the Montreal Protocol.
HDPE High-density polyethylene (HDPE) is a type 2 plastic, and is used in this context for closures and closure rings on PET plastic bottles, amongst other things.

90
2017 Sustainable Development Report
Hot fill A process by which a product is sterilised and then filled at a high temperature in order to sterilise the inside of the container.
Indirect Goods A category of materials procured for marketing beverage products.
LEED Leadership in Energy and Environmental Design (LEED) is a rating system devised by the United States Green Building Council.
Legacy Territories Bottling plants and associated operations already owned by Swire Beverages prior to the acquisitions in mid-2017.
Lightweighting Redesigning primary packaging to reduce the weight of packaging materials.
Low-sugar Beverages that contain 2.5g of sugar or less for every 100ml.
Manufacturing Volume The amount of water used to manufacture beverages, such as the water used for cleaning. It excludes the amount of water that is used inside beverages.
NEPC New Plastic's Economy (NEPC) is an initiative of the Ellen MacArthur Foundation.
New Energy Policy Taiwan Government's policy to establish a low-carbon energy system by working towards being nuclear-free, developing the use of renewable energy and expanding the use of natural gas.
New Territories Bottling plants and associated operations acquired by Swire Beverages in the territory re-alignment of mid-2017.
NGO Non-government organisation
NPSG National Product Supply Group (NPSG) is a coalition of bottlers working together to optimise collaboration between bottlers within the Coca-Cola System in the U.S.
NRG Non-returnable glass bottle
'Other' packaging Packaging materials including festive merchandise packaging and giveaways during holiday periods and marketing materials associated with shop signage, coolers, note books, clothing, umbrellas, and others.
Paris Agreement The Paris Agreement central aim is to strengthen the global response to the threat of climate change by keeping a global temperature rise this century well below 2 degrees Celsius above pre-industrial levels and to pursue efforts to limit the temperature increase even further to 1.5 degrees Celsius. Additionally, the agreement aims to strengthen the ability of countries to deal with the impacts of climate change. To reach these ambitious goals, appropriate financial flows, a new technology framework and an enhanced capacity building framework will be put in place, thus supporting action by developing countries and the most vulnerable countries, in line with their own national objectives. The Agreement also provides for enhanced transparency of action and support through a more robust transparency framework.
Pasteurisation A process by which a product is treated by heat to eliminate viable microbiological load in the product.
PET Polyethylene terephthalate (PET) is a type 1 plastic, and in this context is the raw material for soft drink plastic bottles.
Post-Consumption Material generated by the end-user of a product that has fulfilled its intended purpose or can no longer be used
Pouch A type of primary packaging which is a multilayer foil, squeezy in nature and generally with a plastic screw top. It could also be a package with a tear top if containing powder.
PP Polypropylene (PP) is a type 5 plastic, and in this context is often the raw material for labels.
Primary Packaging The packaging layer that first envelops the product and holds it (i.e. bottle, label, closure, closure ring).
Production Volume The volume (unit cases) of beverages manufactured.
Recovery Conversion of waste so that it can be used again for its original purpose or other purposes, other purposes can include generating energy.
Recycled Content In reference to primary packaging, this term refers to the amount of recycled content contained within the primary package.

91
About this R
eport
2017 Sustainable Development Report
Recycling Conversion of waste so that it can be used again for its original purpose or other purposes with the exception of generating energy.
RGB Returnable glass bottle
rPET Recycled PET
Sales Volume The amount of physical unit cases of beverages sold in an accounting period.
Science Based Targets (SBT) Targets to bring corporate (and countries) emissions in line with the climate goals set by The Paris Agreement (COP 21).
Scope 1 Emission Direct greenhouse gas from sources owned or controlled by the company (i.e. vehicles and boilers)
Scope 2 Emission Greenhouse gas emissions from indirect sources such as purchased electricity used within our operations and facilities.
Scope 3 Emission Referred to as other indirect greenhouse gas emissions. They are a consquence of the activities of the company, but occur from sources not owned or controlled by the company.
Secondary Packaging Used to group individual beverage containers together
SGP The Suppliers Guiding Principles (SGP) is a set of guidelines issued by The Coca-Cola Company provide an overarching set of standards we expect from our suppliers covering workplace policies, health and safety, human rights, environmental protection and business integrity.
SGSC Swire Group Sustainability Committee
Sludge Semi-solid by-product generated from wastewater treatment process.
Sparkling Sparkling category is a segment of the soft drinks category and refers to products that a carbonated.
TCCC The Coca-Cola Company
Tertiary Packaging Packaging that is used for bulk handling (i.e. steel drums for juices, slip trays, pallets, hard plastic crates), warehouse storage and shipping.
TPM Total Product Management system (TPM) is integrated across our entire operations including procurement, manufacturing, warehousing, and distribution to consumers. It identifies the necessary processes to protect products from being damaged or contaminated.
Unit Case One unit case = 24 x 8 ounce servings.
WUR Water Usage Ratio (WUR) is the amount of water used to produce one litre of beverage.

92
2017 Sustainable Development Report
2017 Sustainable Development Report