sustainable community forestry management in lombok, … · awlr automatic water level recorder...
TRANSCRIPT

Sustainable Community Forestry
Management in Lombok, Indonesia
Diswandi Diswandi
Bachelor Economics STIE Kerjasama, Indonesia
M.Sc. Economics Universitas Gadjah Mada, Indonesia
This thesis is presented for the degree of Doctor of Philosophy of Murdoch
University
2017
i
For my wife Suzana Noviyanti Dewi
and
my daughters Syahfa Viandy Kamila and Marwa Viandy Madina

ii
Declaration
I declare that this thesis is my own account of research and contains as its main
content work which has not previously been submitted for a degree at any tertiary
education institution
--------------------------
Diswandi Diswandi
June, 2017

iii
Publication
A part of this thesis has been published in Ecosystem Services Journal:
Diswandi, D. (2017). A hybrid Coasean and Pigouvian approach to Payment for
Ecosystem Services Program in West Lombok: Does it contribute to
poverty alleviation? Ecosystem Services, 23, 138-145.
https://doi.org/10.1016/j.ecoser.2016.12.005

iv
Abstract
Deforestation is a serious problem in Indonesia as a result of forest concessions that
were granted by the government to private companies. The forest destruction was
also caused by the encroachment by villagers during the political chaos and lack of
law enforcement following the collapse of the New Order regime in 1998. In
Lombok, villagers entered forests around their village, logged the trees and
occupied the forests to plant fruit trees. As a response to this encroachment, the
Indonesian government encouraged local participation by involving communities
in forest management, which eventually developed into a community forestry
management scheme. However, improper management by the forest farmers has
generated negative externalities, primarily a reduction in the quantity and quality of
water supply produced from the forest. To address the negative externalities
problem, the local government in West Lombok developed a system of Payment for
Ecosystem Services (PES). Importantly, the PES program in West Lombok was
integrated with the Community Forestry program, designed for forest conservation
and poverty alleviation.
This study investigates the impact of the integrated Community Forestry and PES
programs on local forest conservation and socio-economic improvement. The study
utilises “participatory econometrics” as a mixed quantitative and qualitative
research method. The research included in-depth interviews, field visits, surveys, a
focus group discussion and aerial photo analysis.
This thesis found that the PES program in West Lombok is a hybrid system that
combines Coasean and Pigouvian theory. In conjunction with the Community
Forestry program, the PES program could produce a sustainable outcome in the
long term. This is confirmed by empirical evidence, as integrated PES and the
Community Forestry program accommodates local needs, and can be used as a tool
for forest conservation and the improvement of socio-economic conditions in the
long term.
Keywords: Community forestry, Payment for Ecosystem Services (PES), Forest
conservation, Poverty alleviation.

v
Table of Contents
Declaration .............................................................................................................. ii
Publication ............................................................................................................. iii
Abstract .................................................................................................................. iv
Table of Contents .................................................................................................... v
List of Tables........................................................................................................ viii
List of Figures ........................................................................................................ ix
Abbreviations and Acronyms ................................................................................. xi
Glossary ............................................................................................................... xiv
Acknowledgement............................................................................................... xvii
Chapter 1 Introduction ......................................................................................... 1
1.1. Background and Context of the Study ......................................................... 1
1.2. Research Questions ...................................................................................... 8
1.3. Case Study Location ..................................................................................... 8
1.4. Research Methodology ............................................................................... 10
1.4.1. Data Sources ........................................................................................ 11
1.4.2. Survey Design ...................................................................................... 11
1.4.3. In-Depth Interviews ............................................................................. 12
1.4.4. Focus Group Discussion ...................................................................... 12
1.4.5. Field Visits ........................................................................................... 12
1.4.6. Data Analysis ....................................................................................... 13
1.5. Chapter Outline .......................................................................................... 13
Chapter 2 Theoretical Background and Literature Review ........................... 15
2.1. The Commons Resources ........................................................................... 15
2.2. Community Forestry ................................................................................... 25
2.2.1. Community Forests as Common Resources ........................................ 25
2.2.2. Impact of Community Forestry upon Local Economy and
Ecology .......................................................................................................... 27
2.3. Payment for Ecosystem Services ............................................................... 30
2.3.1. Definition of PES ................................................................................. 30
2.3.2. The Emergence of PES ........................................................................ 33
2.3.3. Two Paradigms Regarding PES ........................................................... 34
2.3.4. Alternative PES Schemes .................................................................... 36
2.3.5. PES and Poverty Alleviation ............................................................... 37
2.3.7. Guidance for PES System Development ............................................. 40

vi
2.3.8. PES Application in the World ............................................................. 41
2.4. Conclusion .................................................................................................. 45
Chapter 3 Forest Management, Community Forestry and Adat
Rules ..................................................................................................................... 48
3.1. Historical Forest Governance and Deforestation in Lombok ..................... 48
3.2. Community Forestry Management Scheme and Adat Rules ...................... 55
3.2.1. Case Study of Sesaot Community Forest ............................................ 57
3.2.2. Awiq-awiq and Sustainable Forest Management ................................. 63
3.3. Role of the Outsider in Community Forestry Management ....................... 67
3.4. Conclusion .................................................................................................. 69
Chapter 4 Integrated Payment for Ecosystem Services and
Community Forestry Management ................................................................... 71
4.1. Development of the PES Program in West Lombok .................................. 71
4.2. Intermediary Organization for the PES Program ....................................... 79
4.3. Demand Side of the PES Program ............................................................. 82
4.4. Supply Side of the PES Program ................................................................ 84
4.5. Contracts under the PES System ................................................................ 90
4.6. New Paradigm on PES Literature .............................................................. 93
4.7. Conclusion .................................................................................................. 94
Chapter 5 Community Forestry, Payment for Ecosystem Services
and Forest Conservation .................................................................................... 97
5.1. Community Forestry Development and Forest Conservation .................... 97
5.2. Forest Farmers’ Experiences and Views on the Impact of the
Community Forestry Program on Forest Conservation .................................. 104
5.3. Payment for Ecosystem Services Program and Forest Conservation ....... 111
5.4. Conclusion ................................................................................................ 117
Chapter 6 Community Forestry, Payment for Ecosystem Services
and Local Socio-Economic Conditions ............................................................ 121
6.1. Community Forestry Impacts on Local Socio-Economic Conditions ...... 121
6.1.1. Direct Socio-Economic Benefits of Community Forestry ................. 124
6.1.2. Indirect Socio-Economic Benefits of Community Forestry .............. 126
6.2. Villagers' Views on the Effect of Community Forestry on Their
Livelihoods and on Poverty Reduction ........................................................... 128
6.3. Socio-Economic Benefits from Integrating PES into a Community
Forestry Program ............................................................................................. 130
6.3.1. Villagers’ Views on the Effect of PES on Their Livelihood
and Poverty Reduction ................................................................................. 131
6.3.2. Welfare Index to Measure the Socio-Economic Impact of
Integrated PES and Community Forestry .................................................... 133
6.4. Conclusion ................................................................................................ 144
vii
Chapter 7 Statistical Analysis of Community Forestry and PES
Impact on Forest Conservation and Socio-Economic Conditions ................ 146
7.1. Data Sources and Classification ............................................................... 147
7.1.1. Community Forestry Index ................................................................ 149
7.1.2. Payment for Ecosystem Service Program .......................................... 150
7.1.3. Adat/Local institutions ....................................................................... 150
7.1.4. Property Rights .................................................................................. 151
7.1.5. Community Forest Land Size ............................................................ 152
7.1.6. Welfare Measure as Proxy for Socio-Economic Conditions ............. 152
7.1.7. Forest Cover ....................................................................................... 153
7.2. Regression Model ..................................................................................... 154
7.2.1. Model for Conservation ..................................................................... 154
7.2.2. Model for Socio-Economic Conditions ............................................. 155
7.3. Regression Process ................................................................................... 157
7.3.1. Ordinary Least Square Regression Analysis ..................................... 158
7.3.2. Seemingly Unrelated Regression (SUR) ........................................... 162
7.5. Conclusion ................................................................................................ 164
Chapter 8 Conclusion and Policy Recommendations .................................... 167
8.1. Thesis Conclusions ................................................................................... 169
8.2. Policy Recommendations ......................................................................... 177
8.3. Future Research ........................................................................................ 180
Appendixes ......................................................................................................... 182
Appendix 1.1. Questionnaire for Household Survey (Bahasa Indonesia
Version) ........................................................................................................... 182
Appendix 1.2. Questionnaire for Household Survey (English Version) ......... 197
Appendix 1.3 Indicative Interview Questions (Bahasa Indonesia
Version) ........................................................................................................... 211
Appendix 1.4 Indicative Interview Questions (English Version) ................... 213
Appendix 3.1 Awiq-awiq Forum Kawasan ...................................................... 215
Appendix 4.1 IMP Report Published on Local Media (Lombok Post, 30
May 2011) ....................................................................................................... 219
Appendix 5.1 Global Forest Watch - Forest Change Analysis ....................... 220
Appendix 5.2 T Test for Farmers’ Logging Practice before and after
establishment of Community Forestry Program ............................................. 221
Appendix 6.1 T test for House Ownership before and after establishment
of Community Forestry Program .................................................................... 222
Appendix 7.1 Regression Result ..................................................................... 223
Bibliography ...................................................................................................... 226

viii
List of Tables
Table 1.1 Sub-districts and Villages in Lombok ................................................... 10
Table 2.1 Institutional Design Principles for Sustainable Common
Resource Governance ........................................................................... 23
Table 2.2 Examples of PES Schemes ................................................................... 42
Table 3.1 Official HKm Forest Management in Lombok ..................................... 56
Table 3.2 Population of Villages around Sesaot Forest ........................................ 58
Table 4.1 Forest Area in Lombok Classified by Management Unit ..................... 75
Table 4.2 PES Fund Allocation ............................................................................. 80
Table 4.3 Distribution of PES Funding to CFFGs, 2010 - 2014 ........................... 88
Table 6.1 Summary of Welfare Indicators Before and After
Community Forestry and PES Programs were Established ............... 134
Table 7.1 Data Description ................................................................................. 148
Table 7.2 Community Forestry Effectiveness Indicators .................................... 149
Table 7. 3 Descripive Statistics of Model 1.1 ..................................................... 158
Table 7.4 Descriptive Statistics of Model 2.1 ..................................................... 160
Table 8.1 Summary of Statistical Influence of the Community
Forestry Index, Property Rights, Adat Rules, PES and
Community Forest Land Size on Conservation and Socio-
economic Conditions .......................................................................... 173

ix
List of Figures
Figure 1.1 The World’s Biggest Contributors to Global Warming and
Anthropogenic Climate Change (by % of CO2 emissions) .................... 2 Figure 1.2 Map of Lombok Island ........................................................................... 9
Figure 2.1 Guidance for PES System Development .............................................. 41
Figure 3.1 Chronological Story of Indonesia Forest Governance.......................... 55 Figure 3.2 Map of Sesaot Forest ............................................................................ 57 Figure 3.3 Villagers' Occupations in Surrounding Sesaot Forest .......................... 58 Figure 3.4 Farmers' Obedience to Awiq-awiq ....................................................... 64 Figure 3.5 Farmers Opinion that the Awiq-awiq Influences Forest
Condition .............................................................................................. 65
Figure 3.6 Farmers’ Opinion on the Importance of NGO Involvement ................ 68
Figure 4.1 Map of Forest Area in Lombok Island ................................................. 74 Figure 4.2 Timeline of PES Development in Lombok .......................................... 77 Figure 4.3 PDAM Water Use in West Lombok, 2009-2013.................................. 84 Figure 4.4 PES Payments from Water Consumers in West Lombok,
2009–2015 ............................................................................................ 84 Figure 4.5 Map of PES Program Location in Lombok .......................................... 86
Figure 5.1 Farmers’ Acknowledging Involvement in Timber Theft
Prior to Establishment of the Community Forestry Program ............. 105 Figure 5.2 Farmers’ Acknowledging Involvement in Timber Theft
Post Establishment of the Community Forestry Program .................. 106 Figure 5.3 Farmers’ Experience of Timber Theft in Their Community
Forest .................................................................................................. 106 Figure 5.4 Farmers’ Knowledge of Timber Theft by Others Including
Inside and Outside the Community Forest ......................................... 107 Figure 5.5 Farmers’ Assessment of Changes in the Number of Trees in
the Community Forest ........................................................................ 108
Figure 5.6 Farmers’ Opinion on the Impact of Community Forestry on
Reducing Deforestation ...................................................................... 108 Figure 5.7 Forest Cover Loss in Sesaot Forest, 2002 – 2014 .............................. 109 Figure 5.8 Satellite Photo of Sesaot Community Forestry and Illegal
Logging Location in 2015 .................................................................. 111 Figure 5.9 Farmers’ Perception of Change in Number of Trees on
Community Forest Land due to PES .................................................. 114 Figure 5. 10 Farmers’ Perception of Forest Cover Quality
Improvement due to PES .................................................................... 115 Figure 5.11 Degraded Forest Land Area in Narmada sub District
Including Sesaot, 2010 – 2014 ........................................................... 117
Figure 6.1 Comparison of House Ownership Before and After
Community Forestry and PES were Established ................................ 136
Figure 6.2 Comparison of House Wall Material Before and After
Community Forestry and PES were Established ................................ 137 Figure 6.3 Comparison of House Floor Material Before and After
Community Forestry and PES were Established ................................ 137
x
Figure 6.4 Comparison of Access to Electricity Before and After
Community Forestry and PES were Established ................................ 138 Figure 6.5 Comparison of Access to Water Supply Before and After
Community Forestry and PES were Established ................................ 139 Figure 6.6 Comparison of Energy Used for Cooking Before and After
Community Forestry and PES were Established ................................ 141
Figure 6.7 Comparison of Transport Ownership Before and After
Community Forestry and PES were Established ................................ 141 Figure 6.8 Comparison of Communication Facility Before and After
Community Forestry and PES were Established ................................ 142 Figure 6.9 Comparison of Education Level Before and After
Community Forestry and PES were Established ................................ 143

xi
Abbreviations and Acronyms
APBN Anggaran Pendapatan dan Belanja Negara / National
Budget Planning
AWLR Automatic Water Level Recorder
BAPPEDA Badan Perencanaan Pembangunan Daerah / Regional
Development Plan Agency
BKSDA Balai Konservasi Sumber Daya Alam/ Natural
Resources Conservation Unit
BPHLSW Badan Pengelola Hutan Lindung Sungai Wain / Sungai
Wain Protected Forest Management Unit
BPS Badan Pusat Statistik / Indonesian Statistics Agency
BTNGR Balai Taman Nasional Gunung Rinjani / Mount Rinjani
National Park Authority
CBFM Community Based Forest Management
CFFG Community Forest Farmer Group
CFIND Community Forestry Index
CI Conservation International
CO2 Carbon dioxide
CV Commanditaire Vennootschap (Limited Partnership)
DAK Dana Alokasi Khusus / Special Allocation Fund
DFID Department for International Development
DISHUT Dinas Kehutanan / Forest Agency
DPRD Dewan Perwakilan Rakyat Daerah / Regional
Assembly
FAO Food and Agricultural Organization of the United
Nations
FGD Focus Group Discussion
FORCOV Forest Cover
FWI Forest Watch Indonesia
xii
GWF Global Forest Watch
HPHH Hak Pemungutan Hasil Hutan / Forests Product
Harvesting Rights
HKm Hutan Kemasyarakatan / Community Forestry
HPH Hak Pengusahaan Hutan / Forest Concession Rights
ICDP Integrated Conservation and Development Projects
IMP Institutsi Multi Pihak / Multi stakeholders institutions
IUCN International Union for Conservation of Nature
KMPH Kelompok Mitra Pelestari Hutan / Partner Group for
Sustainable Forest
KONSEPSI Konsorsium untuk Studi dan Pengembangan Partisipasi
/ Consortium for Study and Participation Development
KPH Kesatuan Pengelolaan Hutan / Forest Management
Unit
MEA Millennium Ecosystem Assessment
MPTS Multi-Purpose Tree Species
NGO Non-Governmental Organization
NTB Nusa Tenggara Barat / West Nusa Tenggara
NTFP Non-Timber Forest Products
OLS Ordinary Least Square
PDAM Perusahaan Daerah Air Minum / District Water
Company
PERDA Peraturan Daerah / Regional Government Regulation
PES Payment for Ecosystem Services
PR Property Rights
PSA Pago por Servicios Ambientales (Payment for
Environmental Services)
PT Perusahaan Terbuka / Go Public Company
PUSKESMAS Pusat Kesehatan Masyarakat / Community health
centres

xiii
REDD+ Reducing Emission from Deforestation and Forest
Degradation
SLCP Sloping Land Conservation Program
SUR Seemingly Unrelated Regression
TAHURA Taman Hutan Raya / Botanical Park
TGHK Tata Guna Hutan Kesepakatan / Forest land use
planning
US United States
UU Undang Undang / Laws
UUD Undang Undang Dasar / Indonesian Constitution
VOC Vereenigde Oost-Indische Compagnie (The United East
India Company)
WTA Willingness to Accept
WTP Willingness to Pay
WWF World Wide Fund for Nature

xiv
Glossary
Terminology Meaning
Adat Local customary practices and tradition.
Awiq-awiq
A kind of adat rule, constructed and agreed upon
by a community to govern their activities and
relationship among the members.
CFFG (Community Forest
Farmer Group)
A group of forest farmers who manage a
community forestry together under one
coordinator.
Coasean
An economic theory proposed by Coase to address
the problem of externalities through the market
system.
Commons
Resources, natural and cultural, that are shared by
many people without any private property right
established over the resources.
Community Forestry
A system of forest management focusing on the
benefits of forests for the livelihoods of local
forest dependent communities.
Conservation Protection of natural resources to ensure
sustainable use.
Deforestation
A long-term reduction of the tree canopy cover
below the minimum ten percent threshold.
Externality
External benefits or costs that emerge as a result
of other people’s activity.
Forum Kawasan
A forum of CFFG in Lombok, that coordinates
CFFG in relation to community forestry
management.
Free rider
A condition where people take advantage of being
able to use a common resource without making
any contribution for its existence.
xv
Terminology Meaning
Goodness of fit
The extent to which observed data matches the
values expected by theory.
HKm (Hutan
Kemasyarakatan)
Indonesian terminology for community forestry.
IMP (Institusi Multi
Pihak)
A multi stakeholders entity that acts as
intermediary in the PES system in Lombok.
Lang-lang
Part of adat institutions in Lombok who are
responsible for awiq-awiq enforcement.
Lokaq
Part of adat institutions in Lombok who are
responsible for being a judge in regards to
offenders of awiq-awiq.
MPTS (Multi-Purpose
Tree Species)
Tree species that have both ecological and
economic benefits.
New Order
A period of Indonesian government under Suharto
presidency, between 1965–1998.
NTFP (Non Timber Forest
Product)
Forest products other than timber.
OLS (Ordinary Least
Square)
A method for estimating unknown parameters in a
linear regression model.
Open access A condition of a resource without clearly defined
property rights that allows everyone to utilize the
resource.
PDAM (Perusahaan
Daerah Air Minum)
Regional Water Corporation.
PERDA (Peraturan
Daerah)
Regional regulation issued by the local
government (district or provincial) in Indonesia.
PES (Payment for
Ecosystem Services)
A transaction where a well-defined ecosystem
service is bought by at least one service buyer
from at least one service provider with a condition
xvi
Terminology Meaning
that the provider continues to conserve the
resource in order to secure the service provision.
Pigouvian
An economic theory proposed by Pigou to address
the problem of externalities through government
intervention.
Property rights Rights to enter, occupy and utilize a resource.
Reforestation Planting trees in deforested forest.
Reformasi (Reformation) A period of Indonesian government between
1998–2002.
Regression A statistical process for estimating the
relationships among observed variables.
SUR (seemingly unrelated
regressions)
A linear regression that consists of several
regression equations where each equation has its
own dependent variable and potentially different
sets of exogenous explanatory variables.
Tumpang Sari
A planting method that allows forest farmers to
cultivate crops on forest land together with tree
plantations.
xvii
Acknowledgement
I am grateful to the many people who gave their help, support, advice and assistance during
the whole process of my study and writing up this dissertation. First, I would like to express
my profound gratitude and deepest appreciation to my supervisors, Professor Malcolm Tull
and Associate Professor Carol Warren, for their invaluable guidance, support, suggestions,
and comments. It was a privilege for me to work under their supervision. My thanks also
go to Doctor Xiaohui Zhang and Doctor Ranald Taylor for their advice and supervision on
the quantitative analysis.
I would like to extend my gratitude to Indonesian Government for providing me with the
DIKTI Scholarship which was managed by the Ministry of Research, Technology and
Higher Education (RISTEKDIKTI) of the Republic of Indonesia. In addition, I would like
to thank to Murdoch University for providing financial support to undertake fieldwork,
conference travel and, the most important support, a scholarship in the fourth year of my
study. Without this financial support, this work would not have been accomplished. I would
like to express my appreciation to the Asia Research Centre for the additional financial
support to conduct the fieldwork and for providing an editing fund.
I would like to acknowledge the support from the Asia Research Centre staff, members and
fellow PhD students for their encouragement, intellectual support, and friendship. My
thanks also go to my friends and colleagues in the Faculty of Economics and Business, the
University of Mataram. My study could not have been completed without generous help
and support from people in the case study area of Lombok, Indonesia. I would like to
acknowledge and express my gratitude to many people who voluntarily participated in my
research.
Above all, my greatest thanks go to my wife Suzana Noviyanti Dewi and my daughters
Syahfa Viandy Kamila and Marwa Viandy Madina for their love, support, inspiration and
encouragement in every step of my PhD journey. I am also grateful to my sister Ida Laely
for her support and love. Finally, my deepest love and gratitude go to my parents Haji Akil
and Hajjah Nuraeni, also to my parents in law Djoko Wiratmo and Sri Haryati for their
unconditional support, love and blessing.

1
Chapter 1
Introduction
This thesis is concerned with sustainable commons resources management
and a case study of a Community Forestry program that was followed by and
integrated with a Payment for Ecosystem Services (PES) program in Lombok
Indonesia. It examines the development of these two programs as a response to
forest degradation that has caused water shortages across the island of Lombok. The
Lombok case study examines the impact of the integrated Community Forestry and
PES programs on forest conservation and local socio-economic conditions, and was
designed to assess how a common pool resource could be managed to achieve a
sustainable outcome.
1.1. Background and Context of the Study
Indonesia's forest area is the third largest in the world, following Brazil and
the Democratic Republic of Congo; it covers 124 million hectares, which is equal
to 65% of its land mass (BPS, 2015b). However, deforestation, which is defined as
“land cover conversion from forested to another land use or the long-term reduction
of the tree canopy cover below the minimum ten percent threshold” (FAO, 2005, p.
25), is a serious problem in this country. The size of forest cover in Indonesia has
been decreasing continually since the colonial era began in 1602, and became worse
in the period of the New Order regime (1966-1998) (Saman et al., 1993; Simon,
1994; Reed, 2006; Gultom et al., 2013; Bae et al., 2014).
Global Forest Watch (GFW) estimates that the average annual deforestation
rate in Indonesia from 2001-2015 is around 1.3 million hectares (GFW, 2017). As
figure 1.1 shows, Indonesia is the eight largest contributor to global warming in the
world, behind China, US, European Union, India, Russian Federation, Japan and
Brazil, and is responsible for 1.6% of global CO2 emissions (World Resources
Institute, 2017) predominantly by deforestation.

2
Regionally classified, the highest rate of deforestation in Indonesia has
occurred in Java and Bali-Nusa Tenggara. Forest Watch Indonesia (FWI) estimated
that between 2000-2009, forests in Java and Bali-Nusa Tenggara shrank by about
61% and 46% respectively (FWI/GFW, 2011, p. 15). FWI predicted that in 2030,
forests in both regions will be totally lost if the current rate of deforestation
continues. The forest in these areas is important for ecosystem services, since
Lombok and Bali are rapidly growing tourism development areas, which need a lot
of high quality water. The island of Lombok, located in West Nusa Tenggara
Province, is the most threatened area, since 4.6 million people on the island are
heavily dependent upon the ecological benefits of the forests, especially for water
supplies. Further, from a basic needs perspective, the issue of ecosystem services
in Lombok has become acute. Approximately 16% of people in the province of
West Nusa Tenggara are poor (BPS, 2016b). Sunderlin et al. (2000) found that most
of Indonesia's poor families live in remote villages surrounding forest areas, and
their livelihood relies on the forest. To support their livelihood, many of the rural
poor engage in illegal logging and illegal farming in the forest, which sets in motion
a vicious cycle linking resource degradation and impoverishment.
Figure 1.1 The World’s Biggest Contributors to Global Warming and
Anthropogenic Climate Change (by % of CO2 emissions)
Source: Constructed by the Author, data from World Resources Institute (2017)
Topographically, Lombok Island is dominated by Rinjani Mountain, the
second highest volcano in Indonesia, which is located in the centre of the island.
0.05.0
10.015.020.025.030.0

3
Most areas of the island are relatively fertile and 40% is covered by forest.
Wulandari (2011, p. 35) observed an average rate of deforestation in Lombok
during the decade 2000–2010 equal to 1,700 hectares a year. A GFW map shows
that during 2001–2015, forest cover in Lombok fell by about 19,202 hectares; or
1,280 hectares per annum (GFW, 2017). Gultom et al. (2013) suggested that
poverty is the major driver of deforestation in Lombok. Since poverty and forest
degradation are closely correlated phenomena (Wunder, 2001; Aggarwal, 2006),
the combination of socio-economic factors that contribute to underdevelopment and
environmental degradation must be considered in solving problems of poverty and
ensuring sustainable economic development (Agrawal, 2003).
Since the end of Suharto's New Order regime, the Indonesian government
officially began to encourage local people living around forest areas to contribute
to resolving the problem of deforestation by involving them in forest management.
In 1998 Community Forestry1 (Hutan Kemasyarakatan, HKm) was introduced in
Indonesia. A Community forest is defined in Indonesian forestry regulations as state
forest managed by a local community for the purpose of economic empowerment
and improvement without undermining forest functions (Menteri Kehutanan RI,
2014a).
Community Forestry is a relatively new scheme for forest co-management,
having been first introduced in the 1980s and 1990s in a number of countries
(Agrawal, 2001b; Bellinger and Gale, 2004; Charnley and Poe, 2007; Kubo, 2009;
Barsimantov and Kendall, 2012; Maryudi et al., 2012). The main characteristics of
Community Forestry are (1) management responsibility and authority is formally
vested by the government in local communities, along with specified
responsibilities and rights to sustainable use of the forest; (2) the aim is to provide
local communities with long-term social and economic benefits from the forest; (3)
there is a core management goal of ensuring ecologically sustainable forest use
(Sanwal, 1988; Charnley and Poe, 2007).
1 Community Forestry is also described in the literature as agro-forestry, social forestry and
community-based forest management.
4
Sesaot Forest, which is located on the western side of Mount Rinjani, is the
pilot Community Forestry project in West Nusa Tenggara Province. Sesaot Forest
is significant as it is the primary water catchment area for the residents of Lombok.
People in Mataram, the capital city of West Nusa Tenggara and of West Lombok
District, use water from this forest for their daily needs. Farmers in East and Central
Lombok also use the water from Sesaot forest to irrigate their land. Since 1998,
with the involvement of non-government organisations, local community
institutions have been formed around the forest with the aim of improving forest
management through a Community Forestry approach. Customary rules and values
(adat) have been employed in Community Forestry management in Sesaot and
adapted to accommodate local community initiatives to protect the forest.
Adat (customary) institutions played a significant role in local community
organization and in natural resource management before the colonial era. Adat
community authority, however, was marginalized especially during the Suharto era
(McCarthy, John, 2009), and was replaced by state control policies that were
designed to serve the political and economic interests of national and local elites
(Warren, 2005, p. 50). Warren (2005) points out that in that period, the Forestry
Law (UU 11/1967), Basic Mining Law (UU 5/1967) and Village Government Law
(UU 5/1979) were among the instruments used by the Indonesian central
government to control all natural resources in the country in the name of the ‘public
interest’.
Adat authority in the local domain has re-emerged in the reform era
following the collapse of the New Order regime's three decade long rule of
Indonesia (Warren and McCarthy, 2009). Adat rules have the potential to play an
important role in the successful introduction of Community Forestry programs,
since indigenous norms and values may have a greater perceived legitimacy than
formal law for many of the people of Lombok (SA, forest agency officer, interview,
5/6/2014). For example, an individual jailed for illegal logging may very well
reoffend after the arrest period. On the other hand, faced by local customary
punishment such as isolation from the community, the individual would be less
likely to repeat the offence in the future. Thus, adat rule enforcement by local user

5
groups could be a necessary condition for effective communal resource
management (Gibson et al., 2005, p. 282).
Ostrom (1999) argues that resource management by local communities
often delivered more sustainable outcomes than other forms of governance that rely
primarily on privatization and state control. Local communities are able to self-
organize on their common property, especially in the cases of Small-scale resources
systems, where they can employ their own rules and norms for sustainable
stewardship of the resource (Agrawal, 1996; Agrawal and Ostrom, 2001; Ostrom,
2005). However, collective action approaches employed in community based
resource management encounter a number of constraints, especially where open
access prevails in vast forest and marine areas (Ostrom, 1990). Most of these
limitations relate to the ways in which people cooperate, and to internal and external
conflicts of interest (Arnold, 1987). In forestry management, there are many
conflicts of interest among the different levels of government, commercial
stakeholders and local communities. For instance, successive governments of West
Nusa Tenggara promoted Sesaot Forest as a grand forest park (Taman Hutan Raya),
specifically designated for research, education, and tourism development. At the
same time, local people in the same location have been using the forest for decades.
Internal conflicts among community members also arise, due to competing socio-
economic and political interests. In this regard, Ostrom (2009) stresses the
importance of building trust and developing institutional rules that are well matched
to the local ecological needs, in order to solve such dilemmas.
Conflicts of interest also arise between the forest farmers and those who live
in the city who are dependent upon the protection of forest water catchments for
their water needs. Improper management of forests can cause severe decline in the
quantity and quality of water supply. Methods to address the problem of such
negative externalities related to poor resource management have been debated in
the policy literature, and focus largely on Coasean and Pigouvian theories. Coasean
economic theory emphasizes voluntary market based transactions among the related
parties to negotiate compensation in order to reduce externalities (Coase, 1960). On
the other hand, Pigouvian economic theory contends that government involvement
6
is important in addressing the externality problem, through exercising policy
instruments such as collecting tax or providing subsidies as incentives to reduce
externalities (Pigou, 1932).
In response to the externality problem resulting from inappropriate forest
management, the government of West Lombok district developed a system of
Payment for Ecosystem Services (PES), as a contribution from urban water
consumers toward proper management of the Sesaot forest. This PES program is a
hybrid system that combines Coasean and Pigouvian economic theory. Government
policy has enforced monthly payments from urban tap water consumers, which
compensate forest farmers in Sesaot forest through various conservation and
economic empowerment programs.
Payment for ecosystem services will operate as an economic incentive if
small payments to forest users can tip the balance in favour of desired land use, in
this case forest protection (Wunder, 2007). However, Muradian, R. et al. (2013)
argue that over-reliance on PES as win-win solutions might lead to ineffective
outcomes when the ecosystem services price does not follow the trend of rising
opportunity costs of ecosystem conservation. Thus, inadequate economic benefits
from PES could become a disincentive for the provider to maintain the PES
contract. Wunder (2013) emphasised that PES needs to be carefully customised to
essential preconditions2 in order to prevent negative outcomes and ensure cost-
effectiveness.
The PES program in Lombok is integrated with the Community Forestry
program through providing cash to buy seeds for multipurpose tree species that can
generate economic benefit for the farmers. The integrated PES and Community
Forestry program is designed not only for forest conservation but also for poverty
alleviation.
2 Preconditions to make a PES system work include: the existence of a ‘give and take’ culture among
services users and providers, trust between the services users and providers, and tenure clarity and
security among service providers (Wunder, 2013).

7
The economic and conservation goals of the Community Forestry and PES
programs have been addressed in a substantive body of academic literature3. Some
studies demonstrate the potential of Community Forestry programs for
deforestation mitigation and simultaneous improvement of the economic welfare of
surrounding communities. For instance, Bottazzi et al. (2013) found that sustainable
forest management through a Community Forestry approach in the Bolivian
Amazon provided income while maintaining low carbon emissions. Similarly,
Dhakal et al. (2007) conclude that Community Forestry could overcome the rural
unemployment problem and increase incomes while ensuring sustainable forest
resources in Nepal. Their findings were supported by Dhakal et al. (2012) who
demonstrated a positive outcome of Community Forestry for the poorest
households in Nepal.
In contrast, other scholars found unclear impacts of Community Forestry for
poverty alleviation. For example, Sunderlin (2006) found no empirical evidence for
poverty alleviation through Community Forestry in Cambodia, Laos and Vietnam.
Charnley and Poe (2007) reported that Community Forestry in America delivers
more ecological impact than economic benefit, which is not to say that economic
benefit is entirely lacking. Similarly, Thoms (2008) found that Community Forestry
in Nepal is better for resource management and conservation than for local
livelihood improvement. Within Indonesia, Maryudi et al. (2012) reported that
Community Forestry also has not yet achieved its high promise to alleviate poverty.
The emergence of Community Forestry and PES programs requires further
research, to provide a better understanding of why these programs do or do not
achieve their promise (Charnley and Poe, 2007). The aim of this present research is
to investigate the extent to which the Community Forestry and PES programs
introduced in Lombok have been able to impact upon both socio-economic
conditions and forest conservation, and to examine the features of these programs
3 See for example Sanwal (1988); Gunter and Jodway (2000); Sunderlin, William D. (2006);
Charnley and Poe (2007); Dhakal et al. (2007); Maryudi et al. (2012) for discussion on the impact
of Community Forestry, and Pagiola et al. (2005); Wunder (2005); Pagiola (2007); Bremer et al.
(2014) for discussion of the goals of PES.
8
and policy improvements that could contribute to achieving long-term sustainable
management goals.
1.2. Research Questions
As this study was designed to analyse whether, to what extent and under
what conditions the integrated Community Forestry and PES programs introduced
in Lombok have contributed to local ecological conservation and local socio-
economic improvement, the research questions that will be addressed are as
follows:
1. How were Community Forestry and PES programs developed in Lombok?
To what extent do they contribute to forest sustainability and poverty
alleviation in forest dependent communities?
2. What improvements are required to enable Community Forestry and PES
programs to further both environmental and socio-economic goals?
3. How is adat (customary law) employed in Community Forestry in
Lombok? What conditions are needed for adat to contribute to sustainable
forest management?
1.3. Case Study Location
Lombok was chosen as the focus of the case study research for this thesis
because this area is the location of a pilot Community Forestry management
program in Indonesia. In addition, the PES program adopted in Lombok differs
from most other PES programs in the world, due to the fact that its implementation
was superimposed upon a Community Forestry program. Lombok is an island
located in the southeastern part of the Indonesian archipelago (see figure 1.2).
Lombok borders the Java and Flores Seas to the north, the Indian Ocean to the
south, Lombok Strait and Bali Island to the west and Sumbawa Island to the east.

9
Figure 1.2 Map of Lombok Island
Source: Lemhanas (2013).

10
Lombok is part of West Nusa Tenggara (NTB) province, which comprises
two main islands, Lombok and Sumbawa, and 280 small islands; with a total land
area of 20,153.20 km2. Lombok itself covers 4,738.70 km2, or nearly one quarter of
the total land area of NTB province. Forests in Lombok cover 163,343 hectares that
are dominated topographically by Mount Rinjani, a volcano rising 3,726 meters
above sea level.
There are 53 sub-districts (kecamatan) and 598 villages (desa) in Lombok
(see Table 1.1). Lombok is home to the NTB provincial government as well as
NTB’s business centre. As a consequence, the island of Lombok is more densely
populated and more developed than the island of Sumbawa. Lombok has a
population of 3,228,654 people, spread over five districts. Of these five districts,
the city of Mataram, the capital city of NTB province, is the most heavily populated.
Table 1.1 Sub-districts and Villages in Lombok
Districts
(Kabupaten)
Number of Sub-
Districts
(Kecamatan)
Number of
Villages (Desa)
Population
Mataram 6 50 413,216
West Lombok 10 122 613,161
Central Lombok 12 139 875,231
East Lombok 20 254 1,123,488
North Lombok 5 33 203,564
Total 53 598 3,228,660
Source: BPS NTB (2014)
1.4. Research Methodology
A mixed research methodology was used in this study. A mixed method
approach has the ability to minimize the weaknesses of solely quantitative or
qualitative methods (Rao, Vijayendra and Woolcock, 2003; Creswell and Plano-
Clark, 2006). Integrating quantitative and qualitative methods provides a more
comprehensive evidence base for evaluating a conservation and development
program such as PES (Rao, Vijayendra and Woolcock, 2003; Creswell and Plano-
Clark, 2006). This study uses a mixed method approach called “participatory
econometrics” (Rao, Vijayendra and Woolcock, 2003; Ibáñez and Rao, 2005). The

11
participatory econometric approach incorporated the following steps in sequence:
(1) in-depth interviews to obtain a grounded understanding of the PES issue; (2)
survey instruments based on understandings developed from the interviews and
field visits; (3) hypotheses derived from qualitative work that were then tested using
survey data.
1.4.1. Data Sources
A variety of sources of data were used for this study: (1) documents: legal
documents, reports, and contracts between the PES intermediary agency (IMP) and
farmers' groups; (2) maps and satellite images, (3) interviews; (4) surveys. The data
was collected during two rounds of fieldwork in Lombok. The first period of
fieldwork was carried out in May–June 2014, and a second fieldwork period took
place in January–May 2015. The first fieldwork period aimed to collect documents,
interview officials and gain background information related to PES development
and practice; the second fieldwork period focused primarily on community based
data gathered from surveys and observations. Satellite images were collected from
Google Earth and Global Forest Watch interactive maps. This multiple data
collection technique allowed the researcher to perform triangulation (Burns, 1997)
to cross check, compare and contrast data among several different sources.
1.4.2. Survey Design
A survey instrument (questionnaire) was developed based on the results
from the first fieldwork. Respondents for the surveys were 200 forest farmer
households that were selected using a purposive random sampling technique
(Bryman, 2015). All respondents were classified into two different groups. The first
group consisted of 100 households that were randomly selected from enrolled
participants in the PES program. The second group consisted of another 100
households that were selected randomly from those that are not enrolled in the PES
program. This technique generates comparable data among respondents in relation
to their experience with the Community Forestry program only compared to those
who participated in the additional PES program.
12
The surveys were conducted during the second period of fieldwork in six
villages where PES funds were distributed, namely Sedau, Lebah Sempage,
Pakuan, Sesaot, Buwun Sejati and Batu Mekar. The surveys aimed to collect
information regarding forest farmer experiences with Community Forestry and PES
programs, including the impact of these schemes on the village economy as well as
the ecological impact of the programs in relation to forest management.
Every survey question in the survey related to Community Forestry and PES
practice offered a closed question, paired with an open-ended question, in order to
generate qualitative data to support the quantitative response. Respondents who
were enrolled in the PES program answered questions related to both Community
Forestry and PES. Those who were not enrolled in the PES program answered only
the questions related to the Community Forestry program.
1.4.3. In-Depth Interviews
Semi-structured interviews were conducted with 22 informants including
PES initiators, a water services officer, forest service agency officers, a regional
development plan agency officer, a regional environmental sector officer, a regional
assembly member, Non- Government Organisations, academics, Institusi Multi
Pihak (IMP) officers and local community leaders. The interviews were carried out
during the first fieldwork period.
1.4.4. Focus Group Discussion
In addition to the interviews, a focus group discussion was conducted with
IMP officers to obtain broader information about their experience in managing the
PES scheme. A focus group discussion (FGD) with community forest leaders was
also performed in the second fieldwork period. In addition, the researcher had the
opportunity to attend a community forest farmer group (CFFG) meeting and
workshop on PES related issues, which was organized by a local NGO.
1.4.5. Field Visits
Field visits to the villages were also conducted to obtain information about
Community Forestry and PES practice in the field. Transect walks to the
13
community forests were also conducted to clarify information that previously
collected from interviews and surveys. In addition, secondary data consisting of the
village profiles covering demographic and socio-economic information on each
community were collected during the field visits.
1.4.6. Data Analysis
All collected data were analysed using qualitative and quantitative
techniques. The NVivo software was used to analyse the qualitative data. The
quantitative data was analysed using Ordinary Least Square (OLS) regression and
Seemingly Unrelated Regression techniques. The STATA software was used for
this quantitative analysis. Results from combined quantitative and qualitative
analysis were than used to draw the thesis conclusions.
1.5. Chapter Outline
This thesis consists of eight chapters. This introductory chapter has provided
background information on the context of the study, identified the research
questions, case study location, and methodology used. Chapter two elaborates on
the theoretical and case study literature on commons resources management,
Community Forestry and PES. The history of forest governance in Indonesia,
including forests in Lombok, the cause of deforestation and forest degradation,
Community Forestry development, the use of adat in community forest
management, and the role of NGOs in forest governance are discussed in Chapter
three.
Chapter four focuses on the development of the PES program in Lombok,
including the establishment of the program, the role of intermediaries, the benefit
delivery system, and challenges and constraints affecting program implementation.
Chapter five critically examines the impact of the Community Forestry and PES
program on the ecology of the forest. This chapter also includes an assessment of
the effects of property rights on forest conservation. Chapter six examines the
Community Forestry and PES program impacts on local socio-economic
conditions, in particular, poverty alleviation.
14
Chapter seven employs a regression analysis to estimate the impact of the
Community Forestry and PES programs on the local economy and ecology, as a
comparison to the previous qualitative analysis. Finally, Chapter eight presents
conclusions and policy recommendations regarding Community Forestry and PES
programs that have evolved in Lombok, and identifies areas requiring further
research.

15
Chapter 2
Theoretical Background and Literature Review
This chapter surveys the literature on commons resources, Community
Forestry (CF), and Payment for Ecosystem Services (PES). The aim of this chapter
is to review theoretical and comparative studies relevant to the analysis in this
thesis. The organization of this chapter is as follows. Section 2.1 reviews debates
on the management of commons resources. Community Forestry management
programs are discussed in section 2.2. Section 2.3 focuses on the PES concept,
which is increasingly applied to the management of commons resources. Finally,
section 2.4 draws conclusions from this chapter and identifies the theoretical
approach applied in this thesis.
2.1. The Commons Resources
The utilization of resources is often subject to the type of property rights
embedded in the resource. There are four categories of property rights that define
the nature of access and utilization based on the type of resources ownership (Feeny
et al., 1990; Bromley, 1992). The first category is described as 'open access'
regimes. Resources without well-defined property rights fall into this category
(Bromley, 1992, p. 2). There is no regulation of access to the resource and so it is
free and open for everyone to utilize. Open access is the default condition in the
absence of institutions that are created through collective action to govern the use
of the resources (Cole et al., 2014, p. 365). Thus open access is not a management
regime at all (Persoon et al., 2003). The global atmosphere is an example of such a
resource.
The second category refers to private property regimes. Under these
regimes, the resource property rights are clearly defined and belong to an individual
or group of individuals like a company (Feeny et al., 1990; Persoon et al., 2003).
The owner of the resource regulates how it is used. This right is usually exclusive
and can be transferred to whomever the owner wants. Private goods such as private

16
land and vehicles are examples of resources that hold this characteristic. A private
property regime is commonly held to lead to the highest and most efficient use of
the resource (Bromley, 1992).
The third category is state property regimes. Under these regimes, the
property right to the resource is held by the state or government in its role as
representative of the interests of present-day and future citizens as well as other
interests (Bromley, 1992; Persoon et al., 2003). The use of the resource is subject
to regulation by the state, which determines the conditions of access by resource
users. The use of the resource is often exclusively reserved only for citizens of the
state. All users theoretically have equal rights to access and utilize the resource,
although the state may allocate those rights to utilize a resource through licensing
or concessions to individuals or groups (Bromley, 1992). The most significant
difference between this state property regime and other regimes is determined by
the state's powers of enforcement regarding the access and utilization of the
resource (Feeny et al., 1990). Examples of such resources include public goods
managed by the government, such as natural forests, roads and parks.
The fourth and last category is communal or common property regimes.
Under these regimes, the property rights on the resource are held by a clearly
defined community of interdependent users (Feeny et al., 1990, p. 4; Persoon et al.,
2003). The resource is also exclusive, meaning that the community can exclude
outsiders from accessing and utilizing the resource. As the property rights holder,
the community regulates how the resource is used. Bromley (1992, p. 12) argues
that if the community authority system breaks down, the common property will
degenerate into open access4. The right to the common resource is usually equal to
all community members. Examples of this type of resource right may include
inshore fisheries, range lands, irrigation systems and community forests. This type
of resource is often referred to as “the commons”. More specifically, Ostrom (1990,
4 This could also happen under state and private property regimes. For instance, some state forests
and private concessions effectively became open access following the collapse of the Suharto
regime in Indonesia.

17
p. 26) describes resources managed under such regimes as “common-pool
resources”.
The term “commons” originates from the type of right to shared land in
Medieval Europe that was held by a community (Anderies and Janssen, 2013).
Various definitions of “commons” are provided in the literature. Most of them
emphasize a shared use of particular resources that can be natural resources and/or
human made resources. According to Anderies and Janssen (2013, p. 3), the term
“commons” refers to a broad set of resources, natural and cultural, that are shared
by many people, but without any private property right established over the
resources. More specifically, Ostrom (1999) emphasized the importance of
communal governance in order to deal with the problems otherwise faced by open
access resource regimes. She defines “the common” as “a natural or man-made
resources system that is sufficiently large as to make it costly (but not impossible)
to exclude potential beneficiaries from obtaining benefit from its use” (Ostrom,
1990, p. 30). Dietz et al. (2002, p. 13) defines the term “commons” as a diversity
of resources, facilities or property institutions that involve joint ownership and
access.
According to Feeny et al. (1990, p. 3), common-property resources hold two
important characteristics which pose challenges to commons management: non-
excludability; and subtract-ability, also known as rivalry. Non-excludability means
that every potential user is able to access and utilize the resource without any
boundary. It may be costly or impossible to make the resource exclusive to only
certain users. Regulating access could be even more difficult for certain resources
like large bodies of water, the global atmosphere, forestland, and migratory
resources such as ocean fish, wildlife, and groundwater (Feeny et al., 1990).
Subtract-ability or rivalry means the use of the resource by someone will reduce
the opportunity of other people to utilize the resource and will subtract from their
welfare (Feeny et al., 1990). For example, in the case of ocean fisheries, if a
fisherman uses unsustainable methods in catching fish - such as using explosives or
chemicals - the fishing effort costs to other fishermen will increase due to the
decline of stock of fish in the area. It may also push the other fishermen to find new
18
fishing grounds, or drive the resource beyond sustainable limits or 'carrying
capacity'.
The non-excludability characteristic of the common resources is very
similar to the open access resources in which everyone can access the resources.
However, unlike the open access resources that are (apparently) non-rivalrous, the
use of common resources by a user will definitely reduce the resources availability
for other users. Thus there is confusion in defining common resources and the open
access resources. Following Anderies and Janssen (2013, p. 3), any resource that is
shared among the users in which private property rights have not been established
will be considered as a “ commons resource” in this thesis.
The focus on common resources became central to environmental policy
after a path-breaking article published by Garrett Hardin in Science (1968). Hardin
expressed concern that common resources will eventually become scarce due to
excessive human consumption, which tends to transgress the limits of a common
resource's capacity to replenish itself. The absence of clearly defined property rights
or of any binding rules in relaticolemanon to human consumptive patterns on these
commons resources lead to what Hardin famously described as the “tragedy of the
commons”. This situation of unregulated, competitive and self-interested resource
use causes a tragedy since everyone will ultimately suffer from losing the benefit
from these resources (Hardin, 1968, p. 1244). As mentioned, Hardin called this
situation a “tragedy” since the limited availability of the resource, in the absence of
good governance, could drive competitive use and lead to resource depletion. In the
absence of regulation, people continue to maximize their individual benefit at
collective expense, and access to the resource is not tied to responsibility for
maintaining it, a phenomenon which Mancur Olson called the “free rider” problem
(Olson, 1965, p. 76).
Freedom to access a resource without any control from the government or
the community will lead to resource destruction that ultimately affects everyone.
Hardin explained this tragedy of the commons in the English commons allegory as
follows:

19
“Therein is the tragedy. Each man is locked into a system that compels him
to increase his herd without limit – in a world that is limited. Ruin is the
destination toward which all men rush, each pursuing his own best interest
in a society that believes in the freedom of the commons. Freedom in a
commons brings ruin to all’ (Hardin, 1968, p. 1245).
According to Dietz et al. (2002), Hardin’s analysis was underpinned by
Adam Smith's notions about human selfishness. In addition, Hardin’s work was
significantly influenced by the work of Lloyd (1833) who argued that common pool
resources will tend to be overused due to a discount factor. I.e. the value of the
benefit from the commons in the present is higher than in the future, because of the
tendency to overexploit the resource (Dietz et al., 2002). Further, Lloyd (1833)
argued that resource use also depends on the institutions that define the benefits and
cost of the resource (Dietz et al., 2002). A “tragedy” is more likely if
communication, trust, the capacity to anticipate future interactions, and the ability
to make binding agreements and rules, are lacking or ineffective (Dietz et al., 2002).
In this context, “the tragedy of the commons” can be avoided by governance
mechanisms that compel people to act in the interest of the collective good rather
than narrow self-interest (Vayda and Rappaport, 1968).
Two of the solutions posed by (Hardin, 1968, p. 1245) for preventing the
tragedy of the commons –state management and privatization– have dominated
policy approaches. Regarding the first solution, state management can make it
costly to use the resources beyond carrying capacity, either by charging tax for the
use of the resources or restricting their use through regulation and sanctions. In this
context, the government’s role is to establish the regulation and enforce it as the
rules of the game for people who utilize these common resources (Dietz et al.,
2002). The problems with state management include that it is expensive to make
such management effective (Wade, 1987, p. 105), and it is open to elite capture. In
addition, state control of common resources often leads to (1) overriding indigenous
institutions; (2) poor monitoring of resource boundaries and harvesting practices
because many governments do not have sufficient resources or motivation to
monitor extensive common resources; (3) de facto open access conditions and a
race to use the resources (Dietz et al., 2002, p. 7).

20
Regarding the second solution, Hardin (1968, p. 1245) argued that private
management of commons resources will often produce more effective, but unjust,
management. Privatizing a commons resource means that the property right of the
resource belongs to a certain stakeholder, which could be a person or a company.
When someone holds property rights on a resource, the resource tends to be better
protected than without clearly defined property rights (Araujo et al., 2009; Poteete
et al., 2010). By privatizing the commons, every resources user who holds the
property right is assumed to take responsibility for their own resources. Private
ownership and use of common resources may lead to greater efficiency but often at
high social cost (Attwood, 1992, p. 15). The costs that arise from the utilization of
the resources, including overuse, are assumed to be met by the user. According to
some theorists, private ownership will theoretically determine the maximum
economic benefit and thus the resource owner will be encouraged to manage the
resource properly to gain that benefit (Dietz et al., 2002). For this reason, Hardin
argued privatization, however unfair because of its exclusion of others from
resource access, was preferable to its ruin (Hardin, 1968, p. 1245).
Hardin’s argument was soon broadly accepted due to the consistency with
predictions made by mainstream economists and increasing examples of
environmental depletion from unregulated commons (Feeny et al., 1990; Anderies
and Janssen, 2013). His thesis that “freedom in a commons brings ruin to all” due
to lack of correspondence between rights and responsibilities (Hardin, 1968, p.
1244), was often considered by policy makers to support the neoliberal preference
for privatization (McCarthy, J. F. and Warren, 2009, p. 9) or government ownership
and control over the common resources (Dietz et al., 2002, p. 7). This became a
widely accepted policy prescription in disciplines such as environmental studies,
resource management policy, economics, and political science (Feeny et al., 1990;
Cole et al., 2014).
However, many policies based on these assumptions have faced
contradictions (Ostrom, 1998). Privatization as suggested by Hardin can clearly
motivate the resources owner to use the resources without consideration of the
needs of other parties or the sustainability of the resource beyond its use to the

21
present owner. Rational choice theory (Coleman and Fararo, 1992; Scott, 2000)
accommodates this probability, by suggesting that people make their decisions
based on outcomes of alternative actions and calculate the best action for
themselves. Actors in either the state or private sector will utilize the resources
under their control to generate a maximum benefit for their perceived (usually short-
term) advantage (Coleman, 1973; Heath, 1976), and not necessarily for the longer-
term sustainability of the resource5.
Ostrom (1998) called the tragedy of the commons a “social dilemma”;
which is a situation that occurs when individuals choose to take an action that
maximizes their short-term self-interest, leaving other parties (including future
generations) worse off than by employing other alternatives. Ostrom (1999)
proposed an alternative option to deploy local institutions for governing common
resources for sustainable use. Instead of relying on the state or private property
control, it is argued that utilizing local institutions would be more effective in
avoiding the tragedy of the commons. As some theorists argue, local communities
are better able to create rules regarding the resource utilization in the common
interest and have the capacity to enforce these rules based on their knowledge and
past experiences (Agrawal, 1996; Ostrom, 1999). Their knowledge and skills often
cause them to be regarded as savers of the environment as well as victims of
degradation (Myers, 1976; Borrini-Feyerabend, 1996; WWF, 1996; Persoon et al.,
2003).
When a community holds ownership rights over a common resource, they
can more immediately align rights and responsibilities by determining the
conditions of access for their own members (Ostrom, 1990). However, local rules
are difficult to apply effectively if the number of users is large, the boundaries of
the common resources are unclear, when they live in a group scattered across a large
area, and when undiscovered rule-breaking is easy (Wade, 1987, p. 104). When
degradation of common resources cannot be avoided in a situation of weak local
5 A clear example of this in Indonesia is forest concessions, where the state granted property rights
to certain companies, which led to extensive deforestation (Ramli and Ahmad, 1994).

22
governance, policy-makers return to the argument for privatization, state
management or a range of co-management alternatives (Wade, 1987, p. 104).
Indeed Hardin himself recognized a third 'solution' to the tragedy, which he
described as 'mutual coercion, mutually agreed upon by the majority of the people
affected' (Hardin, 1968, p. 1247). However, it was only as a result of the work of
Ostrom and other 'commons' scholars that research into the conditions under which
collective action toward sustainable use by local communities or user groups began
to be treated as a serious, even necessary, option for managing common pool
resources.
Ostrom’s work provides insights into the conditions under which self-
governance over common pool resources can be used to avoid the tragedy of the
commons. She defined a self-governing common resource as “one where the major
users are involved over time in making and adapting rules within collective-choice
arenas regarding the inclusion or exclusion of participants, appropriation strategies,
obligations of participants, monitoring and sanctioning, and conflict resolutions’
(Ostrom, 2005, p. 2). Her findings can help to explain the ineffectiveness of many
policies and resource governance regimes (Anderies and Janssen, 2013). Ostrom
(1990) identified eight design principles that characterize successful self-
governance strategies: clearly defined boundaries, congruence between
appropriation and resource provision rules and local conditions, collective decision-
making, monitoring, graduated sanctions, conflict-resolution mechanisms, minimal
recognition of rights to organize, and nested enterprises (see table 2.1).
Cole et al. (2014) have criticized both Ostrom’s and Hardin’s assumptions.
According to Cole et al. (2014, p. 360), the tragedy of the commons is not because
of a lack of institutions, as presumed by Ostrom (1999), but is a direct consequence
of interactions between the various rules applied, which stimulates a risk of
excessive use. They explain that Ostrom ignored an important attribute of the
institutional environment, namely certain institutional conditions, especially
property rights, that contribute to causing the tragedy (Cole et al., 2014). The
tragedy of the commons in Hardin’s example “is the product of interactions among
institutions that assign individual rights over the cattle that convert unowned grass

23
from open access pasture into privately owned beef” (Cole et al., 2014, p. 361).
This is essentially a problem of coherence of nested property rights and
responsibilities. Lack of clearly defined property rights leads to self-interest of the
resource users (Margolis, 1982) to maximize their needs due to competitive use
over the resources. Clearly defined property rights on the commons resources
would be followed by responsibilities over the resources utilization, which may in
turn deliver a sustainable use of the commons resources (Agrawal and Ostrom,
2001; Engel et al., 2008).
Table 2.1 Institutional Design Principles for Sustainable Common Resource
Governance
Principles
Description
1. Clearly defined
boundaries
The boundaries of the resource system and
individuals or households who have rights to
utilize the resource must be clearly defined.
2. Congruence between
resource provision
rules and local
conditions
Rules specifying the amount of the resource that
a user is allocated must be related to local
conditions and to rules regarding labour,
materials, and/or money inputs.
3. Collective decision-
making
Individuals who are affected by the harvesting
and protection rules are accommodated in the
group and can participate in modifying the
operational rules.
4. Monitoring Monitors, who actively audit the common
resources and resource user behaviour, are
accountable to the resource users themselves.
5. Graduated sanctions Resource users who violate rules-in-use are
subject to graduated sanctions (depending on
the seriousness and context of the offense) from
other users, from officials accountable to these
resource users, or from both.
6. Conflict-resolution
mechanisms
Resource users and their officials have rapid
access to low-cost, local mechanisms to resolve
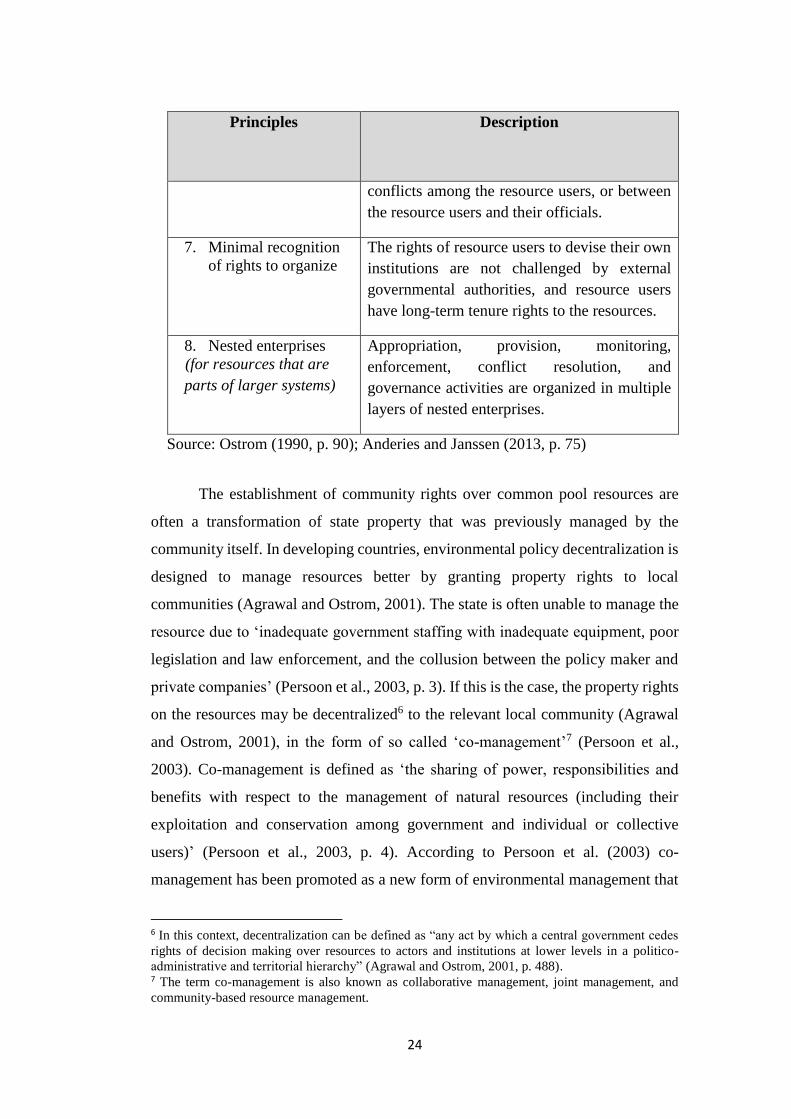
24
Principles
Description
conflicts among the resource users, or between
the resource users and their officials.
7. Minimal recognition
of rights to organize
The rights of resource users to devise their own
institutions are not challenged by external
governmental authorities, and resource users
have long-term tenure rights to the resources.
8. Nested enterprises
(for resources that are
parts of larger systems)
Appropriation, provision, monitoring,
enforcement, conflict resolution, and
governance activities are organized in multiple
layers of nested enterprises.
Source: Ostrom (1990, p. 90); Anderies and Janssen (2013, p. 75)
The establishment of community rights over common pool resources are
often a transformation of state property that was previously managed by the
community itself. In developing countries, environmental policy decentralization is
designed to manage resources better by granting property rights to local
communities (Agrawal and Ostrom, 2001). The state is often unable to manage the
resource due to ‘inadequate government staffing with inadequate equipment, poor
legislation and law enforcement, and the collusion between the policy maker and
private companies’ (Persoon et al., 2003, p. 3). If this is the case, the property rights
on the resources may be decentralized6 to the relevant local community (Agrawal
and Ostrom, 2001), in the form of so called ‘co-management’7 (Persoon et al.,
2003). Co-management is defined as ‘the sharing of power, responsibilities and
benefits with respect to the management of natural resources (including their
exploitation and conservation among government and individual or collective
users)’ (Persoon et al., 2003, p. 4). According to Persoon et al. (2003) co-
management has been promoted as a new form of environmental management that
6 In this context, decentralization can be defined as “any act by which a central government cedes
rights of decision making over resources to actors and institutions at lower levels in a politico-
administrative and territorial hierarchy” (Agrawal and Ostrom, 2001, p. 488). 7 The term co-management is also known as collaborative management, joint management, and
community-based resource management.

25
accommodates joint management of natural resources between environmental non-
government organizations working together with local communities, national
governments and transnational donor agencies.
It has been argued by a number of scholars that decentralization of property
rights over a common resource to a local community and associated governance
accountability may produce more sustainable use of the commons (Ostrom, 1990;
Agrawal, 1996; Baland and Platteau, 1996; Agrawal and Ostrom, 2001;
Bhattacharya and Lueck, 2009), which is examined in this thesis. Having discussed
the nature of common resources in general, we will now focus on the example of
co-management in the form of Community Forestry practices.
2.2. Community Forestry
2.2.1. Community Forests as Common Resources
Community Forestry is a form of Social Forestry, which is a system of forest
management that pays attention to the benefits of forests for the livelihoods of local
forest dependent communities (Simon, 1994; Shyamsundar and Ghate, 2014).
Social forestry is an alternative to conventional forestry, which is a forest
management system based on timber exploitation or protection, traditionally
managed in purely economic and/or ecological terms. The term Social Forestry was
introduced during the World Forestry Congress VIII that was held in Jakarta in
1978, which carried the theme "Forests for the People" (Arnold, 1987; Simon,
1994). At the Congress, Social Forestry was defined as “a system in which local
people are participating in the management of forests with the special emphasis on
the establishment of forest plantations”. The objective of the social forestry system
is a successful reforestation to attain optimum function of the forest and at the same
time to increase the social welfare of the local people” (Simon, 1994, p. 4).
In Community Forestry practice, local people are empowered to manage a
given forest area for the greater economic benefit for the local community
(Krogman and Beckley, 2002). The forest quality is expected to improve through
strengthening forest users' rights by granting formal rights to manage the forest
(Shyamsundar and Ghate, 2014). Community Forestry practice allows local people

26
to employ their local knowledge to manage the forest as long as their practices are
suitable for the sustainability of the forest resource. Decentralization of forest
resources from the central government to local community is widely regarded as a
tool for achieving sustainable development goals while contributing to
strengthening social capital in the communities (Shyamsundar and Ghate, 2014).
Agrawal and Ostrom (2001) emphasized that successful decentralization of
resources management from the state to local actors creates new common resources
at local level that allow the local actors to obtain the rights and power to make
decisions regarding the resource management. The creation of new commons is
significant for natural resource policies worldwide (Agrawal and Ostrom, 2001).
As experienced in Nepal and other South Asian countries (Adhikari, B. et
al., 2007), and also in the Indian Himalayas (Agrawal, 1996), devolution of natural
resources such as forests from central government to local communities can lead to
more efficient, equitable and sustainable management of resources. Local control
over nearby natural resources such as the forest generates greater benefits for
surrounding local communities (Wunder, 2001; Bullock and Hanna, 2012; Dhakal
et al., 2012) and better forest conditions at the same time (Gibson et al., 2005;
Anderson et al., 2009). Collective management of forest by local communities has
been proven to produce more efficient outcomes than either private or state
governance and control since transaction costs that are associated with forest
governance are likely to be lower under local collective management compared to
the other two management regimes (Agrawal, 1996).
Community Forestry is also categorized as community based forest
management (CBFM), which is a form of decentralized forest management that
seeks to improve the quality and stock of forests by strengthening user rights and
allowing users to manage the forest collectively (Krogman and Beckley, 2002).
Community Forestry programs are also considered as a “problem solver” for
mitigating conflicts of interest regarding forest resources. In this context, local
communities play the most important role to support decision making processes and
social conflict mitigation (Bullock and Hanna, 2012).

27
Community Forestry is designed to achieve sustainable forest management,
which could better contribute to poverty alleviation (Gunter and Jodway, 2000), as
well as serving ecological functions (Sanwal, 1988; Charnley and Poe, 2007),
including but not limited to, providing ecosystem services such as water, carbon
sequestration, erosion control, and oxygen production.
Sunderlin, William D. (2006, p. 387) suggests seven preconditions for
fulfilment of poverty alleviation through a Community Forestry approach:
1. There is strong commitment from the government for poverty
alleviation through the Community Forestry program.
2. The government is able to exercise its commitment because the goal is
consistent with other state goals.
3. The administrative apparatus, enabling legislation, rules and
regulations governing Community Forestry adequately support poverty
alleviation.
4. Sufficient financial means exist to support the establishment and
implementation of Community Forestry.
5. There is an adequate level of political and organization power at the
local level to enforce entitlements and to exclude unauthorized
claimants to forest resources.
6. Equity institutions at the local level are sufficiently strong to allocate
project benefits to those who are most in need.
7. There are sufficient forest resource endowments at project sites.
2.2.2. Impact of Community Forestry upon Local Economy and Ecology
In this section we explore empirical studies of Community Forestry impacts
on the local economy and ecology that have revealed a variety of outcomes. Some
studies demonstrate the potential benefits of Community Forestry for mitigating
deforestation and, simultaneously, improving the welfare of surrounding
communities. Other studies suggest that Community Forestry programs provide
more economic benefits than ecological benefits. On the other hand, several studies
did not find significant improvement of socio-economic conditions through
Community Forestry programs, in particular for poverty alleviation.
A study of Community Forestry impacts on economy and ecology in
Kathmandu valley in Nepal conducted by Birch et al. (2014) suggested that
Community Forestry provides positive impacts on people’s livelihoods as well as
contributing to biodiversity conservation. They conclude that in the absence of

28
Community Forestry programs, the forestland would be converted into a mixture of
degraded forest, cropland and urban areas that would result in degradation in the
quality and quantity of ecosystem services, especially of carbon stocks and water.
Water quality would decline due to sedimentation, resulting in increased pollution
and higher treatment costs. With good Community Forestry practice, however, local
people’s revenue from harvesting wild goods from the forest itself and from
recreational visitors to their area, is more sustainable (Birch et al., 2014).
Similarly, Dhakal et al. (2007) found that in Nepal, Community Forestry
could help overcome the rural unemployment problem, subsequently increasing
incomes while ensuring sustainable utilization of forest resources. Before the
Community Forestry program was established, the incomes of poor households
were below the minimum standard of living. Poor households could obtain
sufficient income from a combination of farm and community forest resource use,
with a condition that all policy constraints on land use were fully relaxed and user
groups were allowed to maximize their income (Dhakal et al., 2007). However,
relaxing utilization rules to maximize incomes is a return to something like an open
access regime that may have negative effect on ecosystem services from the forest.
It is possible that the forest users' exploitation of the forest beyond its capacity
would reduce its capability to produce ecosystem services.
The Community Forestry program in Nepal also reduces unemployment in
the project area. In terms of land use, there was a shift from timber production to
fodder (from leaf litter) production in this community forest since fodder became
more profitable than timber due to an increase of livestock farming which in turn
led to improved household incomes, as well as having little negative effect on
ecosystem services from the forest (Dhakal et al., 2007).
By contrast, in some countries such as Cambodia, Laos and Vietnam,
empirical evidence for poverty alleviation through Community Forestry is difficult
to find. As mentioned by Sunderlin, William D. (2006), Community Forestry
programs have not been established with poverty alleviation as a major goal in these
countries. Instead, pressure from donor agencies has led to a focus on reducing
environmental degradation. A major barrier to poverty alleviation through

29
Community Forestry programs in these countries has been the forest management
practices that were conducted by state owned enterprises (Sunderlin, William D.,
2006). It is the fact that some forest resources are still under the control of the state
forest enterprises that can prevent the delegation of forest management rights to
local communities.
Similarly, a study conducted in Indonesia by Maryudi et al. (2012) suggests
that Community Forestry is yet to achieve its promise to alleviate poverty. They
mentioned that benefits from Community Forestry in Indonesia were only sufficient
for the forest farmer household's subsistence economy and could not be used for
saving or asset building for permanent income growth. Crops produced from
community forests are seen as a complement to the yields from private farmland.
Declining agricultural yields as the forest canopy increases proved an obstacle to
gaining better outcomes from the community managed forests (Maryudi et al.,
2012).
Charnley and Poe (2007) emphasize the capacity of Community Forestry
programs in supporting forest conservation and community development. They
argue that the impact of Community Forestry on social economic conditions of local
people is dependent on the extent to which devolution or decentralization has
actually occurred in practice and what exactly has been devolved: rights of access
to forest products, forest management tasks, decision making powers, or property
rights. Products from community forests have helped local people meet their
subsistence needs, provide a safety net in emergencies and helped support
livelihoods during seasonal economic gaps (Charnley and Poe, 2007). Clearly,
further research that can provide a better understanding of why Community
Forestry does or does not achieve its promise is needed (Charnley and Poe, 2007).
This thesis aims to help fill this gap in the literature. Now we will turn to discuss
issues regarding payment for ecosystem services, as this has become a key issue in
sustainable forest resource management.
30
2.3. Payment for Ecosystem Services
The utilization of natural common resources such as forests has frequently
created both positive and negative externalities that affect people differentially, such
as when structural arrangements result in disproportionate allocation of costs and
benefits. Externalities are defined as external benefits or costs that emerge as a
result of other people’s activity. This means that the welfare of some depends on
factors that are determined by other users or authorities (van den Bergh, 2010).
Externalities can be positive if they come as benefits and can be negative if they
come as costs for the affected outside parties. An example of a positive externality
is where people can enjoy free clean and fresh air as a result of trees planted by a
land-owner. On the other hand, pollution as a consequence of the existence of a
chicken farm could be an example of a negative externality.
Positive externalities are not likely to be of concern since the affected parties
benefit from their existence. By contrast, negative externalities are often an issue
since they raise problems for those who are affected, and ultimately result in
disregard or damage to the natural resource itself. An example of a negative
externality related to natural resources utilization would be unregulated or illegal
logging in watersheds that ultimately threatens water quality and quantity, affecting
not only those who profit from illegal logging, but also local villagers and urban
water consumers as well.
Vatn (2010) reveals that biodiversity loss and climate change are also
examples on a global scale of how some people's use of natural resources can affect
others' lives and livelihoods. Thus internalizing these externalities may be an
important step in order to make fair and sustainable conditions for related parties
affected by resource use and conservation. This phenomenon is the well-known
issue of social cost (Coase, 1960) which we turn to discuss in the next section.
2.3.1. Definition of PES
To promote natural resource sustainability by reducing negative
externalities, a relatively new paradigm has been developed and has emerged as a
significant policy instrument, namely Payment for Ecosystem Services (PES). PES

31
is defined as a voluntary transaction where a well-defined ecosystem service is
bought by at least one service buyer from at least one service provider with a
condition that the provider continues to conserve the resource in order to secure the
service provision (Wunder, 2005, 2007). This paradigm is specifically designed to
reward those who manage natural resources through financial incentives to provide
an agreed level of ecosystem services.
Ecosystem services (also called environmental services)8 are defined as the
beneficial ecological components that are enjoyed by people directly or indirectly
from ecosystem or environmental protection (Costanza et al., 1997; MA, 2003;
Boyd and Banzhaf, 2007; Fisher et al., 2009). Examples of ecosystem services
include carbon sequestration, biodiversity conservation, watershed protection, and
landscape beauty (Ferraro, 2001; Wunder, 2005). These are commonly categorized
as public goods or quasi-public goods and typically are free to consume9. However,
the emerging scarcity of these goods causes them to become economic goods with
the potential to be commercialized (Wunder, 2005).
Coasean economics is the primary conceptual basis of the PES approach
(Muradian, Roldan et al., 2010; Sattler and Matzdorf, 2013). The Coasean theorem
is based on the assumption that the problem of externalities can be solved through
direct negotiation among related parties who cause and/or are affected by the
externality, regardless of the allocation of property rights (Coase, 1960; Engel et
al., 2008; Sattler and Matzdorf, 2013). In his influential article “The Problem of
Social Cost”, Coase (1960) challenged Pigou’s approach in “The Economics of
Welfare” to solving the problem of externalities.
Pigou (1932) argued that negative externality generates a social cost that
should be dealt with by government. He proposed a system of tax, which is well
8 The terms ecosystem services and environmental services are often used interchangeably in
academic and public policy literatures (Muradian, Roldan et al., 2010). 9 Public goods are defined as valued goods which everyone can access, that have characteristics of
non-rivalry and non-exclusion (Dietz et al., 2002; Anderies and Janssen, 2013). On the other hand,
goods that have characteristics of rivalry and exclusion are defined as private goods (Anderies and
Janssen, 2013). Quasi-public goods, which Ostrom (1990) called common-pool resources, hold both
characteristics of private and public goods including partial exclusion and partial rivalry (Anderies
and Janssen, 2013). Ostrom (1990, p. 30) defines common-pool resources as “a natural or man-made
resource system that is sufficiently large as to make it costly (but not impossible) to exclude potential
beneficiaries from obtaining benefits from its use”.

32
known as “Pigovian tax”, for resolving the social cost problem. Pigou’s solution
implies market failure and asserts that government authority is needed to correct
the market so that an appropriate level of compensation for externalities would
emerge (Yandle, 1997). Yandle (1997) argues that the Pigovian approach is likely
to be more appropriate, and should be applied in large-scale cases, where there are
many parties included in the system, and where it is too difficult to rely on contracts
and market solutions.
On the other hand, instead of taxing or subsidizing the parties who cause
externalities - to reduce or stop their harmful activity - Coasean economics suggests
market and quasi-market transactions can achieve a socially optimal level of
environmental externalities. Coase argues that those who produce externalities and
those who suffer from them should be left in an unregulated situation without
government intervention (such as Pigovian taxes or subsidies) and that a transaction
process will eventually be developed automatically regardless of who holds the
property rights (Turner et al., 1994). However, Sattler and Matzdorf (2013) argue
that in practice, the Coasean solution faces some obstacles regarding efficient
bargaining, in particular, high transaction costs, power imbalances, and poorly
defined property rights. Thus the Coasean solution itself required a clear definition
and allocation of property rights (guaranteed ownership of resources via the force
of state law) and low transaction costs, similarly requiring state intervention (Turner
et al., 1994; Muradian, Roldan et al., 2010).
In summary, in a Coasean style PES, the beneficiaries of ecosystem services
make a direct payment to the ecosystem services provider based on a mutually
agreed voluntary negotiated procedure. By contrast, in a Pigovian style PES, the
government undertakes an intervention, such as by providing a subsidy to pay the
ecosystem services provider in order to secure the ecosystem services provision
(Sattler and Matzdorf, 2013). It is possible that a hybrid Coasean and Pigovian
approach can lead to a new policy paradigm that combines elements of both a
voluntary market-based and mandatory policy-based system. An example of the
hybrid approach is the PSA program in Costa Rica that combine the Pigouvian and
Coasean approach to the sources of funding. The funding for this program comes
from a private hydroelectric producer, tax, and World Bank loans (Sánchez-

33
Azofeifa and Pfaff, 2007). The PES system in West Lombok Indonesia also
represents a hybrid approach that combines voluntary transactions on the supply
side and government regulation on the demand side. Based on Coase’s thesis,
ecosystem services supply should theoretically be optimal if there is payment from
beneficiaries of ecosystem services to its providers (Pattanayak et al., 2010). This
is the fundamental assumption behind the concept of PES proposed by some
scholars (see, for example, Wunder 2005, 2007). Pagiola (2007) defined PES as a
market-based mechanism centered on the mutual principles of buying and selling
of ecosystem services from beneficiaries to providers. Sommerville, M. M. et al.
(2009) stress, however, a principle of services provision as a condition for the
incentives transferred to ecosystem services providers. Featuring incentives as a
key aspect for the provision of ecosystem services, Muradian, Roldan et al. (2010,
p. 1205) define PES as “a transfer of resources between social actors, which aims
to create incentives to align individual and/or collective land use decisions with the
social interest in the management of natural resources”. A common assumption of
PES policies is that there must be contractual mutual obligations among service
providers and consumers (Kroeger, 2012).
2.3.2. The Emergence of PES
The concept of ecosystem services can be traced back to 1864 when Marsh
first introduced the modern concept of ecosystem services in his book Man and
Nature (Mooney et al., 1997). A century later, concern about ecosystem services
continues to draw scholars’ attention. For instance, in the late 1960s King,
Helliwell, Hueting, Odum and Braat published on the functions of nature in serving
human needs (Gómez-Baggethun et al., 2010). Following this, in the 1970s and
1980s, people’s dependence on natural ecosystems had been stressed by some
scholars through a consideration of ecological impacts on the economy and vice
versa, thus raising greater public interest in environmental protection and
biodiversity conservation (Westman, 1977; Pimentel et al., 1980; Ehrlich and
Ehrilch, 1981; Costanza et al., 1997). In the early 1990s, the research agenda on
ecosystem services was stimulated by the Beijer Institute’s Biodiversity Program
(Perrings et al., 1992). A paper presented by Costanza et al. (1997) was a landmark

34
in the development of the concept and awareness of ecosystem services (Gómez-
Baggethun et al., 2010). The concept of ecosystem services started to be employed
in the policy arena in the late 1990s and early 2000s; the Millennium Ecosystem
Assessment (MA, 2003) established a critical milestone that takes the ecosystem
services paradigm into account (Fisher et al., 2009). It has since been followed by
the introduction of PES programs in a number of countries.
Pagiola (2008) points out that Costa Rica’s country-wide program called
Pago por Servicios Ambientales (PSA) in 1997 was the first full-scale
implementation of the formal PES mechanism in a developing country. The PSA
was designed to address the problem of deforestation as Costa Rica had one of the
highest deforestation rates at the time10. As perhaps the best-known example of PES
(Pattanayak et al., 2010), Costa Rica’s PSA program succeeded in raising the
interest of many countries in introducing PES programs as a tool for environmental
protection. These included Brazil, Mexico, Colombia, Bolivia, Ecuador, China, and
Indonesia. Further impetus came when the Kyoto Protocol established Reducing
Emission from Deforestation and Forest Degradation (REDD+)11 programs as a
possible vehicle to articulate international PES schemes in the forestry sector
(Venter and Koh, 2012).
2.3.3. Two Paradigms Regarding PES
Tacconi (2012) explored two PES approaches called the environmental
economic perspective as summarized by Engel et al. (2008) and the ecological
economic perspective described by Muradian, Roldan et al. (2010). From an
environmental economics perspective, the main concept of PES is that external
ecosystem services beneficiaries directly benefit; contractual and conditional
financial transfers are made to local landholders and users in return for adopting
practices that secure environmental conservation and restoration (Wunder, 2005).
10 Costa Rica’s deforestation rate between 1973 and 1989 reached one of the highest levels in the
world, with yearly average logging of 32,000 hectares (Brown and Bird, 2010, p. 1). In the initial
introduction period of the PSA program, it had contributed to a reduction of about 1% of the yearly
deforestation rate (Robalino and Pfaff, 2013, p. 339). 11 REDD+ is a method for putting a price tag on the carbon storage and sequestration services
provided by forests (Venter and Koh, 2012).
35
The environmental economics perspective stressed the conditionality that providers
should maintain the provision of ecosystem services in return for payment.
Services providers commonly obtain more benefits from their ordinary
methods of managing or using the land than from that required by services buyers
for conservation purposes. Since the ordinary management practices produce
externalities that affect ecosystem services users, according to the environmental
economics perspective approach, ecosystem services users should transfer certain
endowments to the ecosystem services providers as compensation for managing the
land in an appropriate way that does not adversely affect them. The transfer of
endowments could be in the form of monetary or non-monetary (indirect approach)
compensation, such as through rural development projects. In order to represent an
affordable ecosystem services price, the payment should meet a minimum benefit
forgone (opportunity cost) condition by the ecosystem services providers and be
less than or equal to the value of the ecosystem services to the buyers (Engel et al.,
2008).
Wunder (2005) summarizes the five conditionality criteria underlying the
environmental economics perspective approach to PES:
1. It is a voluntary transaction.
2. The ecosystem services must be well-defined.
3. There must be a minimum of one ecosystem services buyer.
4. There must be a minimum of one ecosystem services provider.
5. The ecosystem services provider must secure the ecosystem services
provision.
The second approach to PES, the ecological economics perspective, is built
on a different set of principles. According to this approach, PES cannot be
considered as a voluntary market transaction especially from a buyer’s perspective,
even if private negotiation occurs (Muradian, Roldan et al., 2010; Vatn, 2010). To
execute a PES program, there is a need for engagement between state and
community (Vatn, 2010). So, state or government intervention is required. An
independent intermediary is also probably required to act as a broker to connect
providers and buyers of ecosystem services especially in the case of a large number
of both parties. The intermediary could also be a manager of the PES system. Its
36
role could be collecting payments from buyers and delivering them to providers,
monitoring the provision of ecosystem services, and ensuring the enforcement of
property rights among the parties.
The ecological economics perspective advocates that the conditionality
criteria and the assumption of complete information in PES transactions adopted by
the Coasean approach are, in practice, rarely met. Most PES practice in the world
follows the Pigouvian approach and includes some government intervention (Sattler
and Matzdorf, 2013). Government intervention can be in the form of regulator,
monitor and also provider of supporting subsidies.
2.3.4. Alternative PES Schemes
Wunder (2005) described several important distinctive approaches among
PES schemes: first, area-based versus product-based schemes; second, public
versus private schemes; and third, use-restricting versus asset building schemes.
We discuss each in turn.
Area-based versus Product-based Schemes
In area-based schemes, a certain number of pre-agreed land units are
stipulated in contracts. The agreed land then will be used to provide certain
ecosystem services which should be managed by providers. Examples of this
approach include conservation concessions, easements, protected catchments or
forest-carbon plantations (Wunder, 2005).
In contrast, product-based schemes are set to produce environmentally
friendly certified natural resource based products where buyers will pay “a green
premium” on top of the market price as compensation for the production process of
such products. This type of PES is usually designed to minimize the negative
impacts of related production processes to the environment (Wunder, 2005).
Certified timber, organic farming, and ecotourism are examples of this product-
based type of scheme.

37
Public versus Private Schemes
This kind of scheme is distinguished by who the buyers of the services are.
In public schemes, the state acts on behalf of buyers; they collect money in the form
of fees, taxes or grants from services consumers and deliver it to the providers
(Wunder, 2005). The REDD+ programs are examples of this type of PES scheme.
On the other hand, private schemes tend to be more locally focused where
there is a direct connection between services users as buyers and services providers
(Wunder, 2005). In this case, buyers pay directly to providers without any
intermediary body. A hydro-power company paying the land owner to keep their
trees in order to maintain river flow is a good example of this type of scheme.
Use-restricting versus Asset Building Schemes
In use-restricting schemes, providers are rewarded for their effort in
conservation-related activities such as restricting land development and protecting
natural resources (Wunder, 2005). In this scheme, the opportunity costs of
conservation are covered by the service users. Protecting forest for carbon
sequestration is an example of this scheme.
In contrast, asset-building schemes aim for ecosystem services area
restoration. Farmers are encouraged to participate in environmental conservation,
which aims to maintain or improve ecosystem services provision for which they
will be rewarded by the service users. Replanting trees on degraded land is an
example of this scheme (Wunder, 2005).
2.3.5. PES and Poverty Alleviation
Evidence that high levels of poverty are spatially correlated with remote
areas that provide ecosystem services suggests that PES programs could also
contribute to poverty alleviation (Pagiola et al., 2005; Wunder, 2005; Pagiola, 2007;
Bremer et al., 2014). However, the impact of PES programs on the livelihoods of
poor people is an empirical question. In this regard, Wang et al. (2009)
distinguished three categories of PES impacts on poor households: first, the impact

38
on poor providers; second, the impact on poor users; and third, the impact on poor
non-participants.
The impact of PES on poor providers can be divided into income effects and
non-income effects (Pagiola et al., 2005; Wang et al., 2009). The income effects are
obtained directly by the poor as soon as they participate in providing ecosystem
services, particularly in a cash-based payment approach. Payments from service
users could offer additional income for them that could potentially increase
livelihood benefits. Although theoretically a PES scheme is assumed to be
beneficial to poor ecosystem services providers (Wang et al., 2009), there is no
guarantee that payments will reach those most in need, or compensate for resource
benefits foregone (Pagiola et al., 2005). Distributional inequities might be related
to how resource rights are defined and distributed among ecosystem services
providers. In a condition of weak property rights where poor providers have little
or no access to other resources such as private farming land, they would probably
suffer welfare losses, as in general they are heavily dependent on natural resources
for their subsistence. Thus, PES would probably not be beneficial for poor providers
in areas where property rights are insecure and not clearly defined, since the PES
payment should be delivered to the ecosystem services providers who clearly hold
property rights upon the resources that produce the ecosystem services. In this
situation, a PES system is unlikely to be an adequate policy to increase welfare
(Engel and Palmer, 2008).
Non-income effects of PES commonly relate to social and cultural capital12
(Pagiola et al., 2005; Wang et al., 2009) and investment (Wang et al., 2009; Tacconi
et al., 2013). Effective implementation of PES programs often requires participants
to build an institution that would provide a forum for enhanced cooperation among
communities. It thus contributes to social capital building (Kerr, 2002; Pagiola,
2005). In terms of investment, in considering a PES program in South Africa as an
example, Wang et al. (2009) found that PES has created thousands of jobs, with a
12 Social or cultural capital refers to “features of social life—networks, norms, and trust—that enable
participants to act together more effectively to pursue shared objectives” (Putnam, 1995, pp. 664-
665).
39
strong emphasis on gender equity. They also found that PES provides other benefits
such as specific skills training and better health services for the participants.
Tacconi et al. (2013) argue that the impact of PES will be higher in a situation where
there is a collective fund component in which some payments are retained and used
for credit to individual households or for community level investment such as rural
infrastructure. They considered PES practice in West Java Indonesia as a positive
example, where 5% of individual payments were retained, to be invested in the
community water supply system. In this regard, the existence of local organizations,
which have the capability to manage funds and facilitate collective decision-making
by the community at large is necessary (Tacconi et al., 2013). However, undesirable
impacts on poor ecosystem services providers could still possibly occur. For
instance, users of local forest resources might lose access to non-timber forest
products as a result of PES agreements that exclude traditional uses.
The second category, the impact of PES on poor users, comes indirectly in
the form of better living conditions for the poor users as a result of environmental
quality amelioration (Wang et al., 2009). For instance, improvements in the quality
of water services will help the poor to reduce their cost of water consumption since
they can use clean water both for cooking and drinking without additional spending
on bottled water. However, PES could also be a burden for the poor users. If the
amount of payment is unaffordable, this will obstruct their opportunity to
participate, and thus will limit their access to these ecosystem services.
The last category, the impact of PES on poor non-participants, is via the
effect of land use and labor market change (Wang et al., 2009). Changing land use
could limit the access of landless poor people to natural resources, as poor people
often rely for their livelihood on natural resources such as gathering non-timber
products from the forests. The impact on labour demand could arise from land
management systems changed as a consequence of the land-owner participation in
the PES program. Landowners who previously employed workers to manage their
land could reduce their employees in order to meet the requirement of the PES
system to maintain the natural condition of the land. Thus PES could increase
unemployment rates in rural areas. In this case, PES will generate adverse impacts
for poor-non-participants. Regarding this situation, Pagiola et al. (2005) concluded

40
that PES is designed for natural resources management efficiency purposes and is
not the best instrument for poverty alleviation.
2.3.7. Guidance for PES System Development
In regard to developing a good system of PES, it is necessary to understand
the process of how ecosystem services are affected by land users and how the
provision of ecosystem services will affect the ecosystem services users. The World
Bank provides guidance for PES system development along these lines as illustrated
in Figure 2.1.
There are some key steps required to develop a PES program. Firstly, it is
important to understand the economic impact of land use on ecosystem and
ecosystem services users. For instance, land use could have implications for the
hydrological system, carbon sequestration, and/or biodiversity conservation.
Hydrological systems that generate water services could possibly affect farmers
who use water from irrigation systems, consumers of water companies and also the
hydropower electricity users. The core concept of PES based on the World Bank
model is that those who provide the ecosystem services should be rewarded in order
to maintain positive behavior related to the ecosystem services provision (Pagiola,
2006).
The second step is identifying ecosystem services users and setting up an
ecosystem services price. This step requires a long negotiation process with the
users to set the appropriate ecosystem services price, especially if the users are
private companies. The economic precondition of an acceptable ecosystem services
price is that service users' Willingness to Pay (WTP) should exceed services
providers' Willingness to Accept (WTA) and should ideally compensate the
minimum opportunity cost faced by services providers (Börner et al., 2010; Hoang
et al., 2013).

41
Figure 2.1 Guidance for PES System Development
Sources: Pagiola and Platais (2002) and Pagiola (2006).
After the negotiated price has been set up and the service users are charged,
the next step is paying the service providers. In order to make the PES system
transparent and accountable, one option is to employ an independent mediator who
can manage and monitor the mechanism, to make sure that all the processes of
ecosystem services delivery as well as the payments have been delivered to
appropriate parties. In this regard, the last step, establishing the institutional
framework, is critical (Pagiola, 2006).
2.3.8. PES Application in the World
PES systems have been introduced through various schemes in developing
and developed countries. Table 2.2 summarizes the main schemes. Most of the PES
schemes in the world are related to forest conservation with water and biodiversity
as the main object of ecosystem services protection. Local farmers in the ecosystem
services production areas are the sellers while the buyers come from governments,
private companies and water-user communities. Typically, PES practices are
organized by an independent management organization, usually supported by the
relevant government.
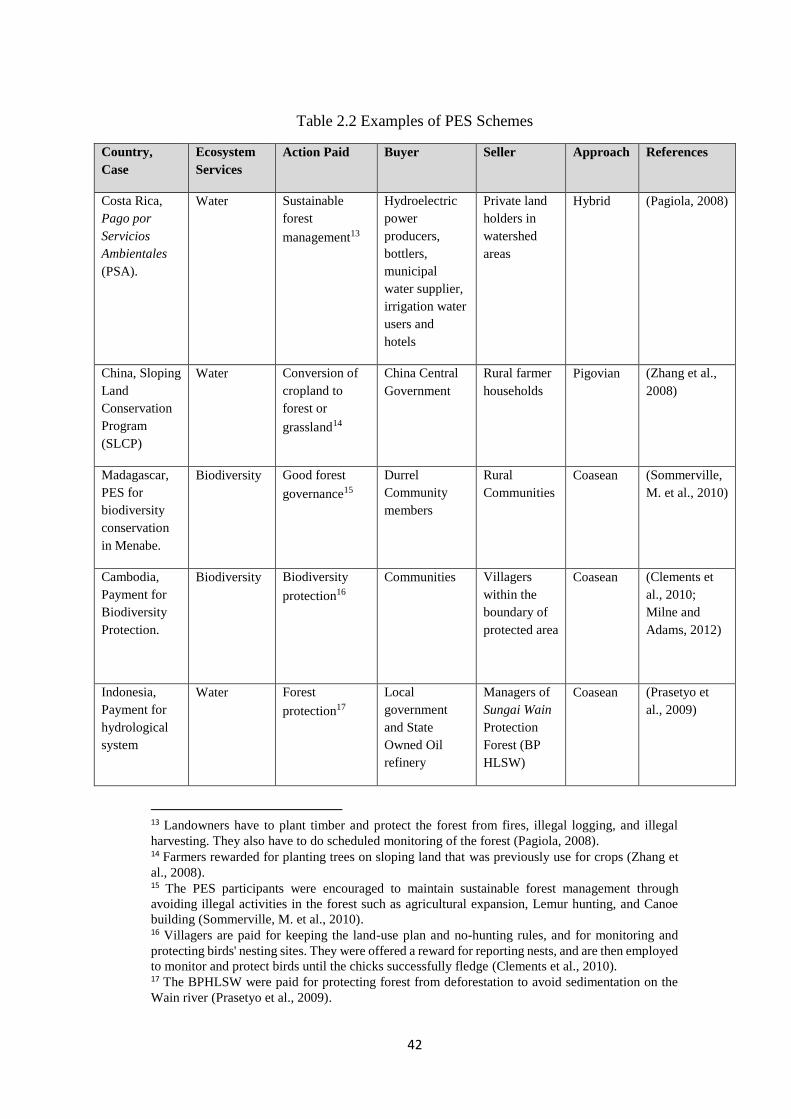
42
Table 2.2 Examples of PES Schemes
Country,
Case
Ecosystem
Services
Action Paid Buyer Seller Approach References
Costa Rica,
Pago por
Servicios
Ambientales
(PSA).
Water
Sustainable
forest
management13
Hydroelectric
power
producers,
bottlers,
municipal
water supplier,
irrigation water
users and
hotels
Private land
holders in
watershed
areas
Hybrid (Pagiola, 2008)
China, Sloping
Land
Conservation
Program
(SLCP)
Water Conversion of
cropland to
forest or
grassland14
China Central
Government
Rural farmer
households
Pigovian (Zhang et al.,
2008)
Madagascar,
PES for
biodiversity
conservation
in Menabe.
Biodiversity Good forest
governance15
Durrel
Community
members
Rural
Communities
Coasean (Sommerville,
M. et al., 2010)
Cambodia,
Payment for
Biodiversity
Protection.
Biodiversity Biodiversity
protection16
Communities Villagers
within the
boundary of
protected area
Coasean (Clements et
al., 2010;
Milne and
Adams, 2012)
Indonesia,
Payment for
hydrological
system
Water Forest
protection17
Local
government
and State
Owned Oil
refinery
Managers of
Sungai Wain
Protection
Forest (BP
HLSW)
Coasean (Prasetyo et
al., 2009)
13 Landowners have to plant timber and protect the forest from fires, illegal logging, and illegal
harvesting. They also have to do scheduled monitoring of the forest (Pagiola, 2008). 14 Farmers rewarded for planting trees on sloping land that was previously use for crops (Zhang et
al., 2008). 15 The PES participants were encouraged to maintain sustainable forest management through
avoiding illegal activities in the forest such as agricultural expansion, Lemur hunting, and Canoe
building (Sommerville, M. et al., 2010). 16 Villagers are paid for keeping the land-use plan and no-hunting rules, and for monitoring and
protecting birds' nesting sites. They were offered a reward for reporting nests, and are then employed
to monitor and protect birds until the chicks successfully fledge (Clements et al., 2010). 17 The BPHLSW were paid for protecting forest from deforestation to avoid sedimentation on the
Wain river (Prasetyo et al., 2009).

43
Country,
Case
Ecosystem
Services
Action Paid Buyer Seller Approach References
protection in
Balikpapan.
Company
(Pertamina)
Mexico,
Payment for
Hydrological
Environmental
Services.
Water Forest
Conservation18
Mexican
Federal
Government
Communal
and
individual
land owners
Pigouvian (Muñoz-Piña
et al., 2008)
Brazil, Bolsa
Floresta
Program.
Carbon
sequestration
Carbon
emission
reduction
through forest
conservation19
Government
and private
sector
Communities
living in the
Amazon
Pigouvian
(Pereira,
2010)
Australia,
payment for
tropical
savannas
protection.
Landscape,
habitats and
biodiversity
Savannas
protection20
Government People living
in tropical
savannas
Pigouvian (Greiner, R. et
al., 2009)
Australia,
Caring for our
Country
program
Biodiversity
and cultural
resources
Biodiversity
promotion and
cultural
conservation21
Government Aboriginal
ranger groups
Pigouvian (Greiner, R
and Stanley,
2013)
In summary, this review of the case study literature on PES found four major
types of PES schemes dominating global experiments to date (Pagiola et al., 2005;
Wunder, 2005; Engel and Palmer, 2008; Wunder et al., 2008; Greiner, R. et al.,
2009; Peskett et al., 2011):
1. Carbon sequestration and storage (e.g. an electricity company pays
farmers or landowners for planting and maintaining additional trees).
The Reducing Emission from Deforestation and Forest Degradation
18 Payment will be made if no land use change had occurred, no matter how small the change. If
deforestation occurs accidently for instance by forest fires or timber theft, participants will get paid
only for the remaining forest area (Muñoz-Piña et al., 2008). 19 Forest dwellers were rewarded for avoiding deforestation. They were still allowed to continue
carrying out sustainable productive activities such as agro-extractivism (Pereira, 2010). 20 Actions paid includes safeguarding the wild grunter fishery, safeguarding Aboriginal cultural
heritage and sustaining terrestrial biodiversity (Greiner, R. et al., 2009). 21 Participants were rewarded for undertaking coastal clean-up of discarded fishing nets and rescue
of marine wildlife caught up in the nets (Greiner, R and Stanley, 2013).

44
(REDD) program is an example of this PES type which aims to
compensate the effort of land owners in reducing carbon emissions from
deforestation and forest degradation (van Wilgen et al., 1998; Agrawal
et al., 2011; Venter and Koh, 2012);
2. Biodiversity protection (e.g. conservation donors pay local people for
restoring areas to create a biological corridor) (Clements et al., 2010;
Gardner et al., 2012; Ingram et al., 2014);
3. Watershed protection (e.g. downstream water consumers paying
upstream forest users for adopting land management practices that
control deforestation, soil erosion, flooding risk, etc.) (Kerr, 2002;
Prasetyo et al., 2009; Pirard, 2012);
4. Landscape embellishment (e.g. a tourism operator pays a local
community for maintaining landscape beauty or not hunting in a forest
being used for ecotourism) (Greiner, R. et al., 2009; Clements et al.,
2010; Sodhi et al., 2010).
These PES developments are supported by international development
institutions, such as the World Bank. The World Bank’s commitment to
environmental sustainability has been implemented via its support for PES
development in developing countries. For instance, the Costa Rica Ecomarkets
Projects were funded with US$ 33 million in 2001-2006 (Pagiola and Platais, 2002).
Some US$ 4.5 million was allocated for the Regional Integrated Silvopastoral
Management program, developed in Colombia/Costa Rica/Nicaragua during 2002-
2008 (The World Bank, 2008). In South Africa, the World Bank allocated an
amount of US$ 9 million for the Cape Action Plan for the Environment in 2004
(The World Bank, 2004). Other projects were also developed in EL Salvador,
Mexico, Venezuela, Kenya, and Panama (Pagiola, 2006). The World Bank not only
provided money for PES development, but it also provided capacity building in the
supported countries.
International conservation NGOs such as World Wide Fund for Nature
(WWF), Conservation International (CI) and The Nature Conservancy also have
important roles in PES programs development worldwide. WWF claims to be the

45
leader in developing PES schemes around the world (WWF, 2017). A number of
PES practices have been promoted by WWF, including Reducing Emissions from
Deforestation and Forest Degradation (REDD) programs in Colombia, Democratic
Republic of Congo, Indonesia, Nepal, Peru, Laos and Vietnam; watershed-based
PES in Madagascar, Serbia, Ukraine, Bulgaria, Romania; as well as the PES scheme
in West Lombok - the case study of this thesis. Most of the PES schemes promoted
by WWF applied a Coasean approach using voluntary systems. Conservation
International (CI) supports PES programs in some countries - the PES approach in
Costa Rica is one of the featured projects promoted by CI that also received funding
support from the German Development Bank through The Trust for the Sustainable
Biodiversity (TSB) Fund (Rodriguez, 2012). Other countries in which CI has been
engaged in developing PES programs include Caledonia, Ecuador, Brazil,
Cambodia, Madagascar, China and Indonesia (Forslund et al., 2009). The Nature
Conservancy instigated PES Water Funds, Water Producers and REDD+ programs
in Brazil and across Latin America including Colombia, Ecuador, Peru, and Mexico
(The Nature Conservancy, 2012, 2017). In contrast to WWF and CI, The Nature
Conservancy promoted PES programs that mostly applied a Pigouvian approach
where the funding comes from the relevant government. The vast majority of PES
programs that have been supported by these NGOs are concerned with forest
conservation.
2.4. Conclusion
Inadequate governance of commons resources that have caused
overexploitation have prompted scholars and policy makers to promote sustainable
ways to manage such resources. The consequences of unregulated exploitation were
highlighted by Garrett Hardin in his influential essay, as “the tragedy of the
commons”. In Hardin’s analysis, a state might address the ‘tragedy of the
commons’ by acting as the owner of common resources, providing regulations for
usage. Another alternative to govern the common resources proposed by Hardin is
privatization. He argues that by privatizing the commons resources, those resources
can be used in a sustainable manner. However, he believed privatization was unfair
due to the exclusive use of the resource. In addition, a private investor could obtain
46
private property rights, exploit the resource and transfer the capital gained from
overexploitation to a new field of operation that might threaten resource
sustainability. Hardin also proposed a third solution that he described as 'mutual
coercion, mutually agreed upon'. In this third solution, social arrangements that can
produce responsibility sharing are required. However, this third solution is often
ignored in the literature.
As early interpreters of Hardin ignored the institutional constraints on
resource use that often exist in the community, Elinor Ostrom and other commons
researchers argued that local communities have the potential within their traditional
institutions to manage common resources more sustainably than privatization or
state monopoly. Ostrom’s research focuses on practices of community based
management of common resources, which is an approach that accommodates local
people's experience, knowledge and institutions in governing the commons, but
which also faces limitations.
There is consequently an emphasis on co-management between state and
local communities in order to deal with the significant negative externalities arising
from commons resource mismanagement. One of the common resources that have
become the focus of co-management approach is forests. Because of their scale,
forests tend to be an open access resource that makes regulation of use rights
difficult. The government usually holds authority over these forests, but is often
unable to regulate use-rights effectively. Through co–management of forests, social
economic factors affecting local communities can prevent forest degradation caused
by local people’s activities in the forest for economic reasons. Accommodation of
local needs in forest management has been attempted mainly in the form of
Community Forestry. In Community Forestry practice, some conditional rights
over forest management are devolved from the state to the local community.
Studies suggest that Community Forestry has the potential to be a tool for a
win-win solution, to achieve a balanced outcome of forest management for both the
local economy and for ecological benefits. However, the effectiveness of local
institutions in relation to community forest management remains an open question,
with mixed results reported.

47
Payment for Ecosystem Services (PES) is one important policy framework
aimed at controlling externalities in the management of common resources such as
forests. Pigou’s and Coase’s theories became the fundamental alternative
approaches for PES development and implementation. The Coasean approach
favours market transactions between those who cause the negative externality and
the ecosystem services users who suffer from it. Coase suggests that both parties
negotiate without any government intervention so that an optimal level of balance
can be achieved between cost and reward. On the other hand, the Pigouvian
approach accommodates the involvement of government to mitigate externalities
through regulatory mechanisms, and by exercising tax or subsidies. In practice,
most of the world’s applications of PES mainly follow the Pigouvian approach;
where the buyer of the ecosystem services is the government, or the government
provides cash on behalf of their citizens for rewarding resource protection. There
are also hybrid arrangements where market transactions are involved and
government intervenes through policy frameworks to make the PES system work.
PES has continued to develop globally since it was introduced in the late
1990s and early 2000s. Support from the World Bank and international
environmental based NGOs contributed to the rise of PES implementation in
developing countries. Debates among scholars emerged regarding the effectiveness
of the twin goals of PES, supporting environmental conservation as well as for
alleviating poverty in rural areas. The extent to which PES combined with
Community Forestry is able to simultaneously counteract poverty and achieve
environmental and social livelihood goals in a case study of Lombok, Indonesia
will be the key question to be addressed in this thesis. Theories of commons
resource management will be used as a framework to answer the question.
However, it is first necessary to provide background on forest governance in
Indonesia and particularly Community Forestry management in Lombok, a topic to
which we turn in the next chapter.

48
Chapter 3
Forest Management, Community Forestry and Adat Rules
The aim of this chapter is to explain how forests in Indonesia, especially in
Lombok, are managed. Historical forest management regimes from the era of the
pre-colonial kingdoms through the post-Suharto regional autonomy era are
reviewed in this chapter. The triggers of deforestation in Indonesian forests in each
era are elaborated, concluding with a discussion of contemporary Community
Forestry management and the role of adat rules in forest management in the case
study area.
This chapter is structured as follows. Section 3.1 discusses historical forest
governance in Indonesia and the triggers of deforestation; Section 3.2 focuses on
Community Forestry schemes and adat rules including the case study of Sesaot
community forest development, the use of adat to govern the forest and its impact
on sustainable forest management. The role of outsiders in Community Forestry
management is discussed in section 3.3. Finally, section 3.4 summarizes the main
points and concludes this chapter.
3.1. Historical Forest Governance and Deforestation in Lombok
The Indonesian Constitution of 1945 (UUD 1945) regulates the ownership
of Indonesian natural resources, including forests. Article number 33 of the
constitution mentions that “the earth, water and natural resources contained therein
shall be controlled by the state and are to be used for the welfare of the people”
(UUD 1945 article 33) . The Basic Agrarian Law -UU 5/1960 article 1(2) and 2(1)-
also emphasizes that all natural resources in Indonesia are national assets that
belong to all of the people and are managed by the state (UU 5/1960 article 2) .
Officially, forests cover 98 million hectares or about 52% of the total land
area in Indonesia (Menteri Kehutanan RI, 2014b, p. 3). Before the colonial era in
this country, kings and traditional communities controlled forests. At that time,

49
forests in Java were exploited for timber, especially teak, that was used as the raw
material for shipbuilding (Simon, 1994). Meanwhile, forests outside of Java,
especially in Lombok were communal property that could be accessed freely by
community members. The forests in Lombok were mainly used for subsistence until
the King of Bali conquered Lombok island in 1740 and took control of the forests
from the community (Van der Kraan, 1980, p. 8).
When the Dutch company Vereenigde Oost-Indische Compagnie (VOC)
colonized Indonesia in 1602, the exploitation of forests increased without any
rehabilitation efforts (Simon, 1994, p. 5). Intensive forest management practices
began in 1796 when the Dutch Government took over control from the VOC. In
1808, Herman Willem Daendels was appointed as Governor-General of the Dutch
East Indies government with the mission to secure a Dutch monopoly on teak
forests in Java, forest labour, and the shipbuilding industry (Peluso, 1992, p. 45).
Bae et al. (2014) notes that there was limited control by the Dutch
government over forests outside of Java, including in Lombok, due to on-going
authority held by the kings (raja) who occupied the region. In 1865, the Dutch
government introduced the national forest service (Jawatan Kehutanan) to secure
greater control of forests in Indonesia. The authority of the kings and communities
over forests was recognized through The Basic Agrarian Law of 1870 which was
introduced by the Dutch government. However, the rights of the kings and local
communities in managing the forests, was now under the jurisdiction of the Dutch
government22. The forests were claimed as colonial state land with local customary
management rights called swapraja and an official Dutch colonial supervisor
appointed for forest management called Pamong Praja (Bae et al., 2014). The
establishment of Jawatan Kehutanan and Pamong Praja resulted in the
subordination of swapraja’s authority over the forest.
In 1942, the Japanese came to what is now Indonesia and took over colonial
control from the Dutch government. During the Japanese invasion in 1942-1945,
there was severe damage to the forests due to an absence of maintenance (Simon,
22 Local communities were employed as timber cutters by the Dutch colonial government (Gultom
et al., 2013).
50
1994). Most forest management activities that had been established by the Dutch
government were discontinued in this period (Bae et al., 2014).
Until the beginning of Indonesian independence, the degradation of
Indonesia's forest continued, although forests were managed by the National Forest
Agency that had been inherited from the Dutch government. In Lombok, forests are
governed by Forest Services for Eastern Indonesia (Bae et al., 2014). Saman et al.
(1993) argues that in the early days of Indonesian independence, deforestation
occurred because of an imbalance between an increasing number of people and
limited job availability, especially in the agricultural sector. The lack of
employment in rural areas forced villagers to “steal” wood in the forest to meet their
economic needs which further contributed to forest destruction (Saman et al., 1993).
During the New Order Government period in Indonesia, the Basic Forestry
Law (UU 5/1967) was introduced. This law was used by the government to centrally
control all forests throughout the country (UU 5/1967 article 5). In this period,
massive deforestation still occurred due to exploitation of the forests as a main
source of national revenue (Brockhaus et al., 2012). This law defines four types of
forests with different functions and restrictions23. These are: protection forests,
production forests, conservation forests and recreational/tourism forests. The
function of protection forests is to support the regulation of water, to protect
watersheds and prevent flooding and erosion, and maintain soil fertility. Production
forests are specifically managed to extract timber. Meanwhile, conservation forests
are used for biodiversity conservation. Finally, tourism forests are forests that are
used for recreational purposes, especially for wildlife hunting (UU 5/1967 article
3).
23 Based on article No. 3 of UU 5/1967, forests in Indonesia were classified as Hutan Lindung
(Protected Forest), Hutan Produksi (Production Forest), Hutan Suaka Alam (Conservation Forest)
and Hutan Wisata (Tourism Forest). The classification was then revised in Indonesian forestry law
no 41/1999, that classified Indonesian forest into three classifications based on forest function,
which are Hutan Konservasi (Conservation Forest), Hutan Lindung (Protection Forest) and Hutan
Produksi (Production Forest).

51
In 1984, forest land use planning (Tata Guna Hutan Kesepakatan, TGHK)24
was introduced to facilitate forest rehabilitation. Forests were then re-classified by
their function, as (1) protection forests that function as watershed protection; (2)
conservation forests that function as protected areas for biodiversity; (3) limited
production forests, where logging is allowed with restrictions to reduce soil erosion;
(4) production forests for commercial logging where clear felling was permitted
(UU 41/99: article 2). Among the types of forests, conservation forests are the most
protected forest with restriction on collection of forest products (UU 18/2013 article
21) . However, forest products from protection forests and production forests can
be collected for economic benefit. In production forests, trees can be logged with
certain terms and conditions. In protected forest, logging is prohibited, but other
forest products such as non-timber forest products still can be collected.
Article 14 of the 1967 Forestry Law also regulated forest concessions in
Indonesia. According to the act, the forest concessions policy aimed to increase the
production and harvest of forest products in order to support national economic
development and the prosperity of the people. Permits for forests management
could be granted to national, regional and private enterprises. The implementation
of this law has triggered massive forest destruction in Indonesia since most of the
concessions were given to irresponsible private enterprises as part of a pervasive
political patronage system (Barber, 1998; McCarthy, J. F., 2000; McCarthy, JF et
al., 2012)
During the period of Suharto’s Presidency, forest concessions were
distributed to Suharto’s family and business partners that in many cases had links
with the military through corruption, cronyism and nepotism (Reed, 2006; Anderies
and Janssen, 2013). Timber mafias also emerged at regional levels that were usually
assisted by the military and police (Gultom et al., 2013). Since the 1970s,
concession holders ignored agreements to replant the forests causing massive forest
degradation (Saman et al., 1993). In the 1970s the annual deforestation rate was
recorded as being 300,000 hectares, which then increased by 100% in the early
24 TGHK is based on the provincial level stakeholders' agreement to determine forest function
(Menteri Kehutanan RI, 2009b).
52
1980s (Saman et al., 1993, p. 1). This privileged elite contributed to the
deforestation of more than 22 million hectares of forest between 1985 and 1997
(Reed, 2006, p. 74).
Other New Order era policies and legislation that have contributed to the
destruction of forests in Indonesia are Law number 1/1967 concerning foreign
investment, and Law number 6/1968 concerning domestic investment. Both of
these laws reflected Indonesia's intention to open up opportunities for investment
in natural resource extraction including forests exploitation. Investment in the
forestry sector increased with the introduction of Government Regulation number
21/1970 on Forests Concession Rights (Hak Pengusahaan Hutan, HPH) and
Forests Product Harvesting Rights (Hak Pemungutan Hasil Hutan, HHPH) (Saman
et al., 1993). The regulation mentions that HPH allows the right holder to exploit
the forests including logging, regeneration and forests preservation, processing and
marketing of forests products (PP 21/1970, article 1) .
In general, deforestation in Indonesia was caused by many things, including
the conversion of forests to industrial plantations for providing raw materials for
paper and pulp, palm oil, and by fires, mining and illegal logging activities (Ramli
and Ahmad, 1994; Nawir et al., 2008). Illegal logging was recorded as the dominant
factor causing deforestation (Gultom et al., 2013). This thesis argues that forest
resource management policies during the New Order provided the basis for the
emergence of alliances between the government and businessmen that constructed
'mafias' in the timber business which were primarily responsible for deforestation
in Indonesia.
During the New Order, as timber enterprises obtained concessions to forests
throughout Indonesia, local communities’ access to forests became increasingly
limited due to tight control by forest rangers (RA, community leader, interview,
27/2/2015). Two timber companies that held concession permits in Lombok,
namely PT Tambora Buana Lestari and PT Angkawijaya Raya Timber, have
contributed to forest degradation in the northern part of Lombok (Bae et al., 2014).
PT Angkawijaya Raya Timber obtained forest concessions in 1990 with an area of
10,000 hectares in the northern part of Lombok (interview with a local NGO
53
officer). Lack of forest rehabilitation lead to massive degradation that caused a
crisis of water and drought in surrounding villages. When forest exploitation
reached about 6,000 hectares, villagers in the surrounding area protested against the
companies. The companies were expelled from the forest in 1999 and their licences
cancelled following the collapse of the Suharto government. Following this, the
provincial forestry agency took control over the forest to be recovered (AN, NGO
officer, interview, 24/9/2015). Just prior to this, PT Tambora Buana Lestari had
obtained a concession in 1998, with a total size of 200 hectares also in northern
Lombok. As was the case with PT Angkawijaya, PT Tambora did not conduct
rehabilitation after the trees were logged. In 2000, the University of Mataram
proposed to local government to occupy the forest land that was exploited by PT
Tambora, to be used for research. However, since the program was not working as
designed, local people occupied this forest land and planted coffee and Albizia (AN,
NGO officer, interview, 24/9/2015).
After the collapse of Suharto’s New Order regime in 1998, central
government control over the forests diminished. This period marks the return of
local communities’ access to forests. In Lombok, villagers entered forests around
their village, logged the trees and occupied the forests in order to plant fruit trees
and other agricultural crops such as coffee and cocoa (RA, community leader,
interview, 27/2/2015). As a response to this encroachment, the government started
to encourage local participation in forest management (Bae et al., 2014) which
eventually developed into a Community Forestry management scheme.
Faced with strong public pressure, the Indonesian Ministry of Forestry
introduced Ministerial Decree number 677/Kpts-II/1998 as a guide for Community
Forestry management over designated areas known as Hutan Kemasyarakatan
(HKm). The first experiments with establishing HKm in Lombok that provide
formal recognition of the community’s involvement in forest management were
implemented in two forest sites, namely Santong and Sesaot (Bae et al., 2014).
During the transition from a centralized to decentralized Indonesian
government system, between 1998–2002, forest degradation continued to occur.
Massive encroachment, illegal logging and forest occupation reached their peak due

54
to political instability, lack of law enforcement, unclear sanctions for offenders and
an increase in the number of people dependent on forest land for agricultural
expansion (Gultom et al., 2013; Bae et al., 2014).
New policies and programs were designed to rehabilitate the forests and to
achieve more sustainable outcomes. In 1999, the Indonesian government introduced
Forestry Law number 41/1999 to replace the Basic Forestry Law of 1967. This law
determined the new status and function of Indonesian forests, including a revised
management system. The law recognised the right of local people to be involved in
forest management. After regional autonomy was implemented in 2001, practical
control over forests shifted from the central government to district governments
while central government maintained ultimate authority (Wollenberg et al., 2006;
Fauzi and Anna, 2013). The chronological story on forest management in Indonesia
is illustrated in figure 3.1.
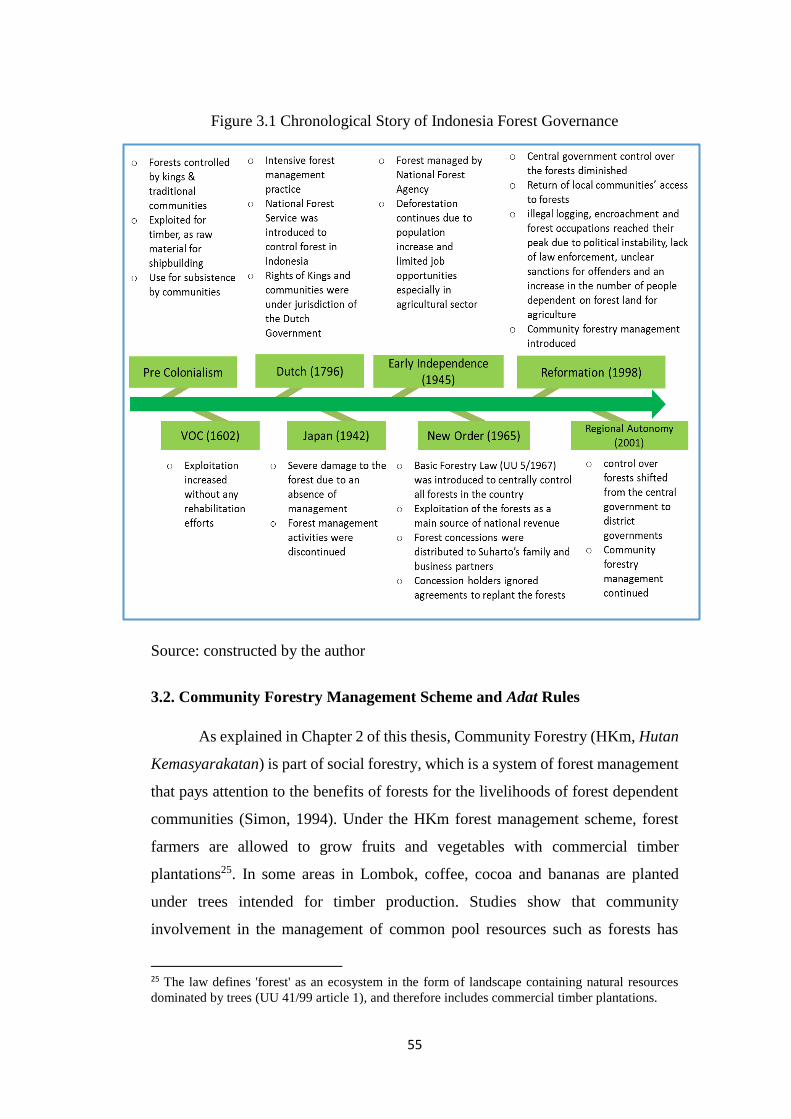
55
Figure 3.1 Chronological Story of Indonesia Forest Governance
Source: constructed by the author
3.2. Community Forestry Management Scheme and Adat Rules
As explained in Chapter 2 of this thesis, Community Forestry (HKm, Hutan
Kemasyarakatan) is part of social forestry, which is a system of forest management
that pays attention to the benefits of forests for the livelihoods of forest dependent
communities (Simon, 1994). Under the HKm forest management scheme, forest
farmers are allowed to grow fruits and vegetables with commercial timber
plantations25. In some areas in Lombok, coffee, cocoa and bananas are planted
under trees intended for timber production. Studies show that community
involvement in the management of common pool resources such as forests has
25 The law defines 'forest' as an ecosystem in the form of landscape containing natural resources
dominated by trees (UU 41/99 article 1), and therefore includes commercial timber plantations.

56
brought about better outcomes in terms of resource sustainability (Agrawal and
Chhatre, 2006; Agarwal, 2009), due to the benefits that local people obtain from
these commons resources. In terms of securing forests from illegal logging, the
forest is likely to be better protected under this governance scheme. As one of the
community leaders in Sesaot village remarked, when local people are involved in
forest management, they will contribute to protecting the forest from timber theft
(AN, community leader, interview, 21/3/2015).
Most of the forests in Lombok that are located near villages are managed
through the HKm forest management system. Currently, there are 9,589.5 hectares
of official HKm forest in Lombok spread over four districts (see Table 3.1).
Table 3.1 Official HKm Forest Management in Lombok
District
HKm size
(hectare)
Hkm with legal
permit (hectare)
West Lombok 2,688 411
North Lombok 2,042 758
Central Lombok 2,180 1,809
East Lombok 2,680 420
TOTAL 9,590 3,398
Source: Dinas Kehutanan Provinsi NTB (2014)
However, as of 2015, legal permits from the Indonesian Ministry of Forestry
covered only 35% of the HKm forest in Lombok. The rest are still in the process of
application. Although forest governance is under the control of local government,
HKm legal permits are issued by the central government through the forestry
minister, with recommendations from the relevant district heads.
Traditional customary law (Adat) is applied in HKm forest governance as a
complementary system to state regulations on forestry. The vast majority of forest
farmers in Lombok are ethnic Sasak who are respectful of their adat and tend to
obey their adat more than state regulations (SA, forestry agency officer, interview,
May 2014). The sanctions for not following adat law are relatively “more painful”
than state law sanctions. One example of adat sanctions is isolation from the
community. With respect to forest governance, adat law regulates forest security
and the relationships between forest farmers. This collaborative approach between

57
adat and state law has support from the local government. The forestry agency and
village government were involved in the formal recognition of adat law and of the
application of adat sanctions to violation of customary regulations.
3.2.1. Case Study of Sesaot Community Forest
The Sesaot forest, one of the pilots for the HKm forest management system
in Lombok, is an example of a forest that is governed through the collaboration of
adat and state law. The Sesaot forest is located in the western part of Rinjani Forest
and administratively under West Lombok District (see figure 3.2).
Figure 3.2 Map of Sesaot Forest
Source: Google (2015a).

58
The total size of Sesaot forest is 5,950 hectares. This forest functions as a catchment
area for the water needs of the City of Mataram and western part of Lombok. Six
villages are located nearby the Sesaot forest, namely Sedau, Lebah Sempage,
Pakuan, Sesaot, Buwun Sejati and Batu Mekar with a total of 32,786 residents (see
table 3.2).
Table 3.2 Population of Villages around Sesaot Forest
Source: Pemerintah Kabupaten Lombok Barat (2014)
Nearly half of the villagers around Sesaot forest are farmers. The second largest
occupation for local people is as rural labourers. Those who work as labourers
typically do not own private land; they work as labourers on private farming land
and in HKm forest land. Meanwhile, only 3% of the villagers work as office
workers.
Figure 3.3 Villagers' Occupations in Surrounding Sesaot Forest
Source: Pemerintah Kabupaten Lombok Barat (2014)
Villages Population Total Number of
households Male Female
Sedau 2,267 2,374 4,641 1,659
Lebah Sempage 2,130 2,060 4,190 1,364
Pakuan 1,553 1,530 3,083 1,018
Sesaot 2,279 2,341 4,620 1,718
Buwun Sejati 1,913 1,875 3,788 1,339
Batu Mekar 6,214 6,250 12,464 3,088
TOTAL 16,356 16,430 32,786 10,186

59
Before 1982, Sesaot forest was classified as a production forest, and was
controlled by the Indonesian central government. A document from Forum
Kawasan, the Community Forest Farmer Group (CFFG) Forum in Sesaot, clarified
that there were three local timber companies that had obtained concession rights to
exploit Sesaot forest when the status of this forest was still a production forest in
1975 (Forum Kawasan, 2009). The companies were CV Bangun Karya, CV Unggul
Jaya and CV Cipta Karya. Each company obtained 100 hectares concession rights.
The companies in Sesaot were not connected to PT Tambora Buana Lestari and PT
Angkawijaya Raya Timber (the two companies that held large concession permits
in Lombok) since they only worked in the northern part of Rinjani Forest (AN,
NGO officer, interview, 22/9/2015).
The exploitation resulted in forest degradation since there were no efforts
from the companies to replant the forest (HA, villager, interview, 29/9/2015). Reed
(2006) notes that the timber companies in Sesaot cleared over 1300 hectares of the
forest. Weak law enforcement allowed them to clear several times the granted
concession size (Reed, 2006, p. 75). In the early 1980s, when the concession areas
of Sesaot forest had been degraded, the government took control over the forest
from the companies and conducted a rehabilitation project. Local people were
employed for the land rehabilitation and afforestation project in the production
forest. Local people who were involved did not receive cash for this work. Instead,
they were allowed to cultivate crops, including coffee that was grown under the
trees, in lieu of wages through an intercropping (tumpangsari) system (RA,
community leader, interview, 27/2/2015).
Due to the crucial function of Sesaot forest for water catchment, its status
was changed from production forest to protected forest by the Indonesian Ministry
of Agriculture in 1982 (Menteri Pertanian RI, 1982). Local people were no longer
allowed to access the forest after the status change. A one hundred metre boundary
or buffer zone was created between the forest and the surrounding villages. As
compensation for the loss of access to forests, each household in the surrounding
villages was granted rights to manage 0.25 hectare of land for cultivating coffee in

60
the buffer zone area, through the tumpangsari26 system (AM, CFFG leader,
interview, 8/6/2014).
However, the availability of land in the proposed buffer zone area was not
adequate for the number of villagers who needed access to land. Those who did not
obtain land, often enter the protected forest to cultivate coffee, outside the buffer
zone area (Konsepsi, 2009). As a response to this situation, the Governor of West
Nusa Tenggara province issued regulation number 140/1986 to provide a legal basis
for coffee cultivation in protected forest areas. This was then followed up with a
decision by the Head of the Forestry Agency of West Nusa Tenggara number
522.21/5358/1986 that allowed 1,632 hectares of the total Sesaot Forest area of
5,950 hectares to be used for coffee cultivation. The policy allowed people to utilize
the forest for coffee cultivation through a revenue sharing system, where 50 percent
of crops are allocated to the farmer and 50 percent to the government (Konsepsi,
2009). This policy also stipulated that farmers were not allowed to log the trees, to
build dwellings on the land, and to sell or to rent out the land.
In 1995, with NGO assistance and support from the provincial forestry
agency, a trial of the Community Forestry system was implemented on 25 hectares
of the Sesaot forest (Forum Kawasan, 2011b). After five years, an evaluation of the
project was conducted and it was concluded that the project had generated positive
outcomes for people’s livelihoods and for forest conservation. The HKm size was
then expanded to 236 hectares (Forum Kawasan, 2011b). A farmers’ group namely
Kelompok Mitra Pelestari Hutan, KMPH (Partner Group for Sustainable Forest),
was created to manage the HKm. The KMPH was legally recognized by the
Indonesian Ministry of Forestry a decade after its establishment (AR, CFFG leader,
interview, 25/5/2015).
Since the decentralization era that began in 1999, forest governance in
Sesaot has been fully controlled by the West Nusa Tenggara provincial government.
The governor introduced regulation number 522.21/457/Prov/2000 to increase
26 Tumpangsari is a planting method that allows forest farmer to cultivate crops on forestland
together with forest plantation (Rosyadi et al., 2005).

61
regional income from the utilization of naturally-logged27 trees in Sesaot forest.
However, this policy was abused by some local people. Standing trees were logged
and sold to timber mafias creating massive deforestation (AM, CFFG leader,
interview, 8/6/2014). Forum Kawasan (2011b) reported that about 1,800 hectares
of Sesaot forest was cleared at the time. After the lands were cleared, local people
occupied the forest to plant fruit trees such as durian, mangosteen, candlenut,
rambutan and banana. Currently, there are 4,331 households occupying the forest
land (Forum Kawasan, 2014).
In 2003, the Government of West Lombok introduced regional regulation
(Perda, Peraturan Daerah) number 10/2003 to regulate Community Forestry in this
district. Based on this regulation, local people are allowed to manage the occupied
forest through the HKm scheme. The HKm management rules require forest
farmers to plant and maintain timber trees along with crop trees. However, the HKm
status of most of this forest is not clear since only 411 hectares of 2688 hectares of
the forest lands that are managed by communities have yet been granted a legal
permit from the Ministry of Forestry28.
Those who have not yet obtained legal permits, are still allowed to work in
the forest. The recognition of their rights is indicated by their obligation to pay a
form of retribution to the district government. The forest users are obliged to pay
annual retribution of 120,000 rupiah (equal to US $10) per hectare of forest land
that they occupied. This retribution is called “non-timber forest product retribution”
and is used for regional government revenue. As the number of farmers is large and
difficult to coordinate, all farmers were grouped together into a community forest
27 Naturally-logged refers to a condition where the tree falls due to death or strong winds. 28 The reason for the discrepancy between the large proportion of Hkm covered by permits
noted above in Table 3.2 is that there are two types of HKm; the HKm program and non-
program. An Hkm program is issued and designed under a government project. Non-
program Hkm were not designed by the government. Instead, they originated as a result of
forest encroachments by villagers. The HKm program obtained more assistance and
support from the forestry agency which issued the permit (SN, local government officer,
interview, 4/6/2014). HKm in Sesaot is categorized as non-program that obtained less
assistance from forestry agency.

62
farmer group (CFFG) based on the location of the forestland they occupy. The
retribution is then collected through each group’s leader and paid to the district
forestry agency. As well as collecting retribution, these CFFGs are used to manage
the forest collectively. Most of the members come from the same ethnic group that
share the same customary traditions (adat) which are used to govern their forest
management activities. Adat (customary) rules in this case are called awiq-awiq.
There are four CFFGs, with a total membership of 4,331 people that govern
the Sesaot forest. Leaders of CFFGs are elected by the members and act as the
representatives of the CFFG in every meeting and in coordination with outside
parties. However, there is asymmetric information access between the members and
the committee. According to some farmers, not all information is communicated to
all members. Information is usually controlled by the leaders or members who have
a close relationship with the CFFG leaders. This could be due to a lack of regular
meetings in the CFFG. They conduct a meeting only when there is a special case to
be discussed, such as a violation of the awiq-awiq or a new government program or
policy in relation to community forest management.
Recognition by local government itself would be insufficient to provide a
legal basis for Community Forestry practice. An official permit such as that given
to the KMPH is needed by all of the forest farmers (Author’s survey data, 2015). In
2006, a forum of CFFGs, the Forum Kawasan Hutan Sesaot, was created to
advocate for legal permits. This forum acts as an umbrella organisation of CFFGs
in the six villages around the Sesaot forest. Forum Kawasan coordinates four
CFFGs - KMPH, Wana Dharma, Wana Abadi and Wana Lestari. At the time this
thesis was written, Forum Kawasan was still struggling to obtain these legal permits
with the assistance of some NGOs. The forum acts as a mediator to advocate for
changes of government policy, in case it is not in line with the communities’ needs.
By grouping together in one formal organization, people tend to have a
stronger bargaining position with outsiders. In the case of Community Forestry in
Sesaot forest, forest farmers became more powerful after they organised themselves
in Forum Kawasan. Forum Kawasan is the first party that should be consulted by

63
the government to advise on any new policy related to Sesaot forest governance.
Forum Kawasan has experienced success in advocating for the interests of the forest
farmers that are in conflict with local government policies. In 1999, the Forest
agency of West Nusa Tenggara Province was going to build a Botanical Park
(TAHURA) in Sesaot forest. People’s occupation and use of the forest would be
threatened if this policy were applied since only certain parts of the forest will be
allowed to be managed by the local community in that circumstance. Forum
Kawasan advocated to government to change the policy. As the result, the
TAHURA was shifted to another location outside the community forest (AM,
CFFG leader, interview, 8/6/2014).
The Forum Kawasan was also created for the purpose of coordination and
communication among the forest farmer groups in relation to forest management
matters. The specific aims relate to the issue of forest management rights, assistance
to CFFGs, forest protection from illegal logging and other causes of forest
destruction. Adat law (awiq-awiq) that is used to govern each CFFG was then
compiled as a single awiq-awiq to govern the Forum Kawasan and all of its
members. The forum’s mission is to develop a model of community based
sustainable forest management that features gender equity, welfare, and
employment of local wisdom in forest governance.
The Forum Kawasan includes two key roles namely Lokaq and Lang-lang.
The Lokaq works as a judge for dealing with any offenders or mismanagement of
the forest. Meanwhile, the Lang-lang has the responsibility to enforce the awiq-
awiq, to monitor the observance of awiq-awiq rules, and to catch offenders of the
awiq-awiq. Lokaq and Lang-lang are selected by the CFFG members by
considering their experience in community leadership and forest management;
these are usually persons that have charisma in the community. For example, the
current Lokaq used to be a hamlet leader in Sesaot.
3.2.2. Awiq-awiq and Sustainable Forest Management
The awiq-awiq was established by CFFG leaders that represent their
members, under the coordination of the Forum Kawasan. Village leaders and forest

64
agency officers were involved in the process of awiq-awiq determination through
several community meetings. The agreed awiq-awiq was then signed by all meeting
participants. Each CFFG leader was then responsible to introduce the awiq-awiq
regulations to their members. However, based on the author’s survey results, not all
CFFG members understand all aspects of the awiq-awiq. Respondents are only
familiar with the most common prohibited activity in the forest that can cause them
to lose their rights to manage the forest land, logging trees. The author’s survey
results indicate that 77% of respondents claim to obey awiq-awiq29. The main
reason they give for respecting the awiq-awiq is that the respondents are part of the
community and the rule is agreed together by the community members. If they do
not obey the community’s agreement, then they will be excluded from the
community, which can cause them to lose the rights to manage the Community
Forestry land. Among the respondents, no one admitted to disobeying the awiq-
awiq. However, 23% of respondents gave a neutral response, which several
indicated was because they did not clearly understand the awiq-awiq rule due to a
lack of explanation from the CFFG leader.
Figure 3.4 Farmers' Obedience to Awiq-awiq
Source: Author's survey; 2015; n = 200
The author’s survey results indicate that 76% of respondents agree that
awiq-awiq influences the forests condition. The main reason is that awiq-awiq
29 The question asked “Apakah Anda mentaati aturan adat (awiq-awiq) dalam pengelolaan
hutan?” (Do you obey the Awiq-awiq regulation regarding forest management?)
23%
64%
13%
Neutral Obey StronglyObey

65
accommodates a participative, forest guard system. All CFFG members are
required to guard their forest land from timber theft and to prevent illegal logging.
Figure 3.5 Farmers Opinion that the Awiq-awiq Influences Forest Condition
Source: Author's survey; 2015; n = 200
The principle features of the awiq-awiq include (Forum Kawasan, 2006):
a. The plantation composition on HKm land must be 30% native tree
species and 70% multi-purpose tree species (MPTS)30;
b. It is acknowledged that the forest land belongs to the state and cannot be
sold for any reason;
c. Raising livestock is not permitted in the forest area;
d. Logging trees in the forest area is prohibited;
e. Collecting non-timber forest products on forestland is allowed.
In the case of violations against the awiq-awiq, the following mechanisms
are then pursued. Verbal reprimands will be given for the first two infringements
by the CFFG leader. If a third infringement occurs, a written warning will be given.
If a further infringement occurs, the offenders will appear in an awiq-awiq court.
The court is led by the Lokaq and attended by Lang-lang, the chairmen of the CFFG,
the chairmen of Forum Kawasan, a village government officer and the forestry
30 MPTS (Multi-Purpose Tree Species) refers to tree species that have both ecological and economic
benefits. They function to protect the water catchment and can produce yields that have economic
benefits. Examples of MPTS are fruit trees, candlenut and palm trees (Menteri Kehutanan RI,
2014a).
1%
23%
72%
4%
Disagree Neutral Agree Stronglyagree

66
agency officer representative (AM, CFFG leader, interview, 8/6/2014). If the
offender is unable to comply with the awiq-awiq due to his failure to manage the
land according to regulations, the land management rights will be taken by the
group and will be given to other members according to need, and in accordance
with the decisions made through group deliberation.31
The penalty for illegal logging is the most significant. A single logged tree
has to be replaced with twenty new trees which must be managed properly until
they are fully grown. If the logged trees cause destruction on a neighbour’s land or
plantation, the loss has to be compensated in line with the value of what has been
destroyed. The same penalty is applied for a second offense. The third penalty is
the heaviest. If illegal logging is conducted for a third time, the offender will face
social sanctions, that is, isolation32 from the community and termination of his
rights to manage the HKm land (DA, CFFG Leader, interview, 8/6/2014).
During 2007-2008, two years after Forum Kawasan was established, four
illegal logging and mismanagement of Community Forestry land cases had been
solved through the awiq-awiq enforcement. In 2007, one farmer was isolated from
Sesaot village due to a case of crop theft (Forum Kawasan, 2006). Another example
of the awiq-awiq enforcement was an illegal logging case that occurred in 2011. A
person who logged trees in his HKm land lost his right to manage the HKm after
being judged by the lokaq in an adat court (Forum Kawasan, 2011a).
However, the enforcement of the awiq-awiq faces several constraints. For
example, family, friendship and neighbourhood relationship are sometimes
considered when enforcing the awiq-awiq. Often the offender is a family member
or a friend of the CFFG committee. In this situation, awiq-awiq enforcement would
have a destructive impact on personal relationships. In this case, the awiq-awiq is
only enforced if the violation caused massive loss for many people or if the violation
created negative impacts on the community. In addition, there is resentment from
the convicted person towards the awiq-awiq enforcers. For instance, crops on a
31 Each household is allowed to manage a maximum 0.25 hectares. 32 Isolation refers to exclusion from the right to receive services and help from the community.
including in ceremonial matters.
67
lokaq’s land were damaged by an unknown person, an incident which may have
been connected to the enforcement of awiq-awiq (DA, CFFG leader, interview, 8/6/
2014).
3.3. Role of the Outsider in Community Forestry Management
Self-governing institutions as suggested by Ostrom (2005) would likely be
insufficient to ensure the success of community governance of common pool
resources. Other factors that might be important and could influence how the
community governs the commons are the existence and character of property rights,
and assistance from outsiders. In the case of Community Forestry management,
property rights of the forest farmer are widely regarded as important to ensure long-
term access to the forest as an incentive for forest farmers to conduct sustainable
forest governance. Assistance from outside parties such as NGOs or government
agencies would be needed to monitor and advise in the form of a co-management
practice on the commons (Baland and Platteau, 1996, p. 334). This is consistent
with Ostrom’s approach (1990), to nested governance, which recognizes the
importance of checks and balances between levels of governance to support and
monitor local community management. The Indonesian Community Forestry
approach is similar to co-management arrangements commonly practiced world-
wide, that can also be called ‘joint management’, ‘adaptive management’,
‘collaborative management’, ‘community-based or local management’ and
‘indigenous management’ (Jentoft, 2003; Persoon et al., 2003; Borrini-Feyerabend
et al., 2004; Carlsson and Berkes, 2005; Berkes, 2009; Ulvevadet and Hausner,
2011). Co-management means, “the sharing of power, responsibilities and benefits
with respect to the management of natural resources (including their exploitation
and conservation) among government and individual or collective users” (Persoon
et al., 2003, p. 4).
This thesis will argue that community forest outcomes and management
patterns such as logging practices in Sesaot forest are correlated with the
involvement of outside parties such as NGO and government agencies that monitor
and influence the behaviour of farmers in managing community forestland. As
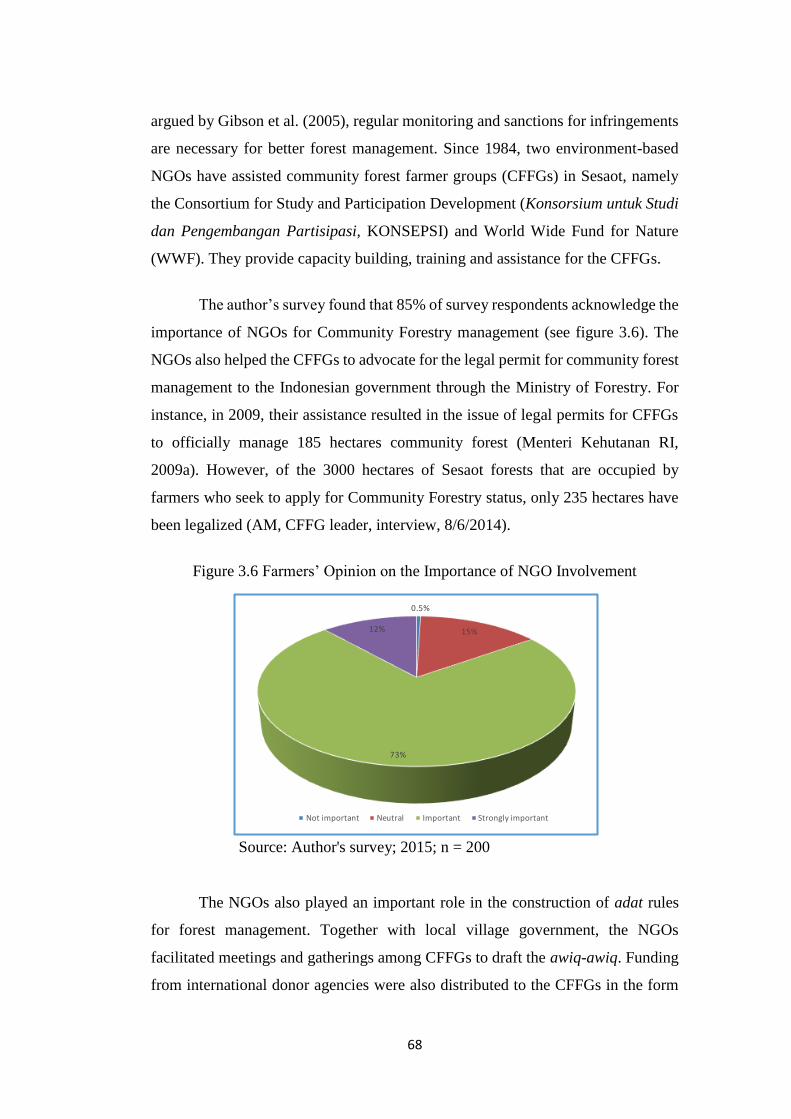
68
argued by Gibson et al. (2005), regular monitoring and sanctions for infringements
are necessary for better forest management. Since 1984, two environment-based
NGOs have assisted community forest farmer groups (CFFGs) in Sesaot, namely
the Consortium for Study and Participation Development (Konsorsium untuk Studi
dan Pengembangan Partisipasi, KONSEPSI) and World Wide Fund for Nature
(WWF). They provide capacity building, training and assistance for the CFFGs.
The author’s survey found that 85% of survey respondents acknowledge the
importance of NGOs for Community Forestry management (see figure 3.6). The
NGOs also helped the CFFGs to advocate for the legal permit for community forest
management to the Indonesian government through the Ministry of Forestry. For
instance, in 2009, their assistance resulted in the issue of legal permits for CFFGs
to officially manage 185 hectares community forest (Menteri Kehutanan RI,
2009a). However, of the 3000 hectares of Sesaot forests that are occupied by
farmers who seek to apply for Community Forestry status, only 235 hectares have
been legalized (AM, CFFG leader, interview, 8/6/2014).
Figure 3.6 Farmers’ Opinion on the Importance of NGO Involvement
Source: Author's survey; 2015; n = 200
The NGOs also played an important role in the construction of adat rules
for forest management. Together with local village government, the NGOs
facilitated meetings and gatherings among CFFGs to draft the awiq-awiq. Funding
from international donor agencies were also distributed to the CFFGs in the form
0.5%
15%
73%
12%
Notimportant Neutral Important Stronglyimportant

69
of various capacity building programs. In addition, NGOs played a significant role
in monitoring community observance of the Ministry's Community Forestry and
local adat rules.
After 2013, NGO assistance to CFFGs in Sesaot was reduced due to limited
funds (TN, NGO officer, interview, 13/06/2014). This led to a situation where
community forest farmers no longer strictly follow Community Forestry rules (AN,
community leader, interview, 21/03/2015). For instance, plantation composition in
the community forest was significantly different from Community Forestry
regulation requirements. Furthermore, the situation has become worse since CFFG
leaders were no longer active in coordinating meetings and gatherings.
Monitoring from outside parties such as NGOs and related government
agencies is clearly important in influencing the level of improvement of forest cover
due to regulation enforcement. Farmers tend to manage the community forest more
appropriately if there is control from other parties who have stronger bargaining
power than the farmer. Thus in the case of Community Forestry practice in Lombok,
this thesis argues that the self-governing community as theorized by Ostrom (1990)
will work more effectively with support from outsider parties such as NGOs and
government agencies who work with the community in managing forest resources.
Thus a co-management approach, which involves collaboration between a
community and NGOs or related government agencies, can contribute to an
alternative solution for more sustainable common pool resource governance.
3.4. Conclusion
Natural resources, including forests in Indonesia are controlled by central
and local governments. The governance of the forests can be granted to private
companies as well as to local communities. However, deforestation is a problem
regardless of the type of the forest management, as a lack of regulatory enforcement
enables exploitation without imposing stewardship responsibilities. Deforestation
in Indonesia, including in Lombok, was mainly triggered by forest concessions to
timber companies, which did not require them to rehabilitate after the forest had

70
been exploited33. In addition, forest degradation was caused by encroachment by
villagers due to political chaos and the lack of law enforcement especially after the
collapse of the New Order regime in 1998.
In an effort to replant the forest, local government in Lombok encourages
local communities surrounding the forest to manage the forest through a
Community Forestry scheme. Villagers that are granted the forest management
rights establish Community Forestry Farmer Groups (CFFG) and employ
customary law (adat regulations called awiq-awiq) to govern the CFFG in relation
to forest security and relationships among CFFG members. Awiq-awiq is applied
together with state regulations on forestry.
Despite the fact that the enforcement of the awiq-awiq faces several
constraints due to the close relationships among CFFG members, most CFFG
members obey the awiq-awiq since violation could cause them to lose their rights
to manage the forest. Since the awiq-awiq introduced a participative forest guardian
system, this may ultimately lead to sustainable Community Forestry management.
As argued by Gibson et al. (2005), rule enforcement by a local community in a
group is significantly correlated with a better forest condition, regardless of how
the group is formed and how dependent the group’s members are on the forest
resources.
Assistance and monitoring from outsiders is needed to support a co-
management forest governance system. Such an approach could achieve forest
conservation as well as poverty alleviation. The extent to which Community
Forestry impacts upon forest conservation and poverty alleviation will be analysed
in Chapters 5 and 6 respectively. The next chapter will discuss the integration of a
Payment for Ecosystem Service program into the Community Forestry management
system in Sesaot Forest.
33 During the New Order regime, the reafforestation funds, which were financed by a volume-based
levy paid by forest concessionaries, were supposed to be used to support forest restoration and
rehabilitation, but they had been corrupted and misused. The funds were used to promote the
development of industrial timber and pulpwood plantations companies with close ties to political
elites, and other politically favoured projects (McLeod, 2000; Barr et al., 2010; Barr and Sayer,
2012; Hidayat, 2016).

71
Chapter 4
Integrated Payment for Ecosystem Services and Community
Forestry Management
This chapter reviews the development of Payment for Ecosystem Services
(PES) in West Lombok. The PES program in West Lombok is integrated into the
Community Forestry program to support forest conservation and poverty reduction
in rural areas. This chapter focuses on the way that PES was introduced and
integrated with the Community Forestry program. This chapter will elaborate on
the potential for a new approach to PES systems that combines the mainstream
Coasean approach and the alternative Pigouvian approach.
This chapter is organized as follows: Section 4.1 summarizes the process of
PES development in West Lombok. Section 4.2 discusses the establishment of a
multi-stakeholders entity called IMP that acts as an intermediary organization to
run the PES program in West Lombok. Section 4.3 considers the demand side of
the PES program including the payment collection scheme. Section 4.4 discusses
the supply side of the PES program, including coverage of the scheme of payment
delivery to PES providers. Section 4.5 discusses the contracts that are used in the
PES system. Section 4.6 focuses on a new paradigm in the PES literature. Finally,
section 4.7 concludes this chapter.
4.1. Development of the PES Program in West Lombok
Forest management in Lombok, and throughout Indonesia, is controlled by
the central government through provincial and district forest agencies. However, as
discussed in the previous chapter, there are several reasons why deforestation is
continuing. One of the major reasons is illegal logging activities (Gultom et al.,
2013). An inadequate number of forest rangers in proportion to the total forest area
exacerbates this condition (MM, forest agency officer, interview, 06/06/2014).
Forest Watch Indonesia (FWI) notes that, as of 2009, Java and Bali-Nusa Tenggara
have lost 61% and 46% of their forest cover respectively (FWI/GFW, 2011, p. 15).

72
Forest Watch Indonesia also estimates that by 2030 forests in both regions will be
totally lost at current rates of deforestation.
The 137,431 hectares of forest in Mount Rinjani, the 3,726 metre volcano
that dominates Lombok Island, is a significant catchment area for the supply of
water to the island’s four million residents. More than 175 springs in Rinjani forest
flow into 10 main rivers on the island, which support the water needs of the island’s
households, agricultural land, and industries. However, the World Wide Fund for
Nature (WWF) reports that 5% of Rinjani forest is deforested annually, leading to
a critical water shortage in three quarters of the watershed (WWF, 2014).
Water provision in Lombok strongly depends on the governance of the
Rinjani forest (AZ, Water corporation officer, interview, 10/6/2014). Most of the
watersheds on the island located in the forest are managed through a Community
Forestry scheme, as discussed in Chapter three of this thesis. The Rinjani forest is
surrounded by 90 villages and populated by approximately 600,000 people (BPS,
2015a). One part of Rinjani forest that has a significant role in watershed
management in Lombok is Sesaot forest. Most of the villagers in the area are poor
and own little or no private land and are thus highly dependent upon the forest for
their livelihood. They collect food, fodder, fuel-wood and timber from the forest
and farm in protected forest areas. This reliance on the forest’s resources and
expansion of agriculture into the forest is threatening forest functions especially in
regard to watershed management.
Economic disparity between communities in rural areas and those who
consume water in urban areas evokes a conflict of interest related to forest
governance. The poor villagers who live surrounding Rinjani forest are encouraged
to take part in the protection of the forest, which contradicts their economic
activities in the forest. Meanwhile, the relatively prosperous communities in urban
areas need water and are thus dependent on good governance of the forest. Lack of
benefit for the villagers from water extraction for urban use conducted by the
District Water Company (Perusahaan Daerah Air Minum, PDAM), triggered a
protest from the villagers in 2004 (SA, forestry agency officer, interview, 5/6/2014).
73
The provincial government could address the conflict of interest by
implementing a conservation program that includes empowerment and concrete
livelihood benefits for villagers - a ‘win-win’ solution for both parties. This,
however, proved beyond the fiscal capacity of regional government. Limited
government budgets for forest conservation motivated several NGOs, including the
international conservation agency, World Wide Fund for Nature (WWF) and
Consortium for study and participation development (Konsorsium untuk Studi dan
Pengembangan Partisipasi, KONSEPSI), together with academics from Lombok,
to propose a scheme to encourage urban water consumers to participate in collective
contributions to fund the conservation of these water catchment areas. This is to be
achieved via a Payment for Ecosystem Services (PES) program (RH, NGO officer,
and PB, academic, interview, 6/6/2014, and 7/6/2014).
The PES program in Lombok was developed following an economic
valuation study of Mount Rinjani conducted by the WWF in 2003. The results of
the study indicated that the economic value of the mountain’s resources such as
water, timber, agriculture, tourism, and erosion control, were around 5.18 billion
rupiah (approximately US$388,597)34 per year (WWF, 2014). Ironically, as
mentioned above, approximately 87% of people around the Rinjani forest are below
the poverty line (WWF, 2014) and their livelihoods are heavily dependent on the
forest.
The Rinjani forest is divided into four classifications based on its function:
conservation, protected, limited production and permanent production (see Chapter
three for details of these classifications). Figure 4.1 presents the spatial distribution
of this forest based on the classifications. Six forest management units, called
Kesatuan Pengelolaan Hutan (KPH), control these forests regionally (see Table 4.1
for details of forest size in each KPH). The forest in KPH Rinjani Barat is the most
significant area since it is responsible for the water supply in the city of Mataram
and West Lombok District, the most densely populated region of the island and the
centre of government as well as business in the province. The forest also supplies
34 All currency conversions in this thesis are based on 2017 exchange rate, US$1 = Rp 13,300.

74
water for irrigation of agricultural land in Central Lombok and East Lombok
districts.
Figure 4.1 Map of Forest Area in Lombok Island
Source: Dinas Kehutanan Provinsi NTB (2013b).

75
Table 4.1 Forest Area in Lombok Classified by Management Unit
Source: Dinas Kehutanan Provinsi NTB (2013a)
Villagers’ activities in the water catchment area would undoubtedly
influence the forest's capability to supply water. A PES program was then promoted
as a response to the threat of water shortages. The PES program goals are 1) to
maintain water resource quality and quantity, 2) to improve the welfare of poor
people around the forests and 3) to conserve the forest resources (Sekretariat Daerah
Lombok Barat, 2007).
A Willingness to Pay (WTP) survey was conducted by KONSEPSI, the
Water corporation (PDAM) and academics in 2003. This survey was designed to
determine the capacity of Lombok’s residents to contribute to a water resources
conservation fund. PDAM customers were involved as respondents of the survey.
Based on a tradition that Lombok’s people are accustomed to donate for funding
public assets such as a worship center, the survey asked whether they are willing to
contribute for environmental restoration and, if so, how much they were willing to
pay (AZ, water corporation officer, interview, 10/6/2014). The result was that 83%
of the household respondents and 55% of corporate respondents were willing to
Name of Forest
Management Unit
Type of Forest
Protected
Forest
(hectare)
Production
Forest
(hectare)
Conservation
Forest
(hectare)
Total
(hectare)
KPH Rinjani Barat
28,911.00
12,072.00
40,983.00
KPH Rinjani Timur
31,987.00
5,602.00
37,589.00
KPH Mareje-
Aikbukak
12,562.00
4,967.00
17,529.00
KPH Pelangan
8,890.00
10,746.00
19,636.00
KPH TNGR
41,330.00
41,330.00
KPH Lombok
6,668.29
6,668.29
Total
82,350.00
33,387.00
47,998.29
163,735.29
Rinjani Area Only
73,460.00
22,641.00
41,330.00
137,431.00

76
contribute between Rp 500 and Rp 5,000 per month to the conservation of water
resources in the upstream area (KONSEPSI, 2003)35.
Following the WTP study’s results, a workshop on PES development was
organized in the same year. The West Lombok Forestry Agency, WWF, the Natural
Resources Conservation Unit (Balai Konservasi Sumber Daya Alam, BKSDA) and
Mount Rinjani National Park Authority (Balai Taman Nasional Gunung Rinjani,
BTNGR) were involved in the workshop. Further discussions with a broader group
for drafting local regulations on PES were then conducted as a follow-up to the
workshop. The details of the PES development stages are illustrated in Figure 4.2.
Between 2004 and 2005, the ecosystem services concept was introduced in
23 villages in the city of Mataram and West Lombok district. At the same time,
institutional strengthening of upstream communities through community
organizing and capacity-building was also conducted. In 2005, a team was formed
to draft regional regulations for establishment of a PES scheme. Furthermore,
widespread dissemination of information on ecosystem service initiatives was
organized, locally and nationally. In 2006, a declaration of agreement for PES was
signed by relevant stakeholders including the local government of West Lombok
and the city of Mataram, the Local Council of West Lombok and the city of
Mataram, PDAM, and other private sector and government agencies, as well as
upstream villagers, Department for International Development (DFID), WWF,
KONSEPSI, and the University of Mataram. Following this, a trial of PES
collection from PDAM customers in East Mataram, a sub-district in the city of
Mataram, was carried out and achieved positive responses from the participants
(IMP, 2014a).
35 However, the survey cannot be statistically validated due to the unavailability of the original
report.
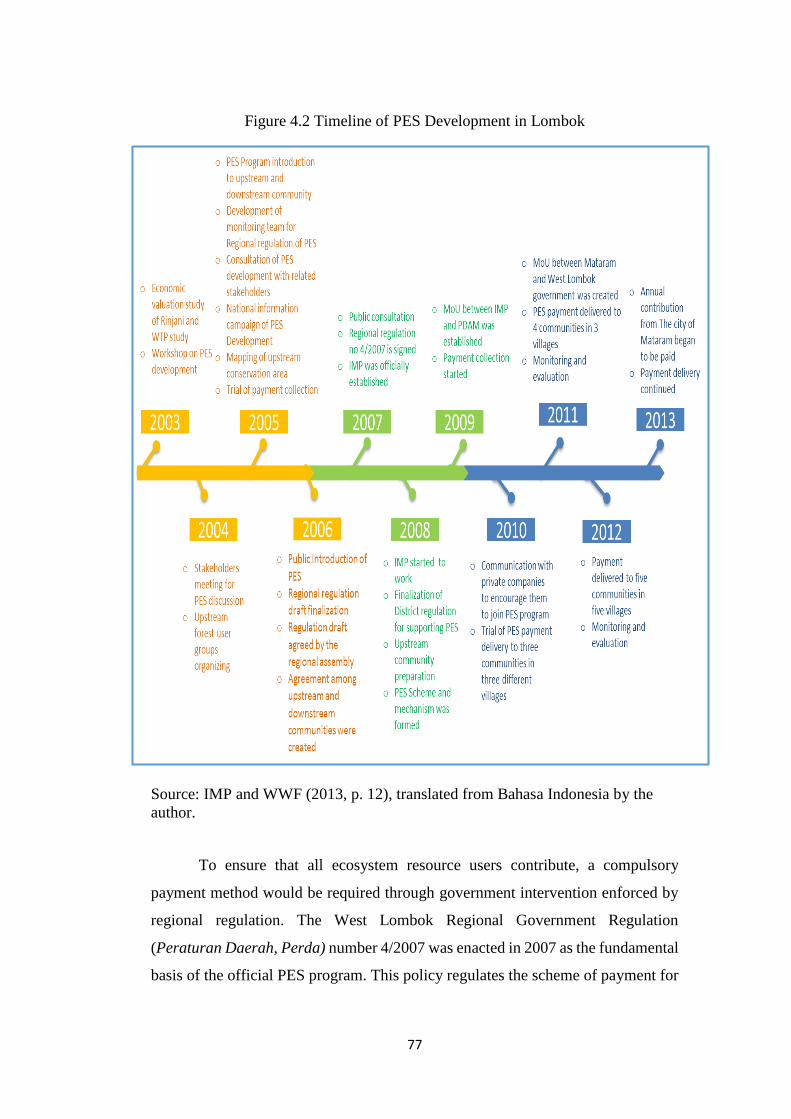
77
Figure 4.2 Timeline of PES Development in Lombok
Source: IMP and WWF (2013, p. 12), translated from Bahasa Indonesia by the
author.
To ensure that all ecosystem resource users contribute, a compulsory
payment method would be required through government intervention enforced by
regional regulation. The West Lombok Regional Government Regulation
(Peraturan Daerah, Perda) number 4/2007 was enacted in 2007 as the fundamental
basis of the official PES program. This policy regulates the scheme of payment for

78
any individual and commercial use of water resources, excluding ground water. The
payment would be used for environmental protection especially for conservation of
the water catchment area.
However, two years after the Perda 4/2007 was enacted, it had still not been
implemented. Although the program received positive responses when the trial was
conducted, resistance arose from those who argued that people should not have to
pay for the provision of ecosystem services. To address this problem, advocacy was
carried out by IMP through the PDAM consumers’ association as the representative
of all water consumers. Water consumers were educated about the importance of
forests for maintaining a sustainable water supply. To avoid more resistance, water
quantity and quality were enhanced by developing a new source for water
extraction. PDAM were allowed by the West Lombok forest agency to access
another spring in a new location in order to increase the water volume. This effort
was conducted in order to demonstrate that a sustainable water supply is the result
of good forest governance (SA, forestry agency officer, interview, 7/6/2014). To
improve awareness of people on the importance of PES development, campaigns
on PES were mounted through various media, as well as through several discussion
forums.
Perda 4/2007 was finally implemented in 2009, four years after the PES
scheme was introduced. PDAM customers started to pay a PES contribution of Rp
1,000 and 2,000 per month (approximately US$ 0.08 and US$ 0.15) for domestic
and industrial water users respectively, in addition to their water bill. Initially, since
PDAM in West Lombok covers two districts, West Lombok and the city of
Mataram, PES was implemented in both districts36. Around 70% of water resources
from West Lombok are utilized by urban residents and industries in the city of
Mataram. However, the PES regulation could not be applied to the city of
Mataram’s jurisdiction, as the legal basis for collecting money from PDAM
36 The water authority in West Lombok and the city of Mataram is controlled by a district
government owned company, PDAM Giri Menang. Since the city of Mataram and West Lombok
used to be a single district (separated in 2009), PDAM Giri Menang is owned by the two districts,
with share proportions of 65% for West Lombok and 35% for the city of Mataram (PDAM Giri
Menang, 2013). As a government company, later on, PDAM Giri Menang was appointed to act as
the collector of PES payments along with the water bill since 2007.

79
consumers was produced by the West Lombok government. As a result, PES
contributions from Mataram residents have been discontinued since 2012. As
compensation, a Memorandum of Understanding (MoU) was negotiated between
the city of Mataram Mayor and the West Lombok Regent by which the city of
Mataram government agreed to contribute a lump sum as its contribution to PES in
West Lombok. The MoU has been in operation since 2013 (MN, member of IMP,
interview, 5/6/2014).
4.2. Intermediary Organization for the PES Program
Since it is challenging to equalize the interests of heterogeneous sellers and
buyers of ecosystem services, a trusted independent organization that takes a role
as mediator and manager of the PES scheme is needed to oversee the program. As
argued by Huber-Stearns et al. (2013), such an intermediary organization is
important for effective PES application. One key success factor of PES programs
in several countries, among other things, is the involvement of such intermediary
institutions (Vatn, 2010; Sattler et al., 2013). Intermediary organization plays a
significant role as agents of information exchange between related stakeholders,
program designers, through representation and mediation among buyers, sellers and
other participants, as well as providing administration and project coordination
(Huber-Stearns et al., 2013). They also may act to control, monitor and verify
ecosystem services delivery (Sattler et al., 2013).
For this purpose, Institusi Multi Pihak (IMP) was formed (WK, member of
IMP, interview, 11/6/2014). The IMP is officially working in coordination with the
West Lombok government that established the institution. The West Lombok
Regent’s decision letter (Keputusan Bupati) number 1072/207/Dishut/2009
appointed the IMP as an independent organization to manage the PES program.
The IMP consists of representatives from relevant government departments,
business, civil society, NGOs, academia and the PDAM consumer association, who
are chosen by the regent based on their experiences and strategic positions.
Unfortunately, multi stakeholder membership of IMP sometimes makes it difficult
to achieve a consensus (AP, forestry agency officer, interview, 4/6/2014). For

80
example, the current director of IMP also holds a position as a head of the
Environmental Governance Agency. This double position, which also applies to
other IMP members, could lead to conflicts of interest. Yet, their expertise is
considered an important contribution to the role.
The size of IMP membership that consists of 19 people on the steering and
supervisory board and 18 people on the management board is relatively large. The
steering and supervisory board includes the regent, 12 heads of related government
agencies, two heads of NGOs, university representatives, the head of PDAM, a
local community leader, and the upstream community representative. The large
number of IMP members leads to high operational costs (IJ, regional assembly
member, interview, 12/6/2014). About 20% percent of the ecosystem services fund,
is used for the operational costs of IMP (IMP, 2010, 2012, 2014b). Table 4.2
presents an example of PES fund allocation managed by IMP in 2013. Operational
costs would probably be reduced if the members of IMP were limited to those who
play a significant role in the PES program.
Table 4.2 PES Fund Allocation
Expenditures
Amount
(Rupiah)
Proportion
(%)
Payment to CFFG for conservation fund
346,267,500.00 73.23
Honoraria
83,760,000.00 17.71
Meeting and discussion
4,500,000.00 0.95
Publication
2,500,000.00 0.53
Monitoring and evaluation
5,040,000.00 1.07
CFFG assistance and identification
8,960,000.00 1.89
PES program campaign
3,000,000.00 0.63
CFFG Verification
3,750,000.00 0.79
Office facilities and stationaries
15,070,000.00 3.19
Total
472,847,500.00 100.00
Source: IMP (2014b)

81
It is a challenge for the IMP to obtain public trust in relation to fund
management (WK, member of IMP, FGD, 4/6/2014). To convince the public that
the collected funds will be used appropriately for water conservation is not an easy
matter. Efforts have been undertaken including a massive campaign through mass
media and direct meetings with communities, to build public trust. To maintain
accountability, an annual audited financial report is published through local media
(see Appendixes 4.1). On the other side, IMP also has to be able to persuade
upstream communities that the PES payment must be used for forest and watershed
conservation. Participatory monitoring and evaluation in upstream areas is
conducted in coordination with the CFFG forum and village governments, to ensure
that PES terms and conditions have been followed.
Capacity building, cooperation and assistance for IMP members are still
required. For instance, IMP lacks the capability to develop tools to measure the
ecological impact of the PES program (WK, member of IMP, FGD, 4/6/2014).
Support from WWF has been obtained especially to monitor the water supply.
WWF provides an automatic water level recorder (AWLR) that was installed near
the PES target location to measure the monthly water debit extracted from the
forest. Since this recorder had only been installed a few months before the fieldwork
for this thesis, it is still being evaluated and results of that evaluation have not yet
been published.
The major problem of this scheme is low participation from the private
sector and this is beyond the control of IMP; government intervention would be
needed to regulate in this area. As stated by the chair of IMP, “we need to expand
public trust to wider communities” (HM, member of IMP, FGD, 4/6/2014). A
workshop was conducted in May 2015 that aimed to encourage broader industry
participation in the PES scheme. However, most of the participants came from
related government agencies and very few participants from industry. The
workshop concluded that a further meeting will need to be conducted with more
participants from industries in order to set up a system of industry contributions to
the PES fund.

82
4.3. Demand Side of the PES Program
Setting up a system to collect the payments was another challenge for the
introduction of the PES scheme in Lombok. Fauzi and Anna (2013) argue that fiscal
regulations for water charges in Indonesia are conflicting. Law no 28/2009 states
that the government is able to charge for surface water and deep water, while Law
no 7/2004 stipulates that water used for basic needs and agricultural purposes is in
principle free of charge (Fauzi and Anna, 2013). There are two official schemes for
collecting money from the public in Indonesia - through tax and levy - the levy
scheme was chosen for PES payments in Lombok and PDAM was appointed to act
as the collector of the payment.
The rate of payment collected from water users was designed to be a flat fee
across all households. Every household pays Rp 1,000 per month (US $.08)
regardless of their water consumption. Thus, there is no distinction between the rich
and the poor; all consumers pay the same amount regardless of their economic
condition. This situation contradicts the criteria of fairness since people who
consume high volumes of water are paying the same as those who consume less,
and neither need nor disincentives to waste were central considerations in designing
the scheme. The purpose of this flat rate is to simplify the scheme and to reduce
resistance from all water users (PB, academics, interview, 7/6/2014). The initial
aim of the program was to build awareness among urban consumers about the
necessity for forest protection. It is possible, however, to increase the rate in the
future once this program is well established (WK, member of IMP, FGD, 4/6/2014).
Under this PES scheme, industries pay double the rate of households
regardless of how much water they use. This situation is inequitable, since big
industries such as hotels that use a lot of water are paying the same amount as small
shops, and are paying relatively little considering their water usage compared to
household consumers. The application of the Lombok PES scheme would be more
efficient if the amount charged was determined in accordance with the volume of
water used (PB, academic, interview, 7/6/2014). Ninety four percent of the total
water supply from PDAM is consumed by households, while industries only
consumed six percent (PDAM Giri Menang, 2016). Instead of using water from

83
PDAM, the vast majority of industries in Lombok extract water directly from
underground water sources. The amount of water extracted from underground by
industries in West Lombok is estimated at around 251,500 cubic meters a year
(Dinas Pertambangan dan Energi Kabupaten Lombok Barat, 2014) which is about
65% of the amount accessed through PDAM that reaches around 384,000 cubic
meters a year (PDAM Giri Menang, 2014). Despite the fact that underground water
provision is also influenced by the existence of forests on the island, industries
refuse to pay the PES levy due to an underground water extraction tax that has been
charged by the local government (district/kabupaten).
Figure 4.3 presents water usage by PDAM consumers in West Lombok. It
demonstrates that water use in the region increased significantly in the last six years.
The increase of water consumption was primarily caused by the expansion of
PDAM services. In 2006, PDAM services only covered around 60% of residents in
the city of Mataram and around 30% of residents in West Lombok (AZ, water
corporation officer, interview, 27/6/2015). In the period of six years since, the
services increased significantly due to increased demand from established residents
who are aware of the benefit of using clean piped water instead of well water. This
also indicates that the economic condition of urban consumers has improved (AZ,
water corporation officer, interview, 27/6/2015). In addition, the increase of new
water installments was caused by the expansion of residential areas due to migration
to the city. The increase in water consumption was later followed by an increase in
PES funding, as demonstrated in Figure 4.4.

84
Figure 4.3 PDAM Water Use in West Lombok, 2009-2013
Source: PDAM Giri Menang (2016).
Figure 4.4 PES Payments from Water Consumers in West Lombok, 2009–2015
Source: PDAM Giri Menang (2014, 2016).
4.4. Supply Side of the PES Program
As described in the previous section, the PES system in Lombok considers
water consumers in the city of Mataram and West Lombok district as the ecosystem
service buyers. Since the PES program was designed to reduce poverty as well as
to conserve the forest catchment, a logical means to achieve this goal is by
integrating PES into the Community Forestry program. Thus, the CFFGs who

85
manage the forest in the water catchment area are identified as the ecosystem
service providers.
The PES fund was distributed to CFFGs for funding conservation programs
in the water catchment area in Rinjani forest. Most CFFG members are poor as
indicated by the average expenditure per family member of $1.7 per day, which is
below the World Bank standard37. Based on interviews with farmers, they have
difficulty buying seeds for planting on community forest land since the price of
seed costs approximately 2.5% of their income (survey data, 2015. See Appendixes
6.2 for detailed survey results). Consequently, the concept of the payment for
ecosystem services program gained positive responses from CFFGs. Figure 4.5
illustrates the distribution area of PES programs in villages around the Sesaot forest
catchment.
The CFFGs were encouraged to apply for PES funds voluntarily by
submitting working proposals to IMP. The submitted proposal was then verified by
IMP who assessed the condition of the groups, including their management, their
activities, and whether the groups were well established or had just been formed to
obtain funding from the PES program. The most important aspect of the verification
was the significance of the project to water catchment conservation. Priorities were
given to those that were going to conserve degraded forestland and significantly
influence the condition of the water catchment (MF, IMP officer, interview,
4/5/2015). For this purpose, the IMP verification team traveled to the CFFG’s
secretariat as well as to the conservation site to assess and clarify the proposal. After
the proposal was determined to be technically and administratively feasible and
eligible to be funded, a Memorandum of Understanding (MoU) was then issued and
signed by the CFFG leader and the IMP director. As a contract between the CFFG
and IMP, the MoU contains agreement by both parties to conduct specified
conservation projects in a certain period of time. Later in this chapter, we will
consider the contract in more detail.
37 The poverty line for developing countries is currently set at $2 per day (World Bank Group,
2012).

86
Figure 4.5 Map of PES Program Location in Lombok
Source: IMP (2014b).

87
The payment delivery scheme for PES can be cash and/or in-kind. In-kind
payments are usually delivered through rural development programs, enabling the
benefits to be distributed, not only for the immediate ecosystem services providers,
but also for the wider benefit of resource dependent communities. Compared to in-
kind payments, however, cash payment is generally regarded as more effective to
increase welfare since cash payment allows the beneficiary to use the money
immediately for their financial needs (Tschakert, 2007). However, it can be seen as
a form of ‘bribery’ by wealthier communities for biodiversity protection (Ferraro
and Kiss, 2002). It is also possible that the payment will be spent on activities which
are not related to ecosystem services provision, and that in turn may result in failure
of the PES program to achieve its ecological goals.
The application of the PES program in Lombok is adapted to suit the
objectives of the Community Forestry program. Since CFFGs plant multipurpose
tree species (MPTS) such as durian, mangosteen and candlenut, the PES payment
is then used for funding MPTS and timber tree planting in the Community Forestry
location.
In the five years since PES in Lombok was implemented, Rp 1,051,810,500
(equal to approximately US$ 78,900) has been delivered to 22 CFFGs (IMP, 2010,
2011, 2012, 2013b, 2014b). Details of PES payments to CFFGs is presented in table
4.1. The money was used to plant trees on 405 hectares38 of degraded forestland in
West Lombok (HM, FGD, 4/6/2014). Although a modest start, at least 2.5% of
16,363 hectares of degraded forest in West Lombok has been restored (IMP,
2013a). The ecological and economic goals of PES would undoubtedly be more
substantial in further years after the trees have grown and produce yields.
38 Ideally, 400 seeds are needed in every one-hectare costing about $348 (Author’s survey data,
2015).

88
Table 4.3 Distribution of PES Funding to CFFGs, 2010 - 2014
Year CFFG Village
Amount
(Rupiah)
2010 Lebah Suren Sedau 83,115,000
Mule Paice Batu Mekar 50,000,000
Forum Ranget Suranadi 58,884,000
Sub Total 191,999,000
2011 Darma Lestari Sesaot 25,000,000
Sanggar Muda Tani Mandiri Batu Mekar 38,500,000
Emas Hijau Langko, Lingsar 35,000,000
Sari Mandiri Dasan Geria, Lingsar 39,000,000
Sub Total 137,500,000
2012 Ale-ale Sesaot 33,750,000
Giri Madia Giri Madia, Lingsar 37,500,000
Buwun Mas Buwun Sejati 15,000,000
Sutra Alam Langko, Lingsar 15,000,000
Lebah Suren Sedau 15,000,000
Sub Total 116,250,000
2013 Blok Slepang Sesaot 45,787,500
KMPH Pakuan 55,950,000
Blok Gontoran Sesaot 45,850,000
Petung Lestari Buwun Sejati 46,190,000
Bensue Lestari satu Buwun Sejati 46,190,000
Lebah Suren Sedau 59,662,500
Masyarakat Peduli Lingkungan Sedau 45,637,500
Sub Total 345,267,500
2014 Harapan Baru Sedau 50,205,000
Belantara Kreatif Sesaot 62,995,000
Pecing Lestari Buwun Sejati 48,020,000
Kepundung Lestari Buwun Sejati 49,452,500
Selen Aik Sedau 50,121,500
Sub Total 260,794,000
Grand Total39 1,051,810,500
Source: IMP (2010, 2011, 2012, 2013b, 2014b).
Payments to CFFGs as the PES providers are made in cash as transfers based
on their accepted proposals. The spending of this money is subject to the West
Lombok government policy that requires the money to be used for activities related
39 PES funding per capita during this period amounted to about Rp 2,200,000 (US$165), which is
considered to be relatively low as cash incentive.

89
to conservation and/or economic empowerment. Although the payment form is
cash, the money cannot be spent on other purposes that are not stated in the
proposal. For example, in 2011, the Kelompok Dharma Lestari CFFG, received Rp
25,000,000 (approximately US$ 1,875), which was used to conserve 50 hectares of
degraded forest land (Darma Lestari, 2011). Sixty seven percent of the fund was
allocated to pay labor for tree planting and maintenance wages that can be a direct
financial benefit of the PES for the farmer40.
The PES payments are set up on a system of terms-based withdrawals. The
first term will be allocated for initial project implementation and the next term will
be paid contingent upon the results of evaluation and monitoring by the IMP.
Monitoring and evaluation of the PES program in the upstream area is conducted
soon after the program has been started and again after it has completed. Monitoring
was done through direct visits to the PES target location to see if the tree planting
took place but no transect studies to guarantee the percentages.
Village heads also play a substantial role in PES implementation. Before a
CFFG’s proposal is submitted to the IMP, it must be approved by the village head.
Similarly, the payment withdrawal request has to be verified and approved by the
relevant village head. After the request has been approved by the IMP, the money
is ready to be withdrawn from the appointed bank. Although it seems a rather
bureaucratic process, this procedure is important as a control scheme to avoid abuse
of the money by CFFGs.
In addition to conservation purposes, as stated in PES regulations, the PES
funds are to be utilized for economic empowerment related activities. So far,
economic development activities that have been funded by PES include non-timber
forest product processing such as coffee, palm sugar and fruit-based foods, as well
as provision of micro credit. However, since 2013 priority is given to conservation
related activities. Meanwhile, economic development activities, especially micro
credit, were temporarily terminated due to a case of nonperforming loans and “elite
40 Not all CFFG provides planting wage. Most CFFG used the money that was supposed to be for
planting wage, to buy more seeds.
90
capture” (MF, IMP member, interview, 22/4/2015). The loans were distributed only
to a small number of people with links with the CFFGs’ leaders, such as their close
family, and were not available to broader CFFGs members (MF, member of IMP,
interview, 22/4/2015). There were no penalties imposed on the offending CFFG
leaders.
Ironically, PES funds, which are supposed to be used for conservation
related activities, are also used as source of revenue for local government. As
stipulated in Perda 4/2007, a quarter of the PES fund is allocated for regional
government revenue and three quarters of the collected funds are allocated to
activities related to the ecosystem services provision, such as forest conservation or
local people’s economic empowerment initiatives, and also for the operational costs
of the IMP. On the other hand, a large number of CFFGs that are potential
participants in the PES scheme are still on a waiting list since only around 10
CFFGs can be involved in any one year. Ideally all of the funds should be allocated
to water conservation related activities since the source of funds is the water
consumers. Thus, the more CFFG groups can be involved, the more water
catchment area can be conserved. As of 2014, only 12% of total CFFG members
have been included in the PES program (IMP, 2010, 2011, 2012, 2013b, 2014b).
4.5. Contracts under the PES System
A direct contract between the ecosystem services providers and buyers in a
PES system is important for its sustainability as well as to control its
implementation. A contract is required due to asymmetric information between
ecosystem services providers and sellers that can cause high implementation costs
and limit the effectiveness of PES (Ferraro, 2008). Asymmetric information can be
found in the form of hidden actions and hidden information. Service providers such
as the land owner or manager commonly have better information than services
buyers. They dominate the information related to the service conditions and the cost
of producing such services. Hidden information may come up when negotiating the
contract (Ferraro, 2008) and can be used in the bargaining process. Meanwhile,

91
hidden action (moral hazard41) may arise after the contract has been negotiated
(Ferraro, 2008, p. 811). A moral hazard could be any kind of act which contradicts
the rules stated in the contract; for example, farmers log the trees that are supposed
to be maintained for water provision. As the monitoring of contract compliance is
costly, ecosystem services buyers are rarely able to verify whether the condition has
been met by services providers as outlined in the contract. This may lead the
ecosystem services providers avoiding their contractual responsibilities (Ferraro,
2008).
Organising a contract between service providers and users in the PES
program in West Lombok is not easy due to the huge numbers of people in both
parties who are taking part in this system. Nevertheless, even without a formal
direct contract between providers and users, PES in West Lombok can work well
due to the intermediary role of the IMP. The IMP negotiates an agreement between
PDAM consumers on the demand side and CFFGs who provide ecosystem services
on the supply side. In this way, the IMP is also able to reduce asymmetric
information among providers and users, which could result in greater efficiency. To
reduce monitoring costs, integration of monitoring systems with mentoring and a
participative action plan, are incorporated into the agreement (WK, member of
IMP, interview, 11/6/2014).
However, there is no clear time frame stated in the contract. In addition,
there is no clear sanction for either CFFGs or water consumers if they fail to meet
obligations as stated in each contract. For instance, on the supply side, if the planted
trees that were funded from the PES were not growing, or if the trees were logged,
no action was required related to the CFFG’s responsibility for the failure. Although
in the long run, they will not have access to the PES funding, lack of clear reward
and punishment in the contract may lead to inefficiency and ineffectiveness in PES
implementation since it is possible for the service providers to break the rules of the
41 Moral Hazard is defined as a situation “where one party to a transactions may undertake certain
actions that (a) affect the other party’s valuation of the transaction but that (b) the second party
cannot monitor/enforce perfectly” (Kreps, 1990, p. 447).
92
game without any obligation to repay the PES fund. It seems that the contract needs
to be revised to make it fair for both parties.
On the demand side, water consumers as the ecosystem service buyers are
unable to avoid their obligation to pay the PES levy since it is embedded within
their water bills. They also cannot formally claim for any reduction of the quality
or quantity of the water. If they do not pay the water bill, which include the PES
levy, then their water service will be terminated by PDAM.
Another PES contract was signed by the West Lombok Regent and the
Mayor of the city of Mataram, whereby the West Lombok government acts as
provider of the ecosystem services and the city of Mataram government acts as the
consumer. As mentioned before, the city of Mataram residents consume water that
is supplied from West Lombok’s forests. West Lombok’s policies that govern the
PES program are unable to be applied across jurisdictions, such as the city of
Mataram. The contract between two governments requires that the city of Mataram
government allocates an annual contribution fund towards the PES program in West
Lombok (RH, NGO officer, interview, 6/6/2014). Since 69% of water from PDAM
is utilized in the city of Mataram (PDAM Giri Menang, 2016), such a payment
arrangement is essential to a fair distribution of water resources. However, there is
no clear amount of the contribution fund stated in the contract. The amount of the
contribution is decided annually based on the budget capability of the city of
Mataram and calculated based on the number of water consumers in the city (MF,
member of IMP, interview, 22/4/2015). In addition, there is no clear statement that
the city of Mataram residents will be charged by the government regarding the PES
levy. Instead, the government will allocate a conservation fund for this purpose in
their annual budget.
Since the amount and basis of the contribution is not clearly stated on the
contract42, it can lead to moral hazard by the city of Mataram government. It is
42 The contract states that West Lombok and the City of Mataram Governments agree to facilitate
and provide funding for environmental conservation, economic empowerment and strengthen of
communities around the watershed. However, There is no specific amount stated on the contract
(Bupati Lombok Barat and Walikota Mataram, 2011).

93
possible that they may argue to reduce or avoid payment for their contribution due
to budget capability. In fact, water from West Lombok is consumed continuously
by the city of Mataram’s residents regardless of the amount of contribution for the
conservation fund from their government. As mentioned above, 70% water supply
from West Lombok is consumed by the city of Mataram residents. In this case, a
free rider problem occurs as water consumers in the city of Mataram do not pay the
PES levy. The City of Mataram government could issue a similar PES regulation
to collect money from water consumers for the PES contribution to solve this
problem.
4.6. New Paradigm on PES Literature
Compared to other PES practices in Indonesia, to date the PES program in
West Lombok is the only one which is implemented through a mandatory system
(Heyde et al., 2012). The vast majority of PES schemes that have been introduced
in other parts of Indonesia, such as PES in Lake Toba and Sumberjaya in Sumatera,
PES in Cidanau, Citarum and Brantas in Java, and PES in Kapuas Hulu in
Kalimantan, employ voluntary-based PES systems. Most of the buyers come from
the private sector and the sellers are farmers located in the areas where the
ecosystem services are sourced. Both parties enter a contract to enable voluntary
transactions of certain ecosystem services (mostly related to water quantity and
quality). A similar situation can be found in the practice of PES around the world.
Most of the PES programs are based on voluntary systems where the contract is
either directly set up between sellers and providers or where an intermediary
organization is used (Pagiola, 2008; Clements et al., 2010; Matthew et al., 2010).
Pirard’s (2012) analysis of PES implementation through a public policy
approach considers the West Lombok PES program as a case study. He argues that
the West Lombok PES policy design is atypical compared to common PES
practices elsewhere with respect to the method of payment and the extent of
compulsory public participation (Pirard, 2012, p. 28). Commonly, most PES
practices employed Coasean economics theory that emphasizes a voluntary or
market-based transaction of ecosystem services. This ensures the payment meets
the minimum opportunity costs of the ecosystem services provider and may be less

94
than, or equal to, the Willingness to Pay (WTP) of the buyers (Wunder, 2005; Engel
et al., 2008).
The PES program in West Lombok has been officially mandated in Perda
4/2007 which is in line with Pigouvian economic theory. According to this
regulation, anyone who utilizes the specified ecosystem services is obliged to pay
the PES levy. This compulsory approach cannot meet the voluntary transaction
criteria of PES that is proposed by Wunder (2005)43 that has been a mainstream
assumption in much of the PES literature. A new expanded concept of PES is
required to encompass mandatory PES approaches that employ public policy in
their implementation (Pirard, 2012).
In the case of PES in West Lombok, there is a component of hybridity that
combines Coasean and Pigouvian economic theory. Pigouvian theory is applied on
the demand side to enforce compulsory participation from water consumers to pay
for the PES levy. On the supply side, Coasean theory is used to encourage voluntary
participation from forest farmers to enrol in the PES program. This hybrid PES
system leads to a new policy paradigm that combines elements of both a voluntary
market-based and mandatory policy-based system.
4.7. Conclusion
The Rinjani forest is significant for water catchment on Lombok Island.
Community forest farmer groups (CFFGs) who manage the Rinjani forest through
a Community Forestry management scheme help protect the water provision that is
supplied from the forest for household, industrial and agricultural needs on the
island. As a response to the critical importance of the water catchment area, and
considering the condition of inadequate government funding for forest protection,
43 Wunder (2005, p. 9) uses five criteria to describe the PES principles “A PES is: (1) a voluntary
transaction where (2) a well-defined ecosystem service (or a land-use likely to secure that service)
(3) is being ‘bought’ by a (minimum one) ecosystem services buyer (4) from a (minimum one)
ecosystem services provider (5) if and only if the ecosystem services provider secures the ecosystem
services provision (conditionality).”

95
Payment for Ecosystem Services (PES) has been developed and integrated into the
Community Forestry management in West Lombok.
PES in Lombok aims to encourage broader public participation in forest
management through contributions to a conservation fund. Due to the scale and
complexity of the watershed conservation issue, a mandatory system, enforced by
government regulation, rather than the voluntary model was developed on the
demand side. The policy requires that all private and commercial water consumers
through the PDAM are obliged to pay a monthly PES levy. The money is then
allocated to related CFFGs as funding for conservation of the degraded water
catchment area. In this regard, the PES system established conditions for
collaboration between urban water consumers and rural forest users in conservation
of the water catchment area.
The Coasean approach, as a mainstream ecosystem economic perspective
on PES theory (Wunder, 2005), suggests that PES systems should be voluntary-
based and that ecosystem services provision should be transacted in a market. But
PES in Lombok diverges from this mainstream PES literature. The PES program in
West Lombok is a hybrid PES system that employs both Coasean and Pigouvian
economic theory. On the demand side, Pigouvian economic theory that considers
government intervention through a PES regulation is applied. Meanwhile, Coasean
economic theory is applied on the supply side to encourage forest farmer groups to
become voluntarily involved in the PES program. The atypical system of PES in
Lombok (Pirard, 2012) leads to a new paradigm in the PES literature, where PES is
not only voluntary–market based, but also mandatory, public-policy based - a
hybrid of voluntary and mandatory schemes. The PES definition that is often used
in the PES literature, which only considers voluntary market-based transaction
criteria, needs to be reviewed.
Ferraro (2008) suggests that a PES system needs a contractual agreement
between the suppliers and consumers of ecosystem services in order to make it
work. However, without a direct contract between the seller and the buyer of
ecosystem services, PES in West Lombok has been relatively effective due to the
existence of the Institusi Multi Pihak (IMP), a government partner organization that

96
governs the PES program. The IMP acts as a bridge to connect upstream and
downstream communities in a single system of water catchment protection. The
hybrid type of PES program in Lombok is a mutually beneficial compensating
mechanism for upstream and downstream communities. PES is used as a tool for
responsible sharing between urban water consumers and rural forest users to protect
the water catchment area for mutual benefit, with the IMP as a mediator. But, the
effectiveness of this approach compared to other schemes remains in need of further
research.
The flat PES levy that is collected from PDAM consumers leads to a
problem of inequity since small consumers are paying the same amount as larger
ones regardless the amount of water they consume. This flat fee problem can be
solved through designing a fair mechanism, such as a proportional PES levy that
depends upon the amount of water consumed by the PES buyers. Since industries
pay a very small amount of PES levy and not all industries contribute in the PES
program, the local government could modify the PES regulation to encourage
industries to participate in the PES program or restrict/prohibit water extraction and
divert a proportion of the PES to local government in lieu of current taxes.
However, a free rider problem exists in this PES system as the residents of
the city of Mataram, who also consume water from West Lombok, do not contribute
to pay for the PES fund. The government of the city of Mataram should introduce
a similar regulation as applied in West Lombok to encourage compulsory
participation of the residents to pay for the PES levy. The more contributors, the
more the PES levy could deliver broader benefits for forest conservation and
poverty alleviation. The impact of this hybrid PES and Community Forestry
program on forest conservation and poverty alleviation will be discussed in the next
chapters.

97
Chapter 5
Community Forestry, Payment for Ecosystem Services and Forest
Conservation
This chapter will analyse the impacts of integrated Community Forestry and
Payment for Ecosystem Services (PES) programs on forest conservation. Forest
conservation in this thesis refers to any efforts aimed at forest protection or
restoration, including replanting forests that were destroyed before the Community
Forestry program was established in the area. Forest cover data will be used to
measure forest conservation. This chapter will also report my survey results, in
particular the forest farmers’ experiences on Community Forestry management in
regard to conservation activities and outcomes.
The structure of this chapter will be as follows: Section 5.1 reviews the
Community Forestry development and its impact on forest conservation in
Lombok; Section 5.2 elaborates on the survey data regarding forest farmers’
experiences and views on the impact of the Community Forestry program on forest
conservation. The contributions of PES programs to Community Forestry
development and thus the impact on forest conservation is the focus of section 5.3.
Finally, section 5.4 concludes this chapter.
5.1. Community Forestry Development and Forest Conservation
The ecological benefits of forests are multiple, in particular with respect to
ecosystem services such as watershed protection, oxygen production and carbon
sequestration. The forest’s ability to produce such ecosystem services is dependent
on how good forest management is. Other things being equal, the better the forest
management, the better the ecological benefits it produces. There are several
different schemes for forest management. These include state forestry management,
industrial or private forestry management, and community forestry management.
Community Forestry is a system of community based natural resources governance
(Krogman and Beckley, 2002), and is increasingly preferred by policy makers and

98
scholars, rather than full central state control or privatization through market
mechanisms (Agrawal, 2001a; Agrawal and Ostrom, 2001; Ostrom, 2005; Sikor,
2006; Warren and McCarthy, 2009).
The devolution of forest management to local people through Community
Forestry had resulted in both positive and negative ecological outcomes. With their
knowledge and experience of the forest and soil conditions, local people are often
able to manage the forest more appropriately (Conklin, 1954; Edmonds, 2002;
Gibson et al., 2005; Agrawal and Chhatre, 2006). Studies on Community Forestry’s
impact in many countries indicate that community involvement in forest
governance can generate positive outcomes in terms of reducing deforestation and
increasing biodiversity protection (Klooster and Masera, 2000; Araujo et al., 2009;
Barsimantov and Kendall, 2012; Pirard and Belna, 2012; Birch et al., 2014). Most
studies on Community Forestry emphasize the importance of recognition of
property rights that influence people’s behaviour towards forest governance
practices (Agrawal and Ostrom, 2001), which then impact on forest cover,
deforestation rates and biodiversity conservation (Araujo et al., 2009; Birch et al.,
2014). Lessons learnt from a number of studies indicate that Community Forestry
was able to contribute to reducing deforestation. Klooster and Masera (2000)
argued that a Community Forestry program implemented in Mexico was able to
avoid deforestation and increase forest cover. Araujo et al. (2009) conclude that a
Community Forestry program that provided security of property rights has been
beneficial in reducing deforestation in the Brazilian Amazon. Also, Birch et al.
(2014) found that secure use-rights upon community forest in Nepal lead to
biodiversity conservation and ecosystem services protection.
However, Community Forestry programs may also produce negative
impacts on forest cover in the short term. For instance, people may overuse the
forest resource if they treat access to the forest as a private property right.
Community forest management rights can be an incentive for local people to clear
the community forest, although the forest cover condition may improve in the long-
term (Pirard and Belna, 2012). Community forest management rights may also have
negative impacts on other forests outside the community forest area. This has been
99
seen in the case of Community Forestry practices in Ethiopia (Beyene and Koch,
2013). The villagers in this case had used wood for cooking collected from a local
forest, which was then converted to community forest. The use of fuel wood that
was collected from the surrounding natural forest increased when the Community
Forestry system was introduced. Forest farmers tended to maintain their community
forest and collect fuel wood in open access forest outside of the community forest
location (Beyene and Koch, 2013).
With regard to explaining Community Forestry practice, approaches to
common pool resource governance by Hardin (1968) and Ostrom (1999) have been
discussed in Chapter 2 of this thesis. This thesis attempts to elaborate on the theory
of common pool resource governance by considering a case study of Community
Forestry practice that is integrated with a Payment for Ecosystem Service (PES)
program.
Referring to Chapter 3 and 4 of this thesis, Community Forestry and
Payment for Ecosystem Services are two different policy approaches aimed at
effective and sustainable forest governance. Community Forestry is mainly
introduced to encourage local people who benefit from the existence of the forest,
to participate in sustainable forest management (Krogman and Beckley, 2002). PES
mainly aims to provide financial incentives for people to change their behaviour in
relation to resource governance, including forests (Wunder, 2005). Both approaches
are instruments to conserve natural resources as well as to alleviate poverty in rural
areas (Pagiola et al., 2005; Sunderlin, William D., 2006; Tschakert, 2007; Stringer,
R. et al., 2008; Dhakal et al., 2012; Stringer, L. C. et al., 2012; Bremer et al., 2014).
Therefore, it is hypothesized that a combination of these two approaches could
generate better outcomes in terms of sustainable forest management.
Following Ostrom (1990), this study emphasizes the role of local
institutions in common pool resource management. Local communities who depend
on a certain common resource for their livelihood and have some autonomy to
access and manage the common resource tend to achieve better outcomes from
common resource governance (Ostrom et al., 1999). The community often share
their experiences, values and norms, which are used to develop rules to govern the

100
common resource. Effective monitoring and appropriate sanctions would then be
required to achieve sustainable use of the common resource (Gibson et al., 2005).
As described in Chapter 3, Community Forestry was initially introduced in
Sesaot forest in Lombok, Indonesia in 1998. The local community were involved
in a reforestation project after the forest had been harvested by timber companies
and the rights to manage the forest were devolved to them through a Community
Forestry program. Before Community Forestry began, the forest area was mainly
covered by bush without many trees due to massive logging (BK and RE,
community’s leaders, interviews, 8/6/2014 and 27/2/2015). In that period, local
trees endemic to Lombok were very rare in that location. People replanted the land
with crops that provided economic benefit in a relatively short period, such as
coffee, cocoa, corn, and bananas, together with Albizia trees, supplied by the local
forestry agency. However, the Albizia trees were not sufficient to meet the
necessary tree coverage required to replenish the degraded land. The villagers were
then instructed by the local government through the forest agency to plant Multi-
Purpose Tree Species (MPTS), which are mainly fruit trees such as durian,
rambutan, mangosteen and candlenut as the complement to the Albizia (RE,
villagers, interview, 27/02/2015). MPTS are a variety of trees that can provide
economic benefits from their crops, as well as supporting conservation goals
through their ecological function.
Since Community Forestry management had been established in forest areas
that had already been destroyed, the practice of Community Forestry did contribute
to the replanting of the forest. The consequent plantation composition follows
multiple layers. At the first layer, tall trees such as Albizia, candlenut and durian
were planted. At the second layer, medium size trees were planted under the first
layer, for example rambutan and mangosteen. Cocoa and coffee were planted as the
third layer. Under the cocoa and coffee trees, vegetables were planted. This multiple
layer plantation technique (tumpang sari)44 was initiated by a villager who was the
leader of a forest farmer group. This technique was then followed by the other
44 Tumpang sari is a customary practice and is an example of the application of traditional
knowledge to efficient land use.

101
members and became a common technique in Community Forestry management in
Sesaot (RE, forest farmer leader, interview, 27/02/2015). However, the size of the
allocated forest for community management was not in balance with the needs of
local people on the land. Only 236 hectares were officially allocated by the forest
agency for some 3000 families who need land. This condition led to the illegal
expansion of Community Forestry into the protected core forest zone, by the
villagers without approval from the district forest agency.
In the short term, the enlargement of the Community Forestry area was
responsible for forest destruction since people occupied forest in the core zone area
that was still in good condition. As described in Chapter 3, encroachment on the
forest by local people occurred due to an imbalance between the size of the
permitted area and the number of people who needed land. People logged the forest
trees and then replanted with crops and MPTS. The land clearing caused a decrease
in forest cover at the time. However, forest cover began to increase after about five
years of Community Forestry (RE, forest farmer leader, interview, 27/02/2015).
Data from Global Forest Watch clarifies that in 2003, five years after the massive
encroachment, Sesaot forest cover increased by 616 hectares over a space that
included the Community Forestry area (GFW, 2016). However, forest lost was
recorded as 6.58 hectares in the same period for the same location (GFW, 2016, see
Appendix 5.1).
Forest restoration requires a relatively long period of time with high costs,
which were not comparable to the more immediate economic benefits that a forest
farmer obtained from crops and MPTS. Thus, from a purely ecological perspective,
Community Forestry “failed” to maintain forest health in the short term. Economic
benefits from crops that were harvested from the community forest alone would not
be in balance with the costs of conservation (AZ, water corporation officer,
interview, 10/6/2014). However, in the long term, Community Forestry could
provide balanced benefits for the local economy and ecology when mature MPTS
produce substantial sustainable yields.
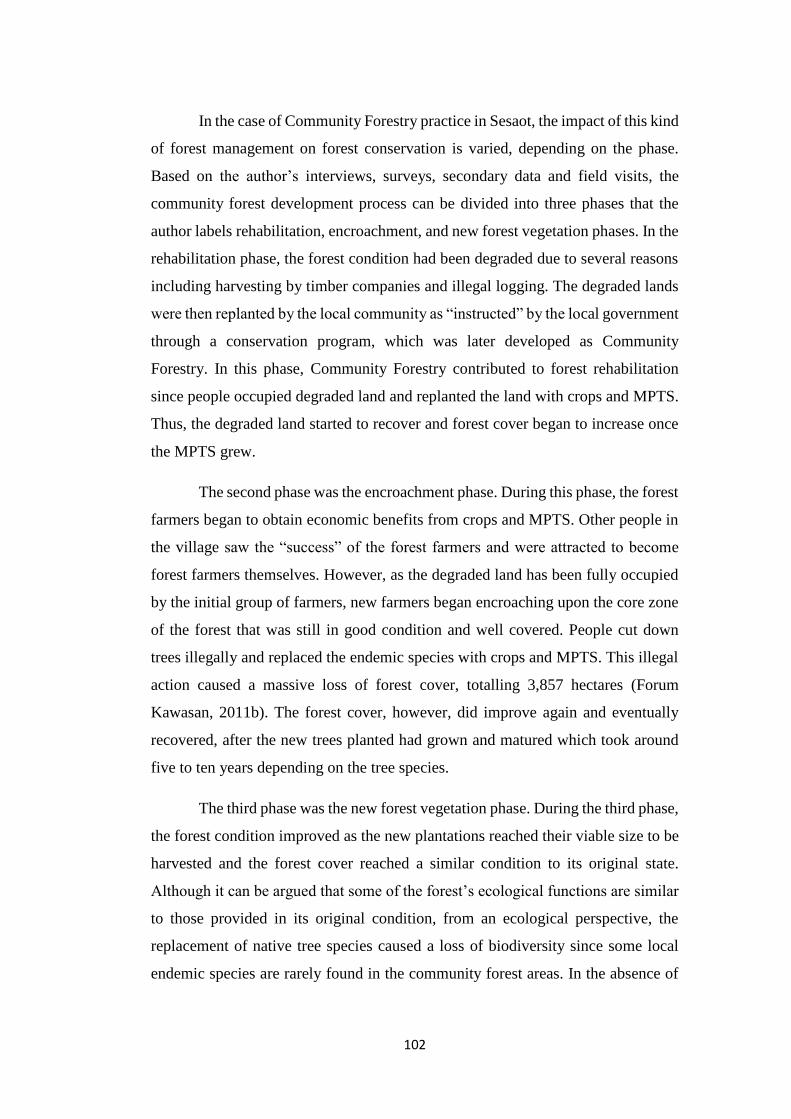
102
In the case of Community Forestry practice in Sesaot, the impact of this kind
of forest management on forest conservation is varied, depending on the phase.
Based on the author’s interviews, surveys, secondary data and field visits, the
community forest development process can be divided into three phases that the
author labels rehabilitation, encroachment, and new forest vegetation phases. In the
rehabilitation phase, the forest condition had been degraded due to several reasons
including harvesting by timber companies and illegal logging. The degraded lands
were then replanted by the local community as “instructed” by the local government
through a conservation program, which was later developed as Community
Forestry. In this phase, Community Forestry contributed to forest rehabilitation
since people occupied degraded land and replanted the land with crops and MPTS.
Thus, the degraded land started to recover and forest cover began to increase once
the MPTS grew.
The second phase was the encroachment phase. During this phase, the forest
farmers began to obtain economic benefits from crops and MPTS. Other people in
the village saw the “success” of the forest farmers and were attracted to become
forest farmers themselves. However, as the degraded land has been fully occupied
by the initial group of farmers, new farmers began encroaching upon the core zone
of the forest that was still in good condition and well covered. People cut down
trees illegally and replaced the endemic species with crops and MPTS. This illegal
action caused a massive loss of forest cover, totalling 3,857 hectares (Forum
Kawasan, 2011b). The forest cover, however, did improve again and eventually
recovered, after the new trees planted had grown and matured which took around
five to ten years depending on the tree species.
The third phase was the new forest vegetation phase. During the third phase,
the forest condition improved as the new plantations reached their viable size to be
harvested and the forest cover reached a similar condition to its original state.
Although it can be argued that some of the forest’s ecological functions are similar
to those provided in its original condition, from an ecological perspective, the
replacement of native tree species caused a loss of biodiversity since some local
endemic species are rarely found in the community forest areas. In the absence of

103
strong law enforcement, this cycle could continue to occur as the population
increases until the entire forest has been converted to Community Forestry and no
core forest zone remains. Thus, strong control from government may be needed to
prevent massive forest conversion.
Whether Community Forestry can make a balanced contribution to both
ecological conservation and economic development in Sesaot forest or not, is an
open question since an economic orientation still dominates the Community
Forestry practice on this site. Forest farmers tend to be focussed on economic
benefits more than the ecological ones. Not all forest farmers fully complied with
the Community Forestry regulations. For instance, the Community Forestry rules
require that plantation composition must be 60% conservation trees and 40% MPTS
(Menteri Kehutanan RI, 2008). In the process of Community Forestry development
in Sesaot, the community forest farmer group (CFFG) negotiated with the local
forestry agency to set the plantation composition at 70% MPTS and 30%
conservation trees (Konsepsi, 2009). After the agreement was evaluated and gained
90% success in increasing forest cover (Konsepsi, 2009), the plantation
composition has continued as a guideline for all community forest farmers and is
now incorporated into adat law. However, the actual condition of plantation
composition on the study site averages 21% conservation trees and 79% MPTS
(Author’s survey, 2015), indicating that even the negotiated modification of
Community Forestry rules is not complied with by all forest farmers.
There were no official sanctions applied to the farmers who did not meet the
composition requirement. Whereas, it is clearly stated in the local adat law codes
that farmers who cannot meet 70% MPTS and 30% conservation trees rule will be
considered as having failed to manage the community forest properly (Forum
Kawasan, 2006). Thus the community forest land will be taken over by the CFFG
to be managed by another villager who has not been a community forest farmer. In
this situation, neither state nor adat law enforcement can be considered fully
effective.
A forest officer suggested that the plantation composition that does not meet
the regulation or the negotiated agreement is not a significant problem since MPTS
can also produce some of the same ecological benefits as officially designated

104
conservation trees and can be more sustainable compared to non MPTS (SA, forest
agency officer, interview, 5/6/2014), because of their greater economic benefit to
local communities. MPTS provides economic benefits which is an incentive for the
farmer to maintain this kind of tree. Since MPTS can be categorized as shade trees,
they are also ecologically beneficial in term of water supply, erosion control,
climate change mitigation, increased carbon storage and reduced greenhouse gas
emissions (Tscharntke et al., 2011). An interview with a forest farmer explicitly
indicated that forest farmers prefer MPTS rather than other trees because of the
expectation of income generation from the fruits. Also, it is likely that MPTS is
more secure from timber theft (AN, forest farmer, interview, 21/3/2015). However,
MPTS do not have the same biodiversity functions that were provided by original
forest trees. Thus how effective the Community Forestry program is for forest
conservation remains an open question.
5.2. Forest Farmers’ Experiences and Views on the Impact of the Community
Forestry Program on Forest Conservation
Forest cover is dependent on the behaviour of forest farmers in relation to
logging trees. As mentioned in Chapter 1, surveys were conducted with 200
community forest farmers to capture the farmers’ behaviour in forest management
including their experience in logging trees. This study found that of the 200 forest
farmers who were surveyed, 64% of respondents replied that they had never logged
trees before the Community Forestry program was established, while 36% had
logged trees mainly for domestic uses such as for firewood and material to build a
house (see figure 5.1). Those who never logged trees explained that this was due to
the degraded land condition largely covered by bush, without many trees. Those
who sometimes or often logged trees admitted that they logged some trees due to a
need for space on the land to plant MPTS and crops. Some endemic trees were
replaced with MPTS that were able to provide more economic benefits for them.
Farmers who logged trees were those who encroached on forest land that had not
been formally allocated by government to be managed as community forest. They
did this because they believed they had the same rights to community forest land as
had been officially granted by government to the other forest farmers.

105
This study has tried to capture the logging practice of the Sesaot forest
farmers post establishment of the Community Forestry in the case study location.
Ninety-five percent of survey respondents explained that they no longer engage in
logging activities since most of the trees in the community forest are categorized as
MPTS that could provide economic benefits (see figure 5.2). A statistical analysis
(Paired t test) was conducted to clarify this finding. The statistics analysis result
indicated that the probability of differences between logging practice conducted by
the farmers before and after the establishment of the Community Forestry program
is significant with the P value of 0.00 (see Appendix 5.2).
Some farmers also indicated that they were afraid of the adat rules that have
been agreed to by their CFFG. If they log trees, they face the risk of losing their
rights to manage the community forest land which could threaten their livelihoods.
On the other hand, at least some forest farmers disobey the adat rules in regards to
the plantation composition discussed above, without sanction to date. The current
effectiveness of adat law is thus, again, questionable.
Figure 5.1 Farmers’ Acknowledging Involvement in Timber Theft Prior to
Establishment of the Community Forestry Program
Source: Author's survey, 2015; n = 200
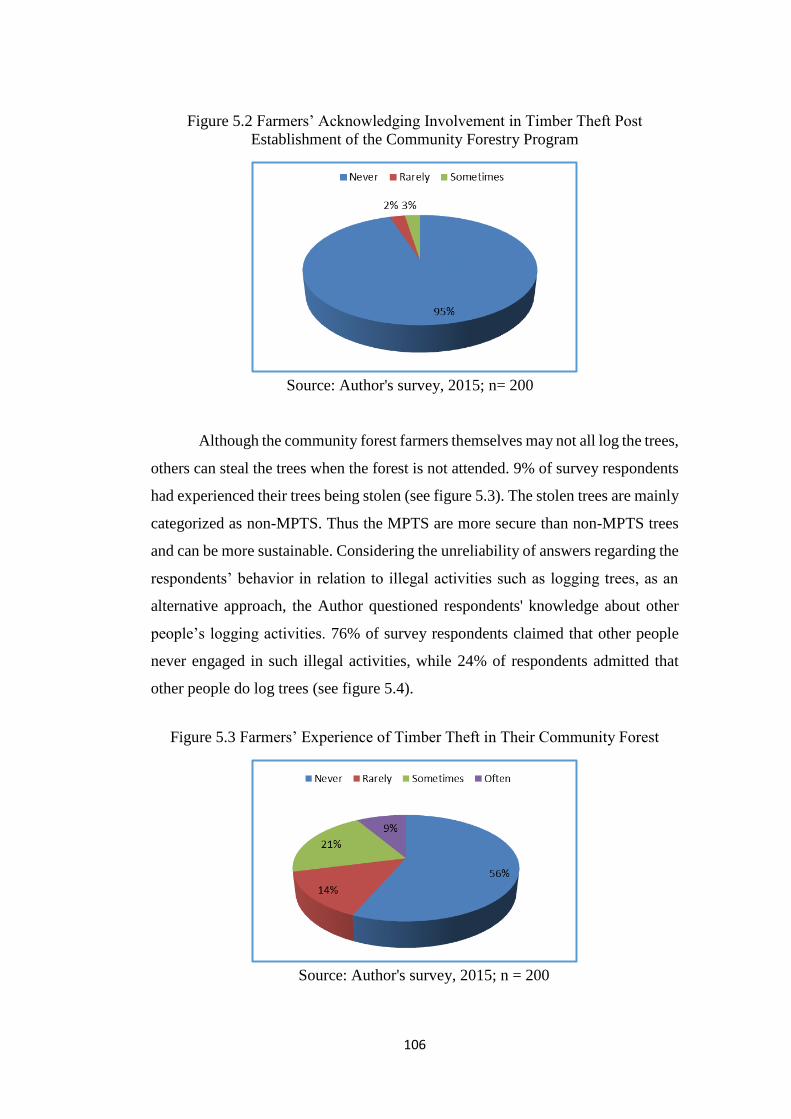
106
Figure 5.2 Farmers’ Acknowledging Involvement in Timber Theft Post
Establishment of the Community Forestry Program
Source: Author's survey, 2015; n= 200
Although the community forest farmers themselves may not all log the trees,
others can steal the trees when the forest is not attended. 9% of survey respondents
had experienced their trees being stolen (see figure 5.3). The stolen trees are mainly
categorized as non-MPTS. Thus the MPTS are more secure than non-MPTS trees
and can be more sustainable. Considering the unreliability of answers regarding the
respondents’ behavior in relation to illegal activities such as logging trees, as an
alternative approach, the Author questioned respondents' knowledge about other
people’s logging activities. 76% of survey respondents claimed that other people
never engaged in such illegal activities, while 24% of respondents admitted that
other people do log trees (see figure 5.4).
Figure 5.3 Farmers’ Experience of Timber Theft in Their Community Forest
Source: Author's survey, 2015; n = 200

107
Figure 5.4 Farmers’ Knowledge of Timber Theft by Others Including Inside and
Outside the Community Forest
Source: Author's survey, 2015; n = 200
The Community Forestry program also provides participative forest
guardianship as a responsibility tied to the property rights held by the farmers. Since
the farmers realize that they have property rights upon the Community Forestry
land, they have an incentive to maintain their tree plantings and prevent them from
destruction. In general, Community Forestry programs have contributed to
increasing the number of trees in the forest. 71% of survey respondents said that the
number of trees on their Community Forestry land increased after they took over
land management. However, 7% of survey respondents said that the number of trees
decreased as they replaced endemic trees with crops such as coffee, cocoa, and
banana due to the immediate economic benefits (see figure 5.5). This explains the
statements of some farmers that they often log trees on their community forest land.
When a question was asked regarding the impact of the Community Forestry
program on reducing the deforestation rate, most of the respondents (85%) agreed
that Community Forestry is able to reduce deforestation and none of them disagreed
(see figure 5.6).

108
Figure 5.5 Farmers’ Assessment of Changes in the Number of Trees in the
Community Forest
Source Author's survey, 2015; n = 200
Figure 5.6 Farmers’ Opinion on the Impact of Community Forestry on Reducing
Deforestation
Source: Author's survey, 2015; n = 200
When the fieldwork for this study was conducted in early 2015, the community
forest condition was relatively good with an average forest cover of 65% (Author’s
survey, 2015). There is no official data from relevant government offices such as
the forestry agency to verify this survey result. As an alternative, satellite data from
Google and Global Forest Watch45 were used. Satellite imagery data provided by
Google verifies that almost all of the Sesaot community forest area was well
45 Global Forest Watch is an interactive forest monitoring system that allows users to draw and
calculate a certain forest cover loss/gain in a particular area. The data is produced from combination
of a cutting edge algorithm technology that employs the most current and high-level IT development
with satellite technology, cloud computing and scientific modelling to monitor tree cover growth
and loss (http://www.globalforestwatch.org).
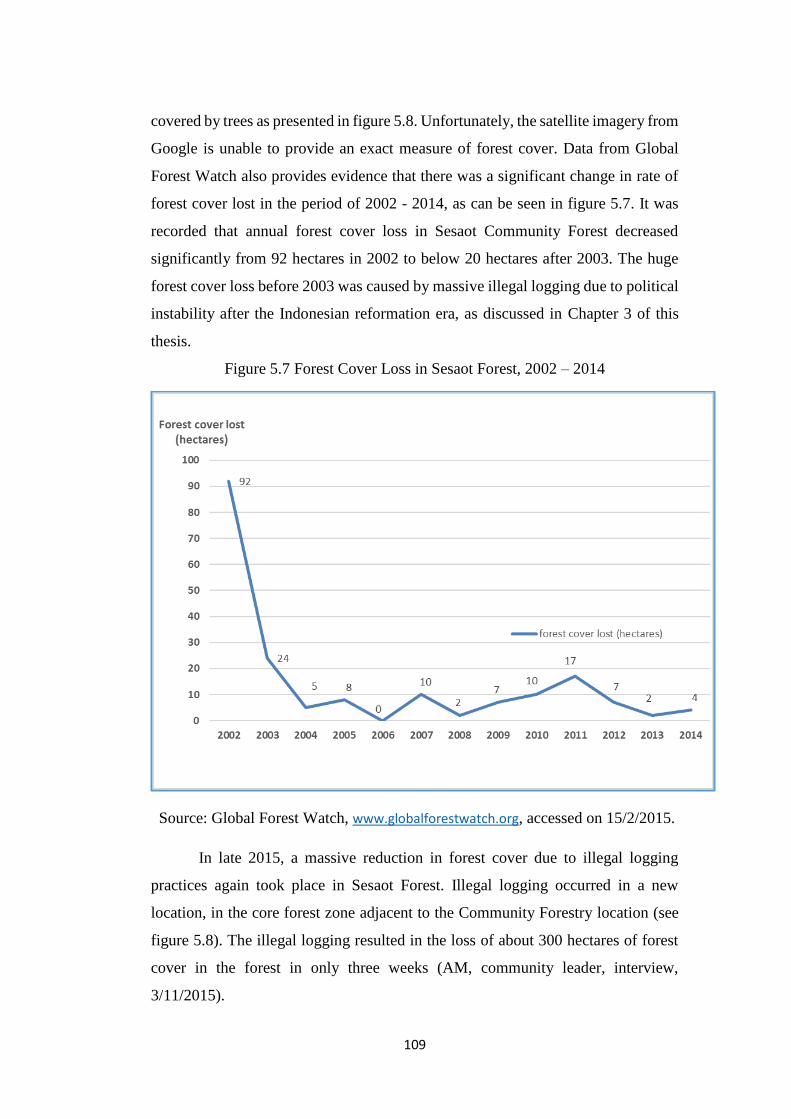
109
covered by trees as presented in figure 5.8. Unfortunately, the satellite imagery from
Google is unable to provide an exact measure of forest cover. Data from Global
Forest Watch also provides evidence that there was a significant change in rate of
forest cover lost in the period of 2002 - 2014, as can be seen in figure 5.7. It was
recorded that annual forest cover loss in Sesaot Community Forest decreased
significantly from 92 hectares in 2002 to below 20 hectares after 2003. The huge
forest cover loss before 2003 was caused by massive illegal logging due to political
instability after the Indonesian reformation era, as discussed in Chapter 3 of this
thesis.
Figure 5.7 Forest Cover Loss in Sesaot Forest, 2002 – 2014
Source: Global Forest Watch, www.globalforestwatch.org, accessed on 15/2/2015.
In late 2015, a massive reduction in forest cover due to illegal logging
practices again took place in Sesaot Forest. Illegal logging occurred in a new
location, in the core forest zone adjacent to the Community Forestry location (see
figure 5.8). The illegal logging resulted in the loss of about 300 hectares of forest
cover in the forest in only three weeks (AM, community leader, interview,
3/11/2015).

110
A community leader in the village argued that the offender, who is not a
member of any of the CFFGs, came from a nearby village (AM, community leader,
interview, 3/11/2015). The CFFG members could not do anything in regards to this
encroachment. They tend to protect only the Community Forestry land that they are
occupying and ignore any destruction outside of their land. The community leaders
asserted that this destruction occurred because of a lack of law enforcement of
illegal logging practices by government. A year before, the person who led the
illegal logging had been reported for the same case by the community to the local
forest agency. However, no rule enforcement was applied. This lax enforcement
then attracted other people to conduct illegal logging in other forest sites (AM,
community leader, interview, 3/11/2015). Adat law has proved difficult to enforce
on illegal logging activities due to social conflict that often emerges, followed by
threats and intimidation (DA, community leader, interview, 8/6/2014). A forest
agency officer explained that they could not control the forest properly due to an
insufficient number of forest rangers to guard the forest (MM, forest agency officer,
interview, 3/11/2015).
Corruption and collusion are undoubtedly another factor that cause these
illegal activities, which are common in the timber industry in Indonesia, and were
exacerbated after the collapse of the New Order regime (Smith et al., 2003). Dietz
et al. (2002) argued that corrupt forest officials have opportunities to receive bribes
from local forest users wishing to exploit the forest officially owned by the state.
As investigated by Gultom et al. (2013), illegal logging in Sesaot Forest has
involved collusion among villagers, local businessmen, members of the police,
army and state officers. The “timber mafia” has a strong network and is difficult to
break up (Gultom et al., 2013). Trees were logged in the night time and then the
timbers were transported from the forest to the villages using motorbikes that have
been designed to carry timbers (AN, community leader, interview, 21/03/2015).
The villagers involved in illegal logging were aware that their actions were against
the law and that there is risk of a jail sentence if they were caught and of social
punishment from the community (Gultom et al., 2013). However, poverty pushes
them to rely on illegal logging for their livelihood (Author’s survey, 2015).

111
Figure 5.8 Satellite Photo of Sesaot Community Forestry and Illegal Logging
Location in 2015
Source: Google (2015b), https://earth.google.com, retrieved on 26 July 2016
This situation illustrates the three phases of Community Forestry
development as discussed above. It is possible that the forest lands that were cleared
will be converted to community forest in the upcoming period, and enlarge the area
of the current community forest.
5.3. Payment for Ecosystem Services Program and Forest Conservation
Theory suggests that Payment for Ecosystem Services (PES) can be used as
an incentive for forest farmers to manage forests properly (Wunder, 2005; Pagiola,
2006). The main goal of PES in West Lombok is to provide incentives for forest
farmers to manage the forest appropriately in order to protect water provision from

112
Sesaot forest. Bennett et al. (2011) argue that PES programs will be more capable
of achieving the program’s goals if they suit the needs of the targeted ecosystem
services providers. For example, in the case of China’s Sloping Land Conversion
Program, the program’s outcome was more effective because farmers were allowed
to select the kind of trees to be planted, although the farmers tended to create more
“economic” than “ecological” forests (Bennett et al., 2011). In the case of the PES
program in Lombok, it will be argued that the introduction of the PES scheme,
which is integrated into the Community Forestry program in Sesaot forest, could
deliver significant positive impacts on forest conservation by increasing the
incentives to protect forest cover.
The introduction of the PES program in West Lombok has helped forest
farmers to obtain free seeds. Farmers implied that they could not afford to buy seeds
using their income. The survey data indicates that the price of one seed is around
Rp 11,600 (US$ 0.87) which is less than 1% of farmers’ average monthly earning
from their forest products (Author’s survey, 2015). At the same time, the
government does not have sufficient budget for tree planting. For example, in 2012,
a very limited forest restoration budget of only US$ 4 per hectare (Neraca, 2013)
was annually allocated by the Indonesian government in their National Budget
Planning (Anggaran Pendapatan dan Belanja Negara, APBN). Only a small
amount of funding for forest restoration in a limited number of locations was
allocated through a Special Allocation Fund (Dana Alokasi Khusus, DAK) scheme
from central government. This indicates that the Indonesian forestry department
was having difficulty in managing forests properly. For this reason, the potential
for funding re-afforestation and forest conservation from the PES program was an
attractive option.
Since the seeds supplied from the PES program are mainly MPTS, it can be
an incentive for farmers to manage forests properly since they will obtain economic
benefits from the seeds in the future. Thus managing trees for economic benefits
also supports ecological benefits. However, compared to the original forest
condition, the current forest cover is dominated by MPTS and very few endemic
forest tree species are left. The forest farmers in Sesaot tend to plant more MPTS

113
than endemic trees as MPTS provides more short-term economic benefit to them
(Author’s survey, 2015) because forest farmers can obtain fruits from these kinds
of trees. Nonetheless, MPTS are ecologically beneficial for maintaining water
resources as well as other ecological forest functions such as carbon sequestration,
and protection from flood. Thus planting MPTS could be advantageous for both the
economy and ecology. However, the replacement of tree species that occurred in
native forest has not been good from the perspective of biodiversity since endemic
trees were replaced with MPTS that should not be planted in protection forest (AZ,
water utility company officer, interview, 10/6/2014).
The PES program was readily accepted by the forest farmers (SA, forest
agency officer, interview, 5/6/2014). Furthermore, MPTS trees will be maintained
by the forest farmers due to the long-term economic benefit from the yields, which
are higher than the short-term benefits from the price of timber if the trees were
logged. For example, the average price of a logged durian tree is around Rp 630,000
(US$ 50). Meanwhile a durian tree can produce fruit valued at around Rp 200,000
(US$ 15) per annum (Author’s survey, 2015). Although the value of the fruit in the
short term is lower than the value of the logged tree, it can be enjoyed by the farmers
in the long term which means the total value from the fruits would be higher than
the value of the logged tree.
However, there is no guarantee that the trees will be kept forever. The forest
farmers will log the trees if there is a need for wood (Author’s survey, 2015). For
instance, if there is a traditional ceremony that requires firewood for cooking,
people will log trees on their forest land with permission from and coordination
with the forest farmer community leaders (CFFG head and village head). Also, local
people tend to log trees if they need timber to build houses. However, it is very rare
that the farmers log trees for commercial purposes because this is against adat and
state law. Although this type of logging is rare and small in volume, these actions
still cause forest degradation. Collecting forest products –including timber– for

114
non-commercial purposes by adat communities is allowed under Indonesian
forestry law (UU 41/99 article 67)46.
The author’s survey results showed that 77% of respondents who are
enrolled in the PES program stated that there is an increase in the number of trees
on their Community Forestry land after the PES program was introduced (see figure
5.9). This is due to the conversion of the cash benefit from PES to seeds to be
planted on community forestland, as a conditionality of the program. The aim of
the conversion is to control the ecological outcome of the PES program. The seeds
are mainly planted on degraded land, which is then supposed to contribute to
increase the forest cover.
Figure 5.9 Farmers’ Perception of Change in Number of Trees on Community
Forest Land due to PES
Source: Author's survey, 2015; n = 100
On the other hand, not all respondents agree that the PES program increased
the number of trees on their Community Forestry land. Around 13% of respondents
who are enrolled in the PES program stated that there was no change in the number
of trees as a result of the PES program. They say this is due to the low quality of
the seeds provided that did not grow well. In addition, due to limited supply, the
seeds were planted in a small area of Community Forestry land. Each farmer who
46 This law does not clearly mention that timber collection is allowed in specific classifications of
forest. Another law (UU 18/2013 article 11) mentions that local people are allowed to log trees
except in conservation and protection forest.

115
was enrolled in the PES program obtained only thirteen seeds on average. This is
too few compared to the level of need for tree planting to support forest
conservation. Furthermore, the number of trees did not increase due to a lack of
water in the period of PES implementation, which did not take place in the optimal
planting season. The seeds should be supplied in the rainy season so they are easy
to grow with a sufficient supply of water. Instead, they were distributed in the dry
season. The effectiveness of the implementation of the PES program thus is open
to question.
However, the PES program has supported an increase in the quality of forest
cover. 79% of survey respondents who were enrolled in the PES program stated
that the quantity and quality of trees increased, especially due to the variety of seeds
that were planted (see figure 5.10). Although some respondents stated that the
quality of the seeds that they obtained was low, other CFFG members reported
obtaining better quality seeds that contributed to an increase in the variety and
quality of trees on their community forest land. The seed quality improved after the
program was evaluated three years following its inception.
Figure 5. 10 Farmers’ Perception of Forest Cover Quality Improvement due to
PES
Source: Author's survey, 2015; n = 100
The PES program in West Lombok was implemented 6 years before this
survey was conducted. During that time, conservation efforts had been undertaken
in some degraded forest areas. Fast growing tree species such as silk trees (Albizia

116
chinensis) were among the trees that were planted to achieve a rapid conservation
effect47. As a result, significant increases in forest cover in that project location are
evident. Data from the West Lombok district forest agency demonstrates that the
degraded forest land in Sesaot forest was reduced from 763.35 hectares in 2010 to
423.50 hectares in 2014 (see figure 5.11).
Up until 2014, money from PES in West Lombok has been allocated to fund
15 forest restoration activities involving 13 forest farmers' groups in seven villages
around Sesaot Forest (IMP, 2010; SBP, 2010; IMP, 2012; SBP, 2012; IMP, 2013b).
This includes 405 hectares of land where 361,744 trees have been planted (IMP,
2014a). However, as the PES budget is still limited, it can only be used for
complementary aspects of the conservation program and cannot be used for
mainstream schemes in forest resource governance. During five years of
implementation, the PES program only supported re-afforestation on about 1.3% of
the total degraded forest area in West Lombok, which requires funding for
restoration (IMP, 2010; SBP, 2010; IMP, 2012; SBP, 2012; IMP, 2013b). Although
small, this contribution to forest conservation is crucial to the effective development
of this program, which has had relatively limited impact to date. In the future, if
PES could be implemented in all areas of Lombok, it would undoubtedly deliver
significant outcomes for forest restoration. A similar PES regulation has already
been introduced in Central Lombok district and will be implemented in the coming
years.
In spite of the fact that the amount of PES funding is relatively small, the
distribution of the fund was running smoothly due to effective administration.
Unlike a project approach, all funds are handed over to the groups awarded funding,
and allocation procedures are designed and monitored by IMP to ensure proper use.
With this approach, villagers were enthusiastic about involvement in the program
(RN, community leader, interview, 10/06/2014). In regards to maintaining the
ecological quality of this program, discussions and consultations with the forest
service officers were conducted throughout the process, starting from the selection
47 Albizia chinensis is a very fast growing tree species and takes only 5 years from planting to
harvesting.
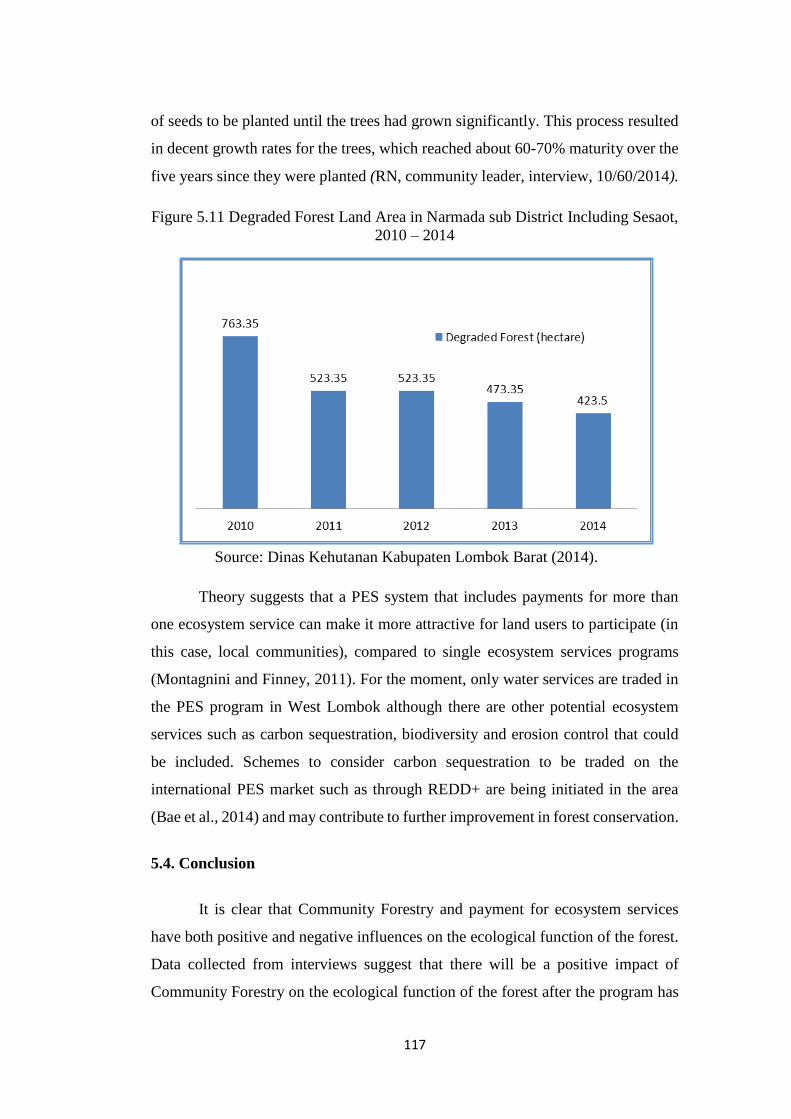
117
of seeds to be planted until the trees had grown significantly. This process resulted
in decent growth rates for the trees, which reached about 60-70% maturity over the
five years since they were planted (RN, community leader, interview, 10/60/2014).
Figure 5.11 Degraded Forest Land Area in Narmada sub District Including Sesaot,
2010 – 2014
Source: Dinas Kehutanan Kabupaten Lombok Barat (2014).
Theory suggests that a PES system that includes payments for more than
one ecosystem service can make it more attractive for land users to participate (in
this case, local communities), compared to single ecosystem services programs
(Montagnini and Finney, 2011). For the moment, only water services are traded in
the PES program in West Lombok although there are other potential ecosystem
services such as carbon sequestration, biodiversity and erosion control that could
be included. Schemes to consider carbon sequestration to be traded on the
international PES market such as through REDD+ are being initiated in the area
(Bae et al., 2014) and may contribute to further improvement in forest conservation.
5.4. Conclusion
It is clear that Community Forestry and payment for ecosystem services
have both positive and negative influences on the ecological function of the forest.
Data collected from interviews suggest that there will be a positive impact of
Community Forestry on the ecological function of the forest after the program has
118
been well established. Referring to the three phases of Community Forestry
development in Lombok, namely the rehabilitation phase, encroachment phase, and
a new forest re-vegetation phase, the positive outcomes occurred in the first and
third phases. There is a need to address the problem of encroachment on the forest,
which occurred in the second phase by those who had not been involved in the
established Community Forestry program.
Even where the Community Forestry program has resulted in improved
forest cover, it does not contribute to biodiversity conservation when endemic forest
trees have been lost and replaced with MPTS fruit producing tree species.
Community Forestry rules allow forest farmers to plant crops and MPTS together
with conservation trees. Similar to the endemic forest trees, MPTS can provide
ecological benefits such as water protection, carbon sequestration and flood control,
yet MPTS lack the benefits of biodiversity protection. MPTS are beneficial for the
livelihood of the forest farmers since they can produce fruits --as a non-timber forest
product-- that can be a source of income for the forest farmer. Thus planting MPTS
on community forest land generates dual benefits for the economy and watershed
conservation, which can be an incentive for the forest farmers to maintain the forest
cover. Although endemic species have the further environmental benefit of
enhancing biodiversity.
However, the forest farmers tend to prioritise economic benefits over
ecological benefits, as indicated by the plantation composition, which is very
different from the composition required by state regulation. The Community
Forestry regulation stipulates a proportion of 60% conservation trees to 40% MPTS
trees to be planted in a community forest. A negotiated modification codified in
local adat regulations with District approval permitted a drastic change to a 30/70%
composition in favour of MPTS instead. In fact, the actual proportion of
conservation trees to MPTS was 21% and 79% respectively according to the Sesaot
survey data. Although forest farmers pay more attention to economic benefit than
ecological benefit from the community forest, the contribution to ecological
outcome remains important, especially insofar as MPTS has the same function as
endemic conservation trees for watershed protection purposes.
119
Another factor which has influenced Community Forestry success is adat
which Community Forest Farmer Groups (CFFGs) believe play an important role
in sustainable community forest management, despite inconsistent enforcement. As
a self-governing institution, Adat rules regulate the terms and condition of
Community Forestry management to be followed by the CFFG members. Forest
farmers follow adat rules due to a threat of loss of property rights to the community
forest if they offend adat law. Adat also supports a participative forest guardianship
system. Forest farmers were encouraged to guard their plantation from illegal
activities such as timber theft. Failing to maintain their community forest properly
should cause the forest farmer to lose their rights to access and manage the
community forest, according to adat regulations. However, adat law is weakly
enforced, especially in regards to plantation composition. The lack of enforcement
suggests that if market conditions favoured planting species that do not serve
watershed protection function, farmers would likely shift, or if timber prices
reached levels that made short term logging more profitable, the forest could return
to a degraded condition.
Property rights play a significant role in maintaining forest cover. Property
rights granted by the government have changed the forest farmers’ behaviour with
respect to illegal logging. Since the right to manage the forest is now believed to be
secure, forest farmers tend to maintain their forest land for longer term economic
benefits.
The payment for ecosystem services (PES) program has a positive influence
on the ecological condition of forests. PES can help to increase forest cover,
although the contribution of the current program is relatively small, compared to
the conservation needs of the area. This is because the PES program is applied in a
way that suits forest farmers’ needs. The PES program is complementary to
Community Forestry management practices. Since this program supplies MPTS
seeds to be planted on degraded community forest land, it also provides an incentive
for forest farmers to maintain trees planted for the long term benefits. Thus, the
forest coverage increases, which affects the ecological function of the forest

120
positively. The extent to which the PES and Community Forestry programs impact
on farmers’ livelihoods will be discussed in the next chapter.
121
Chapter 6
Community Forestry, Payment for Ecosystem Services and Local
Socio-Economic Conditions
This chapter examines whether or not, and under what conditions, integrated
Community Forestry and Payment for Ecosystem Services (PES) programs can
become a tool to improve local socio-economic conditions. The principal
hypothesis of this chapter is that, by better accommodating local communities’
needs; integrated Community Forestry and PES can be used as a tool to support the
improvement of socio-economic conditions, in particular for poverty alleviation in
the long-term.
This chapter is structured as follows: Section 6.1 discusses the impact of the
Community Forestry program on local socio-economic conditions; Section 6.2
describes the villagers’ views concerning the effect of Community Forestry on their
livelihoods and poverty reduction. The socio-economic benefits from integrating
PES into a Community Forestry program is the topic of section 6.3. Finally, section
6.4 concludes this chapter.
6.1. Community Forestry Impacts on Local Socio-Economic Conditions
Community Forestry and Payment for Ecosystem Services (PES) programs
are designed to support poverty alleviation as well as natural resource conservation
(Ferraro and Kiss, 2002). As described in chapter 4 of this thesis, the PES program
in West Lombok Indonesia is integrated with the Community Forestry program to
support forest conservation in Sesaot forests, which are managed through a
Community Forestry approach. In this case, the PES program provides funds for
tree planting in the degraded forest.
Since ecosystem services are provided by nature, people might argue that
no payment is needed to consume the services. In fact, the existence of ecosystem

122
services is strongly influenced by the behaviour of people living in the areas where
ecosystem services are produced (Duncan, 2006). For instance, inappropriate land
management by farmers in an upstream watershed area would undoubtedly affect
the quality and quantity of water supply in a related downstream area. This situation
led to the proposition that payments should be made as an incentive to influence
upstream people’s behaviour in order to maintain the long-term provision of
ecosystem services (Duncan, 2006; Pagiola, 2006; Engel et al., 2008; Sommerville,
M. M. et al., 2009; Muradian, Roldan et al., 2010). PES has been applied as a tool
for connecting downstream and upstream communities, as an instrument for solving
conflict between two such groups of people (Kosoy et al., 2007). PES is also applied
as a wealth distribution strategy among rural and urban communities (Muradian,
Roldan and Rival, 2012).
PES practice is commonly applied as a single purpose program for
maintaining only one defined ecosystem service. In this case, the resource users are
paid by ecosystem services beneficiaries to ensure the ecosystem service is supplied
continuously from the particular natural resource. PES programs are often
introduced together with other development or conservation programs such as
integrated conservation and development projects (ICDP) for rural development
and forest conservation. An integrated PES program with rural development and/or
conservation programs is not only beneficial to ensure the supply of ecosystem
services from rural to urban communities, but also can be seen as a transfer of
human, financial and social capital from urban to rural communities (Torres et al.,
2013).
High levels of poverty are often spatially correlated with remote
conservation areas that provide ecosystem services (Pagiola et al., 2005). Therefore,
it is argued that PES can also be used as a tool for poverty alleviation (Duncan,
2006; Pagiola, 2007; Wunder and Albán, 2008). However, the reality of the impact
of PES programs on the livelihoods of poor households is an empirical question.
Muradian, Roldan et al. (2010) argue that the poverty alleviation goals of PES
programs are difficult to achieve, due to the maldistribution of PES benefits that
should go to the poor. They stressed that benefits were often disproportionally

123
distributed to the well-off landowners who hold formal land tenure. Similarly,
Pagiola et al. (2005) contend that PES has primarily been an instrument for
maintaining natural resource efficiency and not for poverty alleviation. They argue
that “PES programs are not a magic bullet for poverty reduction, but there can be
important synergies when program design is well thought out and local conditions
are favorable” (Pagiola et al., 2005, p. 248).
As described in chapter 4 of this thesis, the PES program in West Lombok
is designed to suit local conditions where the defined ecosystem service, which is
water, is produced from a forest that is managed through a Community Forestry
approach. Here, the PES fund is allocated for planting trees in the community forest
area. The types of trees planted are varied to suit the needs of the forest farmers. In
this case, the forest farmers need Multi-Purpose Tree Species (MPTS)48, which will
both serve the purpose of maintaining water provision from the forest, and at the
same time contribute to the forest farmers’ livelihoods.
Before explaining the impact of integrated Community Forestry and PES on
poverty, we will firstly discuss the general effects of Community Forestry programs
on socio-economic conditions in the villages surrounding Sesaot Forest, regardless
of whether or not PES has been integrated into their practices49. It will be argued
that the Community Forestry program in the Sesaot forest in West Lombok has
significantly improved the socio-economic conditions in the area. Community
Forestry is argued to provide a wide range of social and economic benefits for
villagers, including access to land, new job opportunities, new sources of income
and increased income for villagers, improved education levels, improved health
outcomes, better housing conditions and greater home ownership. Such benefits
will be considered in two categories, direct benefits and indirect benefits.
48 MPTS (Multipurpose Tree Species) are trees that have both economic and ecological benefit, for
example fruit trees such as durian, avocado, mango, jackfruit, hazelnut and others (Menteri
Kehutanan RI, 2014a). 49 A discussion of the debates amongst scholars regarding the impact of Community Forestry
practice on poverty alleviation in other countries was presented in the Chapter 2 of this thesis.

124
6.1.1. Direct Socio-Economic Benefits of Community Forestry
Direct benefits are the immediate benefits obtained by villagers who are
granted a property right to manage the community forest. These include access to
land and new sources of income.
Land access for landless families
Access to land is the greatest benefit that is enjoyed by villagers who
become forest farmers and obtain community forest management rights. This group
of people is made up principally of the villagers who do not own private farming
land, especially single parent women and the poor. As mentioned in the profile
description of the first community forest farmer group in Sesaot, KMPH,
participants in this program were selected on the basis of specific criteria, including:
willingness to voluntarily participate, non-ownership of private farming land, and
residence near Sesaot forest. Single-parent women with children were given first
priority. Based on these criteria, 165 households were selected at the beginning of
the Community Forestry program (Forum Kawasan, 2009).The landless families
obtain access to farming land, which is beneficial for their livelihoods. Thus the
Community Forestry program could be seen as a form of land distribution to the
poor.
Access to community forest land is bounded by government regulation. It is
clearly stated that the land remains state land. The granted right is not an ownership
right, so that the forest land cannot be sold or inherited (Menteri Kehutanan RI,
2014a). The forest farmers are only allowed to manage the land and carry out
farming with a composition of 70% MPTS (Multi-Purpose Tree Species) and 30%
forest trees, with a minimum 265 trees on a hectare of land. Land access is granted
for 35 years and can be renewed after evaluation, which is conducted every five
years (Forum Kawasan, 2006). In the absence of the Community Forestry program,
in 2015, based on the survey for this study, 45% of villagers did not have private
land for farming. Although the size of the Community Forestry plot that has been
125
granted to the villagers is relatively small (0.25 hectares per family50), it has helped
the villagers obtain cash from farming forest land, which they could not have done
legally in the past. The existence of Community Forestry has changed their lives,
from being landless families to families with conditional access to land.
Income generation
Another direct benefit of Community Forestry programs is the cash income
obtained from selling forest products, especially non-timber forest products
(NTFPs) such as coffee, cocoa, banana and other fruits and vegetables. Since the
Community Forestry program in Sesaot is located in a protected forest that is
significant for ecological needs, timber products are prohibited from being obtained
from the community forest (based on the Indonesian law on forestry, UU 41/1999).
As an alternative, non-timber forest products (UU 41/1999 section 26) can be
collected. Based on The Indonesian Ministry of Forestry regulation number
P.35/2007, Non-timber forest products refer to everything other than timber;
including, for example, rattan, resin, fruits, vegetables and honey (Menteri
Kehutanan RI, 2007). The situation would be different if the status of the Sesaot
forest was a production forest. Based on the Indonesian regulations on Community
Forestry, timber production is allowed in a community forest that is located in a
production forest.
The non-timber forest products, especially fruits, are the most significant
benefits that people obtain from the Sesaot community forest. Thus, to support both
economic and ecological needs, MPTS that can produce fruits are favoured for
planting in the community forest. Surveys for this study indicate that, on average,
80% of the trees planted in the community forests are categorized as MPTS. As
mentioned in Chapter 4, the Community Forestry program in Sesaot involved
conversion of degraded forest land which was replanted and developed as
community forest. Almost all community forests in Sesaot are secondary forest.
50 Although each household officially obtains only 0.25 hectares, in fact, some households occupy
more than 0.25 hectares that have been obtained through “buying” from others.

126
The community forest covers around 30% of the total size of the Sesaot forests
(Forum Kawasan, 2011b).
Based on surveys conducted by the author in 2015, the average community
forest farmer’s annual earnings per household from selling NTFPs is around Rp
15,200,000 (US$1,150) or about Rp 1,260,000 (US$95) per month. The highest
contributions to these earnings come from cocoa and banana crops, which reach an
average of Rp 5,816,100 (US$ 438) and Rp 3,466,125 (US$ 254) respectively per
year. This income can be used to cover about 48% of average family expenditure,
which reaches about Rp 32,150,000 (US$2,440) a year, or about Rp 2,600,000
(US$197) per month. To support their income from community forests, most
families have additional jobs, for example as small traders, labourers, livestock
farmers, ojek (freelance motorcycle) drivers and handymen.
For an average of four family members, the forest farmers’ per capita
expenditure is about Rp 650,000 per month. Of this, the highest proportions are
spent for food and education, at 54% and 13% respectively. The economic
conditions of the Sesaot community forest farmers are today well above the
Indonesian national poverty line, which is currently set at Rp 356,378 expenditure
per capita per month (BPS, 2016a). In addition, when considering the United
Nations poverty threshold, which is currently set at US$ 1.25 income per capita per
day (UN, 2015), the economic conditions of forest farmers in Sesaot, at about
US$1.80 per capita per day, is still above this international standard.
6.1.2. Indirect Socio-Economic Benefits of Community Forestry
Indirect benefits are the benefits from the existence of the Community
Forestry program that are enjoyed by villagers who do not work as forest farmers.
Community Forestry provides jobs for people in the villages, such as traders in
forest products, truck and ojek drivers, food processors, and labourers for crop
planting and harvesting the yields. Community forest farmers who manage a large

127
area of community forest land often employ other villagers to help them during
planting and harvesting seasons51.
Before Community Forestry was established, many people sought work
overseas, such as in Malaysia, since there was a lack of job opportunities in the
villages. As mentioned by one Sesaot villager, “Since Community Forestry has
been established, people have tended to stay in their village, and to work in the
forest either as a forest farmer, a labourer for planting and harvesting, or a
middleman trader…” (AN, villager, interview, 21/3/2016). The higher proportion
of people staying in the villages increases family connections, and may have long
term benefits in terms of social capital generation in the area, but on the other hand
the greater the population may put pressure on scarce forestland resources.
Women also gain benefits from Community Forestry. Previously in Sesaot,
women in the villages usually stayed in the home undertaking domestic jobs. Since
Community Forestry has been established, women now go to the forest to help their
husbands in managing the Community Forestry land, or to work as farm labourers
(AM, CFUG leader, interview, 8/6/2014). Some women also work as small traders
for forest products. They buy forest products directly from the farmer in the forest,
to be sold in markets in the city. Women's groups have also been created in the
villages to manage food processing businesses. The raw materials for food
production, such as banana, jackfruit and durian, are bought from community forest
farmers, and their products are sold to supply the tourism industry.
The indirect benefits of Community Forestry also flow to those who work
in related forest product businesses, such as transportation and small trading. The
author’s survey result demonstrated that some villagers have opened transportation
51 The community forest land size officially granted by government is 0.25 hectares per household.
However, some households manage up to 4.5 hectares – due to their capability to “take-over” the
land management rights of other households if the latter need cash and are willing to “hand over”
their rights although this is technically illegal. The survey data indicates 37% of households manage
0.25 hectares, while 63% manage more than 0.25 hectares. This is a big issue for the sustainability
of Community Forestry and PES. Ultimately, there will be more landless seeking to gain land or
income through illegal use of the forest as a result of these illegal transfers.

128
businesses to assist farmers and small traders to access the forest, and to transport
their forest products to market using trucks. Many young people work as ojek
(motorcycle) drivers, to transport non-timber forest products from forest areas that
are difficult to access by truck. Other villagers have opened small warung (coffee
shops) near the forest, to accommodate the needs of forest farmers, drivers and
middleman traders for lunch or coffee breaks. Significant change is also evident
with respect to the lower numbers of people whose livelihoods rely primarily on
timber products. Since the Community Forestry program has been established,
people in the villages are no longer so directly dependent on timber forest products
for their livelihoods; which is beneficial for the ecology of the area, as described in
Chapter 5 of this thesis.
Community Forestry is also able to provide revenue for the local
government, due to taxes and fees collected from the community forest farmers.
The forest farmers are mandated to pay a monthly fee, which is assessed based on
the area of community forest that they occupy. This fee costs the farmers Rp 10,000
(US$0.76) per month per hectare (AM, CFUG leader, interview, 8/6/2014). From
the total official Community Forestry area (2,668 hectares) in West Lombok
district, the local government can obtain Rp 320,160,000 (US$24,300) per annum.
In addition, the local government also generates revenue from the PES fund which
is integrated with the Community Forestry program. As stated in the PES
regulations, 20% of this fund is allocated for government revenue. In one example,
in 2013, the PES contribution from water consumers in West Lombok was Rp
343,641,500 (US$ 26,000) (PDAM Giri Menang, 2016). From this amount, it can
be estimated that government revenue earned from PES was Rp 68,728,000
(US$5,218).
6.2. Villagers' Views on the Effect of Community Forestry on Their
Livelihoods and on Poverty Reduction
This study involved surveys of 200 forest farmers in five villages bordering
the Sesaot community forest location. The primary focus of the survey was to
evaluate the impact of Community Forestry and PES programs on people’s
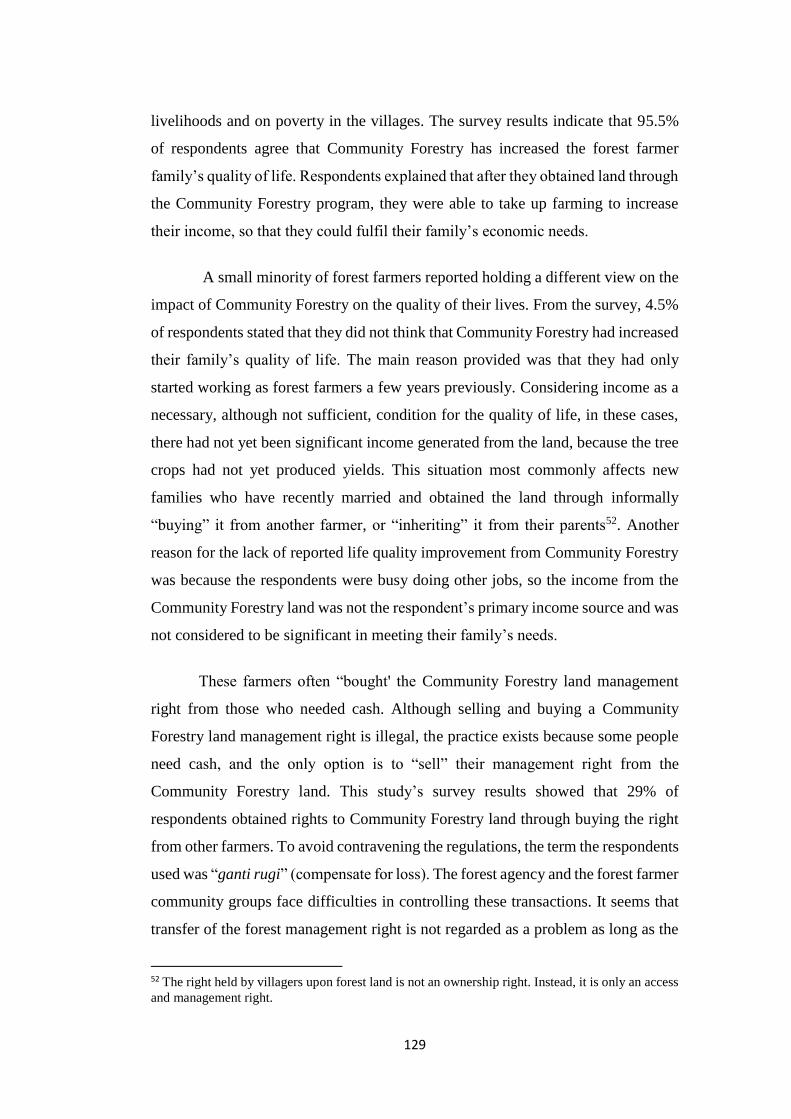
129
livelihoods and on poverty in the villages. The survey results indicate that 95.5%
of respondents agree that Community Forestry has increased the forest farmer
family’s quality of life. Respondents explained that after they obtained land through
the Community Forestry program, they were able to take up farming to increase
their income, so that they could fulfil their family’s economic needs.
A small minority of forest farmers reported holding a different view on the
impact of Community Forestry on the quality of their lives. From the survey, 4.5%
of respondents stated that they did not think that Community Forestry had increased
their family’s quality of life. The main reason provided was that they had only
started working as forest farmers a few years previously. Considering income as a
necessary, although not sufficient, condition for the quality of life, in these cases,
there had not yet been significant income generated from the land, because the tree
crops had not yet produced yields. This situation most commonly affects new
families who have recently married and obtained the land through informally
“buying” it from another farmer, or “inheriting” it from their parents52. Another
reason for the lack of reported life quality improvement from Community Forestry
was because the respondents were busy doing other jobs, so the income from the
Community Forestry land was not the respondent’s primary income source and was
not considered to be significant in meeting their family’s needs.
These farmers often “bought' the Community Forestry land management
right from those who needed cash. Although selling and buying a Community
Forestry land management right is illegal, the practice exists because some people
need cash, and the only option is to “sell” their management right from the
Community Forestry land. This study’s survey results showed that 29% of
respondents obtained rights to Community Forestry land through buying the right
from other farmers. To avoid contravening the regulations, the term the respondents
used was “ganti rugi” (compensate for loss). The forest agency and the forest farmer
community groups face difficulties in controlling these transactions. It seems that
transfer of the forest management right is not regarded as a problem as long as the
52 The right held by villagers upon forest land is not an ownership right. Instead, it is only an access
and management right.

130
land is not "sold" to people who come from outside of the villages. Thus, the
property rights on the community forest are circulated only among the targeted
households in the villages. As mentioned by one forest agency officer, “the forest
management rights should be distributed among people who live in the surrounding
villages where the Community Forestry is located’ (MM, forest agency officer,
interview, 6/6/2015). Nonetheless, the problem of the re-emergence of landless
households from among the recipients and of inequalities among landholders over
time is a potentially serious issue. There is no written contract for the transactions,
which are based only on oral agreements among the relevant parties; although these
transactions need to be approved by the CFFG leader to be locally accepted.
In general, the Community Forestry program has had a positive impact on
socio-economic conditions in the villages. The survey results indicate that 82% of
respondents agree and 13.5% strongly agree that Community Forestry helps to
reduce poverty in the villages. They argue that it is easier to make a living because
Community Forestry programs have established job opportunities in the villages.
The general economic conditions and welfare in the village have increased
significantly even though some people have not become community forest farmers.
Only 0.5% of respondents disagreed with the statement that Community Forestry
reduced poverty in the villages (and 4% of respondents were neutral). Those who
disagreed argued that the answer depends on the size of the community forest plots
awarded. The Community Forestry plot size is relatively small, and is arguably not
adequate for those who have large families. Thus, the benefit of Community
Forestry on socio-economic conditions is smaller for this group of families.
6.3. Socio-Economic Benefits from Integrating PES into a Community
Forestry Program
As mentioned in the introduction section, the PES program that has been
applied in West Lombok has been integrated with the Community Forestry
management program. The PES program provides funding for tree planting in
degraded community forest, in order to maintain water supplies from the forest. The
PES fund should be delivered to forest farmers as a conditional cash incentive, with

131
the aim of positively influencing their behaviour in forest management; specifically,
to keep trees standing and to contribute to the maintenance of water provision from
the forest. As argued by Adhikari, S. et al. (2014), incentives are necessary to
encourage people’s participation in natural resource management.
One obstacle in implementing the direct payment approach in developing
countries is the limited opportunities for non-agricultural investment (Ferraro and
Kiss, 2002). However, this obstacle does not exist in PES implementation in
Lombok, since the payment is not merely allocated for conservation purposes. In
addition to conservation, PES was also used to fund non-conservation activities
around the forest. In the beginning of this program, the funding was also allocated
for business activities, such as a food processing business run by a women’s group.
Due to the limited budget, there has only been one women’s group, involving 14
women, which has received benefit from the PES program to date. This group
received Rp 33,750,000 (equal to US$ 2,562) when the PES program was initiated,
to support their activities in processing non-timber forest products (SBP, 2012). So
far, around Rp 653,516,500 (equal to US$ 49,620) has been delivered to
communities in the Sesaot forest area (see table 4.1). However, non-conservation
activities are no longer funded, due to the high demands on the PES fund for
planting trees in degraded forests.
6.3.1. Villagers’ Views on the Effect of PES on Their Livelihood and Poverty
Reduction
Compared to villagers' responses concerning the impact of Community
Forestry on their livelihoods, where almost all respondents agreed that Community
Forestry has had a positive influence, they are less convinced of the positive impact
of PES on household livelihoods. It is likely that the goals of PES for poverty
alleviation may only be achieved in the long term. As mentioned in Chapter 4, the
initial goal of PES in Lombok was to serve as a tool to encourage the urban
community to contribute to funding both forest conservation and poverty alleviation
in rural areas.

132
Currently, PES funding is only sufficient for conservation purposes, and not
for poverty reduction. The PES program is integrated with Community Forestry to
help farmers obtain free seeds, which are mainly MPTS that are supposed to provide
economic benefit and thus contribute to poverty reduction. Such in-kind payment
which suits the needs of forest farmers tends to be accepted more easily by
recipients, and may stimulate more participation, as experienced in Western Mexico
(Torres et al., 2013). However, since the quantity of funds provided is relatively
small, this can only be used for additional capital for managing the community
forest. Only a small portion of the fund is allocated for planting and maintenance
wages that can provide direct financial benefits for the farmers. Nonetheless, Fauzi
and Anna (2013) argue that PES has been readily accepted by local people, since it
is based on a very different approach from the command and control system of
natural resources management that was applied previously under Indonesia's New
Order regime.
It is difficult to argue that PES will be able to solve poverty problems in
these villages in the short term. Since most of the planted trees are categorized as
MPTS, it can be assumed that more benefits will be enjoyed in the long term, once
the trees are ready to be harvested (RN, community leader, interview, 10 June
2014). The Author’s survey results indicate that 64% of survey respondents
reported that PES improves their family’s quality of life. There is expectation that
their incomes will increase in the future, once the MPTS seeds bought from the PES
fund have grown and produce yields (RN, community leader, interview,
10/6/2014). Some farmers do not get paid for planting the trees, since their
community has agreed to allocate the planting wage for buying more seeds; so that
more trees can be planted and future economic benefits can be achieved.
From the survey, 18% of respondents disagreed that PES improves their
family’s quality of life. The main reason for differential responses was that the trees
are not yet fully grown, and have not yet produced yields. Further, some
respondents explained that the number of seeds is limited and not adequate for their
needs. In addition, not all forest farmers are involved in the PES program. Some
farmers may have to wait several years to join the program, due to the limited PES

133
budget. Others who have recently become involved in the PES program have not
yet obtained direct economic benefits, except for the free seeds.
The survey indicates that around 17% of respondents are neutral with
respect to the benefits of PES; neither agreeing nor disagreeing with the statement
that PES improves their family’s quality of life. The main reason provided for this
answer, as for those who disagreed, was that the seeds have not yet grown. The
economic benefit may be achieved in the future, if the seeds grow well.
Overall, the survey revealed an expectation that the PES program may
reduce poverty in the future. About 83% of survey respondents indicated that PES
could potentially support poverty alleviation once all forest farmers become
involved and all seeds have grown and are producing yields. In such a situation,
money from PES could be used for economic activities other than forest
conservation; once the forest has been fully planted. For the time being, the current
direct economic benefit from PES is the value of the seeds that are distributed. If
the farmers have to buy the seeds using their own money, they need to spend on
average at least Rp 11,600 (US$ 0.88) per seed. The money from PES would be
more beneficial if it could be used for wages for planting.
6.3.2. Welfare Index to Measure the Socio-Economic Impact of Integrated
PES and Community Forestry
To measure the impact of Community Forestry and the PES program on
farmer households’ socio-economic condition, a welfare index was designed. Eight
basic indicators of welfare were surveyed to generate the welfare index. These
indicators of welfare were chosen based on the social economic survey standards
used by the Indonesian statistics agency. These indicators include: house
ownership, house wall material, house floor material, electricity, water supply,
energy for cooking, transportation and communication (Riyadi et al., 2015). A
summary of the welfare index is presented in table 6.1.

134
Table 6.1 Summary of Welfare Indicators Before and After Community Forestry
and PES Programs were Established
Indicators Criteria 1998 2015 Change
(%) (%) (%)
House Ownership Own house 40 97 +57
Live with family 60 3 -57
House wall material Bamboo 45 3 -42
Wood 34 9 -25
Brick 20 88 +68
House floor Material Soil 56 1 -55
Cement 43 61 +18
Tile 1 38 +37
Access to Electricity No Electricity 70 0 -70
Shared from neighbour 20 20 0
PLN grid 10 74 +64
Own generator 0 6 +6
Water Supply River/spring 77 1 -76
Private well 1 1 0
Public pipe 21 8 -13
Private pipe 1 91 +90
Energy for Cooking Wood/timber 100 34 -66
Oil 0 1 +1
Gas 0 65 +65
Transportation
Facilities No transportation 88 14 -74
Bicycle 10 14 +4
Motor bike 2 69 +67
Car 0 3 +3
Communication
Facilities Do not have a mobile phone 100 9 -91
Have one mobile phone 0 47 +47
Have more than one mobile
phone 0 44
+44
Education Level Primary School 67 35 -32
Junior High School 20 27 +7
Senior High School 12 26 +14
Undergraduate 1 12 +11
Postgraduate 0 0.00 0
Source: Author's survey; 2015; n = 200
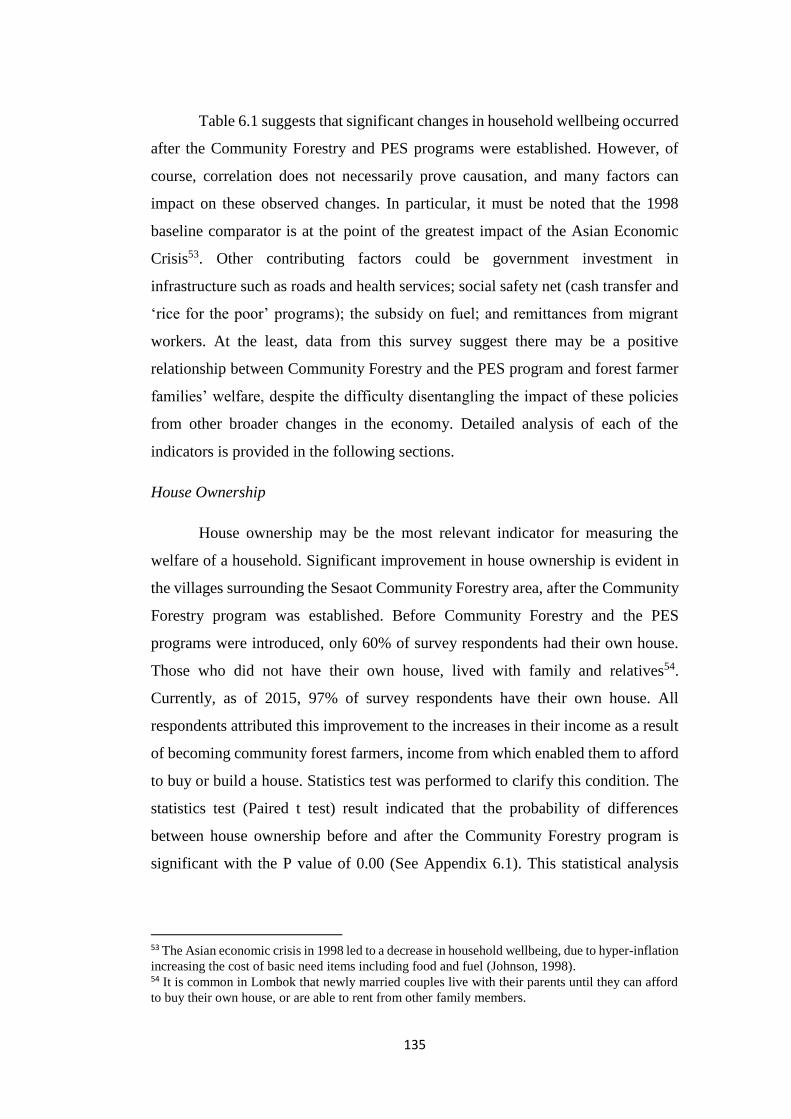
135
Table 6.1 suggests that significant changes in household wellbeing occurred
after the Community Forestry and PES programs were established. However, of
course, correlation does not necessarily prove causation, and many factors can
impact on these observed changes. In particular, it must be noted that the 1998
baseline comparator is at the point of the greatest impact of the Asian Economic
Crisis53. Other contributing factors could be government investment in
infrastructure such as roads and health services; social safety net (cash transfer and
‘rice for the poor’ programs); the subsidy on fuel; and remittances from migrant
workers. At the least, data from this survey suggest there may be a positive
relationship between Community Forestry and the PES program and forest farmer
families’ welfare, despite the difficulty disentangling the impact of these policies
from other broader changes in the economy. Detailed analysis of each of the
indicators is provided in the following sections.
House Ownership
House ownership may be the most relevant indicator for measuring the
welfare of a household. Significant improvement in house ownership is evident in
the villages surrounding the Sesaot Community Forestry area, after the Community
Forestry program was established. Before Community Forestry and the PES
programs were introduced, only 60% of survey respondents had their own house.
Those who did not have their own house, lived with family and relatives54.
Currently, as of 2015, 97% of survey respondents have their own house. All
respondents attributed this improvement to the increases in their income as a result
of becoming community forest farmers, income from which enabled them to afford
to buy or build a house. Statistics test was performed to clarify this condition. The
statistics test (Paired t test) result indicated that the probability of differences
between house ownership before and after the Community Forestry program is
significant with the P value of 0.00 (See Appendix 6.1). This statistical analysis
53 The Asian economic crisis in 1998 led to a decrease in household wellbeing, due to hyper-inflation
increasing the cost of basic need items including food and fuel (Johnson, 1998). 54 It is common in Lombok that newly married couples live with their parents until they can afford
to buy their own house, or are able to rent from other family members.
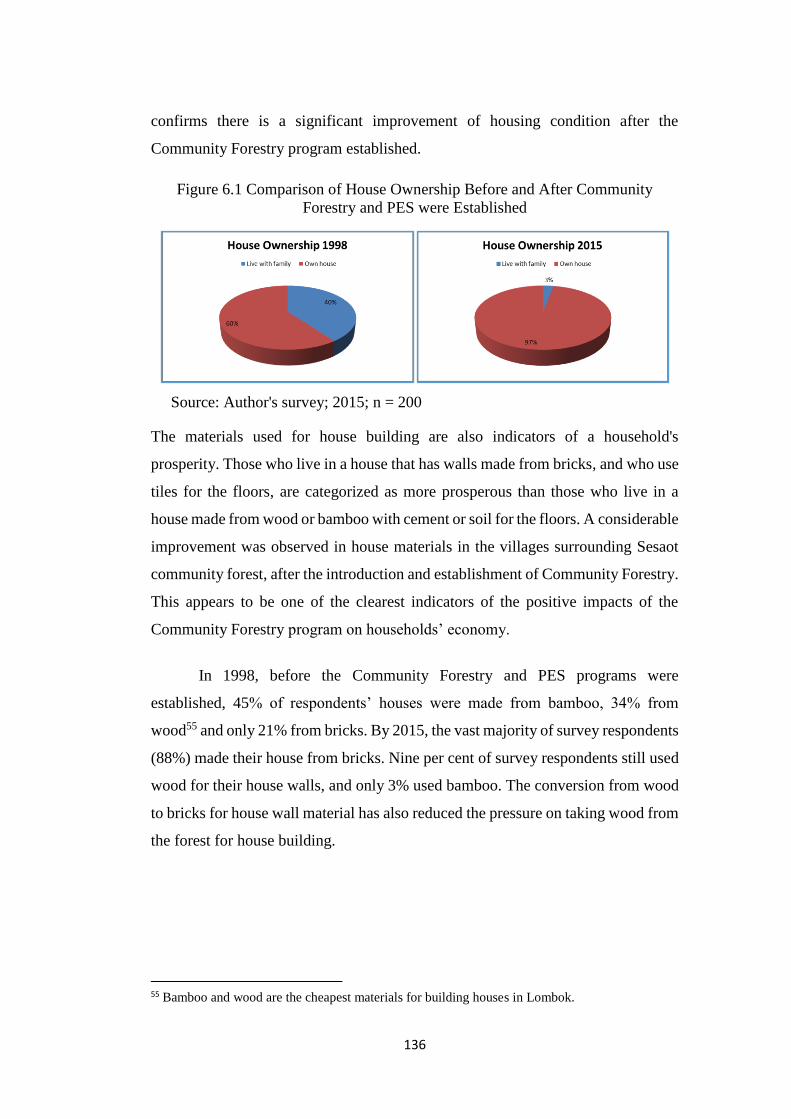
136
confirms there is a significant improvement of housing condition after the
Community Forestry program established.
Figure 6.1 Comparison of House Ownership Before and After Community
Forestry and PES were Established
Source: Author's survey; 2015; n = 200
The materials used for house building are also indicators of a household's
prosperity. Those who live in a house that has walls made from bricks, and who use
tiles for the floors, are categorized as more prosperous than those who live in a
house made from wood or bamboo with cement or soil for the floors. A considerable
improvement was observed in house materials in the villages surrounding Sesaot
community forest, after the introduction and establishment of Community Forestry.
This appears to be one of the clearest indicators of the positive impacts of the
Community Forestry program on households’ economy.
In 1998, before the Community Forestry and PES programs were
established, 45% of respondents’ houses were made from bamboo, 34% from
wood55 and only 21% from bricks. By 2015, the vast majority of survey respondents
(88%) made their house from bricks. Nine per cent of survey respondents still used
wood for their house walls, and only 3% used bamboo. The conversion from wood
to bricks for house wall material has also reduced the pressure on taking wood from
the forest for house building.
55 Bamboo and wood are the cheapest materials for building houses in Lombok.

137
Figure 6.2 Comparison of House Wall Material Before and After Community
Forestry and PES were Established
Source: Author's survey; 2015; n = 200
A similar shift was observed for house floor materials. There are three types
of flooring used in the villages: earthen floor, cement, and tiles. The value of tiles
is higher than cement, while earthen floors are the cheapest material. Before
Community Forestry and PES programs were established, the majority of survey
respondents (56%) used soil for their house floor. Around 43% used cement and
only 1% used tiles. The current situation is markedly different. The majority of
survey respondents (61%) now use cement for their house floor material. Another
large proportion, about 38%, use tiles; and only 1% still have earthen floors.
Figure 6.3 Comparison of House Floor Material Before and After Community
Forestry and PES were Established
Source: Author's survey; 2015; n = 200
Electricity and Water
The welfare indicator categories that were measured included the
availability of utilities such as electricity and water. The ideal living standard is for
every house to have direct access to electricity and water. There are four categories
for electricity access in the villages: direct access from the electricity company

138
(PLN); shared access from a neighbour who has direct access to PLN; owning a
private generator; or no electricity. Although electricity infrastructure is sufficient
in the villages, not all villagers can afford to access the electricity service. The cost
to have direct access to the PLN grid is around Rp 2,500,000 (US$ 190) for
installation, and around Rp 100,000 (US$ 7.6) per month for the bill, depending on
usage.
Before the Community Forestry and PES programs were established, 70%
of survey respondents lived without electricity to their house. Another 20%
obtained electricity from a neighbour who had direct access to PLN supply. Only
10% of survey respondents had direct access to the PLN grid, and no one had their
own generator. This situation improved substantially after Community Forestry was
established. All survey respondents now have access to electricity through various
means. Most respondents (74%) have direct electricity access to the PLN grid; 20%
obtain electricity through their neighbour; and 6% now have their own generator.
Figure 6.4 Comparison of Access to Electricity Before and After Community
Forestry and PES were Established
Source: Author's survey; 2015; n = 200
Access to a water supply can be divided into four categories, in sequential
order of expense and reliability or convenience: direct private pipe to the house;
private well; public piped water facility that is shared with other households; and
the river. Households who have fresh water directly piped into their house are
considered more prosperous than those who only obtain the water from a public
pipe facility. Households that depend upon water collected from the river are
recognized as the least prosperous households.

139
As well as access to electricity, access to water supply has also increased
after the Community Forestry and PES programs were established. Before
Community Forestry and PES, the large majority (77%) of survey respondents
obtained water from the river. Only around 21% of survey respondents had access
to water from a public pipe. About 1% of survey respondents had a private well,
and only 1% had private piped water to their house. After the Community Forestry
and PES programs were established, the vast majority of survey respondents (91%)
now have private piped water to their house. However, there are a small portion of
respondents who still do not have direct access to water facilities in their house.
Instead, they obtain water from a public pipe (8%). The rest of the respondents still
access water from a private well and from the river. Respondents who do not have
direct access to water facilities to their house are mainly those who occupy a small
sized plot of community forest land. Seventy-six percent of this group occupy only
0.25 hectares, with a corresponding low monthly income; and only 58% of them
are involved in the PES program. Additional income from expanded community
forest land and from greater and more direct PES benefits would be important for
them to fund their access to water facilities.
Figure 6.5 Comparison of Access to Water Supply Before and After Community
Forestry and PES were Established
Source: Author's survey; 2015; n = 200
The expense for water utilities is relatively small at around $3 per household
per month. However, although some households may have been able to pay this
expense before they became community forest farmers, the lack of availability of
water infrastructure in the past has limited their access to private piped water.
Before 2005, only certain households had access to piped water utilities in their
house. The water was delivered using privately owned water pumps from the river.

140
Currently, the government supports water access for the whole village by providing
piped water infrastructure, although payment is still required for maintenance
purposes. Although the data shows there is increased access to water supplies before
and after the programs were established, access was not entirely as a result of the
Community Forestry and PES programs. At the least, it can be said that the
programs supported the forest farmer households' ability to pay their monthly water
bill.
Energy for Cooking
Energy used for cooking has also changed considerably since the
Community Forestry and PES programs were established. Prior to Community
Forestry, all respondents used wood for cooking. This was not only because wood
could be obtained easily and freely (albeit illegally) from the forest, but also because
use of other sources of energy for cooking, such as oil, gas and electricity, was more
expensive.
After the Community Forestry and PES programs were established, only
34% of survey respondents still used wood for cooking. The vast majority now cook
with gas (65%), and 1% use oil. This shift indicates that people’s economic situation
has improved and that cooking with alternative sources of energy is now affordable.
The average expenditure reported by forest farmer households on energy –
including gas or oil for cooking, fuel for motorbikes, and electricity – is US$29 per
household per month (survey data, 2015).
141
Figure 6.6 Comparison of Energy Used for Cooking Before and After Community
Forestry and PES were Established
Source: Author's survey; 2015; n = 200
Transportation
Ownership of motorised transportation, such as motorbikes and cars, is also
considered a welfare indicator. Before the Community Forestry and PES programs
were established, most survey respondents (88%) did not have private motorised
transportation. About 10% owned a bicycle, and only two percent had a motorbike.
The current situation is much improved. Most survey respondents (69%) have
motorbikes for transportation, which they use to access the community forest.
Around 14% of survey respondents use bicycles, and 3% now own a car. The other
14% of survey respondents do not have any private transportation. However, this
group uses public transport instead; and they are able to afford fare payments. This
finding indicates that Community Forestry and PES has contributed to improving
welfare conditions in terms of transportation for villagers.
Figure 6.7 Comparison of Transport Ownership Before and After Community
Forestry and PES were Established
Source: Author's survey; 2015; n = 200
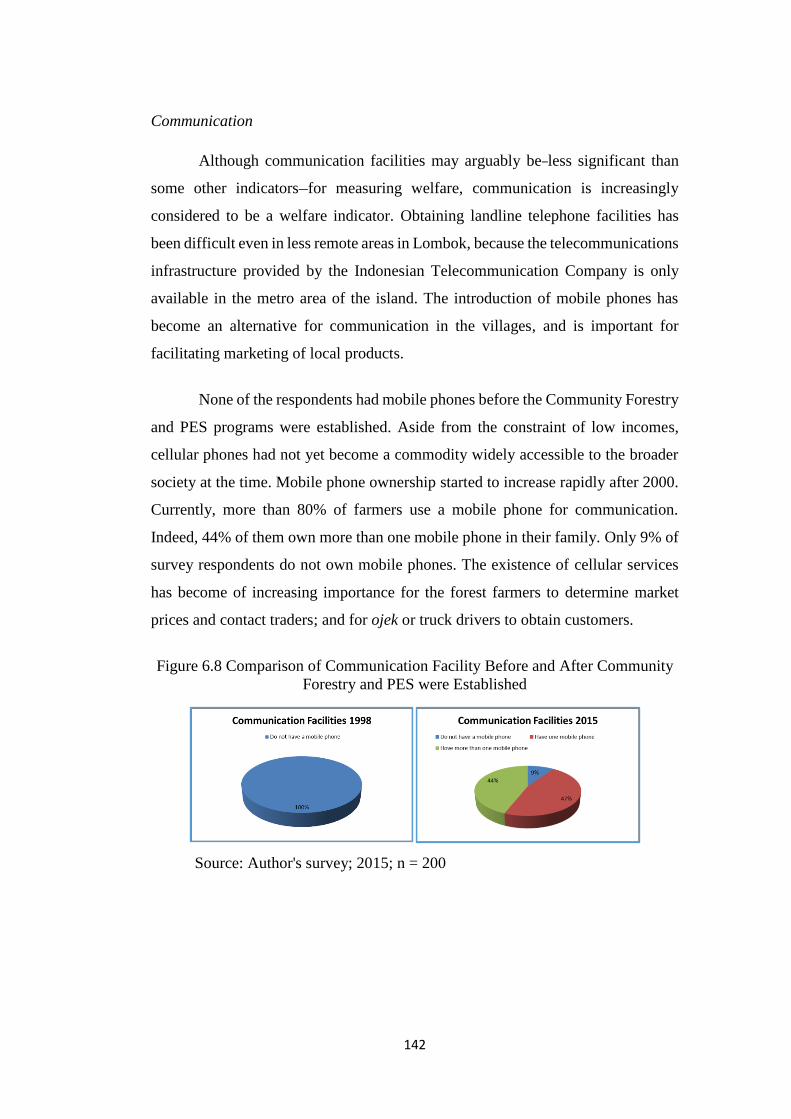
142
Communication
Although communication facilities may arguably be less significant than
some other indicators for measuring welfare, communication is increasingly
considered to be a welfare indicator. Obtaining landline telephone facilities has
been difficult even in less remote areas in Lombok, because the telecommunications
infrastructure provided by the Indonesian Telecommunication Company is only
available in the metro area of the island. The introduction of mobile phones has
become an alternative for communication in the villages, and is important for
facilitating marketing of local products.
None of the respondents had mobile phones before the Community Forestry
and PES programs were established. Aside from the constraint of low incomes,
cellular phones had not yet become a commodity widely accessible to the broader
society at the time. Mobile phone ownership started to increase rapidly after 2000.
Currently, more than 80% of farmers use a mobile phone for communication.
Indeed, 44% of them own more than one mobile phone in their family. Only 9% of
survey respondents do not own mobile phones. The existence of cellular services
has become of increasing importance for the forest farmers to determine market
prices and contact traders; and for ojek or truck drivers to obtain customers.
Figure 6.8 Comparison of Communication Facility Before and After Community
Forestry and PES were Established
Source: Author's survey; 2015; n = 200

143
Education Level
Another social economic indicator for measuring welfare is the improved
education level in the Sesaot village households. The education level of villagers
ranges from primary school level to undergraduate. There has been a major change
in the level of education in the villages after the Community Forestry and PES
programs were established. Before Community Forestry, the average education
level in the villages was junior high school. Currently, many families are able to
send their children to study up to university level, incurring costs of around Rp 15
million (US$ 1200) for the annual tuition fee at undergraduate level; a capacity
which was very rare to find in the era before Community Forestry was established.
Figure 6.9 Comparison of Education Level Before and After Community Forestry
and PES were Established
Source: Author's survey; 2015; n = 200
Health services
Access to health services is recognized as an important indicator of welfare
in any society. In Indonesia, a more prosperous household will tend to go to a
private doctor when they have a health problem, while the least prosperous
households depend upon village health centres (Puskesmas) for health services.
Access to health services is much improved after the introduction of
Community Forestry. The majority of villagers used to go to the Puskesmas – which
offers only basic health services – when they experienced a health problem.
Currently villagers tend to visit a doctor in the city, although this is much more
expensive compared to Puskesmas. The average annual (2015) payment for health
services in the villages is Rp 727,750.00 (US$55.26), which is 2.26% of the annual

144
total expenditure for forest farmer households (survey data, 2015). Unfortunately,
comparison data for health costs in the village in 1998 are not available.
6.4. Conclusion
Although many factors influence poverty reduction in Indonesia, I argue
that the Community Forestry program in West Lombok, and to a lesser extent (to
date) the PES program, has been able to help villagers escape from poverty. Data
from the West Nusa Tenggara Province confirm that the poverty rate in the region
decreased from 27.75% to 17.24% during and after the establishment of
Community Forestry and the PES program (BPS, 2014). The main benefit of
Community Forestry has been felt by people who were previously landless and
mainly poor. This program provides access to land for this group of people. The
program also provides a source of income that derives largely from non-timber
forest production, such as fruit and other tree crops. Socio-economic benefits have
also been enjoyed indirectly by people who do not work as forest farmers, but who
work in other sectors related to the Community Forestry program, including as
traders, drivers, processed food producers and labourers.
Socio-economic conditions, such as housing conditions, transportation and
communication facilities, and access to health services indicate that there are
significant positive outcomes from the Community Forestry program in these areas.
For instance, as mentioned by an NGO officer who works in the village, “Now,
more people have motorcycles compared to the situation before Community
Forestry was established. Other evidence is the improvement in education and
health levels. There has been a significant change in people’s education and health
after they became community forest farmers” (TN, NGO officer, interview,
13/6/2014). Another NGO officer explained, “so far, Community Forestry is still
the best option for poverty alleviation programs for rural communities who live
near a forest” (BS, NGO officer, interview, 11/6/2014).
In contrast, the PES program that has been integrated with the Community
Forestry program has not yet contributed substantively to poverty alleviation,
largely because the benefits that the farmers obtain is in the form of MPTS seeds
145
that need years to produce yields. Thus the impact of the PES program in Lombok
on poverty alleviation cannot be evaluated in the short-term. Instead, PES providers
may be expected to enjoy the economic benefit from PES in Lombok in the
medium-term future, after the seeds obtained through the PES program have grown
and produced yields.
The immediate economic benefit of the PES program for the ecosystem
service providers is equal to the market value of the seed stock itself. The planting
wage, which should arguably be another immediate economic benefit, has mainly
been re-allocated to buy more seeds; to enable more MPTS trees to be planted in
anticipation of greater economic benefit in the future. In summary, Community
Forestry and PES can be beneficial for improvement of socio-economic conditions
in forest villages, once the programs have become fully established. To achieve the
goals of improved socio-economic conditions, these programs should be adjusted
to the specific needs of the local community. The empirical evidence confirms that
by accommodating local needs, integrated PES and Community Forestry programs
can be used as a tool for improvement of socio-economic conditions, and
particularly for poverty alleviation in the long term.

146
Chapter 7
Statistical Analysis of Community Forestry and PES Impact on
Forest Conservation and Socio-Economic Conditions
This chapter presents a statistical analysis that was conducted to capture the
magnitude of the relationship between Community Forestry, PES, and socio-
economic conditions as well as forest conservation. This analysis aims to help
answer the main research questions that have been addressed through qualitative
methods in the previous chapters. The aim is to provide additional empirical
evidence to support or refute the research findings that were produced from the
qualitative analysis. Use of an approach that combines both quantitative and
qualitative analysis is expected to reduce any potential risks associated with use of
solely quantitative or qualitative methods, by providing a more comprehensive
evaluation and wider range of evidence (Rao, Vijayendra and Woolcock, 2003;
Creswell and Plano-Clark, 2006).
As discussed in the previous chapters of this thesis, Community Forestry
and Payment for Ecosystem Services (PES) programs have been introduced in
Sesaot Forest in Lombok. The focus of these programs is to support conservation
of the Sesaot Forest, together with improvement of socio-economic conditions of
villagers in the surrounding community who work as forest farmers. To
complement the qualitative analysis, this chapter will analyze the impact of the
Community Forestry and PES programs on socio-economic conditions and forest
conservation through a statistical analysis. The structure of this chapter is as
follows. Section 7.1 covers data sources and their classification. Regression model
development for this quantitative analysis is the focus of section 7.2, followed by
discussion about the regression process in section 7.3. Section 7.4 provides an
account of the limitations of this analysis. Finally, section 7.5 concludes this
chapter.

147
7.1. Data Sources and Classification
The Ordinary Least Square (OLS) regression method was used in this
econometric analysis, due to its powerful capability to accommodate some dummy
variables and categorical variables that exist in this analysis (Craven and Islam,
2011). The OLS was used rather than other regression techniques because OLS is
the simplest of the regression tests, and was suitable for answering the hypotheses
that were investigated. The aims of this econometric analysis are to test if:
1. The Community Forestry program influenced forest conservation and socio-
economic conditions.
2. The Payment for Ecosystem Services (PES) program influenced forest
conservation and socio-economic conditions.
Some other variables that may have influenced forest conservation and socio-
economic conditions were considered as control variables in the regression models.
These include adat practices in community forest management, property rights of
the forest farmer upon the community forest land, and community forest land size.
Given the similarity of independent variables in both models, seemingly
unrelated regression (SUR) techniques (Fiebig, 2001; Moon and Perron, 2006) are
also used by incorporating the best models defined by the OLS estimation result. In
addition, the SUR regression method is used in consideration of the possibility of a
correlation between the error term in both conservation and socio-economic
models.
Data for the econometric analysis were primary data that were collected
through household surveys involving 200 respondents. All of the respondents are
forest farmers who managed the Sesaot community forest in Lombok. The
respondents were categorized into two groups, those who were enrolled in the PES
program and those who were not enrolled. The data used are described in Table
7.1.
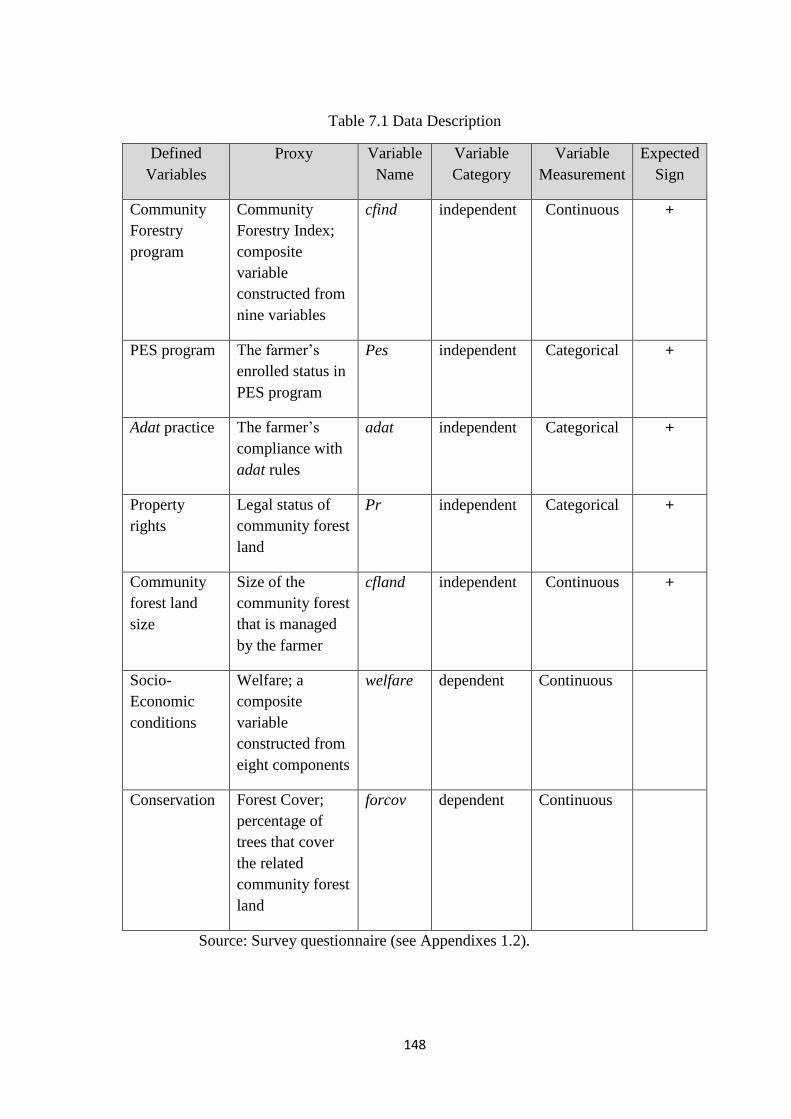
148
Table 7.1 Data Description
Defined
Variables
Proxy Variable
Name
Variable
Category
Variable
Measurement
Expected
Sign
Community
Forestry
program
Community
Forestry Index;
composite
variable
constructed from
nine variables
cfind independent Continuous +
PES program The farmer’s
enrolled status in
PES program
Pes independent Categorical +
Adat practice The farmer’s
compliance with
adat rules
adat independent Categorical +
Property
rights
Legal status of
community forest
land
Pr independent Categorical +
Community
forest land
size
Size of the
community forest
that is managed
by the farmer
cfland independent Continuous +
Socio-
Economic
conditions
Welfare; a
composite
variable
constructed from
eight components
welfare dependent Continuous
Conservation Forest Cover;
percentage of
trees that cover
the related
community forest
land
forcov dependent Continuous
Source: Survey questionnaire (see Appendixes 1.2).

149
7.1.1. Community Forestry Index
The Community Forestry index variable was developed following Samad
(2012). Samad (2012) conducted a study on the effectiveness of the Community
Forestry program in Sesaot community forest in Indonesia. She employed three
aspects to measure the effectiveness of the Community Forestry program, namely
land governance, institutional governance and business governance. Each aspect
contained four indicators, which were then combined into a single variable to
measure the effectiveness of the Community Forestry program (see Table 7.2).
Table 7.2 Community Forestry Effectiveness Indicators
Aspect Indicators
Land governance - land size
- plantation composition
- land management skill
- ecological function of the land
Institutional governance - organization pattern
- organization management
- organization independency
- organization cooperation
Business governance - product volume
- product variation
- marketing pattern
- income generation
Source : Samad (2012).
In this thesis, the indicators used by Samad (2012) were modified into eight
indicators to suit the case study conditions. These include: community forest land
size; forest farmers’ capacity to manage the community forest land; Community
Forest Farmer Group (CFFG) accommodation of the forest farmers’ interests; the
activeness of the forest farmers measured by attendance at the CFFG meetings; the
ability of CFFG to solve the forest farmers’ problems; support from NGOs and
governments; stability of the products volume; and stability of the products price
(see Appendix 1.2 question B28). Each indicator was measured on a five Likert
scale (McIver et al., 1994). All the indicators’ scores were thus compounded into a

150
single number as a composite variable using the weighted average method (Nardo
et al., 2005). The highest the index, the better the community forest condition.
7.1.2. Payment for Ecosystem Service Program
Several studies were conducted to measure the impact of the PES programs
on forest conservation and improvement of socio-economic conditions, in particular
for poverty alleviation. As mentioned in Chapters 5 and 6, the PES program was
introduced as an incentive for forest dependent communities to guard and manage
the forest to achieve a sustainable outcome (Wunder, 2005; Pagiola, 2006). At the
same time, PES aims to benefit the poor forest farmers (Duncan, 2006; Pagiola et
al., 2007; Wunder, 2008).
In this thesis, the involvement of the community forest farmers in the PES
program introduced in Sesaot Forest is used as a variable to measure the impact of
the PES program on forest conservation, as well as its implication for the welfare
of forest farmers’ households. Since the enrollment status of the community forest
farmers in the PES program was only categorized into two categories – enrolled
and not enrolled – a dummy variable (Hill et al., 2008, p. 167) was employed to
accommodate this situation. Respondents who were enrolled in PES were coded as
1, and those who were not enrolled were coded as 0 (see Appendix 1.2 question
C1).
7.1.3. Adat/Local institutions
Ostrom (1990, p. 58) suggested that local users of a common resource often
use their own rules and norms to control the use of their common resources. They
may modify their local customary rules over time, based on their past experience
and knowledge in governing these common resources. The employment of local
institutions for norm enforcement has been observed to produce more sustainable
outcomes (Agrawal, 1996), as in the case of irrigation systems in Nepal (Lam, 1999;
Ostrom et al., 1999).

151
Following previous literature, this thesis uses adat practice in Community
Forestry management as a proxy for local institutions that could influence the
sustainable outcome of community forest management, for both conservation and
improvement of socio-economic conditions. The forest farmers were asked about
the extent to which they obey and practice adat rules in governing their community
forest land. The question was designed with a five Likert scale response set to
capture the forest farmers' experience. The more the respondents obey the adat rule,
the highest the score (see Appendix 1.2 question B23).
7.1.4. Property Rights
A previous study conducted by Beyene and Koch (2013) used land tenure
security as a proxy for property rights, to examine the relationship between property
rights, the strength of local institutions, and household preferences for fuelwood
sources in rural Ethiopia. They found that property rights influenced the choice of
fuelwood collection source. In the absence of clearly defined communal property
rights over the natural forest, households prefer to collect fuelwood from the open
access natural forest, which in turn contributes to forest degradation. An assumption
of property right recognition through land tenure security is that changing the status
of natural forest into community forest will lead households to avoid collecting
fuelwood from the community forest that they manage (Beyene and Koch, 2013).
However, this may deflect firewood collection and forest degradation to protected
areas unless sustainable use practices are introduced within the community forest.
Another study also conducted in Ethiopia by Mekonnen (2009) found that tenure
security, which reflects recognition of property rights56, has a significant positive
impact on tree growth in Ethiopian forests.
Another study conducted by Agrawal (2007) suggested that when local
communities were granted property rights to manage forests by the state, they tend
to govern the forest more effectively. In contrast, Gibson et al. (2002) found that in
56 Lands including forests in Ethiopia are owned by the state. The rural households only hold user-
rights to land, with a periodical land-redistribution among villagers. The land cannot be sold,
mortgaged, or exchanged. Villagers are only granted rights to work on the land, with an obligation
to plant trees; which will determine land re-distribution (Mekonnen, 2009; Beyene and Koch, 2013).

152
Guatemala, property rights were a less important factor in determining the quality
of forest management. Following these studies, this thesis considers land tenure
security, as reflected by the possession of a legal permit for the community forest
land, as a proxy for property rights. Since there are only two statuses of the
community forest: permit granted and not granted, a dummy variable was used to
capture this condition (Hill et al., 2008, p. 167). Respondents who have been
granted legal permission to manage the community forest were coded as 1, and
those who have not been granted were coded as 0 (see Appendix 1.2 question B3).
7.1.5. Community Forest Land Size
Land size is often considered as a factor that influences agricultural
outcomes (Rao, Vaman and Chotigeat, 1981; Cornia, 1985). A study by Cornia
(1985) analyzed the relationship between factor inputs, land yields and labor
productivity for farms of different land sizes in 15 developing countries.
Interestingly, she found that in 80% of the countries, there was a strong negative
correlation between farm size and factor inputs and yields per hectare of agricultural
land. However, Rao, Vaman and Chotigeat (1981) found a positive relation between
land size and productivity for the agricultural sector in India. In this thesis, the size
of community forest land, measured in hectares, is considered as one aspect that
could influence forest farmers’ welfare. Community Forestry land size refers to the
size of the community forest land that is managed by a forest farmer. Respondents
were asked about the size of the community forest that they managed (see Appendix
1.2 question B4). The value, which is a continuous number, is then transposed into
a logarithm to improve the goodness of fit and to make the variable more normally
distributed (Keene, 1995; Lütkepohl and Xu, 2012).
7.1.6. Welfare Measure as Proxy for Socio-Economic Conditions
Welfare improvement of the forest farmers who manage the community
forest is considered as a proxy for the improvement in socio-economic conditions.
The welfare variable is a composite variable constructed from seven components
which are the physical living standards as defined and reported yearly by the
Indonesian statistics agency (Riyadi et al., 2015). This data is collected through

153
surveys, including the national social economic survey and the national workforce
survey. The publication reports several measurable aspects of human welfare,
including health and nutrition, education, employment, consumption level and
patterns, housing and environment, poverty, and other social aspects (Riyadi et al.,
2015).
Following the Indonesian welfare indicators, this thesis considers seven
aspects to measure the socio-economic conditions of the forest farmers in Sesaot
community forest. These aspects include house ownership, house condition,
electricity supply, water supply, energy for cooking, transportation and
telecommunication facilities (see Appendix 1.2 Part D for detailed survey
questions). Scores for these aspects were compounded into a single number as a
welfare index variable, using the weighted average method (Nardo et al., 2005).
The highest the score, the better the welfare condition.
7.1.7. Forest Cover
Forest cover data is often used to measure the impact of a conservation
program. A study conducted by Calvo-Alvarado et al. (2009) uses forest cover
change to measure the social dynamics of deforestation and forest restoration
processes in Guanacaste, Costa Rica. Another study conducted by Daniels et al.
(2010) in Costa Rica measures the ecological impact of a PES program. The latter
authors used forest cover as a proxy for forest-based ecosystem services. That study
found that the PES program in Costa Rica contributed significantly to the
restoration of degraded lands.
In this thesis, forest cover is considered as the proxy for conservation
outcomes. The forest cover data was primary data generated from a survey of forest
farmers. Forest farmers were asked about the names of the tree species and their
number that are grown in their community forest land (see Appendix 1.2 question
B8). As a guide to assessing optimum forest cover in a particular land area, a
measure suggested by the Indonesian forest agency is used. The Indonesian forest
agency determines that there should be 400 trees planted in one hectare of forest

154
land, with a planting distance of five by five meters, to generate 100 percent forest
cover (Hendri, 2008).
7.2. Regression Model
The regression models were developed in two variations based on the
research objectives: a model for conservation and a model for socio-economic
conditions.
7.2.1. Model for Conservation
The success of the conservation goal of the Community Forestry and PES
programs in this study is measured by the extent of forest cover. The higher the
forest cover, the better the conservation outcome from forest management. Forest
cover is hypothesized to be influenced by the Community Forestry index, property
rights, forest farmer involvement in the PES program, and farmer’s reported
compliance with adat rules and the size of community forest land. This pattern of
associations is statistically estimated using the following regression:
forcov = β0 + β1cfind+ β2pr, + β3 pes+ β4adat+ β5lgcfland + ε (1.1)
where forcov refers to forest cover, cfind refers to Community Forestry index, pr
refers to property rights, pes refers to PES program, adat refers to adat rules,
lgcfland refers to community forest land size, ε refers to error term that represent
other factors that influence the dependent variable that are not included in this
model, and β0, β1, β2, β3, β4 and β5 refer to regression coefficient or the parameters
of the econometric model.
The expected influence of each independent variable on the dependent variable is
as follows:
1. Influence of Community Forestry index on forest cover
A high Community Forestry index indicates that the farmer practices community
forest management properly. It was hypothesized that the higher the Community
Forestry index, the more trees are planted, thus the higher the forest cover.

155
2. Influence of property rights on forest cover
Security of property rights could be an incentive for the farmer to manage the
forestland better and plant more trees. Thus property rights could positively
influence the forest cover.
3. Influence of PES on forest cover
The PES program provides seeds to be planted in the community forestland. It is
hypothesized that the involvement of forest farmers in the PES program will
increase forest cover.
4. Influence of adat on forest cover
Adat rules are used by the community forest farmer group to regulate the ways in
which the forest farmers manage the community forests. Adat regulations follow
the Ministry of Forestry's requirement that community forest lands have to be
managed properly by maintaining a specified ratio of plantation between endemic
trees and crops. In addition, adat rules prohibit farmers from logging trees in the
community forest. It is thus hypothesized that the more the forest farmers comply
with adat regulations, the higher the forest cover would be on their forestland.
5. Influence of community forest land size and forest cover
The larger the community forest land, the wider the area that forest farmers are able
to plant, thus the greater the proportion of forest cover. Community forest land size
is hypothesized to positively influence forest cover.
7.2.2. Model for Socio-Economic Conditions
As explained above, the welfare index is used as proxy for socio-economic
conditions. The welfare of community forest farmers was hypothesized to be
influenced by the Community Forestry index, the property rights of the forest
farmer over the community forest, farmer involvement in the PES program, farmer
compliance with adat rules, and community forest land size. Thus the regression
model for this situation is as follows:
welfare = β0 + β1cfind + β2pr + β3pes+ β4adat + β5lgcfland + ε (2)
where welfare refers to welfare growth as proxy for socio-economic conditions,
cfind refers to Community Forestry index, pr refers to property rights, pes refers to

156
the PES program, adat refers to adat rules, lgcfland refers to community forest
land size, ε refers to error term representing other factors that influence the
dependent variable that are not included in this model, and β0, β1, β2, β3, β4 and β5
refer to regression coefficient or the parameters of the econometric model.
The dependent variable in this model is welfare growth. This variable
measures the growth of the forest farmer’s welfare during two periods of time:
before the Community Forestry program was introduced in 1998; and after the
program had been well established in 2015. The expected influence of each
independent variable on the dependent variable in this model is as follows:
1. Influence of community forest index on welfare
The Community Forestry index refers to an index of Community Forestry
management practices that are applied by the forest farmers. This index is
constructed from nine factors that form three groups of governance indicators of
Community Forestry as described in section 7.1.1. The factors include land
governance, institutional governance and business governance. A high index
indicates a better Community Forestry practice, which will potentially lead to better
socio-economic outcomes, and thus higher welfare growth.
2. Influence of property rights on welfare
Farmers’ property rights, which are indicated by the legal status of the Community
Forestry land, will assure their security of land access. The survey conducted for
this thesis indicates that the more secure the access, the better the outcome for
farmers’ incomes and economic livelihood. More secure property rights could
impact positively on welfare growth.
3. Influence of PES on welfare
Farmer involvement in the PES program will generate economic benefits, since the
PES program provides cash that is used by the farmers’ group to buy multi-purpose
tree species (MPTS) seeds to be planted in the community forest land. The value of
the seeds could be an immediate economic benefit of the PES program. Further, the
yield produced by the MPTS will be the primary economic benefit for the farmer
in the future. Thus, involvement in the PES program is estimated to increase
welfare.

157
4. Influence of adat on welfare
Failure to follow adat rules may cause the forest farmers to lose their rights to
manage the community forest. They would then suffer economic disadvantage,
since income from the community forest would be decreased as well. Surveys for
this project indicate that farmers who follow adat rules believe they will be granted
secure rights to manage the community forest, thus ensuring their economic benefit
from the community forest. It is therefore hypothesized that if the farmers comply
with adat, welfare will improve.
5. Influence of Community Forestry land size on welfare
Community Forestry land size was estimated to influence welfare growth in regard
to the ability of the households to obtain money by farming on the community forest
land. It was assumed that the larger the land size per household, the more money
the household can obtain, thus the greater the improvement in welfare.
7.3. Regression Process
Several regression models were constructed in this analysis. The first model
includes all independent variables that are hypothesized to influence the dependent
variable. The estimation result of the first model determines whether the model is
the best model or not. To produce the best model, any insignificant variable as a
result of the regression was excluded from the model. After including only
significant variables, the model was tested again. The process was repeated until all
independent variables significantly influence the dependent variable. The criteria
for the best model is that all independent variables significantly influence the
variation of the dependent variable; that there is a high and significant value of F-
statistics; and that there is a high value of adjusted R2.
As mentioned above, this study employs the ordinary least square (OLS)
regression techniques on each model followed by seemingly unrelated regression
(SUR) techniques that combines both models.

158
7.3.1. Ordinary Least Square Regression Analysis
7.3.1.1. Model for Conservation
As mentioned previously, the model for conservation is as follows:
forcov = β0 + β1cfind+ β2pr, + β3 pes+ β4adat + β5lgcfland + ε (1.1)
Descriptive statistics for this model is presented in Table 7.3.
Table 7. 3 Descripive Statistics of Model 1.1
Variable Observation Mean Standard
Deviation
Minimum Maximum
forcov 200 0.65 0.41 0.09 2.51
cfind 200 4.45 0.69 2.59 6.12
pr 200 0.34 0.47 0 1
pes 200 0.49 0.50 0 1
adat 200 3.91 0.59 3 5
lgcfland 200 -0.37 0.25 -1 0.65
Source: Appendix 7.1
The OLS regression result for the above model is:
𝑓𝑜𝑟𝑐𝑜𝑣̂ = −0.277 + 0.071𝑐𝑓𝑖𝑛𝑑 + 0.154𝑝𝑟 − 0.021𝑝𝑒𝑠 + 0.116𝑎𝑑𝑎𝑡 − 0.297𝑙𝑔𝑐𝑓𝑙𝑎𝑛𝑑
(-1.12) (1.69)* (2.33)** ( -0.37) (2.41)** (-2.57)**
F = 5.69***
Adj R2 = 0.1053
Numbers in the bracket is t statistics
* significant at α 10%
** significant at α 5%
*** significant at α 1%
The OLS result for model 1.1 estimates that all independent variables except
PES significantly influenced the forest cover which is indicated by the significance
value of t statistic, with confidence intervals of 95% and 90%. All of the
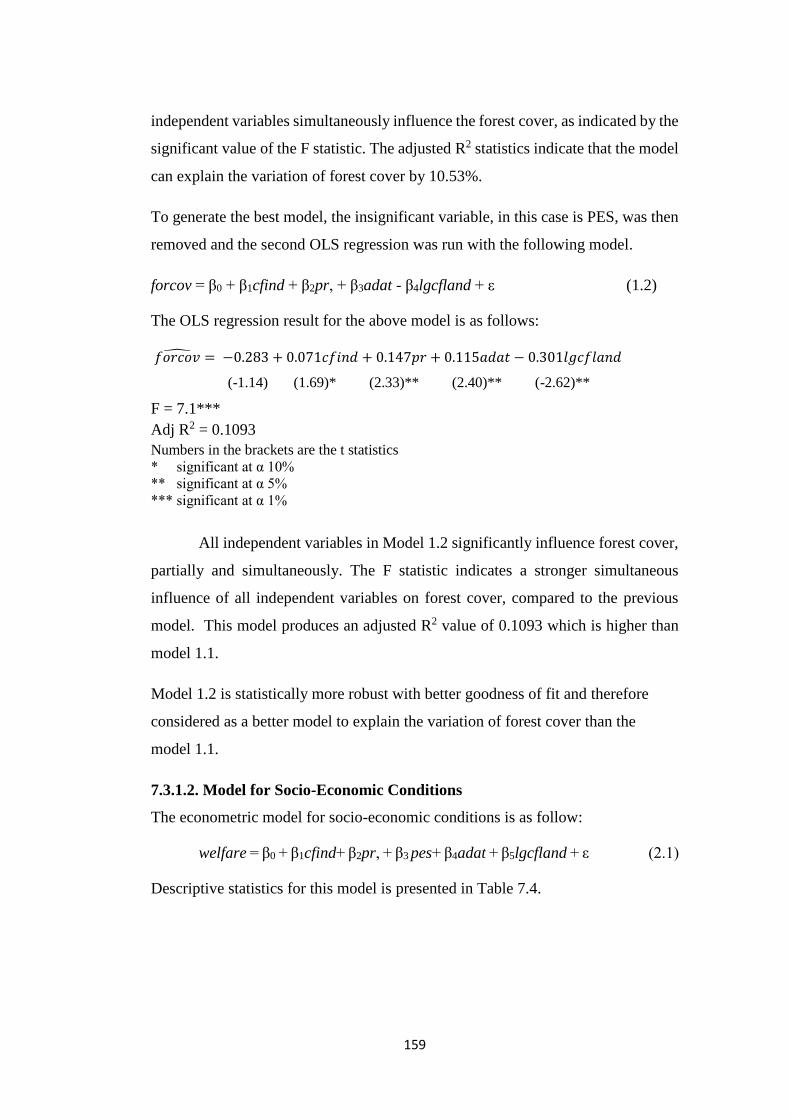
159
independent variables simultaneously influence the forest cover, as indicated by the
significant value of the F statistic. The adjusted R2 statistics indicate that the model
can explain the variation of forest cover by 10.53%.
To generate the best model, the insignificant variable, in this case is PES, was then
removed and the second OLS regression was run with the following model.
forcov = β0 + β1cfind + β2pr, + β3adat - β4lgcfland + ε (1.2)
The OLS regression result for the above model is as follows:
𝑓𝑜𝑟𝑐𝑜𝑣̂ = −0.283 + 0.071𝑐𝑓𝑖𝑛𝑑 + 0.147𝑝𝑟 + 0.115𝑎𝑑𝑎𝑡 − 0.301𝑙𝑔𝑐𝑓𝑙𝑎𝑛𝑑
(-1.14) (1.69)* (2.33)** (2.40)** (-2.62)**
F = 7.1***
Adj R2 = 0.1093
Numbers in the brackets are the t statistics
* significant at α 10%
** significant at α 5%
*** significant at α 1%
All independent variables in Model 1.2 significantly influence forest cover,
partially and simultaneously. The F statistic indicates a stronger simultaneous
influence of all independent variables on forest cover, compared to the previous
model. This model produces an adjusted R2 value of 0.1093 which is higher than
model 1.1.
Model 1.2 is statistically more robust with better goodness of fit and therefore
considered as a better model to explain the variation of forest cover than the
model 1.1.
7.3.1.2. Model for Socio-Economic Conditions
The econometric model for socio-economic conditions is as follow:
welfare = β0 + β1cfind+ β2pr, + β3 pes+ β4adat + β5lgcfland + ε (2.1)
Descriptive statistics for this model is presented in Table 7.4.

160
Table 7.4 Descriptive Statistics of Model 2.1
Variable Observation Mean Standard
Deviation
Minimum Maximum
welfare 200 44.71 16.05 3.08 71.26
cfind 200 4.45 0.69 2.59 6.12
pr 200 0.34 0.47 0 1
pes 200 0.49 0.50 0 1
adat 200 3.91 0.59 3 5
lgcfland 200 -0.37 0.25 -1 0.65
Source: Appendix 7.1
The OLS regression result for this model is as follows:
𝑤𝑒𝑙𝑓𝑎𝑟𝑒̂ = 23.516 + 2.112𝑐𝑓𝑖𝑛𝑑 + 15.098𝑝𝑟 + 1.248𝑝𝑒𝑠 + 2.753𝑎𝑑𝑎𝑡 + 12.618𝑙𝑔𝑐𝑓𝑙𝑎𝑛𝑑
(2.59)** (1.37) (6.22)*** (0.59) (1.55) (2.98)**
F = 12.21***
Adj R2 = 0.2198
Numbers in the brackets are t statistics
* significant at α 10%
** significant at α 5%
*** significant at α 1%
The OLS regression result for model 2.1 shows that only two independent variables
–property rights and community forestland size– significantly influence welfare,
which is indicated by the significance value of t statistic with confidence intervals
of 99% and 95% respectively. Meanwhile, PES and adat do not significantly
influence welfare. This model produces an F statistic of 12.21 with 99% of
confidence interval that indicates a simultaneous significant influence of all
independent variables on welfare. This model produces an R2 value of 0.2198 that
indicates the ability of this model to explain the variation of welfare by 21.98%.
The next regression removes the PES variable due to its smallest probability to
influence the welfare.
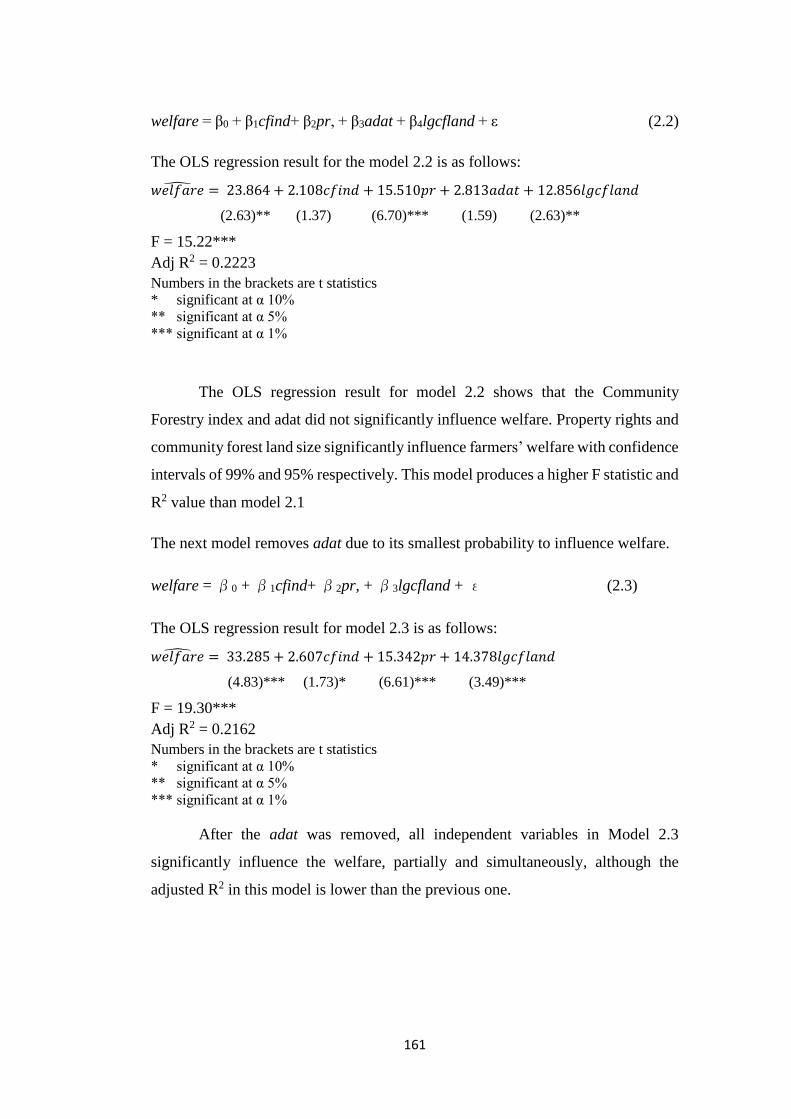
161
welfare = β0 + β1cfind+ β2pr, + β3adat + β4lgcfland + ε (2.2)
The OLS regression result for the model 2.2 is as follows:
𝑤𝑒𝑙𝑓𝑎𝑟𝑒̂ = 23.864 + 2.108𝑐𝑓𝑖𝑛𝑑 + 15.510𝑝𝑟 + 2.813𝑎𝑑𝑎𝑡 + 12.856𝑙𝑔𝑐𝑓𝑙𝑎𝑛𝑑
(2.63)** (1.37) (6.70)*** (1.59) (2.63)**
F = 15.22***
Adj R2 = 0.2223
Numbers in the brackets are t statistics
* significant at α 10%
** significant at α 5%
*** significant at α 1%
The OLS regression result for model 2.2 shows that the Community
Forestry index and adat did not significantly influence welfare. Property rights and
community forest land size significantly influence farmers’ welfare with confidence
intervals of 99% and 95% respectively. This model produces a higher F statistic and
R2 value than model 2.1
The next model removes adat due to its smallest probability to influence welfare.
welfare = β0 + β1cfind+ β2pr, + β3lgcfland + ε (2.3)
The OLS regression result for model 2.3 is as follows:
𝑤𝑒𝑙𝑓𝑎𝑟𝑒̂ = 33.285 + 2.607𝑐𝑓𝑖𝑛𝑑 + 15.342𝑝𝑟 + 14.378𝑙𝑔𝑐𝑓𝑙𝑎𝑛𝑑
(4.83)*** (1.73)* (6.61)*** (3.49)***
F = 19.30***
Adj R2 = 0.2162
Numbers in the brackets are t statistics
* significant at α 10%
** significant at α 5%
*** significant at α 1%
After the adat was removed, all independent variables in Model 2.3
significantly influence the welfare, partially and simultaneously, although the
adjusted R2 in this model is lower than the previous one.

162
7.3.2. Seemingly Unrelated Regression (SUR)
The next step is to conduct the seemingly unrelated regression (SUR). At the first
run of SUR, the original models (model 1.1 and model 2.1) were used to compare
the results to the best model (model 1.2 and model 2.3).
The result of the SUR for each model is as follows:
7.3.2.1. SUR for the Original Model of Conservation
𝑓𝑜𝑟𝑐𝑜𝑣̂ = −0.277 + 0.071𝑐𝑓𝑖𝑛𝑑 + 0.154𝑝𝑟 − 0.021𝑝𝑒𝑠 + 0.116𝑎𝑑𝑎𝑡 − 0.297𝑙𝑔𝑐𝑓𝑙𝑎𝑛𝑑
(-1.13) (1.71)* (2.36)** ( -0.37) (2.45)** (-2.61)**
F = 29.30***
R2 = 0.1278
Numbers in the brackets are t statistics
* significant at α 10%
** significant at α 5%
*** significant at α 1%
The result of SUR analysis for the original model of conservation is similar
to the OLS regression. However, SUR produces higher F-statistics that indicates a
more robust estimation than the OLS regression.
7.3.2.2. SUR for the Original Model of Socio-Economic Conditions
𝑤𝑒𝑙𝑓𝑎𝑟𝑒̂ = 23.516 + 2.112𝑐𝑓𝑖𝑛𝑑 + 15.090𝑝𝑟 + 1.248𝑝𝑒𝑠 + 2.753𝑎𝑑𝑎𝑡 + 12.618𝑙𝑔𝑐𝑓𝑙𝑎𝑛𝑑
(2.62)** (1.39) (6.32)*** (0.60) (1.58) (3.02)**
F = 62.93***
R2 = 0.2394
Numbers in the brackets are t statistics
* significant at α 10%
** significant at α 5%
*** significant at α 1%
Compared to the OLS regression, the SUR analysis for this model produces
higher F-statistics and higher t-statistics in some variables.
7.3.2.3. SUR for the Best Model of Conservation
𝑓𝑜𝑟𝑐𝑜𝑣̂ = −0.293 + 0.070𝑐𝑓𝑖𝑛𝑑 + 0.147𝑝𝑟 + 0.118𝑎𝑑𝑎𝑡 − 0.303𝑙𝑔𝑐𝑓𝑙𝑎𝑛𝑑
(-1.20) (1.70)* (2.36)** (2.50)** (-2.67)**
F = 29.47***
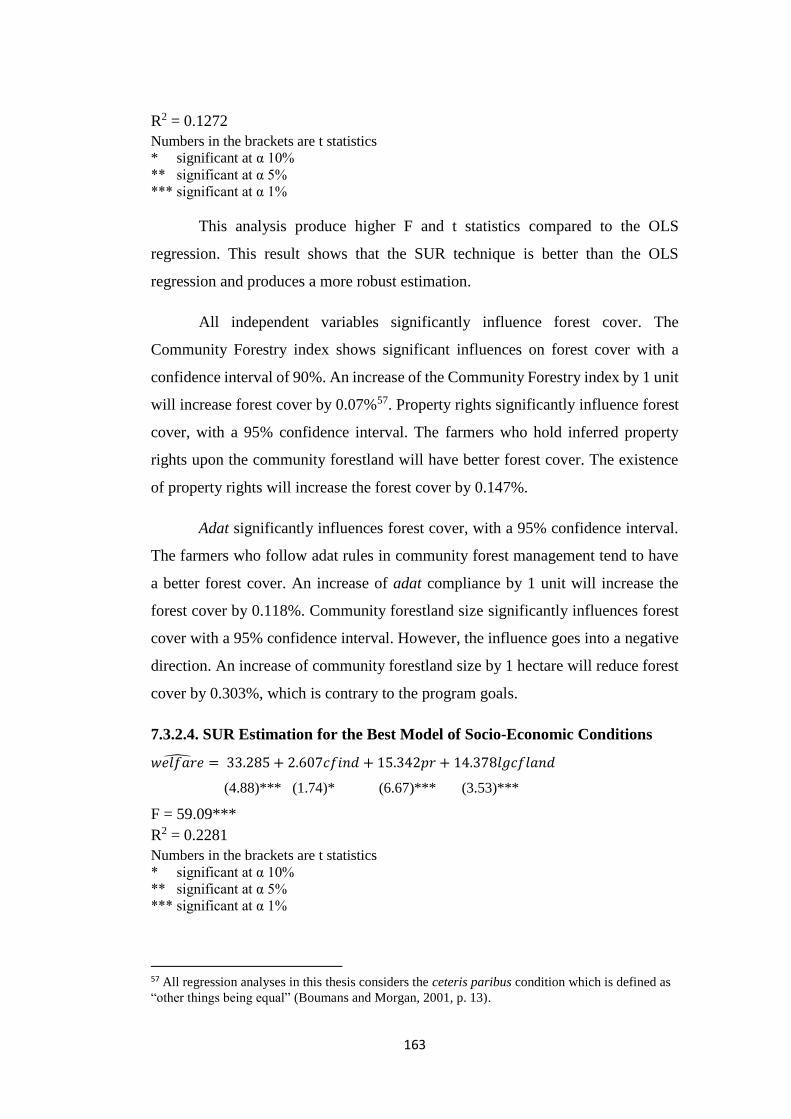
163
R2 = 0.1272
Numbers in the brackets are t statistics
* significant at α 10%
** significant at α 5%
*** significant at α 1%
This analysis produce higher F and t statistics compared to the OLS
regression. This result shows that the SUR technique is better than the OLS
regression and produces a more robust estimation.
All independent variables significantly influence forest cover. The
Community Forestry index shows significant influences on forest cover with a
confidence interval of 90%. An increase of the Community Forestry index by 1 unit
will increase forest cover by 0.07%57. Property rights significantly influence forest
cover, with a 95% confidence interval. The farmers who hold inferred property
rights upon the community forestland will have better forest cover. The existence
of property rights will increase the forest cover by 0.147%.
Adat significantly influences forest cover, with a 95% confidence interval.
The farmers who follow adat rules in community forest management tend to have
a better forest cover. An increase of adat compliance by 1 unit will increase the
forest cover by 0.118%. Community forestland size significantly influences forest
cover with a 95% confidence interval. However, the influence goes into a negative
direction. An increase of community forestland size by 1 hectare will reduce forest
cover by 0.303%, which is contrary to the program goals.
7.3.2.4. SUR Estimation for the Best Model of Socio-Economic Conditions
𝑤𝑒𝑙𝑓𝑎𝑟𝑒̂ = 33.285 + 2.607𝑐𝑓𝑖𝑛𝑑 + 15.342𝑝𝑟 + 14.378𝑙𝑔𝑐𝑓𝑙𝑎𝑛𝑑
(4.88)*** (1.74)* (6.67)*** (3.53)***
F = 59.09***
R2 = 0.2281
Numbers in the brackets are t statistics
* significant at α 10%
** significant at α 5%
*** significant at α 1%
57 All regression analyses in this thesis considers the ceteris paribus condition which is defined as
“other things being equal” (Boumans and Morgan, 2001, p. 13).

164
The SUR analysis for the best model of socio-economic conditions produces
higher F and t statistics compared to the OLS regression technique. Simultaneously,
all of the independent variables significantly influence welfare growth, as indicated
by the F statistic, which holds a value of 59.09 with a confidence interval of 99%.
The R2 value in this model implies that all of the independent variables can explain
the variation of welfare growth by 22.81%.
The Community Forestry index significantly influences welfare growth
with a confidence interval of 90%. An increase of the Community Forestry index
by 1 unit will cause an improvement of welfare growth by 2.6%.
Property rights significantly influence welfare with a confidence interval of
99%. A forest farmer who holds property rights upon community forestland will
have a welfare growth 15.34% higher than those who do not hold property rights.
Similarly, community forestland size significantly influences welfare with
a confidence interval of 99%. The larger the community forest land size, the higher
the welfare growth. An increase of community forestland size by one hectare will
cause an increase of welfare growth by 14.37%.
7.4. Limitation of this study
The quantitative aspects of this study have limitations. The regression
results are not very good in respect to the low R2 statistics. In addition, the number
of observations was limited to only 200 participants. The result would provide
stronger evidence if it accommodated more participants and was conducted in more
than one location.
7.5. Conclusion
Survey evidence suggests that the Community Forestry program has a
positive influence on socio-economic conditions, which is indicated by a positive
relationship between both Community Forestry land size and the Community
Forestry index and welfare improvement of the forest farmers. The larger the land
size, the higher the farmer welfare improvement. Also, the higher the Community
Forestry index, the higher the welfare improvement.

165
The other variable that has had a significant influence on the welfare of the
forest farmers after the establishment of the Community Forestry program is the
expectation of property rights granted to forest farmers upon community forest
land. The forest farmers’ property rights are indicated by the issuance of community
forest land permits. Forest farmers who hold legal permits tend to obtain more
economic benefit than those who have not obtained a legal permit.
Meanwhile, adat rules that are employed in the practice of Community
Forestry does not immediately influence the economic welfare of the forest farmers.
Similarly, the PES program does not yet directly influence the welfare of the forest
farmers.
The Community Forestry program has a positive influence on conservation,
as indicated by the positive relationship between the Community Forestry index
and forest cover. A high Community Forestry index leads to a higher forest cover.
The other factor that contributes to increased forest cover is property rights
of the forest farmer upon community forest land. Forest farmers who have obtained
their property rights, as indicated by holding a legal permit for managing
community forest, tend to foster forest sustainability by planting more trees on the
community forest land.
The employment of adat rules in Community Forestry practice has also
shown a positive influence on forest cover. Forest farmers who report compliance
with adat rules tend to have better forest cover. The more they reportedly obey the
adat rules, the better the forest cover they have.
The community forest land size significantly influences forest cover.
Surprisingly, the relationship is in a negative direction. The larger the land size, the
lower the forest cover. This finding supports the findings from the qualitative
analysis that forest farmers tend to prioritize economic benefits over the
conservation benefit from community forest. They plant more cash crops, such as
coffee, cocoa and banana, rather than conservation trees on their community forest
land.

166
The PES program does not yet demonstrate significant influence on forest
conservation. This is an interesting finding since this condition contradicts PES
theory and the PES program’s goal. This finding will be discussed in the next
chapter, where we consider the results of both the qualitative and quantitative
analysis.

167
Chapter 8
Conclusion and Policy Recommendations
This thesis reviews the development of Community Forestry (CF) and
Payments for Ecosystem Services (PES) programs in Lombok Indonesia and
examines the extent to which these programs impact on forest conservation and
local socio-economic conditions. This study also sought to find out whether local
customary law (adat) can create a positive impact on forest management. An
integrated Community Forestry and PES program in Sesaot Forest in West Lombok
was chosen as the case study location, since this site is one of the pilot Community
Forestry programs in Lombok. By considering the role of these two programs in
forest governance, this case study was designed to contribute to knowledge about
how a common pool resource could be managed to achieve a sustainable outcome.
This study employs a mix of quantitative and qualitative research methods
using an approach that Rao, Vijayendra and Woolcock (2003) called “participatory
econometrics”. It follows three steps in sequence: (1) in-depth interviews were
undertaken with stakeholders; (2) farmer surveys were conducted using instruments
based on the interviews and field visits; (3) hypotheses derived from qualitative
work were then tested using quantitative data. Two rounds of fieldwork were
conducted in the case study location. The first round of fieldwork was done in May–
June 2014, and aimed to collect information related to PES development and
practice through semi-structured interviews with 22 relevant stakeholders including
the PES initiators, a water corporation officer, forest service agency officers, a
regional development plan agency officer, a regional environmental sector officer,
the regional assembly, a Non-Government Organization activist, academics, the
PES program officers, and local community leaders58. The second fieldwork period
58 In Indonesian terms:
- Water corporation : Perusahaan Daerah Air Minum (PDAM)
- Forest service agency : Dinas Kehutanan (Dishut)
- Regional development plan agency : Badan Perencanaan Pembangunan Daerah
(BAPPEDA)
- Local council : Dewan Perwakilan Rakyat Daerah (DPRD)

168
was in January – May 2015, and aimed to clarify data gathered from the first
fieldwork, as well as to collect field data and further information through surveys
with 200 forest farmer households and forest observations in six villages where PES
funds were distributed.
This study is reported in eight chapters. The introductory chapter provides
background introduction and the context of the study, and identifies the research
questions, case study location and methodology. The second chapter deals with
theories and literature on common resources management, Community Forestry
and PES. Chapter three elaborates on the history of forest governance in Indonesia,
including forests in Lombok, the cause of deforestation and forest degradation,
Community Forestry program development, the use of adat in community forest
management, and the role of NGOs in forest management.
Chapter four discusses the development of the PES program in Lombok,
including the establishment of the program, the role of intermediaries, the benefits
delivery system, and challenges and constraints during the program's
implementation. Chapter five critically examines the impact of the Community
Forestry and PES programs on the ecological function of the forest. This chapter
also includes an assessment of the influence of property rights on forest
conservation. Chapter six focuses on the examination of Community Forestry and
the PES program impacts on local socio-economic conditions; in particular, poverty
alleviation.
Chapter seven employs regression analysis to estimate the impact of the
Community Forestry and PES programs on the economy and ecology of these forest
communities, as a complement to the qualitative analysis. Finally, Chapter eight
concludes this thesis. This last chapter presents conclusions and policy
recommendations regarding Community Forestry and the PES program, and
identifies areas requiring further research.
- PES program officers : Institusi Multi Pihak (IMP)
- Local community leaders : Tokoh Masyarakat

169
8.1. Thesis Conclusions
This thesis supports the frequently observed phenomenon that the limited
stocks of natural resources, compared to the number of people who need them, often
leads to resource depletion in the absence of regulations regarding the use of the
resources. The absence of regulations allows everyone to access these resources,
without considering long term sustainability. Unregulated access to the resource
may encourage competition among users, to utilise the resources to maximise their
benefits without assuming rehabilitation costs. Therefore, regulating the use of
natural resources – especially commons resources – becomes necessary to avoid a
situation that Hardin (1968) described as the “tragedy of the commons”, but is
perhaps better understood as the "tragedy of open access" (Fox, 1993). The lack of
control over common resources is often considered as a failure by the state to
maintain the use of these resources in a sustainable manner (Fox et al., 1993). Even
under state control, cooperation between authorities and entrepreneurs might occur
that allows the management of the common resources to be delegated to the private
sector (Reed, 2006; Anderies and Janssen, 2013). The management of common
resources by private enterprises often causes environmental degradation due to
over-exploitation and a lack of rehabilitation. This has been experienced in the case
of forest management in Indonesia, where massive deforestation has occurred as a
result of mismanagement by private enterprises that was not accompanied by
adequate restoration efforts (Saman et al., 1993; Reed, 2006).
This study found that deforestation in Indonesia, including in Lombok, has
occurred since the colonial era. During the developmentalist period of Suharto's
New Order rule between 1966 and 1998 extensive forest degradation occurred due
to corruption and collusion in the timber industry. Forest concessions were granted
by the government to private companies. Forest exploitation by private companies
in Lombok was not followed by adequate forest restoration, nor was the
preservation of high-value old-growth forest and associated biodiversity prioritised.
In addition to these factors, the destruction of forests in Lombok was also caused
by encroachment by villagers, particularly during the political chaos and lack of
law enforcement following the collapse of the New Order regime in 1998.

170
Since 1998, the Indonesian government has encouraged the people who live
in the forests in particular areas of Indonesia to participate proactively in forest
management. In the post-Suharto reform era villagers around the forest are granted
rights to manage forest land under certain terms and conditions. One form of forest
management that involves the local community is called the Community Forestry
management scheme (Hutan Kemasyarakatan, HKm). In the HKm scheme, the
community who reside in the surrounding forest are granted forest management
rights for a specific period. In the case of the Community Forestry program in
Sesaot Forest, the local community have been granted forest management rights for
35 years. Certain rules have been established to achieve both economic and
ecological benefits; for example, by regulating plantation composition. Farmers are
permitted to grow multipurpose tree species (MPTS); tree species that can generate
dual economic and ecological benefits. Indonesian regulations on Community
Forestry allows forest farmers to grow crops and fruit trees together with forest
trees, with a mix of 60% forest trees and 40% MPTS59.
This case study found that the Community Forestry program had a positive
impact on forest sustainability, an outcome that supports the research of Klooster
and Masera (2000), Araujo et al. (2009), Barsimantov and Kendall (2012), Birch et
al. (2014), and Dhakal et al. (2007). Some areas of the forest that were damaged as
a result of the forest concessions held by timber companies in Lombok have been
recovering after the Community Forestry program was developed on the site.
However, the Community Forestry program has also triggered destruction in the
core protected forest zone, often carried out by people who are not involved in the
established Community Forestry program. The destroyed core protected forest
zones were encroached upon and converted into forest farms. In the initial period
of development of the Community Forestry program, this has negatively impacted
on the forest condition, which is in line with the argument of Pirard and Belna
(2012). But after several years, the destroyed lands are replanted with different tree
species, mainly MPTS and other crops. From the perspective of biodiversity
59 The Community forest farmer groups (CFFGs) in Sesaot negotiated the plantation composition
with the regional government. A mix of 30% forest trees and 70% MPTS was agreed as opposed
to the official Forestry Department requirement of a 60 / 40 ratio of endemic forest to MPTS.

171
conservation, the Community Forestry program has made a negative contribution,
due to the elimination of endemic plants that are replaced by horticultural crops and
MPTS such as durian, mango, mangosteen, rambutan, candlenut, coffee, cocoa and
bananas.
On the other hand, the MPTS produce fruits that can serve as a source of
income for local people and at the same time provide ecological benefits such as
oxygen production, carbon sequestration, erosion control, hydrological and other
ecological functions of forests. However, competition between economic and
ecological interests continues to occur. In the case of the community forest practices
in Sesaot, farmers tend to grow plantations that produce more economic benefits.
As a result, the community forest land is dominated by crops and MPTS rather than
forest trees.
Nevertheless, planting MPTS in community forestland has contributed to
the reduction of illegal logging, and has reversed the decline of forest cover in areas
where the program has been established. Forest farmers have an economic incentive
to protect the MPTS. The long-term income from selling fruits that are produced
from MPTS is greater and more sustainable than income from selling timber if the
MPTS were logged. Thus this thesis argues that Community Forestry has
contributed to reducing rates of deforestation, provided that the program’s
application suits the economic needs of the local people.
Decentralised resource management from state to local communities could
contribute to the sustainability of these resources under certain conditions
(Agrawal, 1996; Klooster and Masera, 2000; Araujo et al., 2009; Barsimantov and
Kendall, 2012; Pirard and Belna, 2012; Birch et al., 2014). Local communities who
are well organised and have experience of common traditions in managing their
resources are often able to implement local rules that are agreed upon by members
of the community, to manage the common resource (Ostrom, 2005). Community
forest farmer groups (CFFG) in Sesaot Forest use their local rules (adat) to regulate
the governance of the community forest. Customary rules were adapted and applied
in addition to modified state rules in forest management. Under these adat rules the
172
forest farmers are prohibited from logging trees on community forest land. If this
rule is violated, then the maximum sanction to be imposed is the revocation of the
farmer’s community forest management right by the CFFG. In addition, the farmer
who violates the rule will lose his source of revenue from the community forest.
The adat rules also require farmers to prevent timber theft from their community
forest land. This thesis suggests that adat rules accommodate a participative forest
guardian system that can lead to sustainable forest management. The statistical
analysis shows that the use of adat in community forest governance has a very
modest but positive influence on forest sustainability. Farmers who adhere to the
adat laws tend to have better forest cover.
However, the author’s field research found that the adat rules are not strictly
enforced, especially those related to the tree composition of the plantation. Kinship
and friendship relations among CFFG members remain the biggest obstacles to adat
enforcement. The offenders are often family members and neighbours of CFFG
members, allowing for collusion between the offenders and the law enforcer. Also,
rule enforcers regularly experience intimidation when they attempt to apply
sanctions. Since adat principles stress the importance of harmonious relations, they
work both to encourage respect for commonly agreed rules and to allow a
considerable degree of leeway in their interpretation and application.
This study supports the work of Agrawal and Ostrom (2001), Agrawal
(2007), Araujo et al. (2009) and Birch et al. (2014), who argue that the existence of
property rights influences the behaviour of forest farmers in relation to land
management. The Lombok forest farmers who have gained property rights to
manage the forestland have been shown to be more likely to maintain the quality of
forest cover on their forest land. The statistical analysis confirms that farmers who
hold property rights tend to plant more trees than the farmers without property
rights. A summary of the statistical analysis results, showing that property rights
and adat rules were the factors that had the strongest positive impact on forest
conservation, although not very strong compared to impacts on improvement of
socio-economic conditions, is presented in table 8.1. Supporting Ostrom’s theory,
this thesis reveals that in addition to community self-governance, clearly defined

173
property rights are needed to assure sustainable management of the commons.
Local communities who are granted rights to manage the resources have better
incentives to manage the resources more wisely and sustainably.
Table 8.1 Summary of Statistical Influence of the Community Forestry Index,
Property Rights, Adat Rules, PES and Community Forest Land Size on
Conservation and Socio-economic Conditions
Variables
Influence on
Conservation Socio-economic conditions
Elasticity Confidence
Interval Elasticity
Confidence
Interval
Community Forestry
Index 0.07% 90% 2.60% 90%
Property Rights 0.15% 95% 15.34% 99%
Adat rules 0.12% 95% 2.75% Not
Significant
PES program -0.02% Not
Significant 1.25%
Not
Significant
Community Forest
land size -0.30% 95% 14.38% 99%
Source: Appendix 7.1.
In addition to the self-governing community approach (Ostrom, 2005), this
thesis suggests that external party involvement, which provides checks and balances
to community governance under current circumstances, is also required. The
external party can be a government agency or NGO that acts as the supervisor in
the practice of resource management, such as the community forest management in
this case study. Such a collaborative approach is often called co-management, joint
forest management or a community partnership management scheme (Jentoft,
2003; Persoon et al., 2003; Borrini-Feyerabend et al., 2004; Carlsson and Berkes,
2005; Berkes, 2009; Ulvevadet and Hausner, 2011). In the case of community forest
management in Lombok, the involvement of and assistance from an NGO or the
government has made the community forest farmers able to manage the forest
resources more appropriately, due to the monitoring and technical assistance
provided. The involvement of external parties has provided additional incentives
for the forest farmers not to log the trees, and to obey the state and adat rules.
174
Supporting Baland and Platteau (1996) regarding the role of external authority, this
thesis argues that community forest outcomes, and management patterns such as
logging practices, are correlated with the involvement of outside parties such as
NGOs and government agencies, which monitor and influence the behaviour of
farmers in managing community forestland. This study clarifies that local
community management under certain conditions—involving NGO engagement
and effective state supervision through nested co-management in Sesaot Forest
could be an alternative to state and private enterprise management, previously
regarded as the only viable solutions to Hardin’s tragedy.
In terms of socio-economic outcomes, this study clearly found that
Community Forestry has a positive impact on local socio-economic conditions in
the villages around the community forest site. The most significant socio-economic
benefit from the Community Forestry program is the provision of access to land for
the poor people who do not have private farming land. The Community Forestry
program has been successful in increasing the level of welfare for the forest farmers
involved in the program. The primary source of income for forest farmers is non-
timber forest products, such as crops and MPTS fruits, which are grown on the
community forest land. The Community Forestry program has also provided
indirect socio-economic benefits to people who are not forest farmers. The program
has created new job opportunities for the surrounding community, as traders,
entrepreneurs and in food processing.
The increase in the villagers’ welfare as a result of the Community Forestry
program can be seen in many respects, such as the improved housing conditions,
education level and supporting infrastructure. Housing conditions including home
ownership have improved since the Community Forestry program was established.
The level of education in the villages has also increased significantly following the
establishment of the Community Forestry program. The statistical analysis
confirmed that there is a positive relationship between the Community Forestry
program and farmers’ welfare. Therefore, this thesis supports Gunter and Jodway
(2000), Birch et al. (2014), and Dhakal et al. (2007), but contrasts with Sunderlin,
William D. (2006) and Maryudi et al. (2012), who found no such association.
175
However, there is a trade-off between conservation and livelihood goals, where
farmers tend to plant MPTS, which provide greater economic benefits but may
compromise conservation values, especially in regard to biodiversity. This could be
related to the weak enforcement of the conservation regulations, and has resulted in
the programs having so far tended to provide income benefits at the expense of
some conservation values. As we can see from the statistical data in table 8.1, a
larger land size was accompanied by an improvement in socio-economic conditions
but relatively a lower benefit for conservation.
Similar to the conditions arising from forest management by private
companies in Indonesia, community management can clearly also cause negative
externalities that impact negatively on the welfare of other people and the
environment. This study ascertains that payments for the ecosystem services
program (PES) can address these externalities. A PES program in Lombok has been
integrated with the Community Forestry program to overcome forest degradation
affecting watersheds by raising conservation funds from water users in urban areas.
The raised money is allocated for tree planting in the upstream area. In order to
enforce broad community participation, the government has created local
regulations on ecosystem services; requiring all water users in the city to contribute
to the provision of funding for forest conservation through the PES program. These
programs are often designed to balance the benefits between environmental
conservation and poverty reduction (Ferraro and Kiss, 2002; Pagiola et al., 2005;
Wunder, 2005; Pagiola, 2007; Bremer et al., 2014).
Payments for ecosystem services programs in many countries have been
developed primarily based on Coasean theory (Coase, 1960), where voluntary
transactions occur between ecosystem services buyers and sellers under market
conditions (Muradian, Roldan et al., 2010; Sattler and Matzdorf, 2013).
Alternatively, Pigouvian theory (Pigou, 1932) can also be used as a basis for
implementing PES programs in which the government plays a role, either by
providing subsidies or collecting taxes to fund the provision of ecosystem services
(Yandle, 1997; Sattler and Matzdorf, 2013).

176
Following Pirard (2012), this study found that the PES program in Lombok
is a hybrid PES system that combines Coasean and Pigouvian theory. Coasean
theory is applied on the supply side, where a voluntary transaction occurs between
forest farmers and the PES project manager. On the other hand, on the demand side,
Pigouvian theory is applied. In this case, government intervention exists to force
urban water users to pay contributions for the provision of ecosystem services and
long-term sustainability.
Regarding the impact of PES program on forest coservation, this study
found an interesting evidence. There is a contrast between the finding of qualitative
and quantitative analysis. The quantitative analysis found that the PES program in
Lombok does not yet demonstrate significant influence on forest conservation. On
the other hand, the qualitative analysis found that the PES program has a positive
influence on forest conservation. Considering the strongest evidence provided by
qualitative analysis, the conclusion was generated from this method.
This study sugests that PES programs have contributed positively to forest
conservation in Lombok, which supports the work of other scholars such as
Prasetyo et al. (2009), Clements et al. (2010), Wunder and Albán (2008), and
Matthew et al. (2010). After the PES program was established in Lombok for
several years, forest cover increased significantly in the project location.
Although the direct economic benefits of the PES program in Lombok have
yet to materialize, due to the regulatory requirement that money from PES has to
be used for tree planting, it can be assumed that there will be long-term economic
as well as ecological benefits. The long-term economic benefits of planting MPTS
will be seen after the MPTS produce fruit. The potential revenue generated from
the fruit motivates farmers to protect and maintain the MPTS trees. Thus this thesis
argues that the hybrid PES program in Lombok, in conjunction with the Community
Forestry program, could produce a sustainable outcome in the long term.
In general, PES programs can have a direct impact on the socio-economic
conditions of farmers who are enrolled in the program, if payments are made in
cash and are allowed to be used as extra income. However, there are no significant

177
short term direct economic benefits of PES schemes in Lombok, as the money from
PES schemes is still relatively limited and can only be used for conservation
activities.
8.2. Policy Recommendations
The high rate of deforestation in Indonesia clearly requires serious and
immediate attention from the Indonesian government. However, given the limited
capacity of both financial and human resources, an alternative solution is needed in
which forest management can produce conservation goals while also contributing
to the empowerment and wellbeing of local communities surrounding the forest.
The findings of this thesis, that the Community Forestry program has been
relatively successful in achieving sustainability as well as improvement of socio-
economic conditions, suggests that the Indonesian government should devote
greater consideration to developing effective Community Forestry and PES
programs to control deforestation.
At the same time, the Community Forestry program was found to produce
some negative impacts on the environment. This research found that the
Community Forestry program did attract forest farmers into areas of natural forest
previously degraded by commercial logging. In the Lombok Sesaot Forest case
some groups of people who were not previously involved in the program
encroached on primary forest areas in order to convert them into forest farms. Under
these conditions, the government faces a dilemma between its responsibility to
protect forest resources and the obligation to fulfil the people's welfare needs. It can
be argued that the government should exert strong controls when core protected
forest zones are converted into forest farms to prevent massive or excessive forest
conversion.
The local government needs to provide assistance and monitor the
community forest farmers to ensure adat and state rules on community forest
management are enforced. Additional interventions are required to build
community capacity to develop activities such as post-harvest processing
businesses that would enable the non-forest farmer villagers to also enjoy the
178
economic benefits of the Community Forestry program. For instance, the local
government could provide training programs for processing of forest products,
providing soft loans to support these businesses, opening markets for their products,
and improving rural infrastructure that would extend the success of Community
Forestry and its related businesses. Under the new Village Law (2014), local
communities themselves now have expanded budgets that could be used for these
purposes.
The major problem of protecting biodiversity lost due to the replacement of
endemic tree species with horticultural crops and MPTS also needs to be addressed.
This negative impact can be remedied through efforts that encourage community
forest farmers’ communities to replant tree species that have been lost; as well as
preventing further loss. Government can take a role in providing the seeds for
replanting; however, given that the community forest farmers have prioritized
economic benefits over ecological ones, rules related to the plantation composition
on community forest lands need to be re-enforced and effectively monitored. In this
case, the existing schemes of co-management need to be improved. The community
forest farmers' groups should be re-empowered by providing assistance from either
forestry agencies or related NGOs to enforce compliance with adat rules. The
potential economic consequence of strict enforcement could be compensated by
revising the PES scheme to enable more direct income benefits to be paid to
Community Forest members, with payments scaled according to the proportion of
endemic trees planted. To increase the benefits and coverage of the PES scheme, it
would be necessary to include industrial users and prohibit or increase charges for
ground water use.
There is an irony in the success of the Community Forestry program, given
the actual legal status of community forest management rights. In most cases the
official property rights for community forest management have not been formally
granted. Since clearly defined property rights to manage forests affect the
sustainability of the forest, it is recommended that the Indonesian Ministry of
Forestry should issue official licences, with clearly defined conditions, to the entire
community of forest farmers.

179
Indonesian government budget constraints with regard to supporting
community forest management could be addressed through expanding and revising
the PES programs. This study found that the PES program developed in West
Lombok has contributed to increased forest cover. Nevertheless, inequities exist
related to the PES retribution that is charged to water consumers. The PES rates are
equal for all households and industries regardless of the amount of water consumed
or its purpose. Small families or small industries that consume less water pay the
same flat fee as larger families or industries that consume more water, and there is
no differentiation between water use for basic needs and for luxury consumption,
for example in the tourism industry. Ideally, the PES retribution fee should be
specified proportionally, depending on the amount of water consumed. Revision of
PES rates along lines that address these inequities could also fund the expansion of
the scheme supporting Community Forestry program improvement.
Considering the large number of farmers who are willing to participate in
the PES program, it is necessary for the government of West Lombok to increase
the availability of PES funds to support them. This would be possible by increasing
PES contributions so that the PES fund is large enough to be distributed to more
Community Forest Farmers’ Groups (CFFGs). Funding an expanded and more
comprehensive CFFG scheme will enable more degraded forests to be restored. The
PES rate in West Lombok is currently very small and needs to be revised. The high
enthusiasm of the forest farmers to join the PES program is an opportunity for the
government to bring the conservation program and welfare goals into better
alignment.
The effectiveness of the current PES program in West Lombok clearly
requires review. Many industries do not consume water from the regional water
corporation (PDAM) and thus avoid contributing to the PES program. The
government should enforce a policy that requires them to participate. Even though
these industries do not use water delivered by PDAM, the underground water
supplies that they tap into are also influenced by the existence and quality of the
forest. If the forest is damaged, then supply of underground water may also be
disrupted. The local government could modify the PES regulation to restrict and

180
increase the tax on water extraction and divert a proportion of the PES funds to
local government for improving management, infrastructure, and public education
on water use and ecosystem services.
Because the PES regulation under study has been issued by the West
Lombok government, it cannot be enforced in other districts. This has led to a free
rider problem, where the residents of the City of Mataram, who are the largest
consumers of water from PDAM, do not contribute directly to the PES fund. This
problem can be solved through a PES regulation that is issued by a higher level of
government, enabling the policy to be enforced across districts – in this case at the
level of the provincial government of West Nusa Tenggara. This policy would
require that it is compulsory for all ecosystem services users in the province to pay
the PES fees.
The Community Forestry and PES programs should be adjusted to the
specific needs of the local community. The empirical evidence shows that by
accommodating local needs, integrated PES and Community Forestry programs, if
managed effectively, can be used as a tool for forest conservation and improvement
of socio-economic conditions in the long term.
8.3. Future Research
This research has several limitations. First, the thesis focused primarily on
the watershed protection dimension of forest conservation, rather than their
biodiversity functions; Second, surveys for this study were only conducted in
communities that have been involved in the Community Forestry and PES
programs. They are not compared with other communities where such programs
were not available. Third, the PES analysis is focused on the supply rather than the
demand side.
Considering the negative impact of the Community Forestry program on
biodiversity, research into the details and value of the biodiversity lost, and into
policy mechanisms for halting and reversing this loss, would enrich this research

181
finding greatly. Such a study would also help to fill the gap in biodiversity valuation
studies in less developed countries (Christie et al., 2012).
As this research has focused primarily on the supply side of the PES system,
further research which brings together both the supply and demand sides of PES is
desirable, to produce a comprehensive analysis of PES as a whole system. Research
is needed to investigate the differential capacity of domestic and industrial water
consumers to pay for these essential ecosystem services. Although such research
had been conducted before the PES program in Lombok was designed (Konsepsi,
2003), an up-to-date analysis is needed, as the price of goods and services has
increased significantly. This will enable the local government to increase the PES
contribution.
On the supply side, further research is needed to expand the funds available
and to determine the best method to increase and distribute PES payments, so that
some payments go directly to covering the full cost of planting and can create
immediate income to forest farmers. Research should also look at the best means of
linking payments to outcomes, and should take account of transaction costs in
monitoring these. It is concluded that with immediate evidence-based alterations to
improve effectiveness, and with appropriate ongoing evaluation and revision, the
Community Forestry and PES schemes offer the most promising option for
addressing forest conservation while improving long term socio-economic
conditions in rural areas across Indonesia.
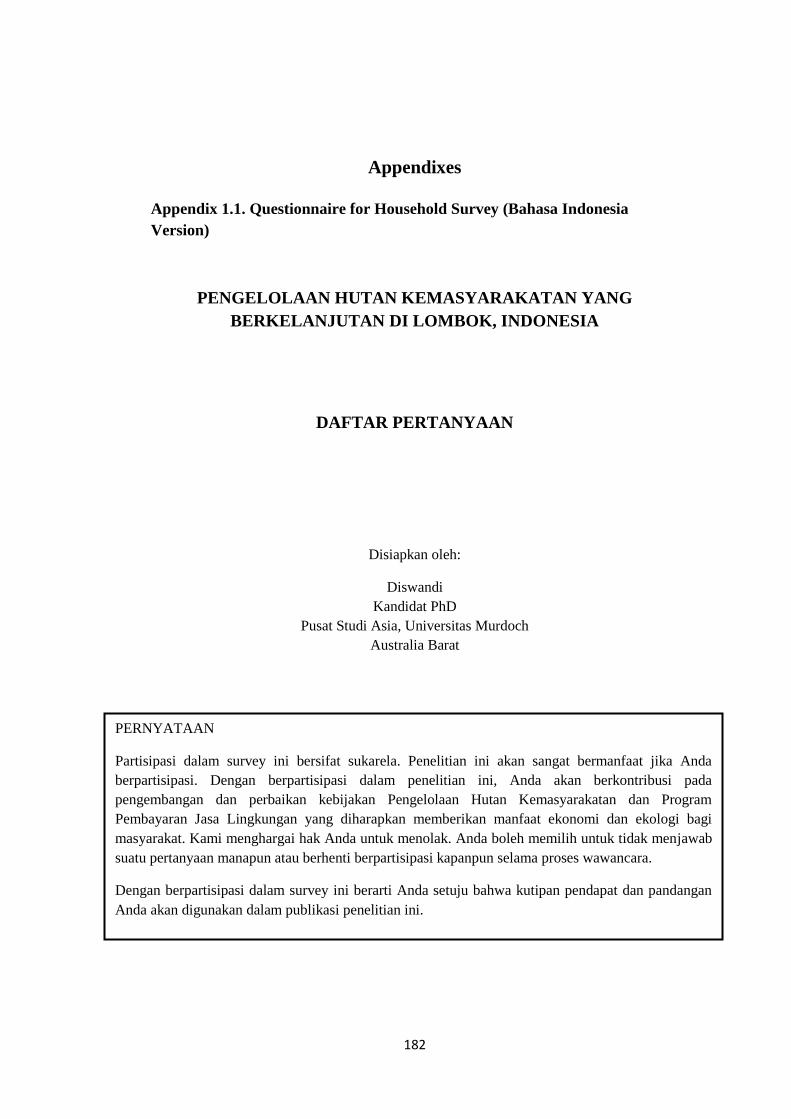
182
Appendixes
Appendix 1.1. Questionnaire for Household Survey (Bahasa Indonesia
Version)
PENGELOLAAN HUTAN KEMASYARAKATAN YANG
BERKELANJUTAN DI LOMBOK, INDONESIA
DAFTAR PERTANYAAN
Disiapkan oleh:
Diswandi
Kandidat PhD
Pusat Studi Asia, Universitas Murdoch
Australia Barat
QUESTIONNAIRE FOR HOUSEHOLD SURVEY
Nomor Kuesioner………………………… (100)
PERNYATAAN
Partisipasi dalam survey ini bersifat sukarela. Penelitian ini akan sangat bermanfaat jika Anda
berpartisipasi. Dengan berpartisipasi dalam penelitian ini, Anda akan berkontribusi pada
pengembangan dan perbaikan kebijakan Pengelolaan Hutan Kemasyarakatan dan Program
Pembayaran Jasa Lingkungan yang diharapkan memberikan manfaat ekonomi dan ekologi bagi
masyarakat. Kami menghargai hak Anda untuk menolak. Anda boleh memilih untuk tidak menjawab
suatu pertanyaan manapun atau berhenti berpartisipasi kapanpun selama proses wawancara.
Dengan berpartisipasi dalam survey ini berarti Anda setuju bahwa kutipan pendapat dan pandangan
Anda akan digunakan dalam publikasi penelitian ini.

183
Nama Desa: ……………………………… (101)
Tanggal: ………………………….……. (102)
BAGIAN A: IDENTITAS RESPONDEN
A1. Kode rumah tangga : …………………………………… (103)
A2. Nama Responden utama: ……………………………………………... (104)
Nama Responden lain: …………………………………………………... (105)
A3. Usia
Responden
Utama
(106)
A4. Jenis
Kelamin
Responden
utama
(107)
A5. Etnis
Responden
Utama
(108)
A6.
Kepala
Rumah
Tangga
(responden
utama) (109)
A7. Tingkat
Pendidikan
tertinggi dalam
rumah tangga (110)
A8. Jumlah
Anggota
Rumah tangga?
(111)
………
tahun
a. Laki-laki
b. Perempuan
c. Laki laki
dan
Perempuan
a. Sasak
b. Bali
c. Samawa
d. Mbojo
e. Jawa
f. Bugis
g. Lainnya
h. Ya
i. Tidak
a. Sekolah Dasar
(SD)
b. Sekolah
Menengah
Pertama
(SMP)
c. Sekolah
Menengah
Atas (SMA)
d. Sarjana
e. Pasca Sarjana
……… orang
A9. Sudah berapa lama Anda tinggal di desa ini? (112)
…………………… tahun
A10. Apakah Anda memiliki atau mempergunakan lahan? (113)
a. Ya
b. Tidak

184
Jika Ya, jelaskan:
No Lokasi Digunakan Untuk Luas (ha) Tipe Hak
a b c d
1 (114) (115) (116) (117)
2 (118) (119) (120) (121)
3 (122) (123) (124) (125)
4 (126) (127) (128) (129)

185
BAGIAN B. PENGELOLAAN HUTAN KEMASYARAKATAN (HKm)
B1. Apa nama Kelompok HKm tempat Anda tergabung dan siapa nama ketua
bloknya? (200)
……………………………………………………………………………………
B2. Sudah berapa lama Anda menjadi anggota Kelompok HKm ini?
……………….. tahun (201)
B3. Apakah lahan HKm Anda memiliki ijin resmi? (202)
a. Ya
b. Tidak
B4. Berapa luas lahan HKm yang Anda kelola? ……………………… hektar (203)
Catatan: Tandai lokasi lahan HKm dalam peta
B5. Bagaimana Anda memperoleh lahan tersebut? (204)
a. Pembagian oleh pemerintah
b. tukar lahan (ganti rugi)
c. membeli
d. diwarisi
B6. Silahkan tentukan dan beri peringkat, manfaat yang Anda peroleh dari HKm! (205)
a. Penghasilan (uang)
b. Makanan
c. Bahan bakar
d. Air
e. Makanan ternak
f. Pembayaran Jasa Lingkungan
g. Penjualan Karbon (REDD)
h. Obat-obatan
i. Lainnya, sebutkan: ………………… (206)
B7. Siapakah yang menentukan jenis tanaman yang akan ditanam di lahan HKm? (207)
a. Suami
b. Istri
c. Kelompok HKm
d. LSM
e. Pemerintah
f. IMP
g. Lainnya, sebutkan: …………………………………….……. (208)

186
B8. Sebutkan berapa jumlah pohon yang ada dalam lahan Anda:
No Nama Pohon Jumlah Keterangan
(a. Kayu/b. MPTS)
1 Mahoni (209a) (209b)
2 Sengon (210a) (210b)
3 Bajur (211a) (211b)
4 Rajumas (212a) (212b)
5 Durian (213a) (213b)
6 Rambutan (214a) (214b)
7 Manggis (215a) (215b)
8 Kemiri (216a) (216b)
9 Pinang (217a) (217b)
10 Sawo (218a) (218b)
11 Melinjo (219a) (219b)
12 Aren (220a) (220b)
13 Kepundung (221a) (221b)
14 Jambu (222a) (222b)
15 Alpukat (223a) (223b)
16 Nangka (224a) (224b)
17 Kopi (225a) (225b)
18 Coklat (226a) (226b)
19 Matoa (227a) (227b)
20 Mengkudu (228a) (228b)
21 Lainnya (229a) (229b)
Jumlah (230a)
Proporsi Kayu (230b)
Proporsi MPTS (230c)
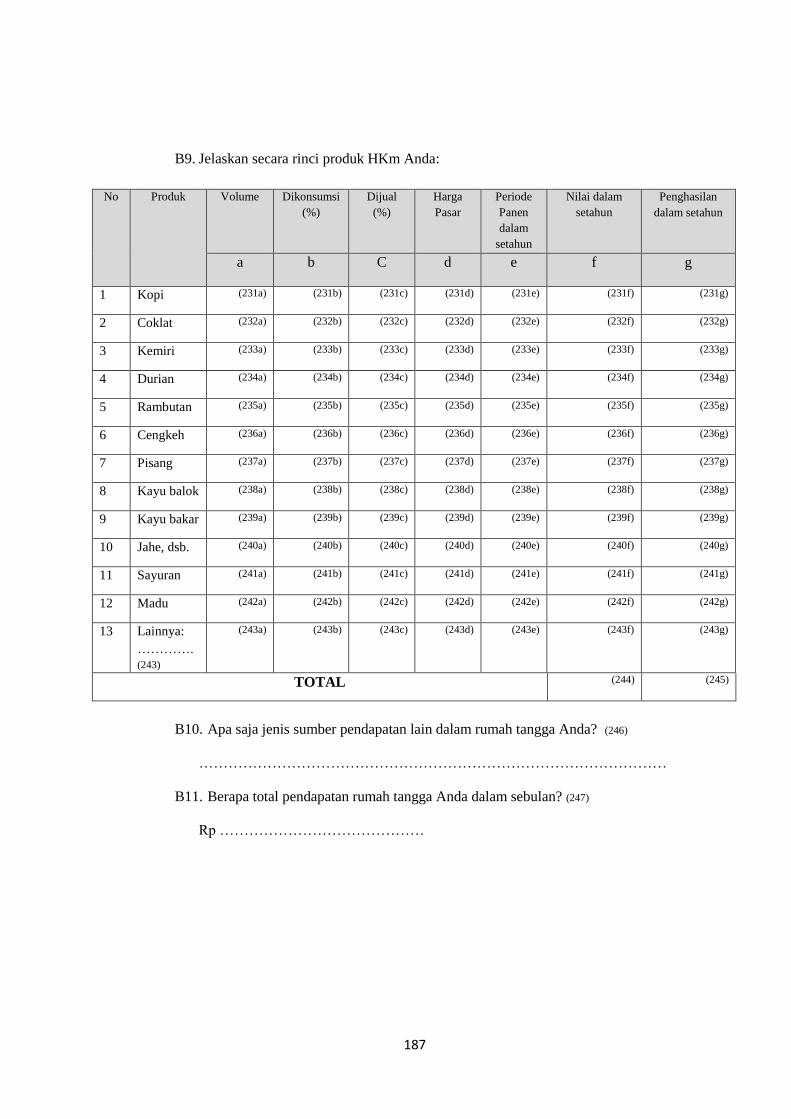
187
B9. Jelaskan secara rinci produk HKm Anda:
No Produk Volume Dikonsumsi
(%)
Dijual
(%)
Harga
Pasar
Periode
Panen
dalam
setahun
Nilai dalam
setahun
Penghasilan
dalam setahun
a b C d e f g
1 Kopi (231a) (231b) (231c) (231d) (231e) (231f) (231g)
2 Coklat (232a) (232b) (232c) (232d) (232e) (232f) (232g)
3 Kemiri (233a) (233b) (233c) (233d) (233e) (233f) (233g)
4 Durian (234a) (234b) (234c) (234d) (234e) (234f) (234g)
5 Rambutan (235a) (235b) (235c) (235d) (235e) (235f) (235g)
6 Cengkeh (236a) (236b) (236c) (236d) (236e) (236f) (236g)
7 Pisang (237a) (237b) (237c) (237d) (237e) (237f) (237g)
8 Kayu balok (238a) (238b) (238c) (238d) (238e) (238f) (238g)
9 Kayu bakar (239a) (239b) (239c) (239d) (239e) (239f) (239g)
10 Jahe, dsb. (240a) (240b) (240c) (240d) (240e) (240f) (240g)
11 Sayuran (241a) (241b) (241c) (241d) (241e) (241f) (241g)
12 Madu (242a) (242b) (242c) (242d) (242e) (242f) (242g)
13 Lainnya:
………….
(243)
(243a) (243b) (243c) (243d) (243e) (243f) (243g)
TOTAL (244) (245)
B10. Apa saja jenis sumber pendapatan lain dalam rumah tangga Anda? (246)
……………………………………………………………………………………
B11. Berapa total pendapatan rumah tangga Anda dalam sebulan? (247)
Rp ……………………………………
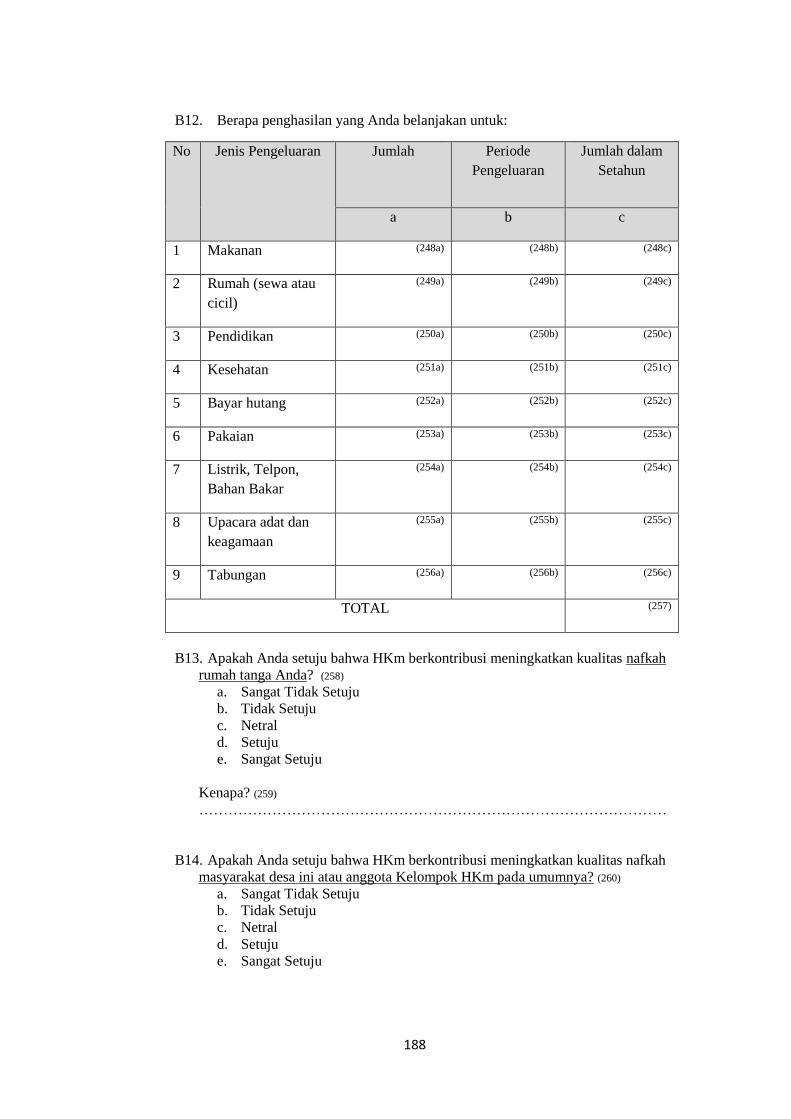
188
B12. Berapa penghasilan yang Anda belanjakan untuk:
No Jenis Pengeluaran Jumlah
Periode
Pengeluaran
Jumlah dalam
Setahun
a b c
1 Makanan (248a) (248b) (248c)
2 Rumah (sewa atau
cicil)
(249a) (249b) (249c)
3 Pendidikan (250a) (250b) (250c)
4 Kesehatan (251a) (251b) (251c)
5 Bayar hutang (252a) (252b) (252c)
6 Pakaian (253a) (253b) (253c)
7 Listrik, Telpon,
Bahan Bakar
(254a) (254b) (254c)
8 Upacara adat dan
keagamaan
(255a) (255b) (255c)
9 Tabungan (256a) (256b) (256c)
TOTAL (257)
B13. Apakah Anda setuju bahwa HKm berkontribusi meningkatkan kualitas nafkah
rumah tanga Anda? (258)
a. Sangat Tidak Setuju
b. Tidak Setuju
c. Netral
d. Setuju
e. Sangat Setuju
Kenapa? (259)
……………………………………………………………………………………
B14. Apakah Anda setuju bahwa HKm berkontribusi meningkatkan kualitas nafkah
masyarakat desa ini atau anggota Kelompok HKm pada umumnya? (260)
a. Sangat Tidak Setuju
b. Tidak Setuju
c. Netral
d. Setuju
e. Sangat Setuju

189
Kenapa? (261)
……………………………………………………………………………………
B15. Apakah Anda setuju bahwa HKm berkontribusi dalam menurunkan tingkat
kemiskinan di desa ini? ((262)
a. Sangat Tidak Setuju
b. Tidak Setuju
c. Netral
d. Setuju
e. Sangat Setuju
Kenapa? (263)
……………………………………………………………………………………
B16. Apakah Anda dulu pernah menebang pohon - pohon di lahan HKm Anda? (264)
a. Tidak Pernah
b. Jarang
c. Kadang-kadang
d. Sering
e. Sangat sering
Kenapa? (265)
……………………………………………………………………………………
B17. Apakah Anda sekarang masih menebang pohon - pohon di lahan HKm Anda? (266)
a. Tidak Pernah
b. Jarang
c. Kadang-kadang
d. Sering
e. Sangat sering
Kenapa? (267)
……………………………………………………………………………………
B18. Apakah pohon - pohon di lahan HKm Anda pernah dicuri? (268)
a. Tidak Pernah
b. Jarang
c. Kadang-kadang
d. Sering
e. Sangat sering
B19. Bagaimana dengan orang lain? Apakah mereka sekarang masih menebang
pohon - pohon di hutan ini? (269)
a. Tidak Pernah
b. Jarang
c. Kadang-kadang
d. Sering
e. Sangat sering

190
Kenapa? (270)
……………………………………………………………………………………
B20. Jenis aturan apa yang diterapkan dalam pengelolaan hutan di desa ini? (271)
a. Aturan adat
b. Aturan Negara
c. Keduanya
d. Aturan lainnya, sebutkan: ………………………………. (272)
e. Tidak tahu
B21. Apa contoh aturan tentang pengelolaan hutan yang harus ditaati, dan apa
sanksinya jika dilanggar? (273)
……………………………………………………………………………………
B22. Apa yang Anda ketahui tentang penerapan aturan adat (awiq-awiq) dalam
pengelolaan hutan? (274)
……………………………………………………………………………………
B23. Apakah Anda mentaati aturan adat (awiq-awiq) dalam pengelolaan hutan? (275)
a. Sangat Tidak Mentaati
b. Tidak Mentaati
c. Netral
d. Mentaati
e. Sangat Mentaati
f. Tidak tahu awiq-awiq
Kenapa? (276)
……………………………………………………………………………………
B24. Sejak Anda bergabung dalam kelompok HKm, bagaimana perubahan jumlah
pohon kayu dalam lahan HKm Anda? (277)
a. Sangat meningkat
b. Meningkat
c. Sama
d. Menurun
e. Sangat menurun
B25. Apakah Anda setuju bahwa HKm berkontribusi menurunkan/menghentikan
kerusakan hutan? (278)
a. Sangat Tidak Setuju
b. Tidak Setuju
c. Netral
d. Setuju
e. Sangat Setuju
Kenapa? (279)
……………………………………………………………………………………
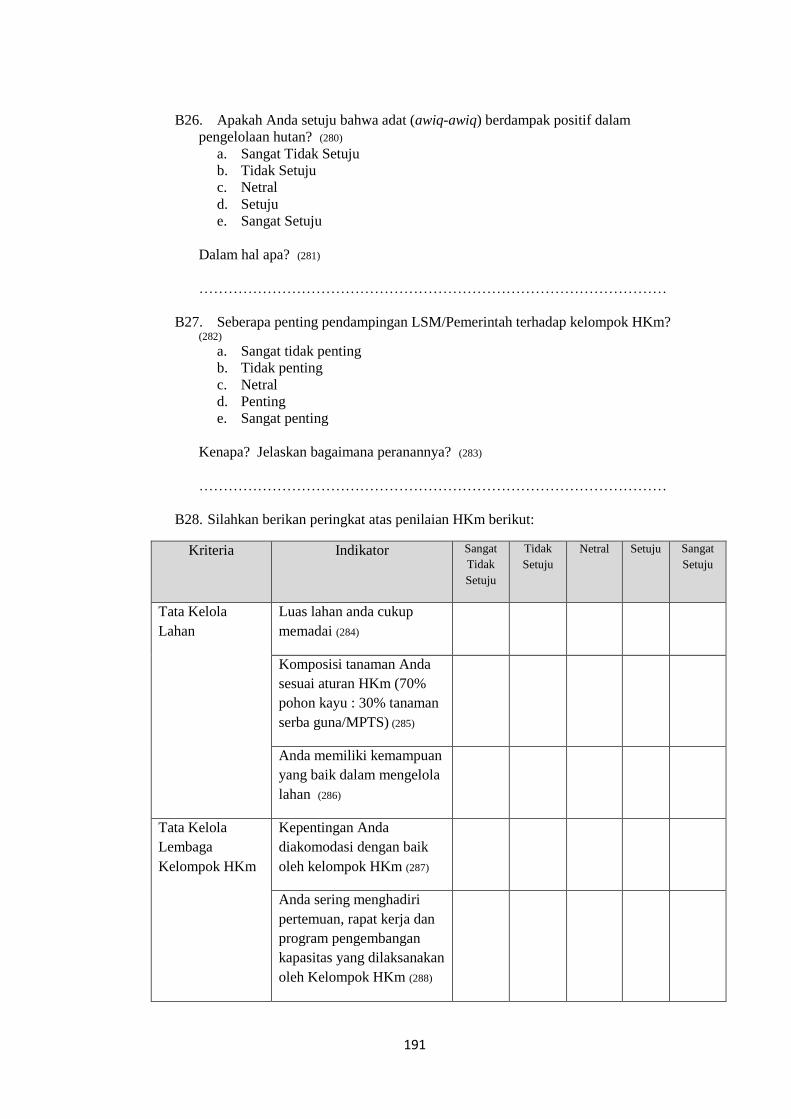
191
B26. Apakah Anda setuju bahwa adat (awiq-awiq) berdampak positif dalam
pengelolaan hutan? (280)
a. Sangat Tidak Setuju
b. Tidak Setuju
c. Netral
d. Setuju
e. Sangat Setuju
Dalam hal apa? (281)
……………………………………………………………………………………
B27. Seberapa penting pendampingan LSM/Pemerintah terhadap kelompok HKm? (282)
a. Sangat tidak penting
b. Tidak penting
c. Netral
d. Penting
e. Sangat penting
Kenapa? Jelaskan bagaimana peranannya? (283)
……………………………………………………………………………………
B28. Silahkan berikan peringkat atas penilaian HKm berikut:
Kriteria Indikator Sangat
Tidak
Setuju
Tidak
Setuju
Netral Setuju Sangat
Setuju
Tata Kelola
Lahan
Luas lahan anda cukup
memadai (284)
Komposisi tanaman Anda
sesuai aturan HKm (70%
pohon kayu : 30% tanaman
serba guna/MPTS) (285)
Anda memiliki kemampuan
yang baik dalam mengelola
lahan (286)
Tata Kelola
Lembaga
Kelompok HKm
Kepentingan Anda
diakomodasi dengan baik
oleh kelompok HKm (287)
Anda sering menghadiri
pertemuan, rapat kerja dan
program pengembangan
kapasitas yang dilaksanakan
oleh Kelompok HKm (288)

192
Kriteria Indikator Sangat
Tidak
Setuju
Tidak
Setuju
Netral Setuju Sangat
Setuju
Kelompok HKm Anda
mampu menyelesaikan
permasalahan kelompok
secara mandiri (289)
Anda mendapatkan
dukungan yang memadai
dari pemerintah, LSM,
Universitas dan pihak
terkait lainnya (290)
Tata Kelola
Usaha
Lahan Anda memproduksi
/menghasilkan komoditas
dalam jumlah yang rata-rata
stabil (291)
Harga pasar komoditas
HKm yang Anda hasilkan,
stabil (292)
B29. Menurut Anda, apa hal negatif atau kekurangan dari program HKm? (293)
……………………………………………………………………………………
Kenapa? (294)
……………………………………………………………………………………
B30. Silakan memberi komentar atau saran untuk peningkatan program HKm. (295)
………………………………………………………………………………………

193
BAGIAN C. PROGRAM PEMBAYARAN JASA LINGKUNGAN (JASLING)
C1. Apakah Anda tergabung dalam program Jasling? (300)
a. Ya
b. Tidak Jika tidak, lanjutkan ke
pertanyaan C8
Jelaskan alasan kenapa Anda bergabung atau kenapa tidak bergabung? (301)
……………………………………………………………………………………
C2. Dalam program Jasling apa Anda terlibat? (302)
……………………………………………………………………………………
C3. Sudah berapa lama Anda bergabung dalam program Jasling ini? ……………….
tahun (303)
C4. Manfaat apa saja yang Anda peroleh dari program Jasling:
No Jenis Jumlah /
Kuantitas
Periode Total Nilai
dalam
setahun
a b c
1 Uang tunai (304a) (304b) (304c)
2 Bibit (305a) (305b) (305c)
3 Modal kerja (306a) (306b) (306c)
4 Non Material,
…………………….. (307)
(307a) (307b) (307c)
5 Lainnya,
……………………….(308)
(308a) (308b) (308c)
C5. Jelaskan penggunaan uang dari jasling, mayoritas untuk keperluan apa? (309)
………………………………………………..………………………………………
C6. Apakah Anda setuju bahwa program Jasling berkontribusi dalam meningkatkan
kualitas kehidupan rumah tangga Anda? (310)
a. Sangat Tidak Setuju
b. Tidak Setuju
c. Netral
d. Setuju
e. Sangat Setuju
Kenapa? (311)
……………………………………………………………………………………
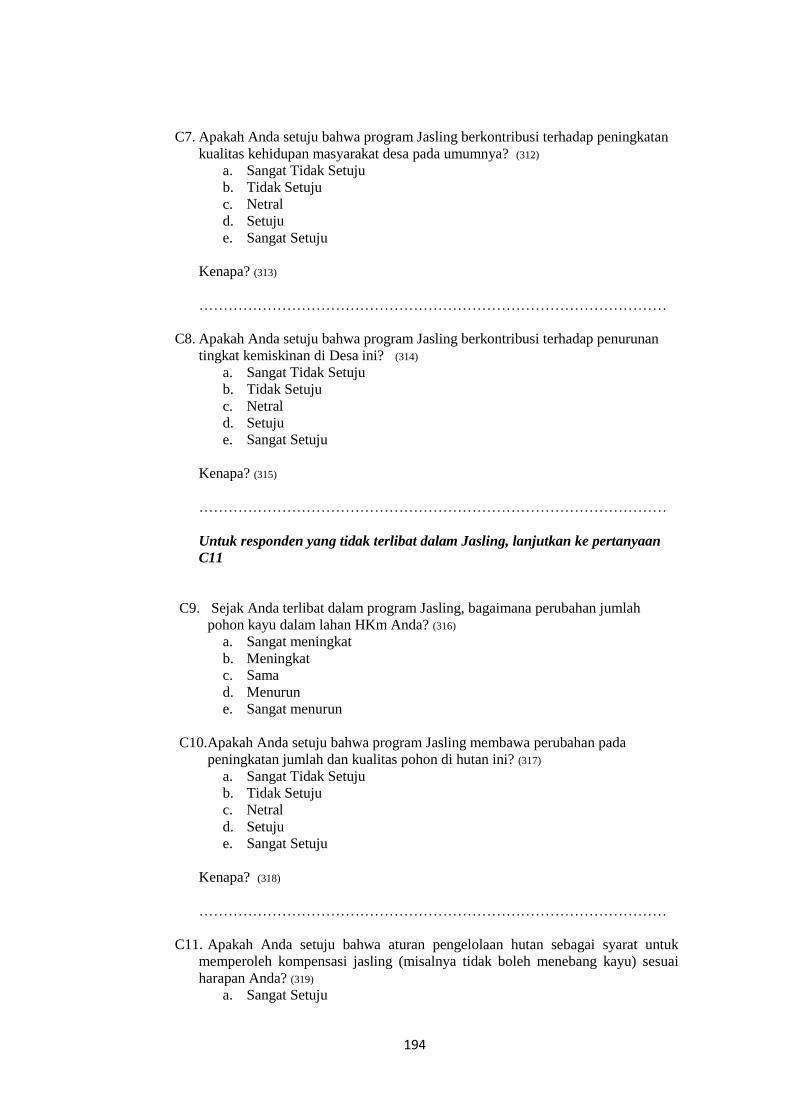
194
C7. Apakah Anda setuju bahwa program Jasling berkontribusi terhadap peningkatan
kualitas kehidupan masyarakat desa pada umumnya? (312)
a. Sangat Tidak Setuju
b. Tidak Setuju
c. Netral
d. Setuju
e. Sangat Setuju
Kenapa? (313)
……………………………………………………………………………………
C8. Apakah Anda setuju bahwa program Jasling berkontribusi terhadap penurunan
tingkat kemiskinan di Desa ini? (314)
a. Sangat Tidak Setuju
b. Tidak Setuju
c. Netral
d. Setuju
e. Sangat Setuju
Kenapa? (315)
……………………………………………………………………………………
Untuk responden yang tidak terlibat dalam Jasling, lanjutkan ke pertanyaan
C11
C9. Sejak Anda terlibat dalam program Jasling, bagaimana perubahan jumlah
pohon kayu dalam lahan HKm Anda? (316)
a. Sangat meningkat
b. Meningkat
c. Sama
d. Menurun
e. Sangat menurun
C10. Apakah Anda setuju bahwa program Jasling membawa perubahan pada
peningkatan jumlah dan kualitas pohon di hutan ini? (317)
a. Sangat Tidak Setuju
b. Tidak Setuju
c. Netral
d. Setuju
e. Sangat Setuju
Kenapa? (318)
……………………………………………………………………………………
C11. Apakah Anda setuju bahwa aturan pengelolaan hutan sebagai syarat untuk
memperoleh kompensasi jasling (misalnya tidak boleh menebang kayu) sesuai
harapan Anda? (319)
a. Sangat Setuju

195
b. Tidak Setuju
c. Netral
d. Setuju
e. Sangat setuju
Kenapa? (320)
……………………………………………………………………………………
C12. Menurut Anda, hal negatif atau kekurangan apa yang ada dalam program
Jasling? (321)
….…………………………………………………………………………………
Kenapa? (322)
……………………………………………………………………………………
C13. Silahkan memberikan komentar atau saran bagi peningkatan program Jasling. (323)
……………………………………………………………………………………
BAGIAN D: KEADAAN EKONOMI RUMAH TANGGA
KRITERIA SEBELUM
1998
SEKARANG
2015
A B
D1. Kepemilikan
rumah
(400)
Menumpang
bersama keluarga
Menyewa
Memiliki rumah
(401)
Menumpang bersama
keluarga
Menyewa
Memiliki rumah
D2. Kondisi rumah Tembok: (402)
Bambu
Kayu
Bata
Lantai: (404)
Tanah
Semen
Keramik
Tembok: (403)
Bambu
Kayu
Bata
Lantai: (405)
Tanah
Semen
Keramik
D3. Saluran Listrik (406)
Tidak ada listrik
Berbagi (Mengalir
dari tetangga)
Jaringan PLN
Punya Genzet
(407)
Tidak ada listrik
Berbagi (Mengalir
dari tetangga)
Jaringan PLN
Punya Genzet
D4. Saluran Air bersih (408)
Sungai/Mata Air
(409)
Sungai/Mata Air

196
KRITERIA SEBELUM
1998
SEKARANG
2015
A B
Sumur bersama
Sumur pribadi
Pipa/Ledeng Umum
Pipa /Ledeng pribadi
Sumur bersama
Sumur pribadi
Pipa/Ledeng Umum
Pipa /Ledeng pribadi
D5. Bahan Bakar
untuk memasak
(410)
Kayu
Minyak
Gas
Listrik
Bahan bakar nabati
(411)
Kayu
Minyak
Gas
Listrik
Bahan bakar nabati
D6. Transportasi (412)
Tidak memiliki
kendaraan
Sepeda
Sepeda Motor
Mobil/Truk/bemo
(413)
Tidak memiliki
kendaraan
Sepeda
Sepeda Motor
Mobil/Truk/Bemo
D7. Telekomunikasi (414)
Tidak memiliki HP
Memiliki satu HP
Memiliki lebih dari
satu HP
(415)
Tidak memiliki HP
Memiliki satu HP
Memiliki lebih dari
satu HP
“Terima Kasih atas dukungan dan partisipasi Anda”

197
Appendix 1.2. Questionnaire for Household Survey (English Version)
SUSTAINABLE COMMUNITY FORESTRY MANAGEMENT IN
LOMBOK, INDONESIA
QUESTIONNAIRE
Prepared by:
Diswandi
PhD Candidate
Asia Research Centre, Murdoch University
Western Australia
QUESTIONNAIRE FOR HOUSEHOLD SURVEY
(COMMUNITY FORESTRY USER GROUP MEMBERS)
DISCLAIMER
Participation in this survey is entirely voluntary. This study would greatly benefit from your
participation. By participating in this research, you will contribute to policy development and
improvement of Community Forestry and Payment for Ecosystem Services system which is
intended to deliver economic and ecological benefit for the public. However, we respect your
rights to decline. You can choose not to respond to any question or to withdraw from
participation in this survey at any time during the interview.
Participating in this survey means you agree for any excerpt or quote of your opinions and
views to be used in publication of this research.

198
Questionnaire number: …………
Name of Village: ………………………… Date: ……………………………
PART A RESPONDENT IDENTITY
A1. Household code: ………………………………………………
A2. Main respondent’s name: …………………………………………
Others respondent’s name: ………………………………………...
A3. Main
Respondent’s
Age
A4. Respondents’
sex
A5. Main
Respondent’s
ethnicity
A6.
Household
leader
(main
respondent)
A7. The highest
education level in
the household
A8.
Number of
household
members
………
years
d. Male
e. Female
f. Male and
Female
a. Sasak
b. Bali
c. Samawa
d. Mbojo
e. Jawa
f. Bugis
g. Others
a. Yes
b. No
a. Primary School
b. Junior High
School
c. Senior High
School
d. Undergraduate
e. Postgraduate
………
people
A9. How long have you been living in this village?
……………………………….. years
A10. Do you have or use land?
a. Yes
b. No
If yes, please explain:
No Location Use for Size (ha) Type of right
a b c d
1
2
3
4
5

199
PART B. COMMUNITY FORESTRY (CF) MANAGEMENT
B1. What Community Forestry User Group (CFUG) are you involved in?
……………………………………………………………………………………
B2. How long have you been a member of this CFUG?
……………….. years
B3. Does your CF land have a legal permit?
a. Yes
b. No
B4. What is the size of your CF land? ……………………… hectare
Note: mark the location on map
B5. How did you get the land?
a. Granted by government
b. Swapped
c. Bought
d. Inherited
B6. Please specify and rate the benefits you obtain from CF.
a. Income
b. Food
c. Fuel
d. Water
e. Fodder
f. PES
g. Carbon/REDD
h. Medicine
i. Others, please specify: ……………
B7. Who decides the types of use of your land?
a. Husband
b. Wife
c. CFUG
d. NGO
e. Government
f. IMP
g. Others, please specify:
…………………………………………………….…….

200
B8. Please specify the name and number of trees on your land:
No Trees’ Name Total Remark
(a. Wood Trees / b. MPTS)
1 Mahogany
2 Sangon
3 Bajur
4 Rajumas
5 Durian
6 Rambutan
7 Mangoesten
8 Candlenut
9 Pinang
10 Sawo
11 Melinjo
12 Aren
13 Kepundung
14 Jambu
15 Avocado
16 Jackfruit
17 Coffee
18 Cocoa
19 Matoa
20 Mengkudu
21 Others
Total
Proportion of wood trees
Proportion of MPTS
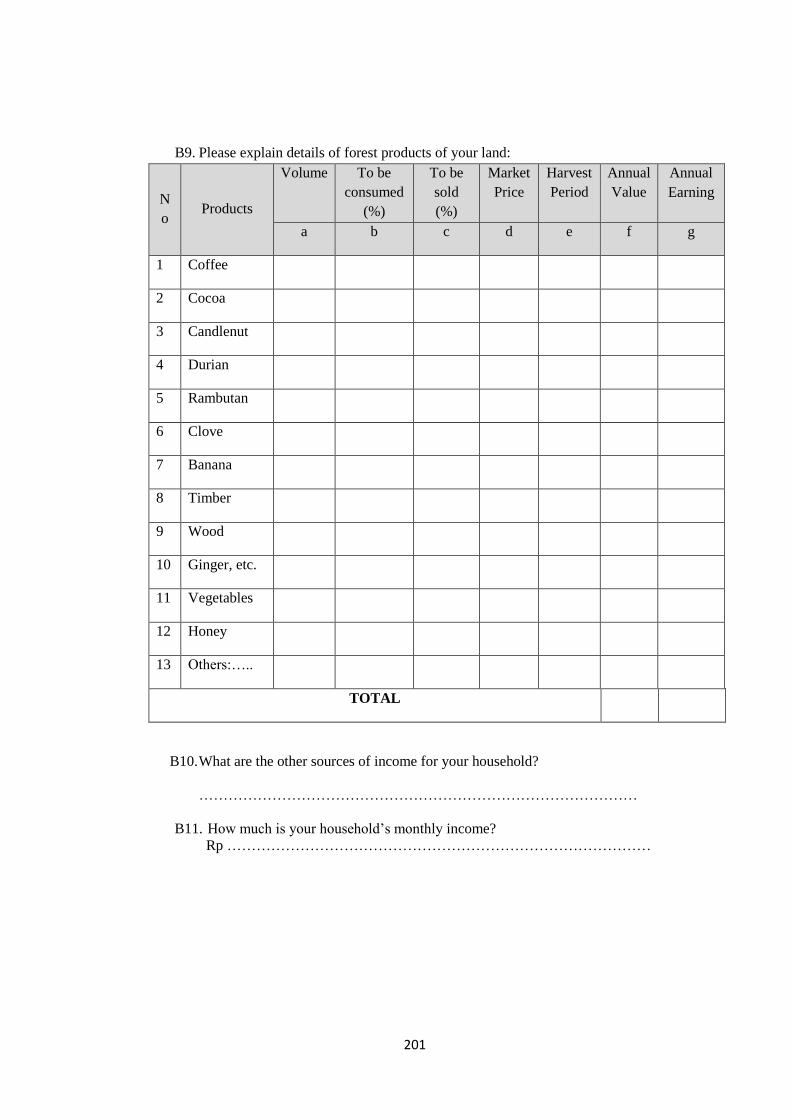
201
B9. Please explain details of forest products of your land:
N
o Products
Volume
To be
consumed
(%)
To be
sold
(%)
Market
Price
Harvest
Period
Annual
Value
Annual
Earning
a b c d e f g
1 Coffee
2 Cocoa
3 Candlenut
4 Durian
5 Rambutan
6 Clove
7 Banana
8 Timber
9 Wood
10 Ginger, etc.
11 Vegetables
12 Honey
13 Others:…..
TOTAL
B10. What are the other sources of income for your household?
………………………………………………………………………………
B11. How much is your household’s monthly income?
Rp ……………………………………………………………………………

202
B12. How much of your household’s income is spent on:
No Expenses Amount
Expense Period Annual Amount
a b c
1 Food
2 Housing
3 Education
4 Health
5 Installment
payment
6 Clothing
7 Electricity, Phone,
Fuel
8 Ceremonies
9 Saving
TOTAL
B13. Does CF contribute to increasing your family’s quality of life?
a. Strongly disagree
b. Disagree
c. Neutral
d. Agree
e. Strongly Agree
Please explain why?
……………………………………………………………………………………
B14. Do you agree that CF contributed to increasing the community’s quality of
life?
a. Strongly disagree
b. Disagree
c. Neutral
d. Agree
e. Strongly Agree
Please explain why?
……………………………………………………………………………………

203
B15. Do you agree that CF contributes to reducing poverty?
a. Strongly disagree
b. Disagree
c. Neutral
d. Agree
e. Strongly Agree
Please explain why?
……………………………………………………………………………………
B16. Have you logged trees on your land?
a. Never
b. Rarely
c. Sometimes
d. Often
e. Very Often
Please explain why?
……………………………………………………………………………………
B17. Do you log trees on your land now?
a. Never
b. Rarely
c. Sometimes
d. Often
e. Very Often
Please explain why?
……………………………………………………………………………………
B18. Does timber get stolen from your land?
a. Never
b. Rarely
c. Sometimes
d. Often
e. Very Often
B19. Do other people log trees in this forest?
a. Never
b. Rarely
c. Sometimes
d. Often
e. Very Often
Please explain why?
……………………………………………………………………………………

204
B20. What kinds of rules are applied to forest management in this village?
a. Adat rules
b. State rules
c. Both adat and state rules
d. Other rules, please specify: ……………………………………
e. Do not know about rules
B21. What are the examples of the rules that should be followed in forest
management and what punishment is applied for not following the rules?
……………………………………………………………………………………
B22. What do you know about adat use in forest governance?
……………………………………………………………………………………
B23. Do you obey adat rules on community forestry management?
a. Strongly disobey
b. Disobey
c. Neutral
d. Obey
e. Strongly Obey
f. Do not know about rules
Please explain why?
……………………………………………………………………………………
B24. Since you joined CFUG, how has the number of trees changed on your land?
a. Increase much
b. Increase
c. The same
d. Decrease
e. Decrease much
B25. Do you agree that the implementation of CF has contributed to reducing
deforestation?
a. Strongly disagree
b. Disagree
c. Neutral
d. Agree
e. Strongly Agree
Please explain why?
……………………………………………………………………………………
B26. Do you agree that adat use has an impact on forest governance?
g. Strongly disagree
h. Disagree
i. Neutral
j. Agree
k. Strongly Agree

205
In what way?
……………………………………………………………………………………
B27. How important is NGO/Government’s assistance for the creation of CF and
PES?
a. Strongly not important
b. Not important
c. Neutral
d. Important
e. Strongly Important
Please explain why?
……………………………………………………………………………………
B28. Please rate for the following assessments of your CF:
Criteria Code Indicators Strongly
Disagree
Disagree Neutral Agree Strongly
Agree
CF’s Land
Governance
B26a Your land size is
sufficient
B26b Your plants
composition fit the CF
regulation (70% trees :
30% MPTS)
B26c You have strong
capacity and skills to
manage your land
CFUG’s
Governance
B26d Your interests are well
accommodated by
your CFUG
B26e You often attend
regular CFUG’s
meetings, CFUG’s
work plans and
capacity buildings
programs
B26f Your CFUG is able to
solve group’s
problems
independently

206
Criteria Code Indicators Strongly
Disagree
Disagree Neutral Agree Strongly
Agree
B26g You obtained support
from government,
NGOs, universities
and other related
parties
CF’s Business
Governance
B26h Your land produces a
stable volume of
commodities
B26i Your CF products’
prices are stable
B29. What do you think are the negative aspects of the CF program?
……………………………………………………………………………………
Please explain why?
……………………………………………………………………………………
B30. Please give your comments or suggestions for improving the CF program

207
PART C. PAYMENT FOR ECOSYSTEM SERVICES (PES) PROGRAM
C1. Are you enrolled in a PES program?
a. Yes
b. No if No, continue to question
C8
Please explain why?
……………………………………………………………………………………
C2. What PES program are you enrolled in?
……………………………………………………………………………………
C3. How long have you been involved in the PES program? ………………. Years
C4. Please specify the benefits you obtain from the PES program:
No. Type of Benefits Amount/
Quantity
Period Annual value
a b C
1 Cash Income
2 Seed
3 Working Capital
4 Non Material,
……………………..
5 Others,
……………………….
C5. What was your income from the PES mostly spent on?
……………………………………………………………………………………
C6. Do you agree that the PES program contributes to increasing your family’s
quality of life?
a. Strongly disagree
b. Disagree
c. Neutral
d. Agree
e. Strongly Agree
Please explain why?
……………………………………………………………………………………

208
C7. Do you agree that the PES program contributes to increasing the quality of life in
the community?
a. Strongly disagree
b. Disagree
c. Neutral
d. Agree
e. Strongly Agree
Please explain why?
……………………………………………………………………………………
C8. Do you agree that the PES program contributes to reducing poverty in the
community?
a. Strongly disagree
b. Disagree
c. Neutral
d. Agree
e. Strongly Agree
Please explain why?
……………………………………………………………………………………
For non PES member, continue to Question C11
C9. Since you enrolled in PES, how has the number of trees changed on your land?
a. Decrease much
b. Decrease
c. The same
d. Increase
e. Increase much
C10. Has the implementation of PES led to an improvement in the quantity and
quality of trees in this forest?
a. Strongly disagree
b. Disagree
c. Neutral
d. Agree
e. Strongly Agree
Please explain why?
……………………………………………………………………………………

209
C11. Do you think that the forest governance rules required to receive PES
compensation are reasonable?
a. Strongly agree
b. Disagree
c. Neutral
d. Agree
e. Strongly Agree
Please explain why?
……………………………………………………………………………………
C12. What do you think are the negative aspects of the PES program?
…..…………………………………………………………………………………
Please explain why?
……………………………………………………………………………………
C13. Please give comments or suggestions for improving the PES program
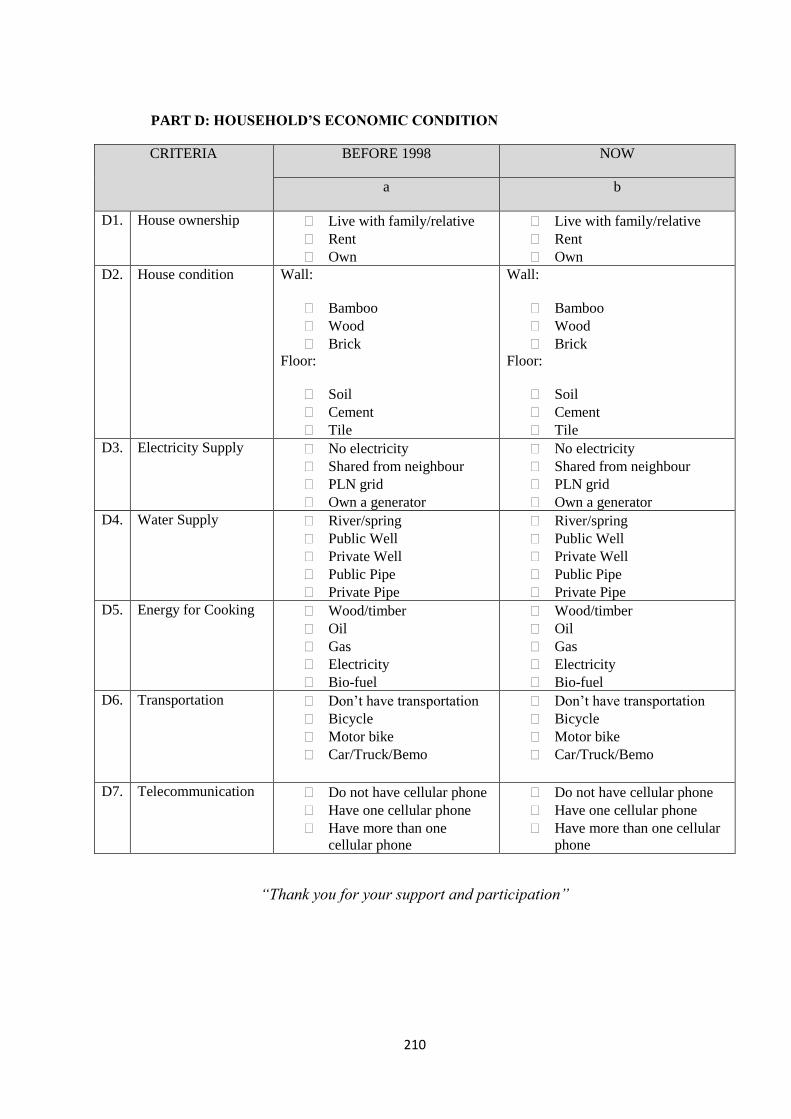
210
PART D: HOUSEHOLD’S ECONOMIC CONDITION
CRITERIA BEFORE 1998 NOW
a b
D1. House ownership Live with family/relative
Rent
Own
Live with family/relative
Rent
Own
D2. House condition Wall:
Bamboo
Wood
Brick
Floor:
Soil
Cement
Tile
Wall:
Bamboo
Wood
Brick
Floor:
Soil
Cement
Tile
D3. Electricity Supply No electricity
Shared from neighbour
PLN grid
Own a generator
No electricity
Shared from neighbour
PLN grid
Own a generator
D4. Water Supply River/spring
Public Well
Private Well
Public Pipe
Private Pipe
River/spring
Public Well
Private Well
Public Pipe
Private Pipe
D5. Energy for Cooking Wood/timber
Oil
Gas
Electricity
Bio-fuel
Wood/timber
Oil
Gas
Electricity
Bio-fuel
D6. Transportation Don’t have transportation
Bicycle
Motor bike
Car/Truck/Bemo
Don’t have transportation
Bicycle
Motor bike
Car/Truck/Bemo
D7. Telecommunication Do not have cellular phone
Have one cellular phone
Have more than one
cellular phone
Do not have cellular phone
Have one cellular phone
Have more than one cellular
phone
“Thank you for your support and participation”

211
Appendix 1.3 Indicative Interview Questions (Bahasa Indonesia Version)
SUSTAINABLE COMMUNITY FORESTRY MANAGEMENT IN LOMBOK,
INDONESIA
PhD Thesis - Diswandi
School of Business and Governance, Murdoch University
INDICATIVE KEY QUESTIONS FOR IN-DEPTH INTERVIEWS
A. Pengelolaan Hutan Kemasyarakatan (HKm)
1. Seberapa efektifkah peranan Kelompok Tani HKm dalam pengelolaan hutan?
2. Jelaskan peranan pemerintah local (Kabupaten/Provinsi) dan Nasional dalam
pengembangan HKm dan dalam mendukung kelompok HKm.
3. Hambatan atau masalah apa saja yang ada dalam pengelolaan HKm? Menurut
Anda, bagaimana cara mengatasi permasalahan tersebut?
4. Apakah Kelompok HKm mampu bertindak sebagai institusi local yang netral
(independen) dan apakah mereka mempunyai kekuatan tawar menawar terhadapa
pihak luar? Jika Iya, jelaskan bagaimana peranan mereka.
5. Apakah program HKm berkontribusi terhadap pengentasan kemiskinan di
Sesaot?
6. Seberapa baik kepemimpinan dalam Kelompok HKm mewakili para anggotanya?
7. Menurut Anda, Kebijakan, Program atau Strategi apa yang harus dikenalkan
(dibuat) untuk memperkuat program HKm?
B. Penggunaan Adat dalam manajemen HKm
1. Bagaimana Anda melihat peranan peranan hukum adat dalam pengelolaan HKm?
2. Apa peranan pemerintah lokal atau nasional dalam penggunaan adat dalam
pengelolaan HKm?
3. Apakah ada kolaborasi atau konflik antara hukum adat dan peraturan Negara
dalam pengelolaan HKm? Berikan contohnya.
4. Seberapa efektifkah aturan adat dalam pengelolaan HKm yang berkelanjutan?
Berikan contohnya.
5. Seberapa bagus kepemimpinan secara adat mewakili ketertarikan komunitas yang
lebih luas dalam pengelolaan hutan, khususnya kaum perempuan dan orang
miskin?
C. HKm dan Kemiskinan
1. Dibandingkan dengan kondisi sebelum adanya HKm, bagaimana Anda melihat
kondisi perekonomian masyarakat di sekitar hutan Sesaot? Bisakah Anda
ungkapkan kontribusi HKm terhadap kehidupan ekonomi masyarakat local?

212
2. Menurut Anda, apakah kaum perempuan, dan golongan kurang mampu
memperoleh manfaat dari program HKm? Jika Iya, bagaimana? Jika tidak, apa
yang kurang dan apa yang harus dilakukan untuk meningkatkan manfaat bagi
mereka?
3. Menurut Anda apakah HKm bisa digunakan sebagai alat untuk mengatasi
kemiskinan? Kenapa?
4. Menurut Anda, bagaimanakah masalah kemiskinan bisa diatasi terutama di
daerah pedesaan di sekitar hutan?
D. HKm dan Deforestasi (Kerusakan Hutan)
1. Dapatkah anda ungkapkan kontribusi HKm terhadap konservasi lingkungan?
2. Apakah ada perubahan dalam kuantitas dan kualitas tutupan hutan dan
Keanekaragaman hutan setelah pelaksanaan program HKm? Bagaiamana
bedanya dengan kondisi sebelum HKm diperkenalkan? Bisa berikan contoh?
E. Pembayaran Jasa Lingkungan (Jasling)
1. Seberapa efektif keterkaitan antara Jasling dengan pengelolaan hutan?
2. Bagaimanakah Jasling memberikan manfaat bagi Kelompok HKm? Apa bentuk
manfaatnya? Jika tidak ada manfaat, kenapa?
3. Seberapa efektifkah Institusi Multi Pihak (IMP) dalam mengelola Jasaling?
4. Apa peranan pemerintah lokal dan nasional dalam pengembangan Jasling?
5. Bisakah Anda identifikasi jenis-jenis biaya (transaksi) yang muncul sebagai
upaya membuat program Jasling?
6. Apakah ada kontrak tertulis antara penyedia dan pengguna jasa lingkungan?
Bagaimana kontrak tersebut dinegosiasikan dan ditegakkan?
7. Seberapa efisienkah program Jasling sebagai upaya untuk mencapai tujuan
konservasi hutan? Menurut Anda, apakah Jasling bisa cukup untuk menjadi
insentif bagi “pengguna hutan” untuk mengelola hutan secara berkelanjutan
sampai dimasa yang akan dating?
8. Apakah Jasling bisa digunakan untuk mengatasi kemiskinan?
9. Apa dampak Jasling bagi pembangunan pedesaan di masyarakat Sesaot? APakah
Jasling memberikan kontribusi yang cukup bagi pembangunan pedesaan dimana
Jasa Lingkungan tersebut diproduksi?
10. Bentuk pembayaran yang bagaimanakah yang terbaik menurut Anda,
pembayaran dalam bentuk tunai atau disalurkan dalam bentuk program
pembangunan pedesaan? Jelaskan kenapa.
11. Bagaimanakah cara terbaik untuk memonitor dan mengevaluasi apakah jasa
lingkungan (air) sudah dirasakan dengan baik oleh “pembeli” seperti tertera
dalam kontrak?
12. Bagaiamanakah program Jasling mempertimbangkan kesetaraan gender?

213
Appendix 1.4 Indicative Interview Questions (English Version)
SUSTAINABLE COMMUNITY FORESTRY MANAGEMENT IN LOMBOK,
INDONESIA
PhD Thesis - Diswandi
School of Business and Governance, Murdoch University
INDICATIVE KEY QUESTIONS FOR IN-DEPTH INTERVIEWS
A. Community Forestry Management
1. How effective is the role of Community Forest User Group (CFUG) in forest
governance?
2. Describe the role of regional (district/provincial) and national governments in
Community Forest (CF) development and in supporting CFUG.
3. Are there any constraints on or problems with the management of CF? How do
you think these constraints should be addressed?
4. Is the CFUG able to act as an independent local institution and does it have
bargaining power with outside agencies? If yes, describe the role it plays.
5. Does the Community Forestry program contribute to poverty alleviation in Sesaot
communities?
6. How well does the CFUG leadership represent its membership?
7. In your opinion, what kind of policy, program or strategy should be introduced to
strengthen and improve the community forestry program?
B. Adat Development in Community Forestry Management
6. How effective is the role of adat in forestry management?
7. What is the role of local or national government in employing adat institutions in
CF management?
8. Is there any collaboration or conflict between adat and state regulation in CF
management? Please give some examples.
9. How effective is adat regulation in managing CF sustainably? Please give an
example.
10. How well does adat leadership represent the interest of the wider community in
forest management, in particular for women and the poor.
C. Community Forestry and Poverty
11. Compared to the condition before the introduction of the CF program, how do
you find the economic condition of people in the Sesaot Forest? Can you
elaborate on the contribution of CF to local people’s livelihoods?
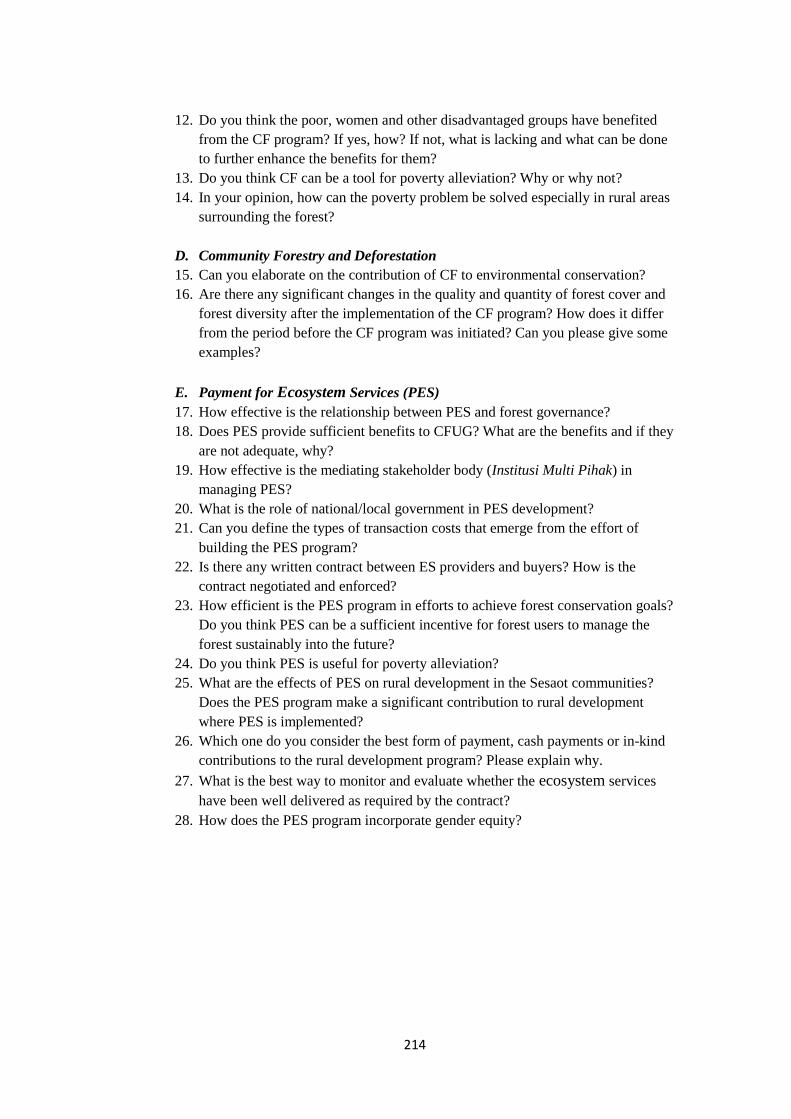
214
12. Do you think the poor, women and other disadvantaged groups have benefited
from the CF program? If yes, how? If not, what is lacking and what can be done
to further enhance the benefits for them?
13. Do you think CF can be a tool for poverty alleviation? Why or why not?
14. In your opinion, how can the poverty problem be solved especially in rural areas
surrounding the forest?
D. Community Forestry and Deforestation
15. Can you elaborate on the contribution of CF to environmental conservation?
16. Are there any significant changes in the quality and quantity of forest cover and
forest diversity after the implementation of the CF program? How does it differ
from the period before the CF program was initiated? Can you please give some
examples?
E. Payment for Ecosystem Services (PES)
17. How effective is the relationship between PES and forest governance?
18. Does PES provide sufficient benefits to CFUG? What are the benefits and if they
are not adequate, why?
19. How effective is the mediating stakeholder body (Institusi Multi Pihak) in
managing PES?
20. What is the role of national/local government in PES development?
21. Can you define the types of transaction costs that emerge from the effort of
building the PES program?
22. Is there any written contract between ES providers and buyers? How is the
contract negotiated and enforced?
23. How efficient is the PES program in efforts to achieve forest conservation goals?
Do you think PES can be a sufficient incentive for forest users to manage the
forest sustainably into the future?
24. Do you think PES is useful for poverty alleviation?
25. What are the effects of PES on rural development in the Sesaot communities?
Does the PES program make a significant contribution to rural development
where PES is implemented?
26. Which one do you consider the best form of payment, cash payments or in-kind
contributions to the rural development program? Please explain why.
27. What is the best way to monitor and evaluate whether the ecosystem services
have been well delivered as required by the contract?
28. How does the PES program incorporate gender equity?
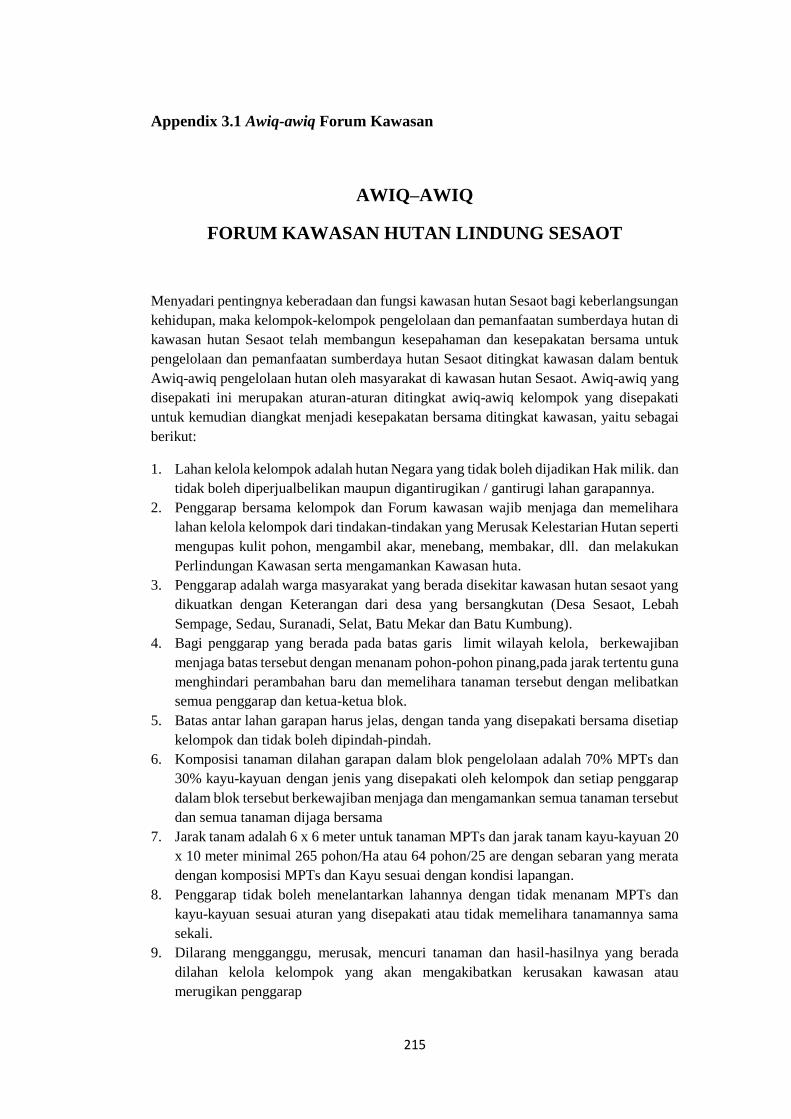
215
Appendix 3.1 Awiq-awiq Forum Kawasan
AWIQ–AWIQ
FORUM KAWASAN HUTAN LINDUNG SESAOT
Menyadari pentingnya keberadaan dan fungsi kawasan hutan Sesaot bagi keberlangsungan
kehidupan, maka kelompok-kelompok pengelolaan dan pemanfaatan sumberdaya hutan di
kawasan hutan Sesaot telah membangun kesepahaman dan kesepakatan bersama untuk
pengelolaan dan pemanfaatan sumberdaya hutan Sesaot ditingkat kawasan dalam bentuk
Awiq-awiq pengelolaan hutan oleh masyarakat di kawasan hutan Sesaot. Awiq-awiq yang
disepakati ini merupakan aturan-aturan ditingkat awiq-awiq kelompok yang disepakati
untuk kemudian diangkat menjadi kesepakatan bersama ditingkat kawasan, yaitu sebagai
berikut:
1. Lahan kelola kelompok adalah hutan Negara yang tidak boleh dijadikan Hak milik. dan
tidak boleh diperjualbelikan maupun digantirugikan / gantirugi lahan garapannya.
2. Penggarap bersama kelompok dan Forum kawasan wajib menjaga dan memelihara
lahan kelola kelompok dari tindakan-tindakan yang Merusak Kelestarian Hutan seperti
mengupas kulit pohon, mengambil akar, menebang, membakar, dll. dan melakukan
Perlindungan Kawasan serta mengamankan Kawasan huta.
3. Penggarap adalah warga masyarakat yang berada disekitar kawasan hutan sesaot yang
dikuatkan dengan Keterangan dari desa yang bersangkutan (Desa Sesaot, Lebah
Sempage, Sedau, Suranadi, Selat, Batu Mekar dan Batu Kumbung).
4. Bagi penggarap yang berada pada batas garis limit wilayah kelola, berkewajiban
menjaga batas tersebut dengan menanam pohon-pohon pinang,pada jarak tertentu guna
menghindari perambahan baru dan memelihara tanaman tersebut dengan melibatkan
semua penggarap dan ketua-ketua blok.
5. Batas antar lahan garapan harus jelas, dengan tanda yang disepakati bersama disetiap
kelompok dan tidak boleh dipindah-pindah.
6. Komposisi tanaman dilahan garapan dalam blok pengelolaan adalah 70% MPTs dan
30% kayu-kayuan dengan jenis yang disepakati oleh kelompok dan setiap penggarap
dalam blok tersebut berkewajiban menjaga dan mengamankan semua tanaman tersebut
dan semua tanaman dijaga bersama
7. Jarak tanam adalah 6 x 6 meter untuk tanaman MPTs dan jarak tanam kayu-kayuan 20
x 10 meter minimal 265 pohon/Ha atau 64 pohon/25 are dengan sebaran yang merata
dengan komposisi MPTs dan Kayu sesuai dengan kondisi lapangan.
8. Penggarap tidak boleh menelantarkan lahannya dengan tidak menanam MPTs dan
kayu-kayuan sesuai aturan yang disepakati atau tidak memelihara tanamannya sama
sekali.
9. Dilarang mengganggu, merusak, mencuri tanaman dan hasil-hasilnya yang berada
dilahan kelola kelompok yang akan mengakibatkan kerusakan kawasan atau
merugikan penggarap

216
10. Dilarang memindahkan lahan kelola kepada pihak lain tanpa melalui mekanisme
kelompok dan Pemindahan hak kelola lahan dari orang tua kepada anaknya harus
dilakukan melalui kesepakatan dan mekanisme kelompok.
11. Tidak boleh tinggal menetap di dalam kawasan hutan dan membuat pondok permanen
dalam kawasan hutan.
12. Dilarang beternak didalam kawasan hutan.
13. Untuk Penggarap yang lokasinya dekat mata air, daerah tebing, terjal, maka
berkewajiban menanam tanaman pelindung mata air dan pelindung tebing untuk
melindungi mata air dan menghindari longsor dengan tanaman yang telah disepakati
14. Dilarang melakukan galian C dalam kawasan hutan.
15. Bagi masyarakat yang menyaksikan pelanggaran di dalam kawasan, berkewajiban
melaporkan hal tersebut pada kelompok dan pelapor diberikan perlindungan dan
identitasnya dirahasiakan.
16. Seluruh penggarap bersedia mematuhi awiq-awiq yang telah disepakati bersama dalam
kelompok.
HAK PENGELOLA / PENGGARAP KAWASAN
1. Penggarap berhak mengelola Hasil Hutan Bukan Kayu (HHBK) dan Tanaman
Dibawah Tegakan.
2. Untuk penggerap yang berada di batas garis limit, berhak memperoleh pengurangan
pembayaran bagi hasil sebesar 50 %.
3. Jika terjadi kayu tumbang yang diakibatkan oleh peristiwa alam, maka kelompok dan
anggota penggarap melakukan koordinasi dengan pihak kehutanan dengan
memanfaatkan kayu yang tumbang tersebut.
4. Jika terjadi penebangan secara legal oleh pemerintah, maka kelompok dan penggarap
berhak mendapat bagian dari penebangan tersebut
5. Kelompok berhak mendapat bagian tertentu dari bagi hasil garapan untuk dijadikan
asset kelompok guna menegakkan awiq-awiq ini.
SANKSI BAGI PENEGAKAN AWIQ-AWIQ PENGELOLAAN KAWASAN
1. Barang siapa merubah/memindahkan batas garapan maka akan diberikan sanksi sesuai
dengan musyawarah di tingkat kelompok
2. Bagi penggarap yang tidak mencapai 30 % tanaman kayu dan 70 % tanaman MPTs
akan diberikan teguran 3 kali, teguran tertulis 1 kali, dan jika penggarap tidak mampu
memenuhinya karena ketidaksanggupannya maka lahan kelolanya akan diambil oleh
kelompok dan diserahkan kepada anggota yang memerlukannya sesuai dengan
musyawarah kelompok.
3. Barang siapa yang telah menelantarkan lahannya dengan tidak menanam MPTs dan
kayu-kayuan sesuai aturan yang disepakati atau tidak memelihara tanamannya sama
sekali, maka
a. Akan diberi teguran lisan, dan jika dalam jangka waktu 1 bulan tidak diindahkan
maka akan diberikan peringatan tertulis.
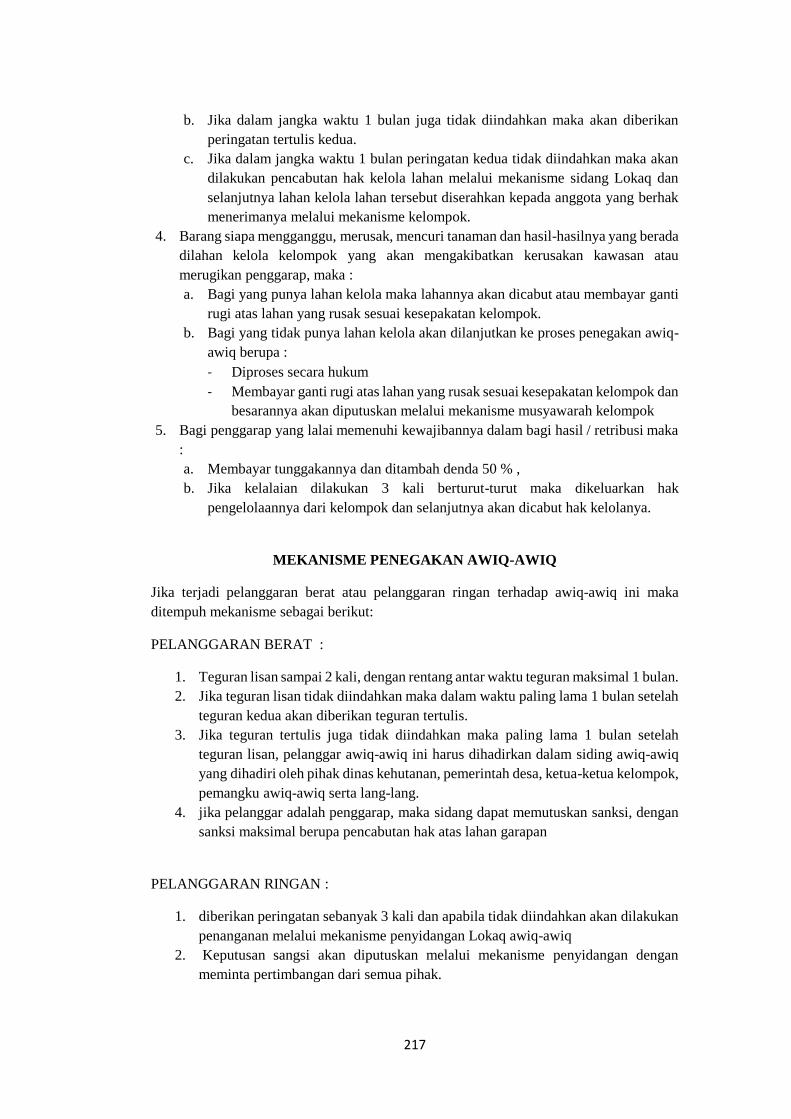
217
b. Jika dalam jangka waktu 1 bulan juga tidak diindahkan maka akan diberikan
peringatan tertulis kedua.
c. Jika dalam jangka waktu 1 bulan peringatan kedua tidak diindahkan maka akan
dilakukan pencabutan hak kelola lahan melalui mekanisme sidang Lokaq dan
selanjutnya lahan kelola lahan tersebut diserahkan kepada anggota yang berhak
menerimanya melalui mekanisme kelompok.
4. Barang siapa mengganggu, merusak, mencuri tanaman dan hasil-hasilnya yang berada
dilahan kelola kelompok yang akan mengakibatkan kerusakan kawasan atau
merugikan penggarap, maka :
a. Bagi yang punya lahan kelola maka lahannya akan dicabut atau membayar ganti
rugi atas lahan yang rusak sesuai kesepakatan kelompok.
b. Bagi yang tidak punya lahan kelola akan dilanjutkan ke proses penegakan awiq-
awiq berupa :
- Diproses secara hukum
- Membayar ganti rugi atas lahan yang rusak sesuai kesepakatan kelompok dan
besarannya akan diputuskan melalui mekanisme musyawarah kelompok
5. Bagi penggarap yang lalai memenuhi kewajibannya dalam bagi hasil / retribusi maka
:
a. Membayar tunggakannya dan ditambah denda 50 % ,
b. Jika kelalaian dilakukan 3 kali berturut-turut maka dikeluarkan hak
pengelolaannya dari kelompok dan selanjutnya akan dicabut hak kelolanya.
MEKANISME PENEGAKAN AWIQ-AWIQ
Jika terjadi pelanggaran berat atau pelanggaran ringan terhadap awiq-awiq ini maka
ditempuh mekanisme sebagai berikut:
PELANGGARAN BERAT :
1. Teguran lisan sampai 2 kali, dengan rentang antar waktu teguran maksimal 1 bulan.
2. Jika teguran lisan tidak diindahkan maka dalam waktu paling lama 1 bulan setelah
teguran kedua akan diberikan teguran tertulis.
3. Jika teguran tertulis juga tidak diindahkan maka paling lama 1 bulan setelah
teguran lisan, pelanggar awiq-awiq ini harus dihadirkan dalam siding awiq-awiq
yang dihadiri oleh pihak dinas kehutanan, pemerintah desa, ketua-ketua kelompok,
pemangku awiq-awiq serta lang-lang.
4. jika pelanggar adalah penggarap, maka sidang dapat memutuskan sanksi, dengan
sanksi maksimal berupa pencabutan hak atas lahan garapan
PELANGGARAN RINGAN :
1. diberikan peringatan sebanyak 3 kali dan apabila tidak diindahkan akan dilakukan
penanganan melalui mekanisme penyidangan Lokaq awiq-awiq
2. Keputusan sangsi akan diputuskan melalui mekanisme penyidangan dengan
meminta pertimbangan dari semua pihak.

218
Demi menjaga kelestarian hutan dan keberlangsungan pemanfaatan hasil hutan serta
kesepakatan yang telah terbangun untuk tujuan tersebut maka awiq-awiq ini harus
dilaksanakan secara tegas, konsisten dan tanpa pandang bulu.
Ditetapkan : Di Sesaot
Pada tanggal : Desember 2006
Penandatangan:
Ketua Forum Kawasan Hutan Sesaot
Ketua Kelompok Forum Ranget
Ketua Kelompok Wana Dharma
Ketua Kelompok Wana Lestari
Ketua Kelompok KMPH Mitra Sesaot
Ketua Kelompok Wana Abadi
Mengetahui
Kepala Desa Sesaot
Kepala Desa Sedau
Kepala Desa Lebah Sempage
Kepala Desa Batu Mekar
Kepala Desa Suranadi
Kepolisian Sektor Narmada
KRDKP Sesaot
KRDKP Lebah Sempage
Dinas Kehutanan
Kabupaten Lombok Barat
Dinas Kehutanan Prov NTB

219
Appendix 4.1 IMP Report Published on Local Media (Lombok Post, 30 May
2011)

220
Appendix 5.1 Global Forest Watch - Forest Change Analysis

221
Appendix 5.2 T Test for Farmers’ Logging Practice before and after
establishment of Community Forestry Program
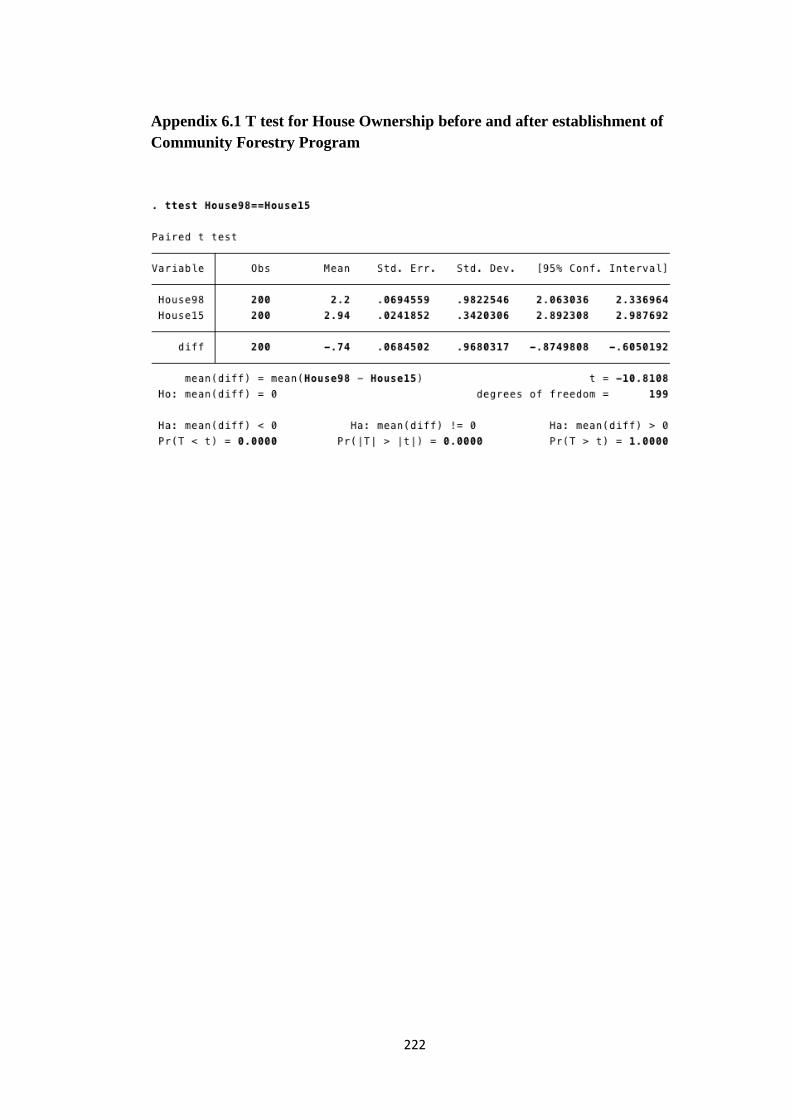
222
Appendix 6.1 T test for House Ownership before and after establishment of
Community Forestry Program

223
Appendix 7.1 Regression Result

224
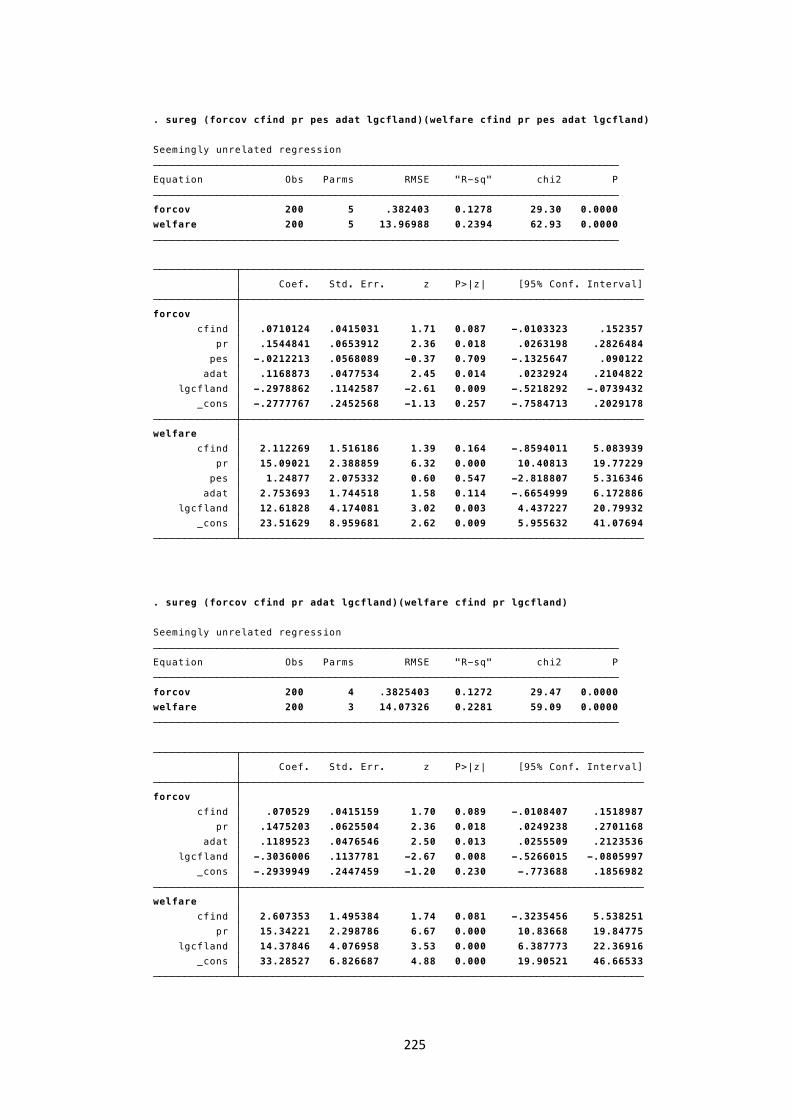
225
226
Bibliography
Adhikari, Bhim, Williams, Frances and Lovett, Jon C. (2007). Local benefits from
community forests in the middle hills of Nepal. Forest Policy and
Economics, 9(5), 464-478. doi: http://dx.doi.org/10.1016/j.forpol.2005.11.002
Adhikari, Sunit, Kingi, Tanira and Ganesh, Siva. (2014). Incentives for
community participation in the governance and management of common
property resources: the case of community forest management in Nepal.
Forest Policy and Economics, 44(0), 1-9. doi: http://dx.doi.org/10.1016/j.forpol.2014.04.003
Agarwal, Bina. (2009). Gender and forest conservation: The impact of women's
participation in community forest governance. Ecological Economics,
68(11), 2785-2799. doi: http://dx.doi.org/10.1016/j.ecolecon.2009.04.025
Aggarwal, Rimjhim M. (2006). Globalization, local ecosystems, and the rural
poor. World Development, 34(8), 1405-1418. doi:
10.1016/j.worlddev.2005.10.011
Agrawal, Arun. (1996). The community vs. the market and the state: Forest use in
Uttarakhand in the Indian Himalayas. Journal of Agricultural and
Environmental Ethics, 9(1), 1-15.
Agrawal, Arun. (2001a). Common Property Institutions and Sustainable
Governance of Resources. World Development, 29(10), 1649-1672. doi:
10.1016/S0305-750X(01)00063-8
Agrawal, Arun. (2001b). Common property, forest management and the Indian
Himalaya. Contributions to Indian Sociology, 35(2), 181-212. doi:
10.1177/006996670103500202
Agrawal, Arun. (2003). Sustainable Governance of Common-Pool Resources:
Context, Methods, and Politics. Annual Review of Anthropology, 32, 243-
262.
Agrawal, Arun. (2007). Forests, Governance, and Sustainability: Common
Property Theory and its Contributions. International Journal of the
Commons, 1(1), 111-136.
Agrawal, Arun and Chhatre, Ashwini. (2006). Explaining success on the
commons: Community forest governance in the Indian Himalaya. World
Development, 34(1), 149-166. doi: http://dx.doi.org/10.1016/j.worlddev.2005.07.013
Agrawal, Arun, Nepstad, Daniel and Chhatre, Ashwini. (2011). Reducing
Emissions from Deforestation and Forest Degradation. Annual Review of
Environment and Resources, 36, 373-396. doi: 10.1146/annurev-environ-
042009-094508
Agrawal, Arun and Ostrom, Elinor. (2001). Collective Action, Property Rights,
and Decentralization in Resource Use in India and Nepal. Politics &
Society, 29(4), 485-514. doi: 10.1177/0032329201029004002
Anderies, John M. and Janssen, Marco A. (2013). Sustaining the Commons.
Tempe, AZ: Center for the Study of Institutional Diversity.

227
Anderson, Candace, Beazley, Karen and Boxall, James. (2009). Lessons for
PPGIS from the application of a decision-support tool in the Nova Forest
Alliance of Nova Scotia, Canada. Journal of Environmental Management,
90(6), 2081-2089. doi: http://dx.doi.org/10.1016/j.jenvman.2007.08.031
Araujo, Claudio, Bonjean, Catherine Araujo, Combes, Jean-Louis, Combes Motel,
Pascale and Reis, Eustaquio J. (2009). Property rights and deforestation in
the Brazilian Amazon. Ecological Economics, 68(8–9), 2461-2468. doi: http://dx.doi.org/10.1016/j.ecolecon.2008.12.015
Arnold, J. E. (1987). Community forestry. Ambio, 16(2), 122-128.
Attwood, DW. (1992). State vs. local control in common resource management: a
comparative analysis. Sociological bulletin, 41(1/2), 1-17.
Bae, J.S., Kim, C., Kim, Y.S., Latifah, S., Afifi, M., Fisher, L.A., . . . Kim, J.S.
(2014). Opportunities for implementing REDD+ to enhance sustainable
forest management and improve livelihoods in Lombok, NTB, Indonesia.
Bogor, Indonesia: Center for International Forestry Research (CIFOR).
Baland, Jean-Marie and Platteau, Jean-Philippe. (1996). Halting degradation of
natural resources: is there a role for rural communities? Rome: Food &
Agriculture Organization.
Barber, Charles Victor. (1998). Forest resource scarcity & social conflict in
Indonesia. Environment: Science and Policy for Sustainable Development,
40(4), 4-9.
Barr, Christopher, Dermawan, Ahmad, Purnomo, Herry and Komarudin, Heru.
(2010). Financial governance and Indonesia’s Reforestation Fund during
the Soeharto and post-Soeharto periods, 1989–2009: A political economic
analysis of lessons for REDD+ (Vol. 52): CIFOR.
Barr, Christopher and Sayer, Jeffrey. (2012). The political economy of
reforestation and forest restoration in Asia–Pacific: Critical issues for
REDD+. Biological Conservation, 154(0), 9-19. doi: http://dx.doi.org/10.1016/j.biocon.2012.03.020
Barsimantov, James and Kendall, Jake. (2012). Community Forestry, Common
Property, and Deforestation in Eight Mexican States. Journal of
Environment and Development, 21(4), 414-437. doi: 10.1605/01.301-
0021015068.2012
Bellinger, Sarah and Gale, Fred. (2004). Models of Community Forestry.
Australasian Journal of Environmental Management, 11(1), 65-77. doi:
10.1080/14486563.2004.10648599
Bennett, Michael T., Mehta, Aashish and Xu, Jintao. (2011). Incomplete property
rights, exposure to markets and the provision of environmental services in
China. China Economic Review, 22(4), 485-498. doi: http://dx.doi.org/10.1016/j.chieco.2010.12.002
Berkes, Fikret. (2009). Evolution of co-management: Role of knowledge
generation, bridging organizations and social learning. Journal of
Environmental Management, 90(5), 1692-1702. doi: http://dx.doi.org/10.1016/j.jenvman.2008.12.001
Beyene, Abebe D. and Koch, Steven F. (2013). Property rights, institutions and
choice of fuelwood source in rural Ethiopia. Forest Policy and Economics,
30(0), 30-38. doi: http://dx.doi.org/10.1016/j.forpol.2013.02.002

228
Bhattacharya, Haimanti and Lueck, Dean. (2009). The role of property rights in
determining the environmental quality–income relationship. Ecological
Economics, 68(10), 2511-2524. doi: http://dx.doi.org/10.1016/j.ecolecon.2009.04.023
Birch, Jennifer C., Thapa, Ishana, Balmford, Andrew, Bradbury, Richard B.,
Brown, Claire, Butchart, Stuart H. M., . . . Thomas, David H. L. (2014).
What benefits do community forests provide, and to whom? A rapid
assessment of ecosystem services from a Himalayan forest, Nepal.
Ecosystem Services, 8(0), 118-127. doi: http://dx.doi.org/10.1016/j.ecoser.2014.03.005
Börner, Jan, Wunder, Sven, Wertz-Kanounnikoff, Sheila, Tito, Marcos Rügnitz,
Pereira, Ligia and Nascimento, Nathalia. (2010). Direct conservation
payments in the Brazilian Amazon: Scope and equity implications.
Ecological Economics, 69(6), 1272-1282. doi: http://dx.doi.org/10.1016/j.ecolecon.2009.11.003
Borrini-Feyerabend, Grazia. (1996). Collaborative Management of Protected
Areas: Tailoring the Approach to the Context. Gland: IUCN.
Borrini-Feyerabend, Grazia, Farvar, M Taghi, Renard, Yves, Pimbert, Michel P
and Kothari, Ashish. (2004). Sharing power: A global guide to
collaborative management of natural resources throughout the world.
Cenesta, Tehran: IIED and IUCN/CEESP/CMWG.
Bottazzi, Patrick, Cattaneo, Andrea, Rocha, David Crespo and Rist, Stephan.
(2013). Assessing sustainable forest management under REDD: a
community-based labour perspective. Ecological economics, 93, 94-103.
doi: 10.1016/j.ecolecon.2013.05.003
Boumans, Marcel and Morgan, Mary S. (2001). Ceteris paribus conditions:
materiality and the application of economic theories. Journal of Economic
Methodology, 8(1), 11-26.
Boyd, James and Banzhaf, Spencer. (2007). What are ecosystem services? The
need for standardized environmental accounting units. Ecological
Economics, 63(2), 616-626. doi: 10.1016/j.ecolecon.2007.01.002
BPS. (2014). Jumlah dan Persentase Penduduk Miskin Di Provinsi NTB 2002-
2014. Retrieved 23 February 2017, from http://ntb.bps.go.id/linkTabelStatis/view/id/72
BPS (Cartographer). (2015a). Desa di Sekitar Rinjani.
BPS. (2015b). Luas Kawasan Hutan dan Perairan Menurut Provinsi. Retrieved
23/11/2016, 2016, from https://www.bps.go.id/linkTabelStatis/view/id/1716
BPS. (2016a). Garis Kemiskinan Menurut Provinsi. Retrieved 29/06/2016, 2016,
from https://www.bps.go.id/linkTableDinamis/view/id/1120
BPS. (2016b). Persentase Penduduk Miskin Provinsi NTB, 2010 - 2016: Badan
Pusat Statistik.
BPS NTB. (2014). Nusa Tenggara Barat Dalam Angka 2013. Mataram: Badan
Pusat Statistik.
Bremer, Leah L., Farley, Kathleen A., Lopez-Carr, David and Romero, José.
(2014). Conservation and livelihood outcomes of payment for ecosystem
services in the Ecuadorian Andes: What is the potential for ‘win–win’?
Ecosystem Services, 8(0), 148-165. doi: http://dx.doi.org/10.1016/j.ecoser.2014.03.007

229
Brockhaus, Maria, Obidzinski, Krystof, Dermawan, Ahmad, Laumonier, Yves
and Luttrell, Cecilia. (2012). An overview of forest and land allocation
policies in Indonesia: Is the current framework sufficient to meet the needs
of REDD+? Forest Policy and Economics, 18(0), 30-37. doi: http://dx.doi.org/10.1016/j.forpol.2011.09.004
Bromley, Daniel W. (1992). The commons, common property, and environmental
policy. Environmental and resource economics, 2(1), 1-17.
Brown, Jessica and Bird, Neil. (2010). Costa Ricas's Sustainable Resource
Management : Successfully Takling Tropical Deforestation. United
Kingdom: Overseas Development Institute.
Bryman, Alan. (2015). Social research methods. Oxford: Oxford University Press.
Bullock, Ryan CL and Hanna, Kevin S. (2012). Community forestry: local values,
conflict and forest governance: Cambridge University Press.
Bupati Lombok Barat and Walikota Mataram. (2011). Kesepakatan Bersama
Bupati Lombok Barat dengan Walikota Mataram tentang Kerjasama
Program Pelestarian Sumberdaya Alam di Wilayah Kabupaten Lombok
Barat dan Kota Mataram. Mataram.
Burns, Robert Bounds. (1997). Introduction to research methods. New South
Wales: Addison Wesley Longman.
Calvo-Alvarado, J., McLennan, B., Sánchez-Azofeifa, A. and Garvin, T. (2009).
Deforestation and forest restoration in Guanacaste, Costa Rica: Putting
conservation policies in context. Forest Ecology and Management, 258(6),
931-940. doi: http://dx.doi.org/10.1016/j.foreco.2008.10.035
Carlsson, Lars and Berkes, Fikret. (2005). Co-management: concepts and
methodological implications. Journal of environmental management,
75(1), 65-76.
Charnley, Susan and Poe, Melissa R. (2007). Community Forestry in Theory and
Practice: Where Are We Now? Annual Review of Anthropology, 36, 301-
336. doi: 10.1146/annurev.anthro.35.081705.123143
Christie, Mike, Fazey, Ioan, Cooper, Rob, Hyde, Tony and Kenter, Jasper O.
(2012). An evaluation of monetary and non-monetary techniques for
assessing the importance of biodiversity and ecosystem services to people
in countries with developing economies. Ecological Economics, 83(0), 67-
78. doi: http://dx.doi.org/10.1016/j.ecolecon.2012.08.012
Clements, Tom, John, Ashish, Nielsen, Karen, An, Dara, Tan, Setha and Milner-
Gulland, E. J. (2010). Payments for biodiversity conservation in the
context of weak institutions: Comparison of three programs from
Cambodia. Ecological Economics, 69(6), 1283-1291. doi: http://dx.doi.org/10.1016/j.ecolecon.2009.11.010
Coase, Ronald H. (1960). The Problem of Social Cost. Journal of Law and
Economics, 3, 1-44.
Cole, D. H., Epstein, G. and McGinnis, M. D. (2014). Digging deeper into
Hardin's pasture: the complex institutional structure of 'the tragedy of the
commons'. Journal of Institutional Economics, 10(3), 353-369. doi:
10.1017/S1744137414000101
Coleman, James S. (1973). Mathematics of collective action. New Jersey:
Transaction Publishers.

230
Coleman, James S. and Fararo, Thomas J. (1992). Rational Choice Theory:
Advance and Critique. London: SAGE Publications.
Conklin, Harold C. (1954). Section of anthropology: An Ethnoecological
approach to shifting agriculture. Transactions of the New York Academy of
Sciences, 17(2 Series II), 133-142.
Cornia, Giovanni Andrea. (1985). Farm size, land yields and the agricultural
production function: An analysis for fifteen developing countries. World
Development, 13(4), 513-534. doi: http://dx.doi.org/10.1016/0305-750X(85)90054-3
Costanza, Robert, Paruelo, Jose, Raskin, Robert G., Sutton, Paul, Van Den Belt,
Marjan, D'Arge, Ralph, . . . O'Neill, Robert V. (1997). The value of the
world's ecosystem services and natural capital. Nature, 387(6630), 253-
260. doi: 10.1038/387253a0
Craven, BD and Islam, Sardar MN. (2011). Ordinary least-squares regression:
Sage Publications.
Creswell, John W and Plano-Clark, VL. (2006). Understanding mixed methods
research. London: Sage Publications.
Daniels, Amy E., Bagstad, Kenneth, Esposito, Valerie, Moulaert, Azur and
Rodriguez, Carlos Manuel. (2010). Understanding the impacts of Costa
Rica's PES: Are we asking the right questions? Ecological Economics,
69(11), 2116-2126. doi: http://dx.doi.org/10.1016/j.ecolecon.2010.06.011
Darma Lestari. (2011). Proposal Perlindungan Sumber Mata Air di Kawasan
Hutan Sesaot. Darma Lestari. Gerung.
Dhakal, Bhubaneswor, Bigsby, Hugh and Cullen, Ross. (2007). The Link between
Community Forestry Policies and Poverty and Unemployment in Rural
Nepal. Mountain Research and Development, 27(1), 32-39.
Dhakal, Bhubaneswor, Bigsby, Hugh and Cullen, Ross. (2012). Socioeconomic
Impacts of Public Forest Policies on Heterogeneous Agricultural
Households. Environmental and Resource Economics, 53(1), 73-95. doi:
10.1007/s10640-012-9548-4
Dietz, Thomas, Ostrom, Elinor, Dolsak, Nives and Stern, Paul C. (2002). The
drama of the commons. In Thomas Dietz, Elinor Ostrom, Nives Dolsak,
Paul C Stern, Susan StonichandElke U Weber (Eds.), The drama of the
commons: National Academies Press.
Dinas Kehutanan Kabupaten Lombok Barat. (2014). Luas Hutan dan Lahan Kritis
di Kabupaten Lombok Barat: Dinas Kehutanan Lombok Barat.
Dinas Kehutanan Provinsi NTB. (2013a). Data Luas Kesatuan Pengelolaan
Hutan (KPH) NTB. Mataram: Dinas Kehutanan Provinsi NTB.
Dinas Kehutanan Provinsi NTB (Cartographer). (2013b). Peta KPH NTB.
Dinas Kehutanan Provinsi NTB. (2014). Statistik Dinas Kehutanan Provinsi NTB
Tahun 2014. Mataram: Dinas Kehutanan NTB.
Dinas Pertambangan dan Energi Kabupaten Lombok Barat. (2014). Pemakaian
Air Bawah Tanah Tahun 2014 Kabupaten Lombok Barat. Gerung: Dinas
Pertambangan dan Energi.
Duncan, E. (2006). Payments for environmental services: An equitable approach
for reducing poverty and conserving nature. WWF-World Wide Fund for
Nature (Formerly World Wildlife Fund), Gland, Switzerland.

231
Edmonds, Eric V. (2002). Government-initiated community resource management
and local resource extraction from Nepal's forests. Journal of Development
Economics, 68(1), 89-115. doi: http://dx.doi.org/10.1016/S0304-3878(02)00007-X
Ehrlich, P.R. and Ehrilch, A.H. (1981). Exctinction: the cause and consequences
of the disappearance of species. New York: Random House.
Engel, Stefanie, Pagiola, Stefano and Wunder, Sven. (2008). Designing payments
for environmental services in theory and practice: An overview of the
issues. Ecological Economics, 65(4), 663-674. doi: http://dx.doi.org/10.1016/j.ecolecon.2008.03.011
Engel, Stefanie and Palmer, Charles. (2008). Payments for environmental services
as an alternative to logging under weak property rights: The case of
Indonesia. Ecological Economics, 65(4), 799-809. doi: http://dx.doi.org/10.1016/j.ecolecon.2007.07.028
FAO. (2005). Global forest resource assessment update 2005. Rome: FAO.
Fauzi, Akhmad and Anna, Zuzy. (2013). The complexity of the institution of
payment for environmental services: A case study of two Indonesian PES
schemes. Ecosystem Services, 6(0), 54-63. doi: http://dx.doi.org/10.1016/j.ecoser.2013.07.003
Feeny, David, Berkes, Fikret, McCay, Bonnie J and Acheson, James M. (1990).
The tragedy of the commons: twenty-two years later. Human ecology,
18(1), 1-19.
Ferraro, Paul J. (2001). Global Habitat Protection: Limitations of Development
Interventions and a Role for Conservation Performance Payments.
Conservation Biology, 15(4), 990-1000. doi: 10.1046/j.1523-
1739.2001.015004990.x
Ferraro, Paul J. (2008). Asymmetric information and contract design for payments
for environmental services. Ecological Economics, 65(4), 810-821. doi: http://dx.doi.org/10.1016/j.ecolecon.2007.07.029
Ferraro, Paul J. and Kiss, Agnes. (2002). Ecology. Direct payments to conserve
biodiversity. Science (New York, N.Y.), 298(5599), 1718-1719. doi:
10.1126/science.1078104
Fiebig, Denzil G. (2001). Seemingly unrelated regression. A companion to
theoretical econometrics, 101-121.
Fisher, Brendan, Turner, R. Kerry and Morling, Paul. (2009). Defining and
classifying ecosystem services for decision making. Ecological
Economics, 68(3), 643-653. doi: http://dx.doi.org/10.1016/j.ecolecon.2008.09.014
Forslund, Anna, Renöfält, Birgitta Malm, Barchiesi, Stefano, Cross, Katharine,
Davidson, Sarah, Farrell, Tracy, . . . Meijer, Karen. (2009). Securing water
for ecosystems and human well-being: The importance of environmental
flows. Swedish Water House Report, 24.
Forum Kawasan. (2006). Profil dan Awiq-awiq Forum Kawasan Hutan Lindung
Sesaot: Forum Kawasan.
Forum Kawasan. (2009). Profil Sesaot: Forum Kawasan.
Forum Kawasan. (2011a). Kronologis Kasus Illegal Logging di Kawasan Hutan
Sesaot: Forum Kawasan.

232
Forum Kawasan. (2011b). Sejarah Pengelolaan Kawasan Hutan Lindung Sesaot
Mataram: Forum Kawasan.
Forum Kawasan. (2014). Rekapitulasi Data Penggarap HKm Sesaot. Mataram:
Forum Kawasan.
Fox, Jefferson. (1993). The Tragedy of Open Access. In Harold Brookfield and
Yvonne Byron (Ed.), Southeast Asia’s Environmental Future: The Search
for Sustainability. Tokyo: Oxford University Press
Fox, Jefferson, Lynch, Owen, Zimsky, Mark, Moore, Erin and Takeuchi, Helen.
(1993). Legal frameworks for forest management in Asia: Case studies of
community/state relations.
FWI/GFW. (2011). Potret Keadaan Hutan Indonesia Periode Tahun 2000-2009.
Bogor and Washington DC: Forest Watch Indonesia
Gardner, Toby A., Burgess, Neil D., Aguilar-Amuchastegui, Naikoa, Barlow, Jos,
Berenguer, Erika, Clements, Tom, . . . Vieira, Ima C. G. (2012). A
framework for integrating biodiversity concerns into national REDD+
programmes. Biological Conservation, 154(0), 61-71. doi: http://dx.doi.org/10.1016/j.biocon.2011.11.018
GFW. (2016). Forest Change Analysis. Retrieved 02/08/2016 http://www.globalforestwatch.org/map/10/-8.45/116.26/ALL/grayscale/loss,forestgain?tab=analysis-tab&begin=2001-01-01&end=2017-01-01&threshold=30&dont_analyze=true
GFW. (2017). Country Profiles: Indonesia. Retrieved 24/03/2017, from http://www.globalforestwatch.org/country/IDN
Gibson, Clark C, Lehoucq, Fabrice E and Williams, John T. (2002). Does
privatization protect natural resources? Property rights and forests in
Guatemala. Social Science Quarterly, 83(1), 206-225.
Gibson, Clark C, Williams, John T and Ostrom, Elinor. (2005). Local
Enforcement and Better Forests. World Development, 33(2), 273-284. doi:
10.1016/j.worlddev.2004.07.013
Gómez-Baggethun, Erik, de Groot, Rudolf, Lomas, Pedro L. and Montes, Carlos.
(2010). The history of ecosystem services in economic theory and
practice: From early notions to markets and payment schemes. Ecological
Economics, 69(6), 1209-1218. doi: http://dx.doi.org/10.1016/j.ecolecon.2009.11.007
Google (Cartographer). (2015a). Map of Lombok Island.
Google (Cartographer). (2015b). Map of Sesaot Forest.
Greiner, R and Stanley, O. (2013). More than money for conservation: Exploring
social co-benefits from PES schemes. Land Use Policy, 31(0), 4-10. doi: http://dx.doi.org/10.1016/j.landusepol.2011.11.012
Greiner, R., Gordon, I. and Cocklin, C. (2009). Ecosystem services from tropical
savannas: economic opportunities through payments for environmental
services. Rangeland Journal, 31(1), 51-59. doi: 10.1071/RJ08067
Gultom, Magdalena, Lawrence, David, Filer, Colin, Potter, Lesley and
Resosudarmo, Budy. (2013). Local Management Arrangements in Sesaot
Forest, Lombok Indonesia. International Journal of Environmental
Technology and Management, 4(1).

233
Gunter, Jennifer and Jodway, Shawn. (2000). Community-Based Natural
Resource Management: a Strategy for Community Economic
Development. Burnaby: Simon Fraser University.
Hardin, Garrett. (1968). The Tragedy of the Commons. Science, 162(3859), 1243-
1248. doi: 10.1126/science.162.3859.1243
Heath, Anthony. (1976). Rational choice and social exchange: A critique of
exchange theory. Cambridge: Cambridge University Press.
Hendri, Alfian. (2008). Laporan Hasil Monitoring dan Evaluasi Pembangunan
HKm di Prov NTB Tahun Anggaran 2008. Mataram: Balai Pengelolaan
DAS Dodokan Moyosari.
Heyde, Jill, Lukas, Martin C and Flitner, Michael. (2012). Payments for
Environmental Services in Indonesia: A Review of Watershed-related
Schemes: Artec.
Hidayat, Herman. (2016). Forest resources management in Indonesia (1968-
2004): A political ecology approach: Springer.
Hill, R Carter, Griffiths, William E and Lim, Guay C. (2008). Principles of
econometrics (Vol. 5): Wiley Hoboken, NJ.
Hoang, Minh Ha, Do, Trong Hoan, Pham, Minh Thoa, van Noordwijk, Meine and
Minang, Peter A. (2013). Benefit distribution across scales to reduce
emissions from deforestation and forest degradation (REDD+) in Vietnam.
Land Use Policy, 31(0), 48-60. doi: http://dx.doi.org/10.1016/j.landusepol.2011.09.013
Huber-Stearns, Heidi R., Goldstein, Joshua H. and Duke, Esther A. (2013).
Intermediary roles and payments for ecosystem services: A typology and
program feasibility application in Panama. Ecosystem Services, 6(0), 104-
116. doi: http://dx.doi.org/10.1016/j.ecoser.2013.09.006
Ibáñez, Ana María and Rao, Vijayendra. (2005). The social impact of social funds
in Jamaica: a 'participatory econometric' analysis of targeting, collective
action, and participation in community-driven development. The journal of
development studies, 41(5), 788-838. doi: 10.1080/00220380500145297
IMP. (2010). Laporan Institusi Multi Pihak Jasa Lingkungan Kabupaten Lombok
Barat. Gerung: Institusi Multi Pihak.
IMP. (2011). Laporan Institusi Multi Pihak Jasa Lingkungan Kabupaten Lombok
Barat. Gerung: Institusi Multi Pihak.
IMP. (2012). Laporan Institusi Multi Pihak Jasa Lingkungan Kabupaten Lombok
Barat. Gerung: Institusi Multi Pihak.
IMP. (2013a). Handout Pengelolaan Jasa Lingkungan. Mataram: IMP.
IMP. (2013b). Laporan Pertanggungjawaban Dana Hibah APBD II Program Jasa
Lingkungan Kabupaten Lombok Barat Tahun 2013. Gerung: Institusi
Multi Pihak.
IMP. (2014a). Focus Group Discussion Gerung: Institusi Multi Pihak.
IMP. (2014b). Laporan Institusi Multi Pihak Jasa Lingkungan Kabupaten Lombok
Barat. Gerung: Institusi Multi Pihak.
IMP and WWF. (2013). Jasa Lingkungan: Inisiatif Pendanaan Berkelanjutan
Untuk Kawasan Rinjani. Mataram: WWF Indonesia.
Ingram, Jane Carter, Wilkie, David, Clements, Tom, McNab, Roan Balas, Nelson,
Fred, Baur, Erick Hogan, . . . Foley, Charles Andrew Harold. (2014).
Evidence of Payments for Ecosystem Services as a Mechanism for

234
Supporting Biodiversity Conservation and Rural Livelihoods. Ecosystem
Services, 7(0), 10-21. doi: http://dx.doi.org/10.1016/j.ecoser.2013.12.003
Jentoft, Svein. (2003). Co-management-the way forward. Fish and Fisheries
Series, 26, 1-16.
Johnson, Colin. (1998). Survey of Recent Developments. Bulletin of Indonesian
Economic Studies, 34(2), 3-60. doi: 10.1080/00074919812331337320
Keene, Oliver N. (1995). The log transformation is special. Statistics in medicine,
14(8), 811-819.
Kerr, John. (2002). Watershed Development, Environmental Services, and
Poverty Alleviation in India. World Development, 30(8), 1387-1400. doi:
10.1016/S0305-750X(02)00042-6
Klooster, Daniel and Masera, Omar. (2000). Community forest management in
Mexico: carbon mitigation and biodiversity conservation through rural
development. Global Environmental Change, 10(4), 259-272. doi:
10.1016/S0959-3780(00)00033-9
Konsepsi. (2003). Laporan Studi Proses Jasa Lingkungan di Lombok. Mataram:
Konsepsi.
Konsepsi. (2009). Sejarah Sesaot. Mataram: Konsepsi.
Kosoy, Nicolas, Martinez-Tuna, Miguel, Muradian, Roldan and Martinez-Alier,
Joan. (2007). Payments for environmental services in watersheds: Insights
from a comparative study of three cases in Central America. Ecological
Economics, 61(2–3), 446-455. doi: http://dx.doi.org/10.1016/j.ecolecon.2006.03.016
Kreps, David M. (1990). A course in microeconomic theory (Vol. 41): JSTOR.
Kroeger, Timm. (2012). The quest for the “optimal” payment for environmental
services program: Ambition meets reality, with useful lessons. Forest
Policy and Economics. doi: 10.1016/j.forpol.2012.06.007
Krogman, Naomi and Beckley, Tom. (2002). Corporate "Bail-Outs" and Local
"Buyouts": Pathways to Community Forestry? Society & Natural
Resources, 15(2), 109-127. doi: 10.1080/089419202753403300
Kubo, Hideyuki. (2009). Incorporating Agency Perspective into Community
Forestry Analysis. Small Scale Forestry, 8(3), 305-321. doi:
10.1007/s11842-009-9085-3
Lam, Wai Fung. (1999). Governing irrigation systems in Nepal: institutions,
infrastructure, and collective action: ICS Press Institute for Contemporary
Studies.
Lemhanas (Cartographer). (2013). Peta NKRI. Retrieved from http://www.lemhannas.go.id/portal/in/peta-resmi-nkri.html
Lloyd, William Forster. (1833). Two lectures on the checks to population. The
University of Oxford, Oxford.
Lütkepohl, Helmut and Xu, Fang. (2012). The role of the log transformation in
forecasting economic variables. Empirical Economics, 42(3), 619-638.
MA. (2003). Millenium Ecosystem Assessment 2003 Ecosystem and Human
Well-being. A Framework for Assessment.
Margolis, Howard. (1982). Selfishness, Altruism, and Rationality: A Theory of
Social Choice. Chicago and London: The University of Chicago Press.
Maryudi, A., Devkota, R. R., Schusser, C., Yufanyi, C., Salla, M., Aurenhammer,
H., . . . Krott, M. (2012). Back to basics: Considerations in evaluating the

235
outcomes of community forestry. Forest Policy and Economics, 14(1), 1-
5. doi: 10.1016/j.forpol.2011.07.017
Matthew, Sommerville, E.J, Milner-Gulland, Michael, Rahajaharison and Julia
P.G, Jones. (2010). Impact of a Community-Based Payment for
Environmental Services Intervention on Forest Use in Menabe,
Madagascar. Conservation Biology, 24(6), 1488. doi: 10.1111/j.1523-
1739.2010.01526.x
McCarthy, JF, M, Moeliano and R, Robison. (2012). The post-authoritarian
politics of agrarian and forest reform in Indonesia. Routledge handbook of
Southeast Asian politics. Routledge.
McCarthy, John. (2009). Where is justice? Resource entitlements, agrarian
transformation and regional autonomy in Jambi, Sumatra. In Carol Warren
and John McCarthy (Ed.), Community, Environment and Local
governance in Indonesia: Locating the Commonweal. London and New
York: Routledge.
McCarthy, John F. (2000). The Changing Regime: Forest Property and Reformasi
in Indonesia. Development and change, 31(1), 91-129. doi: 10.1111/1467-
7660.00148
McCarthy, John F and Warren, Carol. (2009). Communities, environments and
local governance in Reform Era Indonesia. Community, Environment and
Local Governance in Indonesia: Locating the Commonweal, 22, 1.
McIver, John P, Carmines, Edward G and Sullivan, JL. (1994). Unidimensional
scaling.
McLeod, Ross H. (2000). Soeharto's Indonesia: a better class of corruption.
Agenda: A Journal of Policy Analysis and Reform, 99-112.
Mekonnen, Alemu. (2009). Tenure Security, Resource Endowments, and Tree
Growing: Evidence from the Amhara Region of Ethiopia. Land
Economics, 85(2), 292-307.
Menteri Kehutanan RI. (2007). Peraturan Menteri Kehutanan Nomor:
P.35/Menhut-II/2007 tentang Hasil Hutan Bukan Kayu. Jakarta:
Kementerian Kehutanan.
Menteri Kehutanan RI. (2008). Peraturan Menteri Kehutanan Nomor
P.70/Menhut-II/2008 tentang Pedoman Rehabiltasi Hutan dan Lahan.
Jakarta.
Menteri Kehutanan RI. (2009a). Keputusan Menteri Kehutanan RI Nomor
Sk.445/Menhut-II/2009 tentang Penetapan Areal Kerja Hutan
Kemasyarakatan Jakarta: Kementerian Kehutanan.
Menteri Kehutanan RI. (2009b). Peraturan Menteri Kehutanan Republik
Indonesia No P.50/Menhut-II/2009 tentang Penegasan dan Fungsi
Kawasan Hutan.
Menteri Kehutanan RI. (2014a). Peraturan Menteri Kehutanan RI Nomor:
P.88/Menhut-II/2014 tentang Hutan Kemasyarakatan. Jakarta:
Kementerian Kehutanan.
Menteri Kehutanan RI. (2014b). Statistik Kementerian Kehutanan 2013. Jakarta:
Kementerian Kehutanan RI.
Menteri Pertanian RI. (1982). Keputusan Menteri Pertanian Nomor
756/Kpts/Um/1982 tentang Penunjukan Areal Hutan di Wilayah Propinsi
Dati I NTB Jakarta: Departemen Pertanian RI.
236
Milne, Sarah and Adams, Bill. (2012). Market Masquerades: Uncovering the
Politics of Community‐level Payments for Environmental Services in
Cambodia. Development and change, 43(1), 133-158. doi: 10.1111/j.1467-
7660.2011.01748.x
Montagnini, Florencia and Finney, Christopher. (2011). Payments for
Environmental Services in Latin America as a Tool for Restoration and
Rural Development. Ambio, 40(3), 285-297. doi: 10.1007/s13280-010-
0114-4
Moon, Hyungsik Roger and Perron, Benoit. (2006). Seemingly unrelated
regressions. The New Palgrave Dictionary of Economics, 1-9.
Mooney, Harold A, Ehrlich, Paul R and Daily, GE. (1997). Ecosystem services: a
fragmentary history. Nature's Services: societal dependence on natural
ecosystems, 11-19.
Muñoz-Piña, Carlos, Guevara, Alejandro, Torres, Juan Manuel and Braña,
Josefina. (2008). Paying for the hydrological services of Mexico's forests:
Analysis, negotiations and results. Ecological Economics, 65(4), 725-736.
doi: http://dx.doi.org/10.1016/j.ecolecon.2007.07.031
Muradian, R., Froger, G., Garcia‐Frapolli, E., Gómez‐Baggethun, E., Gowdy, J.,
Kosoy, N., . . . Farley, J. (2013). Payments for ecosystem services and the
fatal attraction of win‐win solutions. Conservation Letters, 6(4), 274-279.
doi: 10.1111/j.1755-263X.2012.00309.x
Muradian, Roldan, Corbera, Esteve, Pascual, Unai, Kosoy, Nicolas and May,
Peter H. (2010). Reconciling Theory and Practice: An Alternative
Conceptual Framework for Understanding Payments for Environmental
Services. Ecological Economics, 69(6), 1202-1208. doi:
10.1016/j.ecolecon.2009.11.006
Muradian, Roldan and Rival, Laura. (2012). Between markets and hierarchies:
The challenge of governing ecosystem services. Ecosystem Services, 1(1),
93-100. doi: http://dx.doi.org/10.1016/j.ecoser.2012.07.009
Myers, Norman. (1976). An expanded approach to the problem of disappearing
species. Science, 193(4249), 198-202.
Nardo, M., Saisana, M., Saltelli, A., Tarantola, S., Hoffman, A. and Giovannini,
E. (2005). Handbook on Constructing Composite Indicators: Methodolgy
and User Guide. France: OECD Publishing.
Nawir, A.A., Murniati and Rumboko, L. (2008). Rehabilitasi hutan di Indonesia:
akan kemanakah arahnya setelah lebih dari tiga dasawarsa? Bogor,
Indonesia: Center for International Forestry Research (CIFOR).
Neraca. (2013). Biaya Konservasi Hutan Masih Rendah. Retrieved 25 August,
2014, from http://www.neraca.co.id/article/23642/Biaya-Konservasi-Hutan-Masih-Rendah
Olson, Mancur. (1965). The logic of collective action: public goods and the theory
of collective action: Cambridge, Mass.: Harvard University Press.
Ostrom, Elinor. (1990). Governing the commons: The evolution of institutions for
collective action. New York: Cambridge University Press.
Ostrom, Elinor. (1998). A behavioral approach to the rational choice theory of
collective action presidential address, American Political Science
Association, 1997. The American Political Science Review, 92(1), 1-22.

237
Ostrom, Elinor. (1999). Coping with tragedies of the commons. Annual Review of
Political Science, 2(1), 493-535. doi: 10.1146/annurev.polisci.2.1.493
Ostrom, Elinor. (2005). Self-Governance and Forest Resources. CIFOR
Occasional Paper No. 20.
Ostrom, Elinor. (2009). A general framework for analyzing sustainability of
social-ecological systems. Science, 325(5939), 419-422. doi:
10.1126/science.1172133
Ostrom, Elinor, Burger, Joanna, Field, Christopher B, Norgaard, Richard B and
Policansky, David. (1999). Revisiting the commons: local lessons, global
challenges. Science, 284(5412), 278-282.
Pagiola, Stefano. (2005). Payments for Environmental Services and the Poor:
Initial Lessons and Guidelines (Diaporama). Paper presented at the
Workshop on Environmental Services for Poverty Reduction and Food
Security, FAO, Roma.
Pagiola, Stefano. (2006). Payments for Environmental Services: An Introduction.
Washington: World Bank.
Pagiola, Stefano. (2007). Guideline for "Pro-Poor" PES. Washington: World
Bank.
Pagiola, Stefano. (2008). Payments for environmental services in Costa Rica.
Ecological Economics, 65(4), 712-724. doi: http://dx.doi.org/10.1016/j.ecolecon.2007.07.033
Pagiola, Stefano, Arcenas, Agustin and Platais, Gunars. (2005). Can Payments for
Environmental Services Help Reduce Poverty? An Exploration of the
Issues and the Evidence to Date from Latin America. World Development,
33(2), 237-253. doi: 10.1016/j.worlddev.2004.07.011
Pagiola, Stefano and Platais, Gunars. (2002). Payments for Environmental
Services. Washington, D.C.: The World Bank.
Pagiola, Stefano, Ramírez, Elías, Gobbi, José, de Haan, Cees, Ibrahim,
Muhammad, Murgueitio, Enrique and Ruíz, Juan Pablo. (2007). Paying for
the environmental services of silvopastoral practices in Nicaragua.
Ecological Economics, 64(2), 374-385. doi: http://dx.doi.org/10.1016/j.ecolecon.2007.04.014
Pattanayak, Subhrendu K.;, Wunder, Sven ; and Ferraro, Paul J. (2010). Show me
the money: do payments supply environmental services in developing
countries? Review of environmental economics and policy, 4(2), 254-274.
doi: 10.1093/reep/req006
PDAM Giri Menang. (2013). Profil PDAM Giri Menang 2008-2013. Mataram:
PDAM Giri Menang.
PDAM Giri Menang. (2014). Data Penggunaan Air dan Pembayaran Jasa
Lingkungan. Mataram: PDAM Giri Menang.
PDAM Giri Menang. (2016). Rekap Pembayaran Jasa Lingkungan yang disetor ke
Kas Pemda Lobar. Mataram: PDAM Giri Menang.
Peluso, Nancy Lee. (1992). Rich forests, poor people: resource control and
resistance in Java: Univ of California Press.
Pemerintah Kabupaten Lombok Barat. (2014). Profil Desa. Gerung: Badan
Pemberdayaan Masyarakat dan Pemerintahan Desa Kabupaten Lombok
Barat.

238
Pereira, Simone NovotnyCouto (2010). Payment for environmental services in the
Amazon Forest: how can conservation and development be reconciled?
The journal of environment & development, 19(2), 171-190. doi:
10.1177/1070496510368047
Perrings, Charles, Folke, Carl and Mäler, Karl-Göran. (1992). The ecology and
economics of biodiversity loss: the research agenda. Ambio, 201-211.
Persoon, Gerard, Est, Diny M.E. van and Sajise, Persy E. (2003). Co-management
of Natural Resources in Asia: A Comparative Perspective (Vol. no. 7.).
Copenhagen: NIAS.
Peskett, Leo, Schreckenberg, Kate and Brown, Jessica. (2011). Institutional
approaches for carbon financing in the forest sector: learning lessons for
REDD+ from forest carbon projects in Uganda. Environmental Science
and Policy, 14(2), 216-229. doi: 10.1016/j.envsci.2010.10.004
Pigou, Arthur Cecil. (1932). The economics of welfare. London: Palgrave
Macmillan.
Pimentel, David, Littman, S., Garnick, E., Berkowitz, A., Jacobson, S.,
Napolitano, S., . . . Hudes, E. (1980). Environmental Quality and Natural
Biota. BioScience, 30(11), 750-755.
Pirard, Romain. (2012). Payments for Environmental Services (PES) in the public
policy landscape: “Mandatory” spices in the Indonesian recipe. Forest
Policy and Economics, 18(0), 23-29. doi: http://dx.doi.org/10.1016/j.forpol.2011.09.002
Pirard, Romain and Belna, Karine. (2012). Agriculture and Deforestation: Is
REDD+ Rooted In Evidence? Forest Policy and Economics, 21(0), 62-70.
doi: http://dx.doi.org/10.1016/j.forpol.2012.01.012
Poteete, Amy R, Janssen, Marco A and Ostrom, Elinor. (2010). Working together:
collective action, the commons, and multiple methods in practice:
Princeton University Press.
Prasetyo, F. A., Suwarno, A., Purwanto and Hakim, R. (2009). Making Policies
Work for Payment for Environmental Services (PES): An Evaluation of
the Experience of Formulating Conservation Policies in Districts of
Indonesia. Journal of Sustainable Forestry, 28(3-5), 415-433. doi:
10.1080/10549810902791531
Presiden RI. (1970). Peraturan Pemerintah Nomor 21 Tahun 1970 tentang Hak
Pengusahaan Hutan dan Hak Pemungutan Hasil Hutan.
Putnam, Robert D. (1995). Tuning In, Tuning Out: The Strange Disappearance of
Social Capital in America. PS: Political Science and Politics, 28(4), 664-
683.
Ramli, Rizal and Ahmad, Mubariq. (1994). Rente ekonomi pengusahaan hutan
Indonesia. Jakarta: Wahana Lingkungan Hidup Indonesia.
Rao, Vaman and Chotigeat, Tosporn. (1981). The Inverse Relationship Between
Size of Land Holdings and Agricultural Productivity. American Journal of
Agricultural Economics, 63(3), 571-574.
Rao, Vijayendra and Woolcock, Michael. (2003). Integrating Qualitative and
Quantitative Approaches in Program Evaluation. In F. Bourguignon and
L.P. da Silva (Ed.), The Impact of Economics Policies on Poverty and
Income Distribution: Evaluation Techniques and tools (pp. 165-190). New
York: Oxford University Press.

239
Reed, David. (2006). Escaping Poverty's Grasp: The Environmental Foundations
of Poverty Reduction. UK and USA: Taylor & Francis.
Riyadi, Riyadi, Hartini, Sri, Rudyansah, Zulhan, Anam, Chairul, Hastuti, Adwi,
Setiyawati, Nia, . . . Aprilia, Ira. (2015). Welfare Indicators 2015. Jakarta:
Badan Pusat Statistik.
Robalino, Juan and Pfaff, Alexander. (2013). Ecopayments and deforestation in
Costa Rica: a nationwide analysis of PSA's initial years. Land economics,
89(3), 432-448.
Rodriguez, Carlos Manuel. (2012). Costa Rica Leading the Way in Incentivizing
Protection for Nature. Retrieved 17/03/2017, from http://blog.conservation.org/2012/03/costa-rica-leading-the-way-in-incentivizing-protection-of-nature/
Rosyadi, Slamet, Birner, Regina and Zeller, Manfred. (2005). Creating political
capital to promote devolution in the forestry sector—a case study of the
forest communities in Banyumas district, Central Java, Indonesia. Forest
Policy and Economics, 7(2), 213-226. doi: http://dx.doi.org/10.1016/S1389-9341(03)00027-3
Samad, Samsyiah. (2012). Efektivitas Program Hutan Kemasyarakatan di Pulau
Lombok Provinsi Nusa Tenggara Barat (Studi Kasus pada Kawasan
Hutan Lindung Sesaot Kabupaten Lombok Barat dan Kawasan Hutan
Lindung Batukliang Utara Kabupaten Lombok Tengah). Master Thesis.
Magister Pengelolaan Sumberdaya Lahan Kering. Universitas Mataram.
Mataram.
Saman, Effendi, Hutapea, Anthony L. P., Wailayatiningsih and Hasannudin, Lili.
(1993). Politik hukum pengusahaan hutan di Indonesia. Jakarta: Wahana
Lingkungan Hidup Indonesia.
Sánchez-Azofeifa, G. Arturo and Pfaff, Alexander. (2007). Costa Rica's Payment
for Environmental Services Program: Intention, Implementation, and
Impact. Conservation Biology, 21(5), 1165-1173. doi: 10.1111/j.1523-
1739.2007.00751.x
Sanwal, Mukul. (1988). Community Forestry: Policy Issues, Institutional
Arrangements, and Bureaucratic Reorientation. Ambio, 17(5), 342-346.
Sattler, Claudia and Matzdorf, Bettina. (2013). PES in a nutshell: From definitions
and origins to PES in practice—Approaches, design process and
innovative aspects. Ecosystem Services, 6, 2-11. doi: http://dx.doi.org/10.1016/j.ecoser.2013.09.009
Sattler, Claudia, Trampnau, Susanne, Schomers, Sarah, Meyer, Claas and
Matzdorf, Bettina. (2013). Multi-classification of payments for ecosystem
services: How do classification characteristics relate to overall PES
success? Ecosystem Services, 6, 31-45. doi: http://dx.doi.org/10.1016/j.ecoser.2013.09.007
SBP. (2010). Laporan Akhir Kegiatan Pengembangan Hasil Hutan Non Kayu
(Pengembangan Jasa Lingkungan) Tahun Anggaran 2010 (Subdin Bina
Produksi, Trans.). Gerung: Dinas Kehutanan Lombok Barat.
SBP. (2012). Laporan Akhir Kegiatan Pengembangan Hasil Hutan Non Kayu
(Pengembangan Jasa Lingkungan) Tahun Anggaran 2012 (Subdin Bina
Produksi, Trans.). Gerung: Dinas Kehutanan Lombok Barat.

240
Scott, John. (2000). Rational choice theory. Understanding contemporary society:
Theories of the present, 129.
Sekretariat Daerah Lombok Barat. (2007). Peraturan Daerah Kabupaten Lombok
Barat No 4 Tahun 2007 Tentang Pengelolaan Jasa Lingkungan. Gerung:
Kabupaten Lombok Barat.
Shyamsundar, Priya and Ghate, Rucha (2014). Rights, Rewards, and Resources:
Lessons from Community Forestry in South Asia. Review of
Environmental Economics and Policy, 8(1), 80-102. doi:
10.1093/reep/ret022
Sikor, Thomas. (2006). Analyzing community-based forestry: Local, political and
agrarian perspectives. Forest Policy and Economics, 8(4), 339-349. doi: http://dx.doi.org/10.1016/j.forpol.2005.08.005
Simon, Hasanu. (1994). Merencanakan pembangunan hutan untuk strategi
kehutanan sosial. Yogyakarta: Aditya Media.
Smith, Joyotee, Obidzinski, Krystof, Subarudi, Subarudi and Suramenggala,
Iman. (2003). Illegal logging, collusive corruption and fragmented
governments in Kalimantan, Indonesia. International Forestry Review,
5(3), 293-302.
Sodhi, Navjot S., Koh, Lian Pin, Clements, Reuben, Wanger, Thomas C., Hill,
Jane K., Hamer, Keith C., . . . Lee, Tien Ming. (2010). Conserving
Southeast Asian forest biodiversity in human-modified landscapes.
Biological Conservation, 143(10), 2375-2384. doi: http://dx.doi.org/10.1016/j.biocon.2009.12.029
Sommerville, M. M., Jones, J. P. G. and Milner-Gulland, E. J. (2009). A Revised
Conceptual Framework for Payments for Environmental Services. Ecology
and Society, 14(2), 400-434.
Sommerville, Matthew, Milner-Gulland, EJ, Rahajaharison, Michael and Jones,
Julia PG. (2010). Impact of a Community‐Based Payment for
Environmental Services Intervention on Forest Use in Menabe,
Madagascar. Conservation Biology, 24(6), 1488-1498.
Stringer, L. C., Dougill, A. J., Thomas, A. D., Spracklen, D. V., Chesterman, S.,
Speranza, C. Ifejika, . . . Kopolo, G. (2012). Challenges and opportunities
in linking carbon sequestration, livelihoods and ecosystem service
provision in drylands. Environmental Science & Policy, 19–20(0), 121-
135. doi: http://dx.doi.org/10.1016/j.envsci.2012.02.004
Stringer, R., Zilberman, D., Lipper, N. L., Bulte, E. H. and McCartney, L. (2008).
Payments for ecosystem services and poverty reduction: concepts, issues,
and empirical perspectives Environment and Development Economics
(Vol. 13, pp. 245-254). New York: Cambridge Univ Press.
Sunderlin, W. D., Resosudarmo, I. A. P., Rianto, E. and Angelsen, A. (2000). The
effect of Indonesia’s economic crisis on small farmers and natural forest
cover in the Outer Islands CIFOR Occasional Paper (Vol. 28(E), pp.
36p). Bogor: CIFOR.
Sunderlin, William D. (2006). Poverty alleviation through community forestry in
Cambodia, Laos, and Vietnam: An assessment of the potential. Forest
Policy and Economics, 8(4), 386-396. doi: 10.1016/j.forpol.2005.08.008

241
Tacconi, Luca. (2012). Redefining payments for environmental services.
Ecological Economics, 73(0), 29-36. doi: http://dx.doi.org/10.1016/j.ecolecon.2011.09.028
Tacconi, Luca, Mahanty, Sango and Suich, Helen. (2013). The Livelihood
Impacts of Payments for Environmental Services and Implications for
REDD. Society and Natural Resources, 26(6), 733-744. doi:
10.1080/08941920.2012.724151
The Nature Conservancy. (2012). Sustainable Agriculture: Efficient and
Responsible Use of Natural Resources. Brazil: The Nature Conservancy.
The Nature Conservancy. (2017). Water funds help to provide fresh water today
and into the future. Retrieved 17/03/2017, from https://www.nature.org/ourinitiatives/regions/latinamerica/water-funds-of-south-america.xml
The World Bank. (2004). Project Appraisal Document on a Proposed Grant from
The Global Environment Facility Trust Fund in the Amount of US$9.0
Million to The Republic of South Africa for The Cafe Biodiversity
Conservation and Sustainable Development Project (Rural and Social
Development Environmental, Trans.).
The World Bank. (2008). Implementation Completion and Result Report
(Environmentally and Socially Sustainable Development, Trans.): World
Bank.
Thoms, Christopher A. (2008). Community control of resources and the challenge
of improving local livelihoods: A critical examination of community
forestry in Nepal. Geoforum, 39(3), 1452-1465. doi:
10.1016/j.geoforum.2008.01.006
Torres, Arturo Balderas, MacMillan, Douglas C., Skutsch, Margaret and Lovett,
Jon C. (2013). Payments for ecosystem services and rural development:
Landowners' preferences and potential participation in western Mexico.
Ecosystem Services, 6(0), 72-81. doi: http://dx.doi.org/10.1016/j.ecoser.2013.03.002
Tschakert, Petra. (2007). Environmental services and poverty reduction: Options
for smallholders in the Sahel. Agricultural Systems, 94(1), 75-86. doi: http://dx.doi.org/10.1016/j.agsy.2005.07.010
Tscharntke, Teja, Clough, Yann, Bhagwat, Shonil A, Buchori, Damayanti, Faust,
Heiko, Hertel, Dietrich, . . . Perfecto, Ivette. (2011). Multifunctional
shade‐tree management in tropical agroforestry landscapes–a review.
Journal of Applied Ecology, 48(3), 619-629.
Turner, R.K., Pearce D. and Bateman, I. (1994). Environmental Economics, An
elementary Introduction. United Kingdom: Prentice Hall Press.
Ulvevadet, Birgitte and Hausner, Vera H. (2011). Incentives and regulations to
reconcile conservation and development: Thirty years of governance of the
Sami pastoral ecosystem in Finnmark, Norway. Journal of Environmental
Management, 92(10), 2794-2802. doi: http://dx.doi.org/10.1016/j.jenvman.2011.06.026
UN. (2015). We Can End Poverty. Millenium Development Goals and Beyond
2015. from http://www.un.org/millenniumgoals/poverty.shtml
Undang Undang Dasar Negara Republik Indonesia (1945).

242
Undang-Undang RI Nomor 5 Tahun 1960 tentang Peraturan Dasar Pokok-Pokok
Agraria (1960).
Undang Undang RI Nomor 41 Tahun 1999 tentang Kehutanan (1999).
Undang-Undang RI Nomor 18 tahun 2013 Tentang Pencegahan dan
Pemberantasan Perusakan Hutan (2013).
van den Bergh, Jeroen C. J. M. (2010). Externality or sustainability economics?
Ecological Economics, 69(11), 2047-2052. doi: http://dx.doi.org/10.1016/j.ecolecon.2010.02.009
Van der Kraan, Alfons. (1980). Lombok: conquest, colonization, and
underdevelopment, 1870-1940 (Vol. 5.). Singapore: Published for the
Asian Studies Association of Australia by Heinemann Educational Books
(Asia).
van Wilgen, B. W., Le Maitre, D. C. and Cowling, R. M. (1998). Ecosystem
services, efficiency, sustainability and equity: South Africa's Working for
Water programme. Trends in Ecology & Evolution, 13(9), 378-378. doi:
10.1016/S0169-5347(98)01434-7
Vatn, Arild. (2010). An institutional analysis of payments for environmental
services. Ecological Economics, 69(6), 1245-1252. doi: http://dx.doi.org/10.1016/j.ecolecon.2009.11.018
Vayda, Andrew P and Rappaport, Roy A. (1968). Ecology, cultural and
noncultural. Introduction to cultural anthropology, 477-497.
Venter, Oscar and Koh, Lian Pin. (2012). Reducing emissions from deforestation
and forest degradation (REDD+): game changer or just another quick fix?
Annals of the New York Academy of Sciences, 1249(1), 137-150. doi:
10.1111/j.1749-6632.2011.06306.x
Wade, Robert. (1987). The management of common property resources: collective
action as an alternative to privatisation or state regulation. Cambridge
journal of economics, 11(2), 95-106.
Wang, Li-an;, Zhong, Fang-Lei; and Guo, Xiao-dong. (2009). A Research
Framework of the Relationship Between Payments for Environmetal
Services and Poverty Alleviation in China. Paper presented at the The !st
International Conference on Information Science and Enginering (ICISE
2009).
Warren, Carol. (2005). Mapping Common Futures: Customary Communities,
NGOs and the State in Indonesia's Reform Era. Development and Change,
36(1), 49-73. doi: 10.1111/j.0012-155X.2005.00402.x
Warren, Carol and McCarthy, John. (2009). Community, Environment and Local
Governance in Indonesia: Locating the Commonweal (Vol. 22). London
and New York: Routledge.
Westman, Walter E. (1977). How Much Are Nature's Services Worth? Science,
197(4307), 960-964. doi: 10.1126/science.197.4307.960
Wollenberg, Eva, Moeliono, Moira, Limberg, Godwin, Iwan, Ramses, Rhee,
Steve and Sudana, Made. (2006). Between state and society: Local
governance of forests in Malinau, Indonesia. Forest Policy and
Economics, 8(4), 421-433. doi: http://dx.doi.org/10.1016/j.forpol.2005.08.012
World Bank Group. (2012). World development indicators 2012: World Bank
Publications.

243
World Resources Institute. (2017). CAIT Climate Data Editor. Retrieved
02/06/2017, from http://cait.wri.org/
Wulandari, Rizka. (2011). Pemodelan Spasial Deforestasi di Pulau Lombok, Nusa
Tenggara Barat, Periode 2000 - 2010. Institut Pertanian Bogor, Bogor.
Wunder, Sven. (2001). Poverty Alleviation and Tropical Forests—What Scope for
Synergies? World Development, 29(11), 1817-1833. doi: 10.1016/S0305-
750X(01)00070-5
Wunder, Sven. (2005). Payment For Environmental Services : some nuts and
bolts. CIFOR Occasional Paper No. 42.
Wunder, Sven. (2007). The Efficiency of Payments for Environmental Services in
Tropical Conservation. Conservation Biology, 21(1), 48-58. doi:
10.1111/j.1523-1739.2006.00559.x
Wunder, Sven. (2008). Payments for environmental services and the poor:
concepts and preliminary evidence. Environment and Development
Economics, 13(3), 279-297. doi: 10.1017/S1355770X08004282
Wunder, Sven. (2013). When payments for environmental services will work for
conservation. Conservation Letters, 6(4), 230-237. doi:
10.1111/conl.12034
Wunder, Sven and Albán, Montserrat. (2008). Decentralized payments for
environmental services: The cases of Pimampiro and PROFAFOR in
Ecuador. Ecological Economics, 65(4), 685-698. doi: http://dx.doi.org/10.1016/j.ecolecon.2007.11.004
Wunder, Sven, Engel, Stefanie and Pagiola, Stefano. (2008). Taking stock: A
comparative analysis of payments for environmental services programs in
developed and developing countries. Ecological Economics, 65(4), 834-
852. doi: http://dx.doi.org/10.1016/j.ecolecon.2008.03.010
WWF. (1996). Indigenous People and Conservation. WWF Statements and
Principles. Gland: World Wildlife Fund for Nature (WWF).
WWF. (2014). Jasa Lingkungan: Inisiatif Pendanaan Berkelanjutan Untuk
Kawasan Rinjani. Mataram: World Wildlife Fund for Nature
WWF. (2017). WWF and Payments for Ecosystem Services. Retrieved
17/03/2017, from http://wwf.panda.org/what_we_do/where_we_work/black_sea_basin/danube_carpathian/our_solutions/green_economy/pes/
Yandle, Bruce. (1997). Common Sense and Common Law for the Environment:
Creating Wealth in Hummingbird Economies. Lanham: Rowman &
Littlefield Publishers.
Zhang, L., Tu, Q. and Mol, A. P. J. (2008). Payment for Environmental Services:
The Sloping Land Conversion Program in Ningxia Autonomous Region of
China. China & World Economy, 16(2), 66-81. doi: 10.1111/j.1749-
124X.2008.00107.x