sustainable brazil - building a better working world - ey ... titled “sustainable brazil - social...
TRANSCRIPT
A
Sustainable BrazilEnergy market challenges

SUSTAINABLE BRAZIL ENERGY MARKET CHALLENGESA
Introduction 3
An essential factor in designing the future 4
Fundamental Concepts 7
Global Context 10
Business Opportunities 18
Table of contents
This is the third in a series of five* publications on the outlook for the Brazilian economy over the next two decades, with special attention given to its most strategic sectors. In this context, energy, the subject of this publication, occupies a decisive position. This is due to its role in creating national investment and fostering enhanced quality of life for the population and to the horizon of opportunities it offers. The issuesaddressed in the Sustainable Brazil series are the following:
Housing market potentials; Economic growth and potential consumption;Energy market challenges; The outlook for industrial competitiveness;Brazil’s perspectives in the agricultural industry.
The approach examines Brazil’s potential in its interaction with the global market through 2030. A set of data encompassing a universe of one hundred countries was analyzed, not just in strict economic terms, but also in terms of demographic dynamics, quality of life, human resources and natural resources.
This study, a joint effort by Ernst & Young Terco and the Getulio Vargas Foundation, also seeks to define the concept of development for Brazil in the coming decades. More important than asking if the country will grow a lot, or a little, is asking if it will grow well, leveraging its potential to the maximum, but in a sustainable way.
An assessment of this type must necessarily transcend the strict limits of the current outlook.
Thus, this study will look at long-term trends in which the effects of crises like the current one, begun in the US housing market and taking on global dimensions, represent temporary deviations that are smoothed out over the time period considered.
For example, no matter to what extent abrupt variations in the price of oil create great uncertainty in relation to this input, in the long term the real economic aspects, major historical trends and resource and technological limits will predominate. The reference scenario must isolate the more immediate effects of the current situation, whether it is speculation regarding reduced production that leads to exaggerated prices, or whether it is the perspective of deceleration of the world economy for a time, which will quickly lower the price of petroleum again. We stress that investments in the energy sector have repercussions over the following 30 years and plant construction takes more than five years.
A competitive and sustainable supply of energy is required for quality growth. This is an enormous challenge, both for the public and private sectors. The conditions for public-private synergy are given, and the objective of this publication is to raise important questions and contribute to the debate on this issueand to planning by the institutions and companies involved in the search for better solutions to supply the energy demand.
Introduction
*This publication has been produced in 2008. Since then, the Sustainable Brazil series has six publications. The latest survey, titled “Sustainable Brazil - Social and Economic Impacts of the 2014 World Cup”, was launched in 2010.
An essential factor in designing the future
A Determining Role
Society cannot function without energy, a fundamental input. Analyzing energy sector performance is therefore crucial to predicting the economic opportunities and obstacles that will appear in the coming decades. The market clearly contains many opportunities, but to identify them and, above all, interpret them correctly, a broad analysis on a global scale, such as that proposed in this study, is needed.
The choice of a given source of energy involves heavy investments, and the effect of this choice on production and use patterns becomes consolidated over time, determining the production model of each country. Brazil’s hydroelectric investments in the 1960s through 1980s, for example, provided a relatively cheap, clean energy source. During the same period, France’s nuclear energy investments introduced an equally efficient system, but with a different cost structure and subject to great criticism from environmentalists. Note that, even today, these choices determine these economies’ entire consumption and cost structures and, thus, their competitiveness.
4
Clearly, energy decisions are crucial for the economy and impact it for many decades into the future.
Today, the world is rearranging its energy sources due to the persistent volatility in the price of oil. Nothing indicates that this trend will change in the next few years. The increasing demand for energy, which is reflected by increasing prices, drives the development of alternatives. This opens the door to sources like oil sand and biofuels.
Another determining factor is the increase in societal pressure for environmentally correct resources, which require a change in the energy production cost structure. This demand for clean and unfortunately more costly sources is expected to appear to different degrees in the economies of different countries, based on the ability of public opinion to influence policy and implementation conditions.
Taking into account all the factors mentioned above, this study’s reference scenario assumes a world in which the supply of energy is a mix of competitive resources, resulting in enlarged energy supply at the international level. This perspective is also
due to the projected reference scenario for world economic growth, described in the second publication in this series, which assumes consolidation of international trade in goods and services at a high level on a course towards sustainability.
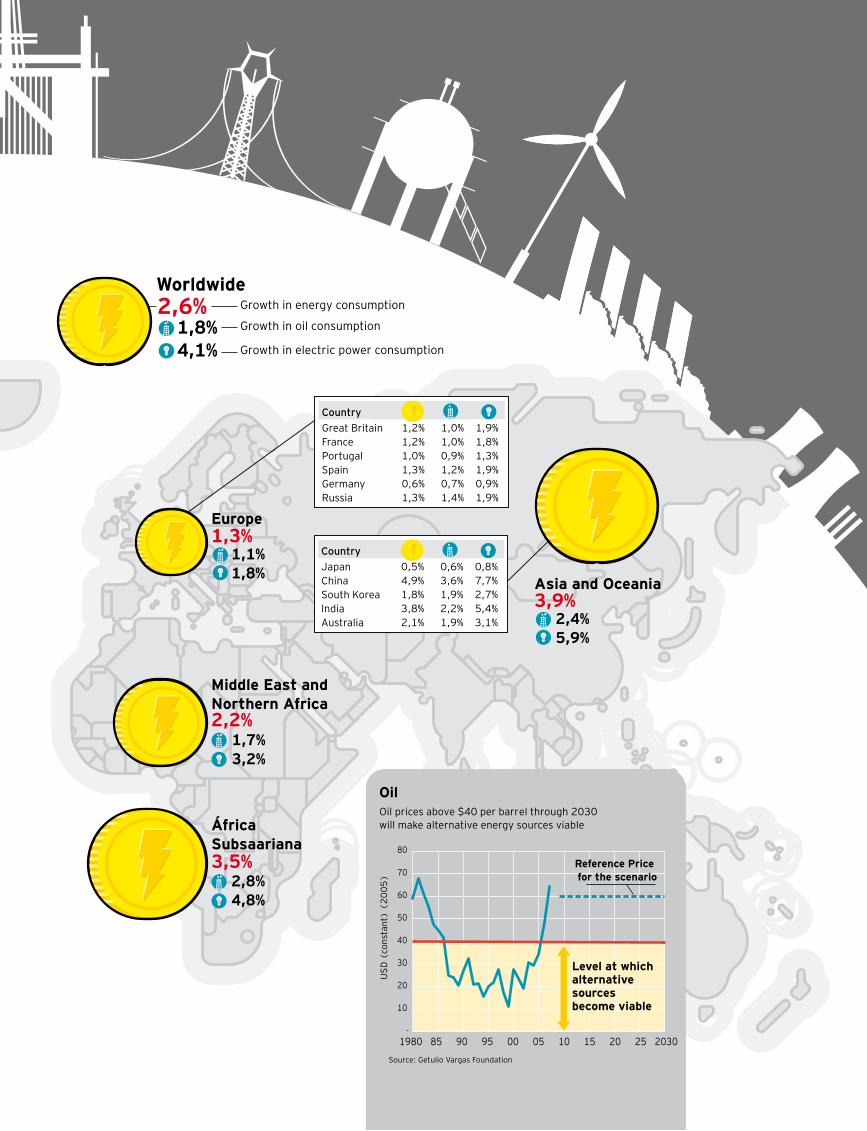
Brazil, a large consumerThe statistical model developed for this study estimates the growth in world energy demand at 2.6% per year, taking the reference scenario as a basis. The countries that will demand the most of this input are those that have the greatest economic growth rates, such as China, with consumption expansion of 4.9% per year, and India, with 3.8%. Brazil will be the seventh largest energy consumer in the world (today it occupies the 11th position), with average annual growth of 3.3%. The components of the rise in Brazilian consumption are:
Oil, derivatives and natural gas, at 2.5%;
electrical power, at 4.4%; and
coal and biofuels, at 3.6%.
SUSTAINABLE BRAZIL ENERGY MARKET CHALLENGES

AElectric power distribution will undergo significant changes due to new housing patterns, including an increase in the number of homes and appliances.
To arrive at a global overview, we also analyzed the behavior of various agents. In other words, the geopolitics of energy is fundamental to mapping the alternatives that will be adopted and, importantly, at what price. Thus, Brazil will stand out not only as a consumer, but also as an energy supplier - either through traditional resources, if the oil reserves in the Santos Basin are made viable, or through the increased importance of biofuels.
This study also mapped the business opportunities in this sector in Brazil, as will be seen in more detail in the following pages. For example, the reference indicates domestic fuel consumption will grow at 3.3% per year. The annual 4.2% increase in production over the next 23 years will create surplus gasoline and ethanol for the foreign market. This scenario predicts a pronounced increase in ethanol in the automobile fuel mix, reaching 45% by 2030.
The distribution of electric power will undergo significant changes due to new housing patterns. With the increase in the number of homes and appliances, residential consumption will grow at a rate of 3.9% per year. To keep up with 4% annual economic growth, a 5.1% annual upsurge in energy consumption is predicted in the industrial, commercial and service
sectors. Economic expansion based on investment recovery will also cause the demand for energy-intensive products like steel and cement to grow at an annual rate of almost 5%, driving consumption in these sectors. This provides an idea of the great challenges that the Brazilian power sector will have to face.
This information is critical both for business planning and for guiding government directives. However, to understand the complex energy situation, one must establish a set of concepts capable of identifying the principal determining factors in this market. The solidity of the reference model is the foundation for the projections presented, as will be seen in the following pages.
GDP
Energy, toe*
1981 to1985
1986 to1990
1991 to1995
1996 to2000
2001 to2005
2006 to2010
2011 to2015
2016 to2020
2021 to2025
2026 to2030
500
1.000
1.500
2.000
2.500
100
200
300
400
US
billion
s 2
00
7
Million
s toe
445,6
2.255,7
Source: Getulio Vargas Foundation*toe: Metric ton of oil equivalent. Includes energy consumption of companies in energy sector.
Brazilian Energy Consumption and GDP

2.388,2
1.760,8
743,2
523,4
427,2
340,3
339,7
266,3
235,4
224,0
223,2
187,5
179,9
168,4
157,4
131,4
130,2
123,2
100,0
91,0
9.974,7
5.347,9
3.462,7
1.007,5
1.004,1
585,6
495,7
468,7
386,4
346,7
341,2
338,6
312,8
277,7
257,6
255,4
226,3
211,9
210,3
187,7
174,7
18.114,0
United States
China
Russia
Japan
India
Canada
Germany
France
Great Britain
South Korea
Brazil
Italy
Iran
Mexico
Spain
Indonesia
Australia
South Africa
Netherlands
Turkey
World
1º
2º
3º
4º
5º
6º
7º
8º
9º
10º
11º
12º
13º
14º
15º
16º
17º
18º
19º
20º
2007** China
United States
Russia
India
Japan
Canada
Brazil
Germany
France
South Korea
Mexico
Great Britain
Iran
Indonesia
South Africa
Italy
Spain
Australia
Turkey
Thailand
World
1º
2º
3º
4º
5º
6º
7º
8º
9º
10º
11º
12º
13º
14º
15º
16º
17º
18º
19º
20º
2030
2007***
2030
(%) ao ano
3,3%
Final energy consumption**
371,8
177,0
2,5%
Oil, derivatives and natural gas
80,4
141,4
4,4%
Power
34,1
92,3
3,6%
Coal and biofuels
62,5
138,1
Millions of toe*
Source: Getulio Vargas Foundation(*) toe: Metric ton of oil equivalent. (**) Excludes energy sector consumption. (***) Estimate.
Energy in 2007 and in 2030
The largest energy consumers* in 2007 and in 2030
Source: Getulio Vargas Foundation(*) Primary energy supply, in millions of metric tons of oil equivalent. (**) Estimate.
6 SUSTAINABLE BRAZIL ENERGY MARKET CHALLENGES
FundamentalConcepts
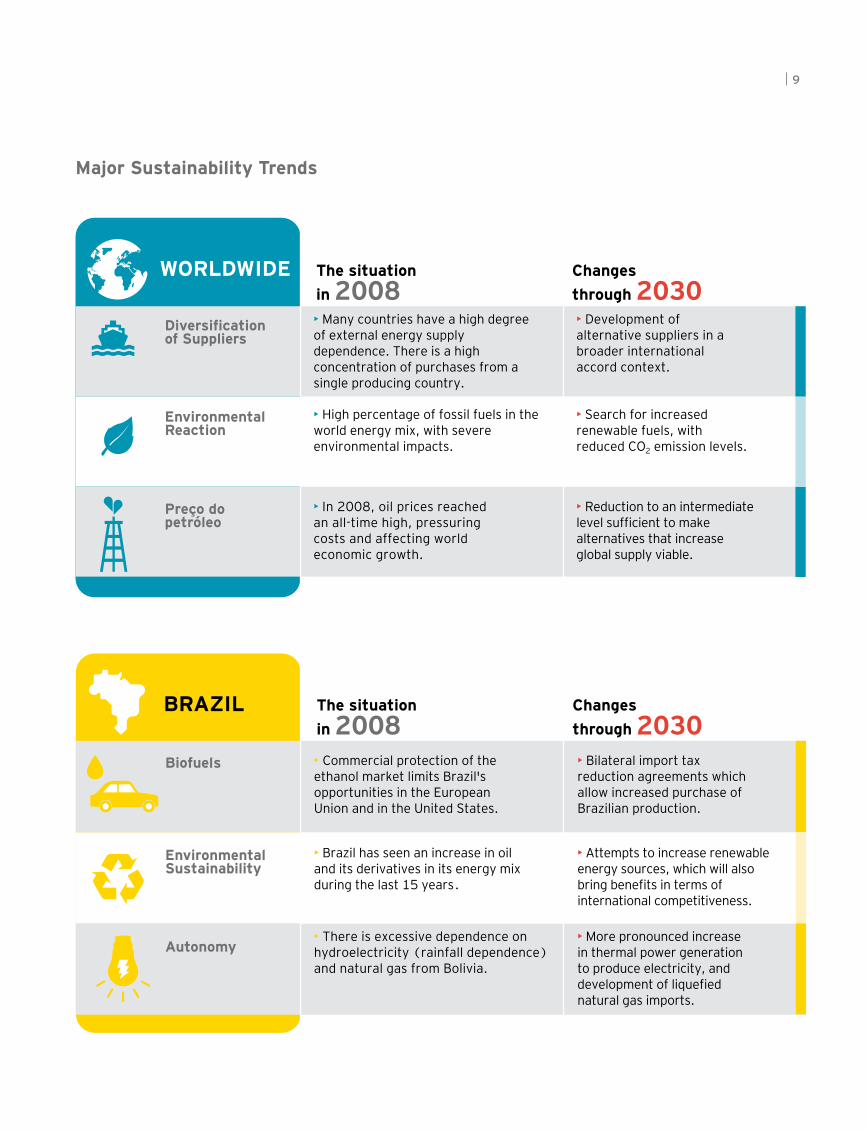
Much more than just nomenclatureThis chapter summarizes the principal concepts present in the discussion on energy market trends. The factors that determine the energy matrix and energy supply conditions combine in a complex manner, but are driven by well-defined interest groups. Thus, understanding the principal topics under discussion is a prerequisite to understanding the references that frequently determine the strategies adopted, both at the regional and global levels. As already mentioned in the previous chapter, actions guided by sustainability have been taking hold in most of the world’s energy markets. To evaluate this trend, however, we must understand the two great underlying factors.
The first is energy security, related to a conjunction of reliable supply sources. All sector planning is oriented by this concept, which involves a variety of both sources and suppliers, in addition to autonomous access to resources. Most of the time, the security factor narrows the choices. The natural gas issue in Europe illustrates the problem. Today, 20% of the electricity generated in the European Union is produced from
natural gas, and this percentage is expected to reach 27% by 2030. With the fall in production in the North Sea, European Union countries are apprehensive about the growth of imports via Russian gas pipelines, representing 40% of natural gas imports and 23% of daily consumption. To gradually dilute this dependency and establish conditions for autonomy in negotiating new contracts, the European Union is increasing its imports of liquefied natural gas, which can be supplied by various countries with liquefaction plants, such as those in Northern Africa and the Middle East.
The second great determiner of sustainability is represented by the forces reacting against environmental aggression or against climate change. This factor, visible in the actions of NGOs and international organizations, is a reality primarily due to government planning and entails a reduction in greenhouse gas emissions, as well as the implementation of efficient energy production systems. This environmental reaction establishes the conditions for clean energy, which will gradually become standard in the decisions taken by developed economies. The increased supply of biofuels and the use of nuclear energy to supply
the electricity demand satisfy these criteria, including energy security and the use of alternatives with a low carbon content.
Competitive Mix
An energy resource is competitive when its price results from competition between various production areas with special production conditions, quality differences, costs and locations. This presumes a lack of intervention from the governments of consumer countries and reduced coordination on the part of producing countries. The sustainability of energy choices requires that there be no dependence on a specific source, but rather dilution of supply risks through diversification of energy inputs. In other words, energy planning must be based on a competitive mix of sources and suppliers.
The creation of the National Alcohol Program (Proálcool) by the Brazilian government in the mid 1970s represented a pioneering energy security initiative, given the potential for an oil supply crisis. Then, the threat of generalized blackouts in 2001 evidenced the need to diversify the country’s power sources. Currently, in contrast to the
7

low probability events — with great impacts — may occur and result in a temporary collapse of supply.
Currently, autonomy is the dominant concept. Broader than self-sufficiency, it includes flexibility and margins for maneuvering and negotiating, thus maximizing different production conditions and management of energy sources for the benefit of consumers. With this increase in the range of supply and, therefore, in competition between producers and distributors, energy security conditions have improved considerably.
Sustainable MixDiversity is the key issue in developing energy supply heading towards 2030: diversity of energy resources (renewable sources, biofuels, nuclear energy, oil sand, oil shale, heavy crude) and diversity of origin to dilute the concentration (the market and political power) of fuel producing countries. An increase in the quantity of energy alternatives will result in a competitive mix and a dilution of geopolitical risks.
Global Renegotiation
With the persistent increase in oil prices, the exporting countries are increasing their revenues $700 - $900 billion per year. At the same time, international oil companies face increased exploration costs and reduced margins, which makes it difficult to increase reserves and invest in developing reserves. Government oil companies (even with the political support of their governments for exploration and production) do not have unlimited investment resources. By 2030 the relationship between producing countries, private companies and consumer countries will change due to negotiation of new agreements on access to resources and sales revenues. Government companies in producing countries must increase their stake in the oil and natural gas distribution infrastructure in consumer countries. The global renegotiation expected in the coming years will determine, in large part, the supply of the principal energy resources.
8
rigidity of natural gas transported via gas pipelines — as illustrated by the relations between Bolivia and Brazil —, liquefied natural gas is a solution that satisfies the security requirement due to origin, destination and volume flexibility.
AutonomyUntil the recent past, the principal questions related to energy security were domestic self-sufficiency. This concept was promoted beginning in the 1950s, inspired mostly by import substitution industrialization policies. Note that self-sufficiency does not necessarily mean input supply security. If domestic production is wholly centralized,
SUSTAINABLE BRAZIL ENERGY MARKET CHALLENGES
9
Major Sustainability Trends
Changes
through 2030• Development of alternative suppliers in a broader international accord context.
• Search for increased renewable fuels, with reduced CO2 emission levels.
Diversification of Suppliers
Environmental Reaction
Preço dopetróleo
• Reduction to an intermediate level sufficient to make alternatives that increase global supply viable.
The situation
in 2008• Many countries have a high degree of external energy supply dependence. There is a high concentration of purchases from a single producing country.
• High percentage of fossil fuels in the world energy mix, with severe environmental impacts.
• In 2008, oil prices reached an all-time high, pressuring costs and affecting world economic growth.
WORLDWIDE Changes
through 2030• Bilateral import tax reduction agreements which allow increased purchase of Brazilian production.
• Attempts to increase renewable energy sources, which will also bring benefits in terms of international competitiveness.
Biofuels
Environmental Sustainability
Autonomy• More pronounced increase in thermal power generation to produce electricity, and development of liquefied natural gas imports.
The situation
in 2008• Commercial protection of the ethanol market limits Brazil's opportunities in the European Union and in the United States.
• Brazil has seen an increase in oil and its derivatives in its energy mix during the last 15 years
• There is excessive dependence on hydroelectricity (rainfall dependence) and natural gas from Bolivia.
BRAZIL
.

SUSTAINABLE BRAZIL ENERGY MARKET CHALLENGES
Global Context
Energy GeopoliticsIn the next two decades, the great challenge will be to satisfy the substantial surge in energy demand with the limited availability of resources. Estimates indicate that investments greater than $ 20 trillion will be needed through 2030 to keep up with world consumption. The resources to meet this demand will come not only from development of existing hydrocarbon reserves (oil and natural gas), but also from the introduction of alternatives that will become economically viable due to high oil prices. The global arrangement needed to complete this task will be determined by regional factors, country development level and the technological conditions and market viability of the principal energy sources, as will be described further in this chapter.
The first requirement for tracing this perspective is related to the behavior of the principal producing and consuming regions. The strongest trends in the world energy market will inevitably be dictated by the following countries and regions:
The Middle East – The importance of the region will increase in the coming decades because it concentrates 56% of the world’s oil reserves and will remain the leader in production and exports of both oil and natural gas to Europe, Japan and the United States. The countries in the region are expected to maintain
10
their productive capacity at a minimum to preserve the new hydrocarbon price level.
The United States – The principal energy consumer at the moment, the country is also the largest oil buyer: it imports 66% of its demand, with 40% from OPEC countries. With the implementation of energy
Domestic production
Imports
2
4
6
8
10
12
1970 1975 1980 1985 1990 1995 2000 2005
Millions of barrels/day
10,0
5,1
Source: Getulio Vargas Foundation(*) toe: metric ton of oil equivalent.
World energy consumption expansion

AChina will become the largest energy consumer by 2010 and Russia will continue its role as an important world player, with the development of oil and natural gas fields.
efficient methods and the gradual introduction of ethanol as a fuel, the United States will become the second ranked energy consumer in 2030, but will become increasingly dependent on oil and natural gas imports from the Middle East.
China – This country will become the largest energy consumer by 2010 and the principal carbon gas emitter by 2015. With the third largest coal reserve (96 billion tons), China must exploit this energy source to generate electricity. There will be increasing pressure from the international community for the country to reduce its carbonic gas emissions.
European Union – The oil and natural gas resources in the North Sea will decline over the next two decades. Growing dependence on Russia for natural gas imports will stimulate import of liquefied natural gas (LNG) from other countries into the EU. An increase in biofuel consumption for transport should reduce oil imports and improve energy security.
Russia – Russia will continue to be an important player, with the development of oil and natural gas fields. Exports to the EU and other regions will grow over this period.
Brazil – Energy demand will grow 3.3% per year, greater than the world average. This will require investments estimated at $750 billion by 2030. In this scenario, 3.8% of world energy investments will be made in Brazil, focusing on increasing the supply of oil, natural gas and electricity generation. The country will be the seventh largest energy consumer in 2030, and may also become a supplier of oil and natural gas. The Brazilian model should follow a path that guarantees energy security, with the possibility of participating in the international natural gas market as a LNG supplier and, through its exports, create a viable international ethanol market. There will be environmental restrictions on expansion of hydroelectricity.
Source: Getulio Vargas Foundation(*) toe: metric ton of oil equivalent.

12
Efficiency and DevelopmentCountries that have already completed their industrialization process have moved on to a new stage, and tend to reduce energy consumption by introducing more efficient standards. Over the years leading to 2030, this process should become pronounced in developed countries (European Union, United States and Japan) and evolve slightly in developing countries.
Expansion of world energy demand at a rate of 2.6% per year, together with annual economic growth of 3.5%, assumes energy efficiency gains of 0.9 % per year in the period from 2007 to 2030. In the reference scenario, energy demand growth in developed countries will be 1.4% per year during this period, reaching 14.5 billion metric tons of oil equivalent in 2030 (40% of the world total), an expansion smaller than that of the economies in these countries (2% per year). It is important to note that annual gains in energy efficiency will be smaller in developed countries -- 0.6% compared to the world average of 0.9% -- but their contribution to the global economy will be greater given the large representation in total consumption.
In addition to reflecting the increasing price of energy worldwide, efforts to improve efficiency seek to satisfy political measures taken to reduce greenhouse gas emissions.
Government resolutions ensure the increased use of biofuels mixed with oil derivatives, which will represent 20% of EU consumption by 2020. In the United States, a new law introduced measures to expand ethanol production to 136 billion liters by 2022. Today, 25 billion liters are produced.
Environment and UnderdevelopmentIn the reference scenario, countries undergoing industrialization will have larger energy demand growth, on the order of 3.7% per year. By 2030,
this group of nations will be responsible for 60% of world consumption, compared to the current 47%.
In regards to electric power consumption, strong annual growth of 4.1% is expected. In developing countries, growth will be greater (5.9%), mostly due to increased electricity use in China and India. Despite the greater portion of the additional demand from developing countries being due to these two countries, a large group of developing markets in Asia and South America will represent this new consumption pattern.
Source: Getulio Vargas Foundation(*) toe: metric ton of oil equivalent.
World energy consumption expansion
Millions of toe*
1.000
2.000
3.000
4.000
5.000
5.347,9
3.462,7
338,6168,4
468,7223,2
2.388,2
6.000
China UnitedStates
Brazil Mexico
2007
2030
1.004,1
427,2
India
1.760,8
1.007,5
Russia
743,2
SUSTAINABLE BRAZIL ENERGY MARKET CHALLENGES

The group of developing countries whose GDP will grow at an average annual rate of 4.8% will have greater energy efficiency gains (1.1% per year) for two reasons: (a) the current, less sophisticated energy infrastructure, which will require smaller investments for modernization; (b) the use of low cost, energy-efficient sources with higher emission levels.
Pressured by energy prices, developing countries will tend to use cheaper resources, with increased environmental impacts. China and India, due to access costs, will see energy demand grow at 4.9% and 3.8% per year, respectively. Most of this will be coal, with a resulting increase in global emission of greenhouse gases. There will be no shortage of fuel: 23% of world coal reserves are Chinese, and 10% are Indian. Coal will be used to generate electrical power and in industry because it is domestic, abundant, and offers economic advantages for local consumption.
Even international pressure will not be enough to “decarbonize” the energy consumption of these two countries.
In 2030, China will have the highest carbon gas emission levels in the world, causing serious environmental problems, which will require changes, especially with respect to electrical power production.
Although alternatives are being discussed between the Chinese government and multilateral
organizations, there is no indication that the intense, continuous use of coal will diminish in the medium term. Control and reduction of carbon gas emissions face the growing demand for cheap energy, which is also a factor for export competitiveness.
Conventional sourcesWith the growth in world energy demand, competition for resources has become fierce, increasing the prices of existing sources and opening new supply frontiers — both geographical and technological. All sources are candidates for space in the energy mix of the future, as long as they are competitive and have guaranteed access to the consumer.
Most conventional oil is located in the Middle East (56% of world reserves) and must follow OPEC production restrictions. This creates strong commercial perspectives for this energy source in new areas, whose reserve volume is yet undetermined -- such as the case of Brazil -- particularly if independent of OPEC and located in secure export routes.
Natural gas resources are also concentrated, with 56% of world reserves located in Russia, Iran and Qatar. With increased sales of liquefied natural gas, an international price sensitive to oil price variations should become established. In this case, the outlook is good for appreciation of Brazilian natural gas over the next decade.
Brazilian LNG will limit Bolivia’s negotiating power, which today benefits from a captive market, and will find markets in countries such as Argentina and Chile.
New PetroleumOPEC’s measures to maintain a minimum differential between effective production and productive capacity will be decisive in guaranteeing high revenues from the sale of oil. High oil prices will lead to exploration and development of resources in new areas, under more expensive production conditions, as well as the development of unconventional oil resources such as shale and oil sand. An oil price of $40 in 2005 made investments in alternative sources during the 2008-2030 period attractive. In the reference scenario for this study, the international price of petroleum will stay at about $ 60 per barrel for the coming decades.
Unconventional oil resources are estimated at 4.4 trillion barrels, of which 38% is oil sand (Canada), 34% is oil shale (United States), and 27% is heavy crude (Venezuela). Investments in unconventional oil production, on the order of billions of dollars, require a stable regulatory framework and, in the projected scenario, should occur principally in Canada and the United States, and less so in Venezuela. In addition, in South Africa coal is being converted into gasoline and diesel fuel at a competitive cost.
13

14
In Canada, for example, economic feasibility projections for reserves show that, with oil prices at about $40, there will be a supply of 6 million barrels of oil per day in the form of oil sand. For higher oil prices, as predicted in the reference scenario, the supply will reach 37 million barrels per day.
Proven reserves of unconventional oil in Canada total 174 billion barrels, edged out only by the conventional oil reserves in Saudi Arabia (264 billion barrels). If there are no restrictions on capacity expansion, production of existing projects should increase from 1.1 million barrels/day to 4.4 million barrels/day in 2015. Note, however, that oil production based on oil sand has severe environmental impacts. Carbon gas emissions from gasoline produced from unconventional oil are 30% more than those from gasoline extracted from conventional oil refining processes.
The largest oil shale reserves are located in the United States (1.5 trillion barrels). The transformation of shale into synthetic fuel costs about $30 per barrel, but it should not become a relevant source in the short term due to its significant environmental impact. Hopefully, after 2020, Carbon Capture and Storage (CCS) systems will be implemented to significantly reduce the damage due to emissions.
Venezuela has resources estimated at 1.2 trillion barrels of heavy crude that can be extracted at a cost lower than that of the oil sands in Canada. But this production process is not advantageous due to the large supply of conventional oil in the country.
Biofuels
The inclusion of ethanol and other biofuels in the energy mix is extremely important, not only from the environmental standpoint, but also due to supply security. The dispute for oil and oil derivatives to satisfy the growing energy demand has made partial substitution of gasoline a critical element in energy system management.
The international biofuel market should develop over the coming years due to geopolitical and economic conditions. With the reduction in oil derivative consumption—replaced with energy sources located in risk-free countries—diversification of energy supply and, consequently, increased energy security, will occur. The international biofuel market will be sensitive to oil prices and should expand if oil prices stay above $ 40 per barrel.
One of the crucial elements in biofuel supply is the speed with which cellulose ethanol production reaches commercial scale. Technological advances
that will allow competitive production of ethanol from cellulose will substantially alter the outlook for this fuel. Technological control will be the central aspect of the production process, since it will increase availability of the raw material and the volume of ethanol produced.
In the 2003-2005 period, ethanol use was stimulated by European Union Directive 2003/30 and the United States Energy Policy Act 2005, which defined renewable fuel standards. These measures established schedules for introduction of minimum ethanol consumption volumes. In the United States, biofuels, mostly ethanol, will be mixed with gasoline and should reach 28 billion liters by 2012 and 136 billion liters by 2022, in accordance with new industry regulations. In Europe, biofuels must replace 5.7% of the energy content of fossil fuels by the end of 2010.
In these two regions, locally produced ethanol is subsidized to be competitive. Governments levy import taxes to restrict competition with corn ethanol and beet ethanol, respectively. In the countries studied, the subsidies and import taxes will gradually be reduced to guarantee reduced biofuel costs.
Production capacity is fundamental to guaranteeing
SUSTAINABLE BRAZIL ENERGY MARKET CHALLENGES

participation in the expansion of ethanol demand. New investments in this area are being made in various countries. The supply of additional ethanol capacity will depend on the articulation of various factors, such as ethanol conversion technologies, availability of raw materials and the location of plants in relation to markets.
Nuclear Energy
The sustainability of energy choices requires consensual policies on uranium enrichment and the non-proliferation of nuclear arms. Thus, the share of nuclear energy in the energy mix should increase to satisfy emissions mitigation policies and because it is less sensitive to oil price increases.
The accidents at Three Mile Island (in 1979) and Chernobyl (1986) slowed installation of new nuclear power plants. The conjugation of environmental, economic and technological factors -- materialized in a new generation of nuclear reactors -- has made this source a viable alternative. In addition, nuclear energy offers security in the uranium access route, available in countries with low potential supply risk, such as Canada, Australia and Brazil.
The increase in natural gas prices will cause many countries to prefer nuclear energy for expansion of installed capacity.
This is expected to occur in economies which already use nuclear power, in countries which intend to reduce their dependence on natural gas suppliers and those that plan on reducing coal generation, principally China, India, South Korea and Japan.
CoalAlthough it is the principal cause of carbon gas emissions, coal will continue to be used in countries with coal reserves because they cannot forgo the jobs generated by mining. Additionally, the countries that export this energy source are spread around the world, which makes coal a relatively secure source when compared with oil and natural gas, exported from the Middle East and Russia, because dependence is distributed.
In terms of long-term sustainability, CCS technology will be important in making coal a cleaner energy source. CCS may contribute to reducing carbon gas emissions by 20% to 28% by 2050. The localization of new coal power plants must take into account this technology’s implementation potential.
15

BRASIL SUSTENTÁVEL DESAFIOS DO MERCADO DE ENERGIAA
1º
2º
3º
4º
5º
6º
7º
8º
9º
10º
11º
12º
13º
14º
15º
16º
17º
18º
19º
20º
World MapENERGY
The 20 largest oil and electrical power consumers in 2030
26.511,816.163,1
5.834,64.092,33.764,53.755,73.616,93.350,33.016,52.921,62.391,22.215,52.176,22.066,82.047,32.045,81.698,11.420,61.344,51.204,9
ChinaUnited StatesIndiaRussiaBrazilJapanCanadaSouth KoreaFranceGermanySouth AfricaMexicoGreat BritainAustraliaItalySpainTurkeyThailandIndonesiaIran
13.036,26.668,11.762,51.163,81.072,81.046,3
878,2616,7613,0608,1556,4495,0494,3411,3370,1354,0343,1282,2256,7243,9
Oil Consumption in barrels/day (in thousand barrels)
Electric Power Consumption in terawatt-hours (TWh)
Source: Getulio Vargas Foundation
WorldwideGrowth in energy consumption
Growth in oil consumption
Growth in electric power consumption
1,8% 4,1%
2,6%
SouthAmerica
2,4% 4,2%
3,1%
ArgentinaBrazilChileVenezuela
Country
2,6%3,3%3,1%3,2%
2,0%2,5%2,6%2,3%
3,5%4,4%4,2%4,4%
Asia and Oceania
2,4% 5,9%
3,9%
JapanChinaSouth KoreaIndiaAustralia
Country
0,5%4,9%1,8%3,8%2,1%
0,6%3,6%1,9%2,2%1,9%
0,8%7,7%2,7%5,4%3,1%
ÁfricaSubsaariana
2,8% 4,8%
3,5%
Middle East andNorthern Africa
1,7% 3,2%
2,2%
Central Americaand the Caribbean
2,5% 3,7%
3,0%
Brazil
2,5% 4,4%
3,3%
Europe
1,1% 1,8%
1,3%
Great BritainFrancePortugalSpainGermanyRussia
Country
1,2%1,2%1,0%1,3%0,6%1,3%
1,0%1,0%0,9%1,2%0,7%1,4%
1,9%1,8%1,3%1,9%0,9%1,9%
Nafta
1,4% 2,8%
1,7%
United StatesMexico
Country
1,6%3,1%
1,2%2,5%
2,8%4,5%
1º
2º
3º
4º
5º
6º
7º
8º
9º
10º
11º
12º
13º
14º
15º
16º
17º
18º
19º
20º
United StatesChinaJapanIndiaRussiaBrazilMexicoSouth KoreaCanadaGermanyFranceGreat BritainIranIndonesiaSpainItalyThailandSingaporeAustraliaNetherlands
OilOil prices above $40 per barrel through 2030 will make alternative energy sources viable
US
D (
con
stan
t) (
20
05
)
-
10
20
30
40
50
60
70
80
1980 85 90 95 00 05 10 15 20 25 2030
Level at whichalternativesourcesbecome viable
Reference Price for the scenario
Source: Getulio Vargas Foundation
(Annual growth % - 2007 to 2030)
A
1º
2º
3º
4º
5º
6º
7º
8º
9º
10º
11º
12º
13º
14º
15º
16º
17º
18º
19º
20º
World MapENERGY
The 20 largest oil and electrical power consumers in 2030
26.511,816.163,1
5.834,64.092,33.764,53.755,73.616,93.350,33.016,52.921,62.391,22.215,52.176,22.066,82.047,32.045,81.698,11.420,61.344,51.204,9
ChinaUnited StatesIndiaRussiaBrazilJapanCanadaSouth KoreaFranceGermanySouth AfricaMexicoGreat BritainAustraliaItalySpainTurkeyThailandIndonesiaIran
13.036,26.668,11.762,51.163,81.072,81.046,3
878,2616,7613,0608,1556,4495,0494,3411,3370,1354,0343,1282,2256,7243,9
Oil Consumption in barrels/day (in thousand barrels)
Electric Power Consumption in terawatt-hours (TWh)
Source: Getulio Vargas Foundation
WorldwideGrowth in energy consumption
Growth in oil consumption
Growth in electric power consumption
1,8% 4,1%
2,6%
SouthAmerica
2,4% 4,2%
3,1%
ArgentinaBrazilChileVenezuela
Country
2,6%3,3%3,1%3,2%
2,0%2,5%2,6%2,3%
3,5%4,4%4,2%4,4%
Asia and Oceania
2,4% 5,9%
3,9%
JapanChinaSouth KoreaIndiaAustralia
Country
0,5%4,9%1,8%3,8%2,1%
0,6%3,6%1,9%2,2%1,9%
0,8%7,7%2,7%5,4%3,1%
ÁfricaSubsaariana
2,8% 4,8%
3,5%
Middle East andNorthern Africa
1,7% 3,2%
2,2%
Central Americaand the Caribbean
2,5% 3,7%
3,0%
Brazil
2,5% 4,4%
3,3%
Europe
1,1% 1,8%
1,3%
Great BritainFrancePortugalSpainGermanyRussia
Country
1,2%1,2%1,0%1,3%0,6%1,3%
1,0%1,0%0,9%1,2%0,7%1,4%
1,9%1,8%1,3%1,9%0,9%1,9%
Nafta
1,4% 2,8%
1,7%
United StatesMexico
Country
1,6%3,1%
1,2%2,5%
2,8%4,5%
1º
2º
3º
4º
5º
6º
7º
8º
9º
10º
11º
12º
13º
14º
15º
16º
17º
18º
19º
20º
United StatesChinaJapanIndiaRussiaBrazilMexicoSouth KoreaCanadaGermanyFranceGreat BritainIranIndonesiaSpainItalyThailandSingaporeAustraliaNetherlands
OilOil prices above $40 per barrel through 2030 will make alternative energy sources viable
US
D (
con
stan
t) (
20
05
)
-
10
20
30
40
50
60
70
80
1980 85 90 95 00 05 10 15 20 25 2030
Level at whichalternativesourcesbecome viable
Reference Price for the scenario
Source: Getulio Vargas Foundation
(Annual growth % - 2007 to 2030)

SUSTAINABLE BRAZIL ENERGY MARKET CHALLENGES
Business Opportunities
Demand through 2030To sustain an average annual GDP of 4%, as predicted in the scenario outlined in this study, Brazil has much work to do. However, the magnitude of the opportunities in this market correspond to the magnitude of the challenge. By
18
2030, the country will consume 371.8 million metric tons of oil equivalent, a growth of 3.3% per year. This evolution is related to industrial production growth (both for the domestic market and for export) and greater domestic consumption.
This domestic consumption should reach 3,7 million barrels
per day. The transport sector will be the principal consumer of oil derivatives, especially diesel fuel. An increase in biofuel supply should reduce domestic gasoline consumption, which will result in net export of this fuel due to its international market price.
Electric power consumption will total 1,073 TWh, an increase of
Final energy consumption** Oil and derivatives Power Biofuels and coal Total
Domestic production Oil and derivatives Power Biofuels and coal Total
Surplus Oil and derivatives Power Biofuels and coal Total
80,4 34,1 62,5
177,0
110,8 36,9 86,9
234,6
30,4 2,8
24,4 57,6
141,4
92,3 138,1 371,8
210,0 95,0
210,0 515,0
68,6 2,7
71,9 143,2
2007 2030Millions of toe* (%) per year
2,5% 4,4%
3,6%3,3%
2,8%4,2%
3,9%3,5%
3,6%-0,1%
4,8%4,0%
Source: Getulio Vargas Foundation(*) toe: metric ton of oil equivalent. (*) Excludes energy sector consumption.
The Energy Balance Sheet in 2030

AEnvironmental restrictions are expected to limit the expansion of hydroelectric energy, especially in the Amazon, where the largest potential hydropower resources are located.
4.4% per year from 2007 through 2030. Among the factors that explain this high demand, the evolution of the industrial sector, the broadening of the services sector and increased use of electricity by the population should be mentioned — all the consequence of a higher standard of consumption of goods and services.
Supply AlternativesOil will continue to be the principal energy source in Brazil in 2030, propelled principally by investments in exploration and development of new reserves beginning in 2015. Among liquid fuels, the supply of ethanol and biodiesel will require a new distribution strategy for oil derivatives in the domestic and international markets.
The supply of natural gas will be formed by development of new reserves and LNG imports. The effective volume of these reserves will determine the increase in the domestic market and possible export of LNG to the United States, Argentina and Chile. Imports from Bolivia should stay at current levels of 30 million m³/day.
An increase of 2.8% in the supply of oil, derivatives and natural gas is expected, which will expand annual
production to 4.2 million barrels per day in 2030. The expected investment through 2030 is $ 350 billion in the oil sector and $ 90 billion in natural gas.
With respect to hydroelectric power, which will continue to be the dominant source for electricity, environmental restrictions should limit expansion, especially to the Amazon, where the largest potential hydropower resources are located. During this period, there will be increasing recourse to thermal power generation for electricity. Nuclear energy should be more intensely used, as well as biomass, with the burning of the waste from ethanol production and mineral coal. The electric power industry will have to make investments of $ 310 billion through 2030 to keep up with a supply growth of 4.2% per year. Only a residual supply will be obtained from small hydroelectric plants and wind power.
In the final balance of the energy sector, there will be an increase in surplus Brazilian production with respect to domestic demand, which will rise from 57.6 million toe in 2007 to 143.2 million toe in 2030. In this context, biofuel production will surpass increased demand (3.9% per year versus
3.6% per year, respectively), which is justified by international opportunities, especially in the United States, Europe and Japan.
Industrial ConsumersThe transport and industrial sectors will continue to be the largest energy consumers, though with different use patterns in developed and developing countries. Transport will be more efficient in mature economies over this period. In industry, environmental restrictions will make production in developed countries more expensive when compared with energy costs in developing nations.
With the rise in energy prices and the geopolitical tensions resulting from the concentration of hydrocarbons in regions that involve supply risks, such as the Middle East, intensive energy activities will gradually move to countries with competitive energy resources, raw materials and production costs. China and India have these qualities. Brazil will have energy, but its cost will not be as competitive, especially electric power. During this period, despite geopolitical risks, the Middle East will continue to be an attractive

supplier of oil, derivatives and natural gas to petrochemical companies.
The evolution of Brazilian energy supply through 2030 will be marked by the new prices for oil and electricity. The average price of oil is expected to continue at $ 59.3 per barrel over the 2008-2030 period, a price 117% higher than the average price during the last 17 years. On the other hand, a 31.2% rise in electric
power prices is also expected due to increases in investment and environmental costs.
The unfavorable evolution of energy prices will spur the implementation of conservation and rationalization measures. In Brazil, large consumers are expected to have efficiency gains on the order of 0.7% per year between 2007 and 2030, a figure similar to that estimated for the US economy (0.8% per year).
20
The Electric Power Distribution MarketElectrical power distribution companies will compete on a diversified resource base to provide the best composition for their clients. Hydroelectric power will predominate, followed by thermoelectric and natural gas. Bioelectricity (from sugarcane biomass) should provide 10 MW of power beginning in 2015, and
Power
Appliances
-2%
0%
2%
4%
6%
8%
10%
- 0,18- 0,15
1,82 1,99
3,22
from R$ 2.000 to R$ 4.000
from R$ 4.000 to R$ 8.000
from R$ 8.000 to R$ 16.000
from R$ 16.000 to R$ 32.000
overR$ 32.000
up to R$ 1.000
from R$ 1.000 to R$ 2.000
3,52
4,224,63
5,075,65
6,60
7,20
8,78
9,51
Source: Getulio Vargas Foundation(*) At 2007 prices.
Growth of residential consumption and consumption by appliances, 2007 through 2030By income bracket*, (%) per year
SUSTAINABLE BRAZIL ENERGY MARKET CHALLENGES

nuclear energy will become more important during the period. There will no longer be captive markets, except in low-density areas, and distributors (who will continue to own distribution facilities) will compete in all markets through vendors.
Family consumption should grow at a rate of 3.8% per year, following a rise of 2.2% per year in the number of homes, as mentioned in the first publication
in this series. These projections indicate a trend towards an increase in average consumption by Brazilian families due to rising use of appliances, made possible by increased incomes and easier access to housing. Growth of consumption will be more intense in the upper classes, although in absolute terms the greatest contribution (more than 40%) will come from families with monthly incomes between R$ 2,000 and R$ 8,000.
Source: Getulio Vargas Foundation(*) At 2007 prices.
Growth in fuel consumption and vehicles, 2007 through 2030
Fuel
Vehicles
up toR$ 1.000
12%
10%
8%
6%
4%
2%
0%
-2%
from R$ 1.000 to R$ 2.000
from R$ 2.000 to R$ 4.000
from R$ 4.000 to R$ 8.000
from R$ 8.000 to R$ 16.000
from R$ 16.000 to R$ 32.000
over R$ 32.000
- 0,18 - 0,15
2,041,83
3,703,27
5,044,29
6,25
5,15
8,29
6,63
11,76
8,76
By income bracket*, (%) per year
The Fuel MarketThe supply of vehicle fuel in Brazil will be based on the availability of gasoline, ethanol and vehicular natural gas in proportions that will depend, basically, on the volumes of ethanol exported. Until the volume of natural gas to be supplied to the domestic market from the Santos Basin reserves is defined, vehicular natural gas will remain on the margins, subject to the seasonality of the electric
21

system, which uses this source for power generation when rainfall is insufficient during the wet season. This means that its expansion may be contained and its share gradually reduced by the end of the next decade.
The supply of gasoline is expected to rise with the expansion of Brazil’s refining capacity, estimated at 500,000 barrels per day. The new investments, in addition to modernization of Brazil’s refinery infrastructure, will produce gasoline under technical conditions that will satisfy the requirements of the international market. Due to the increasing demand on the world market for gasoline with a low sulfur level and restrictions on refining in developed countries, substantial volumes of Brazilian gasoline should be exported, although subject to competition from new refining capacity installed in other countries. Export volume is expected to reach 9.3 billion liters in 2030, which means an expansion of 5% yearly with respect to 2005.
The great ethanol expansion process, in place in Brazil since 2005, was determined by the opportunity to gradually substitute gasoline in developed markets. Brazilian production of ethanol from sugarcane has a competitive advantage compared to other existing production systems, but, for its share of the international market, it must compete with sugarcane ethanol from other
developing countries and with cellulose ethanol production.
The projections assume an annual growth rate of 3.3% for the vehicle fuel market in Brazil during this period. Of this total, the volume to be supplied in the form of ethanol is 45% due to fleet growth and energy efficiency gains in fuel use — the Brazilian fleet is expected to have yields of 10.4 km/l with the mix of fuels.
With this, enlargement of the domestic ethanol market will be greater than that of gasoline: 4.3% compared to 2.5%, respectively. Ethanol exports are expected to reach 17.4 billion liters in 2030, growth of 8.9% per year based on 2005 exports.
For an Even Larger GDPAs seen in the second volume of this series, institutional and human resource improvements have led to sustained development at levels higher than economic growth. In this modified scenario, an average GDP annual growth rate of 4.6% is assumed for the 2007-2030 period. This new level brings even greater challenges for the energy sector.
Thus, energy demand will grow at an annual rate of 3.9%, with greater expansion of consumption of electricity (4.9% per year) and oil,
22 SUSTAINABLE BRAZIL ENERGY MARKET CHALLENGES
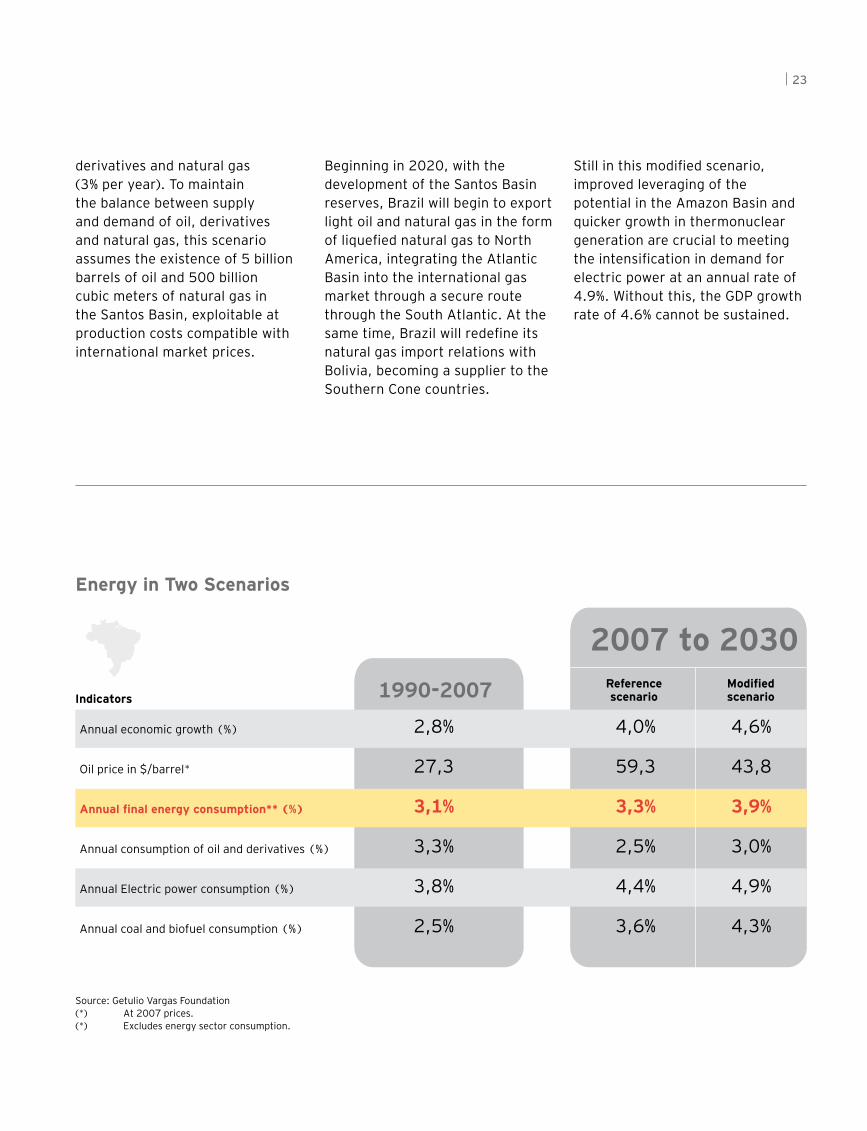
derivatives and natural gas (3% per year). To maintain the balance between supply and demand of oil, derivatives and natural gas, this scenario assumes the existence of 5 billion barrels of oil and 500 billion cubic meters of natural gas in the Santos Basin, exploitable at production costs compatible with international market prices.
Beginning in 2020, with the development of the Santos Basin reserves, Brazil will begin to export light oil and natural gas in the form of liquefied natural gas to North America, integrating the Atlantic Basin into the international gas market through a secure route through the South Atlantic. At the same time, Brazil will redefine its natural gas import relations with Bolivia, becoming a supplier to the Southern Cone countries.
Still in this modified scenario, improved leveraging of the potential in the Amazon Basin and quicker growth in thermonuclear generation are crucial to meeting the intensification in demand for electric power at an annual rate of 4.9%. Without this, the GDP growth rate of 4.6% cannot be sustained.
2007 to 2030Referencescenario
Modifiedscenario
2,8%
27,3
3,1%
3,3%
3,8%
2,5%
4,0%
59,3
3,3%
2,5%
4,4%
3,6%
4,6%
43,8
3,9%
3,0%
4,9%
4,3%
Annual economic growth (%)
Oil price in $/barrel*
Annual final energy consumption** (%)
Annual consumption of oil and derivatives (%)
Annual Electric power consumption (%)
Annual coal and biofuel consumption (%)
Indicators 1990-2007
Source: Getulio Vargas Foundation(*) At 2007 prices. (*) Excludes energy sector consumption.
Energy in Two Scenarios
23

Project and editing management:Mitizy Olive Kupermann
Editorial coordination:Rejane Rodrigues (MTB 22.837)
Printing and design:Ernst & Young Terco Branding and Communication Department
Infographs:Infografe
Revision:Beatriz Marchesini
Our offices
São Paulo | SPCondomínio São LuizAv. Presidente Juscelino Kubitschek, 1.830 Torre I - 5º ao 10º e 13º andares, Torre II - 5º ao 7º e 10º andaresTorre III - 11º andarItaim Bibi - ZIP Code: 04543-900+55 11 2573 3000
Av. Das Nações Unidas, 12.995 13°, 14°, 15 e 16º andares Brooklin Novo - ZIP Code: 04578-000+55 11 3054 0000
Av. Maria Coelho Aguiar, 215 Bloco B - 4º Andar Jd São Luis - ZIP Code: 05804-900+55 11 2573 3000
Campinas | SPGalleria Corporate Av. Dr. Carlos Grimaldi, 1.701 - 3° andar 3A Fazenda São Quirino - ZIP Code: 13091-908+55 19 2117 6450
Rio de Janeiro | RJCentro Empresarial Botafogo Praia de Botafogo, 300 - 13º andarBotafogo - ZIP Code: 22250-040+55 21 2109 1400
Rua do Ouvidor, 88 - 6º andar Centro - ZIP Code: 20040-030+55 21 2222 3100
Praia de Botafogo, 228, Ala B - 13º andar Botafogo - ZIP Code: 22359-900+55 21 3736 9500
Belo Horizonte | MGEdifício Asamar R. Paraíba, 1.000 - 10° andarFuncionários - ZIP Code: 30130-141+55 31 3055 7750
Rua Bernardo Guimarães, 245 - 17º andar Funcionários - ZIP Code: 30140-080+55 31 3508 7200
Blumenau | SCEdifício California CenterR. Dr. Amadeu da Luz, 100 8° andar, conjunto 801 Centro ZIP Code: 89010-160+55 47 2123 7600
Brasília | DFEdifício Brasil 21 Setor Hoteleiro Sul - Quadra 06 conjunto A, bloco A - 1º andar - sala 105ZIP Code: 70316-106 +55 61 2104 0100
Goiânia | GOAv. República do Líbano, 1551 4º andar, sala 402 Setor Oeste - ZIP Code: 74125-125+55 62 3212 0210
Curitiba | PRCondomínio Centro Século XXIR. Visconde de Nacar, 1.440 - 14º andarCentro - ZIP Code: 80410-201 +55 41 3593 0700
Porto Alegre | RSCentro Empresarial Mostardeiro Av. Mostardeiro, 322 - 10º andarMoinhos de Vento - ZIP Code: 90430-000+55 51 2104 2050
Recife | PEEdifício Empresarial Center IIIR. Antônio Lumack do Monte, 128 - 14° andar Boa Viagem - ZIP Code: 51020-350+55 81 3092 8300
Salvador | BAEdifício Guimarães Trade Av. Tancredo Neves, 1.189 - 17° andar Pituba - ZIP Code: 41820-021+55 71 3496 3500
Rua da Alfazema, 761 - 2º andar Salas 201, 202 e 210 Caminho das Árvores - ZIP Code: 41820-710+55 71 2203 4350
Getulio Vargas Foundation Team
Technical coordination andcontent development:FGV Projetos
Project director:César Cunha Campos
Supervisor:Ricardo Simonsen
Coordinator:Fernando Garcia (in charge of scenario model)
Technical staff:Edney Cielici Dias (editorial, research and editorialconsulting), Ana Maria Castelo (real estate sectorresearch), Otávio Mielnik (energy sector research),Robson Ribeiro Gonçalves (agribusiness research),Jorge de Oliveira Pires (industrial competitivenessresearch), Ana Lélia Magnabosco (research ofindicators)
This is a publication of the Communicationand Brand Management Department ofErnst & Young Terco Brazil.
SUSTAINABLE BRAZIL ENERGY MARKET CHALLENGESA

AErnst & Young Terco
Assurance | Taxes | Transactions | Advisory Services | Middle Market | Government | Financial Services
About Ernst & Young
Ernst & Young is a global leader in assurance, tax, transaction and advisory services. Worldwide, our 144,000 people are united by our shared values and an unwavering commitment to quality. We make a difference by helping our people, our clients and our wider communities achieve their potential.
In Brazil, Ernst & Young Terco is the most complete company for advisory and assurance services in Brazil, boasting 3,500 professionals that support and serve over 3,400 large-, medium- and small-sized companies, 111 of which are listed on CVM (in June 2010) and are part of the special portfolio of the assurance team.
www.ey.com.br
© 2011 EYGM Limited. All Rights Reserved.
This is a publication of the Branding & Communication Department.
The full or partial reproduction of the contents of this publication is allowed provided the source is quoted.