sustainable brand perception vs. performance: reducing the gap - tom zara
TRANSCRIPT

Sustainable Brands London Conference
Sustainable Brand Perception vs. Performance: Reducing the Gap
¡ Tom Zara, Global Practice Leader of Corporate Citizenship, Interbrand

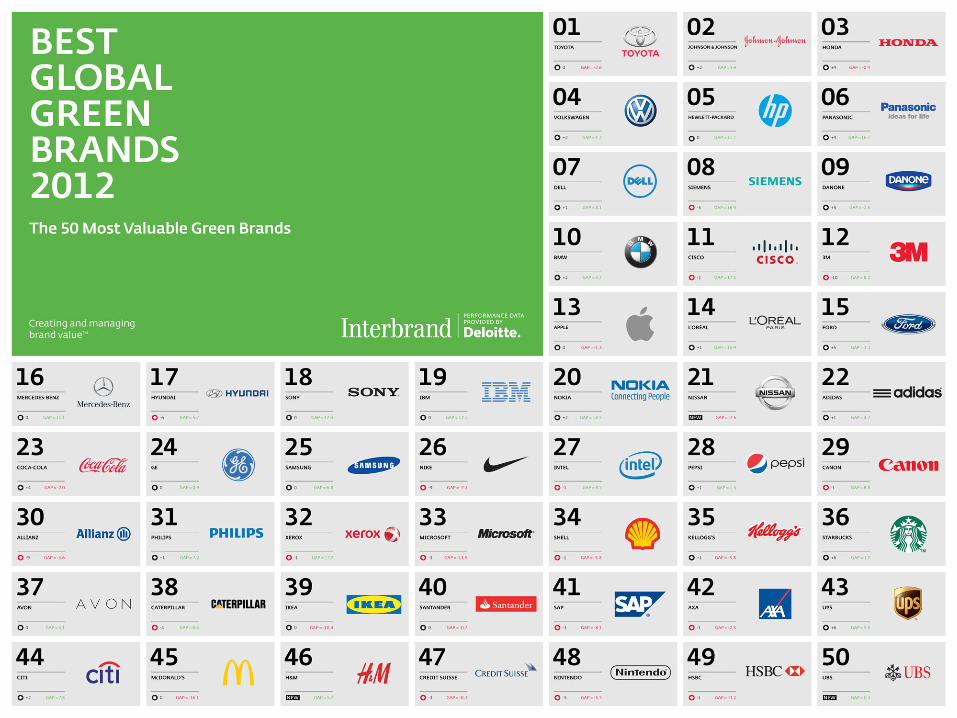
BEST GLOBAL GREEN BRANDS 2012
27 November 2012
Agenda
1. Introduction to the Interbrand Best Global Green Brands rankings
2. Brand value perception methodology
3. Sustainability performance methodology
4. Value of sustainability reporting and disclosure strategy
2 | Best Global Green Brands | London | 27 November 2012

The world is moving to a new center of gravity
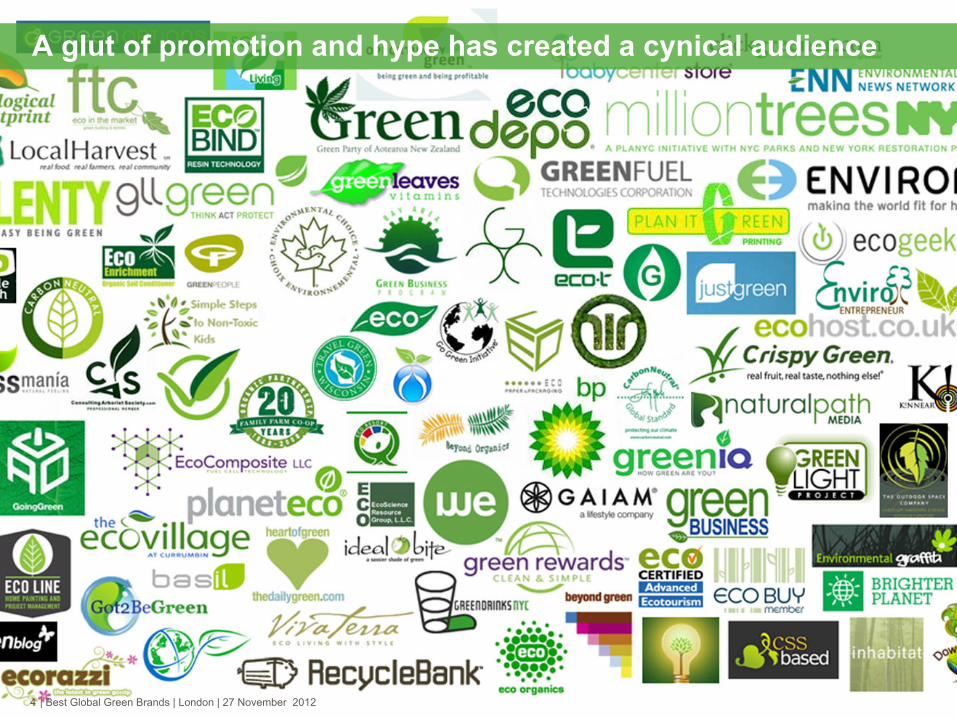
A glut of promotion and hype has created a cynical audience
4 | Best Global Green Brands | London | 27 November 2012

Yet, there is clearly a lot of noise around sustainability

We call this new paradigm ‘Corporate Citizenship’
| Best Global Green Brands | London | 27 November 2012 6
Government Employees Customers Suppliers Community Planet
How a Company treats….
…defines their perceived “Corporate Citizenship”

Critical examination of a key constituent
| Best Global Green Brands | London | 27 November 2012 7
Government Employees Customers Suppliers Community Planet
How a Company treats….
…defines their perceived “Corporate Citizenship”

Methodology
| Best Global Green Brands | London | 27 November 2012 8

Our Starting Point

79 Brands Evaluated

Performance Score
The performance score is calculated by Deloitte based on these 6 pillars:
| Best Global Green Brands | London | 27 November 2012 11
Governance Policies and mechanisms put in place by the company to manage environmental impacts and successfully set and execute environmental programs.
Operations The company’s performance across operations as measured in energy efficiency, GHG emissions, water management, waste management, and toxic emissions management.
Transportation and Logistics The company’s performance in measuring, reporting, and mitigating the environmental performance of their transportation and logistics, business travel and commuting.
Stakeholder Engagement The degree to which the company recognizes and engages with the various relevant stakeholder groups associated with the company.
Supply Chain The company’s performance in measuring, reporting, and mitigating the environmental performance of their supply chain.
Products and Services The product portfolio of the company and an evaluation of the green attributes of its products, including product efficiency, sustainable production, and use of life cycle assessment.

Green perception assessment is based on a survey
• We interviewed a total of 10,000 consumers via an online survey
• Each brand was rated by at least 125 consumers per market (a total of 1,250 respondents per brand)
• The markets included the top 10 countries in terms of economic impact (highest percentage of global GDP)
| Best Global Green Brands | London | 27 November 2012 12
United States Japan China Germany France United
Kingdom Italy Brazil Spain Canada

Perception Score
The perception score is calculated by Interbrand based on the 6 external factors of our brand strength components:
| Best Global Green Brands | London | 27 November 2012 13
Authenticity The perceived credibility of the brand’s environmental claims.
Differentiation How differentiated the brand’s green efforts are perceived to be relative to other competitors in the category.
Presence Consumer awareness of the brand’s green activities and its green reputation in the market.
Relevance An assessment of the relevance of brand’s environmental claims. This involves comparing the perceived importance of green activities for the category with the brand’s green perception.
Consistency The consistency of the brand’s various green communications across all touchpoints.
Understanding The level of understanding of the brand’s green activities as a whole.
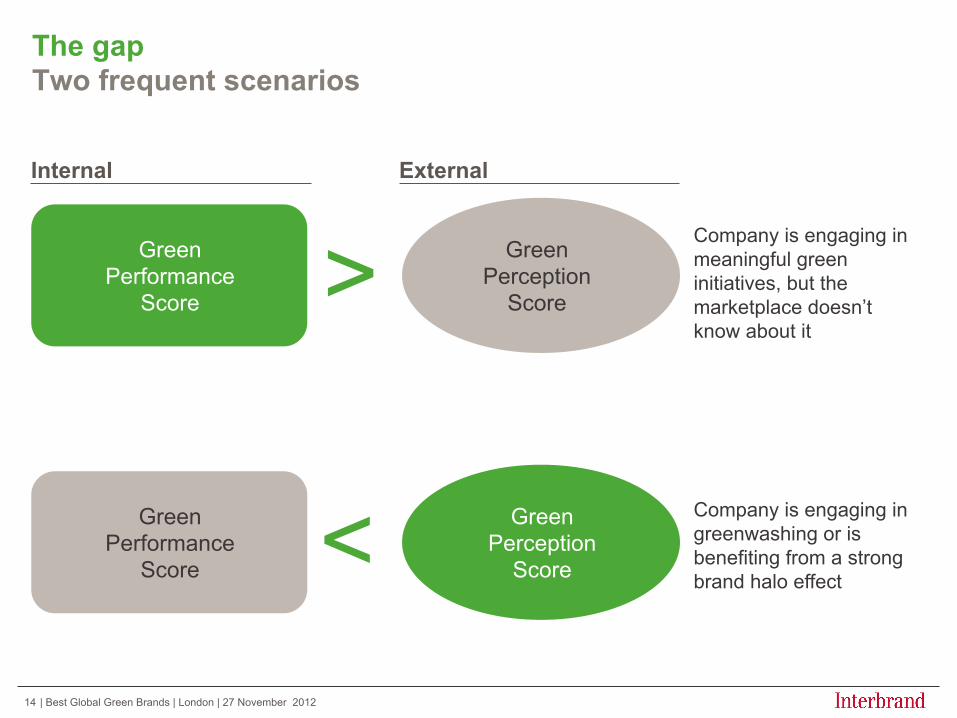
The gap Two frequent scenarios
| Best Global Green Brands | London | 27 November 2012 14
Internal External
Green Perception
Score
Green Perception
Score
>
<
Company is engaging in meaningful green initiatives, but the marketplace doesn’t know about it
Company is engaging in greenwashing or is benefiting from a strong brand halo effect
Green Performance
Score
Green Performance
Score