sustainability strategy : the case of logistics service
TRANSCRIPT

This document is downloaded from DR‑NTU (https://dr.ntu.edu.sg)Nanyang Technological University, Singapore.
Sustainability strategy : the case of logisticsservice providers
Lim, Jun Ming.
2012
Lim, J. M. (2012). Sustainability strategy : the case of logistics service providers. Final yearproject report, Nanyang Technological University.
https://hdl.handle.net/10356/95510
Nanyang Technological University
Downloaded on 04 Apr 2022 19:18:56 SGT
SUSTAINABILITY STRATEGY: THE CASE OF
LOGISTICS SERVICE PROVIDERS
LIM JUN MING
SCHOOL OF CIVIL AND ENVIRONMENTAL ENGINEERING
COLLEGE OF ENGINEERING
NANYANG TECHNOLOGICAL UNIVERSITY
2012
ATTENTION: The Singapore Copyright Act applies to the use of this document. Nanyang Technological University Library

SUSTAINABILITY STRATEGY: THE CASE OF
LOGISTICS SERVICE PROVIDERS
SUBMITTED BY:
LIM JUN MING
SCHOOL OF CIVIL AND ENVIRONMENTAL ENGINEERING
COLLEGE OF ENGINEERING
NANYANG TECHNOLOGICAL UNIVERSITY
A Final Year Project presented to the Nanyang Technological University
in partial fulfillment of the requirements for the Degree of
Bachelor of Science (Maritime Studies)
2012
ATTENTION: The Singapore Copyright Act applies to the use of this document. Nanyang Technological University Library

i | P a g e
ABSTRACT
Logistics service providers are beginning to understand that sustainability can be a great source of
competitive advantage and those who manage to translate sustainability into sources of
differentiation will emerge as winner in this new competitive landscape. Accordingly, many have
devised and implemented some sort of sustainability strategy. Unfortunately, the quest to
sustainability is not always smooth-sailing and problems often arise as a result of inadequate
stakeholders’ participation in sustainability-related decision-making and sustainability strategy
not being developed within business context. This paper thus seeks to explore and analyze how
participation from different stakeholder groups may affect the outcome of sustainability strategy
and how this is affected by the level of integration between business strategy and sustainability
strategy. Through a survey conducted among 96 logistics service providers and the use of
Structural Equation Modeling technique, full information maximum likelihood, it is shown that
higher level of participation from internal and value chain stakeholders can lead to better
integration between business strategy and sustainability strategy. In addition, it was established
that the level of integration positively correlates with sustainability performance. The findings
shed light on what managers and public officials can do to help logistics service providers
achieve better sustainability performance.
ATTENTION: The Singapore Copyright Act applies to the use of this document. Nanyang Technological University Library

ii | P a g e
ACKNOWLEDGEMENTS
The author would like to express his sincere and heartfelt gratitude to his project supervisor,
Assistant Professor Lam Siu Lee, Jasmine, for her continual guidance and support throughout the
course of this research project.
In addition, the author would like to thank the two survey reviewers for their invaluable advice
and all other maritime and logistics professionals who have participated in the survey.
Finally, the author wishes to acknowledge the funding support for this project from Nanyang
Technological University under the Undergraduate Research Experience on Campus (URECA)
programme.
ATTENTION: The Singapore Copyright Act applies to the use of this document. Nanyang Technological University Library
iii | P a g e
TABLE OF CONTENTS
Abstract............................................................................................................................................. i
Acknowledgements ......................................................................................................................... ii
Table of Contents ........................................................................................................................... iii
List of Figures .................................................................................................................................. v
List of Tables ................................................................................................................................... v
Chapter 1 Introduction ................................................................................................................. 1
1.1 Background ................................................................................................................. 1
1.2 Objectives ................................................................................................................... 1
1.3 Scope ........................................................................................................................... 2
Chapter 2 Literature review & theoretical development .............................................................. 3
2.1 Corporate Sustainability .............................................................................................. 3
2.2 Sustainable Logistics .................................................................................................. 4
2.3 Drivers of sustainability strategy ................................................................................ 5
2.3.1 Natural Resources ................................................................................................ 6
2.3.2 Employees ........................................................................................................... 6
2.3.3 Capital Market ..................................................................................................... 7
2.3.4 Customer .............................................................................................................. 7
2.3.5 Non-governmental Organization (NGO) and Community .................................. 8
2.3.6 Policy and Regulations ........................................................................................ 8
2.3.7 Competitor ........................................................................................................... 9
2.4 Theoretical development ............................................................................................. 9
2.4.1 Link between Stakeholders’ participation & Integration ................................... 10
2.4.2 Link between Integration and Performance ....................................................... 11
Chapter 3 Methodology .............................................................................................................. 13
3.1 Survey Design ........................................................................................................... 13
3.2 Sample....................................................................................................................... 13
ATTENTION: The Singapore Copyright Act applies to the use of this document. Nanyang Technological University Library
iv | P a g e
Chapter 4 Findings & discussion ............................................................................................... 17
4.1 Model Fit ................................................................................................................... 17
4.2 Structural Model & Hypothesis Testing ................................................................... 18
4.3 Implications ............................................................................................................... 20
Chapter 5 Conclusion & recommendation ................................................................................. 23
References ..................................................................................................................................... 25
Appendix A – Survey Instrument .................................................................................................. 32
Appendix B – Survey Invitation (Email) ....................................................................................... 35
Appendix C – Survey Reminder (Email) ...................................................................................... 36
Appendix D - Analysis Summary (Short Term) ............................................................................ 37
Appendix E - Analysis Summary (Long Term) ............................................................................ 43
ATTENTION: The Singapore Copyright Act applies to the use of this document. Nanyang Technological University Library

v | P a g e
LIST OF FIGURES
Figure 1 - The five Aspects of Sustainable Logistic ........................................................................ 4
Figure 2 - Seven Drivers of Sustainability ...................................................................................... 5
Figure 3 - Theoretical Model ......................................................................................................... 10
Figure 4 - Hypothesized Relationships .......................................................................................... 12
Figure 5 - Overall structural equation model ................................................................................. 17
Figure 6 - Estimates of structural model (Short Term Benefits) ................................................... 19
Figure 7 - Estimates of structural model (Long Term Benefits).................................................... 19
LIST OF TABLES
Table 1 - Construct, item, measure and related literature .............................................................. 14
Table 2 - Profile of survey respondents ......................................................................................... 15
Table 3 - Summary of hypotheses testing ..................................................................................... 20
Table 4 - Standardized total effects ............................................................................................... 20
ATTENTION: The Singapore Copyright Act applies to the use of this document. Nanyang Technological University Library
1 | P a g e
CHAPTER 1: INTRODUCTION
1.1 BACKGROUND
In recent years, three powerful forces namely, globalization, climate change and information
technology, have amplified the salience of sustainability to business. In particular, there has been
heightened public concerns about environmental and social issues such as resource depletion,
pollution and unfair treatment of workers (e.g. EurActiv, 2008; Kan, 2011; Revkin, 2002;
Rosenthal, 2009). Consequently, the issue of sustainability is gaining mindshare in board rooms
around the world (Naik, Ward, Godfrey, & Hanifan, 2011; Porter & Kramer, 2006).
As companies start to make business decisions based on the need for sustainability and turn in to
its potential marketing value (Greenbiz, 2007; Maersk Line, 2010), they demand their Logistics
Service Providers (LSPs) to do likewise (PricewaterhouseCoopers, 2009; Waters, 2010).
Acceding to these requests is not always easy and some LSPs may even view this as a hindrance
to growth. Others have however, recognized it as a business opportunity (Accenture, 2009;
Berthon, Lowitt, & Hoffman, 2008). These farsighted players understand that sustainability can
be a great source of competitive advantage. Those who manage to translate sustainability into
sources of differentiation and a key value driver for their customers, stakeholders and, ultimately,
their bottom lines, will emerge as winner in this new competitive landscape (Engardio, Capell,
Carey, & Hall, 2007; Esty & Winston, 2006; Hart, 2005; KPMG International, 2011). Thus, many
have devised and implemented some sort of sustainability strategy.
Unfortunately, not all those who are committed to the quest for sustainability are able to succeed.
In fact, previous literature suggests that investment in improving the environment and society
seldom brings about positive financial returns (Walley & Whitehead, 1994). Whilst this has
changed over the years, many companies still find such investment rarely outperforming market
benchmarks (Mansdorf, 2010; The Economist, 2007). These are often caused by inadequate
stakeholders’ participation in sustainability-related decision-making (Burke & Logsdon, 1996; M.
S. Reed, 2008) and sustainability strategy not being developed within business context (Boston,
2010; UN Global Compact-Accenture CEO Study, 2010).
1.2 OBJECTIVES
The objective of this study is to explore and analyze how participation from different stakeholder
groups may affect a LSP’s sustainability performance. An important mediating factor, which is
ATTENTION: The Singapore Copyright Act applies to the use of this document. Nanyang Technological University Library

2 | P a g e
likely to affect this, is the level of integration between its business strategy and sustainability
strategy (Burritt & Saka, 2006; Wagner, 2011).
In order to achieve the objective, this paper seeks to answer the following questions:
[1] What is sustainability strategy in the context of LSP;
[2] What are the drivers influencing them to pursue the cause;
[3] What are the measures of integration and sustainability performance &
[4] How does these constructs (i.e. stakeholders’ participation, level of integration between
business strategy and sustainability strategy, and sustainability performance) affect each
other?
1.3 SCOPE
For the purpose of this study, LSP may be defined as provider of logistical services and consists
of only second-party (2PL) and third-party LSP (3PL). 2PLs are providers handling basic
logistics services and includes carriers and warehouse space providers (Kersten & Koch, 2010).
3PLs, on the other hand, are providers of an entire bundle of coordinated logistics services
(Selviaridis & Spring, 2007). Another common category is the fourth-party LSP (4PL) which are
those who manage material and information flows in entire supply chains of diverse companies as
a neutral agent (Kersten & Koch, 2010). As 4PLs typically do not own assets and are restricted in
terms of the range of sustainability activities they can perform, they are not included in this study.
A survey will be conducted to obtain data on LSP’s stakeholders’ participation, level of
integration between its business strategy and sustainability strategy, and its sustainability
performance. The results obtained will then be empirically evaluated using Structural Equation
Modeling technique, full information maximum likelihood, via SPSS AMOS.
In the sections that follow, literature concerning corporate sustainability is reviewed. The
theoretical framework and methodology will then be presented. Finally, the findings are discussed
along with suggestions on implication for both future research and practice.
ATTENTION: The Singapore Copyright Act applies to the use of this document. Nanyang Technological University Library
3 | P a g e
CHAPTER 2: LITERATURE REVIEW & THEORETICAL DEVELOPMENT
While the topic of sustainability has been widely discussed, previous studies have tend to focus
on industries that deal directly with resources such as mining (e.g. Figueroa, 2010; Hilson &
Murck, 2000; Kumah, 2006; Mudd, 2007; Yu, Zhang, & Zhou, 2008) and energy (e.g. Petrie,
2007; Spalding-Fecher, 2003). Whilst recent years have seen increasing interest in sustainable
logistics, most of these studies tend to focus on the design of sustainable logistics network (e.g.
Chaabane, Ramudhin, & Paquet, 2012; El korchi & Millet, 2011; Frota Neto, Bloemhof-Ruwaard,
van Nunen, & van Heck, 2008; Lee, Dong, & Bian, 2010) rather than on sustainability strategy of
Logistics Service Provider (LSP).
This section thus, provides a review of relevant literature and identifies the gaps in previous
literature. It begins by defining corporate sustainability and what it means for LSP. This is
followed by a discussion on the seven drivers of sustainability. Finally, a conceptual framework
to analyze the relationship between LSP’s stakeholders’ participation, integration between its
business strategy and sustainability strategy, and outcome of their sustainability strategy is
proposed.
2.1 CORPORATE SUSTAINABILITY
The idea of Corporate Sustainability (CS), initially proposed about two decades ago, revolves
around the central thesis that the goals of environmental conservation and the goals of business
need not be disparate and conflicting (Barbier, 1987; Dyllick & Hockerts, 2002; Hawken, Lovins,
& Lovins, 1999; Jr, Schmidheiny, & Watts, 2002). However, in recent years, there are growing
censuses and sentiments that CS entails more than having non-conflicting environmental and
business goals. Accordingly, a variety of definitions have emerged (e.g. Cesar, 1994; Elkington,
1998; Kolstad & Krautkraemer, 1993; Maersk Line, 2010; Munasinghe, 1994; Pearce & Turner,
1990; Pezzey, 1992; Schaltegger & Burritt, 2006; World Business Council for Sustainable
Development, 2008).
Schaltegger & Burritt (2006), for example, defined CS in a broad approach relating to the
contextual integration of economic, environmental and social characteristics. They additionally
proposed that the challenge to CS relate not only to the dimensions but also their
interrelationships. This concurred with the view of Elkington (1998) and his widely-accepted
triple bottom line (3BL) definition.
ATTENTION: The Singapore Copyright Act applies to the use of this document. Nanyang Technological University Library

4 | P a g e
On the other hand, Munasinghe (1994) defined CS as involving the improvement of the range of
opportunities that will enable individual human beings and communities to achieve their
aspiration and full potential over a sustained period of time, while maintaining the resilience of
economic, social and environmental system. This definition highly resembles that adopted by the
World Business Council for Sustainable Development, which is a CEO-led, global association of
about 200 leading international companies dealing exclusively with business and sustainable
development (World Business Council for Sustainable Development, 2008).
While slight differences exist, these definitions largely suggest that businesses must consider the
repercussion of their decision and operation on the society. CS no longer only relates to the
economic and environment dimension but also the societal dimension. The subsequent inclusion
of societal dimension thus, sees the convergence between the concept of CS and Corporate Social
Responsibility (e.g. Dyllick & Hockerts, 2002; Lehtonen, 2004; Mel, 2003; van Marrewijk, 2003;
van Marrewijk & Werre, 2003). This brings about the next question on what exactly is
sustainable logistics.
2.2 SUSTAINABLE LOGISTICS
The term sustainable logistics is often used interchangeably with logistics social responsibility
and green logistics. Essentially, the concepts are largely similar and may be viewed as consisting
of purchasing, transportation, packaging, warehousing and reverse logistics aspects (Ciliberti,
Pontrandolfo, & Scozzi, 2008) (shown in Figure 1).
Figure 1 - The five Aspects of Sustainable Logistic
Purchasing social responsibility can be defined as the inclusion in purchasing decisions, the
sustainability issues advocated by organizational stakeholders (Maignan, Hillebrand, & McAlister,
2002). The underlying principle is that if a company adopts social and/or environmental standards,
the purchasing function can be used to transfer them to suppliers, thereby generating a chain
effect (Ciliberti, et al., 2008; Morton, Green, & New, 1996; Preuss, 2000). LSP may adopt
various strategies and practices as suggested by Maignan et al (2002) and Carter and Jennings
(2000, 2004).
ATTENTION: The Singapore Copyright Act applies to the use of this document. Nanyang Technological University Library
5 | P a g e
Sustainable transportation, on the other hand, is defined as transportation that meets mobility
needs while preserving and enhancing human and ecosystem, health, economic progress, and
social justice now and for the future (Deakin, 2001). The main environmental impacts are
associated with emissions of greenhouse gases and other harmful pollutants. Solutions aimed at
achieving sustainable transportation include development of clean vehicle technologies, de-
speeding the supply chain, optimized network and provision of door-to-door delivery (Dekker,
Bloemhof, & Mallidis, 2012; World Economic Forum, 2009).
Sustainable packaging has four main criterions (James, Fitzpatrick, Lewis, & Sonneveld, 2005).
Firstly, it should add real value to society by effectively containing and protecting products as
they move throughout the supply chain and by supporting informed and responsible consumption.
Secondly, it should be designed to use materials and energy as efficiently as possible throughout
the product life cycle. Thirdly, it should be made up of materials that are cycled continuously
through natural or technical systems, so minimizing material degradation and/or the use of
upgrading additives. Lastly, it should be made up of components that are safe and non-polluting.
Sustainable warehousing includes activities such as selecting optimum terminal and warehouse
location, proper storage and disposal of dangerous materials, pursuing energy-saving initiative,
and efforts to create safe working environment for workers (C.R Carter & Jennings, 2000; 2002).
Finally, reverse logistics includes all issues related to source reduction, recycling, substitution,
reuse, and disposal of materials (Stock, 1992). Since waste volume grows in parallel to GDP,
there is huge potential in addressing the issue of sustainability through increases in the take-up of
recycling and reverse logistics activities (World Economic Forum, 2009).
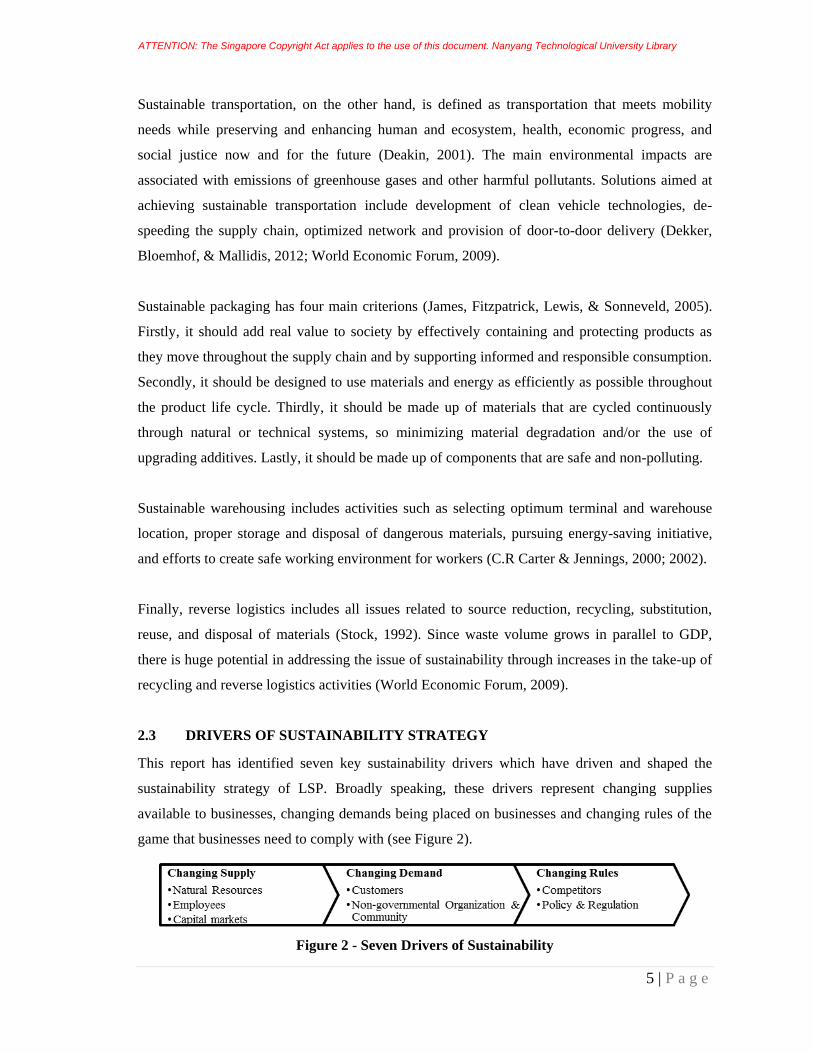
2.3 DRIVERS OF SUSTAINABILITY STRATEGY
This report has identified seven key sustainability drivers which have driven and shaped the
sustainability strategy of LSP. Broadly speaking, these drivers represent changing supplies
available to businesses, changing demands being placed on businesses and changing rules of the
game that businesses need to comply with (see Figure 2).
Figure 2 - Seven Drivers of Sustainability
ATTENTION: The Singapore Copyright Act applies to the use of this document. Nanyang Technological University Library

6 | P a g e
2.3.1 Natural Resources
Sustainability is both influencing and bringing about changes to the critical supplies that LSP
relies on to create value. In particular, they are experiencing rising operating costs due to
depletion of and heightened competition for Earth’s natural resources.
As awareness of climate change increases, more regulations are being developed that will alter
the price of carbon at all levels of the local and global economies. China for example, looks likely
to commit to a number of ambitious targets, such as its 40 to 45 percent carbon intensity
reduction pledge for 2020 (over 2005 levels) and its 15 percent primary energy supply target from
nuclear and renewable energy resources (PricewaterhouseCoopers, 2010). These new rules will
affect fossil-fuel-based energy and resource pricing and availability, creating a ripple effect
throughout a LSP’s entire value chain.
The price of attending to sustainability is unfortunately, not cheap. The UN Framework
Convention on Climate Change estimates that private sector will need to invest more than
US$600 billion every year through 2030 to stabilize carbon dioxide emissions alone (Lacy,
Arnott, & Lowitt, 2009). Nonetheless, there are potentially huge benefits for doing so as well.
Many companies have been able to improve their bottom line or gain competitive advantages
while attending to sustainability. Maersk’s Waste Heat Recovery (WHR) system and slow-
steaming for instance, has not only helped reduce fuel consumption and emission but also
improves the company’s profit (Maersk, 2011; Maersk Line, 2010).
2.3.2 Employees
In the face of global competition for talent, one way for LSP to retain and attract talent is to take
sustainability seriously. This is because employees today are more concerned about the
companies’ efforts to attend to sustainability (Ray & Anderson, 2000).
TNT Express, the global leader in the category for Industrial Goods & Services in Dow Jones
Sustainability index, for example found that its connection with World Food Programme has
helped to attract applicants for their job offers (The Economist, 2008). In addition, they have also
been voted as top employer in France, Germany, Portugal and Italy (TNT, 2012). This was not
surprising given that a 2008 study by Aspen Institute’s Center for Business Education indicated
that 25 percent of the graduates of Master of Business Administration are seeking jobs with the
potential to make a contribution to society, up from 15 percent in 2007 (Bronk, 2008).
ATTENTION: The Singapore Copyright Act applies to the use of this document. Nanyang Technological University Library

7 | P a g e
2.3.3 Capital Market
LSPs are also discovering that the capital markets are focusing on their sustainability initiatives
when making stock recommendation and financing decisions. In response, investment houses
such as JPMorgan, Citigroup, Morgan Stanley and Credit Suisse, have proactively developed
lending guidelines that takes into account sustainability (Equator Principles, 2011).
Sustainability performance is also increasingly being used by investors as an indicator of business
performance and a reflection of the quality of management. The Dow Jones Sustainability Index
for example, assesses how a company recognizes the risks and opportunities arising from
sustainability issues in its business strategy (The Dow Jones Sustainability Indexes, 2010). The
Carbon Reporting Project and CERES’s Investor Network on Climate Risk, on the other hand,
represents the commitment of institutional investors to urge companies to annually publish data
about their carbon emission and address sustainability respectively (Carbon Disclosure Project,
2009; CERES, 2010).
2.3.4 Customer
LSPs are also experiencing changes in the demands on the value they provide and the methods
they employ to do so. Consumers today are more informed and aware of how sustainability issues
can affect their lives. As indicated in a recent worldwide survey, 85 percent of consumers were
either ‘extremely’ or ‘somewhat’ concerned by climate change and 81 percent thought it would
directly impact their lives (World Economic Forum, 2009).
Accordingly, this resulted in changes in their buying behavior. This was revealed in the 2007
BBMG Conscious Consumer Report where 87 percent of consumers would like companies to
commit to environmentally friendly practices to support fair labour and trade practices
(Bemporad & Baranowski, 2007). Research by the Carbon Trust also found that 64 percent of
consumers in United Kingdom are more likely to buy a low-carbon product, and similar trends
are seen across much of the European Union (World Economic Forum, 2009). Consequently,
retailer, distributors and manufactures are too, demanding their LSP to do likewise
(PricewaterhouseCoopers, 2009; Waters, 2010).
While addressing this changing consumer expectation and behavior may be challenging, it also
holds the promise of a material impact on companies’ growth and bottom line. While there are no
clear signs that customers will reward LSP for superior performance in sustainability (e.g. in the
ATTENTION: The Singapore Copyright Act applies to the use of this document. Nanyang Technological University Library
8 | P a g e
form of price premium), they are starting to separate “the sheep from the goats”. A strong value
position on sustainability can thus, serve as a key differentiator and ultimately help secure
stronger customer relationships.
2.3.5 Non-governmental Organization (NGO) and Community
Businesses must also answer to an expanding group of stakeholders, including NGOs and the
community. All of them have fresh and different demands as well as increasing power to threaten
a LSP’s commercial viability.
The development of Information and Communication Technology (ICT) has resulted in NGOs
being more successful than ever at rallying public support to hold large corporation accountable
for their impact on society and the environment. In the case of Nike, it faced an extensive
consumer boycott after the New York Times and other media outlet reported abusive labour
practices at some of its Indonesian suppliers in the early 1990 (Porter & Kramer, 2006). More
recently, Apple was also being slammed for the poor working conditions at its China supplier’s
factory (Kan, 2011).
Well aware of the power of NGOs, many LSPs are finding it worthwhile to establish good
relationship or even to collaborate with them. TNT for example, is collaborating with the World
Food Programme to fight hunger while DHL, UPS and Agility are working closely with United
Nation in distributing humanitarian aids (The Economist, 2008; World Food Program, 2007).
2.3.6 Policy and Regulations
With transport and logistics sector’s energy use projected to grow by an annual rate of 1.9 percent
and accounting for 13 percent of greenhouse gas emission worldwide and roughly double that
(and growing) in some regions, it does not come as a surprise that there are likely to be more
policy and regulations (PricewaterhouseCoopers, 2010; Trilling, 2002).
New regulations and policy on sustainability create winners and losers. While it can disrupt or
even destroy existing business models and industry structures, it can also create new market
opportunities and help differentiate “the sheep from the goats”. Damco, the logistic arm of the AP
Moller-Maersk Group, for example, was able to capitalize on the growing demand of customer
with regards to carbon reporting. It introduced several innovative products such as SupplyChain
ATTENTION: The Singapore Copyright Act applies to the use of this document. Nanyang Technological University Library
9 | P a g e
CarbonDashboard and SupplyChain CarbonCheck™ in response and succeeded in attracting
several global companies (Damco, 2009, 2010).
LSPs are also starting to realize the advantage of self- regulation in helping companies preempt
government mandates and many have established their own environmental or social guidelines.
Apart from preempting government mandates, this helps drive innovation through more indirect
incentive-based approaches. At the same time, laggards will be compelled to rise up to the
standards set by the collective.
2.3.7 Competitor
A final driver for sustainability strategy is commercial competitiveness or simply what the
competitors do. Competitors can alter the rule of game because when competitors are performing
well in their sustainability effort, they raise the bar for other players.
With customers starting to place more emphasis on a company’s sustainability performance, it is
clear that the space for differentiation is becoming increasingly competitive and a myriad of
environmental and social initiatives are quickly becoming a standard part of LSP (Maersk Tanker,
2011). LSP must thus, be on toes or risk being abandoned by their customers, employees and
stakeholders who in return sought the services of their better-performing competitors.
2.4 THEORETICAL DEVELOPMENT
After understanding sustainable logistics and the various sustainability drivers, it becomes clear
that for LSP to succeed in their sustainability strategy, they must address the different needs and
priorities of various stakeholder groups. This may be done by seeking their participations during
the formulation of sustainability strategy.
Previous literature has claimed many benefits that stakeholders’ participation has on the
performance of sustainability-related decision (Martin & Sherington, 1997; M. Reed, 2007; M.
Reed & Dougill, 2010). For example, Dougill et al. (2006) argued that by taking local interests
and concerns into account at an early stage, it may be possible to improve the project design and
increase the likelihood that local needs and priorities are successfully met. In addition, Brody
(2003), Beierle (2002) and Sultana & Abeyasekera (2008) have empirically evaluated or based on
case studies, arrived at similar conclusion where the presence of specific stakeholders greatly
increases the quality of local plan.
ATTENTION: The Singapore Copyright Act applies to the use of this document. Nanyang Technological University Library

10 | P a g e
Nonetheless, attempts to investigate the validity of the claim have been limited (M. S. Reed, 2008;
Wagner, 2011) and none was related to the logistics industry. Operating in a different business
environment, the effect that stakeholders’ participation has on the outcome of sustainability-
related decision for LSP may be different as well. Existing evidence however, suggests that
participation from different stakeholder groups do correlate, ceteris paribus, with the outcome of
sustainability strategy.
An important variable likely to mediate the effect of stakeholders’ participation on performance
of sustainability strategy is the level to which sustainability strategy are integrated with the
business strategy of the firm (Burritt & Saka, 2006; Wagner, 2011).
The structure-conduct-performance (SCP) paradigm is relevant when considering mediation by
integration in models linking firm’s external and internal dimension (Kotler, Berger, & Bickhoff,
2010; Scherer, 1980). The literature stressed that integration is achieved through a process based
on tacit capabilities which are difficult to imitate (e.g. business strategy development and quality
management activities) in turn making the level of integration correlate to proactivity (Aragón-
Correa & Sharma, 2003; Hart, 1995). This suggests integration as a mediator between the
stakeholder participation and sustainability performance. The theoretical model postulated is
shown in Figure 3.
Figure 3 - Theoretical Model
2.4.1 Link between Stakeholders’ participation & Integration
As concerning stakeholders’ participation, existing literature has suggested various stakeholder
typologies. Henriques and Sadorsky (1999) developed four stakeholder categories, namely
regulatory, organizational, community and mass media, out of 12 individual stakeholders. On the
other hand, Buysse and Verbeke (2003) grouped 14 individual stakeholders into four stakeholder
categories, namely regulatory, external primary, internal primary and secondary stakeholders.
Murillo-Luna, Garcés-Ayerbe, and Rivera-Torres (2008), instead, identified five stakeholder
categories out of again 14 individual stakeholders and they are corporate government, internal
economic, external economic, regulatory and external social stakeholders. Superimposing the
above three categorization schemes, Wagner (2011) came out with four stakeholders categories,
ATTENTION: The Singapore Copyright Act applies to the use of this document. Nanyang Technological University Library

11 | P a g e
namely internal, regulatory, value chain and public stakeholders. This paper will adopt the four
stakeholders categories identified by Wagner (2011).
A firm’s action is typically driven by stakeholders. Stakeholders’ participation in sustainability-
related decision-making process may thus affect the level to which sustainability issues are
integrated with the business strategy. Since internal and value chain stakeholders are concerned
about the firm’s profitability and survivability, their participation in decision-making process
should lead to higher degree of integration between LSP’s business strategy and sustainability
strategy. Unlike internal and value chain stakeholders, regulatory and public stakeholders are
more concerned about whether the firm’s operation harms the environment and/or society.
Nonetheless, their participation in decision-making process is also likely to lead to higher degree
of integration between LSP’s business strategy and sustainability strategy.
Thus, the following hypotheses are proposed:
H1 – LSP’s internal stakeholder’s participation positively correlates with the level of integration
between LSP’s business strategy and sustainability strategy
H2 – LSP’s value chain stakeholder’s participation positively correlates with the level of
integration between the LSP’s business strategy and sustainability strategy
H3 – LSP’s regulatory stakeholder’s participation positively correlates with the level of
integration between LSP’s business strategy and sustainability strategy
H4 - LSP’s public stakeholder's participation positively correlates with the level of integration
between LSP’s business strategy and sustainability strategy
2.4.2 Link between Integration and Performance
While there is no empirical research available concerning the link between integration and
performance in the case of LSP, literature suggests that a positive correlation exist.
Boston (2010), for example, pointed out that sustainability of and by itself is not completely
sustainable unless it is developed within a business context. Similarly, Kaplan and Norton (2001)
noted that different strategies coming from different function of an organization can become a
barrier to strategy implementation. Burke and Logsdon (1996) and Carroll and Hoy (1984) also
stressed the importance for sustainability policies to be related to a company’s business strategy.
ATTENTION: The Singapore Copyright Act applies to the use of this document. Nanyang Technological University Library

12 | P a g e
The only empirical study done, as far as the author is concerned, is by Wagner (2011) who
surveyed companies from varying industries to understand the link between integration and
environment performance. This study is by far, the most relevant to the topic and provided
cursory indication of a possible positive link between a LSP’s level of integration between
business strategy and sustainability strategy, and its sustainability performance.
The following hypothesis is thus proposed:
H5 - Level of integration between LSP’s business strategy and sustainability strategy positively
correlates with the performance of their sustainability strategy
A good measure of sustainability performance is the extent to which benefits are being enjoyed
by the firm as a result of sustainability strategy. Some of these benefits include advantage in
employees recruitment and retention, cost savings, corporate image and relationship, new market
opportunities and improved customer loyalty (Bemporad & Baranowski, 2007; Berthon, Abood,
& Lacy, 2010; Berthon, et al., 2008; Bronk, 2008; Maersk, 2011; Maersk Line, 2010). Since these
benefits may be enjoyed at different time span, it would also be meaningful to differentiate the
extent of benefits enjoyed at both short (≤ 1 year) and long (>1 year) term (Davis, 1973; Steiner,
1980).
A summary of the hypotheses and the link between each construct is shown in Figure 4.
Figure 4 - Hypothesized Relationships
ATTENTION: The Singapore Copyright Act applies to the use of this document. Nanyang Technological University Library

13 | P a g e
CHAPTER 3: METHODOLOGY
3.1 SURVEY DESIGN
In order to design and validate an appropriate survey instrument, a desk research on literature and
relevant sources, such as market reports and company databases, was undertaken. A thorough
desk research was helpful in identifying options and measures for the respective constructs. Based
on the desk research, an initial survey instrument was created.
The initial survey instrument was reviewed by two industry experts for content validity, clarity
and understandability. One of industry experts is the Global Head of Sustainability of a world’s
leading logistic service provider while the other is an experienced professional who has served as
Senior Vice-President in one of the leading shipping lines. Feedbacks obtained through the
reviews were taken into consideration and modifications were made accordingly. A summary of
the source of the measures for each of the constructs may be found in Table 1.
A continuous scale from 1.0 – 5.0 was adopted in the survey because of its suitability for the
statistical method chosen. The scale of 1.0 represent “least extent” while 5.0 for “very large
extent”. Likert-type scales were not used because data collected would not be normally
distributed and full information maximum likelihood estimation may not be able recover the
parameters of models estimated on such data (D. Kaplan, 2000). In addition, the categorization
may also unduly affect standard errors and test statistics (D. Kaplan, 2000). The survey
instrument is shown in Appendix A.
3.2 SAMPLE
After finalizing the main survey instrument, a population set comprising of about 440 member
companies were obtained from the Singapore Logistics Association online directory (Accessed on
14 September 2011). Disregarding duplicated contacts, a total of 394 companies were selected.
200 shipping companies listed in World Shipping Directory (Accessed on 12 October 2011) were
also included. The sample companies were largely international companies and only one
representative were chosen from each companies. The chosen respondents were mainly manager
directly in-charge of sustainability, Corporate Social Responsibility or Health, Safety, Security
and Environment (HSSE). If such person could not be identified, other senior managers such as
the Chief Executive Officer and Managing Directors were chosen.
ATTENTION: The Singapore Copyright Act applies to the use of this document. Nanyang Technological University Library

14 | P a g e
Table 1 - Construct, item, measure and related literature
Construct/ Item Source
S1 Board of directors Berthon, Abood & Lacy (2010)
S2 Employees Berton, Lowitt & Hoffman (2008); Berthon, Abood & Lacy (2010)
S3 Suppliers Berthon, Abood & Lacy (2010)); Wagner (2011)
S4 Competitor Wagner (2011)
S5 Customers Berton, Lowitt & Hoffman (2008); Berthon, Abood & Lacy (2010); Wagner (2011)
S6 Financial institution Berton, Lowitt & Hoffman (2008)
S7 Insurance companies Wagner (2011)
S8 Governments Berthon, Abood & Lacy (2010); Wagner (2011)
S9 Regulators Berthon, Abood & Lacy (2010)
S10 Communities Berthon, Abood & Lacy (2010)
S11 NGOS Berthon, Abood & Lacy (2010)
S12 Media Berton, Lowitt & Hoffman (2010); Wagner (2011)
I1 Berton, Lowitt & Hoffman (2010)
I2 Berton, Lowitt & Hoffman (2010)
I3 Berton, Lowitt & Hoffman (2010)
I4 Pagell, 2004
I5 Pagell, 2004
I6
P1 Berton, Lowitt & Hoffman (2008); Bronk (2008); Berthon, Abood & Lacy (2010)
P2 Maersk (n.d)
P3 Improved corporate image and relationship with stakeholders Berton, Lowitt & Hoffman (2008, 2010)
P4 Carbon Trust Survey (2006); Bemporad & Baranowski (2007)
P5 Maersk Line (2010)
T1 Davis (1973); Steiner (1980)
T2 Davis (1973); Steiner (1980)
Short Term
Long Term
Measures
Cost savings
Better employees recruitment and retention
Stakeholder Groups
Time
Improved customer loyalty
New market opportunities (e.g. Attract new customer & ability to enter new market)
Internal Stakeholders
Value Chain Stakeholders
Regulatory stakeholders
Public
These issues are fully embedded into the strategy and operation of my company.
My company’s board discusses and acts on these issues as part of its agenda.
My company incorporates these issues into discussions with financial analysts
Internal management communicates frequenly about sustainability goals and priorities.
Formal meetings are routinely scheduled among various department to discuss about these issues.
These issues were taken into account during employee performance appraisal.
Performance
Integration
ATTENTION: The Singapore Copyright Act applies to the use of this document. Nanyang Technological University Library

15 | P a g e
Due to the perceptual nature of the study, there is, inevitably, possibility of biasness from
respondents. In order to reduce the likelihood and extent of biasness, anonymity of response was
emphasized. Respondents were also informed that their response will be combined with others
and will never be linked to them or their company. To further increase the confidence and provide
assurance to the respondents, direct contact number and email address of the author were made
available to them.
An online survey was adopted for data collection because of its convenience for the respondents
and due to cost consideration. The survey was created via online survey site. An invitation email
was sent out to the representative of the company on 19 September 2011. 3 reminder emails were
sent out subsequently between October and December 2011, at an interval on 1 month. A sample
of the invitation and reminder email is available in Appendix B and C respectively.
The low response rate triggered the need to expand the sample size. Accordingly, 90 working
professionals from the Master of Science (Maritime Studies), Nanyang Technological University,
were surveyed using printed questionnaires similar to the online version on 16 October 2011.
Only 30 of these surveys were taken into consideration after eliminating those which were of
unrelated sectors and removing duplicated response from same company by selecting the one
holding position most relevant to sustainability or by seniority of position.
Table 2 - Profile of survey respondents
No. of firms %
Annual Turnover <S$250k 1 1.0
S$250K- S$500K 4 4.2
S$501K- 1 Million 5 5.2
1+ Million – 5 Million 17 17.7
5+ Million – 20 Million 16 16.7
20+ Million – 50 Million 6 6.3
50+ Million – 100 Million 10 10.4
>100 Million 37 38.5
No. of Employees <10 4 4.2
10 to 25 10 10.4
26- 50 14 14.6
51-100 7 7.3
101-250 10 10.4
>250 51 53.1
Sector
Container 8 8.3
Tanker 12 12.5
Bulk 11 11.5
Logistics 45 46.9
Not Specified 20 20.8
ATTENTION: The Singapore Copyright Act applies to the use of this document. Nanyang Technological University Library

16 | P a g e
66 companies out of the 594 responded to the online survey representing a response rate of 11.1%.
With the 30 surveys collected from the working professionals in the Master program, a total of 96
responses were collected. The profile of the survey respondents is shown in Table 2.
ATTENTION: The Singapore Copyright Act applies to the use of this document. Nanyang Technological University Library

17 | P a g e
CHAPTER 4: FINDINGS & DISCUSSION
Analyses by Structural Equation Modeling were carried out with SPSS AMOS. Full information
maximum likelihood estimation of the parameter was carried out using survey data as input. The
measurement model is presented in Figure 5 and the analysis summary may be found in
Appendix D (short term benefits) and E (long term benefits).
* Not e1 – e6 represents random error/ noise
Figure 5 - Overall structural equation model
4.1 MODEL FIT
Evaluation of the model was done through chi-square test, Root Mean Square Error of
Approximation (RMSEA), Goodness-of-fit index (GFI) and Normed Fit Index (NFI). The chi-
square test is an absolute test of model fit: if the probability value (P) is below 0.05, the model is
rejected (James Arbuckle & Wothke, 2001). In this case, the probability value is much higher at
0.218 and 0.121 respectively. The other measures of fit such as RMSEA, GRI and NFI are
descriptive. Steiger & Lind (1980) recommended RMSEA to be less than 0.1 and in this model,
the RMSEA is 0.068 and 0.093. Therefore, there is adequate fit. This is also supported by the GFI
value of 0.981 and 0.976 and NFI of 0.945 and 0.935. Hence, it is concluded that the model fits
the data reasonably well.
With regards to reliability of the constructs, the Cronbach's α is used. Nunnally (1978)
recommended that a minimum value of 0.70 is acceptable for existing scales and a value of 0.60
is appropriate for newly developed scales. For this model, the Cronbach's α for integration, short
term benefits and long term benefits are much higher at 0.837, 0.707 and 0.828 respectively.
Therefore, the scales are good measures of the respective constructs.
ATTENTION: The Singapore Copyright Act applies to the use of this document. Nanyang Technological University Library

18 | P a g e
4.2 STRUCTURAL MODEL & HYPOTHESIS TESTING
The results from evaluation of the structural model are presented in Figure 6, Figure 7 and Table
3. Firstly, from both the structural model in Figure 6 and 7, it can be seen that the standardized
path coefficient from internal stakeholders to integration is significant (0.370; p < 0.001). Thus,
internal stakeholders’ participation does positively correlates with level of integration, lending
support to H1. As pointed out by one of the survey reviewers, this may be because when there is
high level of participation from internal stakeholders, they are likely to take ownership of the
sustainability program and be willing to go the extra-mile to ensure its success. Another
possibility is that strong participation from internal stakeholder may be a reflection of an
intrinsically motivated company, where employees and board members have interest in
sustainability effort. Regardless the case, high level of participation from internal stakeholders is
likely to lead to better integration between business strategy and sustainability strategy.
The standardized path coefficient from value chain stakeholders to integration is also statistically
significant, but less strong with p = 0.003 and a path coefficient of 0.289. This lends support to
H2 where value chain stakeholders’ participation positively correlates with level of integration.
This correlation may be explained by Operant Conditioning. Value chain stakeholders have the
ability to provide “reinforcers” and “punishments” to LSP. They may withdraw partnership in
cases of non-compliant or provide more business opportunities in exchange for compliant with
their sustainability requirements. As such, high participation from value chain stakeholders will
result in LSP placing more emphasis on their sustainability strategy and ensure better integration
with business strategy.
The standardized path from regulatory stakeholders to integration is, however, not found to be
significant (p = 0.846). Thus, no support for H3 was found. In fact, there may be a negative
correlation as pointed out by the survey reviewers. This is because request from regulatory
stakeholders may be taken to be mandatory and resources may be used to ensure compliance of
such request rather than on other aspect that enhances integration.
Similarly, the standardized path from public stakeholders to integration is also not statistically
significant (p = 0.440), and thus no support for H4 is demonstrated. This may be explained by the
fact that logistics is a business-to-business industry and have little visibility to the public (Eccles,
Ioannou, & Serafeim, 2012). Public stakeholders which include communities, public and media
generally do not directly interfere or participate in how LSP operates, and thus, do not affect the
ATTENTION: The Singapore Copyright Act applies to the use of this document. Nanyang Technological University Library

19 | P a g e
level of integration between business strategy and sustainability strategy. It is, however, possible
that their influence is indirect, working through business-to-consumer businesses, which are
among the value-chain stakeholders of LSP.
With regard to the level of integration and performance, the standardized path coefficients for
both short (≤ 1 year) and long term (> 1 year) are significant. The standardized path coefficient
for short term (≤ 1 year) is 0.524 with P < 0.001. The standardized path coefficient for long term
(> 1 year) is 0.568 with P < 0.001. The results provided fresh and new empirical support to the
comments and views of Boston (2010), Burritt & Saka (2006) and those expressed in the UN
Global Compact – Accenture CEO study (2010). They have previously concluded that integration
between business strategy and sustainability strategy will lead to better sustainability performance,
although there was no empirical evidence and they did not focus on specific industry. Table 3
provides a summary of the integration between business hypotheses.
Figure 6 - Estimates of structural model (Short Term Benefits)
Figure 7 - Estimates of structural model (Long Term Benefits)
ATTENTION: The Singapore Copyright Act applies to the use of this document. Nanyang Technological University Library

20 | P a g e
Table 3 - Summary of hypotheses testing
H1 Internal stakeholder’s participation Level of integration Supported
H2 Value Chain stakeholder’s participation Level of integration Supported
H3 Regulatory stakeholder’s participation Level of integration No support
H4 Public stakeholder’s participation Level of integration No support
H5 Level of integration Sustainability performance Supported
The coefficient of determination, R2, of the model is 0.275 and 0.323 respectively. This is an
acceptable range for this model because a LSP’s level of integration between business strategy
and sustainability strategy, and sustainability performance depends on other factors such as
business environment, political development and technological advancement too. However, since
these factors are largely not within the control of the LSP, they are not being considered in this
model.
Table 4 - Standardized total effects
Internal
Stakeholders
Value Chain
Stakeholders Integration
Integration .370 .289 .000
Performance (Short term) .194 .151 .524
Performance (Long term) .210 .164 .568
The standardized total effects of each variable on the resulting variable are shown in the Table 4.
As can be seen, participation from internal stakeholders has a greater effect on the level of
integration than participation from value chain stakeholders. It is also noted that the effect of
participation from internal and value chain stakeholders on sustainability performance are greater
over the long term analysis than the short term analysis. Similarly, the effect of integration
between business strategy and sustainability strategy on sustainability performance is stronger
over the long term analysis. This seems to suggest that sustainability effort pays off better over
the long run.
4.3 IMPLICATIONS
The findings from this research have important implications for both managers of LSP and public
officials.
By understanding that participation from internal and value chain stakeholder correlates
positively with level of integration between business strategy and sustainability strategy, and that
ATTENTION: The Singapore Copyright Act applies to the use of this document. Nanyang Technological University Library

21 | P a g e
the level of integration positively affects sustainability performance, managers of LSP can adjust
their efforts to achieve more desirable outcome. Apart from generic stakeholder’s analysis where
managers identify the priorities of different stakeholder groups, they may want to do more. This
may be in the form of better communication of sustainability effort, such as having focus group
discussion or the use of Delphi techniques involving internal and value chain stakeholders to
better understand and analyze their needs and opinions.
To encourage internal stakeholder’s participation, top-down commitment is also important as it
helps signal organizational focus on sustainability effort. Reward and promotion systems may
also be used to recognize those people who achieve, or help to achieve, sustainability objectives
(International Institute for Sustainable Development, 1994). On the other hand, value chain
stakeholder’s participation may be enhanced by developing a “collaborative partnership”. This
means that managers of LSP should work closely with their value chain stakeholders to create
win-win situation instead of trying to meet or set stringent requirements which may affects
profitability. By working together to achieve sustainability objectives, managers of LSP can help
value chain stakeholders appreciate the need for such actions and ensure better coordination and
alignment of strategies.
Since the effect of stakeholder’s participation and level of integration between business strategy
and sustainability strategy on sustainability performance are stronger over the long run, managers
must avoid being short-sighted and should recognize that sustainability effort may not pay off
immediately. In fact, sustainability efforts often entail short-term costs and will only pay off in
the long run (Davis, 1973; van Marrewijk, 2003). Therefore, in selecting sustainability project,
managers must consider not just the returns on investment but also the strategic factors (Mansdorf,
2010). Some projects may not have as good return as other competing projects, but they are
considered strategic and critical to the long-term success of the business. In fact, Maersk Line has
admitted that CSR and sustainability decisions can increase ship’s operating cost but investors are
impressed (IHS Fairplay, 2011). Thus, a comprehensive cost-benefit analysis that takes into
accounts both financial and strategic factors over the long run should be used to assess
sustainability investment.
As regards to public officials, they may want to avoid direct interference with sustainability
strategy formulation process. They should, instead, focus on changing social expectations about
what LSP should and should not do. When all stakeholders understand the need for sustainability,
ATTENTION: The Singapore Copyright Act applies to the use of this document. Nanyang Technological University Library
22 | P a g e
they will differentiate ‘the sheep from the goats’. This will provide additional motivation for
LSPs and make their quest for sustainability more rewarding and meaningful.
Similarly, when attempting to promote sustainability in the logistics industry, public officials may
target some programs at its value chain stakeholders. Such program may include tax schemes to
encourage sustainability from LSP’s customer and requirements for responsible lending by banks.
When value chain stakeholders become interested in sustainability effort, they would require LSP
to do likewise and will increase their participation in the formulation process, leading to better
integration between business strategy and sustainability strategy and thus, better sustainability
performance.
ATTENTION: The Singapore Copyright Act applies to the use of this document. Nanyang Technological University Library

23 | P a g e
CHAPTER 5: CONCLUSION & RECOMMENDATION
Focusing upon an industry sector with a highly uncertain environment, this study contributes in
several ways.
Firstly, unlike prior research, this paper provides a more differentiated understanding of the
relationship between stakeholder’s participation and sustainability performance, and how this is
shaped by the level of integration between business strategy and sustainability strategy, in the
case of logistics service providers (LSP). It is perhaps, the first study that empirically evaluates
the relationships between these constructs in the case of LSP.
Secondly, the findings of this study shed light on what managers of LSP can do to achieve better
sustainability performance. They should focus on generating interest, seeking involvement from
internal stakeholders and collaborating with value chain stakeholders. They should also avoid
being short-sighted and recognize that sustainability effort may take time to pay off. In selection
of sustainability project, both strategic factors and financial returns should be considered.
Thirdly, by understanding the correlations, public official will be able to craft adequate policy
initiatives and regulation. They should avoid direct interference with LSP’s sustainability
formulation process and instead, focus on changing social expectations about what LSP should
and should not do.
Regarding research limitation, even after several attempts, efforts to increase the number of
survey responses were futile. Nevertheless this sample size allows for a degree of confidence in
expanding from the study finding, and thereby has fulfilled the research objective.
In addition, there may also be limitation due to nature of the method adopted. Surveys data are
subjected to limitation such as the perceptual nature of the factors used to assess the various
constructs, the possibility of mono-respondent bias and other common variance present in other
empirical research studies. Similar to most studies, this study surveyed key personnel from
individual companies, who are generally capable of such assessment. While this may be a
potential limitation, it is also an opportunity for future research. In future, a broader respondent
base within the organization may be used to allow researcher to identify and analyze the
difference in opinions between senior management and junior employees.
ATTENTION: The Singapore Copyright Act applies to the use of this document. Nanyang Technological University Library

24 | P a g e
Future research may also be done to explain the mechanism through which participation from
various stakeholders group affects level of integration and hence outcome, which is not the focus
of this paper. Other areas of focus include identification of other potential moderators and
mediators such as company size, company’s origin and location, and exploring the type of
benefits associated with participation from the respective stakeholder group.
ATTENTION: The Singapore Copyright Act applies to the use of this document. Nanyang Technological University Library
25 | P a g e
REFERENCES
Accenture. (2009). Cracking the Carbon Conundrum. from
http://www.accenture.com/SiteCollectionDocuments/PDF/Accenture_tts_crackin
g_the_carbon_conundrum.pdf
Aragón-Correa, J. A., & Sharma, S. (2003). A contingent resource-based view of
proactive corporate environmental strategy. Academy of Management Review,
28(1), 71-88.
Barbier, E. B. (1987). The concept of sustainable economic development. Environmental
conservation, 14(02), 101-110.
Beierle, T. C. (2002). The quality of stakeholder-based decisions. Risk Analysis, 22(4),
739-749.
Bemporad, R., & Baranowski, M. (2007). Conscious Consumers Are Changing the Rules
of Marketing. Are You Ready? Highlights from the BBMG Conscious Consumer
Report, from
http://www.fmi.org/docs/sustainability/BBMG_Conscious_Consumer_White_Pap
er.pdf
Berthon, B., Abood, D. J., & Lacy, P. (2010). Can business do well by doing good? ,
from
http://www.accenture.com/SiteCollectionDocuments/PDF/Accenture_Outlook_C
an_Business_Do_Well_by_Doing_Good_Sustainability.pdf
Berthon, B., Lowitt, E. M., & Hoffman, A. J. (2008). Compatible Aims: Sustainability
and High Performance. from
http://www.accenture.com/SiteCollectionDocuments/PDF/CompatibleAimsSustai
nabilityandHighPerformance14Jan09.pdf
Boston, S. (2010). Governance and Sustainability. In J. Lamm (Ed.), Under Control:
Governance Across the Enterprise (pp. 183-205): CA, Inc. .
Brody, S. D. (2003). Measuring the effects of stakeholder participation on the quality of
local plans based on the principles of collaborative ecosystem management.
Journal of Planning Education and Research, 22(4), 407.
Bronk, K. (2008). The Do-Good Disconnect. Retrieved June 12, 2011, from Bloomberg
BusinessWeek:
http://www.businessweek.com/print/bschools/content/apr2008/bs20080420_7510
22.htm
Burke, L., & Logsdon, J. M. (1996). How Corporate Social Responsibility Pays Off.
Long range planning, 29(4), 495-502.
Burritt, R. L., & Saka, C. (2006). Environmental management accounting applications
and eco-efficiency: case studies from Japan. Journal of Cleaner Production,
14(14), 1262-1275.
Buysse, K., & Verbeke, A. (2003). Proactive environmental strategies: A stakeholder
management perspective. Strategic Management Journal, 24(5), 453-470.
Carbon Disclosure Project. (2009). Retrieved June 12, 2011, from
https://www.cdproject.net/en-US/Pages/HomePage.aspx
Carroll, A. B., & Hoy, F. (1984). Integrating corporate social policy into strategic
management. Journal of Business Strategy, 4(3), 48-57.
ATTENTION: The Singapore Copyright Act applies to the use of this document. Nanyang Technological University Library
26 | P a g e
Carter, C. R., & Jennings, M. M. (2000). Purchasing’s Contribution to the Socially
Responsible Management of the Supply Chain: Center for Advanced Purchasing
Studies.
Carter, C. R., & Jennings, M. M. (2002). Logistics social responsibility: an integrative
framework. Journal of Business Logistics, 23(1), 145-180.
Carter, C. R., & Jennings, M. M. (2004). The role of purchasing in corporate social
responsibility: a structural equation analysis. Journal of Business Logistics, 25(1),
145-186.
CERES. (2010). Retrieved June 12, 2011, from http://www.ceres.org/about-us/what-we-
do
Cesar, H. S. J. (1994). Control and game models of the greenhouse effect : economics
essays on the comedy and tragedy of the commons / Herman S.J. Cesar: Berlin ;
New York : Springer-Verlag, c1994.
Chaabane, A., Ramudhin, A., & Paquet, M. (2012). Design of sustainable supply chains
under the emission trading scheme. International Journal of Production
Economics, 135(1), 37-49.
Ciliberti, F., Pontrandolfo, P., & Scozzi, B. (2008). Logistics social responsibility:
Standard adoption and practices in Italian companies. International Journal of
Production Economics, 113(1), 88-106.
Damco. (2009). Damco expertise enables Nike to reduce its logistics carbon footprint.
Retrieved from
http://www.damco.com/en/Download%20Center/IndustryLiterature/Apparel/Nike
.aspx
Damco. (2010). Green Logistics. Retrieved July 30, 2011, from
http://www.damco.com/Service/GreenLogistics/PackagingOptimisation.aspx
Davis, K. (1973). The case for and against business assumption of social responsibilities.
Academy of Management Journal, 312-322.
Deakin, E. (2001). Sustainable development and sustainable transportation: strategies
for economic prosperity, environmental quality, and equity: Institute of Urban and
Regional Development, UC Berkeley.
Dekker, R., Bloemhof, J., & Mallidis, I. (2012). Operations Research for green logistics –
An overview of aspects, issues, contributions and challenges. European Journal
of Operational Research, 219(3), 671-679.
Dougill, A. J., Fraser, E. D. G., Holden, J., Hubacek, K., Prell, C., Reed, M. S., et al.
(2006). Learning from doing participatory rural research: Lessons from the Peak
District National Park. Journal of Agricultural Economics, 57(2), 259-275.
Dyllick, T., & Hockerts, K. (2002). Beyond the business case for corporate sustainability.
Business strategy and the environment, 11(2), 130-141.
Eccles, R. G., Ioannou, L., & Serafeim, G. (2012). Essay: Is there an optimal degree of
sustainability? Ethical Corporation from http://www.ethicalcorp.com
El korchi, A., & Millet, D. (2011). Designing a sustainable reverse logistics channel: the
18 generic structures framework. Journal of Cleaner Production, 19(6–7), 588-
597.
Elkington, J. (1998). Partnerships from cannibals with forks: The triple bottom line of
21st century business. Environmental Quality Management, 8(1), 37-51.
ATTENTION: The Singapore Copyright Act applies to the use of this document. Nanyang Technological University Library

27 | P a g e
Engardio, P., Capell, K., Carey, J., & Hall, K. (2007). Beyond The Green Corporation.
Retrieved August 19, 2011, from Bloomberg Businessweek:
http://www.businessweek.com/magazine/content/07_05/b4019001.htm
Equator Principles. (2011). Retrieved July 3, 2011, from http://www.equator-
principles.com/
Esty, D. C., & Winston, A. S. (2006). Green to Gold: How Smart Companies Use
Environmental Strategy to Innovate, Create Value, and Build Competitive
Advantage: New Haven: Yale University Press.
EurActiv. (2008). Deal secured on ambitious EU renewables law. Retrieved May 29,
2011: http://www.euractiv.com/en/energy/deal-secured-ambitious-eu-renewables-
law/article-177897
Figueroa, B. (2010). Green accounting and sustainability of the Peruvian metal mining
sector. Resources Policy, 35(3), 156-167.
Frota Neto, J. Q., Bloemhof-Ruwaard, J. M., van Nunen, J. A. E. E., & van Heck, E.
(2008). Designing and evaluating sustainable logistics networks. International
Journal of Production Economics, 111(2), 195-208.
Greenbiz. (2007). More Companies Want Outsource Vendors to Green Operations:
Survey. Retrieved from http://www.greenbiz.com/news/2007/08/19/more-
companies-want-outsource-vendors-green-operations-survey
Hart, S. L. (1995). A natural-resource-based view of the firm. Academy of Management
Review, 20(4), 986-1014.
Hart, S. L. (2005). Capitalism at the crossroads : the unlimited business opportunities in
solving the world's most difficult problems / Stuart L. Hart: Upper Saddle River,
N.J. : Wharton School, c2005.
Hawken, P., Lovins, A., & Lovins, H. (1999). Natural capitalism: Creating the Next
Industrial Revolution. New York: Little, Brown and Company.
Henriques, I., & Sadorsky, P. (1999). The relationship between environmental
commitment and managerial perceptions of stakeholder importance. Academy of
Management Journal, 42(1), 87-99.
Hilson, G., & Murck, B. (2000). Sustainable Development in the Mining Industry:
Clarifying the Corporate Perspective. Resources Policy, 26(4), 227-238.
IHS Fairplay. (2011). Does your company have a CSR policy? :
http://www.fairplay.co.uk/login.aspx?reason=denied_empty&script_name=/secur
e/displayMagArticles.aspx&path_info=/secure/displayMagArticles.aspx&articlen
ame=fptr20111110011tr
International Institute for Sustainable Development. (1994). Business strategy for
sustainable development: Leadership and accountability for the '90s. Business
Strategy & the Environment (John Wiley & Sons, Inc), 3(3), 29.
James Arbuckle, & Wothke, W. (2001). Structural Equation Modeling using AMOS: An
Introduction. from http://em.hyit.edu.cn/jiaowu/uploadfile/201082382638850.pdf
James, K., Fitzpatrick, L., Lewis, H., & Sonneveld, K. (Eds.). (2005). Sustainable
packaging system development. Frankfurt: Peter Lang Scientific Publishing.
Jr, C. O. H., Schmidheiny, S., & Watts, S. P. (2002). Walking the talk: The business case
for sustainable development. San Francisco: CA: Berrett-Koehler Publishers.
ATTENTION: The Singapore Copyright Act applies to the use of this document. Nanyang Technological University Library

28 | P a g e
Kan, M. (2011). Apple slammed for work conditions at China suppliers. Retrieved June 5,
2011: http://www.cw.com.hk/content/apple-slammed-work-conditions-china-
suppliers
Kaplan, D. (2000). Structural Equation Modeling: Foundations and Extensions.
Thousand Oaks, CA: Sage Publications.
Kaplan, R. S., & Norton, D. P. (2001). The strategy-focused organization: How balanced
scorecard companies thrive in the new business environment: Harvard Business
Press.
Kersten, W., & Koch, J. (2010). The effect of quality management on the service quality
and business success of logistics service providers. International Journal of
Quality & Reliability Management 27(2), 185-200.
Kolstad, C., & Krautkraemer, J. (1993). Natural Resource Use and the environment.
Handbook of Natural Resource and Energy Economics, 3, 1219-1265.
Kotler, P., Berger, R., & Bickhoff, N. (2010). The Quintessence of Strategic Management:
What You Really Need to Know to Survive in Business. Heidelberg: Springer.
KPMG International. (2011). Corporate Sustainability: A progress report from
http://www.kpmg.com/Global/en/IssuesAndInsights/ArticlesPublications/Docume
nts/corporate-sustainability-v2.pdf
Kumah, A. (2006). Sustainability and gold mining in the developing world. Journal of
Cleaner Production, 14(3-4), 315-323.
Lacy, P., Arnott, J., & Lowitt, E. (2009). The challenge of integrating sustainability into
talent and organization strategies: investing in the knowledge, skills and attitudes
to achieve high performance. Emerald Group Publishing Limited. Corporate
Governance, 9(4), 484-494.
Lee, D.-H., Dong, M., & Bian, W. (2010). The design of sustainable logistics network
under uncertainty. International Journal of Production Economics, 128(1), 159-
166.
Lehtonen, M. (2004). The Environmental-Social Interface of Sustainable Development:
Capabilities, Social Capital, Institutions. Ecological Economics, 49(2), 199-214.
Maersk. (2011). Innovation. Retrieved June 30, 2011, from
http://www.maersk.com/Innovation/WorkingWithInnovation/Pages/CaseStories.a
spx?SSItemId=3
Maersk Line. (2010). Sustainability Progress Report 2010. from
http://www.maersk.com/Sustainability/Documents/Maersk_Sustainability_Report
_2010.pdf
Maersk Tanker. (2011). Sustainability Plan 2011. from
http://www.brostrom.com/Documents/SAP2011.pdf
Maignan, I., Hillebrand, B., & McAlister, D. (2002). Managing Socially-Responsible
Buying:: How to Integrate Non-economic Criteria into the Purchasing Process.
[Article]. European Management Journal, 20(6), 641.
Mansdorf, Z. (2010). Sustainability and Return on investment (Without the Spin).
Retrieved from http://ehstoday.com/environment/green/sustainability-return-
investment-3429/index1.html
Martin, A., & Sherington, J. (1997). Participatory research methods - Implementation,
effectiveness and institutional context. Agricultural Systems, 55(2), 195-216.
ATTENTION: The Singapore Copyright Act applies to the use of this document. Nanyang Technological University Library

29 | P a g e
Mel, W. (2003). Corporate sustainability: What is it and where does it come from. Ivey
Business Journal 67(6), 1-5.
Morton, B., Green, K., & New, S. (1996). Purchasing and Environmental Management:
Interactions, Policies and Opportunities [Article]. Business Strategy & the
Environment (John Wiley & Sons, Inc), 5(3), 188-197.
Mudd, G. M. (2007). Global trends in gold mining: Towards quantifying environmental
and resource sustainability. Resources Policy, 32(1-2), 42-56.
Munasinghe, M. (1994). Sustainomics: a transdisciplinary framework for sustainable
development. Keynote Paper. In: Proceedings of the 50th Anniversary Sessions of
the Sri Lanka Assoc. for the Adv. of Science (SLAAS). Colombo.
Murillo-Luna, J. L., Garcés-Ayerbe, C., & Rivera-Torres, P. (2008). Why do patterns of
environmental response differ? A stakeholders' pressure approach. Strategic
Management Journal, 29(11), 1225-1240.
Naik, S., Ward, M., Godfrey, G., & Hanifan, G. (2011). Simultaneous Sustainability and
Savings – why companies should invest in sustainable packaging: Accenture.
Nunnally, J. C. (1978). Psychometric Theory. New York: McGraw-Hill.
Pearce, D. W., & Turner, R. K. (1990). Economics of Natural Resources and
Environment. Hemel Hempstead, Hertfordshire, UK: Harvester Wheatsheaf.
Petrie, J. (2007). New Models of Sustainability for the Resources Sector: A Focus on
Minerals and Metals. [Article]. Process Safety & Environmental Protection:
Transactions of the Institution of Chemical Engineers Part B, 85, 88-98.
Pezzey, J. (1992). Sustainable development concepts. Retrieved from http://www-
wds.worldbank.org/servlet/WDSContentServer/WDSP/IB/1999/10/21/000178830
_98101911160728/Rendered/PDF/multi_page.pdf
Porter, M. E., & Kramer, M. R. (2006). The link between competitive advantage and
CSR. Retrieved from http://efbayarea.org/documents/events/ccc2008/Mark-
Kramer-Keynote/Strategy-Society.PDF
Preuss, L. (2000). Should you buy your customer's values? On the transfer of moral
values in industrial purchasing. International Journal of Value-Based
Management, 13(2), 141-158.
PricewaterhouseCoopers. (2009). How will supply chains evolve in an energy-
constrained, low-carbon world? Transportation & Logistics 2030, 1, from
http://www.pwc.com/at/de/publikationen/branchen-und-
wirtschaftsstudien/supply-chains-in-energy-constrained-low-carbon-world.pdf
PricewaterhouseCoopers. (2010). Transport infrastructure – Engine or hand brake for
global supply chains? Transportation & Logistics 2030, 2, from
http://www.pwc.com/at/de/publikationen/branchen-und-
wirtschaftsstudien/transport-infrastructure-engine-or-brake-for-supply-chains.pdf
Ray, P., & Anderson, S. R. (2000). The Cultural Creatives: How 50 Million People Are
Changing the World. New York: Harmony Book.
Reed, M. (2007). Participatory technology development for agroforestry extension: an
innovation-decision approach. African Journal of Agricultural Research, 2(8),
334-341.
Reed, M., & Dougill, A. (2010). Linking degradation assessment to sustainable land
management: A decision support system for Kalahari pastoralists. Journal of Arid
Environments, 74(1), 149-155.
ATTENTION: The Singapore Copyright Act applies to the use of this document. Nanyang Technological University Library
30 | P a g e
Reed, M. S. (2008). Stakeholder participation for environmental management: A
literature review. Biological Conservation, 141(10), 2417-2431.
Revkin, A. C. (2002). Obama speaks on climate at the U.N. . Retrieved May 29, 2011,
from The New York Times:
http://www.nytimes.com/2009/09/23/us/politics/23obama.text.html
Rosenthal, E. (2009). Biggest obstacle to global climate deal may be how to pay for it.
A6. Retrieved from
http://www.nytimes.com/2009/10/15/science/earth/15climate.html
Schaltegger, S., & Burritt, R. (2006). Corporate Sustainability Accounting. A
Catchphrase for Compliant Corporations or a Business Decision Support for
Sustainability Leaders? In S. Schaltegger, M. Bennett & R. Burritt (Eds.),
Sustainability Accounting and Reporting (pp. 37-59). Netherlands: Springer.
Scherer, F. (1980). Industrial Market Structure and Economic Performance. Chicago:
University of Chicago Press.
Selviaridis, K., & Spring, M. (2007). Third party logistics: a literature review and
research agenda. The International Journal of Logistics Management, 18(1), 125-
150.
Spalding-Fecher, R. (2003). Indicators of sustainability for the energy sector: a South
African case study. Energy for Sustainable Development, 7(1), 35-49.
Steiger, J. H., & Lind, J. C. (1980). Statistically Based Tests for the Number of Common
Factors. Paper presented at the Annual Meeting of the Psychometric Society.
Steiner, G. C. (1980). An overview of the changing business environment and its impact
on business. Business Environment/Public Policy: 1979 Conference Papers, 3-18.
Stock, J. R. (1992). Reverse Logistics. Oak Brook: Council of Logistics Management.
Sultana, P., & Abeyasekera, S. (2008). Effectiveness of participatory planning for
community management of fisheries in Bangladesh. Journal of environmental
management, 86(1), 201-213.
The Dow Jones Sustainability Indexes. (2010). Retrieved June 2, 2011, from
http://www.sustainability-index.com/
The Economist. (2007). Third world way. Retrieved from
http://www.economist.com/node/9531002?story_id=9531002
The Economist. (2008). The feelgood factor. Retrieved from
http://www.economist.com/node/10491069
TNT. (2012). Recognition. Retrieved 09 Mar, 2012, from
http://www.tnt.com/corporate/en/site/home/about_us/our_business/recognition.ht
ml?tab=Europe_and_MEA
Trilling, D. R. (2002). Notes on Transportation into the Year 2025. The Potential Impacts
of Climate Change on Transportation., from
http://climate.dot.gov/documents/workshop1002/trilling.pdf
UN Global Compact-Accenture CEO Study. (2010). from
http://www.unglobalcompact.org/docs/news_events/8.1/UNGC_Accenture_CEO
_Study_2010.pdf
van Marrewijk, M. (2003). Concepts and Definitions of CSR and Corporate
Sustainability: Between Agency and Communion. Journal of Business Ethics,
44(2), 95-105.
ATTENTION: The Singapore Copyright Act applies to the use of this document. Nanyang Technological University Library

31 | P a g e
van Marrewijk, M., & Werre, M. (2003). Multiple Levels of Corporate Sustainability.
Journal of Business Ethics, 44(2), 107-119.
Wagner, M. (2011). Corporate Performance Implications of Extended Stakeholder
Management: New Insights on Mediation and Moderation Effects. Ecological
Economics, 70(5), 942-950.
Walley, N., & Whitehead, B. (1994). Its not easy being green. Harvard Business Review,
72(3), 46.
Waters, D. (2010). Global Logistics: New Directions in Supply Chain Management (6
ed.). London: Kogan Page.
World Business Council for Sustainable Development. (2008). Retrieved 25 June, 2010,
from:http://www.wbcsd.org/templates/TemplateWBCSD5/layout.asp?type=p&M
enuId=MTE0OQ
World Economic Forum. (2009). Supply Chain Decarbonization. from
http://members.weforum.org/pdf/ip/SupplyChainDecarbonization.pdf
World Food Program. (2007). TNT & UPS support UN humanitarian hubs in Panama
and Ghana. Retrieved from http://www.wfp.org/news/news-release/tnt-ups-
support-un-humanitarian-hubs-panama-and-ghana
Yu, J., Zhang, Z., & Zhou, Y. (2008). The sustainability of China's major mining cities.
Resources Policy, 33(1), 12-22.
ATTENTION: The Singapore Copyright Act applies to the use of this document. Nanyang Technological University Library
32 | P a g e
APPENDIX A – SURVEY INSTRUMENT
ATTENTION: The Singapore Copyright Act applies to the use of this document. Nanyang Technological University Library

33 | P a g e
ATTENTION: The Singapore Copyright Act applies to the use of this document. Nanyang Technological University Library

34 | P a g e
ATTENTION: The Singapore Copyright Act applies to the use of this document. Nanyang Technological University Library

35 | P a g e
APPENDIX B – SURVEY INVITATION (EMAIL)
Dear Mr. [First Name],
Re: Invitation to participate in Sustainability Strategy Survey
I am from Nanyang Technological University (Singapore) and am currently doing a research
project on Sustainability Strategy in the case of Logistics Service Provider. This project seeks to
understand how participation of various stakeholders affects the outcome of sustainability-related
project. As such, you are invited to participate in this survey. Your input could potentially help
shape the future of the logistics and maritime industry.
Here is the link to the survey:
https://www.surveymonkey.com/s/BP2QMPW
It will only take a few moments of your time and all information collected will purely be used for
academic purpose. Your response will be combined with others, and will never be linked with
you or your company.
Should you have any suggestions or queries, you may contact me at +65 9xxxxxxx (GMT +8) or
Thanks for your participation!
Best Regards,
Lim Jun Ming
Lim Jun Ming | Researcher | School of Civil and Environmental Engineering Nanyang Technological University | N1, 50 Nanyang Avenue, Singapore 639798
Tel: +65 9xxxxxxx GMT+8h | Email: [email protected] | Web: www.ntu.edu.sg
ATTENTION: The Singapore Copyright Act applies to the use of this document. Nanyang Technological University Library

36 | P a g e
APPENDIX C – SURVEY REMINDER (EMAIL)
Dear Mr. [First Name],
Re: Reminder to participate in Sustainability Strategy Survey
I am from Nanyang Technological University (Singapore) and have previously sent out an
invitation email seeking your participation in a survey on Sustainability Strategy. However, due
to your busy schedule, you may have overlooked this. Thus, I am sending this reminder hoping
that you could participate in this short survey. Your input could potentially help shape the future
of the logistics and maritime industry.
Here is the link to the survey:
https://www.surveymonkey.com/s/BP2QMPW
It will only take a few moments of your time and all information collected will purely be used for
academic purpose. Your response will be combined with others, and will never be linked with
you or your company.
Should you have any suggestions or queries, you may contact me at +65 9xxxxxxx (GMT +8) or
Thanks for your participation!
Best Regards,
Lim Jun Ming
Lim Jun Ming | Researcher | School of Civil and Environmental Engineering Nanyang Technological University | N1, 50 Nanyang Avenue, Singapore 639798
Tel: +65 9xxxxxxx GMT+8h | Email: [email protected] | Web: www.ntu.edu.sg
ATTENTION: The Singapore Copyright Act applies to the use of this document. Nanyang Technological University Library

37 | P a g e
APPENDIX D - ANALYSIS SUMMARY (SHORT TERM)
Title
FYP diagram: Friday, February 03, 2012 09:38 PM
Groups
Group number 1 (Group number 1)
Notes for Group (Group number 1)
The model is recursive.
Sample size = 96
Variable Summary (Group number 1)
Your model contains the following variables (Group number 1)
Observed, endogenous variables Value Chain Regulatory Public Internal Integration
Performance
Unobserved, exogenous variables
e2 e3 e4 e1 e5
e6
Variable counts (Group number 1)
Number of variables in your model: 12
Number of observed variables: 6
Number of unobserved variables: 6
Number of exogenous variables: 6
Number of endogenous variables: 6
ATTENTION: The Singapore Copyright Act applies to the use of this document. Nanyang Technological University Library
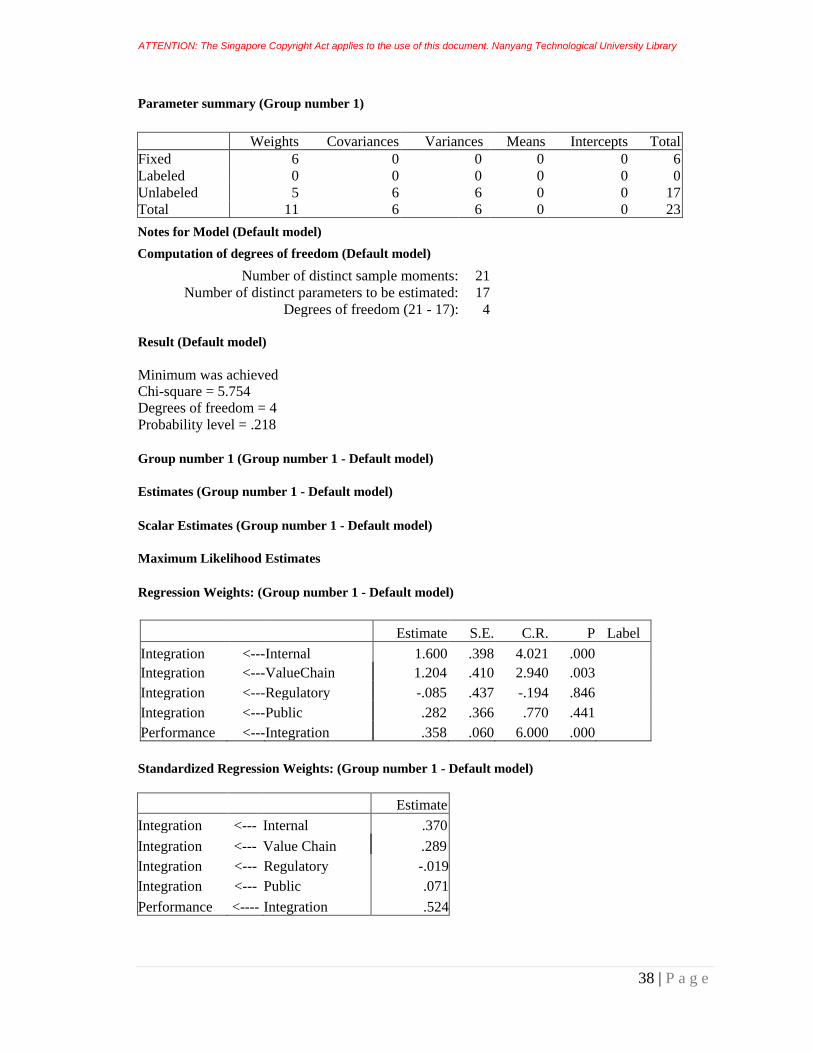
38 | P a g e
Parameter summary (Group number 1)
Weights Covariances Variances Means Intercepts Total
Fixed 6 0 0 0 0 6
Labeled 0 0 0 0 0 0
Unlabeled 5 6 6 0 0 17
Total 11 6 6 0 0 23
Notes for Model (Default model)
Computation of degrees of freedom (Default model)
Number of distinct sample moments: 21
Number of distinct parameters to be estimated: 17
Degrees of freedom (21 - 17): 4
Result (Default model)
Minimum was achieved Chi-square = 5.754 Degrees of freedom = 4 Probability level = .218
Group number 1 (Group number 1 - Default model)
Estimates (Group number 1 - Default model)
Scalar Estimates (Group number 1 - Default model)
Maximum Likelihood Estimates
Regression Weights: (Group number 1 - Default model)
Estimate S.E. C.R. P Label
Integration <--- Internal 1.600 .398 4.021 .000
Integration <--- ValueChain 1.204 .410 2.940 .003
Integration <--- Regulatory -.085 .437 -.194 .846
Integration <--- Public .282 .366 .770 .441
Performance <--- Integration .358 .060 6.000 .000
Standardized Regression Weights: (Group number 1 - Default model)
Estimate
Integration <--- Internal .370
Integration <--- Value Chain .289
Integration <--- Regulatory -.019
Integration <--- Public .071
Performance <---- Integration .524
ATTENTION: The Singapore Copyright Act applies to the use of this document. Nanyang Technological University Library

39 | P a g e
Covariances: (Group number 1 - Default model)
Estimate S.E. C.R. P Label
e4 <--> e1 .124 .145 .855 .393
e2 <--> e4 .366 .155 2.360 .018
e2 <--> e1 .337 .143 2.353 .019
e3 <--> e4 .383 .145 2.637 .008
e3 <--> e1 -.153 .130 -1.178 .239
e2 <--> e3 .466 .142 3.269 .001
Correlations: (Group number 1 - Default model)
Estimate
e4 <--> e1 .088
e2 <--> e4 .250
e2 <--> e1 .249
e3 <--> e4 .281
e3 <--> e1 -.122
e2 <--> e3 .356
Variances: (Group number 1 - Default model)
Estimate S.E. C.R. P Label
e2 1.406 .204 6.892 .000
e3 1.217 .177 6.892 .000
e4 1.527 .222 6.892 .000
e1 1.305 .189 6.892 .000
e5 17.313 2.512 6.892 .000
e6 8.240 1.196 6.892 .000
Squared Multiple Correlations: (Group number 1 - Default model)
Estimate
Internal .000
Public .000
Regulatory .000
Value Chain .000
Integration .291
Performance .275
ATTENTION: The Singapore Copyright Act applies to the use of this document. Nanyang Technological University Library

40 | P a g e
Matrices (Group number 1 - Default model)
Total Effects (Group number 1 - Default model)
Internal Public Regulatory Value Chain Integration
Integration 1.600 .282 -.085 1.204 .000
Performance .572 .101 -.030 .431 .358
Standardized Total Effects (Group number 1 - Default model)
Internal Public Regulatory Value Chain Integration
Integration .370 .071 -.019 .289 .000
Performance .194 .037 -.010 .151 .524
Direct Effects (Group number 1 - Default model)
Internal Public Regulatory Value Chain Integration
Integration 1.600 .282 -.085 1.204 .000
Performance .000 .000 .000 .000 .358
Standardized Direct Effects (Group number 1 - Default model)
Internal Public Regulatory Value Chain Integration
Integration .370 .071 -.019 .289 .000
Performance .000 .000 .000 .000 .524
Indirect Effects (Group number 1 - Default model)
Internal Public Regulatory Value Chain Integration
Integration .000 .000 .000 .000 .000
Performance .572 .101 -.030 .431 .000
Standardized Indirect Effects (Group number 1 - Default model)
Internal Public Regulatory Value Chain Integration
Integration .000 .000 .000 .000 .000
Performance .194 .037 -.010 .151 .000
ATTENTION: The Singapore Copyright Act applies to the use of this document. Nanyang Technological University Library
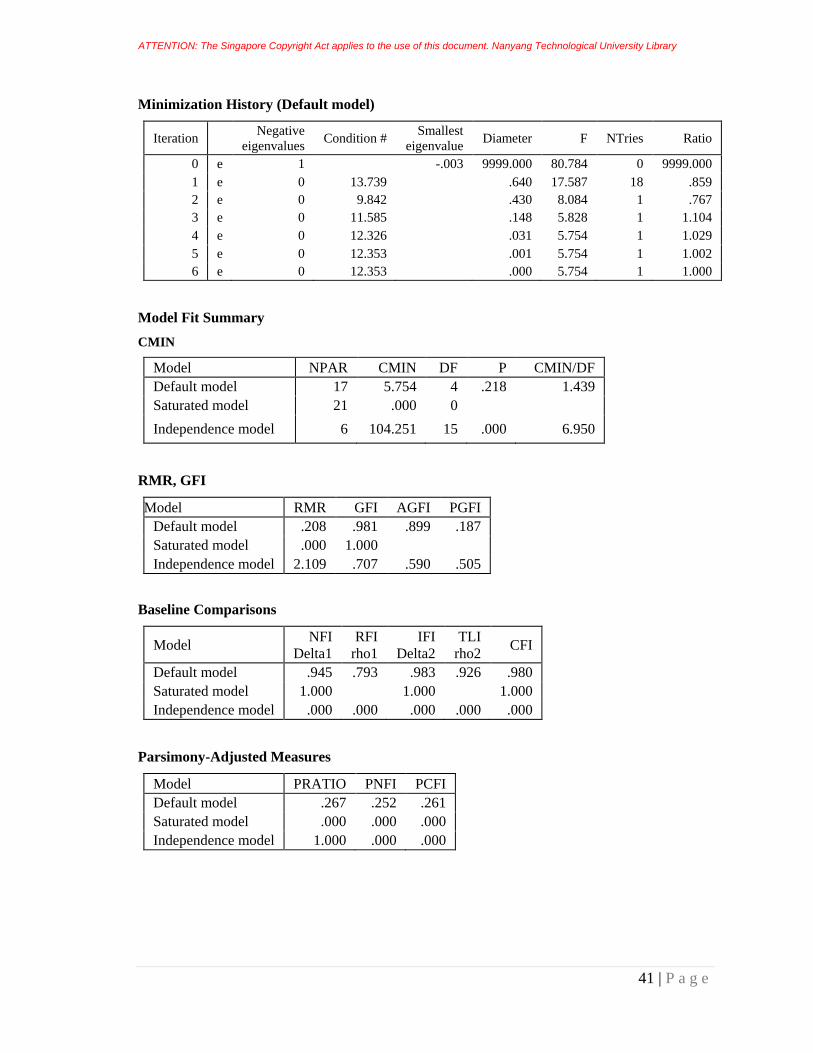
41 | P a g e
Minimization History (Default model)
Iteration
Negative
eigenvalues Condition #
Smallest
eigenvalue Diameter F NTries Ratio
0 e 1
-.003 9999.000 80.784 0 9999.000
1 e 0 13.739
.640 17.587 18 .859
2 e 0 9.842
.430 8.084 1 .767
3 e 0 11.585
.148 5.828 1 1.104
4 e 0 12.326
.031 5.754 1 1.029
5 e 0 12.353
.001 5.754 1 1.002
6 e 0 12.353
.000 5.754 1 1.000
Model Fit Summary
CMIN
Model NPAR CMIN DF P CMIN/DF
Default model 17 5.754 4 .218 1.439
Saturated model 21 .000 0
Independence model 6 104.251 15 .000 6.950
RMR, GFI
Model RMR GFI AGFI PGFI
Default model .208 .981 .899 .187
Saturated model .000 1.000
Independence model 2.109 .707 .590 .505
Baseline Comparisons
Model NFI
Delta1
RFI
rho1
IFI
Delta2
TLI
rho2 CFI
Default model .945 .793 .983 .926 .980
Saturated model 1.000
1.000
1.000
Independence model .000 .000 .000 .000 .000
Parsimony-Adjusted Measures
Model PRATIO PNFI PCFI
Default model .267 .252 .261
Saturated model .000 .000 .000
Independence model 1.000 .000 .000
ATTENTION: The Singapore Copyright Act applies to the use of this document. Nanyang Technological University Library

42 | P a g e
NCP
Model NCP LO 90 HI 90
Default model 1.754 .000 12.382
Saturated model .000 .000 .000
Independence model 89.251 60.558 125.435
FMIN
Model FMIN F0 LO 90 HI 90
Default model .061 .018 .000 .130
Saturated model .000 .000 .000 .000
Independence model 1.097 .939 .637 1.320
RMSEA
Model RMSEA LO 90 HI 90 PCLOSE
Default model .068 .000 .181 .327
Independence model .250 .206 .297 .000
AIC
Model AIC BCC BIC CAIC
Default model 39.754 42.459 83.348 100.348
Saturated model 42.000 45.341 95.851 116.851
Independence model 116.251 117.205 131.637 137.637
ECVI
Model ECVI LO 90 HI 90 MECVI
Default model .418 .400 .530 .447
Saturated model .442 .442 .442 .477
Independence model 1.224 .922 1.605 1.234
HOELTER
Model HOELTER
.05
HOELTER
.01
Default model 157 220
Independence model 23 28
Execution time summary
Minimization: .010
Miscellaneous: .064
Bootstrap: .000
Total: .074
ATTENTION: The Singapore Copyright Act applies to the use of this document. Nanyang Technological University Library

43 | P a g e
APPENDIX E - ANALYSIS SUMMARY (LONG TERM)
Title
FYP diagram: Saturday, February 04, 2012 01:57 PM
Groups
Group number 1 (Group number 1)
Notes for Group (Group number 1)
The model is recursive.
Sample size = 96
Variable Summary (Group number 1)
Your model contains the following variables (Group number 1)
Observed, endogenous variables Value Chain Regulatory Public Internal Integration
Performance
Unobserved, exogenous variables
e2 e3 e4 e1 e5
e6
Variable counts (Group number 1)
Number of variables in your model: 12
Number of observed variables: 6
Number of unobserved variables: 6
Number of exogenous variables: 6
Number of endogenous variables: 6
ATTENTION: The Singapore Copyright Act applies to the use of this document. Nanyang Technological University Library

44 | P a g e
Parameter summary (Group number 1)
Weights Covariances Variances Means Intercepts Total
Fixed 6 0 0 0 0 6
Labeled 0 0 0 0 0 0
Unlabeled 5 6 6 0 0 17
Total 11 6 6 0 0 23
Notes for Model (Default model)
Computation of degrees of freedom (Default model)
Number of distinct sample moments: 21
Number of distinct parameters to be estimated: 17
Degrees of freedom (21 - 17): 4
Result (Default model)
Minimum was achieved
Chi-square = 7.305
Degrees of freedom = 4
Probability level = .121
Group number 1 (Group number 1 - Default model)
Estimates (Group number 1 - Default model)
Scalar Estimates (Group number 1 - Default model)
Maximum Likelihood Estimates
Regression Weights: (Group number 1 - Default model)
Estimate S.E. C.R. P Label
Integration <--- Internal 1.600 .398 4.021 .000
Integration <--- ValueChain 1.204 .410 2.940 .003
Integration <--- Regulatory -.085 .437 -.194 .846
Integration <--- Public .282 .366 .770 .441
Performance <--- Integration .423 .063 6.728 .000
Standardized Regression Weights: (Group number 1 - Default model)
Estimate
Integration <--- Internal .370
Integration <--- Value Chain .289
Integration <--- Regulatory -.019
Integration <--- Public .071
Performance <---- Integration .568
ATTENTION: The Singapore Copyright Act applies to the use of this document. Nanyang Technological University Library

45 | P a g e
Covariances: (Group number 1 - Default model)
Estimate S.E. C.R. P Label
e4 <--> e1 .124 .145 .855 .393
e2 <--> e4 .366 .155 2.360 .018
e2 <--> e1 .337 .143 2.353 .019
e3 <--> e4 .383 .145 2.637 .008
e3 <--> e1 -.153 .130 -1.178 .239
e2 <--> e3 .466 .142 3.269 .001
Correlations: (Group number 1 - Default model)
Estimate
e4 <--> e1 .088
e2 <--> e4 .250
e2 <--> e1 .249
e3 <--> e4 .281
e3 <--> e1 -.122
e2 <--> e3 .356
Variances: (Group number 1 - Default model)
Estimate S.E. C.R. P Label
e2 1.406 .204 6.892 .000
e3 1.217 .177 6.892 .000
e4 1.527 .222 6.892 .000
e1 1.305 .189 6.892 .000
e5 17.313 2.512 6.892 .000
e6 9.179 1.332 6.892 .000
Squared Multiple Correlations: (Group number 1 - Default model)
Estimate
Internal .000
Public .000
Regulatory .000
Value Chain .000
Integration .291
Performance .323
ATTENTION: The Singapore Copyright Act applies to the use of this document. Nanyang Technological University Library
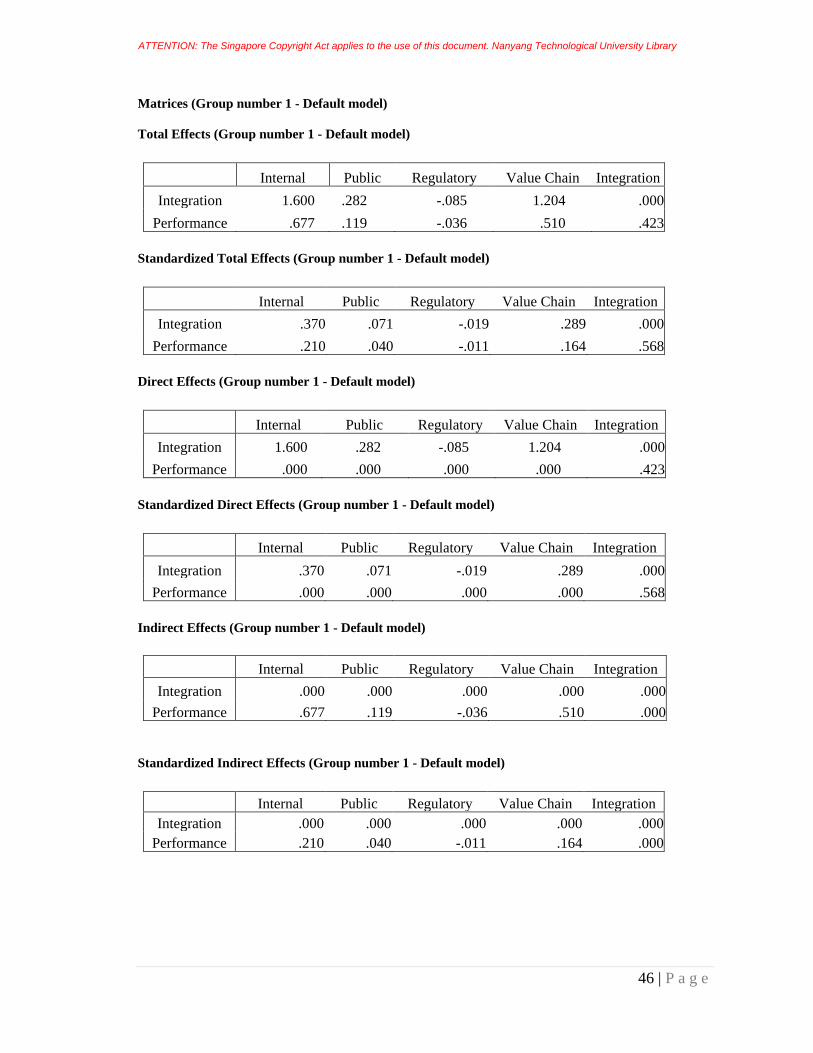
46 | P a g e
Matrices (Group number 1 - Default model)
Total Effects (Group number 1 - Default model)
Internal Public Regulatory Value Chain Integration
Integration 1.600 .282 -.085 1.204 .000
Performance .677 .119 -.036 .510 .423
Standardized Total Effects (Group number 1 - Default model)
Internal Public Regulatory Value Chain Integration
Integration .370 .071 -.019 .289 .000
Performance .210 .040 -.011 .164 .568
Direct Effects (Group number 1 - Default model)
Internal Public Regulatory Value Chain Integration
Integration 1.600 .282 -.085 1.204 .000
Performance .000 .000 .000 .000 .423
Standardized Direct Effects (Group number 1 - Default model)
Internal Public Regulatory Value Chain Integration
Integration .370 .071 -.019 .289 .000
Performance .000 .000 .000 .000 .568
Indirect Effects (Group number 1 - Default model)
Internal Public Regulatory Value Chain Integration
Integration .000 .000 .000 .000 .000
Performance .677 .119 -.036 .510 .000
Standardized Indirect Effects (Group number 1 - Default model)
Internal Public Regulatory Value Chain Integration
Integration .000 .000 .000 .000 .000
Performance .210 .040 -.011 .164 .000
ATTENTION: The Singapore Copyright Act applies to the use of this document. Nanyang Technological University Library
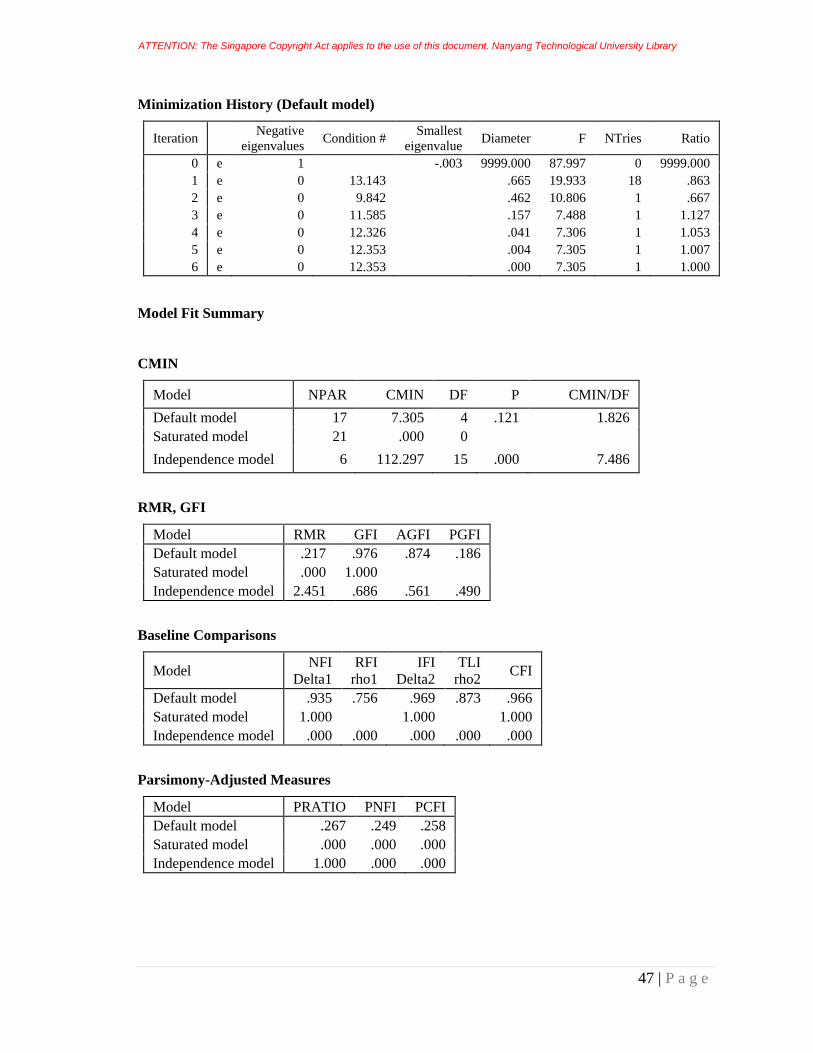
47 | P a g e
Minimization History (Default model)
Iteration
Negative
eigenvalues Condition #
Smallest
eigenvalue Diameter F NTries Ratio
0 e 1
-.003 9999.000 87.997 0 9999.000
1 e 0 13.143
.665 19.933 18 .863
2 e 0 9.842
.462 10.806 1 .667
3 e 0 11.585
.157 7.488 1 1.127
4 e 0 12.326
.041 7.306 1 1.053
5 e 0 12.353
.004 7.305 1 1.007
6 e 0 12.353
.000 7.305 1 1.000
Model Fit Summary
CMIN
Model NPAR CMIN DF P CMIN/DF
Default model 17 7.305 4 .121 1.826
Saturated model 21 .000 0
Independence model 6 112.297 15 .000 7.486
RMR, GFI
Model RMR GFI AGFI PGFI
Default model .217 .976 .874 .186
Saturated model .000 1.000
Independence model 2.451 .686 .561 .490
Baseline Comparisons
Model NFI
Delta1
RFI
rho1
IFI
Delta2
TLI
rho2 CFI
Default model .935 .756 .969 .873 .966
Saturated model 1.000
1.000
1.000
Independence model .000 .000 .000 .000 .000
Parsimony-Adjusted Measures
Model PRATIO PNFI PCFI
Default model .267 .249 .258
Saturated model .000 .000 .000
Independence model 1.000 .000 .000
ATTENTION: The Singapore Copyright Act applies to the use of this document. Nanyang Technological University Library

48 | P a g e
NCP
Model NCP LO 90 HI 90
Default model 3.305 .000 15.043
Saturated model .000 .000 .000
Independence model 97.297 67.285 134.794
FMIN
Model FMIN F0 LO 90 HI 90
Default model .077 .035 .000 .158
Saturated model .000 .000 .000 .000
Independence model 1.182 1.024 .708 1.419
RMSEA
Model RMSEA LO 90 HI 90 PCLOSE
Default model .093 .000 .199 .206
Independence model .261 .217 .308 .000
AIC
Model AIC BCC BIC CAIC
Default model 41.305 44.009 84.899 101.899
Saturated model 42.000 45.341 95.851 116.851
Independence model 124.297 125.251 139.683 145.683
ECVI
Model ECVI LO 90 HI 90 MECVI
Default model .435 .400 .558 .463
Saturated model .442 .442 .442 .477
Independence model 1.308 .992 1.703 1.318
HOELTER
Model HOELTER
.05
HOELTER
.01
Default model 124 173
Independence model 22 26
Execution time summary
Minimization: .010
Miscellaneous: .060
Bootstrap: .000
Total: .070
ATTENTION: The Singapore Copyright Act applies to the use of this document. Nanyang Technological University Library