sustainability snapshot report 2019
TRANSCRIPT
Sustainability Snapshot Report
2019
Foreword from the Mayor
2
The City of Rockingham is lucky enough to support a diverse natural environment, together with a wonderful community and growing population. Acknowledging that our everyday actions can have a significant impact on the world around us, tracking the City’s ongoing journey towards sustainability is paramount to achieve our community aspirations.
The City has long supported climate sensitive behaviour and the Sustainability Snapshot Report is a way for us to capture our collective action across the organisation and consider the best way forward. The first report, produced in 2017, showcased our existing commitment to a sustainable way of life. While this enabled us to recognise the great work already in place across the organisation, it has also been a catalyst to continue to build on these achievements as a united front, working towards the ultimate goal of a safe, equitable and thriving environment for all generations.

Acknowledgement of Traditional Owners
3
The City of Rockingham respectfully acknowledges the traditional owners and custodians of the land on which Rockingham stands today, the Nyoongar people. The City pays its respects to their elders both past and present.
Nyoongar people successfully managed and nurtured the land and water for thousands of generations and an enduring spiritual and physical connection remains today. By showing respect for the land and water in the same way, the City can continue to work towards the sustainability of the environment for future generations.
The City of Rockingham are committed to working with the Nyoongar community on matters of land, water, culture, language and cultural heritage.
The City’s third Reconciliation Action Plan is in development and aims to build a community that demonstrates respect, builds positive relationships and creates opportunities for local Aboriginal and Torres Strait Islander people.
The word ‘Nyoongar’ is identified as a single language but can be pronounced and spelt several ways. This document uses ‘Nyoongar’ to represent the different spellings.

Introduction
4
The City has long supported climate sensitive behaviour and has integrated sustainability initiatives across its operations and in the community. This report allows the City to showcase these initiatives, reflecting on past achievements and to set a direction for the years ahead.
This is the third year of annual reporting, and the City is now beginning to establish a valuable dataset, which will enable the analysis of trends and identification of areas for improvement. While there have been some substantial achievements over the past 12 months, the City also recognises the important work still to be done. The City is committed to ensuring that we can meet the requirements of the current generation, without impacting the ability of future generations to meet their own needs.
All actions reported on through this document, collectively work towards meeting the City’s four key aspirations:
1. Actively pursue tourism and economic development2. Grow and nurture community connectedness
and wellbeing 3. Plan for future generations4. Deliver quality leadership and business expertise
These actions are reported on under the six key focus areas:
Water
Environmental Education and Engagement
Energy and Emissions
Waste and Recycling
Climate Response
Health and Nature Conservation

5

6 Karnup Nature Reserve
7
P E O P L E
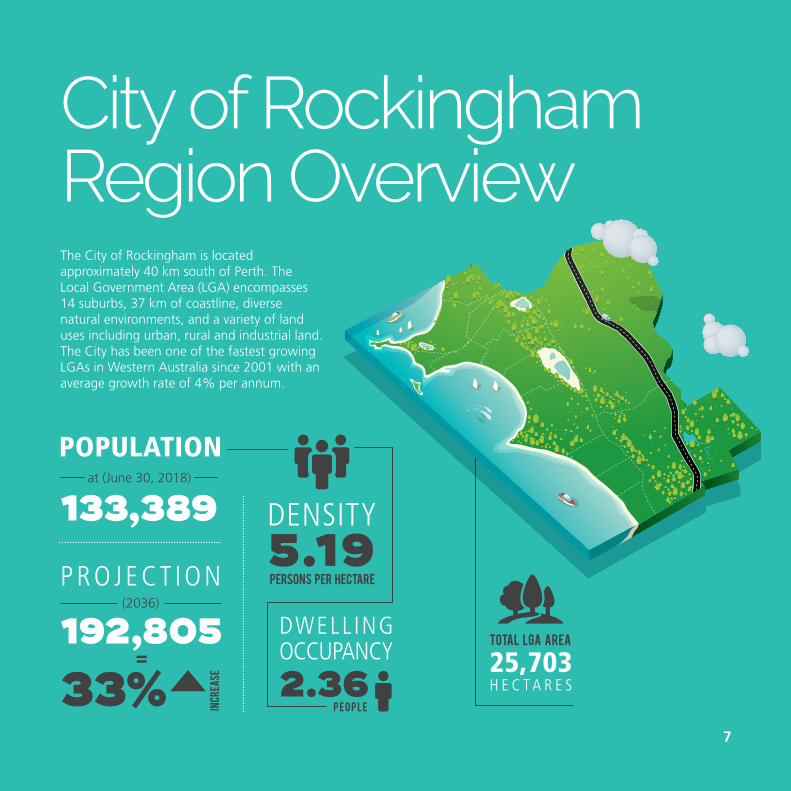
The City of Rockingham is located approximately 40 km south of Perth. The Local Government Area (LGA) encompasses 14 suburbs, 37 km of coastline, diverse natural environments, and a variety of land uses including urban, rural and industrial land. The City has been one of the fastest growing LGAs in Western Australia since 2001 with an average growth rate of 4% per annum.
City of RockinghamRegion Overview
POPULATION
133,389at (June 30, 2018)
192,805
33%
(2036)
=
INCR
EASE
PROJE CT ION 5.19DENSITY
PERSONS PER HECTARE
DWELL INGOCCUPANCY
2.36 H E C T A R E S25,703Total LGA area

Sustainability Milestones
November 2014Strategic Community Plan 2015 – 2025 adopted (Climate Change Defence and Management Strategy and Climate Change Mitigation Strategy identified).
November 2012Climate Change Response Strategy – adopted by Council in November 2012.
September 2003WA State Sustainability Strategy ‘Hope for the Future’ released.
November 2012‘Local Government Energy Efficiency Program’ launched in the City. Sponsored by the Federal Government.
November 2011Became a signatory of the WALGA Local Government Climate Change Declaration. The City’s own Climate Change Declaration was also endorsed by Council.
2010 2011 2012 2013 2014
8

9
September 2019Council endorsed the Coastal Hazard Risk Management and Adaptation Plan, originally earmarked in the Strategic Community Plan as the ‘Climate Change Defence and Management Strategy’.
The City also made a submission on the State Government’s Climate Change in WA Issues Paper.
May 2019Single Use Plastics and Balloons Policy launched, along with a Turn the Tide on Plastic guideline. The City was also recognised as a Gold Waterwise Council, for its outstanding commitment to water efficiency.
May 2018The City became a signatory of the Climate Council’s Cities Power Partnership (formally announced in August 2018).
February 2018First annual Sustainability Snapshot Report released.
December 2015Paris Agreement: Australia committed to reduce emissions by 26-28 per cent below 2005 levels, by 2030.
June 2017A third ‘Greenwaste’ bin rolled out across municipality.
March 2017City endorsed as a Waterwise Council by the Water Corporation and Department of Water and Environmental Regulation.
November 2018Council approved public advertising of the City’s first Sustainability Strategy, originally earmarked in the Strategic Community Plan as the ‘Climate Change Mitigation Strategy’.
January 2019Second annual Sustainability Snapshot Report released.
20192018201720162015

10
1
Aqua Jetty

Water
11
The south of Western Australia experiences a moderate Mediterranean climate with warm, dry summers and mild, wet winters. Over the last 100 years the average temperature has risen about 1 degree, while rainfall along the south western coast has declined 20%*. As a vital and finite resource, the City recognises the need for effective water management.
A Water Efficiency Action Plan (WEAP) was endorsed in 2016 and aims to reduce corporate water consumption, improve water quality and educate the community with methods to reduce water usage at home. The WEAP outlines a 15% corporate potable water reduction by 2030 and a 15% per capita reduction in community water use by 2030. The City is committed to taking innovative measures to ensure these targets are reached, and ensure continued best practice water management, both across its operations and within the community.
Strategic Community Plan Objectives:
1.1 Climate Change Adaptation Acknowledge and understand the impacts of climate change, and identify actions to mitigate and adapt to those impacts.
1. Water
Key City Documents:
▶ Planning Policy 3.4.3 - Urban Water Management
▶ Water Efficiency Action Plan 2016
*https://www.agric.wa.gov.au/climate-change/climate-trends-western-australia

1. Water
Gold Waterwise Council
The City was formally recognised as a Gold Waterwise Council in May 2019. To achieve Gold Waterwise Council status, the City was required to expand on its existing endorsement by developing new actions aimed at meeting the goals listed in the Water Sensitive Cities Goal Index. This was the first time that the City had received Gold Waterwise status and the award served as an acknowledgement of the ongoing hard work and commitment across a number of teams and the community.
Waterwise Plants Giveaway
As a part of our commitment to building water sensitive communities, the City held a Native Plants Giveaway in May 2019, in collaboration with Carramar Coastal Nursery. This was the second consecutive year of the Giveaway and following the success of the pilot year in 2018, the number of plants available was more than tripled. Residents were able to collect 10 free seedlings per household to encourage the establishment of a waterwise garden at home. As a result, it is expected that 1,300 homes across the area have benefitted from the Waterwise Plants Giveaway.
Native plants issued through Native Plants Program
0 2,000 4,000 6,000 8,000 10,000
Achievements
3,000
10,000
2017/2018
2018/2019
Receiving recognition of becoming a Gold Waterwise Council at the 2019 Waterwise Business Recognition Event, hosted by the Water Corporation and the Department of Water and Environmental Regulation.
1.1
12

1. Water
▶ Seven new Public Open Space (POS) areas were constructed using Water Sensitive Urban Design principles (WSUD). WSUD improves the quality of stormwater runoff and also provides habitat for native animals such as frogs and waterbirds.
▶ Water efficiency audits were carried out at the City’s Aquatic Centre, Aqua Jetty and the Depot. These audits identified that between 33%-78% of water usage across these three sites was attributed to water leakage, costing the City approximately $40,000 annually. This presented a significant opportunity to reduce water use through retrofitting upgrades and leakage repair. Repairs have been completed and ongoing retrofitting and monitoring will continue at these sites.
▶ The City promotes water saving tips and the Water Corporation’s Winter Sprinkler Ban on social media and through its newsletter, the City Chronicle, delivered to residents four times a year.
13

14
1. Water
Water audits were carried out at the City’s highest water using facilities, identifying a number of leaks which have now been repaired, alongside other best practice water efficiency measures.
2015/2016
120
110
100
90
80
70
60
502016/2017 2017/2018 2018/2019 2030
GOAL
*This is an 8.08% reduction on 2015/2016 consumption rates. On this current trajectory, the City will exceed its WEAP goal of a 15% reduction (per capita) community water use by 2030.
108.03Kilolitres 104.7
Kilolitres 101.36Kilolitres
99.3*Kilolitres
71.4Kilolitres
112,000
110,000
108,000
106,000
104,000
102,000
100,000
880
860
840
820
800
780
760
740
720
700
680
KL in City operations
2015/2016 2016/2017 2017/2018 2018/2019
105,706Kilolitres
840Litres 830
Litres
830Litres
780Litres107,021
Kilolitres
103,092Kilolitres
110,244Kilolitres
Facts and Figures
Community Water Use (per capita) Scheme Water Use
l/capita
2015/2016 2016/2017 2017/2018 2018/2019
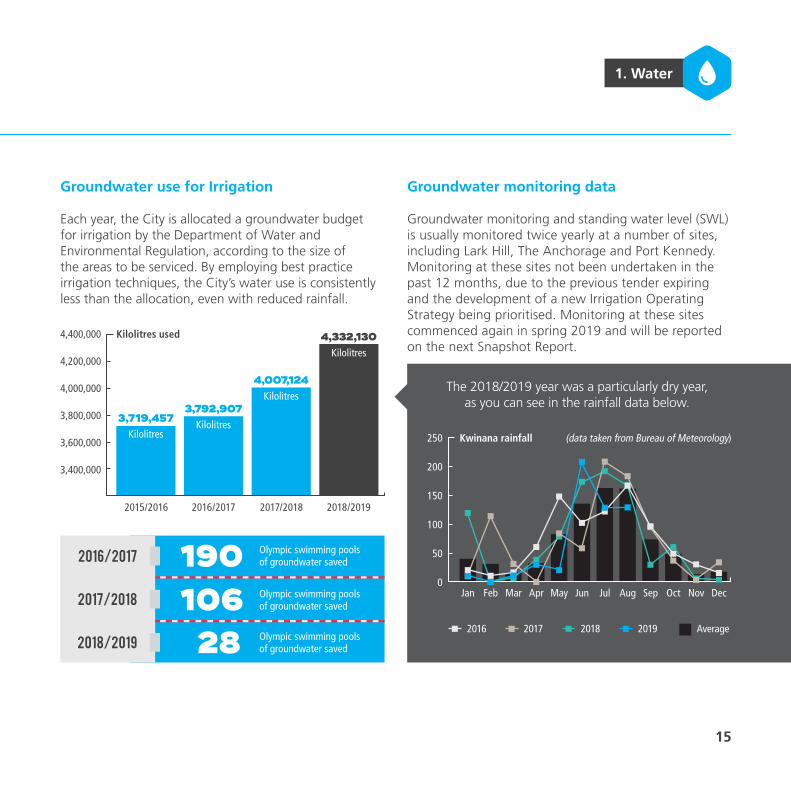
3,719,457Kilolitres
3,792,907Kilolitres
4,007,124Kilolitres
4,332,130Kilolitres
Groundwater use for Irrigation
Each year, the City is allocated a groundwater budget for irrigation by the Department of Water and Environmental Regulation, according to the size of the areas to be serviced. By employing best practice irrigation techniques, the City’s water use is consistently less than the allocation, even with reduced rainfall.
4,400,000
4,200,000
4,000,000
3,800,000
3,600,000
3,400,000
1. Water
Kilolitres used
190106282018/2019
Olympic swimming pools of groundwater saved
Olympic swimming pools of groundwater saved
Olympic swimming pools of groundwater saved
Jan May SepMar Jul NovFeb Jun OctApr Aug Dec
250
200
150
100
50
0
Kwinana rainfall (data taken from Bureau of Meteorology)
Groundwater monitoring data
Groundwater monitoring and standing water level (SWL) is usually monitored twice yearly at a number of sites, including Lark Hill, The Anchorage and Port Kennedy. Monitoring at these sites not been undertaken in the past 12 months, due to the previous tender expiring and the development of a new Irrigation Operating Strategy being prioritised. Monitoring at these sites commenced again in spring 2019 and will be reported on the next Snapshot Report.
The 2018/2019 year was a particularly dry year, as you can see in the rainfall data below.
2016 2017 2018 2019 Average
15
2017/2018
2016/2017
16
1. Water

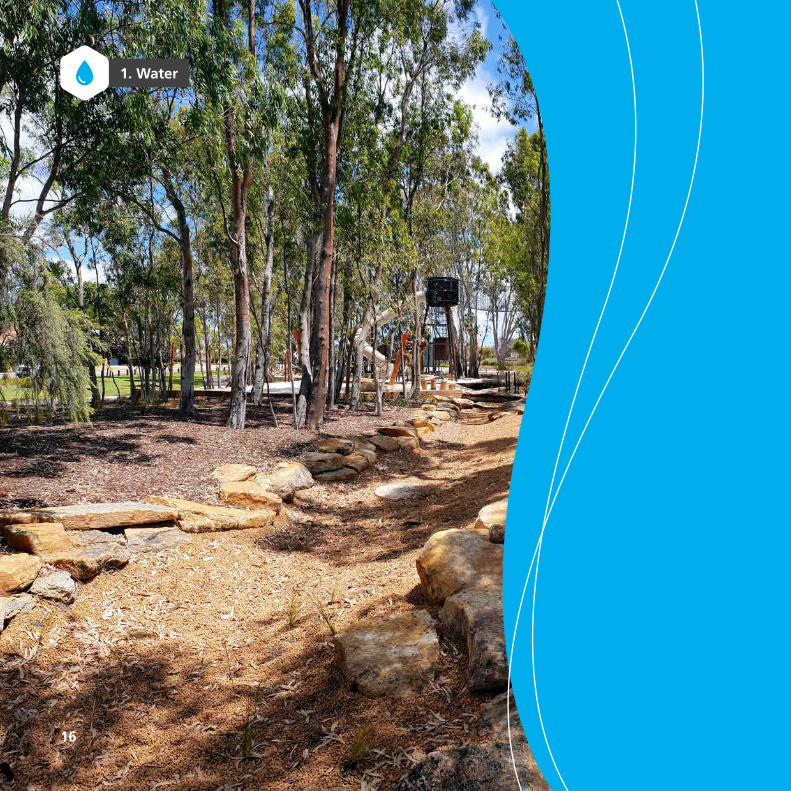
Nature Play and Water Sensitive Urban Design Rivergums Estate, Baldivis (Developer: Cedar Woods)
A public open space on Crinea Drive, located in the Rivergums Estate, included the installation of a ‘living stream’ which meanders through retained vegetation and a nature play which provides amenity to the adjacent school. The living streams retains the natural drainage elements of the site while the integration of the nature play area and the living stream provides an educational component to a feature that would typically go unnoticed.
Case study
Living stream infrastructure (left image)1.2 Nature play elements1.3
1. Water
17

18
“What is MAR?”Managed Aquifer Recharge or MAR, is the intentional injection of water into groundwater aquifers.
MAR can play an important role in integrating the management of surface and groundwater resources for security of water supply while ensuring public health and environmental protection.
Some benefits include:
improved water supply security
replenished aquifers
the creation of a water supply with no
evaporation loss
and the utilisation of water that would have otherwise been wasted
Water storage is essential to improve the sustainability and resilience of water supply, both of which contribute to urban amenity and liveability of cities (CSIRO).
1. Water
Focus Moving Forward
▶ To determine if Managed Aquifer Recharge (MAR) is feasible within the City of Rockingham, a Stage 1 desktop analysis of all possible opportunities was completed in November 2018.
Based on the findings of the Stage 1 report, the City is currently preparing for further investigations to determine the construction requirements and overall feasibility of water injection into the deep Leederville Aquifer at locations identified within the Stage 1 report.

1. Water
▶ Continue to undertake water efficiency upgrades and water monitoring at the main water using sites across the City.
▶ Run the Native Plants Giveaway again in 2020, with arrangements to be reviewed given the success and popularity of this year’s program.
▶ Continue to implement the water saving actions outlined in the Water Efficiency Action Plan.
▶ Continue to meet the reporting requirements for Gold Waterwise Councils and submit the annual report to the Water Corporation.
19
Infographic displaying Managed Aquifer Recharge (source: CSIRO)1.4
Confining Layer
Groundwater Level
Storm / Waste-water to aquifer in wet season Recovery from aquifer in dry season
Wetland / Basin
InjectionWell
Stormwater
Irrigation
Aquifer
Wet Season
Dry Season

20
Waste and RecyclingWaste and recycling services are a key function of Local Government and a crucial element for creating sustainable systems. With good planning, there is opportunity to deliver positive social, environmental and economic outcomes. The City is committed to delivering ongoing best practice waste management and education. Changes in the global demand for recyclables means that the City can play an important role in supporting local market development by ensuring clean, viable waste and recycling streams are collected and managed appropriately. With Western Australia having the highest national rate of waste generation per capita and among the lowest rate of resource recovery at around 48%, the City strives to be a leader in this space and advocate for improved waste reduction and management.
2

21
Strategic Community Plan Objectives:
Key City Documents:
2.7 Services and FacilitiesProvide cost effective services and facilities which meet community needs.
3.4 Sustainable Waste SolutionsIncorporate new opportunities that support responsible and sustainable disposal of waste.
4.3 Leadership in SustainabilityProvide community education on the management of waste, and provide opportunities for community involvement in sustainability programs.
Waste Collection Strategy (in development)
Projects and Updates ▶ The City currently offers three separate waste
collections in addition to hard waste and green waste verge collections. General waste (red-lidded bin) is collected every week while mixed recycling (yellow-lidded bin) and green waste (green lidded bin) are collected every fortnight.
▶ Turn the Tide on Plastic In May 2019, a Policy on Single Use Plastics and Balloons was endorsed by Council, after receiving significant positive feedback during the public consultation period. The Policy provides controls to limit the amount of plastics that can be used within the City and was the most extensive Policy of its kind for a Local Government in WA at the time.
▶ The Policy is supported by an educational guideline ‘Turn the Tide on Plastic’ which aims to assist anyone wishing to minimise their use of disposable plastic. The City has since received industry recognition for these achievements, and will continue to roll out education in this space. The introduction of the Policy has seen many disposable plastics being phased out across City operations and facilities. Total compliance with the Policy will be required by May 2020, following the 12 month transition period.
2. Waste and Recycling
supportive of the Policy in some way. WITH 100%
During the public consultation period,
94 SUBMISSIONS WERE RECEIVED

being collected
That’s the equivalent to the weight of
Last financial year, the equivalent of 10.6 towers was collected, with 7 being landfilled and 3.6 being recycling.
22
Facts and Figures
2. Waste and Recycling
44,495
6
A total of
TONNES25,853
3.5
An additional
TONNESof residential landfill waste was collected and disposed of at the
Millar Road Landfill in 2018/2019.
of those being landfilled
of those being processed for recycling
9.5 Eiffel Towers
of recycling was collected from residents in 2018/2019.

▶ Since 2015/2016, waste to landfill has decreased almost 30%, while waste recovery (recycling collected) has increased 50% in the same time.
▶ The State’s Waste Avoidance and Resource Recovery Strategy 2030 has recently been released and this outlines a target of 70% materials recovery by 2025 and 75% by 2030. If the City aims for the same targets, materials recovery has to almost double, requiring an increase of 5.5% each year.
Total waste collected in 2018/2019
0 2015/2016
80,000
70,000
60,000
50,000
40,000
30,000
20,000
10,000
Tonnes collected
Tonnes collected
10,000 30,00020,000 40,000 50,000 2016/2017 2017/2018 2018/2019
44,495Landfill
14,531Mixed recycling
11,322Green waste
Residential waste collection
23
2. Waste and Recycling
Landfill collectedRecycling collected(including greenwaste)
17,181
63,078
17,200
62,503
26,727
52,197
25,853
44,495
24
Facts and Figures
2. Waste and Recycling
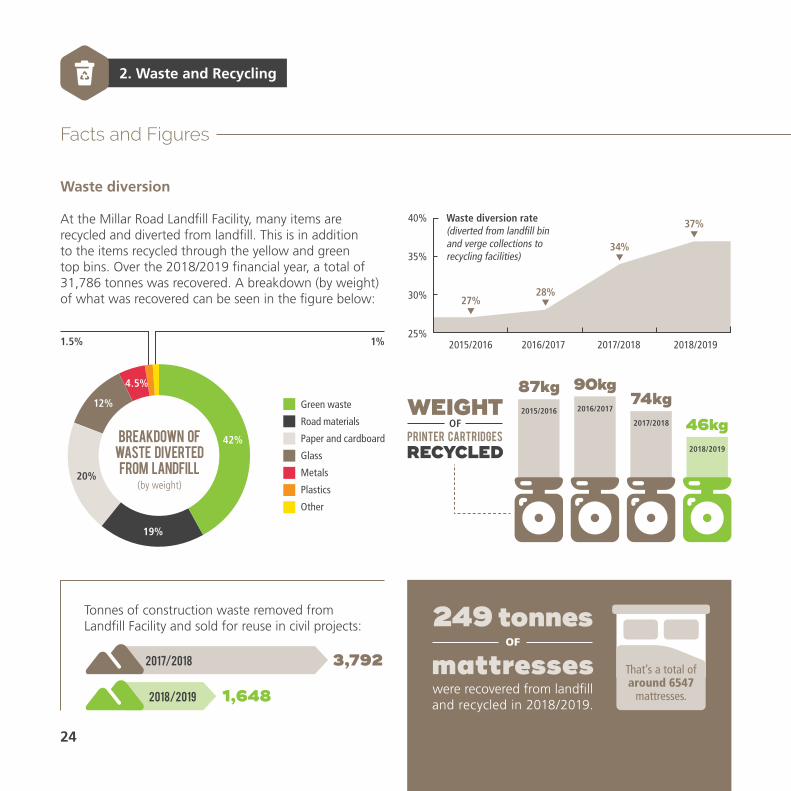
Waste diversion
At the Millar Road Landfill Facility, many items are recycled and diverted from landfill. This is in addition to the items recycled through the yellow and green top bins. Over the 2018/2019 financial year, a total of 31,786 tonnes was recovered. A breakdown (by weight) of what was recovered can be seen in the figure below:
Tonnes of construction waste removed from Landfill Facility and sold for reuse in civil projects:
1.5% 1%
Green waste
Road materials
Paper and cardboard
Glass
Metals
Plastics
Other
Breakdown of waste diverted
from landfill(by weight)
42%
12%
4.5%
19%
20%
2015/2016
40%
35%
30%
25%
Waste diversion rate (diverted from landfill bin and verge collections to recycling facilities)
printer cartridges
2016/2017 2017/2018 2018/2019
27%28%
34%
37%
WEIGHT87kg2015/2016
90kg2016/2017
74kg2017/2018 46kg
2018/2019RECYCLED
OF
249 tonnes
mattressesOF
were recovered from landfill and recycled in 2018/2019.
That’s a total of around 6547
mattresses.
2017/2018
2018/2019
3,792
1,648

25
2. Waste and Recycling
LitterBusters
Since 2015, over 1,600 tonnes of litter have been collected through the LitterBusters service. This financial year, a total of 2,905 reports of litter were responded to, bringing the total reports to over 9,400 over the last four years.
Green waste
The City rolled out a third bin at the end of 2017, referred to as the green lidded bin. This bin allows for the separation and collection of garden organics, effectively diverting this waste stream from landfill. The green waste collected through this service is shredded into compost at the Suez Resource Recovery Park.
That’s over 21,000 tonnes of green waste diverted from landfill since launching in 2017, equivalent to the weight of almost three Eiffel towers.
Green waste collected from verge collections is shredded on site at Millar Road, where it is then released and made available for residents to use.
365TONNES
11,322 tonnes
662TONNES
307TONNES
2015/2016
324TONNES
2017/2018
2018/20192016/2017
of green waste was collected via this service. THIS YEAR,

26
2. Waste and Recycling
Focus Moving Forward
▶ The WA Container Deposit Scheme (CDS) is due for commencement in June 2020. The Scheme aims to increase the rate of recovery and recycling of beverage containers in order to reduce their impact on the natural environment. This is expected to increase resource recovery of eligible containers, ensuring a cleaner waste stream. The Scheme follows the introduction of similar schemes in most other Australian States and Territories (SA, NT, NSW, ACT and QLD). While this is a State-led project, the City has been involved in the consultation process leading up to the Scheme and will play a role in facilitating the roll out.
▶ A new City of Rockingham Waste Strategy is being developed which will supersede the existing Waste Strategy 2015 and the Millar Road Landfill Facility Business Plan 2014. Combining these two plans and strategies will streamline efforts and allow for a more consistent and targeted approach to waste services.
▶ A pilot Cash for Cans program was held at the City’s International Food Festival in March 2019, with support from WALGA to promote the CDS launch in 2020 and initiate some local engagement. There was overwhelming support for the program with over 780 containers collected in two hours. Information was shared with at least 70 individuals who visited the stall during the event.
Cash for Cans at the 2019 International Food Festival2.1

27
2. Waste and Recycling

Energy and EmissionsGlobally, there is an urgent need to reduce energy use, move towards renewable technologies and reduce greenhouse gas emissions in order to minimise the impact of climate change. As a Local Government, the City needs to ensure provision of essential services and facilities to the community, while delivering sustainable outcomes. The City is committed to optimising energy efficiency and reducing emissions across its operations. The City will also maintain its longstanding advocacy position for energy and emissions reduction throughout the community, industry and all levels of government.
28
3
In the 2018/2019 financial year, the City’s total energy use across all facilities totalled:
12,401,593 kWh

29
Strategic Community Plan Objectives:
3.5 Alternative Energy Applications 4.3 Leadership in Sustainability
3. Energy and Emissions
Key City Documents:
Strategic Asset Management Plan (In development)
Sustainability Strategy (In development)
Projects and Updates ▶ Since 2012, strategies to reduce energy consumption have been implemented through an Energy
Efficiency Program, delivered by Asset Services. This has allowed for the installation of Solar Photo Voltaic (Solar PV) systems on all of the City’s major facilities, switching to LED lighting and investigation into future energy projects.
▶ A lighting control system was installed at the Administration Building, eliminating the need for lights to be manually activated. This system uses timers that determine when the lights need to be on and off. Outside these hours the system uses motion sensors to activate the lights as required. This will help to better manage power consumption and reduce the City’s carbon footprint.
▶ Cities Power Partnership In 2018, the City joined a coalition of Local Governments from around Australia who are working together to tackle climate change. Upon joining, the City identified and committed to five key action pledges relating to best practice energy efficiency, renewable energy, sustainable transport and collaboration. The Cities Power Partnership, initiated by the Climate Council, now has over 100 member councils.
Embrace new technology and apply alternative energy solutions to City facilities and services
Provide community education on the management of waste, and provide opportunities for community involvement in sustainability programs.

of power supplied from solar PV
30
3. Energy and Emissions
Facts and Figures
Total energy used (kWh)
Total energy produced from Solar PV systems at City facilities (from the top 10 facilities, with solar panels totaling 600kW)
▶ In 2018/2019 a total of 296kW of solar panels were installed at City facilities. Most of this is attributable to the 290kW added to the Aqua Jetty.
▶ Currently the City has 2,974 solar panels across 91 facilities with a total capacity of 841kW.
▶ It is estimated that in 2018/2019 the systems combined produced 814,000kW/h of electricity, totalling 6.5% of the City’s energy demand. This is equivalent of powering 125 average households for one year.
▶ All light fittings are being transitioned to energy saving LED lights. This financial year, a total of nine sites (317 fittings) were transitioned. This saw a 76% decrease in energy required for lighting at these sites (from 105,530 watts to 25,053 watts).
2017/2018
2017/2018
6.5%
2016/2017
2018/2019
2018/2019
14,110,910
12,401,593
582,618
680,261
12,415 838
kWh power
kWh power
kWh produced
kWh produced
kWh power
105,530watts
25,053 watts
76% decreaseOver 80,000 wattsof energy will be saved each year due to these upgrades.

31
3. Energy and Emissions
Street lighting
Each year, street lighting accounts for around 50% of the City’s total energy use, this highlights the importance of progressively upgrading to LEDs.
Gas usage
Total gas consumption decreased by 16% compared to the same period last year.
Percentage of total energy use
56%47% 56%
6,627,413 kWh2016/2017
6,839,798 kwh2017/2018
6,937,310 kwh2018/2019
The equivalent of 206 gas bottles were saved, compared to last year
2016/2017 2017/2018 2018/2019
382 Gigajoules
570 Gigajoules
479 Gigajoules
600
500
400
300
200
100
0
GJ of gas used
9KGGAS BOTTLES

32
3. Energy and Emissions
Facts and Figures
Emissions attributed to the City’s fleet
The City’s vehicle fleet is carbon neutral.
This means that each year, the City purchases offsets through an accredited carbon neutral program, according to the amount of emissions generated from operating City vehicles.
In addition to combustion of fuel, emissions are created from other sources including electricity use, gas use and decomposing waste at the landfill. It is estimated that emissions from across all City operations total: 108,765 tonnes CO2.
Without comprehensive monitoring systems in place, it is difficult to accurately calculate the range of emissions from different sources. Future works will be focused on investigating a fit for purpose integrated monitoring system.
2016/20172015/2016
92%
5%
3%3%
3%
9%
2%
84%
13%
92%
6%
88%
2017/2018 2018/2019
140,000
120,000
100,000
80,000
60,000
40,000
20,000
0
Breakdown of emissions by source
2016/20172015/2016 2017/2018 2018/2019
3,500
3,400
3,300
3,200
3,100
3,000
Tonnes CO2 emissions
Landfill emissions
Fleet emissions
Electricity and gas
108,765 tonnes CO2
3,439 Tonnes
3,171 Tonnes
3,373 Tonnes
3,372 Tonnes

33
3. Energy and Emissions
Methane capture at the landfill
While methane generated from the landfill comprises the largest source of the City’s emissions, it is important to note that the majority of this gas is able to be captured. The captured gas is then converted into electricity and put back into the grid. Methane is proven to be one of the most harmful greenhouse gases contributing to climate change, so reducing the release of this substance is a viable activity.
In the 2018/2019 financial year, the electricity generated from this source was almost one and a half times the total electricity used in City operations, over the same time period.
The generators have produced approximately 248,815 MWh of electricity since commissioning, which has displaced an additional 186,611 tonnes of CO2, if the equivalent power had been generated in Western Australia by other means.
CO2 equivalent
95,473 tonnesElectricity generated
17,837 MWAverage households powered yearly
3,129
Liner and cover to contain gases
Refuse
Landfill
Landfill Gas
Transformer
To Grid
Gas-extraction andCleaning Equipment
Gas Engine
Electric Generator
Gas Collection
Wells
Depiction of a methane capture facility at a landfill3.2

34
3. Energy and Emissions
Moving Forward
▶ Preparation of an Energy Management Plan
▶ Preparation of an Emissions Reduction Plan
▶ Transition to real time energy monitoring system and integrated reporting platform
▶ Installation of software to integrate solar PV systems
▶ Investigation of energy management system at City facilities
Solar PV system on the Council Administration building3.3

35
3. Energy and Emissions

36
4
Point Peron

Health and Nature Conservation
37
The City of Rockingham is home to a diverse natural environment which includes the deepest freshwater lake on the Swan Coastal Plain, several protected flora and fauna species, and unique environmental assets such as the Lake Richmond Thrombolite community. Alongside this, the City also manages over 870 hectares of public open space, and approximately 940 hectares of nature reserves. The City takes pride in maintaining the health of these environments, so that they can be enjoyed into the future.
Strategic Community Plan Objectives:
Key City Documents:
3.6 Preservation and Management of Bushland and Coastal Reserves Encourage the sustainable management and use of the City’s bushland and coastal reserves.
3.7 Liveable Suburbs Plan for attractive sustainable suburbs that provide housing diversity, quality public open spaces, walkways, amenities and facilities for the community.
▶ Greening Plan
▶ Wetland Management Plan
▶ Lake Richmond Management Plan
▶ Foreshore Management Plan
▶ Natural Area Conservation Strategy
▶ Reserve Prioritisation Report
▶ Bushland Management Plan
▶ Tamworth Hill Swamp Management Plan
4. Health and Nature Conservation

38
4. Health and Nature Conservation
Project Updates
Little Penguin Research Project
The City has contributed funding towards the Little Penguin Research Project since 2012. The research aims to better understand the health, ecology and resilience of the local population of Little Penguins. As a result of the findings from the previous report, educational signage was installed at five key locations around the City, alerting boat users to challenges faced by the Little Penguins.
The City has committed further funding into the research project which will provide an estimate of penguin population in spring 2019. The estimate will provide an important insight into the long term viability of the declining population and whether an increase in its food source could result in an increase in population for the first time since 2010.
Watch out for penguins
Penguins forage in coastal waters from Cockburn Sound to Geographe Bay and
travel just below the surface of the water.
It is estimated that watercraft injuries account for up to 25% of the recent mortality rate.
If you notice any dead or injured penguins in the area,
please notify the City of Rockingham on 9528 0333.
Recent studies have indicated that the population of Little
Penguins in the area has declined by at least 50% since 2007.
Little Penguin in a nesting box with two chicks on Penguin Island4.1
Signage erected at boat ramps to inform the community of research findings
39
4. Health and Nature Conservation
Frogs
Frogs are sensitive to climatic variations and are therefore a leading indicator of ecosystem health and change. To this end, the City has established an ongoing frog monitoring program to assist with detecting potential impacts of climate change on our environment. The latest results from the City’s biennial Frog Population Monitoring Study (2018) indicate that the City’s wetlands are in good condition, with healthy populations of Crinia insignifera (Squelching Froglet) and Litoria adelaidensis (Slender Tree Frog) detected at the majority of survey sites.
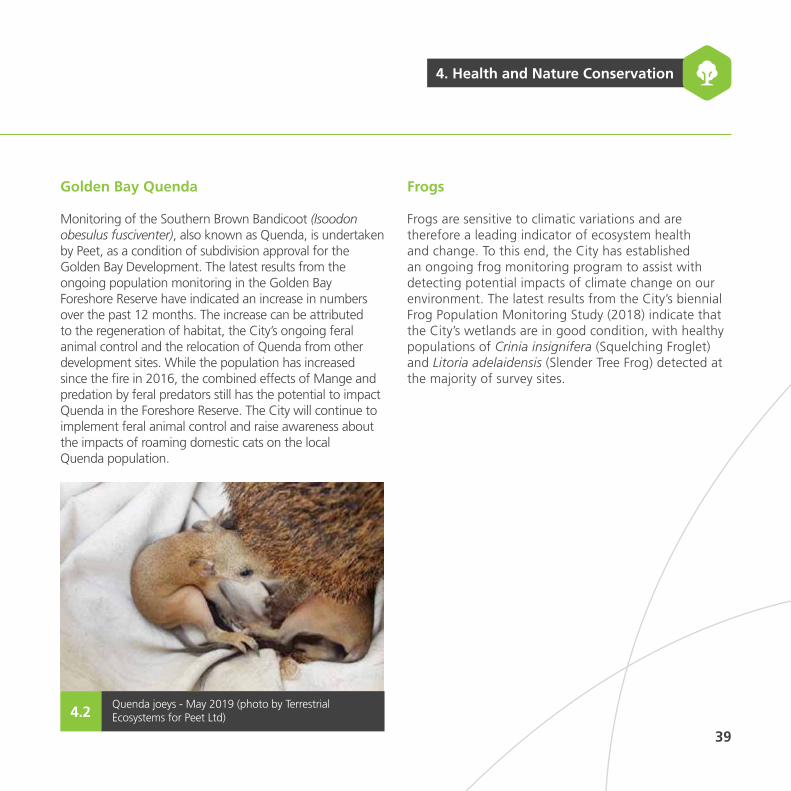
Golden Bay Quenda
Monitoring of the Southern Brown Bandicoot (Isoodon obesulus fusciventer), also known as Quenda, is undertaken by Peet, as a condition of subdivision approval for the Golden Bay Development. The latest results from the ongoing population monitoring in the Golden Bay Foreshore Reserve have indicated an increase in numbers over the past 12 months. The increase can be attributed to the regeneration of habitat, the City’s ongoing feral animal control and the relocation of Quenda from other development sites. While the population has increased since the fire in 2016, the combined effects of Mange and predation by feral predators still has the potential to impact Quenda in the Foreshore Reserve. The City will continue to implement feral animal control and raise awareness about the impacts of roaming domestic cats on the local Quenda population.
Quenda joeys - May 2019 (photo by Terrestrial Ecosystems for Peet Ltd)4.2

What is a Thrombolite?
40
4. Health and Nature Conservation
Project Updates
Lake Richmond
The City’s Community Plan Strategy – Natural Area Conservation (2017) identified the need for review of the previous Lake Richmond Management Plan (2008), acknowledging the local and regional environmental significance of the reserve.
The draft Lake Richmond Management Plan (2019) is informed by an assessment of vegetation, fauna and reserve infrastructure. Additionally, the City appointed microbialite expert, Dr Ryan Vogwill to undertake an assessment of current thrombolite health and activity, an investigation into optimal water conditions for microbialite growth and the suitability of using herbicides to control weed species growing in proximity to thrombolites. The findings of Dr Vogwill’s assessment have been used to inform a robust Weed Management Strategy, as part of the draft Plan.
The research undertaken during the preparation of the Weed Management Strategy is the first of its kind and provides new information on how aquatic microbial communities respond to the application of herbicides. In November 2019, Council approved advertising of the draft Lake Richmond Management Plan for public comment.
Thrombolites at Lake Richmond4.3
Also referred to as ‘living fossils’, Thrombolites comprise a complex association of micro-organisms that aggregate in rock-like formations. They are some of earths, earliest lifeforms. Today, Thrombolites are found in just a few places around the world (Department of Biodiversity, Conservation and Attractions 2017). Lake Richmond Thrombolites are unlike any other known occurrences of Thrombolites, as this ecological community appears to be adapted to fresh water. This is extremely unique and not found anywhere else on earth.

41
4. Health and Nature Conservation
Baldivis District Sporting Complex
A City led project provides example of best practice environmentally responsive development.
The Baldivis District Sporting Complex (BDSC) project aims to meet the current and future community demand for sporting grounds in the locality, with construction to commence in 2019/2020. The BDSC has been designed in an environmentally sensitive manner to maximise retention of native vegetation which is known to provide habitat for the three threatened species of black cockatoos.
The development will retain 56% of vegetation on site, with 73% of potential black cockatoo breeding trees being retained. As part of the development, the City will also be revegetating 3.15ha of the existing degraded Tuart/Jarrah Woodland in the north-western portion of the site, to enhance the quality of habitat for native fauna. Nine artificial black cockatoo nesting boxes will also be installed in the revegetation area, to offset the nine hollows needing to be cleared as part of the development.
The City will also be working with qualified zoologists to undertake a stringent fauna monitoring and relocation program prior to site works commencing, to ensure native fauna are not impacted.
56%
VEGETATION RETAINED
on site
Black cockatoo breeding trees
retained73%
Remnant Tuart/Jarrah Woodland at BDSC site to be conserved and planted with middle and understorey species to improve vegetation cover for native fauna.
4.4

42
4. Health and Nature Conservation
Project Updates
Facts and Figures
Tamworth Hill Swamp Management Plan
The City has prepared a new management plan for Tamworth Hill Swamp, one of the largest and most significant wetland reserves managed by the City. The Plan provides key directions for the protection and enhancement of conservation values within Tamworth Hill Swamp over the next five years.
To inform the Plan, Surveys were undertaken during spring 2018 and identified more than 1,100 terrestrial invertebrates and 8,413 aquatic invertebrates at the site. A number of interesting invertebrate fauna were collected such as the Common western scorpion fly (Harpobittacus similis) and the Common peacock spider (Maratus pavonis). While these species are widespread in southern Western Australia, they are predators of other insects which is reflective of a healthy ecosystem at Tamworth Hill Swamp. Five native bat species and 32 native bird species, including two birds of prey, the Brown Goshawk (Accipiter fasciatus) and the Swamp harrier (Circus approximans) were also recorded in the reserve during the survey. The Plan can be viewed on the City’s website.
of new bike paths installed across 12 locations
2.38 KM $513,000spent on cycling infrastructure
planted through the Winter Street Tree Planting Program, whereby residents request a free street tree to be planted on their verge.
Common Peacock Spider (Maratus pavonis) (Photo source: Michael Duncan)4.5

43
4. Health and Nature Conservation
Urban Greening
The City’s Greening Plan provides a framework to increase our tree canopy in streetscapes and public open space, with over 15,000 trees to be planted over the next five years. Urban greening offers a host of benefits including urban cooling, air quality and stormwater management, while also contributing to the City’s overall liveability and sense of place.
Revegetation planting in previous years included a number of environmental offset sites. With all of the offset planting completed, revegetation works are now targeting 15,000 plants per season, with a focus on maintenance of the existing large sites to ensure successful establishment.
1,200 planted
1,720 planted
3,525 planted
2016/2017 2017/2018 2018/2019
25,7252017/2018
52,6682016/2017
15,8102018/2019
49,2732015/2016
Number of seedlings used in
revegetation of City conservation reserves
Trees being grown in the City’s nursery to be planted in streetscapes and public open space. 4.6

4. Health and Nature Conservation
Focus Moving Forward
▶ Bushland Management Plan Under guidance of the Natural Area Conservation Strategy, the City has prepared a Bushland Management Plan to guide the protection and enhancement of eight bushland reserves. The Plan prioritises management actions over the next five years, informed by detailed flora and fauna assessments in each reserve. Here are some of the unique fauna spotted in the City’s bushland reserves: The Plan can be viewed on the City’s website.
Western Heath Dragon (Ctenophorus adelaidensis)4.73Common Brushtail Possum
(Trichosurus vulpecula hypoleucus)4.71
West coast long tailed ctenotus (Ctenotus australis)4.72
44

4. Health and Nature Conservation
Rainbow Bee-eater(Merops ornatus)
South-western Spiny-tailed Gecko (Strophurus spinigerus spinigerus)4.75 4.77
Moaning Frog (Heleioporus eyrei)4.74 Splendid Fairywren
(Malurus splendens)4.76
45

46
4. Health and Nature Conservation
Focus Moving Forward
▶ Environmental Protection Strategy The City is in the process of developing a Community Plan Strategy for Environmental Protection. The Strategy is being guided by the findings of the Natural Areas Technical Assessment undertaken in 2018 which identified and prioritised areas on private land based on their environmental significance. The Strategy will be advertised for public comment in 2020.
▶ Southwestern snake-necked turtle survey The Southwestern snake-necked turtle (Chelodina colliei) is the only native freshwater species of turtle found in the Perth metropolitan region. A study of 35 Perth wetlands undertaken in 2017 revealed populations of the species are alarmingly low across the metropolitan area. The south-western snake-necked turtle has the potential to occur within the City’s wetland reserves such as Lake Richmond and Tamworth Hill Swamp. An assessment of the population status and viability of the C. colliei within the City’s wetlands will assist with guiding any future management actions required to protect the species. The survey was undertaken in November 2019 in collaboration with Murdoch University.
Southwestern snake necked turtle (Chelodina colliei)4.8

47
4. Health and Nature Conservation
Lake Walyungup

48
5
Key City Documents:
▶ Health and Wellbeing Strategy
▶ Volunteering Strategy
▶ Cultural Development and the Arts Strategy
▶ Library and Information Services Strategy
Rockingham City Community Garden

Environmental Education and Engagement
49
The City strives to provide a range of opportunities for community education, engagement and empowerment. Since last year, the City has expanded the sustainability focused programs on offer for the community, with more planned in the future.
Strategic Community Plan Objectives:
1.4 Attractions and Events Seek to host iconic community events and attractions that will entice residents and visitors throughout the year.
2.4 Community Engagement Facilitate comprehensive community engagement on issues facing the City, ensuring that residents can provide input into shaping our future.
2.5 Community Capacity Building Empower the community across all ages and abilities to be culturally aware and involved with a diverse range of community initiatives that incorporate volunteering, sport, culture and the arts.
4.3 Leadership in Sustainability Provide community education on the management of waste, and provide opportunities for community involvement in sustainability programs.
4.7 Key Stakeholders Partnerships Foster relationships and partnerships with key stakeholders to achieve enhanced community outcomes.
5. Environmental Education and Engagement

5. Environmental Education and Engagement
Achievements
50
▶ Alongside the Policy on Single Use Plastics and Balloons, the City developed a unique educational guideline. ‘Turn the Tide on Plastic’ aids in helping those wishing to reduce their plastic impact. The guide was distributed to all traders affected by the Policy, local schools and is available on the City’s website.
▶ Plastic Free July is a global initiative that encourages people to take actions to minimise their use of plastic. With the recent adoption of the Single Use Plastics and Balloons Policy, the City proudly hosted a number of free community activities in support of Plastic Free July. These included:
Sustainable Saturday, a one day sustainability expo hosted at the Rockingham Central Library including workshops on worm-farming, information on local environmental centres and tips on how to live a sustainable lifestyle.
A Low Waste Kitchen and Pantry workshop, hosted by Wasteless Pantry
‘How I live a plastic free life’ with Lyndsay Miles, a Perth zero-waste blogger and author
Documentary screening of STRAWS, a film about the impact of straws and plastic litter
A DIY Plastic Free Beauty Product Workshop
SEASIDE SCAVENGE Fast facts
of second hand goods donated by
local community
OVER 150
participants
Over 191 KGof litter collected during the event
11 local businesses and organisations engaged
OVER 250 KG

5. Environmental Education and Engagement
51
▶ Seaside Scavenge is an Australia-wide initiative that sees participants go ‘scavenging’ for litter around waterways and parklands. Litter can then be exchanged for a trash token, which can be used as currency in a pop-up market that contains second-hand goods and donated items. The Seaside Scavenge event was held at Bell Park on the Rockingham Foreshore in October 2018, and was the first event to be held in WA. The event was a great success and was held again in 2019.
▶ Your Move Schools Ten local schools are currently signed up to the Your Move program, initiated through the State Government. The program aims to promote active transport to school which increases physical activity, reduces traffic congestion and reduces greenhouse gas emissions. The City coordinates the quarterly Your Move Schools Network Meeting, providing support and networking opportunities to schools. The City plans to increase the engagement level to the program, and is committed to promoting active transport among the local school community.
▶ Five corporate volunteer programs were held with a total of 47 City employees volunteering to assist the following community organisations: Rockingham Community Garden, Naragebup Environmental Centre, Silver Chain Social Respite Centre, Wanslea Early Learning Centre and Marilla Community Centre.
▶ A Change Maker Festival was held in October 2018, offering young people a chance to have their voice heard and make a change in their community. This was a new initiative delivered by the City, which brought together 80 young people aged 12-18. The event focused on a number of environmental issues.
▶ The annual Castaways Sculpture Awards Exhibition was not held in 2018 due to redevelopment works on the Rockingham Beach Foreshore. The exhibition returned again in late 2019. This will be reported on in the next Snapshot Report.
Second hand goods can be purchased using ‘trash tokens’5.2
Litter being sorted and counted after collection5.1

Facts and Figures
5. Environmental Education and Engagement
52
Sustainability related workshops and events held through City libraries
Waste Education Program (hosted through the Landfill)
1,400
1,200
1,000
800
Delivered to students
2016/2017 2017/2018 2018/2019
1,350students 1,040
students
1,215 students
500
400
300
200
Delivered to community members
2016/2017 2017/2018 2018/2019
420 community members
260 community members
488 community members
2016/2017
2017/2018
2018/2019 27
118
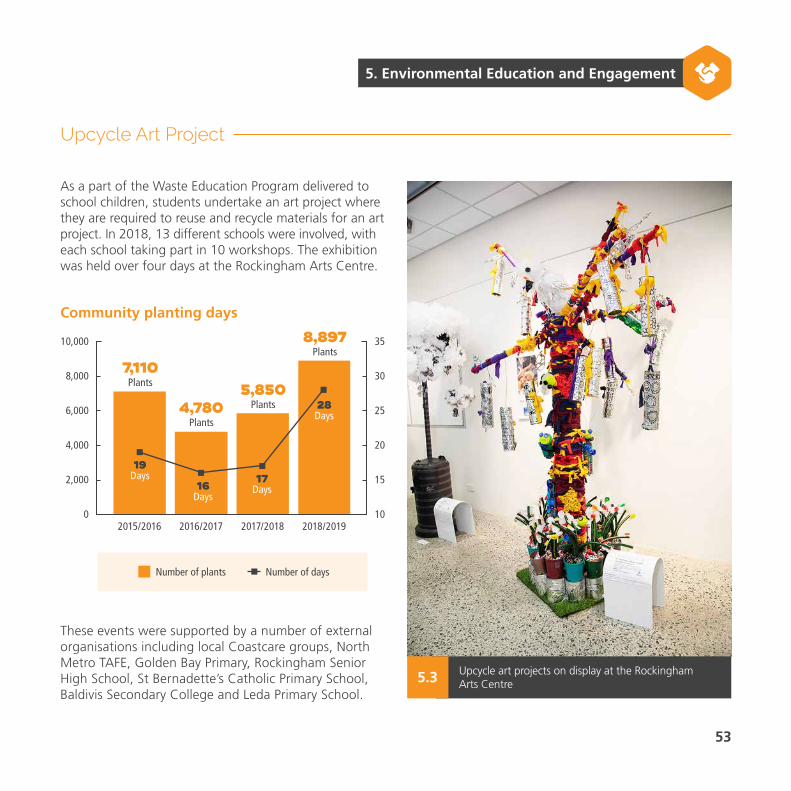
Upcycle Art Project
5. Environmental Education and Engagement
53
Community planting days
As a part of the Waste Education Program delivered to school children, students undertake an art project where they are required to reuse and recycle materials for an art project. In 2018, 13 different schools were involved, with each school taking part in 10 workshops. The exhibition was held over four days at the Rockingham Arts Centre.
These events were supported by a number of external organisations including local Coastcare groups, North Metro TAFE, Golden Bay Primary, Rockingham Senior High School, St Bernadette’s Catholic Primary School, Baldivis Secondary College and Leda Primary School.
10,000
8,000
6,000
4,000
2,000
0
35
30
25
20
15
10
Number of plants
2015/2016 2016/2017 2017/2018 2018/2019
8,897Plants
5,850Plants4,780
Plants
7,110Plants
28Days
17Days16
Days
19Days
Number of days
Upcycle art projects on display at the Rockingham Arts Centre5.3

▶ Due to its success, Sustainable Saturday will be continued next year with the intention of establishing it as an annual event.
▶ The City will continue to work with the community to deliver engaging, environmentally focused events.
▶ The draft Sustainability Strategy outlines a range of actions aiming to build community engagement and education on sustainability and environmental issues. In November 2019, Council approved advertising of the Sustainability Strategy for public comment. Following an 8 week comment period, it is anticipated that the Strategy will be adopted in early 2020.
Walk Safely to School Day - May 2019
Moving Forward
5. Environmental Education and Engagement
54
The City encourages this national event by supporting a number of schools to host a healthy breakfast as part of their events. The event seeks to promote active travel which has a wide range of benefits including reduced traffic congestion, reduced greenhouse gas emissions, improved social wellbeing and a greater sense of community.
PARTICIPATED
Students walked4,500
4,300STUDENTS
to school that day
received ahealthy breakfast
compared to the 2,700 who would normally
walk to school

5. Environmental Education and Engagement
55

56
6
56 Rockingham Kite Festival

Climate Response
57
Australia is one of the most vulnerable developed countries to the impacts of climate change. With increased average temperatures, decreased rainfall and increased frequency and severity of extreme storm events, it is important to build resilience at a local level.
All actions mentioned throughout this report work collectively to mitigate the impacts of climate change.
Strategic Community Plan Objectives
Key City Documents:
3.1 Infrastructure Planning Plan and develop community, sport and recreation facilities which meet the current and future needs of the City’s growing population.
3.3 Climate Change Adaptation Acknowledge and understand the impacts of climate change, and identify actions to mitigate and adapt to those impacts.
▶ Coastal Hazard Risk Management and Adaptation Plan
▶ Sustainability Strategy (In process)
6. Climate Response

58
Projects and Updates
6. Climate Response
Planning for Coastal Hazards
In September 2019, Council endorsed the Coastal Hazard Risk Management and Adaptation Plan (CHRMAP), prepared in accordance with State Planning Policy 2.6 (SPP 2.6).
The CHRMAP is a strategic planning document that informs community and decision makers about potential coastal hazards (such as erosion and inundation), the risks and necessary actions. The CHRMAP will outline key directions for coastal adaptation in response to a potential sea level rise of 0.9m over the next 100 years, while also prioritising management responses over the next 10 years.
The City took an innovative approach to the preparation of its CHRMAP, by building upon State Government guidelines, working with technical specialists, and conducting a robust in-house consultation process with community, staff and Council.
Chris Tallentire MLA, Member for Thornlie on behalf of Planning Minister Rita Saffioti announced the recipients of the 2019 WA Coastal Awards for Excellence at a ceremony at the Western Australian Natural Resource Management and Coastal Conference at the Aquarium of Western Australia on 1 October 2019.
At the 2019 WA Coastal Awards for Excellence, the City received the Local Government Award for commitment and contribution to the planning and management of Western Australia’s coast, in recognition of the City’s CHRMAP.
The City also received the Highly Commended award at the National 2019 Australian Coastal Awards, held in Kiama NSW, in the category of Community Engagement, for the innovative approach taken to coastal hazard risk management and adaptation planning.
City of Rockingham Coordinator Sustainability and Environment Natalie Elliott receives the 2019 Local Government Award at the WA Coastal Awards for Excellence from Chris Tallentire MLA.
6.1

59
6. Climate Response
Sustainability Strategy
The draft Sustainability Strategy was available for public comment from November 2019 to January 2020. The Strategy aims to provide a framework for delivery of key objectives and measures aimed at achieving climate change mitigation. Following the consultation period, feedback will be considered before final adoption. It is anticipated that this will be in February 2020.
Following public consultation and Council endorsement of the Sustainability Strategy in 2019/2020, works will begin to deliver the priorities, objectives and actions.
Peron Naturaliste Partnership
The Peron Naturaliste Partnership (PNP) was formed in 2001 between nine coastal Local Governments from Point Peron and Point Naturaliste. Since then, the groups have worked collaboratively on coastal hazard modelling, and research into adaption pathways and coastal values at a regional scale.
In 2018, a program was launched by the PNP where coastal monitoring surveys are undertaken at a regional scale, to establish a long term dataset which will be used to inform future coastal hazard modelling, management and adaptation.

▶ A design was completed for the Mersey Point Seawall in the first half of 2019. The seawall is planned for construction in early 2020 and will provide protection to the City’s coastal assets. A temporary 30 metre limestone seawall has been installed in the interim, to protect vulnerable assets.
▶ In 2018, a new jetty was built at Mersey Point. The jetty was constructed in a more stable location, 150m away from the previous location.
▶ The City is part of the Cockburn Sound Coastal Alliance, which was formed in 2011. The CSCA provides a valuable forum for information sharing between local governments, to ensure consistency in coastal planning and management abutting the Cockburn Sound.
▶ The City is working towards a long term goal of 20% canopy cover by planting 15,000 new trees every year in public open space and streetscapes, as identified in the Greening Plan 2017. Urban greening underpins the City’s liveability and character, providing a range of social, economic and environmental benefits.
60
Projects and Updates
6. Climate Response
▶ The major influences of bushfires are all compounded by climate change. A hotter and drier climate dries out vegetated fuel loads. This, coupled with decreased rainfall and strong winds all increase the risk of bushfires The City‘s revised Bushfire Risk Management Plan was endorsed by Council in September 2018.

61
6. Climate Response
Facts and Figures
Coastal Management - Point Peron sand trap
Each year, sand is excavated from the Point Peron sand trap where it naturally builds up due to the Garden Island Causeway. This has a dual benefit, as it ensures safe access to the Point Peron Boat Ramp and allows the sand to be distributed to parts of the coast subject to significant erosion.
This year a total of 24,605m3 was excavated during two separate events. Most of this sand was used to replenish the beach at Kwinana Headlands with the rest yet to be assigned for reuse.
14,344m3
Excavated
15,943m3
Excavated
13,000m3
Excavated
2016/2017 2018/2019
2017/2018
Used for Kwinana Beach Headlands renourishment + 10,261m3 collected in June 2019
Excavated inAugust 2019
62
Did You Know?
6. Climate Response
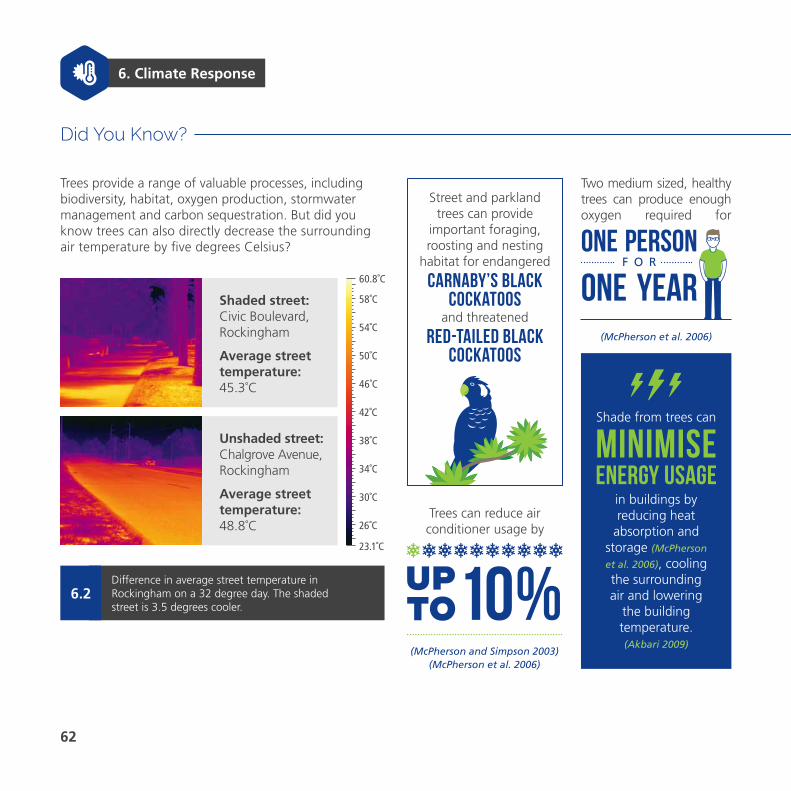
Trees provide a range of valuable processes, including biodiversity, habitat, oxygen production, stormwater management and carbon sequestration. But did you know trees can also directly decrease the surrounding air temperature by five degrees Celsius?
Shaded street:Civic Boulevard, Rockingham
Average street temperature:45.3˚C
Unshaded street:Chalgrove Avenue, Rockingham
Average street temperature:48.8˚C 26˚C
42˚C
34˚C
50˚C
30˚C
46˚C
38˚C
54˚C
58˚C
60.8˚C
23.1˚C
Difference in average street temperature in Rockingham on a 32 degree day. The shaded street is 3.5 degrees cooler.
6.2
Two medium sized, healthy trees can produce enough oxygen required for
one personF O R
one year(McPherson et al. 2006)
Street and parkland trees can provide
important foraging, roosting and nesting
habitat for endangered
Carnaby’s Black Cockatoos
and threatened
Red-tailed Black Cockatoos
Shade from trees can
minimise energy usage
in buildings by reducing heat
absorption and storage (McPherson
et al. 2006), cooling the surrounding air and lowering
the building temperature.(Akbari 2009)
Trees can reduce air conditioner usage by
10%(McPherson and Simpson 2003)
(McPherson et al. 2006)

63
6. Climate Response
Trees reduce stormwater impacts through all parts of the plant.
Leaves and branches intercept rainfall and reduce urban runoff(Xiao and McPherson 2002)
Trees reduce erosion B Y
decreasing the impact of rain on surfaces
(McPherson et al. 2006)
Trees remove air pollution through interception of particulate matter and absorption of gases (McPherson et al. 1994)
Trees reduce atmospheric CO2 by sequestering carbon in stems
and leaves
(Akbari et al. 2001; Nowak and Crane 2002)
Street trees are known to increase property prices. Research undertaken in Perth indicates that:
1 street tree can increase property price by up to
$16,889 (Pandit et al. 2013)

The City wishes to acknowledge the following teams who collectively work to
implement the various environmental sustainability actions detailed in this report:
Acknowledgements
Asset Services
Library Services
Engineering Services
Strategic Planning and Environment
Community Capacity Building
Parks Services
Land and Development Infrastructure
Waste Services

