sustainability roadmap 2018-2019 - green · sustainability roadmap 2018-2019 . progress report and...
TRANSCRIPT

Sustainability Roadmap 2018-2019 Progress Report and Plan for Meeting the Governor's Sustainability Goals for California State Agencies
California Department of Corrections and Rehabilitation
Edmund G. Brown Jr., Governor

ii
Department of Corrections and Rehabilitation Sustainability Roadmap 2018-2019
Primary Authors:
Deanna Beland, Chief
Energy and Sustainability Section
Facilities Asset Management Branch
Tamer Ahmed, Associate Director
Facilities Asset Management Branch
Devin Fong, Deputy Director
Office of Business Services
Director:
Deborah Hysen, Director
Facility Planning, Construction and Management

Department Stakeholders
iii
Des
ign
and
Envi
ronm
enta
l Se
rvic
es a
nd S
tand
ards
Br
anch
Cap
tial P
lann
ing
and
Proj
ect S
ervi
ces B
ranc
h
Budg
et M
anag
emen
t Br
anch
Each
Inst
itutio
n/Fa
cilit
y
STATE OF CALIFORNIADEPARTMENT OF CORRECTIONS AND REHABILITATION
Sustainability Roadmap 2018-2019
Facilities Asset Management BranchProject
Management Branch
Facility Planning, Construction and Management Division Division of Fiscal and Business Services
Fleet ManagementO ffice of Business Services
Division of Adult Institutions
O
S-O
pera
tions
Sup
port
The “responsible party” is the individual or entity that controls, manages, or directs the entity and the disposition of the entity's funds and assets.
Tam
er A
hmed
Ass
ocia
te D
irec
tor
Gre
g St
inso
nC
hief
, A
sses
t and
Pro
pert
y M
anag
emen
t
Todd
Pos
ton
Proj
ect D
irec
tor
lll
Jenn
ifer F
arre
llR
egio
nal M
anag
er
Dea
nna
Bela
ndC
hief
, Ene
rgy
and
Sust
aina
bilit
y Se
ctio
nM
aria
Mar
tinez
Ass
ocia
te C
onst
ruct
ion
Ana
lyst
, Ene
rgy
and
Sust
aina
bilit
y Se
ctio
nM
ark
Ellio
ttA
ssoc
iate
Con
stru
ctio
n A
naly
st, E
nerg
y an
d Su
stai
nabi
lity
Sect
ion
Jam
es V
illap
udua
Seni
or E
stim
ator
of B
uild
ing
Con
stru
ctio
n, E
nerg
y an
d
Mic
hael
Bea
ber
Ass
ocia
te D
irec
tor
Kei
th B
elan
dA
ssoc
iate
Dir
ecto
r
Gre
g W
right
Ass
ocia
te D
irec
tor
Mic
helle
Wea
ver
Ass
ocia
te D
irec
tor
Eric
Sw
anso
nA
ssoc
iate
Dir
ecto
r
Dev
in F
ong
Dep
uty
Dir
ecto
r
Bede
th V
icto
rioso
Serv
ice
Con
trac
ts M
anag
er
Vic
ki C
arpe
nter
Goo
ds P
rocu
rem
ent M
anag
er
Dav
e W
ilson
Goo
ds P
rocu
rem
ent M
anag
er
Dav
id W
ilson
Sect
ion
Chi
ef
Caro
l She
llenb
erge
rSe
ctio
n C
hief
Kev
in P
ark
Uni
t Man
ager
*War
dens
Dea
n Bo
rgD
eput
y D
irec
tor
Lisa
Bar
rera
Staf
f Ser
vice
s Man
ager
l,Tr
ansp
orta
tion
Uni
tCh
arle
s Gib
son
Cor
rect
iona
l Cap
tain
,Tr
ansp
orta
tion
Uni
t
Mik
e Sc
obee
Seni
or In
spec
tor,
Aut
omot
ive
Equi
pmen
t, O
CHAPTER 1: CLIMATE CHANGE & ADAPTATIO NUnderstanding Climate Risk at Existing Facilit ies ● ● ●Understanding Climate Risk at Planned Facilit ies ● ● ● ● ●Integrating Climate Change into Department Planning and Funding Programs ● ● ● ● ● ●Measuring and Tracking Progress ● ● ● ● ●
CHAPTER 2: GREEN O PERATIO NSGreenhouse Gas Emissions ● ● ●Building Design and Construction ● ● ● ●LEED® O+M: Existing Buildings ● ● ●Indoor Environmental Quality ● ● ●Integrated Pest Management ● ●Environmentally Preferable Purchasing ● ● ● ●Location Efficiency ● ● ●
CHAPTER 3: ENERGYZero Net Energy (ZNE) ● ● ● ● ●New Construction Exceeds T itle 24 by 15% ● ● ● ● ●Reduce Grid-Based Energy Purchased by 20% by 2018 ● ● ● ● ●Demand Response ● ● ● ● ●Renewable Energy ● ● ● ●Monitoring Based Commissioning (MBCx) ● ● ● ●Financing ● ●
CHAPTER 4: FLEET & ZERO EMISSIO N VEHICLES (ZEV) INFRASTRUCTUREIncorporating ZEVs into the Department Fleet ● ● ●Telematics Pilot Program ● ● ●Public Safety Exemption ● ● ●Outside Funding Sources for ZEV Infrastructure ● ● ● ●Hydrogen Fueling Infrastructure ● ● ● ●Comprehensive Facility Site and Infrastructure Assessments ● ● ● ●EVSE Construction Plan ● ● ● ●EVSE Operation ● ● ● ●
CHAPTER 5: WATER EFFICIENCY & CO NSERVATIO NIndoor Water Efficiency Projects in Progress First Initiative ● ● ● ● ●Boilers and Cooling Systems Projects in Progress ● ● ● ● ●Landscaping Hardware Water Efficiency Projects in Progress ● ● ● ● ●Living Landscaping Water Efficiency Projects in Progress ●Buildings with Urban Water Shortage Contingency Plans in Progress ● ● ● ●

iv
Table of Contents Page
EXECUTIVE SUMMARY ................................................................................................................................................................................. 2 CHAPTER 1: CLIMATE CHANGE & ADAPTATION - OVERVIEW ................................................................................................. 5 I. CLIMATE CHANGE & ADAPTATION GOALS .......................................................................................................................... 6
Executive Order B-30-15 ............................................................................................................................................................... 6 Legislative Direction ........................................................................................................................................................................ 6 State Resources and Guidance Documents ............................................................................................................................ 7
II. CLIMATE CHANGE ADAPTATION .............................................................................................................................................. 7 Climate Change Risks to Facilities ............................................................................................................................................. 7 Integrating Climate Change into Department Planning and Funding Programs ................................................ 21 Measuring and Tracking Progress ........................................................................................................................................... 23
CHAPTER 2: GREEN OPERATIONS - OVERVIEW ............................................................................................................................ 25 I. GREEN OPERATIONS GOALS ..................................................................................................................................................... 26
Executive Order B-18-12 ............................................................................................................................................................. 26 Executive Order B-16-12 ............................................................................................................................................................. 26 Executive Order B-30-15 ............................................................................................................................................................. 26 Assembly Bill 4 ................................................................................................................................................................................. 26 SGC Resolution on Location Efficiency .................................................................................................................................. 27 State Administrative Manual & Management Memos...................................................................................................... 27
II. GREEN OPERATIONS REPORT .................................................................................................................................................. 27 Greenhouse Gas Emissions ......................................................................................................................................................... 27 Building Design and Construction ........................................................................................................................................... 31 LEED for Existing Buildings Operations and Maintenance (LEED O+M) ............................................................... 34 Indoor Environmental Quality (IEQ) ...................................................................................................................................... 35 Integrated Pest Management (IPM) ........................................................................................................................................ 39 Waste Reduction and Recycling ............................................................................................................................................... 40 Environmentally Preferable Purchasing .............................................................................................................................. 41 Location Efficiency ......................................................................................................................................................................... 44
CHAPTER 3: ENERGY - OVERVIEW ....................................................................................................................................................... 48 I. ENERGY GOALS ................................................................................................................................................................................ 48
Executive Order B-18-12 ............................................................................................................................................................. 49 Executive Order B-30-15 ............................................................................................................................................................. 49 State Administrative Manual & Management Memos...................................................................................................... 49
II. ENERGY REPORT ............................................................................................................................................................................ 50 Department Infrastructure ......................................................................................................................................................... 50 CDCR’s Five Year Capital Improvement Program ............................................................................................................. 55 Zero Net Energy (ZNE) ................................................................................................................................................................. 56 New Construction Exceeds Title 24 by 15 Percent .......................................................................................................... 63 Reduce Purchased Grid-Based Energy 20 Percent by 2018 ........................................................................................ 64 Demand Response .......................................................................................................................................................................... 72 Renewable Energy .......................................................................................................................................................................... 73 Monitoring Based Commissioning (MBCx) .......................................................................................................................... 75 Financing ............................................................................................................................................................................................. 75
CHAPTER 4: FLEET AND ZERO EMISSION VEHICLES INFRASTRUCTURE - OVERVIEW ............................................. 77 I. FLEET AND ZEV GOALS ................................................................................................................................................................ 78
Executive Order B-18-12 ............................................................................................................................................................. 78 Executive Order B-16-12 ............................................................................................................................................................. 78

v
Executive Order B-30-15 ............................................................................................................................................................. 78 2016 ZEV Action Plan .................................................................................................................................................................... 78 Assembly Bill 32 Scoping Plan .................................................................................................................................................. 78 Public Resources Code §25722.8 ............................................................................................................................................. 79 State Administrative Manual & Management Memos...................................................................................................... 79
II. FLEET VEHICLES ............................................................................................................................................................................. 79 Introduction to the CDCR Mission and Fleet ....................................................................................................................... 79 Incorporating ZEVs into the State Fleet ................................................................................................................................ 82 Telematics Plan ................................................................................................................................................................................ 84 Public Safety Exemption .............................................................................................................................................................. 84
III. ZEV INFRASTRUCTURE ................................................................................................................................................................ 84 CDCR Parking Facilities ................................................................................................................................................................ 84 Outside Funding Sources for EV Infrastructure ................................................................................................................ 88 Hydrogen Fueling Infrastructure ............................................................................................................................................. 90 Comprehensive Facility Site and Infrastructure Assessments ................................................................................... 90 Electric Vehicle Supply Equipment Construction Plan ................................................................................................... 93 Electric Vehicle Supply Equipment Operation ................................................................................................................... 96
CHAPTER 5: WATER EFFICIENCY & CONSERVATION OVERVIEW ........................................................................................ 98 I. WATER EFFICIENCY & CONSERVATION GOALS .............................................................................................................. 99
Executive Order B-18-12 ............................................................................................................................................................. 99 Executive Order B-29-15 ............................................................................................................................................................. 99 Executive Order B-30-15 .......................................................................................................................................................... 100 Executive Order B-37-16 .......................................................................................................................................................... 100 State Administrative Manual & Management Memos................................................................................................... 100 Relevant Legislation .................................................................................................................................................................... 101
II. WATER EFFICIENCY & CONSERVATION REPORT ........................................................................................................ 101 Introduction.................................................................................................................................................................................... 101 CDCR Mission and Built Infrastructure .............................................................................................................................. 102 Heating and Cooling Systems Inventories Summary ................................................................................................... 111 Irrigation Hardware Inventories Summary ..................................................................................................................... 111 Best Management Practices..................................................................................................................................................... 114
SUSTAINABILITY MILESTONES & TIMELINE ............................................................................................................................... 121 APPENDICES ................................................................................................................................................................................................. 122 List of Tables ................................................................................................................................................................................................ 123 List of Figures ............................................................................................................................................................................................... 124 List of Graphs ............................................................................................................................................................................................... 125 Acronyms ....................................................................................................................................................................................................... 126 CDCR Facility Acronyms .......................................................................................................................................................................... 131 Glossary .......................................................................................................................................................................................................... 133

1
EXECUTIVE SUMMARY

2
EXECUTIVE SUMMARY The Governor, the California State Legislature, and various regulatory agencies have established
requirements in executive orders, statutes, regulations, and/or policies, which together direct
California State Agencies to operate their respective programs in environmentally sustainable
ways. Sustainability efforts as established in California include the following general initiatives:
• Greenhouse Gas Emissions (GHGe) Reductions
• Climate Change Adaptation
• Building Energy Efficiency and Conservation
• Indoor Environmental Quality (IEQ)
• Water Efficiency and Conservation
• Waste Reduction and Recycling
• Monitoring Based Building Commissioning (MBCx)
• Environmentally Preferable Purchasing (EPP)
• Financing for Sustainability
• Zero Emission Vehicle (ZEV) Fleet Purchases
• Electric Vehicle Charging Infrastructure
• Monitoring and Executive Oversight
The California Department of Corrections and Rehabilitation (CDCR) is the largest State agency
in total facility size, number of personnel, and percentage of the State’s general fund among all
agencies under the purview of the Executive Branch. CDCR operates all State adult prisons and
juvenile facilities, oversees a variety of community correctional facilities, and supervises all
adult and juvenile offenders, including adults released to parole supervision. The CDCR vision
is to end the causes and tragic effects of crime, violence, and victimization in our communities.
The CDCR mission is to improve public safety through law enforcement that provides for the
safe and secure incarceration of the State’s most serious and violent felons, and to provide
parole supervision and develop and implement rehabilitative strategies to successfully
reintegrate these offenders back into their communities.
CDCR employs over 56,000 persons and maintains infrastructure for 34 State-owned adult
institutions, 3 juvenile facilities, 6 facilities in “warm shutdown” (minimal operations/no
inmates), and a training academy housing cadets. Its facilities include over 49 million square
feet of State-owned building space on over 24,000 acres of land statewide. These statistics have
established CDCR as the largest California State agency under the Executive Branch as
measured by both its number of employees and building infrastructure. Additionally, CDCR
leases approximately 1.8 million square feet for its administration needs and contracts for an
additional 489,000 square feet for a private correctional facility.


4
CHAPTER ONE
CLIMATE CHANGE & ADAPTATION

5
CHAPTER 1: CLIMATE CHANGE & ADAPTATION - OVERVIEW The State of California has determined that climate change is a serious challenge facing
California and has enacted executive orders and legislation aimed at addressing the challenge.
A significant number of CDCR facilities are located in climate zones that experience extreme
heat or cold in summer and winter months and an equally significant number are located in
remote locations that may suffer from monsoonal rains, wildfires, depletion of local water
supplies, or similar climate-related concerns. In recognition of CDCR’s vast footprint, the
Department became an innovator in sustainability to alleviate both the adverse effects of a
changing climate on the operations of CDCR but also to establish a leadership position in
environmental stewardship. One of its earliest efforts was to install solar arrays at one of its
prisons in 2006 to reduce carbon emissions, a prototype installation to test and later install at
many more sites. By 2008, CDCR created a unit within the Division of Facility Planning,
Construction and Management (FPCM) dedicated to its growing renewable energy and
sustainability program. This unit, together with other key stakeholders has worked to
implement substantial changes to CDCR operations and has and will continue to identify the
potential effects of climate change and pursue efforts to prevent or mitigate them.
The Department has already incorporated
climate action planning into its required Annual
Master Plan and Five Year Infrastructure Plans
for the last several years. In fact, beginning in
2007, CDCR undertook an ambitious effort as
the first California State agency to measure its carbon emissions and report on these emissions
in partnership with The Climate Registry. The Climate Registry was established in 2007 by
states within the US and the Canadian provinces. It is currently governed by a Board of
Directors comprised of senior officials from 41 US states, the District of Columbia, 13 Canadian
provinces and territories, 6 Mexican states, and 4 native sovereign nations. The Climate Registry
is a nonprofit GHGe registry for North America that provides organizations with the tools to
help them calculate, verify, report, and manage their GHGe in a publicly transparent and
credible way. The information gathered from this analysis was used to guide the Department in
various resource efficiency and emission reduction strategies since that time.
CDCR also began the preparation of an Environmental Impact Report (EIR) for a Climate Action
Plan (CAP) in 2016 that, when completed, will provide guidance in project-level impacts related
to climate change for CDCR’s facility portfolio and identify potential climate adaptation
strategies that could be implemented to address these increased risks and improve the
resilience of CDCR facilities and operations in the future. The CAP will be developed utilizing
reference documents and measurement tools, including but not limited to the following: online
Cal-Adapt tool, reference guides such as California Natural Resources Agency Safeguarding
California Plan and associated Implementation Action Plans, California Environmental
Protection Agency Preparing California for Extreme Heat Guidelines and Recommendations, and
FIRST CALIFORNIA STATE AGENCY To measure carbon emissions in
partnership with the Climate Registry

6
the California Coastal Commission Sea Level Rise Policy Guidance. It is CDCR’s expectation that
this CAP will eventually provide a blueprint by which CDCR can manage its climate risks and
provide greater specificity and actionable strategies than are currently laid out in this Chapter
of CDCR’s Sustainability Plan. Additionally, when combined with CDCR’s other ambitious
efforts in sustainability; CDCR anticipates its CAP will help the Department continue to address
the challenges and opportunities in improving its operations in an environmentally sustainable
manner. I. CLIMATE CHANGE & ADAPTATION GOALS The Governor has issued numerous executive orders directing sustainable State operations. The
Order relevant to climate adaptation is:
Executive Order B-30-15 Executive Order (EO) B-30-15 declared climate change to be a threat to the well-being, public
health, natural resources, economy, and environment of California. It established a new interim
statewide GHGe reduction target of 40 percent below 1990 levels by 2030, and reaffirmed
California’s intent to reduce GHGe by 80 percent below 1990 levels by 2050. To support these
goals, this order requires numerous State agencies to develop plans and programs to reduce
emissions. It also directs State agencies to take climate change into account in their planning
and investment decisions and employ life-cycle cost accounting to evaluate and compare
infrastructure investments and alternatives. State agencies are directed to prioritize
investments that build climate preparedness and reduce GHGe, prioritize natural infrastructure,
and protect the State’s most vulnerable populations.
Legislative Direction Several pieces of legislation were signed in 2015-2016 that codified several elements of the EO.
These include the following:
• Assembly Bill 1482 (Gordon, 2015): Requires the California Natural Resources Agency
(CNRA) to update the State’s adaptation strategy, Safeguarding California, every three
years. Directs State agencies to promote climate adaptation in planning decisions and
ensure that State investments consider climate change impacts, as well as the use of
natural systems and natural infrastructure. (Public Resources Code Section 71153).
• Senate Bill 246 (Wieckowski, 2015): Established the Integrated Climate Adaptation and
Resiliency Program, within the Governor’s Office of Planning and Research, to
coordinate regional and local efforts with State climate adaptation strategies to adapt to
the impacts of climate change. (Public Resources Code Section 71354).
• Senate Bill 2800 (Quirk, 2016)1: Requires State agencies to take the current and future
impacts of climate change into planning, designing, building, operating, maintaining,
1 SB 2800 (quirk) passed in 2016 requires, among other things, that state agencies take into account the current and future impacts of climate change when planning, designing, building, operating, maintaining and investing in state infrastructure

7
and investing in State infrastructure. The CNRA will establish a Climate-Safe
Infrastructure Working Group to determine how to integrate climate change impacts
into State infrastructure engineering. (Public Resources Code Section 71155).
State Resources and Guidance Documents California has invested significant resources in understanding the risks of climate change to the
State and actions available to respond to and reduce these risks. These include the following:
• Safeguarding California: The State’s climate adaptation strategy organized by sector.
Each sector identifies risks from climate change and actions to reduce those risks.
• Safeguarding California Implementation Action Plans: Directed under EO B-30-15, the
Implementation Action Plans outline the steps that will be taken in each sector to
reduce risks from climate change.
• Building a Resilient California: Prepared under direction of EO B-30-15, this document
provides a framework for State Agencies to integrate climate change into planning and
investment, including guidance on data selection and analytical approach.
• California’s Climate Change Assessments: California has completed three
comprehensive assessments of climate change impacts. Each assessment has included
development of projections of climate impacts on a scale that is relevant to State
planning (i.e., downscaled climate projections). This data is available through Cal-Adapt,
an online data visualization and access tool.
II. CLIMATE CHANGE ADAPTATION EO B-30-15 directs State Agencies to integrate climate change into all planning and investment.
Planning and investment can include the following:
• Infrastructure and Capital Outlay Projects
• Economic Analysis
• Development of Strategic and Functional Plans
• Permitting
• Purchasing and Procurement
• Guidance Development
• Regulatory Activity
• Outreach and Education
This chapter of the Sustainability Roadmap will focus on the first three of these activities, and
follows the guidance created by the Technical Advisory Group developed under EO B-30-15 to
assist State Agencies to complete this task.
Climate Change Risks to Facilities For all infrastructure, it is important to assess the risk that a changing climate poses to an asset
or project (e.g., sea level rise or increasing daily temperatures). It is also important to recognize

8
the impact that an infrastructure project has on the surrounding community and the impacts
on individual and community resilience (e.g., heat island impacts).
To determine how to consider climate change for a given project, plan, or existing
infrastructure, the Department will consider the following screening questions:
1. What is the lifetime of the facility, planned project or plan?
2. Could it be affected by changing average climate conditions or increases in extreme
events over its lifetime?
3. What is the consequence of that disruption?
4. Will that disruption affect vulnerable populations, critical natural systems, critical
infrastructure, or other assets?
5. Will that disruption cause irreversible effects or pose an unacceptable risk to public
health and safety?
The effects of climate change can be described in terms of primary exposure to various physical
changes in the climate and environment caused by global climate change such as temperature,
precipitation, and sea level rise, as well as stresses experienced by facilities as a result of these
exposures (e.g., reduced water supply, impacts on structures from erosion and sea level rise,
increased frequency and duration of heat waves). These vary considerably from region to region
within California.
The application by CDCR of this screening process will depend upon the type of project
planned. First, it is worth noting, new and renovation projects planned for CDCR follow the
requirements of CALGREEN and, where appropriate, executive order initiatives for Leadership
in Energy and Environmental Design2 (LEED®) and Zero Net Energy (ZNE) construction. The
Department also developed uniform standards and guidance documents for its project
architects and engineers to ensure these initiatives were met. Its own Design and Construction
Policy Guidelines outlines, among other things, requirements to consider and mitigate GHGe,
improve energy and water efficiency, improve indoor air quality, implement on-site renewable
generation, utilize environmentally preferable construction materials, and develop on-site
electric vehicle charging stations. As of December 2017, CDCR has completed 60+ LEED-
certified facilities and is in the design phase of its first project specifically designed to achieve
ZNE. Projects designed to be LEED-certified and ZNE, by their very nature, will have features
that will reduce both the project’s carbon footprint and also be more reflective of existing
climate conditions that may restrict the design and/or include features that are more adaptive
to the climate.
In the case of planning for a Capital Outlay Project, the need for these projects is identified in
the Department’s Five-Year Plan that is updated each year and submitted to the Department of
Finance for funding consideration. Individual projects are submitted as Capital Outlay Budget
2 USGBC® and LEED® are trademarks owned by the U.S. Green Building Council and are used
with permission

9
Change Proposals (COBCPs) for legislative consideration and approval. The planning process for
each submittal and the COBCP document itself will incorporate a specific section that addresses
the above questions. Most often, these projects will not include a newly constructed prison but
rather smaller new or renovated structures on an existing prison site. However, when a new
prison is required due to operational needs, CDCR first evaluates the ability to build upon its
existing footprint to minimize the impact of new construction on the environment. This has
been the case for the last ten years of construction by the Department. Additionally, all project
impacts, including emissions, waste, and natural habitat impacts, are already studied as
required by the California Environmental Quality Act (CEQA). In that endeavor, CDCR has
preserved over 800 acres of wildlife breeding/foraging habitats and funded the restoration or
creation of nearly 2,500 acres of natural habitat and farmland, resulting in over 3,300 acres to
be held in perpetuity by natural resource agencies, land conservancies, or other reputable
environmental stewardship organizations.
Other CDCR infrastructure projects are funded through an annual support appropriation to
address critical repairs or in some cases, through utility rebates, grants or loans. CDCR
maintains more discretion over these types of projects, but they still contain all or most of the
above environmental components and will similarly ensure the climate screening questions
outlined above are incorporated into its review process.
Beyond infrastructure repairs and capital improvements, CDCR’s operations also include a
number of other operational areas that have been impacted or could be impacted by the effects
of climate change. CDCR’s leased portfolio is located in communities throughout California and
is managed by the Department of General Services (DGS). CDCR has encouraged DGS to identify
new lease opportunities that meet the same sustainability goals as CDCR promotes for its State-
owned portfolio and presumes that DGS will now include these climate screening criteria in new
site searches on CDCR’s behalf. Additionally, CDCR manages an extensive fleet of
approximately 3,600 owned vehicles and 1,800 leased vehicles. The Department has worked
with DGS to replace a portion of its fleet with Zero Emission Vehicles (ZEV), has already
installed electric vehicle charging stations at a few locations with more planned in the near
future depending upon grant or funding
availability, and is replacing its conventional
diesel with renewable diesel. CDCR is also
actively recycling and purchasing recycled
materials and other environmentally
preferable products for use in its facilities.
The Department also includes in its construction and rehabilitative programs a curriculum
aimed at educating its offenders about sustainability initiatives, including climate change
impacts. These efforts will be described in other chapters of this Roadmap.
105 ENERGY EFFICIENCY PROJECTS Have yielded a combined GHGe
reduction of 68,888 metric tons per year

10
Understanding Climate Risk to Existing Facilities
Risk from Increasing Temperatures
Under a changing climate, temperatures are expected to increase – both at the high and low end. As a result, facilities will experience higher maximum temperatures and increased minimum temperatures.
According to the Intergovernmental
Panel on Climate Change (IPCC), global
average temperature is expected to
increase by 0.3 to 4.8°C (0.5 to 8.6°F) by
the end of the 21st century, depending
on future GHGe scenarios (IPCC 2014).
In California, average temperatures are
also likely to increase significantly with
a projected increase of approximately
1.5°C (2.7°F), above 2000 averages, by
2050. And depending on emission
levels, increase 2.3 to 4.8°C (4.1 to
8.6°F), above 2000 averages, by 2100
under a higher emissions scenario (CEC
2012:2-3). The anticipated increase in
average temperatures may also be
characterized by extreme heat events
such as more frequent and longer-
lasting heat waves. Higher increases in
temperature will be more prominent further inland and closer to desert regions. The map
(Figure 1) shows the forecasted increase in annual average temperatures in California between
a baseline time period (1961-1990) and the end of the century (2070-2099) (Cal-Adapt 2016).
The Region Map (Figure 2) illustrates the location of CDCR’s facilities throughout the state. This
map clearly depicts the far-reaching range of locations and, as such, the different climate zones
these facilities are located in.
Table 1- Top 5 Facilities Most Affected by Changing Temperature (Degrees Fahrenheit)
Facility Name*
Annual Mean
Maximum Temperature (1961–1990)
Annual Mean
Maximum Temperature (2031–2060)
Annual Mean
Maximum Temperature (2070-2099)
Annual Mean
Minimum Temperature (1961–1990)
Annual Mean
Minimum Temperature (2031–2060)
Annual Mean
Minimum Temperature (2070-2099)
CAL 88.09 88.50 96.91 56.71 62.17 66.67 ISP 87.19 92.04 96.30 58.74 64.27 68.89 CEN 87.64 93.76 96.19 56.84 62.00 66.32 CVSP 86.77 85.35 95.89 49.66 63.75 68.38 CRC 78.94 74.03 87.50 50.54 55.26 59.29
* Sorted data by Estimated Max Temp 2070 – 2099
Figure 1- Cal-Adapt 2016 Temperature Forecast

11
Figure 2- CDCR Facilities and Climate Impact Regions

12
The above Table 1 reflects those prisons that are projected to experience the highest estimated
annual maximum temperatures in the year 2070 – 2099. In addition to changing average
temperatures, climate change will increase the number of extreme heat events across the State.
Table 2 reflects those prisons with the highest forecasted extreme heat events as measured by
the Extreme Heat Threshold. It is not surprising to see that four out of five facilities are
represented on both Table 1 and Table 2.
Facility Name*
Extreme Heat
Threshold (EHT)
Average number of days above
EHT (1961-1990)
Average number of days above
EHT (2031-2060)
Increase in number of days above EHT by mid-century
Average number of days above EHT (2070-
2099)
Increase in Average
number of days above EHT by end of century
CVSP 114.1 4.2 17 12.8 29 24.8 ISP 114.1 4.2 17 12.8 29 24.8 CAL 112.9 4.3 23 18.7 39 34.7 CEN 112.5 4.2 19 14.8 32 27.8 WSP 106.2 4.3 22 17.7 29 24.7
*Sorted data by Extreme Heat Threshold
The nature of CDCR’s operations dictates the need for very sturdy shell construction (i.e.,
concrete, concrete block, metal framing, and structural steel) that has a typically longer lifecycle
than other types of construction (i.e., wood framing, etc.). CDCR structures tend to withstand
the harsh effects of solar rays, wind and rainstorms, and even fire events because of these
materials. However, many of the critical support systems contained within and around these
structures remain susceptible to climate conditions. Approximately half of the CDCR adult
correctional facilities are in areas of the State that have moderate to high summer
temperatures. This includes several correctional facilities in the eastern and southeastern
deserts, the lower San Joaquin Valley, Antelope Valley, and Inland Empire. Accordingly, CDCR
has had long experience in the adaption of the operation of prisons in areas with periods of
high daily temperatures. CDCR has traditionally used evaporative cooling for the majority of
inmate housing and program areas, which can provide little relief in extreme heat events; only a
small portion of each facility typically has refrigerated cooling. However, all facilities regardless
of their cooling systems are required to have a heat plan protocol to help reduce the harm to
staff and the offender population from extreme conditions.
When cooling systems have outlived their useful life and require replacement and/or
upgrading, the Department is increasingly converting to centralized chiller systems that
provide more efficient and effective cooling. As an example, a project to replace all of the
evaporative cooling with a centralized chiller is expected to proceed to construction in 2018
and will serve the cooling needs of both Ironwood State Prison (ISP) and Chuckawalla Valley
State Prison (CVSP), both of which are listed in Table 1 and Table 2 on the previous page. This
is also one of the Department’s first ZNE designed projects. CDCR is also introducing improved
cooling systems in its Health Care space and a myriad of housing units serving the CDCR
offender population with medical and/or mental health treatment needs. The Department is
Table 2- Five Facilities that Will Experience the Largest Increase in Extreme Heat Events

13
also addressing the need to improve the livability of prisons in desert and southern Central
Valley locations by adding insulation to its roofing systems as they are replaced to help reduce
interior daytime temperatures. CDCR is already working on plans to replace a significant
portion of its roofs in need of repair within the next five years.
While increased heat will add challenges to the operations of 30+ year old buildings in deserts
and other similar terrain, it will also accelerate deterioration of building systems – especially
mechanical systems - if repairs/renovation projects are delayed or deferred. Unfortunately, due
to historic funding shortages, CDCR’s backlog of deferred maintenance has continued to
increase, delaying the replacement or repair that could bring needed upgrades and efficiencies.
CDCR continues to seek supplemental funding to replace archaic mechanical systems with
more energy efficient systems.
Increased temperatures also add to both water and electricity demands. The effect of increased
temperatures on water availability was pronounced during the drought years of 2013-2017 and
CDCR took steps to reduce its water use through both operational (conservation) practices and
installation of water efficiency measures, exceeding the 25 percent statewide conservation goal
set by the Administration. In the case of electrical demands, CDCR established a Demand
Response Program in concert with investor owned utilities in 2002 that created a framework
through which CDCR can reduce its consumption needs to allow other utility customers to stay
connected; the periods of time when this program is of greatest need is during the peak
summer months. Part of CDCR’s ability to reduce its load during these times and even
throughout the year can be attributed to its extensive construction of on-site renewable
generation. Currently, CDCR has over 34 Megawatts (MW) of solar generation and is in design or
construction at several locations,
for a planned total of
approximately 125 MW of
renewable generation by the close
of 2020. These solar installations
have assisted CDCR in
substantially reducing its total
carbon footprint.
Other sustainability measures
incorporated into CDCR projects
to assist with temperature impacts
beyond LEED and ZNE efforts
include its Cool Roof program
(Figure 3) designed to minimize
on-site heat buildup, the
installation of solar parking
canopies and cool (reflective) pavements to help reduce the heat island effect in CDCR parking
facilities, and the installation of misting systems at several Health Care facilities to help
mitigate temperature issues during outside recreation hours.
Figure 3- Cool Roofs at CHCF

14
Risk from Changes in Precipitation
Table 3- Facilities that will be Most Impacted by Projected Changes in Precipitation (Inches)
Facility Name
Annual Mean Maximum
Precipitation (1961–1990)
Annual Mean Precipitation (2031–2060)
Percent Change by
mid-century
Annual Mean Precipitation (2070–2099)
Percent change by
end of century
PBSP 4.92 0.0000614 -99.9988% 0.0000615 -99.9988%
SQ 2.07 0.000028 -99.9986% 0.0000309 -99.9985%
FSP/SAC 1.66 0.0000211 -99.9987% 0.0000218 -99.9987%
Only a few existing State prisons are located in settings where increased precipitation could
affect ongoing operations and/or the physical safety of the prison facilities. Correctional
facilities in Los Angeles, Riverside, and San Joaquin Counties are situated close to major
drainage systems that conduct storm water to local collection systems. If climate change results
in more intense rainfall events in these or other adjacent watersheds, CDCR will need to
potentially improve drainage systems in and near each facility to prevent storm water runoff,
intrusion, and erosion. In addition, while the above Table 3 indicates only three prisons that
will experience increased precipitation, several more prisons are impacted by already high
precipitation levels in their respective climate zone. The impacts from 2017’s historical
precipitation was widespread among CDCR facilities, with several facilities not listed above
inundated with severe rains and accompanying winds that caused roofs to fail and water
intrusion in parking and drive areas, making navigation to and around the prison difficult.
Since a substantial portion of CDCR’s infrastructure, particularly its roofing systems, needs
replacement, high precipitation levels will continue to exacerbate operations until repairs or
replacements can be made. Even if improvements within CDCR facilities are made, the lack of
companion improvements in the surrounding community can adversely affect operations. Large
transportation routes inundated with water have the potential to shut off access for extended
periods of time, posing safety hazards to staff and the public trying to access the institutions
or worse, transporting ill persons to needed hospitals. Other outside systems that provide
CDCR with the continuity of operations can be severely impacted. Two circumstances the
Department had to deal with in the aftermath of the storms of 2017: the potential breach of
flood levees surrounding and protecting two of its prisons and the potential spillover of
reservoirs on CDCR property that became inundated with rainwater. It will be essential that
CDCR work with its local partners to ensure that they are aware of and investing as necessary
in climate preparation strategies to mitigate excess precipitation.
Changes in precipitation related to a warming climate are, more often than not, going to lead to
reduced precipitation as was experienced in the State’s recent multi-year historic drought. As a
result of reduced rainwater influx, nearly every region within California experienced some level
of reduced groundwater and potable water supply availability. Even prior to the drought,
proactive steps were taken by CDCR in 2007 to reduce its water consumption in recognition
that some of its facilities were located in regions with limited water supplies. However, in
response to these water shortages and prolonged drought conditions, CDCR immediately
implemented additional water rationing and conservation at all of its facilities in accordance

15
with Executive directives. CDCR developed a statewide Drought Action Plan and required each
institution to develop a site-specific plan as well. Each institution selected a Water Conservation
Manager (WCM) to lead Drought Task Force Teams. Each WCM worked closely with their water
suppliers and with the Department of Water Resources to ensure coordination, especially at the
institutions located in critical groundwater basins. The WCMs also worked with CDCR’s FPCM to
ensure water shortage contingency plans were in place. Despite the recent drought having
ended, the Department continues to emphasize water conservation and pursuit of water
conservation retrofits to reduce its reliance on both potable and non-potable supplies.
CDCR requires all construction sites to have a Storm Water Pollution Prevention Plan for
implementation and compliance with the National Pollution Discharge Elimination System
General Permit. Each facility also has a Sewer System Management Plan in place to help manage
and mitigate storm water runoff. During the design and construction of the California Health
Care Facility (CHCF), CDCR incorporated landscape elements (bioswales) to remove silt and
pollution from surface runoff water, which will also facilitate recharge of groundwater to
reduce climate impacts on groundwater supply (Figure 36). In another of its facilities, CDCR
installed a permeable paved parking lot that also allowed surface water to percolate through
the asphalt and into the water table below to recharge the table and avoid water runoff. There
are still opportunities under consideration for rain catchment systems in facilities with high
precipitation levels to capture and redistribute excess rain. The Climate Action Plan (CAP) under
development will be addressing these same issues pertaining to flood, storm water runoff and
landslides, including risks, adverse effects and other relevant issues with more specificity.
Risks from Sea Level Rise
Increasing global temperatures are contributing to rising sea levels. Rising sea levels will result
in an inundation of water to coastal areas and increased flooding due to storm surges. The
California Ocean Protection Council (OPC) has issued guidance for State Agencies on what range
of sea level rise to consider. The Guidance document provides the following estimates of sea
level rise for the California Coast, which are based on a study by the National Academy of
Sciences.
An accompanying OPC resolution recommends that departments base analyses on estimates of
sea level rise in the upper two-thirds of the range.
Global climate change is already contributing to sea level rise, which is projected to continue at
increasing rates as warming continues. Along California’s coastline, the average sea level rose
approximately seven inches during the 20th century (CEC 2012). Assuming sea level rise along
the California coast continues to track global trends, projected sea levels along the State’s
coastline south of Cape Mendocino are expected to increase from 12 to 61 cm (5 to 24 in.) by
2050, and 42 to 167 cm (17 to 66 in.) by 2100, as compared to 2000 levels (Table 4). North of
Cape Mendocino, geologic forces are causing much of the land to uplift, resulting in a slower
projected rate of sea level rise than California’s coastline to the south. Between 2000 and 2100,
sea level north of Cape Mendocino is projected to rise approximately 10 to 143 cm (4 to 56
inches) (California Ocean Protection Council [OPC] 2013).

16
Table 4- Projected Sea Level Rise along the California Coast
Accelerating sea level rise, especially at the increasing rates projected for the 21st century, may
result in the loss of substantial areas of coastal land area. Erosion and inundation from rising
sea levels would threaten structures, roads, and other supporting infrastructure located along
the coastline and at nearby low elevations.
According to Cal-Adapt data, there are no CDCR correctional facilities that are at risk from
rising sea levels; however, CDCR has identified two of its three correctional facilities situated
near coastal zones, Deuel Vocational Institution (DVI) and San Quentin State Prison (SQ), which
it believes could be impacted by sea level rise and potential flooding along the coastline and
delta. San Quentin is situated on a low bluff on the shoreline of San Francisco Bay and has
experienced erosion of its protective seawall over the years. An improvement project fortifying
its walls was completed several years ago to fortify this structure. Changes in sea level could
result in destruction of some support areas outside of the main prison grounds and the
influence of storm waves could require further remediation of the existing perimeter seawall.
Sea level rise could also disrupt major transportation routes, such as State Route 580 and
U.S. Highway 101, which are main thoroughfares for inmate transport, visitor trips, employee
commutes, and vendor deliveries. CDCR’s DVI prison in San Joaquin County and Pelican Bay
State Prison (PBSP) in Del Norte County are located in coastal zones; however, both prisons are
well inland of tidal influence and are situated at base land elevations (20-70 feet) above sea
level. While these prisons are not currently considered at risk of sea rise, CDCR remains
cognizant of the potential for seawater rise influences and will continue to evaluate the risks
associated with these locations.
Natural Infrastructure to Protect Existing Facilities
As described above, climate change may increase the risks of impacting institutional operations
and some of the strategies mentioned above serve to guard against these risks. For example,
planting additional trees to reduce heat island impacts is an appropriate mitigation
consideration for new projects. Reducing the heat island effect within a prison yard is also
under way, as the Department has completed several gardens inside prison walls with more
planned. These gardens are also meant to be therapeutic and provide vital rehabilitation skills
and will serve to help educate our offender population about the value of preserving the
natural environment. Other natural infrastructure solutions to combat against the effects of
climate change included assisting with the funding of levee improvements to widen and raise
an existing earthen levee protecting two of CDCR’s prisons in the Central Valley that were at
risk of flooding during last year’s historic rains.
Understanding the Potential Impacts of Facilities on Communities
CDCR facilities are often located in remote rural locations where their presence is significant in
terms of population, footprint, and/or as an economic driver in that location. Climate change
Time Period North of Cape Mendocino South of Cape Mendocino
2000 - 2030 -4 to 23 cm (-0.13 to 0.75 ft) 4 to 30 cm (0.13 to 0.98 ft) 2000 - 2050 -3 to 48 cm (-0.1 to 1.57 ft) 12 to 61 cm (0.39 to 2.0 ft) 2000 - 2100 10 to 143 cm (0.3 to 4.69 ft) 42 to 167 cm (1.38 to 5.48 ft)

17
that could lead to a prison closure could potentially cripple the economic stability of some of
these areas. Some prisons’ infrastructure systems (i.e., water, wastewater) either take the
burden off local municipalities to serve CDCR populations or in turn provide water or
wastewater supplies and services to the greater community. Ensuring that proper planning for
CDCR operations needing or providing these services from or to the community is essential in
minimizing disruption to that community. As mentioned earlier, CDCR has created a
substantial renewable portfolio that reduces reliance on the electricity grid as one key area in
which CDCR can mitigate its operational effects and the effects climate change will have on
operations within its local communities.
Vulnerable Populations
It is recognized that certain populations are more susceptible to the effects of changing climate
conditions and will have less capacity to recover from changing average conditions and more
frequent and severe extreme events. Vulnerable populations can include people living in
poverty; people with underlying health conditions; incarcerated populations; linguistically or
socially isolated individuals; communities with less access to healthcare or educational
resources; or communities that have suffered historic exclusion or neglect.
CDCR’s incarcerated population is in many ways reflective of the population at large. A
significant number of its offenders have either mental or medical health issues and those often
include learning disabilities. They are more likely to have experienced some neglect prior to
being housed with CDCR. Some of these individuals may be prescribed medications that do not
react well with extreme heat conditions. Because these individuals are within the care and
custody of CDCR, the unique needs and circumstances of this population are addressed as part
of the standard offering of services, including provision of food, housing and education, or as
part of their case management plan for those with mental and medical health needs. Once
released and/or paroled, these same individuals may once again be subject to risks other
vulnerable population’s experience. However, CDCR is trying to combat this cycle of
vulnerability by emphasizing rehabilitation and employment-building skills during
incarceration. These efforts are intended to reduce the chances of an offender reoffending and
returning to prison, but also are intended to provide the means to live in a self-sustaining
manner after they have served their sentence.
CDCR staff and inmates have also recognized that the community at large, and particularly
within proximity to some of our prisons, may struggle with issues of poverty, incarcerated
parents, mental health issues and the like, and have volunteered thousands of hours and raised
substantial sums of money to assist these vulnerable populations in dealing with a myriad of
issues affecting their quality of life.
Disadvantaged Communities
California is required to invest resources in Disadvantaged Communities (DACs). DACs are
identified using CalEnviroScreen, a tool that ranks census tracts based on a combination of
social, economic, and environmental factors. While it does not capture all aspects of climate
vulnerability, it is one tool that is available, and does include several relevant characteristics. In
many cases, DACs are more likely to suffer damage under changing climate conditions,

18
including extreme events. It is recognized that the Department’s facilities located in these
communities can contribute or alleviate the vulnerability of these communities.
Table 5- Facilities Located in Disadvantaged Communities
Facility Name CalEnviroScreen Score Is it located in a disadvantaged
community? Yes/No
CHCF 96-100% Yes
KVSP 96-100% Yes
NKSP 96-100% Yes
NCYCC 96-100% Yes
CCWF 91-95% Yes
VSP 91-95% Yes
ASP 76-80% Yes
As evidenced in Table 5, several CDCR facilities are located within a DAC as identified by the
CalEnviroScreen. In total, approximately 19 percent of the Department’s total institutional
portfolio is located in a DAC. As mentioned above and earlier, many of CDCR’s facilities are
located in remote and/or rural areas, which
by and large, suffer from a lack of
investment by large corporations more
traditionally located in urban settings, thus
having a corresponding impact on property
values. CDCR is often the largest employer
within the region. To ensure local residents
were afforded the opportunity to obtain
employment with CDCR, its last three major
construction projects included contract
language that required the construction firm
to prioritize local hiring to build the
projects. Additionally, CDCR’s Division of Administrative Services held both job recruitment
and procurement fairs to provide additional opportunities for local residents to find
employment or provide services. These on-site hiring fairs have continued at facilities
throughout the State. CDCR also has Mutual Aid agreements with local first responder
organizations to assist as needed in public service emergencies. Additionally, the Department
provides community work crews comprised of inmates that will assist local partners with
needed cleanup and infrastructure repairs.
There may still be other avenues for CDCR to pursue in working with these communities,
particularly in light of climate change. These opportunities will continue to be evaluated in
future projects and planning efforts.
Urban Heat Islands
Urban heat islands are areas with localized spikes in temperature, which impact human health,
increase pollution, and increase energy demand. Urban heat islands occur during the hot
Figure 4- Solar Parking Canopies at RJD

19
summer months in areas with higher percentages of impervious surface and less vegetation.
This is likely in areas with large parking lots, dense development, and lower tree density and
shading. Urban heat islands can be reduced through tree planting and greening measures, cool
roofs (e.g., lighter roofing materials that reflect light), cooler pavements, and other measures.
Table 6- Top Five Facilities Located in Urban Heat Islands (Sorted by highest UHII)
Facility Name Located in an urban heat
island (yes/no)
CRC Yes
CIM Yes
CIW Yes
CMF Yes
SOL Yes
The nature of CDCR facilities is such that large portions of the property are covered in paved
areas and structures. A typical prison can include up to 1,000 acres and housing upwards of
4,000-6,000 inmates, not including a staffing figure between several hundred to more than
1,000 employees at a given site.
As mentioned earlier, CDCR has already undertaken a number of measures to ensure that the
heat island effect is reduced, through such design features as solar-equipped parking canopies
(Figure 4), cool pavements and cool roofs, and additional vegetation. Reductions to heat islands
have also included installing more energy efficient systems that consume less energy and
installing renewable generation that relies solely on solar power and eliminates carbon
emissions. More of these efforts will be implemented in the near future, and with the
Department’s Zero Net Energy policy, all new projects are to be planned as ZNE.
An analysis of statewide effects of climate changes pertaining to extreme heat and local heat
islands including risks, adverse effects, and issues that are relevant to the Department’s
existing facilities as well as potential climate adaption strategies shall be included in the CAP.
Understanding Climate Risk to Planned Facilities
CDCR is not contemplating a significant expansion of its footprint in the near future. For any
new projects proposed in the Governor’s Budget, the Department’s Design and Construction
Policy Guidelines establishes minimum siting requirements to avoid or mitigate adverse effects
of extreme climate conditions (i.e., floods, heat, wind, snow, and drought). Factors to be
considered include:
• Avoid sites in coastal/deltaic settings where an increase in sea level, coastal erosion or
other coastal hazards could result in deterioration of the building and support areas of
the new facility. Avoidance of areas that could be affected by increases in sea level is
preferred over sites that would require levees and other similar hydraulic barriers.
(Reference: State of California Sea Level Rise Guidance).

20
• Avoid sites prone to extreme heat and/or the potential for the heat island effect.
Implement strategies to reduce the heat island effect due to climate change; cool roof
systems, cool pavements (reflective or permeable), parking canopies, and increased trees
and vegetation when feasible. (Reference: Preparing California for Extreme Heat Guidance
and Recommendations).
• Avoid sites within a mapped 100-year floodplain and/or sites in the pathway of
watersheds that might be subject to increased periods or magnitude of seasonal storm
events including monsoonal/hurricane events. Also, avoid placement of new facilities in
close proximity to levee and/or storm water channels that may eventually be determined
inadequate due to the increasing frequency and/or magnitude of rainfall events. Where
feasible, avoid sites that require construction of stand-alone levee systems and/or storm
water channels to prevent site inundation. (Reference: Department of Water Resources
Statewide Flood Management Program).
• Avoid sites situated within areas of chaparral plant communities, coniferous forest,
and/or mature landscaping that may pose the risk of catastrophic wild fires and/or
would be difficult to protect from wild fires. (Reference: California Department of
Forestry and Fire Protection’s Fire and Resource Assessment Program).
• Avoid sites that, due to unique terrain and/or topographic setting, present solar
exposure in excess of that typical of the respective climatic area and/or potentially
expose new structures to excessive wind levels, dry lightning, snow, or other extreme
weather conditions. (Reference: California Office of Emergency Services State Hazard
Mitigation Plan).
As new facilities are planned, this information will be evaluated along with other information CDCR uses in its decision-making process and any impacts will be evaluated and addressed as appropriate. The CAP currently under development will serve as an overall framework for this effort.
Natural Infrastructure Solutions for Planned Projects
EO B-30-15 directs agencies to prioritize natural and green infrastructure solutions. Natural
infrastructure is the “preservation or restoration of ecological systems or the utilization of
engineered systems that use ecological processes to increase resiliency to climate change,
manage other environmental hazards, or both. This may include, but need not be limited to,
flood plain and wetlands restoration or preservation, storm water management, combining
levees with restored natural systems to reduce flood risk, and urban tree planting to mitigate
high heat days” (Public Resource Code Section 71154(c)(3)).
The majority of past sites used for construction of new and/or expanded correctional facilities
did not contain significant natural resources such as wetlands, old growth forests, critical
habitat for endangered species, etc. However, when such resources are present, CDCR typically
provides appropriate direct or indirect mitigation. For example, because of the unavoidable loss
of grassland habitat at an expansion site on the Richard J. Donovan Correctional Facility in
south San Diego County, the Department secured 35 acres of burrowing owl habitat
conservation credits.

21
CDCR has implemented a number of natural infrastructure solutions to mitigate the
environmental impacts of its projects, some of which were described above. Earlier projects
have funded and planned wetlands restoration or preservation projects such as the installation
of bioswales at the California Health Care Facility in Stockton or, more recently, wetlands
avoidance and restoration at a construction site completed in 2016.
CDCR also provides for the long-term protection of sensitive and/or declining wildlife species
that may be lost due to the operation of the lethal electrified fencing used within the secure
perimeter of many State prisons. In conformance with the Department’s Habitat Conservation
Plan, habitat that will serve to maintain and/or enhance the target sensitive wildlife species is
acquired in non-profit conservation banks approved by State and Federal wildlife regulators.
In instances where CDCR projects are unable to fully avoid effects to natural resources, off-site
mitigation is typically implemented through purchase of conservation credits within various
habitat preserves. In addition to mitigation required for the direct effects of new or expanded
facilities, the Department also secures habitat to compensate for the loss of wildlife as a result
of its perimeter security systems. Through the later program, CDCR has preserved over
800 acres of wildlife breeding/foraging habitats and sensitive ecosystems through direct land
acquisition, funding conservation easements, purchasing mitigation credits at state/federal
agency approved mitigation banks, and has funded the restoration/creation of nearly
2,500 acres of various natural habitats and farmland; this approximately 3,300 acres is held in
perpetuity by natural resource agencies, land conservancies or other reputable environmental
stewardship organizations.
Integrating Climate Change into Department Planning and Funding Programs
Full Life Cycle Cost Accounting
EO B-30-15 directs State Agencies to employ full life cycle cost accounting in all infrastructure
investment. Lifecycle cost accounting includes:
• Considering initial investment costs, as well as lifetime operation and maintenance costs
under changing climate conditions, including changing average conditions and increases
in extreme events.
• Applying non-market evaluation methods such as travel cost, avoided costs or contingent
valuation to capture hard to quantify benefits and costs.
Unlike more traditional real property that may have an identified timeline of between 30-50
years, often coincident with either its financing scheme or the life of its major systems, CDCR
does not consider its existing correctional facilities to have a specific end of life term. While the
majority of existing State correctional facilities have been built since 1985, the Department
currently has two correctional facilities over 125 years old yet remain serviceable for inmate
housing and programs. CDCR is able to continue operation of the entire span of historic and
contemporary facilities through periodic upgrades/replacements of infrastructure, housing
units, and program support areas. The design standards of all renovation projects, and for

22
replacement/expansion projects, are the requirements of the State Building Code and, if
feasible, additional commitments that exceed these standards such as those of the Leadership
in Energy and Environmental Design program.
For all third-party energy conservation/generation projects, such as new on-site photovoltaic
installations, CDCR performs life cycle costing to account for all costs related to construction,
operation, maintenance, and disposal at the end of the useful life of a structure. Economic
metrics used for energy efficiency projects include; Simple Payback, Return on Investment, Life
Cycle Cost Analysis, Savings to Investment Ratio, Net Present Value, and Internal Rate of
Return. CDCR leverages a formal partnership with California’s Investor Owned Utilities to
identify and implement energy efficiency projects that utilize rebates and zero percent loans to
realize cost savings.
Table 7- Integration of Climate Change into Department Planning
Plan Have you integrated climate?
If no, when will it be integrated?
If yes, how has it been integrated?
Climate Action Plan in development process
Yes - In progress
N/A See below
Table 8- Engagement and Planning Processes
Plan
Does this plan consider impacts
on vulnerable populations?
Does this plan include coordination
with local and regional agencies?
Does this plan prioritize natural and green infrastructure?
Climate Action Plan in development process
As necessary TBD Yes
Funding of Projects to Reduce Climate Risks
State agencies are required to pursue all available financing and project delivery mechanisms to
achieve executive order goals and mandates including, but not limited to: State revolving loan
funds, utility On-Bill Financing (OBF), Power Purchase Agreements (PPAs), Green Seal (GS) $Mart,
Energy Service Contractors, or other available programs.
CDCR has been successful in fulfilling many of the State mandates of energy efficiency and
sustainability by seeking out various funding opportunities as they become available. CDCR is
proactive in promoting additional funding opportunities by participating in policy discussions
on topics such as OBF and On-Bill Repayment (OBR).
CDCR has utilized and will continue to explore multiple funding opportunities for projects that
aid in climate adaptation including GS $Mart loans, OBF, Municipal utility company loan and
incentive programs, American Recovery and Reinvestment Act (ARRA) loans, Energy
Conservation Assistance Act (ECAA) loans, Department of Water Resources loans and grants,
and Solar or Wind PPAs.

23
Measuring and Tracking Progress For the last several years, CDCR has incorporated climate action planning into its Five Year
Infrastructure Plan. Carbon emissions data has been tracked since 2007. The Department also
regularly reports its electricity consumption data into an Energy Star Portfolio, where its
progress can be tracked on a public-facing website. Additionally, CDCR executed an agreement
in 2016 with an environmental consulting firm to prepare a Climate Action Plan (CAP) to
analyze statewide climate change effects as they relate to CDCR facilities and operations.
CDCR’s consultant is required to identify potential climate adaption strategies that could be
implemented to address increased risks and improve the resilience of CDCR facilities and
operations. The consultant will use existing guidance and tools including, but not limited to,
the following: online Cal-Adapt tool, reference guides such as California Natural Resources
Agency Safeguarding California Plan and associated Implementation Action Plans, California
Environmental Protection Agency Preparing California for Extreme Heat Guidelines and
Recommendations, and the California Coastal Commission Sea Level Rise Policy Guidance. The
CAP will also provide a GHGe inventory, emissions reduction plan, and a comprehensive
analysis of the environmental effects of the potential adoption of measures that would further
reduce GHGe to contribute to the statewide goal of reducing the long-term potential for climate
change. Upon completion, the CAP will serve as a guideline along with required activities under
the California Environmental Quality ACT (CEQA) for CDCR when making new facility
investment decisions that may have environmental impacts.
CDCR recognizes the importance of understanding the current and future impacts of climate
change in the State when planning, designing, building, operating, maintaining, and investing in
correctional facilities and infrastructure. Proactive planning for future climate change is
necessary for resiliency and protection of the Department’s assets, as well as providing a better
use of resources, improving self-sufficiency, and maximizing the efficient use of fuel, water,
and other resources while carrying out the CDCR mission and vision.

24
CHAPTER TWO
GREEN OPERATIONS

25
CHAPTER 2: GREEN OPERATIONS - OVERVIEW CDCR has been a major force within State government in accomplishing the objectives set forth
in EO B-18-12 for State buildings, including energy efficiency projects and GHGe reduction
efforts such as using clean on-site power generation, solar photovoltaic, and wind power
generation. Through third-party Solar Power Purchase Agreements (SPPA), CDCR has completed
16 on-site renewable solar generation projects at 12 institutions totaling 33.6 megawatts (MW
AC). CDCR recently awarded nine solar projects and is in the process of awarding 10 more,
which will provide an additional 54 MW of solar energy. CDCR also awarded three wind turbine
projects that will provide 4 MW of renewable wind energy. CDCR's statewide renewable energy
portfolio is positioned to
exceed 125 MW by the end of
2020.
CDCR has managed the design
and construction of 60 new
buildings that have achieved U.S. Green Building Council (USGBC) Leadership in Energy and
Environmental Design (LEED) Certification of a Silver level or higher. In addition, CDCR occupies
eight LEED-certified leased buildings. CDCR has identified an additional eight projects that will
be designed to meet or exceed the LEED Silver certification standards. There are also over 150
Health Care Facility Improvement Program (HCFIP) sub-projects currently being constructed
that are designed to meet CALGREEN standards. Finally, CDCR has identified several potential
Zero Net Energy (ZNE) building projects that are currently in design as new construction or are
in the certification process.
CDCR’s emphasis on “building green” has also carried through into its operations. The
Department has established a number of green practices throughout its facilities. Examples
include:
• Improved waste diversion and enhanced waste reduction and recycling,
• Maintenance methods aimed at improving indoor air quality such as enhanced filtration,
• Establishing less toxic methods to control pests though integrated pest management
practices, and
• Utilizing environmentally preferred purchasing methods for typical purchases such as
office supplies and cleaning products to ensure goods and services meet stringent
standards.
Planned installations of electric vehicle charging stations will enable staff to use emission-free
vehicles in their daily commutes and when combined with on-site renewable generation, will
help to improve air quality.
These programs and partnerships, along with CDCR efforts overall have led to an 11 percent
decrease in grid-based energy purchases and a 24 percent decrease in the overall Energy Usage
Index (EUI) rate since 2003, despite a 17 percent increase in total institutional square footage.
34 MW/yr GENERATED BY RENEWABLE POWER 125 MW/yr solar and wind power projected
by 2020

26
From August 2014 through December 2017, CDCR has diverted approximately 23,000 tons or
organic waste from landfills. CDCR has exceeded the 10 percent entity-wide GHGe reduction
goal set by Governor Brown in 2015 and is on track to meet the goal of a 20 percent reduction
by 2020.
Through the continued efforts of CDCR’s programs, projects, and objectives, the Department is
on track to meet or exceed the overall GHGe, energy, and renewables goals and objectives set
forth by the Administration and its own ambitious sustainability agenda, including being a
leader in advancing and meeting the goals and objectives of EOs B-18-12 and B-16-12.
I. GREEN OPERATIONS GOALS The Governor and legislature have directed state agencies to prioritize sustainability efforts
within their respective departmental operations. The orders and legislation relevant to green
operations described in this roadmap, as well as policy guidelines aimed at implementing these
directives, are:
Executive Order B-18-12 EO B-18-12 and the companion Green Building Action Plan, require State agencies to reduce the
environmental impacts of State operations by lowering GHGe, managing energy and water use,
improving indoor air quality, generating on-site renewable energy when feasible, implementing
environmentally preferable purchasing, and developing the infrastructure for electric vehicle
charging stations at state facilities. The Green Building Action Plan also established two
oversight groups; the staff level Sustainability Working Group and the executive level
Sustainability Task Force, to ensure these measures are met.
Executive Order B-16-12 EO B-16-12 directs State agencies to integrate zero emission vehicles (ZEVs) into their vehicle
fleet and to develop the infrastructure to support an increased public and private sector use of
ZEVs. Specifically, it directs State agencies replacing fleet vehicles to exchange at least 10
percent with ZEVs, and by 2020 to have fleets comprised of at least 25 percent ZEVs.
Executive Order B-30-15 EO B-30-15 declared climate change to be a threat to the well-being, public health, natural
resources, economy, and environment of California. It established a new interim statewide
GHGe reduction target of 40 percent below 1990 levels by 2030 and reaffirms California’s
intent to reduce GHGe to 80 percent below 1990 levels by 2050. To support these goals, this
order requires numerous state agencies to develop plans and programs to reduce emissions.
Assembly Bill 4 Assembly Bill (AB) 4 was passed in 1989. The State Agency Buy Recycled Campaign (SABRC)
statutes are in Public Contract Code Section 12153-12217. The intent of SABRC is to stimulate
markets for materials diverted by California local government and agencies. It requires state
agencies to purchase enough recycled content products to meet annual targets, report on

27
purchases of recycled and non-recycled products, and submit plans for meeting the annual
goals for purchasing recycled content products.
SGC Resolution on Location Efficiency Location efficiency refers to the GHGe arising from the transportation choices of employees
and visitors to a building as determined by the Smart Location Calculator. Adopted on
December 6, 2016, the resolution directs members of the Strategic Growth Council to achieve a
10 percent improvement of the Smart Location Score of new leases compared to the average
score of leased facilities in 2016.
State Administrative Manual & Management Memos The following Management Memos (MM) currently impose requirements for green operations on
the department under the Governor’s executive authority:
• MM 15-04: Energy Use Reduction for New, Existing, and Leased Buildings - This MM
provides direction to all State agencies to reduce and to report energy use in: new
building design and construction, major alterations and additions (new buildings and
renovations), existing state-owned buildings (existing buildings), and new and
renegotiated state building leases (building leases).
• MM 15-06: Building and Grounds Maintenance and Operation - This MM provides State
building and facility managers with practices and procedures to achieve operational
efficiencies and resource conservation measures for: Integrated Pest Management (IPM),
Drought Moratorium, Landscaping Practices, and Maintenance of Building Exteriors,
Roofs, Hardscape, and Exterior Painting.
• MM 14-05: Indoor Environmental Quality: New, Renovated, and Existing Buildings - This
MM announces policy and provides direction to State agencies that build, lease, and
operate State buildings, on reducing indoor pollutant levels and ensuring healthful
indoor environments for occupants in new, renovated, leased, and existing State
buildings, as directed in Governor’s EO B-18-12 and the Green Building Action Plan.
• MM 14-07: Standard Operating Procedures for Energy Management in State Buildings -
This MM amends the Standard Operating Efficiency Procedures regarding efficient
energy management in State buildings during normal operations, as specified in EO B-18-12 and the Green Building Action Plan.
II. GREEN OPERATIONS REPORT
Greenhouse Gas Emissions State agencies are directed to take actions to reduce entity-wide GHGe by at least 10 percent by
2015 and 20 percent by 2020, as measured against a 2010 baseline.
CDCR is on track to meet the 20 percent goal by
2020 based upon the 2010 baseline. However, CDCR
had previously set a 2007 baseline and based upon
that has already exceeded the 20 percent goal by
GREENHOUSE GAS EMMISSIONS Reduced by 27% since 2010

28
almost 10 percent despite a 17 percent increase in total institutional square footage. CDCR will
continue to strive for further reductions and plans to achieve them through the efforts
described below.
Energy Efficiency
CDCR has engaged in a collaborative effort through the California Investor-Owned Utilities
(IOU)/CDCR Energy Efficiency Partnership Program to improve energy efficiency since 2008. As
of December 2017, CDCR has completed 105 energy efficiency projects that have yielded a
combined GHGe reduction of 68,888 metric tons per year and an annual cost savings of
$8,450,670.
CDCR will continue to utilize energy efficiency projects to reduce GHGe. Looking beyond 2017,
CDCR has identified 70 future energy efficiency projects. These projects are expected to
provide annual cost savings of $1,601,611 and additional GHGe reductions of over 9,500 metric
tons per year.
On-Site Renewable Energy
Through third-party Solar Power Purchase
Agreements (SPPA), CDCR has completed 16
on-site renewable solar generation projects at
12 institutions totaling 33.6 megawatts
(MW AC).
CDCR recently awarded 20 solar projects,
which will provide an additional 53 MW of
solar energy. CDCR also awarded three wind
turbine projects that will provide 5.6 MW of
renewable wind energy, the only California
state agency with plans to install wind energy.
CDCR will continue to utilize renewable energy projects to reduce GHGe and is currently
considering 7 additional institutions for solar installations for an additional 33 MW of
renewable energy generation. CDCR's statewide renewable energy portfolio is positioned to
exceed 125 MW by the end of 2020 as shown in Table 9.
Table 9- CDCR Renewable Energy Portfolio
Institution Completed Solar (MW)
Awarded/In Construction Solar (MW)
Future Planned Solar
(MW)
Wind Generation
(MW)
ASP 0 0 8.00 0
CAL 0 5.00 0 0
CCI 2.33 4.00 0 0
CCWF 2.50 2.00 0 0
CEN 0 5.00 0 0
CHCF/NCYCC 0 0 5.00 0
Figure 5- Solar Array at PVSP

29
Institution Completed Solar (MW)
Awarded/In Construction Solar (MW)
Future Planned Solar
(MW)
Wind Generation
(MW)
CIW 0 1.00 0 0
CMC 0 3.50 0 0
CMF 0 0 3.00 0
COR 5.00 0 0 0
CTC 0 0 1.00 0
CTF 1.00 2.00 0 1.85
CVSP 4.94 3.00 0 0
DVI 0 0 8.00 0
FSP/SAC 0 1.30 0 0
ISP 5.00 2.00 0 0
KVSP 0 3.00 0 0
LAC 2.00 2.40 0 1.85
MCSP 0 2.00 0 0
NKSP 5.00 0 0 0
PVSP 1.22 2.00 0 0
RJD 0 3.00 5.00 0
SCC 0 0 3.00 0
SOL 1.13 3.00 0 0
SVSP 2.00 3.50 0 1.85
VCYF 0 1.50 0 0
VSP 0 2.15 0 0
WSP 1.50 2.00 0 0
Totals 33.6 53.4 33.0 5.6
Grand Total 125.6
Purchased Renewable Energy
To date, CDCR has relied on the use of renewable energy produced on-site due to its substantial
landholdings but is considering purchasing renewable energy from other providers (Sacramento
Municipal Utility District and Marin Clean Energy) for institutions where land constraints are
present to increase its total energy delivered through renewable resources. However, CDCR is
participating in three Community Choice Aggregate programs; San Quentin is enrolled in Marin
Clean Energy’s Light Green program receiving 50 percent renewable energy, SVSP and CTF are
enrolled in Monterey Bay (MB) Community Power’s MB Choice program receiving 100 percent
renewable energy and LAC is enrolled in Lancaster Choice Energy receiving 38 percent
renewable energy.
Fuel Efficient Vehicles and Zero Emission Vehicles
CDCR’s light-duty fleet has increased the number of fuel-efficient vehicles over the last several
years. As of December 2017, CDCR has 653 traditional hybrid vehicles, 47 plug-in hybrids
vehicles and eight battery electric vehicles (BEV) as shown on the website State of California

30
Green Fleet. The Department is availing itself of utility companies’ grant programs and other
funding sources to install the requisite charging infrastructure and has already installed
charging stations at several prisons with more planned based on available funding.
In addition to the State-owned fleet, CDCR conducted a statewide survey of employees at its
institutions to determine the interest level in installing charging stations for the employee and
public parking lot. The results showed favorable support for this infrastructure and CDCR is
currently evaluating these options.
Looking forward, fuel-efficient vehicle purchases will continue to increase per the Department’s
Fleet Acquisition Plan, and opportunities to support other non-fleet vehicles with charging
needs will continue to be explored and implemented as the need increases and/or resources
permit.
Biofuels
CDCR operates a number of vehicles, equipment, and buildings systems that rely on diesel fuel.
The Department has recently increased its renewable diesel and other biofuel purchases where
feasible and will continue to explore additional opportunities to increase the Department’s
usage. For example, in 2016, CDCR purchased over 32,000 gallons of renewable diesel. As of
December 2017, CDCR has purchased over 175,000 gallons of renewable diesel, an increase of
almost 550 percent.
All of the above efforts in combination and others discussed in this report have led to
substantial reductions in the Department’s carbon footprint. Table 10 and below show the
GHGe reductions that CDCR has realized since 2007.
Table 10- GHG Emissions Since 2007
Natural Gas Vehicles
Purchased
Electricity Total
2007 Baseline 235,247 36,122 237,127 508,46
2010 Baseline 242,165 22,414 175,570 440,150
2011 236,345 61,861 211,632 509,839
2012 215,931 55,144 169,331 440,405
2013 210,379 25,424 171,434 407,237
2014 207,314 22,582 155,553 385,449
2015 192,601 20,222 136,501 349,324
2016 202,194 17,381 136,289 356,584
Percent Change since
2007 Baseline -14.05% -51.89% -42.54% -29.87%

31
Percent Change since
2010 Baseline -16.51% -22.46% -22.38% -18.99%
Building Design and Construction EO B-18-12 requires that all new buildings, major renovation projects and build-to-suit leases
over 10,000 square feet shall obtain LEED Silver certification or higher. All new buildings fewer
than 10,000 square feet shall meet applicable CALGREEN Tier 1 Measures. New buildings and
major renovations greater than 5,000 square feet are also required to be commissioned after
construction.
Since July 1, 2012, CDCR has 14 LEED BD+C certified new construction projects (including the
MCSP Level II Dorm Complex project completed in 2016) involving 59 buildings plus an
additional four leased buildings (totaling 11 with Gold and 51, Silver ratings). Additionally,
CDCR has renovated one existing building and leases two others, which earned LEED ID+C
Silver certifications.
All new buildings and renovations built since July 1, 2012 and the associated LEED level
achieved, along with post-construction commissioning (Cx) completed or planned, are listed in
Table 11 below.
Table 11- New Construction Since July 1, 2012
Project Name LEED Level Achieved Commissioning Performed (Y/N)
CIW - 45-Bed Mental Health Crisis Facility 1 Building, LEED BD+C Silver, 2013 Y
SAC - Enhanced Outpatient Program 1 Building, LEED ID+C Silver, 2013 Y
CMF - 64-Bed Mental Health Crisis Facility 1 Building, LEED BD+C Silver, 2013 Y
Graph 1- GHG Emissions Since 2007
0
50,000
100,000
150,000
200,000
250,000
300,000
2007 2010 2011 2012 2013 2014 2015 2016
CO
2e
(t)
CDCR Emissions Trend
Natural gas
Vehicles
Purchased Electricity

32
Project Name LEED Level Achieved Commissioning Performed (Y/N)
CMF - Enhanced Outpatient Program 1 Building, LEED BD+C Silver, 2013 Y
COR - ASU Enhanced Outpatient Program 1 Building, LEED BD+C Gold, 2014 Y
LAC - ASU Enhanced Outpatient Program 1 Building, LEED BD+C Gold, 2014 Y
CMC - 50-Bed Mental Health Crisis Facility 1 Building, LEED BD+C Gold, 2014 Y
SAC - Psychiatric Services Unit 1 Building, LEED BD+C Gold, 2014 Y
SVSP - Enhanced Outpatient Program 1 Building, LEED BD+C Gold, 2014 Y
CHCF - Materials Service Center 1 Building, LEED BD+C Gold, 2014 Y
CHCF - Central Utility Plant 1 Building, LEED BD+C Gold, 2014 Y
CHCF - Various 31 Buildings, LEED BD+C Silver, 2014 Y
DNCA - Enhanced Outpatient Program 1 Building, LEED BD+C Silver, 2015 Y
DNCA - Material Unit Transfer 1 Building, LEED BD+C Silver, 2015 Y
MCSP - Level II Dorm Complex 12 Buildings, LEED BD+C Silver, 2016; 2 Buildings, LEED BD+C Gold, 2016
Y
RJD - Level II Dorm Facility In Progress, Goal of LEED BD+C Silver Cx Planned
ISP - Central Chiller Plant In Progress, Goal of LEED BD+C Silver Cx Planned
CCC - HCFIP (Sub-project 4) In Progress, Goal of LEED BD+C Silver Cx Planned
CMC - HCFIP (Sub-project 4) In Progress, Goal of LEED BD+C Silver Cx Planned
CMC - HCFIP (Sub-project 6) In Progress, Goal of LEED BD+C Silver Cx Planned
FSP - HCFIP (Sub-project 3) In Progress, Goal of LEED BD+C Silver Cx Planned
SAC - HCFIP (Sub-project 3) In Progress, Goal of LEED BD+C Silver Cx Planned
SOL - HCFIP (Sub-project 1) In Progress, Goal of LEED BD+C Silver Cx Planned
CIM - 50-Bed Mental Health Crisis Facility In Progress, Goal of LEED BD+C Silver Cx Planned
RJD - 50-Bed Mental Health Crisis Facility In Progress, Goal of LEED BD+C Silver Cx Planned
State agencies, such as CDCR, are required to implement mandatory measures and relevant and
feasible voluntary measures of the California Green Building Standards Code (CALGREEN),
Part 11, related to indoor environmental quality (IEQ) that are in effect at the time of new
construction or alteration and shall use adhesives, sealants, caulks, paints, coatings, and
aerosol paints and coatings that meet the volatile organic chemical (VOC) content limits
specified in CALGREEN.

33
CDCR supports the implementation of EO B-18-12, LEED, CALGREEN Tier 1, and commissioning
requirements by ensuring those requirements are clearly laid out for new construction projects.
The Department’s standard Architect and Engineering Contract of Services includes language
mandating the incorporation of Governor’s EO B-18-12, including the Green Building Action
Plan, and requiring compliance with CALGREEN Code. In addition, CDCR’s Sustainable Design
Guidelines (Design Criteria Guidelines Manual – Volume II – Appendix J) provides additional
information outlining the requirements for LEED Silver certification for new and major
renovations >10,000 square feet (sf), commissioning for new construction and renovations
>5,000 sf with an Energy Usage Index (EUI) of 50 kBTU/sf or larger, and for all new construction
and renovations >10,000 sf.
Several projects, currently in construction, have completed a Green Building Compliance Report
during the Schematic Design Phase which details how each of the requirements of EO B-18-12,
including the Green Building Action Plan, are proposed to be implemented. This report has only
recently been required by CDCR of its consultants for new construction. It includes LEED
requirements and a preliminary scorecard together with commissioning requirements for all
buildings >5,000 sf. This report also includes a CALGREEN checklist which describes how
projects need to comply with the mandatory requirements and which voluntary Tier 1
requirements are relevant and feasible together with the requirements for documentation to be
provided by the contractor to demonstrate compliance at the end of the project.
CDCR provides design consultants with Standard Design Document (SDD) specification sections
that are available for use on a project. The SDD specifications already include the requirements
for LEED submittals and certification as part of Section 01 81 13 SUSTAINABLE DESIGN
REQUIREMENTS. CDCR’s standard sustainable design specification has been edited to include
the general requirements and procedures for compliance with CALGREEN on certain projects.
This specification requires the maintaining of a comprehensive LEED and CALGREEN file
electronically with verification documentation for each LEED and CALGREEN measure. In
addition, modifications to Sections 01 74 19 CONSTRUCTION WASTE MANAGEMENT AND
DISPOSAL and 01 81 22 INDOOR AIR QUALITY PROTECTION BEFORE OCCUPANCY were
updated to include CALGREEN requirements. CDCR also has two specification sections that
address recycled content, which require the contractor to track and report recycled-content
products for procured materials and submit Waste Reduction Reports.
Figure 6- California Health Care Facility

34
Incorporating Indoor Environmental Quality (IEQ) Provisions of CALGREEN Tier 1
CDCR’s sustainable guidelines help designers understand the project requirements in relation
to sustainability. CDCR’s sustainable guidelines state that all relevant and feasible voluntary
measures from Divisions A4.5 and A5.5 of the California Green Buildings Standards Code
should be implemented.
Voluntary measures for Tier 1 for IEQ CALGREEN include increased testing of indoor air quality,
more stringent formaldehyde requirements, VOC limits and verification for acoustical ceilings
and wall panels, use of entryway systems and isolation of pollutant sources, increased air
filtration (MERV 11), additional lighting and thermal comfort controls, increased consideration
for additional daylight and view requirements, no hydrochlorofluorocarbons (HCFCs), and
requirements for hydrofluorocarbons (HFCs). Mandatory Tier 1 measures include additional
requirements for resilient flooring and thermal information together with verification of code
compliance.
As discussed previously, some projects currently in
construction have completed a Green Building Compliance
Report during the Schematic Design Phase. Specific
updates made to Sections 01 81 13 SUSTAINABLE DESIGN
REQUIREMENTS and 01 81 22 INDOOR AIR QUALITY
PROTECTION BEFORE OCCUPANCY also support the IEQ
provisions of CALGREEN Tier 1 to include no additional
formaldehyde, VOC limits and verification for acoustical
ceilings and wall panels, thermal insulation improvements
and verification and building flush-out. These were the
CALGREEN Tier 1 measures identified for the program as
being relevant and feasible. Tier 1 measures that were
identified as not feasible in a correctional environment
included entryway systems, daylight, and views
requirements. CDCR will continue to explore Tier 1 measures that can be incorporated in select
buildings that are not correctional in nature and/or are outside of the secure perimeter in
future projects.
LEED for Existing Buildings Operations and Maintenance (LEED O+M) All state buildings over 50,000 square feet were required to complete LEED O+M certification by
December 31, 2015 and meet an Energy Star rating of 75 to the maximum extent cost effective.
CDCR staff has identified 23 buildings over 50,000 sf that will require LEED O+M certification.
However, there are multiple challenges in achieving this goal:
• The United States Department of Energy, which established the Energy Star program,
does not have established energy star criteria for correctional facilities. Without this,
CDCR cannot achieve any energy star rating and hence a LEED O+M designation. This
requires a change at the federal level, which CDCR intends to pursue along with other
state correctional agencies.
Figure 7- IEQ Monitoring During Construction at PVSP
35
• USGBC LEED O+M Minimum Energy Performance Prerequisite requires that each
building’s energy use must be metered for a full 12 months of continuous operation.
CDCR institutions commonly have only one utility meter for the entire institution so
building sub-meters must first be installed.
• The cost of installing these sub-meters must be planned over multiple fiscal years.
• CDCR also utilizes high-security protocols for information systems that must be
coordinated with any data transmissions from the new sub-meters.
However, despite these challenges, CDCR is working closely with an Energy Service Company,
institution staff, and CDCR’s Enterprise Information Services staff and has begun the process of
installing sub-meters at select buildings with others planned in the future.
Table 12- LEED for Existing Buildings and Operations
Number of Buildings over 50,000 sf and eligible for LEED O+M 23
Number of Building over 50,000 sf that have achieved LEED O+M 3 in process
Percentage of buildings over 50,000 sf required to achieve LEED O+M that have achieved it
0
Moving forward, CDCR will continue to install building sub-meters at the remaining 20 LEED
O+M eligible buildings based upon funding availability. Additionally, CDCR includes the
installation of building sub-meters in the design of all new construction and rehabilitation
projects, which will facilitate future LEED O+M certification.
Indoor Environmental Quality (IEQ) When accomplishing Alterations, Modifications, and Maintenance Repairs, and when relevant
and feasible, State agencies shall implement the mandatory and voluntary measures of the
California Green Building Standards Code (CALGREEN), Part 11, related to indoor environmental
quality. Indoor Environmental Quality must also be maintained by using low-emitting
furnishings, cleaning products and cleaning procedures.
New Construction and Renovation
To ensure healthy indoor environments for occupants, CDCR’s Sustainable Design Guidelines
(Design Criteria Guidelines Manual – Volume II – Appendix J) require relevant and feasible
voluntary measures from Divisions A4.5 and A5.5 of CALGREEN,
which relate to Environmental Quality. As laid out above, steps
have been taken to improve the process for ensuring voluntary
measures related to IEQ are implemented in all building projects
by including specific requirements which relate to IEQ in the
specifications. These requirements include requiring submittals
for product data indicating VOC content for adhesives and
sealants applied inside the weatherproofing barrier, paints and
coatings, and applied on-site. They also include the requirements

36
for VOC limits for adhesives, sealants, caulks, paints, coatings, flooring systems, thermal
insulation, and acoustic panels.
FPCM plans to implement additional steps by December 31, 2018 to institutionalize the use of
these standards including:
• Updating the standard specifications used on all new construction and major renovation
projects to incorporate CALGREEN submittal/calculation requirements.
• Updating standard specifications used on all new construction and major renovation
projects to require a Construction Management Plan be completed together with outside
airflow monitoring.
• Requiring a Green Building Compliance Report for all new construction and major
renovation detailing compliance with EO B-18-12 and the inclusion of LEED/CALGREEN
checklists (as applicable).
• Requiring local air quality at the project site to be reviewed and appropriate level of
filtration recommended as per the Green Building Compliance Report.
• Requiring the CALGREEN checklist to be included in each package of drawings. At
100 percent Construction Documents (CDs), this checklist shall include reference to
plan sheets/specifications or attached calculations where the compliance can be
checked.
• CDCR performing design review at 100 percent CDs to verify the CALGREEN checklist is
complete and submitted with plans.
• CDCR performing design review at 100 percent CDs to verify CALGREEN
calculations/submittals are provided as per specification requirements.
• Requiring A/E to update the CALGREEN checklist following comments received and
re-submits for sign-off.
• Requiring the contractor to update the CALGREEN checklist following comments
received and re-submits for sign off.

37
CDCR also maximizes daylighting in new construction when
feasible by providing a direct line of sight to the outdoors via
windows, skylights, and clerestory glazing in 90 percent of all
regularly occupied areas, as well as using top-lighting, side-
lighting, light shelves, reflective room surfaces, various means
to eliminate glare, and photo sensor controls where feasible.
This can be a challenge in correctional facilities but design
teams should ensure these methods are incorporated for all
areas where possible.
Furnishings
Per MM 14-05, office furniture and seating is required to
comply with either:
• DGS’ Purchasing Standard and Specifications (Technical
Environmental Bid Specification 1-09-71-52, Section 4.7) or
• The American Society of Heating, Refrigerating and Air-Conditioning Engineers’
(ASHRAE) Standard 189.1-2011 (Section 8.4.2.5).
CALPIA manufacturing and associated products are compliant with DGS’ Purchasing Standard
and Specifications (Technical Environmental Bid Specification 1-09-71-52).
DGS has a modular systems furniture specification (DGS 7110-3045 REV. 6 Engineering &
Environmental Specification) which, under Section 5 Environmental specifications, establishes
the requirements and specifications for implementation of Environmentally Preferable
Purchasing (EPP) as mandated by the California Public Contract Code (PCC), Division 2, Part 2,
Chapter 6, Sections 12400-12404, and required by EO B-18-12. For seating, the State has DGS
Purchasing Standard 56112100 Seating, which in a similar manner sets out the Environmentally
Preferable Purchasing Requirements in line with EO B-18-12.
CDCR has begun development of a tracking program for its Project Management Branch and
consultants to report compliance with CALGREEN and LEED BD+C certification/qualification
status on their internal/consultant SharePoint website during design. This tracking process will
help support the verification of compliance with CALGREEN and LEED BD+C.
Figure 8- Clerestory Windows at SAC

38
The chart (Figure 9) below illustrates CDCR’s process to be implemented in 2018 to further
institutionalize the use of the standards mentioned.
Cleaning Products
CDCR utilizes ‘California Green’ cleaning products manufactured by the California Prison
Industry Authority (CALPIA). CALPIA products meet the Green Seal™ standard. Per section 2807
of the California Penal Code, CDCR must order items provided by CALPIA unless an exemption
has been approved.
Cleaning Procedures
CDCR employs inmates at its facilities to provide general cleaning. CDCR has
also been using CALPIA and inmates under its employ at all Health Care
facilities statewide through their Healthcare Facilities Maintenance (HFM)
program. HFM provides reliable, comprehensive, and innovative cleaning
services for California Correctional Health Care Services (CCHCS) and meets all
federal and California healthcare environmental standards. The CALPIA team
focuses on infection prevention and germ control by using a comprehensive program, which
includes training and hands-on supervision. CALPIA uses quality specialized cleaning products,
ensuring conformance to environmental services best practices and International Sanitary
Supply Association (ISSA) guidelines.
FPCM will consult with CDCR’s adult operations and CALPIA managers regarding the cleaning
programs and procedures to ensure that the requirements outlined in DGS MM 14-05 are
followed.
Figure 9- CDCR Process Flow

39
HVAC Operation
During construction, CDCR requires that HVAC systems provide no
less than the Minimum Outdoor Air Requirements and that buildings
are purged with outdoor air sufficient for three complete air changes
or the minimum ventilation rate allowed in Section 120.1(c)2 of Title
24 for 1 hour before occupancy of completed renovations or new
construction. This requirement for outdoor air monitoring will be
added to SECTION 01 81 13 SUSTAINABLE DESIGN REQUIREMENTS
to ensure this requirement is included on all projects per MM 14-05.
After construction and during normal operations, CDCR Plant
Operations staff at each institution performs HVAC system
maintenance and repair tasks per the schedules set in CDCR’s
Standard Automated Preventive Maintenance System (SAPMS), a computer-based system that
tracks all institution maintenance and work orders. SAPMS details work activities required
based typically on manufacturer’s recommendations. These activities include:
• Verification of minimum outdoor airflows using hand-held airflow measuring
instruments.
• Confirmation that air filters are clean and replaced based on the manufacturer’s
specified interval.
• Air filters have a Minimum Efficiency Reporting Value (MERV) rating of no less than 11.
• Verification that all outdoor dampers, actuators and linkages operate properly.
• Checking condition of all accessible heat exchanger surfaces for fouling and microbial
growth, with action taken if growth is found.
• Checking the first 20 feet of ductwork downstream of cooling coils for microbial
growth, with action taken if growth is found.
• Ensuring that cooling towers are properly maintained and that records of chemical
treatment are kept.
• FPCM will review SAPMS required tasks to ensure that they are also consistent with the
provisions of EO B-18-12 in 2018 and implement any required changes accordingly.
Integrated Pest Management (IPM) Department staff and contracted pest management companies are now required to follow an
integrated pest management (IPM) strategy that focuses on long-term prevention of pest
problems through monitoring for presence, improving sanitation, and using physical barriers
and/or other nonchemical practices. If nonchemical practices are ineffective, Tier 3 Pesticides
may be used, progressing to Tier 2 and then Tier 1 if necessary.
Figure 10- IAQ Monitoring During Construction at
SAC

40
CDCR has long-term pest management strategies in place either through a statewide contract or
at the individual institution level. The term IPM has not been specifically used by the
Department but the strategies are the same, beginning with monitoring, improved sanitation,
and installing physical barriers such as caulk before moving on to the use of chemicals. The
existing pest control contracts listed in Table 13 below expire on December 31, 2017 with the
new contract beginning January 1, 2018, which will include 26 institutions. The contracts
contain all of the strategies of an IPM and the term IPM will be added to the scope of work for
any new contracts.
The remaining eight institutions have their own certified pest control technician on staff and
each one has Operating Procedures in place that describe in detail the specific requirements of
each institution.
Table 13- Existing Pest Control Contracts
Pest Control Contractor Institutions IPM Specified (Y/N)
Tovar Termite and Pest Control CIM, CIW N
American Pest Control VYCF N
Cartwright Termite and Pest Control ASP, CAL, CCI, CEN, CHCF, COR, CTF, DVI, VSP, SATF
N
Waste Reduction and Recycling Organic waste makes up approximately one third of the 30 million tons of waste that are
currently sent to landfills within the State of California. In October 2014, Governor Brown
signed AB 1826 (Ch. 727, Stats. of 2014), requiring businesses and State facilities generating
eight cubic yards of organic waste or more per week to have an organic waste recycling
program. AB 1826 established progressive thresholds for the reduction of organic and solid
waste reaching landfills, with a statewide goal of 50 percent diversion of organic waste by 2020.
In order to achieve the mandates of AB 1826, CDCR is
working with the California Department of Resources
Recycling and Recovery to establish a comprehensive
program aimed at diverting food and green waste
from landfills. CDCR also executed a new master
services contract in 2017 to provide food and green
DIVERTED FROM LANDFILLS 23,000 tons of food and organic waste since 2014, enough to fill
3,066 dump trucks

41
waste recycling services statewide. CDCR has experienced challenges in complying with this
mandate mainly at its four desert institutions: CAL, CEN, CVSP, and ISP. CEN and CAL received
bids from contractors but due to the excessive costs, both facilities are planning to install
vermicomposting. For CVSP and ISP, there were five attempts to have a contractor bid on the
statewide contract to provide services, and all attempts failed to deliver any bidders. The next
steps will be to find alternative recycling solutions for these institutions. In addition, RJD
utilizes vermiculture to compost organic waste instead of diverting to the landfill.
Environmentally Preferable Purchasing State agencies are required to purchase and use environmentally preferable products (EPP) that
have a reduced effect on human health and the environment when compared with competing
goods that serve the same purpose, per CA Public Contract Code (PCC) 12200-12217.
Reducing Impacts
The environmental impact of the goods purchased by CDCR can sometimes be larger than the
impact of Department operations given its significant size and volume of transactions. CDCR is
committed to reducing the environmental impact of the goods and services purchased.
CDCR buyers are encouraged to purchase Green/EPP-compliant goods and goods with
post-consumer-recycled content whenever feasible. Additionally, service contracts require
contractors to self-certify that they will comply with PCC 12200.
Extensive and continued efforts have been put forth to improve CDCR’s State Agency Buy
Recycled Campaign (SABRC) compliance and reporting accuracy. The Office of Business Services
(OBS) is committed to continued participation in the Department of General Services’ (DGS)
Performance and Environmental Standards (PES) workgroup to enhance and
share knowledge and understanding of EPP purchasing standards and
contract language for use in solicitations. Additionally, CDCR OBS has
committed to participate in the Sustainable Purchasing Leadership Council
(SPLC) Benchmark Cohort Pilot to ensure CDCR buyers are kept up-to-date on
the latest in supply chain sustainability. OBS believes the SPLC Benchmark
Cohort Pilot will assist buyers in understanding how to efficiently and accurately incorporate
sustainability in their procurement decisions.
CDCR is working toward implementation of consolidated orders to create ease of ordering,
reduce costs, and decrease deliveries per commodity. OBS encourages EPP purchasing through
statewide contracts using SABRC-compliant products. OBS is taking additional steps to create
policy that will require inclusion of DGS purchasing standards and specifications for select
commodity purchases. OBS is streamlining processes and in many instances removing paper
forms. OBS will continue to provide EPP training as needed.
CDCR ensures purchases are EPP-compliant for the following categories:
• Paint (i.e. master painter’s institute certified paint and recycled paint)
o Buyers are encouraged to utilize the Green/EPP-compliant statewide contract for
recycled paint whenever feasible.

42
• Janitorial supplies and cleaners (EcoLogo, Green Seal certified cleaners, DGS_471318A
Purchasing Standard compliant)
o OBS requires that all institutions with sub-delegated purchasing authority
participate in the CDCR/CALPIA Centralized Procurement Program (CPP). CALPIA
cleaning products (janitorial, laundry, and kitchen) are purchased annually
through the CPP process and delivered to locations per an agreed-upon annual
delivery schedule. CALPIA products meet the EPP Green Seal standard, and
consolidated annual ordering reduces the need for small on-demand deliveries.
• Janitorial supplies, paper products (i.e., SABRC compliant and DGS_141117A Purchasing
Standard Compliant)
o OBS conducts quarterly consolidated solicitations on behalf of participating
institutions for toilet paper and paper towels. All of the toilet paper and paper
towels purchased through the consolidated ordering process are SABRC
compliant.
• Desk Lamps (DGS-391115-A Purchasing Standard compliant)
o CDCR buyers are encouraged to purchase Green/EPP compliant goods and goods
with post-consumer recycled content, whenever feasible (per policy).
• Office equipment (i.e. Electronic Product Environmental Assessment Tool (EPEAT)
compliant and EnergyStar rated printers, copiers and DGS_432121A Purchasing
Standard compliant for high-end multifunctional devices) and paper products (i.e.
Sustainable Forestry Initiative certified, SABRC compliant copy paper, DGS-441200-A
Purchasing Standard compliant)
o CDCR purchases Green/EPP/SABRC compliant equipment and copy paper from
the DGS statewide contract.
• Remanufactured toner cartridges (available from CALPIA and statewide contract
ID/Number: 1-15-75-61)
o CDCR purchases SABRC compliant toners from the statewide contract and
CALPIA whenever feasible.
Measure and Report Progress
Institutions utilize contracted vendors for diversion of their organic waste. Monthly tonnage is
reported to the Energy and Sustainability Section (ESS) by each vendor equal to the sum of that
month’s weight receipts from each pick up. These amounts are recorded and maintained by ESS
to track the total amount of waste diverted from each institution. ESS is working with CDCR’s
project management consultant to develop dashboard reports on the Facility Records and
Management Enterprise (FRAME) site to show CDCR’s organic waste diversion efforts.
CDCR’s OBS department trains buyers in the benefits of buying EPP products and how to apply
best practices and standard specifications to procurements. OBS is also taking steps to create
policy that will require the inclusion of DGS purchasing standards and specifications for select
commodity purchases. Currently OBS is developing a policy that will increase the use and

43
oversight of the DGS Purchasing Standard DGS-411200-A when competitively soliciting bids for
copy paper. OBS commits to finalizing and implementing this policy in the summer of 2018.
CDCR’s OBS participates in the PES workgroup and SPLC and provides knowledge transfer to
the buyers.
CDCR only tracks SABRC and does not currently have an EPP tracking mechanism in place. OBS
will collaborate with the Enterprise Information Systems staff to develop EPP identification and
tracking methods within the purchase order in the Systems Applications and Products (SAP)
program. EPP data entered into the purchase order can then be accessed in the State Contract
and Procurement Registration System (SCPRS).
Extensive and continued efforts have been put forth to improve CDCR’s SABRC compliance and
reporting accuracy. OBS facilitates and includes SABRC training in annual training efforts. OBS
also has an analyst tasked with oversight of SABRC compliance for all CDCR entities with
sub-delegated purchasing authority. Table 14 below details CDCR’s performance in the SABRC.
Table 14- State Agency Buy Recycled Campaign (SABRC) - 2016 Performance by CDCR
Product Category SABRC Reportable
Dollars SABRC Compliant
Dollars % SABRC
Compliant
Antifreeze $6,275.62 $1,736.50 27.67%
Compost and Mulch $38,412.71 $20,366.39 53.02%
Glass Products $679,746.42 $290,146.68 42.68%
Lubricating Oils $198,056.73 $108,762.11 54.91%
Paint $661,119.16 $222,849.07 33.71%
Paper Products $7,230,917.86 $5,654,852.96 78.20%
Plastic Products $7,382,966.87 $4,638,987.77 62.83%
Printing and Writing Paper $3,225,009.20 $1,977,744.21 61.33%
Metal Products $30,960,081.27 $18,490,385.85 59.72%
Tire Derived Products $164,082.30 $45,786.77 27.90%
Tires $657,969.11 $1,200.23 0.18%
Totals $51,204,637.25 $31,452,818.54 61.43%
OBS requires all entities with sub-delegated purchasing authority to submit individual SABRC
reports annually to CalRecycle. OBS verifies and monitors each entity’s SABRC
data and overall compliance. This process enables OBS to identify and address
non-compliant categories more efficiently. The OBS SABRC analyst provides
individual training on an as-needed basis to assist entities with sub-delegated
purchasing authority in SABRC compliance.
OBS’ ongoing strategy to achieve the 50 percent minimum goal in each
category is to:
• Work with the BIS team to enhance reporting capabilities and accuracy in SAP.

44
• Increase oversight of locations with sub-delegated purchasing authority through a
quarterly review process.
• Research commonly purchased non-SABRC compliant commodities and identify
comparable SABRC compliant products.
• Inform buyers of the research results and encourage them to purchase the SABRC
compliant products.
This strategy, in conjunction with enhancing the use of SABRC compliant specifications and
DGS Purchasing Standards, will put CDCR on the path to achieving the 75 percent SABRC goal
by 2020.
Sustainability Development and Education
CDCR promotes the understanding and advancement of sustainable procurement both
internally and with external suppliers by including language in all service contracts to ensure
bidders/contractors are aware of the EPP requirements. The following language is required by
DGS in their General Terms and Conditions, Exhibit C, and is also included in all CDCR
contracts:
“RECYCLING CERTIFICATION: The Contractor shall certify in writing under penalty
of perjury, the minimum, if not exact, percentage of post-consumer material as
defined in the Public Contract Code Section 12200, in products, materials, goods, or
supplies offered or sold to the State regardless of whether the product meets the
requirements of Public Contract Code Section 12209. With respect to printer or
duplication cartridges that comply with the requirements of Section 12156(e), the
certification required by this subdivision shall specify that the cartridges so comply
with Public Contract Code Section 12205.”
As previously noted, OBS currently has one analyst tasked with SABRC compliance and
reporting for all entities purchasing under CDCR’s non-IT goods purchasing authority. This
position is also tasked with PES workgroup and SPLC participation.
CDCR has confirmed that EPP training through the California Procurement and Contract
Academy (CALPCA) has not been offered since 2013 and is not currently available for staff to
complete. If/when DGS CALPCA offers EPP training, CDCR will support training enrollment for
its buyers. CDCR currently has 62 employees assigned as buyers.
In addition to these efforts, CDCR has established sustainability coordinators at each of its
institutions and developed a website and other educational materials to promote a greater
understanding of CDCR’s sustainability efforts to increase awareness amongst its staff of how
employees can contribute in these efforts.
Location Efficiency Location efficiency refers to the effect of a facility’s location on travel behavior and the
environmental, health and community impacts of that travel behavior, including emissions
from vehicles. Locating Department facilities in location-efficient areas reduces air emissions
from State employees and users of the facilities, contributes to the revitalization of California’s

45
downtowns and town centers, helps the Department compete for a future workforce that
prefers walkable, bikeable and transit-accessible worksites, and aligns Department operations
with California’s planning priorities.
Location Efficiency is determined by the use of the Smart Location Calculator, which can be
found here: Smart Location Calculator. The Calculator provides a Smart Location Index (SLI),
which ranges in value from 0-100, where 0 indicates the least location-efficient site in the
region, and 100 indicates the most location-efficient site. These scores are relative to the region
and should not be compared across regions.
CDCR coordinates its leasing efforts with DGS, as it is the leasing authority for real property for
State Agencies. CDCR must take into account many factors when selecting new lease locations
and is faced with several constraints. The California Penal Code places limitations on the
locations of parole offices, such as maintaining a set number of miles away from schools, parks
and victim residences. In addition, parole offices should be in close proximity to the parolees
being served, or at least accessible by public transit.
The State of California currently offers partial reimbursements for State employees using
commuter buses or regional transit to encourage reducing commuter traffic, particularly in
urban areas. CDCR’s headquarters operations is located in Sacramento’s downtown core,
immediately adjacent to the city’s transit line which makes this means of commuting attractive
to the Department’s employees. This location also includes multiple vehicle charging stations
and includes on-site showers and bike storage for employees using this transit option. CDCR
recently added a free Bike Share program to employees at its headquarters’ location to use to
travel in and around the city during the weekday.
CDCR’s Leasing and Property Management Section works with the assigned DGS leasing
manager to analyze each potential location, its amenities, and other improvements. In the
future, CDCR will ensure that this process includes consideration of the location efficiency
score in selecting leased spaces. For example, if two or more spaces are available in an area
being considered, preference will be given to the space with the higher location efficiency score,
provided that the space meets all other departmental criteria and goals. CDCR’s goal is to
increase the average location efficiency score for all new leases to 10 percent higher than its
January 1, 2017 baseline. All new executed leases since January 1, 2017 are shown below in
Table 15.

46
Table 15- Smart Location Score for New Leases
The lowest scoring leases in CDCR’s portfolio are shown below in Table 16. The two
Sacramento locations are just outside the core Sacramento metro area and were lease renewals
that were entered into years ago after the CDCR office needs exceeded the available space in its
downtown location. CDCR will continue to evaluate its lower scoring lease locations and market
availabilities in the Sacramento metro region for consolidation in future negotiations.
Table 16- Lowest Smart Location Score Leases
Facility Name Smart Location Calculator
Score
Sacramento FPCM/OBS/EIS/OPOS Office 28
Sacramento Accounting 28
Salinas Parole Office 39
Facility Name Smart Location Calculator
Score
Stockton Parole Office 83
Red Bluff Parole Office 74
Redding Parole Office 71
Sacramento Parole Office 67
West Covina Office of Correctional Safety 66
San Luis Obispo Parole Office 62
Riverside Parole Office 61
Irvine Parole Office 59
Salinas Parole Office 39
Sacramento Office (FPCM/OPOS/EIS/OBS) 28
Sacramento Accounting Office 28
Average / 2017 Baseline 58

47
CHAPTER THREE
ENERGY
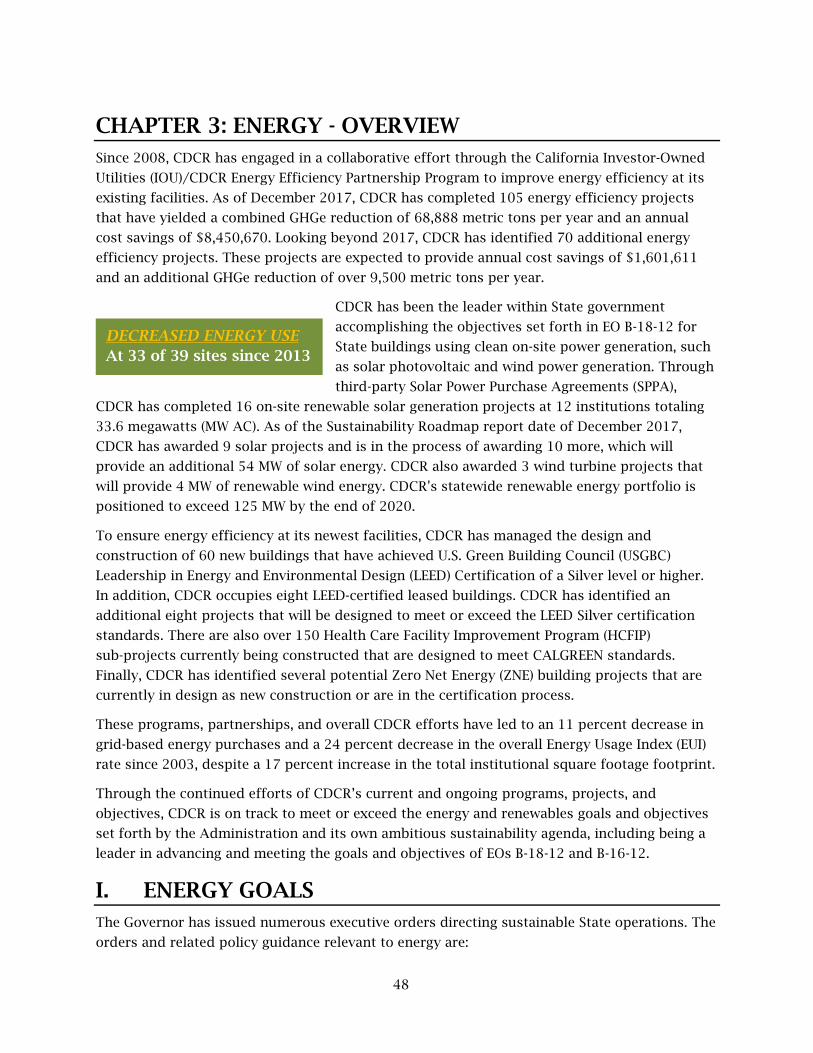
48
CHAPTER 3: ENERGY - OVERVIEW Since 2008, CDCR has engaged in a collaborative effort through the California Investor-Owned
Utilities (IOU)/CDCR Energy Efficiency Partnership Program to improve energy efficiency at its
existing facilities. As of December 2017, CDCR has completed 105 energy efficiency projects
that have yielded a combined GHGe reduction of 68,888 metric tons per year and an annual
cost savings of $8,450,670. Looking beyond 2017, CDCR has identified 70 additional energy
efficiency projects. These projects are expected to provide annual cost savings of $1,601,611
and an additional GHGe reduction of over 9,500 metric tons per year.
CDCR has been the leader within State government
accomplishing the objectives set forth in EO B-18-12 for
State buildings using clean on-site power generation, such
as solar photovoltaic and wind power generation. Through
third-party Solar Power Purchase Agreements (SPPA),
CDCR has completed 16 on-site renewable solar generation projects at 12 institutions totaling
33.6 megawatts (MW AC). As of the Sustainability Roadmap report date of December 2017,
CDCR has awarded 9 solar projects and is in the process of awarding 10 more, which will
provide an additional 54 MW of solar energy. CDCR also awarded 3 wind turbine projects that
will provide 4 MW of renewable wind energy. CDCR's statewide renewable energy portfolio is
positioned to exceed 125 MW by the end of 2020.
To ensure energy efficiency at its newest facilities, CDCR has managed the design and
construction of 60 new buildings that have achieved U.S. Green Building Council (USGBC)
Leadership in Energy and Environmental Design (LEED) Certification of a Silver level or higher.
In addition, CDCR occupies eight LEED-certified leased buildings. CDCR has identified an
additional eight projects that will be designed to meet or exceed the LEED Silver certification
standards. There are also over 150 Health Care Facility Improvement Program (HCFIP)
sub-projects currently being constructed that are designed to meet CALGREEN standards.
Finally, CDCR has identified several potential Zero Net Energy (ZNE) building projects that are
currently in design as new construction or are in the certification process.
These programs, partnerships, and overall CDCR efforts have led to an 11 percent decrease in
grid-based energy purchases and a 24 percent decrease in the overall Energy Usage Index (EUI)
rate since 2003, despite a 17 percent increase in the total institutional square footage footprint.
Through the continued efforts of CDCR’s current and ongoing programs, projects, and
objectives, CDCR is on track to meet or exceed the energy and renewables goals and objectives
set forth by the Administration and its own ambitious sustainability agenda, including being a
leader in advancing and meeting the goals and objectives of EOs B-18-12 and B-16-12.
I. ENERGY GOALS The Governor has issued numerous executive orders directing sustainable State operations. The
orders and related policy guidance relevant to energy are:
DECREASED ENERGY USE At 33 of 39 sites since 2013

49
Executive Order B-18-12 EO B-18-12 and the companion Green Building Action Plan require State Agencies to reduce the
environmental impacts of State operations by lowering GHGe, managing energy and water use,
improving indoor air quality, generating on-site renewable energy when feasible, implementing
environmentally preferable purchasing, and developing the infrastructure for electric vehicle
charging stations at State facilities. The Green Building Action Plan also established two
oversight groups; the staff level Sustainability Working Group and the executive level
Sustainability Task Force, to ensure these measures are met. MM 17-04 also provides related
requirements and guidance for meeting Zero Net Energy (ZNE).
Executive Order B-30-15 EO B-30-15 declared climate change to be a threat to the well-being, public health, natural
resources, economy, and environment of California. It established a new interim statewide
GHGe reduction target of 40 percent below 1990 levels by 2030 and reaffirms California’s
intent to reduce GHGe by 80 percent below 1990 levels by 2050. To support these goals, this
order requires numerous State Agencies to develop plans and programs to reduce emissions.
State Administrative Manual & Management Memos The following sections of the State Administrative Manual (SAM), and associated MMs, currently
impose sustainability requirements on the Department under the Governor’s executive
authority:
• SAM Chapter 1800: Sustainability – This SAM chapter provides the policies and
guidelines put in place pursuant to the Green Building Action Plan accompanying EO B-
18-12. In partnership with other State Agencies, the Department of General Services
(DGS) develops policies and guidelines for the operation and maintenance of State
buildings to achieve operating efficiency improvements and water and resource
conservation, and continually incorporates them into SAM.
• MM 15-06: State Buildings and Grounds Maintenance and Operation - This MM provides
State building and facility managers with practices and procedure achieve operational
efficiencies and resource conservation measures for: Integrated Pest Management (IPM),
Drought Moratorium, Landscaping Practices, and Maintenance of Building Exteriors,
Roofs, Hardscape, and Exterior Painting.
• MM 15-04: Energy Use Reduction for New, Existing, and Leased Buildings - This MM
provides direction to all State Agencies to reduce and to report energy use in: new
building design and construction, major alterations and additions (new buildings and
renovations), existing state-owned buildings (existing buildings), and new and
renegotiated State building leases (building leases).
• MM 15-03: Minimum Fuel Economy Standards Policy - This MM announces a revision to
SAM section 3620.1, which sets a fuel economy standard for passenger vehicles and
light duty trucks [under 8,500 pounds gross vehicle weight rating (GVWR)] that are
purchased on behalf of, or by State offices, agencies, and departments. It states that
effective July 1, 2015, the combined annual purchases by each State entity of passenger

50
vehicles and light duty trucks shall meet the new minimum State average fuel economy
standard of 38 miles per gallon (MPG) for passenger vehicles and 22.2 MPG for light
duty trucks, vans and sport utility vehicles established pursuant to SAM Section 3620.1.
• MM 14-05: Indoor Environmental Quality: New, Renovated, And Existing Buildings - This
MM announces policy and provides direction to State Agencies that build, lease and
operate State buildings, on reducing indoor pollutant levels and ensuring healthful
indoor environments for occupants in new, renovated, leased, and existing State
buildings, as directed in Governor’s EO B-18-12 and the Green Building Action Plan.
• MM 14-07: Standard Operating Procedures for Energy Management in State Buildings -
This MM amends the Standard Operating Efficiency Procedures regarding efficient
energy management in State buildings during normal operations, as specified in EO B-18-12 and the Green Building Action Plan.
• MM 14-09: Energy Efficiency in Data Centers and Server Rooms - This MM provides
direction to all State Agencies to meet data center and server room energy efficiencies
as required in the Green Building Action Plan Section 10.7.
II. ENERGY REPORT This Energy Report demonstrates to the Governor, Legislature, and the public the progress the
Department has made toward meeting the State’s sustainability goals related to energy. This
report identifies accomplishments, ongoing efforts, and outstanding challenges.
Department Infrastructure • Correctional facilities must provide the confined inmate population with most of the
services available in a small city; the infrastructure includes a wide variety of essential
buildings and systems including: housing units, kitchen and dining facilities, medical,
dental, mental health and substance abuse treatment space, pharmacies, laboratories,
classrooms, chapels, libraries, recreation areas, vocational and industry space, firehouse,
laundry, warehouse, wastewater treatment and water plant operations, administrative
offices, staff training, and inmate and staff records space. All operations must occur in
a secure environment, requiring correctional facilities to have various features and
systems to provide both internal and perimeter security.
• The correctional facilities include complex and extensive energy, utility, and
telecommunications systems, as well as an electronic security infrastructure. In
addition, due to their size and often remote location, many operate their own potable
water and wastewater treatment systems. Some facilities have cogeneration that
produces part of their electrical power. Energy efficiency projects for the Department
must take into account the infrastructure needs of each institution before projects can
proceed. Table 17 below details the types of energy purchased by CDCR in 2016.

51
Table 17- Total Purchased Energy 2016 (excluding Renewables)
Purchased Utility Quantity Cost ($)
Electricity 545,900,201 kWh $ 60,140,136
Natural Gas 38,070,733 Therms $ 16,862,133
Propane 24,832 Gallons $ 22,552
Total Cost --- $ 77,024,822
It is important to quantify the energy intensity of each facility as detailed in Table 18. This
allows CDCR to review its priorities when evaluating opportunities.
Table 18- CDCR Institutions with Largest Energy Consumption (including Renewables)
Building Name Floor
Area (ft2) Site Energy
(kBTU) Site EUI
(kBTU/ft2-yr) Source EUI
(kBTU/ft2-yr)
Avenal State Prison (ASP) 1,671,840 356,086,996 213 213
California Institution for Men (CIM)
1,748,957 307,011,512 176 176
Richard J. Donovan Correctional Facility (RJD)
1,577,252 291,481,750 185 185
California Medical Facility (CMF) 1,178,055 282,375,349 240 240
California Correctional Center (CCC)
755,800 276,807,216 366 366
California State Prison-Sacramento (SAC)3
1,324,762 240,854,003 182 182
Substance Abuse Treatment Facility (SATF)3
1,681,956 234,123,610 139 129
California State Prison-Corcoran (COR)3
1,652,194 229,980,822 139 129
California Correctional Institution (CCI)
1,540,096 210,147,017 136 123
California Men’s Colony (CMC) 1,461,907 207,552,695 142 142
Total for Buildings in This Table
14,592,819 2,636,420,970 --- ---
Total for All Department Buildings
49,091,627 5,921,433,477 --- ---
% of Total (Buildings in This Table compared to Total of All Department Buildings)
30% 45% --- ---
• Given the data above, CCC has the highest energy intensity consumption. This is due to
the age of the facility (built in 1963), and antiquated equipment/systems. Currently,
CCC purchases electricity from Plumas Sierra Rural Electric Cooperative (PSREC), which
does not offer any financing options for implementing energy efficiency projects. CDCR
is planning to complete an energy audit in Fiscal Year 17/18 to identify potential energy
3 Where noted, utilities are shared between two institutions and data listed was generated by prorating the totals by the institutions’ 2016 square footage.

52
efficiency measures (EEMs) and associated costs. CDCR will then explore financing
opportunities to initiate and develop energy efficiency projects at this facility.
• ASP and RJD have cogeneration plants that use natural gas to produce electricity, and
thus the site energy consumption appears high; however, both of these facilities are
purchasing minimal electricity from the grid.
• CIM does not purchase significant amounts of energy from the grid. It is currently under
a 30-year Power Purchase Agreement (PPA) that provides both electricity and steam to
the facility. CDCR is currently working with DGS on a new seven-year contract to
continue purchasing energy off-the-grid.
• CMC is currently under development to have an energy-efficiency project that includes
interior and exterior lighting measures, as well as the replacement of dorm water
heaters. CDCR is planning to apply for a DGS revolving fund loan to implement this
project.
• COR has an Investment Grade Audit in process that will assist in prioritizing energy
efficiency opportunities that are cost effective. CDCR has reserved On-Bill Financing
(OBF) for these projects.
• SATF, CMF, SAC, and CCI are all being considered to receive the American Society of
Heating, Refrigerating and Air-Conditioning Engineers (ASHRAE) energy efficiency Level
II audits in order to assess opportunities at each of these facilities, such as installing
variable frequency drives on air handling units, as shown in below.
CDCR’s Challenges in Meeting State Goals
• Security – CDCR’s mission to improve public safety through law enforcement that
provides for the safe and secure incarceration of the State’s most serious and violent
felons and to provide parole supervision and develop and implement rehabilitative
strategies to successfully reintegrate offenders back into their communities is the first
priority of the Department. As such, security requirements sometimes limit the energy
efficiency options available to the Department. One example is that LED lighting is not
currently approved for use in inmate cells due to the metal strips found within the
lamps that can be used by the inmates as weapon stock. CDCR follows Design Criteria
Figure 11- Air Handling Unit Figure 12- Variable Frequency Drive
53
Guidelines (DCG) and policies that ensure safety and security for inmates, staff, and the
public. All new technologies must be analyzed, reviewed, and approved by the CDCR
Design and Environmental Services and Standards Branch (DESS).
• Needs of 24-hour operations – Unlike typical office environments that have limited
hours of operation, CDCR operates on a 24-hour basis, which is much longer than many
other State Agencies.
• Unique utility drivers – The size of CDCR institutions has created a need to function
independently of typical city-provided services. Unlike typical office building
environments, CDCR runs water and wastewater plants serving its facilities, and even at
times serves surrounding properties, both public and private. These systems are often
expensive to replace with higher efficiency systems, leading to increased costs until
sufficient funding is identified.
• Financing – Despite the challenge of implementing energy-related projects without a
budget line item specifically designated for energy efficiency, CDCR has been successful
in fulfilling many of the mandates of energy efficiency and sustainability. CDCR has
sought out various funding opportunities as they become available and has taken the
lead in promoting additional funding opportunities by participating in policy
discussions on topics such as OBF and On-Bill Repayment (OBR). CDCR has utilized
multiple funding opportunities including Green Seal $Mart loans, OBF, American
Recovery and Reinvestment Act (ARRA) loans, Energy Conservation Assistance Act
(ECAA) loans, and SPPAs.
o One challenge of the existing OBF program is a funding limitation of $1-$2
million per site and/or utility account, CDCR has had to limit the scope of energy
efficiency projects in order to remain under this cap. The IOUs are working with
CDCR and the California Public Utilities Commission (CPUC) to raise this limit
where feasible.
• Aging infrastructure – CDCR is not sufficiently funded to address its aging
infrastructure. Recent facility condition assessments conducted by a third party have
identified a backlog of infrastructure repairs and replacements at a cost of more than
$10 billion. Current funding levels are substantially insufficient to address this backlog
with efficiency projects competing for these fiscal resources as well. Where possible,
though, CDCR has tried to pair a needed infrastructure repair or replacement with an
energy efficiency opportunity that is third-party financed (i.e., loans, rebates, etc.) to
address both areas.
• Incentives for EEMs – Some of the potential measures that align with CDCR’s energy
efficiency goals no longer qualify for incentives, which exclude the measures from OBF.
A few examples include the replacement of incandescent lights with LED lights,
replacing exit signs, and replacing linear fluorescents with LEDs. If the measures do not
qualify for the incentive/OBF, then facilities that have outdated technology may not
have a project initiated unless alternate funding is available.
54
• Lack of designated Energy Star category for correctional facilities – To obtain LEED EB, a
property owner is required to achieve an Energy Star Rating of at least 75 percent;
however, the EPA’s Energy Star program does not have an established category for
correctional facilities.
• Networking capabilities – CDCR is limited on the availability of a connectivity backbone
to implement facility-wide energy management systems (EMS). The existing
infrastructure backbone is either not serviced any longer or only available for Health
Care services. Installation of EMS becomes cost-prohibitive if a backbone has to be
added as part of the cost of the energy efficiency project. Other networking paths will
have to be evaluated for feasibility and cost-effectiveness.
• Limited Operations and Maintenance budget – Each facility’s operation and maintenance
budget is based on the number of inmates housed there regardless of building square
footage. Each facility receives $277 per inmate per year as their respective annual
maintenance allowance. This can impact each facility’s ability to service its equipment as
needed in order to maintain maximum efficiency.
Some examples of CDCR’s promotion of the State’s energy and sustainability goals include:
• CDCR actively promotes these goals through its Going Green website and involvement
of these goals at the highest levels of the Department, in addition to participating in
many programs and winning several awards that promote sustainability goals.
o US EPA Green Power Partnership member
o Climate Registry member
o GO-Biz Electric Vehicle Infrastructure Task Force member
o Governor’s Sustainability Task Force and Drought Task Force member
o 2011 Pacific Gas & Electric Company (PG&E) Integration Award (incorporating
sustainability into operations)
o 2015 Winner of the Cool Planet Award from Southern California Edison (SCE) and
the Climate Registry
o 2017 Featured speaker on Sustainability at the American Correctional
Association (ACA) conference in San Antonio, Texas
o 2017 Attendee of California Climate Adaptation Forum
• Sixty+ LEED certified buildings completed.
• A demonstration project to test the efficiency of LED lighting of CDCR’s yards and
perimeters was conducted last year at Mule Creek State Prison (MCSP), measuring light
levels before and after, and customer satisfaction. This demonstration proved
successful and LED is now the Department’s standard for security high mast lighting
and exterior wall-mount fixtures.
• CDCR’s FPCM produces a monthly executive briefing document of all energy projects,
planned or in progress, to ensure CDCR executives are actively engaged in the

55
Department’s commitment to the State’s energy and sustainability goals. This report
tracks CDCR’s progress in meeting these goals and also identifies any challenges so they
can be resolved accordingly.
• CDCR is the first and only State Agency/department to solicit and award wind-generated
power for its facilities, with three projects totaling 5.5 MW in the planning or
construction phase.
• CDCR includes a third-party sustainability consultant as well as a commissioning agent
on its major construction projects to ensure compliance with its sustainability goals.
CDCR’s Five Year Capital Improvement Program CDCR prepares a Five Year Infrastructure Plan (Plan) which provides a narrative report
summarizing the Department’s Capital Outlay priorities that are anticipated over the next five
years. The Plan is submitted along with the fully developed Capital Outlay Budget Change
Proposals for the first year represented in the Plan, along with Budget Concept Statements for
each proposal for which funding will be pursued in the four subsequent out-years. The Plan
includes the following sections: Infrastructure, Division of Juvenile Justice, Facility
Maintenance, Energy, and Categorized Proposals (Fire/Life/Safety, Health Care, Housing, Adult
Programs, Security, Support Services, and Utilities).
CDCR also develops a Master Plan Annual Report (MPAR). This report includes proposed
projects contained in the Department’s most current Five Year Infrastructure Plan, active and
completed projects within the reporting period, and narrative sections on population, Gap
Chart, infrastructure, housing needs, adult healthcare, and institution project summaries.
CDCR’s efforts in energy management, sustainability, and conservation to meet the Governor’s
EOs, existing laws, and regulations are documented within these reports.
• The 2016 MPAR can be accessed at the link below.
2016 Master Plan Annual Report
Per California Penal Code Section 7000 and 7001 (provided
below), CDCR has the authority to plan and construct facilities
and renovations included within the Department’s master plan
(Five Year Infrastructure Plan). Depending on workload, CDCR
may delegate a portion of these projects to DGS, some of which
may be energy-related projects. CDCR and DGS project teams
conduct ongoing meetings to monitor this workload.
California Penal Code Section 7000
(a) The Department of Corrections and Rehabilitation shall prepare plans for, and construct facilities and renovations included within, its master plan for which funds have been appropriated by the Legislature.
(b) “Master plan” means the department's “Facility Requirements Plan,” dated April 7, 1980, and any subsequent revisions.

56
California Penal Code Section 7001
Any power, function, or jurisdiction for planning or construction of facilities or renovations
pursuant to the master plan, which is conferred by statute upon the Department of General
Services (DGS), shall be deemed to be conferred upon the department.
Zero Net Energy (ZNE) The Governor has set forth the following ZNE milestones for State buildings:
• 2020 – 50 percent of new construction & major renovations will be ZNE
• 2025 – 100 percent of new construction & major renovations will be ZNE
• 2025 – 50 percent of total existing building area will be ZNE
CDCR seeks to achieve ZNE at its institutions by reducing energy demand and maximizing
on-site energy generation, where feasible, without jeopardizing CDCR’s Mission. Projects must
be designed with EEMs and evaluated consistent with the ZNE Guidelines.
CDCR’s challenges in meeting the Governor’s ZNE goals:
• Magnitude - The size and age of many CDCR facilities results in high energy use
requiring substantial renewable power for offset.
• Location - Many CDCR institutions are in remote areas not in the IOU territories, which
restricts the funding sources available for EEMs. Additionally, many CDCR institutions
are in areas with climate concerns - extremes that lead to higher than average energy
use as well as difficult construction conditions much of each year.
• Security - Correctional security requirements restrict some power-saving measures such
as lighting level reductions in inmate-accessible areas and providing trellises or other
shade structures on exterior walls within the secure perimeters of the prisons.
• Land availability - CDCR has made great progress in achieving more renewable
generation through on-site solar fields at a significant number of its facilities, and
embarking on wind generation at a few select sites. However, some prisons do not have
the available land to achieve this and some of these sites may not be appropriate for
wind power generation due to environmental restrictions regarding bird habitat. Where
possible, CDCR has shifted to installing solar canopies in its parking lots despite some
initial concerns that these structures could “hide” suspicious activities on prison
grounds that may pose security challenges to CDCR.
• Deferred maintenance - With its aging portfolio, the challenge of ensuring that
50 percent of this existing stock meets ZNE requirements must be balanced with
limited funding available to meet the needs associated with aging and obsolescence.
CDCR’s approach to new construction to achieve the Governor’s ZNE goals for State buildings is
detailed in CDCR’s FPCM Project Procedures Manual (PPM) and DCGs. The following are
significant excerpts/paraphrases from each manual.

57
Project Procedures Manual on ZNE
Each project managed by CDCR’s Project Management Branch (PMB) must have a Project
Management Plan developed specifically for the project that will include and address each
element of the PPM. The Project Management Plan Guideline directs the following in its
Sustainable Design Guidelines (SDG) and ZNE article:
• The Project Director (PD) must review each project for incorporation of sustainable
design and ZNE Certification. In this review, the PD must identify the current EO and
version of USGBC’s LEED criteria applicable to the project, as well as outlining the
documentation that will be required under LEED and ZNE Certification and develop a
project-specific plan to implement sustainable design guidelines.
• During the establishment of the project scope and budget, CDCR will determine if the
project will be ZNE-certified and identify the method that renewable, on-site energy
generation will be provided.
• The PD must meet with CDCR’s Energy and Sustainability Section (ESS), determine the
most appropriate path for compliance with the current EO based on the options
identified in the CDCR SDG (ZNE-certified or exempt), and review project constraints
that may affect eligibility for ZNE Certification and/or use of sustainable practices.
Design and Construction Guidelines on ZNE
The CDCR’s SDG for use by State and contracted architectural and engineering firms designing
CDCR projects establishes general sustainable design principles for the design of correctional
facilities for CDCR, in accordance with current administrative directives, regulatory
requirements, and its policies. The SDG is incorporated into the DCG, and also serves as a
reference for the DCG as it relates to sustainability. The SDG is updated periodically to
incorporate new or revised documents that affect LEED certification requirements, ZNE
Certification, regulatory requirements, CDCR policies, and Title 24 requirements.
Key components relative to ZNE goals and mandates include:
• CDCR will self-certify ZNE compliance in accordance with the SDG.
• Fifteen key excerpts from EO B-18-12, its accompanying Green Building Action Plan, and
MM 15-04 are listed as applicable to CDCR design and construction.
• CDCR adopted definitions for “Zero Energy Building”, “Zero Energy Campus”, and “Zero
Energy Portfolio” consistent with the U.S. Department of Energy and the State of
California’s State Agency Compliance with EO B-18-12 definitions for ZNE.
• New buildings and major renovations will be evaluated separately from the existing
institutions’ buildings.
• New buildings and major renovation will exceed the requirements of Title 24, Part 6 –
Building Energy Efficiency Standards by a minimum of 15 percent, prior to the use of
on-site renewables.
• New buildings and major renovation will be provided sufficient metering to document
actual ZNE performance and support future Monitoring Based Commissioning (MBCx).

58
• New buildings and major renovation may utilize existing on-site energy generation for
ZNE, provided that the existing on-site generation is available and not designated for
other applications. If no on-site energy generation is available, the new building will
need to include new renewable energy generation to achieve ZNE.
• It is CDCR’s intent to maximize the total building area that is certified as ZNE at each
adult institution and youth facility, based on available on-site renewable energy
generation. CDCR reserves the right to exempt buildings from ZNE requirements if
public safety is jeopardized by pursuing ZNE certification.
• Existing institutions and youth facilities will be evaluated as a campus utilizing CDCR’s
Zero Net Energy Procedure that is part of CDCR’s FPCM PPM.
• Pursuant to the State authorized exemptions4, CDCR will exempt the following from ZNE
calculations:
o Site Security Lighting
o Lethal Electrified Fence
o Water Treatment
o Wastewater Treatment
• It is CDCR’s intent to comply with the ZNE requirements for State Agencies outlined in
EO B-18-12 for its portfolio of adult institutions and youth facilities. CDCR intends to
certify a minimum of 50 percent of existing building area throughout its entire
portfolio. However, with over 48 million square feet of existing buildings it will be
extremely challenging to improve the efficiencies or achieve the ZNE requirements for a
substantial portion of this inventory without a major influx of funding. Building area
will be determined by the values indicated in the Energy Star Portfolio Manager (ESPM)
database.
• CDCR’s designated ZNE projects will be certified as either ZNE buildings or ZNE
campuses (or potentially a ZNE portfolio). CDCR’s FPCM will utilize a reporting
document to track ZNE performance for the building, campus, or portfolio certified. The
document will track annual Total Energy Production and Total Energy Consumption for
each ZNE-designated project on a monthly basis for each calendar year at the
completion of the project. Table 19 (below) provides an overall review of the CDCR
portfolio while Table 20 details each ZNE project at each institution.
4 MM 14-07 Standard Operating Efficiency Procedures shall be followed to next extent they do not conflict with health and safety requirements or operations necessary for CDCR to fulfill its mission and responsibilities.

59
Table 19- Zero Net Energy Buildings
Status of ZNE Buildings Number
of Buildings Floor
Area (ft2)
Buildings in Design 1 ~375,000
Buildings in Construction 31 186,702
Buildings in Auditing Phase 8 39,606
Totals for ZNE Buildings 40 601,308
Totals for All Institutions 6,438 48,291,947 % ZNE .6% 1.2%
Table 20- Zero Net Energy Projects
Institution Project Name
Building Name Status Floor
Area (ft2)
California Correctional Institution
HCFIP SP#2
New Pharmacy and Laboratory Building In
Construction 2,205
HCFIP SP#5
Facility D Primary Care Clinic In
Construction 3,876
HCFIP SP#6
Facility E Primary Care Clinic In
Construction 3,876
Central California Women’s Facility
HCFIP SP#4
New Pharmacy In
Construction 2,244
California Men’s Colony
HCFIP SP#1
New West Facility Primary Care Clinic In
Construction 5,268
HCFIP SP#4
New East Facility Primary Care Clinic and Health Care Administration
Building
In Construction
13,044
HCFIP SP#5
New Pharmacy and Laboratory Building In
Construction 3,000
HCFIP SP#6
New East Facility ASU Primary Care and ASU-EOP Mental Health Clinic
In Construction
11,000
CSP, Corcoran HCFIP SP#2
New ASU Primary Care Clinic In
Construction 2,559
Correctional Training Facility
HCFIP SP#1
New Facility A Primary Care Clinic In
Construction 3,468
HCFIP SP#4
New Facility C Primary Care Clinic In
Construction 2,880
HCFIP SP#7
New Facility D Primary Care Clinic In
Construction 3,614
Chuckawalla Valley State Prison
HCFIP SP#3
New Health Care Administration and Health Records Building
In Construction
2,880
Folsom State Prison
HCFIP SP#1
New Minimum Support Facility Primary Care Clinic
In Construction
3,072
HCFIP SP#2
New Building 1 Primary Care Clinic In
Construction 3,268
HCFIP SP#3
New Central Health Services Building and Education Annex Building
In Construction
17,978
Ironwood State Prison HVAC Portion of Campus - Facilities A & B In Design ~375,000
CSP, Los Angeles County
HCFIP SP#1
New ASU Primary Care Clinic Construction
Complete, Auditing Phase
2,594

60
Institution Project Name
Building Name Status Floor
Area (ft2)
HCFIP SP#2
New Complex Primary Care Clinic (Facilities A & B)
Construction Complete,
Auditing Phase 5,573
HCFIP SP#3
New Complex Primary Care Clinic (Facilities C & D)
Construction Complete,
Auditing Phase 5,573
HCFIP SP#5
New Health Care Administration and Health Records Building
Construction Complete,
Auditing Phase 5,921
Mule Creek State Prison
HCFIP SP#2
New Clothing Exchange Buildings (Facilities A, B and C)
In Construction
5,357
HCFIP SP#3
New ASU Primary Care and ASU-EOP Mental Health Clinic
Construction Complete,
Auditing Phase 611
HCFIP SP#4
New Pharmacy and Laboratory Building Construction
Complete, Auditing Phase
2,471
North Kern State Prison
HCFIP SP#2
New Facility B Primary Care Clinic In
Construction 2,873
HCFIP SP#3
New Facility C Primary Care Clinic In
Construction 4,835
HCFIP SP#4
New Facility D Primary Care Clinic In
Construction 3,873
HCFIP SP#5
New Medication Distribution Rooms (Facilities B & D, 2 each)
In Construction
2,111
HCFIP SP#8
New Correctional Case Management Building
In Construction
5,038
Richard J. Donovan State Prison
HCFIP SP#1
New ASU Primary Care and ASU-EOP Mental Health Clinic
Construction Complete,
Auditing Phase 9,880
HCFIP SP#3/8
New Pharmacy and Dialysis Unit Building
In Construction
8,389
HCFIP SP#4
New Health Care Administration Building
In Construction
7,680
CSP, Sacramento
HCFIP SP#1
New Facility A PSU-ASU Primary Care Clinic
In Construction
6,578
HCFIP SP#3
New Central Health Services Building In
Construction 28,089
CSP, Solano HCFIP SP#1
New Complex Facility Clinic In
Construction 12,258
Salinas Valley State Prison
HCFIP SP#1
New ASU Primary Care Clinic In
Construction 2,687
Wasco State Prison
HCFIP SP#3
New Facility C Primary Care Clinic In
Construction 4,835
HCFIP SP#4
New Facility D Primary Care Clinic In
Construction 4,236
HCFIP SP#5
New Medication Distribution Rooms (Facilities B & D, 2 each)
In Construction
2,111
HCFIP SP#8
New Correctional Case Management and Health Care Administration Building
Construction Complete,
Auditing Phase 6,983

61
Solar Photovoltaics and Wind Generation with Respect to ZNE
It is the intention of CDCR to ensure that buildings are as energy efficient as possible before
applying renewable power to achieve ZNE per MM 2017-04 (Zero Net Energy for New and
Existing State Buildings). See example case in Figure 13.
Energy Efficiency Measures with Respect to ZNE
EEMs and issues that CDCR consider in the design of new buildings include:
• Site location
• Insulation on exterior vs interior, to expose thermal mass to occupied areas
• Phase change material (PCM) on walls or ceiling
• Shade trellis on walls
• Shading devices for windows
• Building orientation on the site
• Lighting Power Density
• Daylight controls
• Occupancy sensors
• Exterior lighting controls and type
• Daylighting, including solar tubes and high clerestory glass
• HVAC system type (e.g. Variable Refrigerant Flow)
• Heat pump water heater
• Heat waste reuse
• Plug load management
• Operating hours
• Thermal storage
• Energy cost
• Temperature comfort range
• Evaporative pre-cool outside air

62
Figure 13- CDCR Zero Net Energy Case Study
Health Care Administration Building (HCAB) at Chuckawalla Valley State Prison (CVSP), Blythe
CDCR’s first ZNE designed building was selected at
a site where a substantial photovoltaic (PV) array exists,
intending to apply a portion of the PV output towards
the ZNE requirement. More than 25 potential energy
efficiency measures (EEMs) and strategies were identified
for the CVSP HCAB. Each was analyzed using energy modeling to show the potential impact
on the current design. The results of this analysis are reported as potential changes in EUI,
energy cost, initial construction cost and estimated delta to the current estimated base
design cost, and other functional considerations.
The recommendations resulted in an additional forecasted energy use reduction of 19
percent compared to the 100 percent Design Development (DD) design. This means that 19
percent less PV will need to be allocated to meet the Net Zero goal. The recommended EEMs
have an immediate simple payback when the avoided cost of more PV is included in the
payback calculations. The team included the cost of avoided PV in all calculations to show
that lower EUI reduces the cost of PV needed to achieve ZNE. The EEMs evaluated consider
the project has completed DD and did not investigate changes to the orientation and massing
of the building.
The EEMs recommended for HCAB to achieve annual ZNE design include:
• R-19 wall insulation
• Viracon VNE 1-63 glazing, or performance equal
• Increased efficiency of HVAC
• Additional automatic lighting controls (photocells)
• Aggressive plug load management
The chart below demonstrates the monthly energy use of the 100 percent DD design and the
recommended ZNE design. Annual energy use reduction is 19 percent.

63
New Construction Exceeds Title 24 by 15 Percent All new State building construction over 5,000
square feet and major renovations are required
to exceed Title 24 by 15 percent. Although
prisons are specifically exempted under Title 24
(Part 6, California Energy Code for Non-Residential Buildings, current edition, Institutional
Group I buildings) due to their unique construction characteristics, CDCR has nonetheless
imposed Title 24 adherence and, in certain instances, this later standard of exceedance in
design criteria used by selected architectural firms. The following projects completed since
July 2012 were designed to meet this requirement:
• Dewitt Nelson Correctional Annex is now operating as the California Health Care Facility
(CHCF), Facility E. The Design Criteria for the Design-Build contract (CHCF DB3) was
established prior to July 2012 yet required energy models to be prepared as required by
Savings By Design (SBD) and required LEED certification for the two largest (greater than
10,000 sf) new buildings and site improvements. Those two buildings were each
required to demonstrate their design to reduce their building baseline energy profile by
at least 26 percent below a Title 24 minimum energy requirement baseline.
o SBD documents for the two new buildings document that the Whole Building
Approach to qualification was used and the minimum of three EEMs
incorporated resulted in a model exceeding Title 24 by 28.9 percent and
35.3 percent.
• Mule Creek State Prison (MCSP) Level II Dorm Complex (Data Pending)
• Richard J. Donovan (RJD) Level II Dorm Facility (Data Pending)
60+ USGBC® CERTIFIED BUILDINGS All LEED Silver® level or higher

64
Table 21- New Construction/Major Renovations Exceeding Title 24 by 15%
Projects Exceeding Title 24 by 15%
Number of Projects
Floor Area (ft2)
Completed Since July 2012 3 881,886
Under Design or Construction 34 423,679
Proposed Before 2025 2 92,155
Design and Construction Guidelines on Exceeding Title 24
As mentioned previously, the unique nature of correctional facility construction has allowed
CDCR facilities to be exempt under Title 24. However, CDCR has incorporated energy-efficiency
requirements into its design criteria documents. New construction and major renovation
projects in CDCR’s Five Year Infrastructure Plan, which are not exempted from Title 24, will be
designed to exceed Title 24 by 15 percent.
As previously stated, the SDG establishes general sustainable design principles for the design of
correctional facilities for CDCR and serves as a reference in regard to LEED and ZNE
certification, regulatory requirements, CDCR policies, and Title 24 requirements, among other
things.
• The SDG requires energy modeling to demonstrate that the project meets energy targets
established by EOs, CDCR, LEED energy-efficiency prerequisites and credits, and
requirements for SBD incentive applications.
• Design decisions must be based on energy modeling and life-cycle cost analysis.
Reduce Purchased Grid-Based Energy 20 Percent by 2018 EO B-18-12 requires State Agencies to reduce grid-based energy purchased by 20 percent by
2018, compared with a 2003 baseline.
CDCR is reducing its grid-based energy purchases through a variety of efforts, ranging from
energy-efficiency programs to LEED certification, renewable-energy installations to
Figure 14- Daylighting in MCSP Level II Dorms

65
environmentally preferred purchasing, and operation practices to maintenance. All of these are
integral to reducing CDCR’s load on the grid.
Institutional Operations and Maintenance
The CDCR Energy and Sustainability Section (ESS) maintains ongoing communications with all
institutions to ensure that each is aware of the requirements of the Green Building Action Plan.
The ESS updates the institutions on changes to energy and sustainability mandates at the
annual Associate Warden/Plant Managers conference. CDCR annually distributes Standard
Operating Procedures for Energy Management in State Buildings as a reminder of the specific
responsibilities for all CDCR employees.
CDCR’s Department Operations Manual and the Facilities Asset Management Branch (FAMB)
provide the operations and maintenance policies and procedures for all institutions. Each
institution is responsible for developing and updating a Plant Operations Manual. Included in
that Manual are detailed instructions for implementing a comprehensive maintenance program
in accordance with the specific needs of the facility. CDCR’s electronic Statewide Automated
Preventive Maintenance System (SAPMS) is used to track all preventive maintenance and repair
work for lighting, cooling and heating systems, kitchen equipment, mechanical systems,
electrical systems and all other equipment/repairs throughout each institution. SAPMS
currently relies heavily on the maintenance requirements needed to comply with regulations or
the requirements of the equipment asset itself. Given the budgetary challenges with the
operation and maintenance budget allocations, the majority of old and inefficient equipment,
such as incandescent lights, are replaced through attrition.
Due to the unique nature of CDCR’s facilities, there are limitations on the type of
energy-efficiency measures that can be implemented at each institution. Some constraints are:
• CDCR facilities operate on a 24/7 schedule so lighting and HVAC electricity usage
cannot be minimized outside of normal building hours.
• CDCR only has two facilities that have a facility-wide Energy Management System (EMS):
California State Prison - Corcoran and CHCF in Stockton. The majority of CDCR’s
building square footage is not air-conditioned and must comply with the DCG
established for each occupancy location and type, so there are few building HVAC
controls that can be set to allow for a ±2-degree fluctuation from the temperature set
point.
• CDCR must maintain lighting levels consistent with the DCG in interior and exterior
locations for security purposes, or in places where services, such as classrooms or
healthcare, are provided in accordance with the requirements of the tasks performed.
• CDCR has some incandescent lights in areas such as mechanical/electrical rooms,
janitor/storage closets, and restrooms. This lighting type is being replaced through
attrition or through energy-efficiency projects.
• Lighting controls are installed as part of energy projects. Most institutions have lighting
controls in areas that are not inmate accessible.

66
Department-wide Energy Trends
Compared to the baseline year of 2003, CDCR as of December 31, 2016, had a 17 percent
increase to the Department’s overall building area, which is expected to increase 20 percent by
the end of 2018. The total energy consumption for the Department is over 5.5 billion kBTU with
a site average EUI of 116.
For 2016, the energy usage decreased for 32 of CDCR’s State-owned facilities, increased for
12 facilities, and one facility with no EUI trend as it was new and has no 2003 baseline.
Department-wide, this represents a reduction of over half-a-billion kBTU’s and an 11 percent
decrease when compared to the 2003 baseline. The Department’s average site EUI rate has
continuously decreased as well. As previously noted in the challenges section, there currently is
no building-use type for prisons and presents a challenge when attempting a performance
comparison.
CDCR has saved millions of dollars given the two-prong approach taken to meet the goals of
EO B-12-18, including the implementation of energy-efficiency projects and entering into third
party PPAs. These methods provided cost savings to CDCR by ensuring permanent energy
reductions and by providing a pre-determined rate approach when purchasing renewable
energy.
Table 22- Department-wide Energy Trends (without Renewables)
Year Floor
Area (ft2) Total Site kBTU Consumption
Department Average Site EUI
Baseline Year 2003
41,457,027 6,339,377,948 153
2012 44,800,381 6,021,981,540 134
2013 46,644,879 6,097,589,607 131
2014 48,163,049 5,526,135,269 115
2015 48,291,977 5,650,116,677 117
2016 49,091,627 5,671,969,324 116
2017 TBD TBD TBD
2018 Goal 49,880,173 5,071,502,358 102
As Table 22 and the corresponding graphs indicate, the footprint of CDCR has grown by over
8.3 million square feet from 2003 to 2016 with further construction adding to this. Despite the
growth, and through extensive conservation and retrofit efforts, CDCR has consistently reduced
40,000,000
42,000,000
44,000,000
46,000,000
48,000,000
50,000,000
2000 2010 2020
Square Footage
5,400,000,000
5,600,000,000
5,800,000,000
6,000,000,000
6,200,000,000
6,400,000,000
20
02
20
06
20
10
20
14
20
18
kBTU Consumption
0
50
100
150
200
2000 2005 2010 2015 2020
Avg EUI
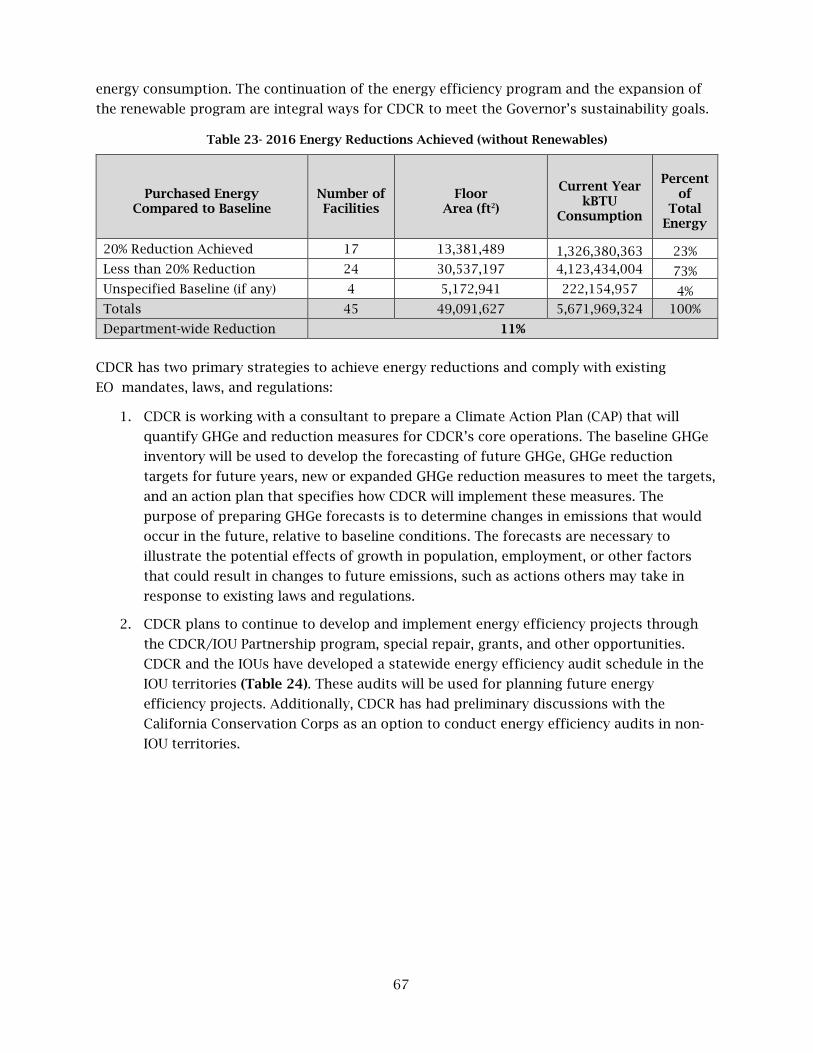
67
energy consumption. The continuation of the energy efficiency program and the expansion of
the renewable program are integral ways for CDCR to meet the Governor’s sustainability goals.
Table 23- 2016 Energy Reductions Achieved (without Renewables)
Purchased Energy Compared to Baseline
Number of Facilities
Floor Area (ft2)
Current Year kBTU
Consumption
Percent of
Total Energy
20% Reduction Achieved 17 13,381,489 1,326,380,363 23% Less than 20% Reduction 24 30,537,197 4,123,434,004 73% Unspecified Baseline (if any) 4 5,172,941 222,154,957 4% Totals 45 49,091,627 5,671,969,324 100%
Department-wide Reduction 11%
CDCR has two primary strategies to achieve energy reductions and comply with existing
EO mandates, laws, and regulations:
1. CDCR is working with a consultant to prepare a Climate Action Plan (CAP) that will
quantify GHGe and reduction measures for CDCR’s core operations. The baseline GHGe
inventory will be used to develop the forecasting of future GHGe, GHGe reduction
targets for future years, new or expanded GHGe reduction measures to meet the targets,
and an action plan that specifies how CDCR will implement these measures. The
purpose of preparing GHGe forecasts is to determine changes in emissions that would
occur in the future, relative to baseline conditions. The forecasts are necessary to
illustrate the potential effects of growth in population, employment, or other factors
that could result in changes to future emissions, such as actions others may take in
response to existing laws and regulations.
2. CDCR plans to continue to develop and implement energy efficiency projects through
the CDCR/IOU Partnership program, special repair, grants, and other opportunities.
CDCR and the IOUs have developed a statewide energy efficiency audit schedule in the
IOU territories (Table 24). These audits will be used for planning future energy
efficiency projects. Additionally, CDCR has had preliminary discussions with the
California Conservation Corps as an option to conduct energy efficiency audits in non-
IOU territories.

68
a. Through the IOU partnership, energy audits were originally performed in 2006
for the institutions within the IOU territories. Currently, CDCR and the IOUs are
working on a master schedule and prioritization of energy efficiency audits to
use as a planning tool for future energy efficiency projects. PG&E is reviewing
existing audit data, working with CDCR on prioritization, and planning for these
audits. Southern California Edison (SCE) is completing a comprehensive energy
audit at CCI and collaborating with CDCR on prioritization and the level of audit
details for the institutions within SCE territory. CDCR is exploring other energy
audit opportunities for the institutions that are not within the IOU territories.
Some of these opportunities include utilizing existing Architect/Engineer
retainers or the California Conservation Corps.
Energy Efficiency Program
CDCR leverages existing resources using strategic partnerships with California’s IOUs to assess
and implement energy efficiency projects, utilize rebates, and obtain zero-percent loans
through the partnership, as administered by the California Public Utilities Commission (CPUC)
for energy saving projects. CDCR also locates and secures grants, loans, incentives and rebates
for energy efficiency projects such as energy-efficient boilers (Figure 15).
Fiscal Year Total Department
Floor Area (ft2)
Energy Surveys Under Way (ft2)
Percent of Department Floor Area (ft2)
Level 1 Level 2 Level 1 Level 2
2005-2006 41,457,027 0 9,196,993 0 18%
2007-2008 41,457,027 0 5,252,136 0 10%
2016-2017 49,091,627 0 2,624,739 0 5%
2017-2018 49,521,833 0 36,134,439 0 72%
Table 24- Energy Surveys
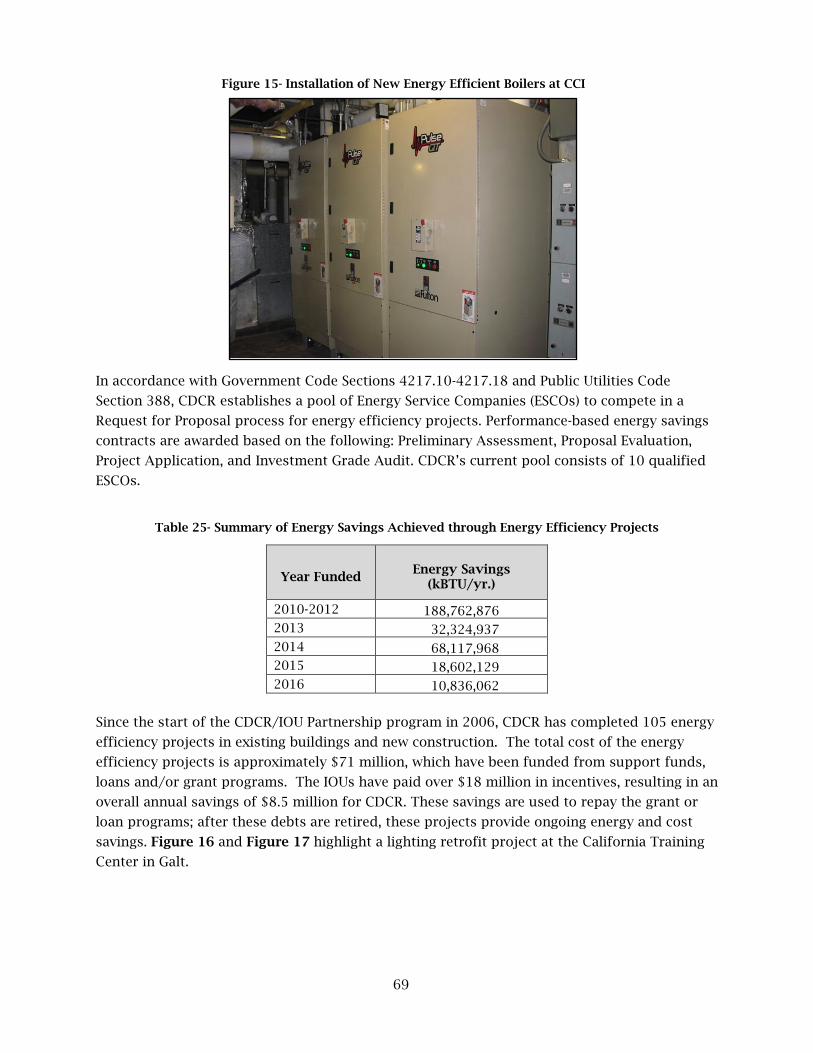
69
In accordance with Government Code Sections 4217.10-4217.18 and Public Utilities Code
Section 388, CDCR establishes a pool of Energy Service Companies (ESCOs) to compete in a
Request for Proposal process for energy efficiency projects. Performance-based energy savings
contracts are awarded based on the following: Preliminary Assessment, Proposal Evaluation,
Project Application, and Investment Grade Audit. CDCR’s current pool consists of 10 qualified
ESCOs.
Year Funded Energy Savings
(kBTU/yr.)
2010-2012 188,762,876 2013 32,324,937 2014 68,117,968 2015 18,602,129 2016 10,836,062
Since the start of the CDCR/IOU Partnership program in 2006, CDCR has completed 105 energy
efficiency projects in existing buildings and new construction. The total cost of the energy
efficiency projects is approximately $71 million, which have been funded from support funds,
loans and/or grant programs. The IOUs have paid over $18 million in incentives, resulting in an
overall annual savings of $8.5 million for CDCR. These savings are used to repay the grant or
loan programs; after these debts are retired, these projects provide ongoing energy and cost
savings. Figure 16 and Figure 17 highlight a lighting retrofit project at the California Training
Center in Galt.
Table 25- Summary of Energy Savings Achieved through Energy Efficiency Projects
Figure 15- Installation of New Energy Efficient Boilers at CCI

70
Leadership in Energy and Environmental Design
The USGBC developed green building rating systems to advance energy, material efficiency, and
sustainability known as LEED for Building Design and Construction (LEED BD+C), LEED for
Building Operations and Maintenance (LEED O+M), and LEED Interior Design and Construction
(LEED ID+C). EO B-18-12 and the Green Building Action Plan require new State buildings and
major renovations of 10,000 square feet or more, to be designed, constructed, and certified at
LEED Silver or higher; also new State buildings under 10,000 square feet must meet applicable
California Green Building Standard’s Tier 1 measures.
Additionally, the Green Building Action Plan requires all existing State buildings over 50,000
square feet to complete LEED O+M certification and meet an Energy Star rating of 75 (or an
alternate energy standard established by the California Energy Commission) to the maximum
extent that such certification is cost-effective.
CDCR has made significant progress in designing and constructing new Capital Outlay Projects
to meet the LEED BD+C Silver or Gold rating. LEED certification details were noted previously in
the Green Operations Building Design and Construction section. There are eight additional
projects in various phases of design or construction that are projected to meet a minimum of
LEED-Silver rating. The RJD Level II Dorm facility (multiple buildings) is pending LEED- Silver
certification (Figure 19). The remaining projects are HCFIP buildings located at CCC, CMC (two
buildings), FSP, SAC, and SOL, and a new Central Chiller Plant at ISP.
CDCR has identified 23 buildings that are eligible for LEED O+M certification but obtaining this
certification is challenging. Currently, most CDCR prisons have only one master utility meter
installed. Sub-meters must be installed on eligible buildings in order to obtain an Energy Star
rating needed to meet the requirements for LEED O+M certification. In addition, Energy Star
ratings currently do not exist for correctional buildings throughout the country. CDCR is in the
process of installing sub-meters on two qualifying buildings (CHCF Shared Services Building
and at the new Central Health Care Services Building at SQ; Figure 18) to collect one year’s data
to fulfill the prerequisite baseline information and to help develop the standards for a
correctional facility Energy Star rating. Both buildings are anticipating LEED O+M certification.
Figure 16- High Pressure Sodium Fixtures Figure 17- Energy Efficient LED Fixtures

71
CDCR has allocated funding to award a phased contract
for building sub-metering for the remaining 21
buildings. CDCR is planning to evaluate the LEED O+M
Volume Certification Program based on the results of
the two pilot projects. Additionally, CDCR has joined a
working group of other correctional organizations
throughout the country, as well as the US Department of
Energy (US DOE), in lobbying the US Environmental
Protection Agency (US EPA) to create a category for
correctional facilities that will be recognized by the Energy Star rating criteria. The US DOE is
optimistic that the US EPA will grant the addition of this category, allowing CDCR and others to
make better progress in measuring and improving upon existing building performance levels.
Figure 18- Central Health Services at SQ

72
Figure 19- CDCR LEED Case Study
Demand Response EO B-18-12 directed all State departments to participate in available demand response
programs and to obtain financial incentives for reducing peak electrical loads when called
upon, to the maximum extent that is cost-effective.
As stated in the executive summary, CDCR’s mission is to improve public safety through law
enforcement that provides for the safe and secure incarceration of the State’s most serious and
violent felons; to provide parole supervision and develop; and to implement rehabilitative
strategies to successfully reintegrate offenders back into their communities. CDCR has
developed energy strategies that fit within its primary mission. One of those strategies is to
participate in demand reduction to support California in avoiding any rolling blackouts.
Richard J. Donovan Correctional Institution (RJD), San Diego
The Level II dorm is sited adjacent to the main Richard J. Donovan Correctional Facility and has been designated to house inmates requiring an Intermediate level of medical care as determined by the medical classification system. The project will obtain LEED Silver Certification. Sustainability initiatives utilized on the RJD Infill Facility project include the following:
• Replacement of originally specified site lighting fixtures with LED fixtures for energy efficiency, longevity and improved lighting quality.
• Reduction of GHGe by 10 percent and exceed the ASHRAE rating of 90.1 2007, partially accomplished with a central plant.
• On-site power generation by use of photovoltaic systems to account for more than 12 percent of the site’s total energy use. This system is mounted on parking canopies, which help to reduce the heat island effect typically found in surface parking areas.
• Optimizing healthy indoor environments for all inmates and staff by using only low VOC adhesives, sealants and paints and only urea-formaldehyde free composite wood products.
• Purchasing EPP by specifying materials with a high recycled content. • The project meets the construction activity pollution prevention requirement for LEED projects • Preferred parking is being provided for low-emission vehicles (currently 8 percent of staff). • Cool roof (i.e., heat reducing) materials being used for both sloped and flat roofs. • Low-flow plumbing fixtures for inmates and staff: 1.28 GPF toilets and .5 GPM faucets. • Indirect evaporative coolers that use a relief air stream to evaporate the water for the indirect
cooler and provide a cooler water temperature. • Use of Variable Frequency Drives (VFDs) on 100 percent of outside air units to allow for saving
of both fan and heating energy. • Chiller efficiencies exceed minimum energy standards. The two chillers provided utilize a plate
and frame heat exchanger to provide free cooling with a waterside economizer cycle when temperature conditions allow.
• Seventy percent of the building areas utilize 100 percent outside air to assure the highest level of indoor air quality.
• Utilize regional materials by sources within 500 miles of the project site (e.g. casework, steel, and aluminum fabrication).
• Use of LED light fixtures for high mast lighting and inmate dorm lighting.
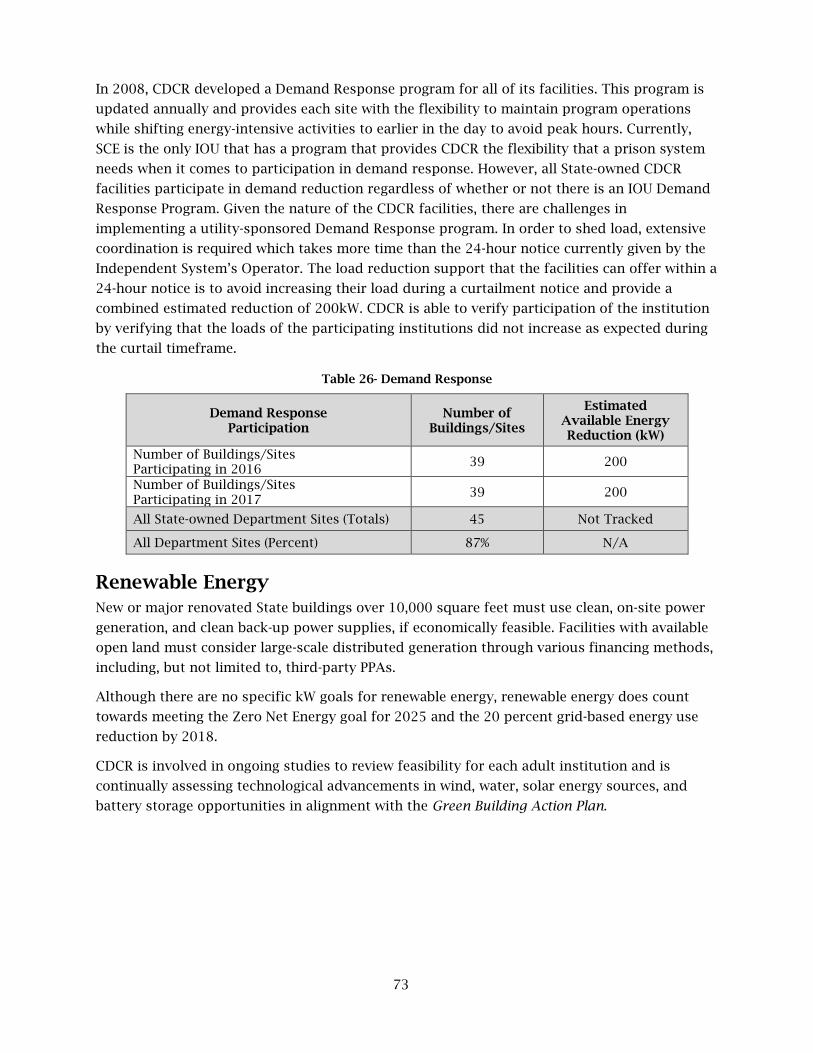
73
In 2008, CDCR developed a Demand Response program for all of its facilities. This program is
updated annually and provides each site with the flexibility to maintain program operations
while shifting energy-intensive activities to earlier in the day to avoid peak hours. Currently,
SCE is the only IOU that has a program that provides CDCR the flexibility that a prison system
needs when it comes to participation in demand response. However, all State-owned CDCR
facilities participate in demand reduction regardless of whether or not there is an IOU Demand
Response Program. Given the nature of the CDCR facilities, there are challenges in
implementing a utility-sponsored Demand Response program. In order to shed load, extensive
coordination is required which takes more time than the 24-hour notice currently given by the
Independent System’s Operator. The load reduction support that the facilities can offer within a
24-hour notice is to avoid increasing their load during a curtailment notice and provide a
combined estimated reduction of 200kW. CDCR is able to verify participation of the institution
by verifying that the loads of the participating institutions did not increase as expected during
the curtail timeframe.
Table 26- Demand Response
Demand Response Participation
Number of Buildings/Sites
Estimated Available Energy Reduction (kW)
Number of Buildings/Sites Participating in 2016
39 200
Number of Buildings/Sites Participating in 2017
39 200
All State-owned Department Sites (Totals) 45 Not Tracked
All Department Sites (Percent) 87% N/A
Renewable Energy New or major renovated State buildings over 10,000 square feet must use clean, on-site power
generation, and clean back-up power supplies, if economically feasible. Facilities with available
open land must consider large-scale distributed generation through various financing methods,
including, but not limited to, third-party PPAs.
Although there are no specific kW goals for renewable energy, renewable energy does count
towards meeting the Zero Net Energy goal for 2025 and the 20 percent grid-based energy use
reduction by 2018.
CDCR is involved in ongoing studies to review feasibility for each adult institution and is
continually assessing technological advancements in wind, water, solar energy sources, and
battery storage opportunities in alignment with the Green Building Action Plan.

74
CDCR has installed solar photovoltaic arrays
at 12 institutions: CCI, CCWF, COR, CTF,
CVSP, ISP, LAC, NKSP, PVSP, SOL, SVSP, and
WSP (Figure 20). CDCR generates
approximately 34 MW of power annually,
which is roughly equivalent to the energy
required to power at least 7,333 homes.
These fields were constructed by a third-
party vendor at its expense in exchange for
CDCR purchasing the electrical power from
the solar field operator at discounted rates,
allowing CDCR to reduce projected energy
costs by approximately $75.1 million over
the next 20 years. CDCR has also installed several smaller solar arrays (5-25 kW) on several
newly constructed buildings to meet the energy demands of these buildings and to achieve
higher levels of LEED certification. Additionally, under the authority of Senate Bill 862, CDCR
was given an exception to the Net Energy Metering (NEM) cap of 1 MW per site, which allowed
CDCR to utilize NEM up to 8 MW. Several existing solar arrays have since been converted from
non-export agreements to NEM and additional arrays will be added to many sites because of
this allowance.
Additional solar projects are planned for construction during Fiscal Year 18/19 at the following
institutions: CAL, CEN, CIW, CMC, FSP, KVSP, MCSP, SAC, VSP, WSP, PVSP, and VYCF. These
projects are estimated to bring an additional 28 MW into CDCR’s renewable energy portfolio.
CDCR is also in the bidding process to expand renewable generation at ten existing prison sites
adding as much as 26 additional MW of renewable capacity.
Additionally, CDCR has three projects awarded to install wind turbines at CTF, LAC, and SVSP.
The turbine at LAC (Figure 21) became operational in December
2017 and the CTF/SVSP turbines are scheduled to begin
construction in Spring 2018. These wind projects will increase
the Department’s renewable energy portfolio by approximately
four MW. This will significantly contribute to CDCR’s renewable
energy portfolio and put the Department on track to exceed the
power grid reductions specified in EO B-18-12.
Based on the current plan, over 30 percent of CDCR’s total
power is expected to be powered by renewable energy. By 2018,
CDCR will achieve a 20 percent reduction on energy use
compared to a 2003 baseline, thereby complying with the
Governor’s EO.
Figure 20- Solar Array at ISP
Figure 21- Wind Turbine at LAC

75
Table 27- On-Site Renewable Energy
Monitoring Based Commissioning (MBCx) New and existing State buildings must incorporate MBCx to support cost effective and energy
efficient building operations, using an Energy Management Control System (EMCS). State
agencies managing State-owned buildings must pursue MBCx for all facilities over 5,000 square
feet with EUIs exceeding thresholds described in MM 15-04.
MBCx can help CDCR develop a prioritized energy management roadmap. With real time data
from MBCx, CDCR can continually address inefficient facilities and buildings that are drifting
out of calibration. As building systems change, user requirements shift, or energy economics
fluctuate, the building with MBCx can keep pace. Traditionally, the IOUs’ MBCx programs have
required a remote access for implementation. Given the safety and security requirements at
CDCR institutions, these programs did not meet the Department’s DCG and could not be
considered. Currently, the IOUs are in the process of defining new programs. Once these
programs are finalized and readily available for customers, CDCR is planning to assess the
available options and determine if the new programs can meet safety and security
requirements.
Financing State agencies are required to pursue all available financing and project delivery mechanisms to
achieve these goals including, but not limited to: state revolving loan funds, utility OBF, PPAs,
GS $Mart, Energy Service Contractors (ESCOs), or other available programs.
CDCR has been successful in fulfilling many of the State mandates of energy efficiency and
sustainability. CDCR has sought out various funding opportunities as they become available
and has taken the lead in promoting additional funding opportunities by participating in policy
discussions on topics such as OBF and OBR.
CDCR has utilized and will continue to explore multiple funding opportunities including GS
$Mart loans, OBF, municipal utility company loan and incentive programs, ARRA loans, ECAA
loans, Department of Water Resources loans and grants, and Solar or Wind PPAs.
5 A number of the proposed sites are already included in the operating/in-construction site count.
Status Number of Sites
Capacity (MW)
Estimated Annual Power
Generation (kWh) Renewables In Operation or Construction
22 66.12 132,260,000
Renewables Pro posed 17 45.9 91,800,000
Renewable Totals5 31 112.02 224,060,000
Department Wide Totals 45 N/A 769,960,201
Department Wide Renewable Percent
69% N/A 29%

76
CHAPTER FOUR
FLEET AND ZERO EMISSION VEHICLES
INFRASTRUCTURE
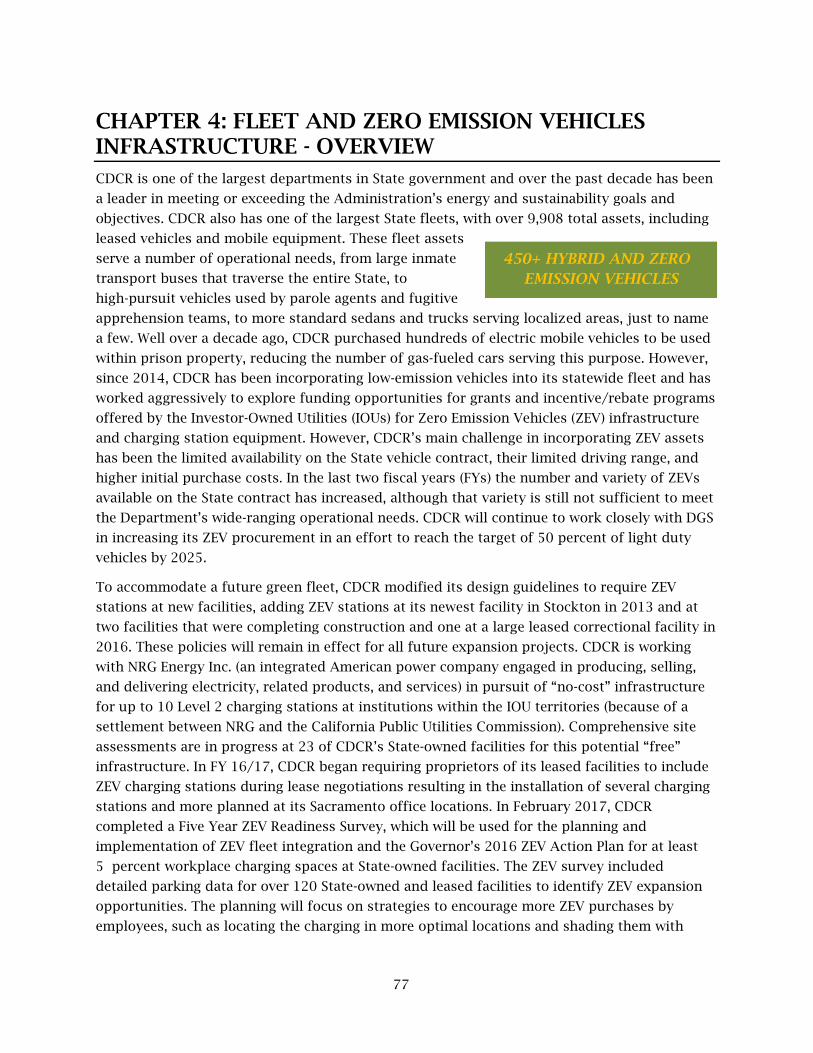
77
CHAPTER 4: FLEET AND ZERO EMISSION VEHICLES INFRASTRUCTURE - OVERVIEW CDCR is one of the largest departments in State government and over the past decade has been
a leader in meeting or exceeding the Administration’s energy and sustainability goals and
objectives. CDCR also has one of the largest State fleets, with over 9,908 total assets, including
leased vehicles and mobile equipment. These fleet assets
serve a number of operational needs, from large inmate
transport buses that traverse the entire State, to
high-pursuit vehicles used by parole agents and fugitive
apprehension teams, to more standard sedans and trucks serving localized areas, just to name
a few. Well over a decade ago, CDCR purchased hundreds of electric mobile vehicles to be used
within prison property, reducing the number of gas-fueled cars serving this purpose. However,
since 2014, CDCR has been incorporating low-emission vehicles into its statewide fleet and has
worked aggressively to explore funding opportunities for grants and incentive/rebate programs
offered by the Investor-Owned Utilities (IOUs) for Zero Emission Vehicles (ZEV) infrastructure
and charging station equipment. However, CDCR’s main challenge in incorporating ZEV assets
has been the limited availability on the State vehicle contract, their limited driving range, and
higher initial purchase costs. In the last two fiscal years (FYs) the number and variety of ZEVs
available on the State contract has increased, although that variety is still not sufficient to meet
the Department’s wide-ranging operational needs. CDCR will continue to work closely with DGS
in increasing its ZEV procurement in an effort to reach the target of 50 percent of light duty
vehicles by 2025.
To accommodate a future green fleet, CDCR modified its design guidelines to require ZEV
stations at new facilities, adding ZEV stations at its newest facility in Stockton in 2013 and at
two facilities that were completing construction and one at a large leased correctional facility in
2016. These policies will remain in effect for all future expansion projects. CDCR is working
with NRG Energy Inc. (an integrated American power company engaged in producing, selling,
and delivering electricity, related products, and services) in pursuit of “no-cost” infrastructure
for up to 10 Level 2 charging stations at institutions within the IOU territories (because of a
settlement between NRG and the California Public Utilities Commission). Comprehensive site
assessments are in progress at 23 of CDCR’s State-owned facilities for this potential “free”
infrastructure. In FY 16/17, CDCR began requiring proprietors of its leased facilities to include
ZEV charging stations during lease negotiations resulting in the installation of several charging
stations and more planned at its Sacramento office locations. In February 2017, CDCR
completed a Five Year ZEV Readiness Survey, which will be used for the planning and
implementation of ZEV fleet integration and the Governor’s 2016 ZEV Action Plan for at least
5 percent workplace charging spaces at State-owned facilities. The ZEV survey included
detailed parking data for over 120 State-owned and leased facilities to identify ZEV expansion
opportunities. The planning will focus on strategies to encourage more ZEV purchases by
employees, such as locating the charging in more optimal locations and shading them with
450+ HYBRID AND ZERO EMISSION VEHICLES

78
solar parking canopies. CDCR also actively participates on the GO-Biz task force in support of
the ZEV initiative and is committed to California’s statewide sustainability mission.
I. FLEET AND ZEV GOALS The Governor has issued numerous executive orders (EO) directing sustainable State operations
and the legislature has also passed a number of laws pertaining to sustainability. The orders,
laws and related policy implementation guidelines relevant to fleets and zero emission vehicle
infrastructure are:
Executive Order B-18-12 EO B-18-12 and the companion Green Building Action Plan require State agencies to reduce the
environmental impacts of State operations by reducing GHGe, managing energy and water use,
improving indoor air quality, generating on-site renewable energy when feasible, implementing
environmentally preferable purchasing, and developing the infrastructure for electric vehicle
charging stations at State facilities. The Green Building Action Plan also established two
oversight groups; the staff level Sustainability Working Group and the executive level
Sustainability Task Force, to ensure these measures are met.
Executive Order B-16-12 EO B-16-12 directs State agencies to integrate ZEVs into the State vehicle fleet. It also directs
State agencies to develop the infrastructure to support increased public and private sector use
of ZEVs. Specifically, it directs State agencies replacing fleet vehicles to replace at least
10 percent with ZEVs, and by 2020 to purchase at least 25 percent replacement fleet as ZEVs.
Executive Order B-30-15 EO B-30-15 declared climate change to be a threat to the well-being, public health, natural
resources, economy, and environment of California. It established a new interim statewide
GHGe reduction target of 40 percent below 1990 levels by 2030 and reaffirms California’s
intent to reduce GHGe by 80 percent below 1990 levels by 2050. To support these goals, this
order requires numerous State agencies to develop plans and programs to reduce emissions.
2016 ZEV Action Plan The plan establishes a goal to provide electric vehicle charging to 5 percent of State owned
parking spaces by 2022. It also advances the ZEV procurement target to 50 percent of light duty
vehicles by 2025.
Assembly Bill 32 Scoping Plan The scoping plan assumes widespread electrification of the transportation sector as a critical
component of every scenario that leads to the mandated 40 percent reduction in GHGe by 2030
and 80 percent reduction by 2015.

79
Public Resources Code §25722.8 This statute requires reducing consumption of petroleum products by the State fleet compared
to a 2003 baseline. It mandates a 10 percent reduction or displacement by January 1, 2012 and
a 20 percent reduction or displacement by January 1, 2020.
State Administrative Manual & Management Memos The following sections of the State Administrative Manual (SAM), and associated MM, currently
impose sustainability requirements on the department under the Governor’s executive
authority:
• MM 15-03: Minimum Fuel Economy Standards Policy
• MM 15-07: Diesel, Biodiesel, and Renewable Hydrocarbon Diesel Bulk Fuel Purchases
• MM 16-07: Zero-Emission Vehicle Purchasing and EVSE Infrastructure Requirements
II. FLEET VEHICLES
Introduction to the CDCR Mission and Fleet
This report demonstrates to the Governor, Legislature, and the public at large the progress the
Department has made toward meeting the Governor’s sustainability goals related to ZEVs.
Further, it identifies successful accomplishments, ongoing efforts, outstanding challenges, and
future efforts.
CDCR operates adult correctional institutions and juvenile facilities throughout the State of
California, as well as other divisional programs aimed at public safety and service operations.
The Department’s mission to “enhance public safety through safe and secure incarceration of
offenders, effective parole supervision, and rehabilitative strategies” is accomplished with
critical fleet assets necessary for such operations.
CDCR has 7,892 State-owned fleet assets and 1,780 leased vehicles, as identified in the
Department of General Services (DGS) Fleet Asset Management database as of December 2017.
The increase to the CDCR fleet from last year’s report is attributed to better fleet reporting
from all statewide CDCR programs based on enhanced oversight and field education. This fleet
total includes heavy- and light-duty vehicles. CDCR’s fleet also has 3,560 mobile equipment
assets, such as electric carts and forklifts. CDCR fleet vehicles are used to perform a variety of
functions, including inmate/parolee and staff transport, plant operations, construction,
correctional education, food and pharmacy delivery, hazardous materials handling, information
technology operations, materials and supplies transport, perimeter security, and waste
management. At the adult institution and juvenile facility level, there is a wide variety of
vehicles as these assets are in turn used by a number of different functional programs within a
facility.
1. Sedan-type vehicles – These are most often used for administrative service functions
such as staff transport or pool vehicles, inmate transport services to courts or medical
appointments, high security transport and mutual aid support services, as well as
custody and law enforcement services for either inmates or parolees. These vehicles

80
may require “high-speed pursuit” capabilities and/or be heavily modified with radio and
security improvements to meet the unique needs of a correctional facility. They may
also be required to be utilized at a moment’s notice to deal with emergency situations.
2. Sport Utility Vehicles (SUVs) – These are used to perform site security and plant
operation functions, staff training, perimeter patrol and pursuit, as well as inmate and
medical transport services. CDCR programs require the use of SUVs to house inmate
security transportation cells for security and transport purposes. As a result, these
vehicles also require modifications. The additional interior capacity space within SUVs
provides the ability to transport multiple inmates, as well as the necessary tactical gear
and equipment required by custody staff.
3. Vans and trucks – These vehicle types prove to be highly versatile for CDCR operations.
Vans are used for inmate, staff, or visitor transport both on and off facility grounds.
They are also used as paratransit and ambulance vehicles. Some of these vehicles will
include modifications to meet correctional needs. Trucks are used for several different
operations on CDCR facility grounds, including grounds maintenance and warehouse
services, supply transports, food delivery services, and security patrol.
4. Buses – CDCR currently operates 30 buses servicing all institutions for the
transportation of inmates to mission critical assignments and work projects.
5. Fire Engines – CDCR currently operates approximately 60 fire engines that serve
institutions and are used in mutual aid agreements with local entities and other State
agencies for emergency response services.
6. Farm and Construction Vehicles – CDCR operates several different types of farm and
construction vehicle assets to carry out these services, including tractors, excavators,
front loaders, outdoor forklifts, and utility carts to maintain surroundings, buildings,
and perform minor and major construction or renovation at all facilities.
7. Electric Carts – CDCR uses electric carts daily to transport inmates, supplies, and
medications within an institution.

81
8. Mobile Equipment – CDCR uses a variety of mobile equipment assets for grounds
maintenance and plant operation services to transport materials, supplies, and
equipment across facility grounds.
Divisional headquarter programs use vehicles in other capacities. The Office of Correctional
Safety, Office of Internal Affairs, Division of Adult Parole Operations, and Board of Parole
Hearings, among others, routinely travel throughout the State to monitor field operations and
conduct other important work. These programs typically utilize sedan-type assets due to the
amount of travel involved with their operations; however, some of these programs also use
other vehicle types to aid in covert operations and criminal apprehension services.
As CDCR operates programs throughout the entire State of California, vehicles are used in all
types of environments and road conditions. CDCR facilities are often located in rural and/or
remote parts of the State, some in desert locations. CDCR’s fire camp program may require
travel across difficult terrain and non-paved roads. Additionally, because of the significant
distances between facilities, some vehicles will have to travel hundreds of miles on isolated
roadways to reach their destination. Conversely, a few prisons are located in urban areas with
Graph 2- CDCR’s Fleet Vehicle Type Breakdown
Graph 3- Composition of Department’s Light-Duty Vehicle Fleet

82
high-congestion traffic that can benefit from the high-occupancy vehicle exemption for
commute purposes.
As of June 2017, DGS reported the average Miles Per Gallon (MPG) of the CDCR light-duty fleet
was 21.08 MPG compared to 19.58 MPG in 2012 (www.green.ca.gov/fleet). This average MPG
increased 7 percent based on CDCR’s owned and leased inventory identified in the DGS Fleet
Asset Management System database due to the adoption of hybrid electric and ZEVs into the
CDCR fleet. Many of CDCR’s divisional headquarter programs have shifted their vehicle models
from the standard full-size sedan vehicle to mid-size hybrid vehicles. This shift has allowed
CDCR to not only comply with green fleet measures and State and federal mandates, but to also
achieve greater fuel efficiency, enhance operational efficiency, and realize substantial cost
savings to the State.
Table 28- Total Purchased Fuel in 2017
Purchased Utility Quantity* Gallons
Cost*
Gasoline 782,482 $ 1,865,432
Diesel 97,626 $ 292,018
Renewable Diesel 217,780 $ 581,477
Total GGE 1,097,888 $ 2,738,928 *Totals include bulk fuel purchases only.
In May 2017, CDCR’s Environmental and Regulatory Compliance Section issued a statewide
advisory notice outlining requirements to change from conventional diesel to renewable diesel
in aboveground and underground storage tank systems. CDCR has over 10 correctional
facilities currently using renewable diesel and anticipates the number of sites and amount of
renewable diesel usage to increase in compliance with the DGS MM 15-07. CDCR expects this
trend to continue in 2018 with an ultimate goal to convert to 100 percent renewable diesel
where attainable.
Incorporating ZEVs into the State Fleet A widespread shift to ZEVs is essential for California to meet its GHGe goals. State departments
are now required to incorporate larger numbers of ZEVs in their vehicle fleets. Beginning in
FY 17/18, the percentage of new light-duty vehicles that must be ZEV increases by 5 percent
each year, reaching 25 percent in FY 19/20 and 50 percent in FY 24/25. CDCR has integrated
12 State-owned and 42 leased ZEVs into its fleet assets. Below is a description of the various
vehicle models and potential operations. CDCR will continue to convert all fleet that are eligible
for replacement to ZEVs where the opportunity and ability is available to place and utilize a
ZEV-type vehicle. There are operational services within CDCR that are unable to accommodate
the use of a ZEV vehicle. However, CDCR will continue to place ZEVs in all applications that are
conducive to their use and will remain within compliance of the annual ZEV mandate
requirement.

83
Battery-Electric Vehicle (BEV)
Potential roles that could be filled within CDCR through the use of BEVs could be on-grounds
service operations. BEV-type vehicles could be used in an institutional setting to transport staff,
supplies, or equipment across institutional grounds. Facility deliveries, visitor transport
services, non-emergency perimeter check evaluations, or minor maintenance and repair duties
could be services provided with these vehicles types.
Plug-In Hybrid Electric Vehicle (PHEV)
Potential roles that could be filled within CDCR through the use of PHEVs could be staff
transport and pool service vehicles. As these vehicles are not as limited by range through the
use of both fuel and electricity, these vehicles are more viable in staff transport operations.
Fuel Cell Vehicle
Potential roles that could be filled within CDCR through the use of Fuel Cell vehicles could also
be staff transport and pool service vehicles. As these vehicles are not as limited by range
through the use of both fuel and electricity, these vehicles are more viable in staff transport
operations.
Vehicles that meet or exceed specified mileage and age thresholds are eligible for replacement.
Currently, ZEVs are available on statewide commodity contracts in the sub-compact, compact,
mid-size sedan, and mini-van vehicle classes. There are currently 289 vehicles in CDCR’s fleet
that are eligible for replacement in vehicle classes for which ZEVs are available on contract.
Table 29- Vehicles in Department Fleet Currently Eligible for Replacement
Sub-Compact
Sedan Compact
Sedan Midsize Sedan
SUV Mini Van Total
Number of vehicles eligible for replacement
13 29 128 79 40 289*
*Data signifies light-duty vehicles with a reported odometer reading or age that meets the applicable updated replacement thresholds, based on type, according to the DGS Replacement Standards set forth in MM 17-05.
The table below shows the estimated number of ZEVs that have been or are anticipated to be,
added to the Department fleet in coming years.
Table 30- ZEV Additions to the Department Fleet (Owned Assets) by Fiscal Year
Vehicle Type 14/15 15/16 16/17 17/18 18/19 19/20 20/21 21/22
Battery Electric Vehicle 3 2 2 2* 6** 6** 6** 6**
Plug-in Hybrid Vehicle 1 1 4 0* 5** 5** 5** 5**
Fuel Cell Vehicle 0 0 0 0 0 0 0 0
Percent of total purchases
10%*** 10%*** 10%*** 15%*** 20%*** 25%*** 30%*** 35%***
Required ZEV Percentage
10% 10% 10% 15% 20% 25% 30% 35%
Total number of ZEVs in Fleet
4 7 13 15 26 37 48 59

84
*In FY 17/18 CDCR used previously earned ZEV credits to reduce the total number of required ZEV purchases (and still meet the 15 percent requirement)
**These figures are estimates based on average purchases of respective vehicle type. These anticipated purchases take into consideration the impact of MM 16-07 and the “ZEV/Hybrid First” Policy implemented by DGS.
***Percent of total fleet purchases represents percentage of Light-Duty vehicle purchases only, not all fleet purchases.
Telematics Plan Telematics is a method for monitoring vehicle use. Using GPS and on-board diagnostics,
telematics provides valuable information that often results in fuel savings and improved vehicle
utilization. Telematics is especially important for verifying that PHEVs are maximizing the use
of electric fuel rather than gasoline. The rule requiring 50 percent of ZEVs purchased to be
BEVs is not in place for fleets making use of telematics for all ZEVs.
CDCR’s Division of Adult Institutions’ Statewide Transportation Unit (STU) has undertaken a
pilot program to investigate the operative benefits of utilizing telematics. STU’s pilot program
includes the installation of GPS telematics devices on approximately 100 fleet vehicles. The STU
plans to have all devices installed and calibrated by June 2018. Pending the conclusion of this
pilot program, CDCR will determine its goals and plans for using telematics based on the
findings.
Public Safety Exemption As CDCR employs sworn peace officers, the updated rules for public safety vehicles will, in fact,
affect the number of ZEVs that can be incorporated into the fleet due to the nature of the
Department’s operations. ZEVs cannot be consistently used in the course of CDCR peace officer
duties. Such vehicles are required to be able to house peace officer equipment, weaponry, and
provide enough capability to serve in pursuit and apprehension operations. Vehicles that are
limited in size, range, and efficiency are not capable to serve in such capacities. Further, such
vehicles often require security modifications and radio outfitting for law enforcement duties,
which further prohibits the use of ZEVs in such operations. CDCR will be actively seeking all
opportunities to place available ZEV vehicle types within its operations, where applications and
cost may allow for such acquisitions. CDCR will need to continue to review and determine if
ZEV medium-duty fleet options will be capable of supporting peace officer needs, and if such
type vehicles are able to accommodate the after-market security modifications that are required
for most peace officer operations.
III. ZEV INFRASTRUCTURE
CDCR Parking Facilities CDCR’s State-owned facilities include over 46 million square feet of building space on over
24,000 acres of land statewide. CDCR leases approximately 1.8 million square feet and
contracts for an additional 489,000 square feet for a private correctional facility. All of these
properties have associated surface-level parking of varying sizes, in addition to the listed
square feet used for employees, contractors, inmate visitors, and other members of the public.
The parking is primarily located outside the secured perimeter fence. The total number of

85
parking spaces at juvenile facilities ranges from 150 to 300, while at adult prisons the parking
spaces range from 500 to 2,500. There are also a minimal number of parking spaces located
inside the secured fence adjacent to some of the facilities essential buildings. All parking
spaces inside and outside of the perimeter fence are included in the total parking space
calculations. A detailed breakdown of parking space type and subtotals for each specific type
are identified in the Five Year ZEV Infrastructure Readiness Survey.
CDCR has 85 leased facilities located throughout the State. The parking spaces at CDCR leased
facilities are also surface-level. The total number of parking spaces ranges from one to 600;
however, most of the parking spaces at CDCR’s leased locations are less than 100.
Based on extensive operational needs, as described earlier in this Chapter, fleet vehicles are
located at nearly all CDCR State-owned correctional facilities and leased facilities. Fleet parking
locations are determined by the parking layout at each facility. Fleet parking is typically located
adjacent to or to the rear of workplace parking and is secured. Employee and public spaces are
usually in the same lot, but separately designated through signage. Accessible (i.e., Americans
with Disabilities Act compliant) spaces are typically not distinguished between employee and
public.
Given the nature of the Department’s fleet operations, the length of stay for visiting guests, and
number of employees, CDCR has determined it is appropriate that Level 1 chargers should
make up approximately 75 percent of chargers in employee parking areas and 25 percent of
chargers in fleet parking areas, with the remainder being Level 2. The ratio of Level 1 to Level 2
chargers is based on recommended calculations provided by the Department of General
Services.
Based on estimates of future ZEV fleet purchases and a count of workplace parking spaces, it
has been determined the Department will need to purchase Level 1 and Level 2 chargers to
adequately serve fleet vehicles and achieve the goals established in the ZEV Action Plan.
*Workplace Level 1 (75%) = 1386 *Workplace Level 2 (25%) = 464
Graph 4- Parking Facilities (39 State-Owned and 85 Leased)
Leased facilities withCDCR Fleet Vehicles
Owned facilities withCDCR Fleet Vehicles
Not Hosting FleetVehicles and Leased
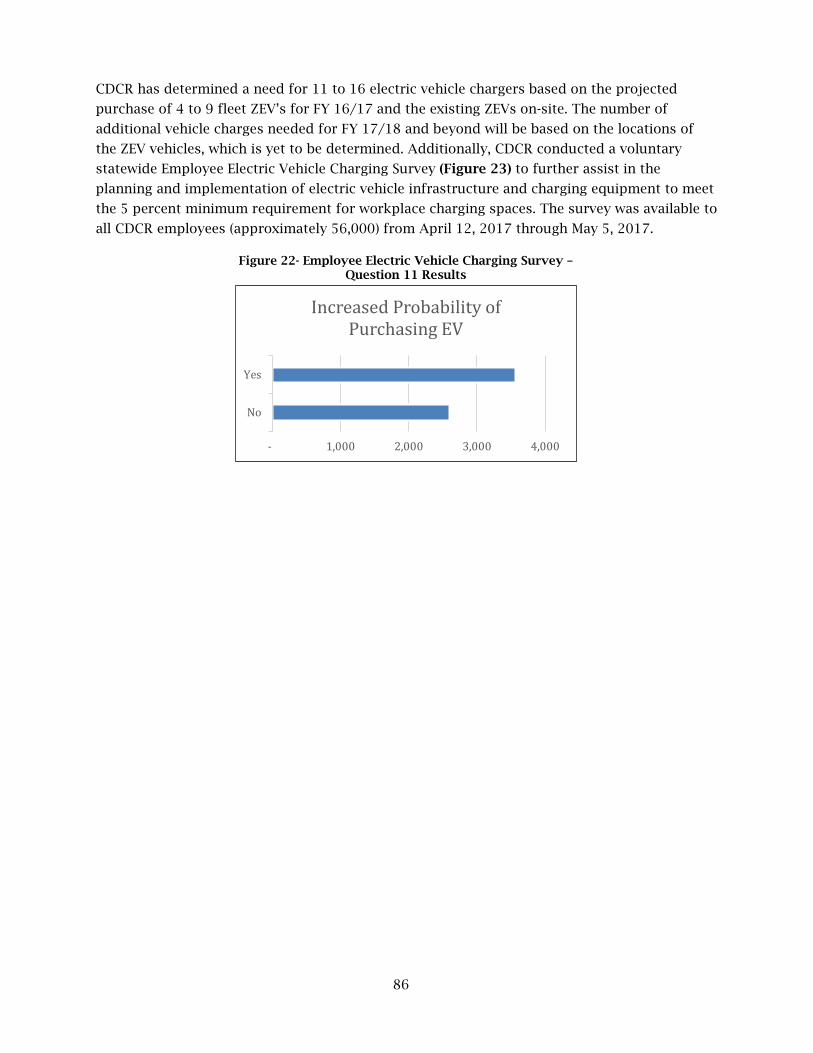
86
CDCR has determined a need for 11 to 16 electric vehicle chargers based on the projected
purchase of 4 to 9 fleet ZEV’s for FY 16/17 and the existing ZEVs on-site. The number of
additional vehicle charges needed for FY 17/18 and beyond will be based on the locations of
the ZEV vehicles, which is yet to be determined. Additionally, CDCR conducted a voluntary
statewide Employee Electric Vehicle Charging Survey (Figure 23) to further assist in the
planning and implementation of electric vehicle infrastructure and charging equipment to meet
the 5 percent minimum requirement for workplace charging spaces. The survey was available to
all CDCR employees (approximately 56,000) from April 12, 2017 through May 5, 2017.
Figure 22- Employee Electric Vehicle Charging Survey – Question 11 Results
No
Yes
- 1,000 2,000 3,000 4,000
Increased Probability of Purchasing EV

87
Figure 23- Employee Electric Vehicle Charging Survey Results

88
The facilities with the most urgent need for EV charging are listed below.
Table 31- High Priority EVSE Projects
Facility Name
Total* Parking Spaces
Existing L1
Chargers
Existing L2
Chargers
New L1 Chargers Needed -
Workplace
New L1 Chargers Needed -
Fleet
New L2 Chargers Needed -
Workplace
New L2 Chargers Needed -
Fleet
SATF 2000 0 0 71 0 24 2 SAC 1111 0 0 39 0 13 1 SOL 893 0 0 31 0 10 1 CIW 490 0 0 18 0 6 1 NCYCC 338 0 0 12 0 4 1 VYCF 272 0 0 10 0 3 1 Total 6389 0 0 360 0 120 7
*Note: Total Parking Space includes total Fleet and Workplace spaces.
CDCR prioritized the facilities in Table 31 based on existing ZEV fleet inventory, projected
electric vehicle purchasing, and results of the employee survey. CDCR’s owned ZEVs consist of:
• Four Full Battery Electric Vehicles (BEV, Nissan Leaf)
o 2 – SATF o 1 – SAC o 1 – SOL
• Seven Plug-In Hybrid Electric Vehicles (PHEV, Chevrolet Volt)
o 1 – CIW o 1 – NCYCC o 1 – VYCF o 3 – MCSP* o 1 – RJD*
CAC, CHCF, MCSP and RJD currently have ZEV charging stations on-site; these facilities are not
included in Table 31. CDCR’s requirement is projected at 4-to-9 ZEVs for FY 16/17 at the time
of this report (locations to be determined).
Outside Funding Sources for EV Infrastructure CDCR has established a formal partnership with the IOUs to help identify and implement a
number of CDCR’s sustainability initiatives over the last decade. The CDCR/IOU partnership
facilitates ongoing communications on funding opportunities for grants and incentive/rebate
programs offered for ZEV infrastructure and charging station equipment. CDCR is researching
the IOU programs offered below to determine the program qualifications, additional funding,
easement requirements, etc. This is an ongoing process based on availability as the funding
opportunities and programs open or close.
Southern California Edison (SCE), Charge Ready Program:
This pilot project will support the installation of as many as 1,500 electric vehicle charging
stations. The application process is open at the time of this report. Space requirements include
a 10-space minimum. The rebate will cover some or all of the cost of station installation. The

89
locations in SCE territory must own, operate, or lease a site that provides long dwell time (4+
parked hours). This program is also available in disadvantaged communities (DACs). There is no
program participation payment because SCE is only providing rebates, not the purchase of the
EVSE itself. This program requires an easement and approval from DGS.
Sacramento Municipal Utility District (SMUD) Workplace Charger Incentive:
This program incentive is for Level 2 (240V) chargers. This application process is open at the
time of this report. The rebate is $1,500 per connector, with a maximum of 20 incentives per
property. One electric vehicle charger pedestal (dual system) can have two connectors; in this
case, the rebate would be $3,000. SMUD also requires the charger(s) to be sub-metered and will
monitor the usage associated with the charging, which is then reported to the Air Resources
Board (ARB). The ARB generates credits that SMUD sells to fund the rebate program. The sub-
meter is installed free by SMUD; however, an electrician/contractor would need to setup the
meter “socket” as required so SMUD can follow with the installation of the sub-meter. CDCR is
researching the feasibility of utilizing this program for its only owned facility in SMUD territory
(i.e., Folsom State Prison) in coordination with an Americans with Disabilities Act Parking
Project and Solar Project in progress at this correctional facility.
San Diego Gas & Electric (SDG&E) Power Your Drive:
This is a pilot program to install 3,500 Level 2 EVSEs. The application process is open at the
time of this report. Locations must be in SDG&E territory, (RJD is located in San Diego), and
DACs are 10 percent of the total funding over the entire program. There is a participation
payment of $630/port for workplaces, and $0 for DACs. The EVSE would be owned, operated,
and maintained by SDG&E at no cost to the site host. Easements are also required by this IOU.
Stations are metered separately from the site host's electric service and account.
Pacific Gas & Electric (PG&E) EV Charge Network:
This is a pilot program to install up to 7,500 Level 2 EVSEs. There is only an interest list at the
time of this report. The funding will cover full cost of make-ready installations and a discount
of up to 25-100 percent on charging equipment. This program is available in DACs only. Space
requirements include a 10-space minimum. Fees include a participation payment and cost of
charging stations, though there are subsidized pre-qualified charger packages offered. PG&E
requires ownership and the program is allowed only in multifamily or disadvantaged
community up to 35%. This program requires an easement and approval by the DGS. CDCR is
working with PG&E to identify which of CDCR’s 15 facilities located in PG&E territory might be
potential candidate sites.
CDCR also participates on the Governor’s Office of Business and Economic Development
(GO-Biz) Task Force and utilizes a smart sheet application to collaborate with other
departments on ZEV infrastructure/charging station funding opportunities. CDCR is working
with EVgo for ZEV infrastructure for up to 10 Level 2 charging stations within the IOU
territories for make-ready installation of up to $30,000. The scope of work includes electrical
subpanel, transformer, conduit, wiring, concrete pad, and pedestal or wall receptacle. Site
assessments, cost development and design are in process at 23 of CDCR’s State-owned facilities

90
for this potential “free” infrastructure (not including the scope of work and costs to install the
EV charging station equipment and on-going maintenance).
Hydrogen Fueling Infrastructure CDCR participates in the GO-Biz Task Force and is working with the U.S. Department of Energy
to track new technologies for ZEVs, including the purchase of hydrogen vehicles and fueling
infrastructure. Currently there are 28 open retail hydrogen fueling station locations statewide
and only 1 hydrogen vehicle available in the DGS State Contract. Given CDCR’s unique,
widespread operations, often in remote areas, having more stations and more vehicle choices
offered through DGS would help CDCR expand the number of these types of vehicles in its
fleet.
Comprehensive Facility Site and Infrastructure Assessments Site assessments are performed to establish the cost and feasibility of installing the needed
electric vehicle infrastructure. Table 31 lists the facilities that have been evaluated with Site
Assessments.
CDCR has compiled detailed site assessment surveys for the adult and juvenile correctional
facilities identified in Figure 24. The remaining site assessment surveys are in process. Site
assessment surveys were distributed statewide to collect existing information, including
parking layout, electrical, photos, maps, and proposed electric vehicle charging station
locations. These site assessment surveys were provided to EVgo for the correctional facilities
within the IOU territories to assist in cost development, planning, design, and construction for
“free” infrastructure for up to 10 Level 2 electric vehicle charging stations. CDCR is utilizing the
site assessments to develop cost estimates, feasibility, and planning for incorporating ZEVs into
the fleet and for meeting the minimum requirements for 5 percent workplace charging spaces.

91
Figure 24- Preliminary Site Assessments

92
Figure 25- Preliminary Site Assessment Survey (Example)
Avenal State Prison 1 Kings Way, Avenal, CA 93204
1. Parking Type (check all that apply): ☐ Garden ☒ Lot ☐ Structure 2. Description of the electric room location: Located N/E corner of bldg. 830, see pics. Has own exterior door. No meter.
3. Volts and amps to the electrical panel: ☒ 208 volt | 125 amp ☐ 208 volt | 225 amp ☐ 480 volt | 60 amp ☒ 480 volt | 110 amp
4. PHOTO: Electrical Panel and Plate 5. PHOTO: Meter Box NONE
6. Sub panel? If yes, amps and volts: ☒ 208 volt | 125 amp ☒ 208 volt | 225 amp ☐ 480 volt | 60 amp ☐ 480 volt | 110 amp
7. PHOTO: Sub-Panel (if applicable) 8. PHOTOS: Parking Lot and Stalls
9. Description of the location of the make-ready parking spaces: Visitor parking lot, first six stalls. Diagonal parking. Stations to be protected by bollards
10. MAP: Indicate on the map above the exact locations of all of the make-ready parking spaces 11. Trenching needed? If yes, max distance and type: ☒ Asphalt ☐ Concrete ☒ Landscape 12. Wall penetrations? If yes, how many: 1 13. MAP: Indicate on the map above the location of the power source Additional Notes All materials have already been purchased for 6 stations. See attachments/drawings for more specifics.
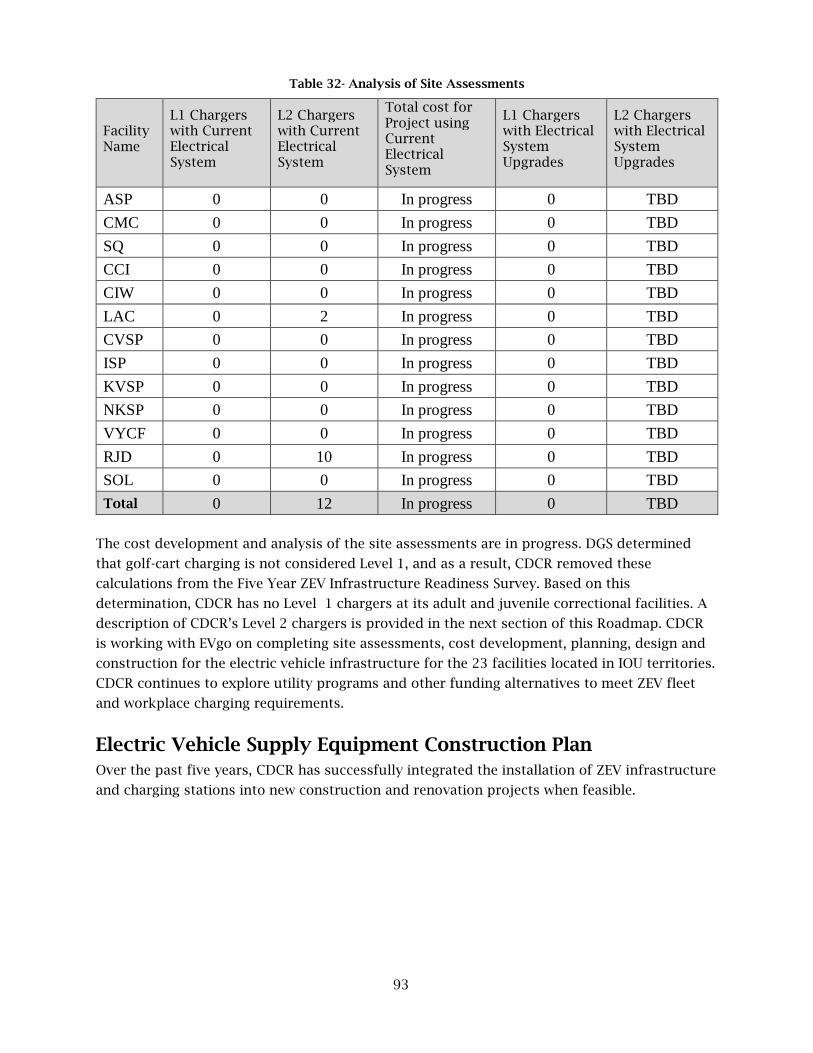
93
Table 32- Analysis of Site Assessments
Facility Name
L1 Chargers with Current Electrical System
L2 Chargers with Current Electrical System
Total cost for Project using Current Electrical System
L1 Chargers with Electrical System Upgrades
L2 Chargers with Electrical System Upgrades
ASP 0 0 In progress 0 TBD CMC 0 0 In progress 0 TBD SQ 0 0 In progress 0 TBD CCI 0 0 In progress 0 TBD CIW 0 0 In progress 0 TBD LAC 0 2 In progress 0 TBD CVSP 0 0 In progress 0 TBD ISP 0 0 In progress 0 TBD KVSP 0 0 In progress 0 TBD NKSP 0 0 In progress 0 TBD VYCF 0 0 In progress 0 TBD RJD 0 10 In progress 0 TBD SOL 0 0 In progress 0 TBD Total 0 12 In progress 0 TBD
The cost development and analysis of the site assessments are in progress. DGS determined
that golf-cart charging is not considered Level 1, and as a result, CDCR removed these
calculations from the Five Year ZEV Infrastructure Readiness Survey. Based on this
determination, CDCR has no Level 1 chargers at its adult and juvenile correctional facilities. A
description of CDCR’s Level 2 chargers is provided in the next section of this Roadmap. CDCR
is working with EVgo on completing site assessments, cost development, planning, design and
construction for the electric vehicle infrastructure for the 23 facilities located in IOU territories.
CDCR continues to explore utility programs and other funding alternatives to meet ZEV fleet
and workplace charging requirements.
Electric Vehicle Supply Equipment Construction Plan Over the past five years, CDCR has successfully integrated the installation of ZEV infrastructure
and charging stations into new construction and renovation projects when feasible.

94
California Health Care Facility (CHCF) – During the construction of this facility, three Level 2
dual port charging stations were installed to support workplace charging (activated 2014).
California State Prison, Lancaster (LAC) – During the construction of the Enhanced Outpatient
Program Office and Treatment building, one Level 2 dual-port charging station was installed to
support workplace charging (activated 2014).
Figure 26- Workplace Electric Vehicle Charging – CHCF
Figure 27- Workplace Electric Vehicle Charging – LAC

95
Mule Creek State Prison (MCSP) – During the infill project at this site, two Level 2 dual port
charging stations and two Level 2 single port charging stations were installed to support
workplace charging (activated 2016).
Richard J. Donovan Correctional Facility (RJD) – During the infill project at this site, five Level 2
dual-port charging stations were installed to support workplace and fleet charging (activated
2017).
Figure 28- Workplace Electric Vehicle Charging – MCSP
Figure 29- Workplace Electric Vehicle Charging – RJD
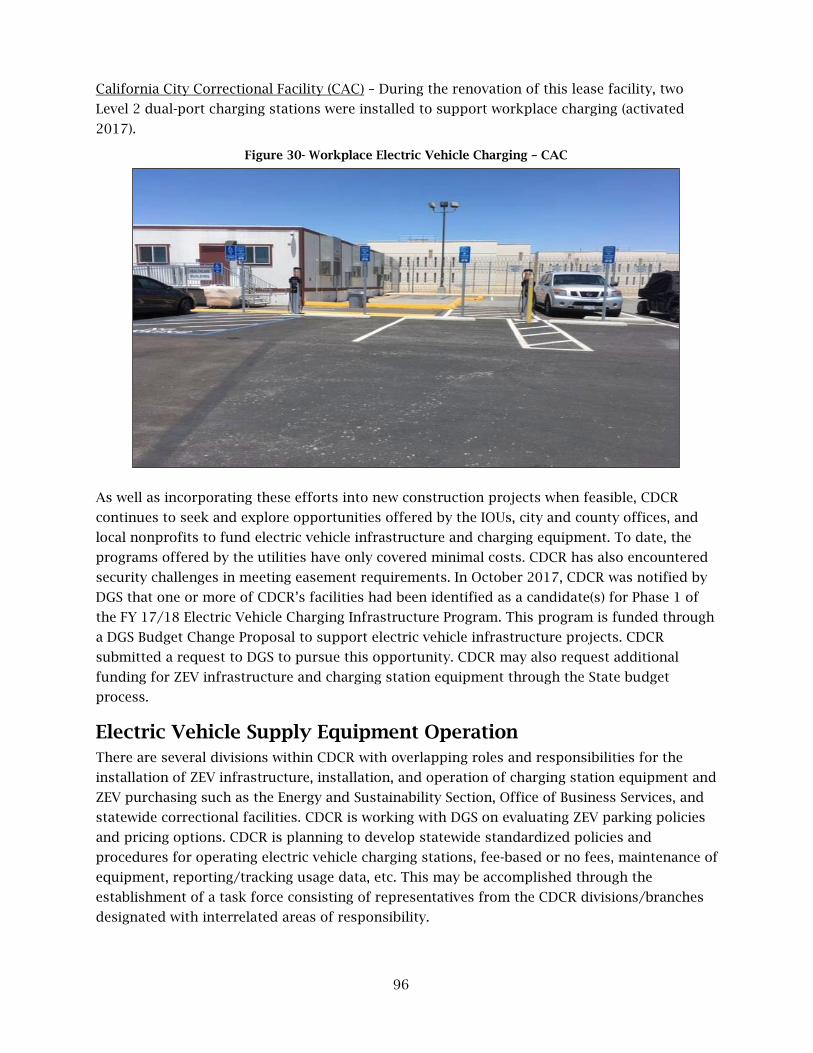
96
California City Correctional Facility (CAC) – During the renovation of this lease facility, two
Level 2 dual-port charging stations were installed to support workplace charging (activated
2017).
As well as incorporating these efforts into new construction projects when feasible, CDCR
continues to seek and explore opportunities offered by the IOUs, city and county offices, and
local nonprofits to fund electric vehicle infrastructure and charging equipment. To date, the
programs offered by the utilities have only covered minimal costs. CDCR has also encountered
security challenges in meeting easement requirements. In October 2017, CDCR was notified by
DGS that one or more of CDCR’s facilities had been identified as a candidate(s) for Phase 1 of
the FY 17/18 Electric Vehicle Charging Infrastructure Program. This program is funded through
a DGS Budget Change Proposal to support electric vehicle infrastructure projects. CDCR
submitted a request to DGS to pursue this opportunity. CDCR may also request additional
funding for ZEV infrastructure and charging station equipment through the State budget
process.
Electric Vehicle Supply Equipment Operation There are several divisions within CDCR with overlapping roles and responsibilities for the
installation of ZEV infrastructure, installation, and operation of charging station equipment and
ZEV purchasing such as the Energy and Sustainability Section, Office of Business Services, and
statewide correctional facilities. CDCR is working with DGS on evaluating ZEV parking policies
and pricing options. CDCR is planning to develop statewide standardized policies and
procedures for operating electric vehicle charging stations, fee-based or no fees, maintenance of
equipment, reporting/tracking usage data, etc. This may be accomplished through the
establishment of a task force consisting of representatives from the CDCR divisions/branches
designated with interrelated areas of responsibility.
Figure 30- Workplace Electric Vehicle Charging – CAC

97
CHAPTER FIVE
WATER EFFICIENCY &
CONSERVATION
98
CHAPTER 5: WATER EFFICIENCY & CONSERVATION OVERVIEW CDCR’s construction program has aimed to improve efficiency of key water systems in the last
10 years, or more, through its CALGREEN and LEED efforts and has furthered the goals of water
conservation through changes in operational practices. Some of its water efficiency projects
have included the installation of water efficiency fixtures and plumbing controls, as well as
commercial grade equipment. Many of these projects predate any requirements established by
recent executive orders. One of the most significant water savings achieved by CDCR, for
example, was through its installation of devices installed on inmate toilets, starting in 2006,
which regulate the amount of flushes in a specified time frame. These devices, on average,
resulted in water savings of 40 percent or more at prisons statewide. More recent water
conservation efforts have included changes to operational procedures to further reduce water
consumption as required through CDCR’s implementation of Drought Action Plans.
CDCR will continue to investigate opportunities that will make the water savings permanent;
however, CDCR has challenges that make project development complex. A recent facility
condition assessment (of aging infrastructure) conducted by a third party has identified a
backlog of infrastructure repairs and replacements at a cost of over $10 billion. Where possible,
CDCR pairs an infrastructure repair or replacement project with a water efficiency opportunity
to address both critical needs. Another challenge is the availability of financing or grants for
water efficiency projects for CDCR facilities. CDCR has applied for and received grants;
however, this funding is limited when compared to the potential opportunities for water
efficiency projects throughout the Department.
Through the efforts implemented thus far,
CDCR has reduced the amount of water
usage by 45 percent since 2003, a decrease of
over 5.1 billion gallons of water. EO B-18-12
requires State Agencies to reduce agency-
wide water use 10 percent by 2015 and 20 percent by 2020 as measured against a 2010
baseline. Through 2016, CDCR has exceeded the target by an additional 9 percent. For
EO B-29-15, CDCR has exceeded the State Water Resources Control Board (SWRCB) statewide
target to reduce potable water use by 25 percent by saving 28 percent between 2013 through
February 2016.
Through the continued efforts of CDCR’s current and ongoing programs, projects, and
objectives, CDCR is on track to meet or exceed the overall GHGe, energy, water, and renewables
goals and objectives set forth by the Administration and its own ambitious sustainability
agenda, including being a leader in advancing and meeting the goals and objectives of
EOs B-18-12 and B-29-15.
OUR ANNUAL WATER SAVINGS 4+ billion-gallon reduction from 2003 7,182 Olympic-size swimming pools

99
I. WATER EFFICIENCY & CONSERVATION GOALS The Governor has issued numerous executive orders directing sustainable State operations. The
orders and related policy guidelines implementing those orders relevant to water efficiency and
conservation are:
Executive Order B-18-12 EO B-18-12 and the companion Green Building Action Plan require State Agencies to reduce the
environmental impacts of State operations by reducing GHGe, managing energy and water use,
improving indoor air quality, generating on-site renewable energy when feasible, implementing
environmentally preferable purchasing, and developing the infrastructure for electric vehicle
charging stations at State facilities. The Green Building Action Plan also established two
oversight groups; the staffs level Sustainability Working Group and the executive level
Sustainability Task Force, to ensure these measures are met.
EO B-18-12 requires State Agencies to reduce agency-wide water use 10 percent by 2015 and
20 percent by 2020, as measured against a 2010 baseline. The 2015 and 2020 targets reinforce
the SB X7-7 requirement that State Agencies reduce water use at facilities they operate to
support local water suppliers in meeting their targets.
On February 28, 2013, the California Department of Water Resources issued its Water Use
Reduction Guidelines and Criteria, pursuant to EO B-18-12. Each applicable agency was required
to take actions to reduce water use in facilities and landscapes that are operated by the State,
including facilities owned, funded or leased. State operated facilities are defined as facilities
where the agency has direct control of the buildings’ function, maintenance and repair. For
leased facilities, the Green Building Action Plan directed that new and renegotiated leases
include provisions for water conservation, reporting water use and installation of sub-meters to
the extent possible and economically feasible.
All the following sections in this water plan and the associated worksheet only repeat the initial
criteria and guidelines issued. Only the Model Water Efficient Landscape Ordinance (MWELO)
requirements have been updated. Additionally, other executive orders have followed,
strengthening and elaborating on the issues contained in EO B-18-12.
Beginning January 2013, EO B-18-12 required Agencies to regularly report current water use
into the water tracking database. Since January 2014, annual water use reports have
documented progress towards the 2015 and 2020 targets using the ESPM Database to track
energy and water use and to submit annual reports to DGS. Additionally, for facilities with
landscape areas over 20,000 sq. ft., landscape water use must be tracked with a water budget
program.
Executive Order B-29-15 EO B-29-15 directs State Agencies to take actions in response to the ongoing drought and to the
State of Emergency, due to severe drought conditions, proclaimed on January 17, 2014. The
Governor directed numerous State Agencies to develop new programs and regulations to
mitigate the effects of the drought and required increased enforcement of water waste
100
state-wide. Agencies were instructed to reduce potable urban water use by 25 percent through
February 2016 when compared to 2013.
Executive Order B-30-15 EO B-30-15 declared climate change to be a threat to the well-being, public health, natural
resources, economy, and environment of California. It established a new interim statewide
GHGe reduction target of 40 percent below 1990 levels by 2030, and reaffirms California’s
intent to reduce GHGe by 80 percent below 1990 levels by 2050. To support these goals, this
order requires numerous State Agencies to develop plans and programs to reduce emissions.
Executive Order B-37-16 EO B-37-16 builds on what were formerly temporary statewide emergency water restrictions in
order to establish longer-term water conservation measures. It includes permanent monthly
water use reporting, new permanent water use standards in California communities, and bans
on clearly wasteful practices such as hosing off sidewalks, driveways, and other hardscapes.
The EO focuses on using water more wisely and eliminating water waste by taking actions to
minimize water system leaks. The Department of Water Resources (DWR) estimates that leaks
in water district distribution systems siphon away more than 700,000 acre-feet of water a year
in California, enough to supply 1.4 million homes for a year.
The EO further strengthens local drought resilience and to improve agricultural water use
efficiency and drought planning. State Agencies are to cooperate with urban water management
plans, which include plans for droughts lasting for at least five years, by assuring that the water
efficiency and conservation plan has drought contingency actions.
State Administrative Manual & Management Memos The following sections of the State Administrative Manual (SAM) and associated MM currently
impose sustainability requirements including those specifically for water in departments under
the Governor’s executive authority:
SAM Sections
• Landscaping practices 1821.5 - State building and facility managers will adopt the
following landscaping practices:
o Reduce landfill waste material and water use
o Promote the purchase of sustainable plants and maintenance materials
o Maintain a healthier outdoor environment
• Drought moratorium 1821.4 - The Emergency Drought Proclamation dated
January 17, 2014, places a moratorium on new, non-essential landscaping projects at
State facilities and on State highways and roads. Projects that are not needed to protect
existing trees and shrubs or are not necessary for erosion or dust control are considered
non-essential.

101
Relevant Management Memos
• MM 15-06: State Buildings and Grounds Maintenance and Operation - This MM provides
State building and facility managers with practices and procedures to achieve
operational efficiencies and resource conservation measures for: Integrated Pest
Management (IPM), Drought Moratorium, Landscaping Practices, and Maintenance of
Building Exteriors, Roofs, Hardscape, and Exterior Painting.
• MM 14-02: Water Efficiency and Conservation - This MM provides direction to all State
Agencies under the Governor’s executive authority on meeting the water use reduction
requirements outlined in EO B-18-12. In addition, State Agencies should prepare for the
possibility that additional conservation measures could be required in 2014 to address
the anticipated statewide drought conditions.
• MM 14-07: Standard Operating Procedures for Energy Management in State Buildings -
This MM amends the Standard Operating Efficiency Procedures regarding efficient
energy management in State buildings during normal operations, as specified in
EO B-18-12 and the Green Building Action Plan.
Relevant Legislation Sustainable Groundwater Management Act of 2014 - The Sustainable Groundwater Management
Act (SGMA) directs the DWR to identify groundwater basins and sub-basins in conditions of
critical overdraft. Conditions of critical overdraft result from undesirable impacts, which can
include seawater intrusion, land subsidence, groundwater depletion, and/or chronic lowering of
groundwater levels. As defined in the SGMA, “A basin is subject to critical overdraft when
continuation of present water management practices would probably result in significant
adverse overdraft-related environmental, social, or economic impacts.”
As required in the SGMA, basins designated as high or medium priority and critically over
drafted shall be managed under a Groundwater Sustainability Plan or coordinated groundwater
sustainability plans by January 31, 2020. All other high and medium priority basins shall be
managed under a groundwater sustainability plan by January 31, 2022.
Senate Bill X7-7, also known as The Water Conservation Act of 2009, specifies urban water
consumption reduction requirements.
II. WATER EFFICIENCY & CONSERVATION REPORT This Water Efficiency and Conservation Report demonstrates to the Governor and the public
the progress the Department has made toward meeting the Governor’s goals. This report
identifies successful accomplishments, ongoing efforts, and outstanding challenges.
Introduction California experiences the most extreme variability in yearly precipitation in the nation. In
2015, California had record low statewide mountain snowpack of only 5 percent of average,
while 2012 - 2014 were the four driest consecutive years of statewide precipitation in historical
record. Since then, the 2017 water year (October 1, 2016 - September 30, 2017) has surpassed
the wettest year of record (1982 - 1983) in the Sacramento River and San Joaquin River

102
watersheds and was close to becoming the wettest year in the Tulare Basin (set in 1968 - 1969).
These potential wide swings in precipitation from one year to the next show why California
must be prepared for either flood or drought in any year, therefore, using water wisely is
critical.
The EO and SAM sections listed in the previous section help demonstrate the connection
between water and energy use (the water-energy nexus), water and climate change, and water
and landscaping. Further, the impact of water uses by State Agencies goes beyond the scope of
these EOs, SAM sections, and DGS MM because these documents do not address related issues
such as, water runoff from landscaping and various work processes, the potential for water
pollution or the benefits of water infiltration, soil health, and nutrient recycling. However, by
using holistic water planning, a well-crafted water plan can not only meet all State requirements
but add considerable value and benefits to the organization and surrounding communities.
CDCR Mission and Built Infrastructure The CDCR mission is to improve public safety through law enforcement that provides for the
safe and secure incarceration of the State’s most serious and violent felons, and to provide
parole supervision and develop and implement rehabilitative strategies to successfully
reintegrate offenders back into their communities.
CDCR’s building portfolio, on average, is nearly 50 years old, with its two oldest facilities being
more than 100 years old. A large majority of CDCR’s facilities are in need of substantial repairs
or upgrades to maintain their usability.
CDCR employs over 56,000 persons and maintains infrastructure for 34 State-owned adult
institutions, 3 juvenile facilities, 6 facilities in “warm shut down” (minimal operations/no
inmates) and a training academy housing cadets. Its facilities include over 49 million square
feet of State-owned building space on over 24,000 acres of land statewide. The footprint per
facility ranges from 82,000 to over 3.3 million square feet.
The CDCR-owned facilities are composed of inmate housing living units, kitchens, dining,
vocational, education, factories, laundry, medical, dental, administration buildings, and other
process-oriented systems such as Waste and/or Water Treatment Plants and Central Plants.
Unlike more typical commercial building settings, CDCR’s water needs are often served through
its own on-site wells, reservoirs and/or water treatment plants.
CDCR’s total water usage has been declining steadily since the baseline year of 2003. See
Table 33 on the following page for actual usage.

103
Table 33- Historical Annual Water Usage
Year Gallons Water Savings
compared to 2003 Gallons
Water Savings compared to 2003
%
2003 11,386,443,127
2010 8,792,331,651 2,594,111,476 23%
2013 8,452,234,392 2,934,208,735 26%
2014 7,121,071,080 4,265,372,048 37%
2015 6,287,053,223 5,099,389,904 45%
2016 6,220,281,222 5,166,161,905 45%
CDCR currently does not track the costs associated with the purchase of water, as not all
institutions purchase water. Several institutions pump water from wells and treat it on-site or
create potable water. The institutions with the largest per capita water use are shown in
Table 34.
Table 34- Properties with Largest Water Use Per Capita in 2016
Building Name Area (ft2) Total Gallons Gallons per
Capita*
California Institution for Men 1,748,957 329,659,200 171
California State Prison, Corcoran 1,652,194 345,389,000 169
Folsom State Prison 1,008,640 172,829,500 137
Deuel Vocational Institution 1,202,847 159,246,000 135
California State Prison, Sacramento 1,324,762 174,329,500 114
Total for Buildings in This Table 6,937,400 1,181,453,200 ---
Total for All Department Buildings 49,091,627 6,202,415,100 ---
% of Totals 14 % 19 % ---
*Includes inmates and staff
CDCR’s largest landscape areas, including turf and landscaping, are shown in Table 35 on the
following page.

104
Table 35- Properties with Largest Landscape Area
Institution Area (ft2)
Mule Creek State Prison 3,475,090
Pleasant Valley State Prison 3,013,145
San Quentin State Prison 2,580,391
California Institution for Men 1,895,526
California Medical Facility 1,780,548
Total for Institutions in This Table 12,744,000
Total for All Institutions 36,682,490
% of Totals 35 %
CDCR’s challenges in meeting the Administration’s water conservation goals:
• 24-hour operations – Unlike typical office environments that have core days/hours of
operation, CDCR operates on a 7 day, 24-hour basis. Water usage is continuous given
the fact that CDCR building infrastructure includes housing units for inmates and the
staff necessary to maintain 24-hour operations.
• Unique utility drivers – The size of CDCR institutions has created a need to function
independently of typical city- or county-provided services. Unlike typical office building
environments, CDCR operates many water and wastewater plants serving its facilities.
Some plants even serve the surrounding properties, both public and private. The sheer
size of many of these systems are often expensive to replace with higher efficiency
systems, leading to increased costs of operation until sufficient funding is identified.
• Aging infrastructure – CDCR is not sufficiently funded to address its aging
infrastructure. Recent facility condition assessments conducted by a third party have
identified a backlog of infrastructure repairs and replacements at more than $10 billion.
The backlog of deferred projects is increasing each year, and efficiency projects are
competing against those needs. Where possible, CDCR pairs a needed infrastructure
repair or replacement with a water efficiency opportunity to address both areas.
• Limited Operations and Maintenance budget – Each facility’s operation and maintenance
budget is based on the number of inmates housed, regardless of building square
footage. The budget is based upon a set amount of $277 per inmate, per year. That total
is divvied up between 34 State-owned institutions for their respective annual
maintenance allowance. This can impact each facility’s ability to service its equipment as
needed in order to maintain maximum efficiency.
• Financing/Grants – CDCR requires additional funds, beyond the insufficient facility
operations funds that are currently provided, in order to implement more water
efficiency projects that will permanently reduce water usage; however, there are limited
grant opportunities currently available for State government agencies like CDCR. CDCR
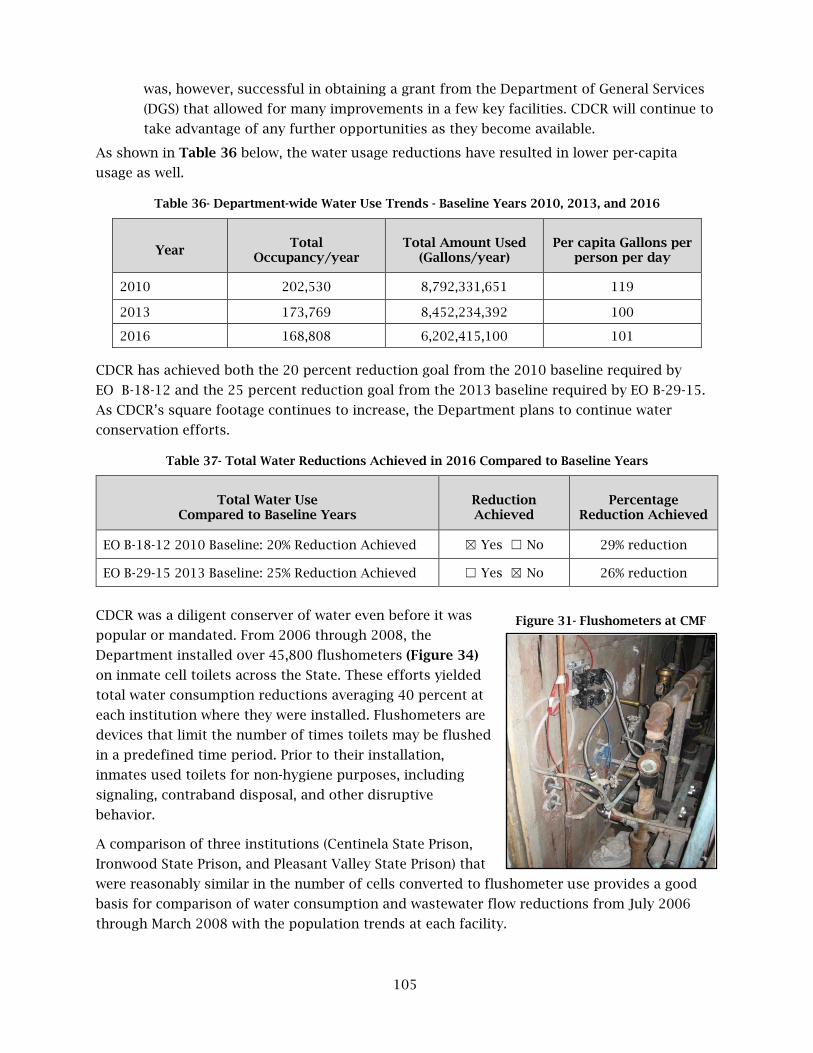
105
was, however, successful in obtaining a grant from the Department of General Services
(DGS) that allowed for many improvements in a few key facilities. CDCR will continue to
take advantage of any further opportunities as they become available.
As shown in Table 36 below, the water usage reductions have resulted in lower per-capita
usage as well.
Table 36- Department-wide Water Use Trends - Baseline Years 2010, 2013, and 2016
CDCR has achieved both the 20 percent reduction goal from the 2010 baseline required by
EO B-18-12 and the 25 percent reduction goal from the 2013 baseline required by EO B-29-15.
As CDCR’s square footage continues to increase, the Department plans to continue water
conservation efforts.
Table 37- Total Water Reductions Achieved in 2016 Compared to Baseline Years
Total Water Use Compared to Baseline Years
Reduction Achieved
Percentage Reduction Achieved
EO B-18-12 2010 Baseline: 20% Reduction Achieved ☒ Yes ☐ No 29% reduction
EO B-29-15 2013 Baseline: 25% Reduction Achieved ☐ Yes ☒ No 26% reduction
CDCR was a diligent conserver of water even before it was
popular or mandated. From 2006 through 2008, the
Department installed over 45,800 flushometers (Figure 34)
on inmate cell toilets across the State. These efforts yielded
total water consumption reductions averaging 40 percent at
each institution where they were installed. Flushometers are
devices that limit the number of times toilets may be flushed
in a predefined time period. Prior to their installation,
inmates used toilets for non-hygiene purposes, including
signaling, contraband disposal, and other disruptive
behavior.
A comparison of three institutions (Centinela State Prison,
Ironwood State Prison, and Pleasant Valley State Prison) that
were reasonably similar in the number of cells converted to flushometer use provides a good
basis for comparison of water consumption and wastewater flow reductions from July 2006
through March 2008 with the population trends at each facility.
Year Total
Occupancy/year Total Amount Used
(Gallons/year) Per capita Gallons per
person per day
2010 202,530 8,792,331,651 119
2013 173,769 8,452,234,392 100
2016 168,808 6,202,415,100 101
Figure 31- Flushometers at CMF

106
• Centinela State Prison: 2,080 cells converted - The flushometer installation started in
March 2007 and was completed in November 2007. The wastewater flow prior to
installation averaged roughly 30 million gallons a month. The average wastewater flow
after installation was approximately 21 million gallons. The water consumption at this
facility also shows a similar trend with a reduction of approximately 30 percent.
• Ironwood State Prison: 2,000 cells converted - The flushometer installation started in
September of 2007 and completed in 2008 The wastewater flow at this facility prior to
installation averaged roughly 45 million gallons a month. At 80 percent installation, the
average wastewater flow for Ironwood State Prison reduced to approximately 25 million
gallons, a reduction of almost 45 percent.
• Pleasant Valley State Prison: 2,100 cells converted - The flushometer installation started
in July 2007 and was completed in February 2008. The wastewater flow prior to
installation averaged approximately 3 million gallons a month. This was reduced to
almost 15 million gallons by February 2008. The water consumption prior to installation
averaged roughly 32 million gallons a month and decreased to almost 16 million gallons
after installation. The water consumption and wastewater flow each had a reduction of
approximately 50 percent.
Despite the challenges previously discussed, CDCR has been successful in obtaining grants
through DGS and has found program savings to complete water efficiency projects. Between
2014 and 2017, CDCR completed water conservation projects at 33 institutions for a total
annual water savings of over 150 million gallons. Most of these projects replaced toilets,
faucets and showerheads, but some included new high efficiency scullery equipment like the
new dishwasher at Avenal State Prison (Figure 32).
CDCR institutions utilize boilers for hot water and steam production. Through the Investor-
Owned Utility (IOU) partnership, various loans, and utilizing the Energy Service Company
(ESCO) pool, CDCR has completed many energy efficiency projects that also realized substantial
water savings. Table 38 details projects at various institutions.
Figure 32- New Dishwasher at ASP

107
Table 38- Summary of Boilers and Cooling Systems Projects Completed or In Progress
Year Funded
Institution Project Status
2009 PVSP Water Treatment Plant Upgrades Complete
2009 SVSP Condenser Coil Replacements Complete
2010 CCI Point of Use Boilers (removed two housing
units from central plant) Complete
2011 CIM Replaced PIA Boiler with High Efficiency
Model Complete
2011 COR Replaced Hot Water Heaters Complete
2011 CRC Replaced Boilers with High Efficiency
Models Complete
2011 NKSP Installed Instantaneous Water Heaters Complete
2012 CTF Replaced Boilers with High Efficiency
Models Installed
2014 WSP Replaced Boilers with High Efficiency
Models Complete
2015 CIM Reservoir Renovation and Leak Repair Complete
2016 PBSP Hydronic Loop Replacement Complete
2016 ASP Replace Steam and Condensate loop In Construction
2016 MCSP Replace Hydronic Loop In Construction
2017 ASP Hydronic Loop Replacement In Construction
2017 SAC Replace Underground Steam and
Condensate Return Complete
2017 DVI New Boiler In Design
2017 SQ New Boiler In Design
N/A CCI Replace Steam and Condensate Return Planned, Unfunded
N/A CIW Repair Hydronic Piping Loop Planned, unfunded
N/A CMC Repair Steam and Condensate Return Planned, Unfunded
N/A COR Replace Hot Water and Hydronic Loop Planned, Unfunded
N/A SOL Replace Hydronic Loop Planned, Unfunded
N/A SQ Repair Steam and Condensate Return Planned, Unfunded
Water Shortage Contingency Plans and Critical Groundwater Basins
Urban water suppliers are required to maintain Water Shortage Contingency Plans that are
customized to local conditions. These Plans include a staged response to water shortages and

108
droughts lasting up to three years. When implementing the stages of the Water Shortage
Contingency Plan, the water supplier will require increasingly stringent reductions in water use.
EO B-37-16 requires DWR to propose strengthened requirements for these Plans, including,
among other proposed changes, the creation of common standards for each stage in the Plan
and extending the drought planning from three to five years. For smaller water suppliers and
rural communities not required to maintain a Water Shortage Contingency Plan, DWR proposes
to work with counties to facilitate improved drought planning.
DWR has released the public draft of these proposed requirements, found here: Making Water
Conservation a California Way of Life.
State Agencies are to be aware of their water suppliers’ Water Shortage Contingency Plan and
the potential impact each stage may have on their water use. State Agencies are to have their
own contingency plans in place for their building and landscaping water use in order to
respond to any stage implemented by the water supplier.
The Sustainable Groundwater Management Act (SGMA) established a new structure for
managing California’s groundwater resources at a local level by local agencies. SGMA required,
by June 30, 2017, the formation of locally controlled groundwater sustainability agencies (GSAs)
in the State’s high- and medium-priority groundwater basins and sub-basins (basins). A GSA is
responsible for developing and implementing a groundwater sustainability plan (GSP) to meet
the sustainability goal of the basin to ensure that it is operated within its sustainable yield,
without causing undesirable results. For those facilities located in critical groundwater basins,
State Agencies are to work with the local GSA plan.
CDCR reacted immediately to all Executive directives during the recent drought and has
continued to maintain water conservation directives. CDCR developed a statewide Drought
Action Plan and required each institution to develop a site-specific plan as well. Each institution
selected a Water Conservation Manager (WCM) to lead Drought Task Force Teams. Each WCM
worked closely with their water suppliers and with DWR to ensure coordination, especially at
institutions located in critical groundwater basins. The WCMs also worked with CDCR’s FPCM to
ensure water shortage contingency plans were in place.
Number of Institutions with urban water shortage contingency plans.
45
Number of Institutions in critical groundwater basins
12
Total Amount of water used by buildings in critical groundwater basins (Gallons)
1,369,931,800
The original Drought Action Plan from 2013 is still enforced with one exception, to allow for
limited irrigation of the institution’s recreational yards. Figure 33 shows the 2017 Updated
Drought Action Plan.
Table 39- Institutions with Urban Water Shortage Contingency Plans and in Critical Groundwater Basins
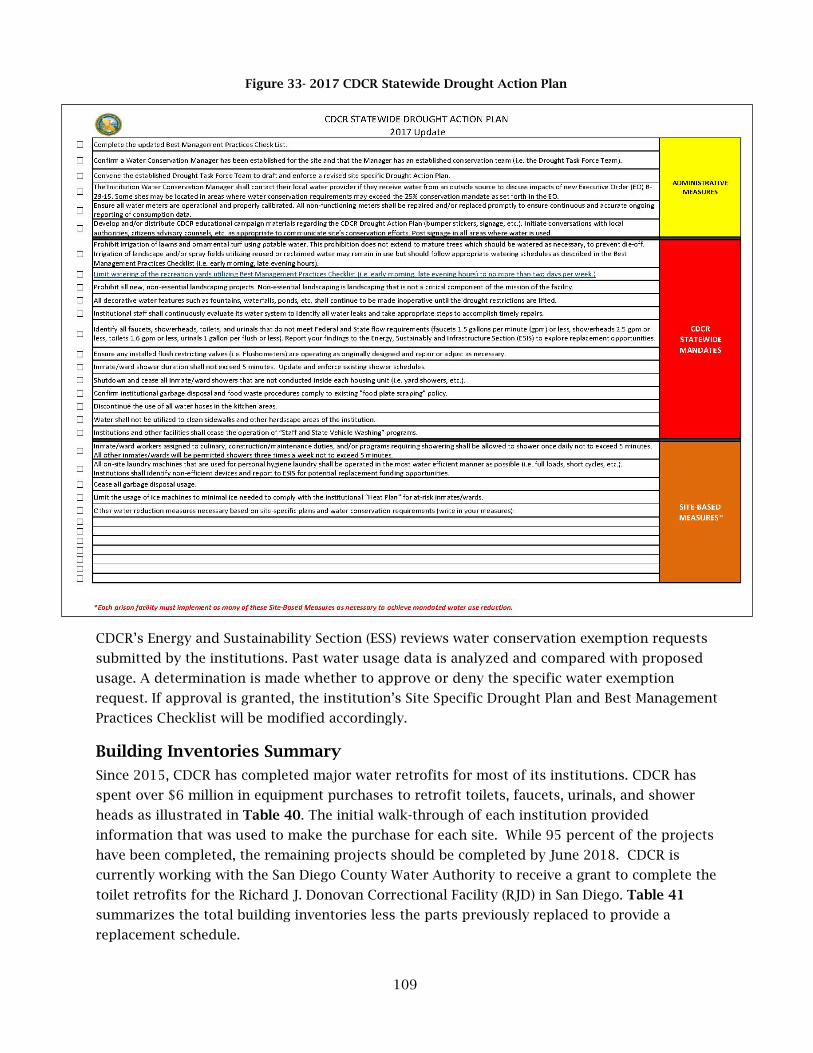
109
CDCR’s Energy and Sustainability Section (ESS) reviews water conservation exemption requests
submitted by the institutions. Past water usage data is analyzed and compared with proposed
usage. A determination is made whether to approve or deny the specific water exemption
request. If approval is granted, the institution’s Site Specific Drought Plan and Best Management
Practices Checklist will be modified accordingly.
Building Inventories Summary
Since 2015, CDCR has completed major water retrofits for most of its institutions. CDCR has
spent over $6 million in equipment purchases to retrofit toilets, faucets, urinals, and shower
heads as illustrated in Table 40. The initial walk-through of each institution provided
information that was used to make the purchase for each site. While 95 percent of the projects
have been completed, the remaining projects should be completed by June 2018. CDCR is
currently working with the San Diego County Water Authority to receive a grant to complete the
toilet retrofits for the Richard J. Donovan Correctional Facility (RJD) in San Diego. Table 41
summarizes the total building inventories less the parts previously replaced to provide a
replacement schedule.
Figure 33- 2017 CDCR Statewide Drought Action Plan

110
Table 40- Summary of Indoor Water Efficiency Projects Completed or In Progress
Efficiency Project Name Facility Year
Begun
Completion Date
(or Estimate) Status
Est. Annual Water Savings (Gallons)
Grant - Dishwashers ASP 2015 6/30/2017 Complete 5,683,780
Faucets ASP 2015 3/30/2017 Complete 819,060
Grant - Toilets, Faucets CAL 2015 6/30/2017 Complete 3,780,086
Toilets, Faucets, Showerheads CAL 2015 5/30/2016 Complete 131,400
Toilets, Faucets, Showerheads CCC 2015 6/30/2018 75% 6,861,416
Toilets, Faucets, Showerheads CCI 2015 6/30/2018 53% 397,120
Toilets, Showerheads CCWF 2015 12/1/2016 Complete 5,485,220
Showerheads CEN 2015 7/1/2016 Complete 536,550
Toilets, Showerheads CIM 2015 12/30/2016 Complete 1,642,500
Grant - Toilets/Sink Combo Units CIW 2015 4/30/2017 Complete 32,794,900
Grant - Urinals CMC 2015 6/30/2018 9% 3,723,000
Toilets, Showerheads CMC 2015 5/30/2016 Complete 1,795,800
Faucets, Showerheads CMF 2015 12/30/2016 Complete 136,875
Toilets, Showerheads COR 2015 6/30/2018 95% 1,988,520
Toilets, Faucets, Showerheads CRC 2015 6/30/2018 97% 1,760,760
Faucets, Showerheads CTC 2015 12/30/2016 Complete 328,500
Showerheads CVSP 2015 6/30/2016 Complete 821,250
Toilets, Faucets DVI 2015 6/30/2018 80% 199,509
Grant - Faucets FSP 2015 6/30/2018 75% 7,227,000
Toilets, Faucets, Showerheads FSP 2015 12/30/2016 Complete 2,764,328
Toilets, Faucets, Showerheads HDSP 2015 12/31/2017 99% 901,696
Toilets, Faucets, Showerheads ISP 2015 5/15/2016 Complete 328,700
Faucets, Showerheads KVSP 2015 6/30/2018 85% 2,072,835
Toilets, Showerheads LAC 2015 6/30/2016 Complete 1,226,400
Toilets, Faucets MCSP 2015 6/30/2016 Complete 616,850
Showerheads NKSP 2015 12/31/2016 Complete 109,500
Toilets, Faucets, Showerheads PBSP 2015 6/30/2018 67% 8,647,215
Toilets PVSP 2015 10/31/2016 Complete 23,579
Grant - Toilets, Faucets RJD 2015 6/30/2017 Complete 41,007,487
Grant - Toilets, Faucets, Showerheads SAC 2015 6/30/2018 64% 1,870,829
Toilets, Faucets, Showerheads SCC 2015 6/30/2017 Complete 1,057,040
Toilets, Faucets, Showerheads SOL 2015 10/31/2016 Complete 2,711,585
Toilets SQ 2015 6/30/2017 Complete 1,102,008
Faucets, Showerheads SVSP 2015 6/30/2018 40% 3,832,500
Toilets, Faucets, Showerheads VSP 2015 6/30/2016 Complete 1,004,480
Toilets, Faucets, Showerheads VYCF 2015 6/30/2016 Complete 1,213,698
Toilets, Faucets, Showerheads WSP 2015 1/31/2017 Complete 1,971,000
Totals 148,574,976

111
Table 41- Summary of Department Inventory Needs
Item Original
Inventory Previously retrofitted
Replacement Need
Number of toilets to be replaced with 1.25 gallon per flush
30,868 4,207 26,661
Number of faucets to be replaced 56,128 7,449 48,679
Number of toilet/sink combo units to be replaced
29,168 943 28,225
Number of showerheads to be replaced at 2.0 gpm
25,030 3,746 21,284
Heating and Cooling Systems Inventories Summary
CDCR has an extensive system of boilers and other HVAC systems throughout its institutions.
Refer to Table 38 for a list of previously completed and planned projects.
Table 42- Summary of Boilers and Cooling Systems Inventory
Amount of water used for make-up (Gallons) 2,992,862
Number of flash tanks to purchase and install 6
Number of meters to purchase and install 24
Amount currently reused (Gallons) 144,877
Remaining additional water suitable for other purposes such as irrigation (Gallons)
21,444,000
Irrigation Hardware Inventories Summary Landscaping typically uses 50 percent or more of an Agency’s total water use. While
landscaping serves critical functions, the accompanying irrigation hardware, if not properly
installed and maintained, can contribute to water waste. By reviewing and inventorying all
irrigation hardware, it is possible to achieve significant water savings.
Figure 34- Original Toilet and Sink at CIW
Figure 35- Retrofitted Toilet/Sink Combo at CIW

112
CDCR has not specifically developed landscaping water budgets for its facilities due to the
limitations in place to restrict landscape watering. However, if all water restrictions were lifted,
Table 43 below summarizes what irrigation hardware would be needed for all institutions.
Table 43- Summary of Irrigation Hardware Inventory
Number of separate meters or sub-meters to purchase and install 204
Number of irrigation controllers required with weather or soil moisture adjustment and flow sensing capabilities to purchase and install
775
Number of backflow prevention devices to purchase and install 213
Number of flow sensors to purchase and install 213
Number of new pressure regulators to purchase and install 1,270
Number of new hydro zones needed 978
Number of new valves to purchase and install 995
Number of filter assemblies to purchase and install 211
Amount of drip irrigation to purchase and install (area covered) 57,228,357
Living Landscape Inventory
Far from being just an aesthetic or ornamental feature, landscaping plays a critical role around
public buildings and facilities. From providing safety and security, to reducing local heat
islands, suppressing dust, reducing water runoff, maintaining soil health, aiding in water
filtration and nutrient recycling; landscaping around public buildings is essential. Furthermore,
landscaping in public places frequently surrounds historic places and public memorials as well
as providing pleasant public gathering spaces. The health and proper maintenance of these
landscapes is vital to the physical wellbeing of California’s people as well as to its social,
cultural, political, and historical life.
Additionally, the many vital ecosystem functions carried out by living public landscaping are
critical in helping California meet its goals for greenhouse gas reduction, climate adaptation,
water and energy efficiency, and water conservation. Urban forests are vital to improve site
conditions for occupants and visitors to buildings and the surrounding communities. Large
shade trees should be considered valuable infrastructure and given priority over other plants to
maintain tree health. A voluntary urban forest plan is encouraged to assess individual trees and
plan for additional tree plantings.
During the design and construction of the California Health Care Facility (CHCF), CDCR
incorporated landscape elements (bioswales) to remove silt and pollution from surface runoff
water. In another of its facilities, CDCR installed a permeable paved parking lot that allowed
surface water to percolate through the asphalt and into the water table below to recharge the
table and avoid water runoff. There are other opportunities under consideration for rain
catchment systems in facilities with high precipitation levels to capture and redistribute excess
rain.
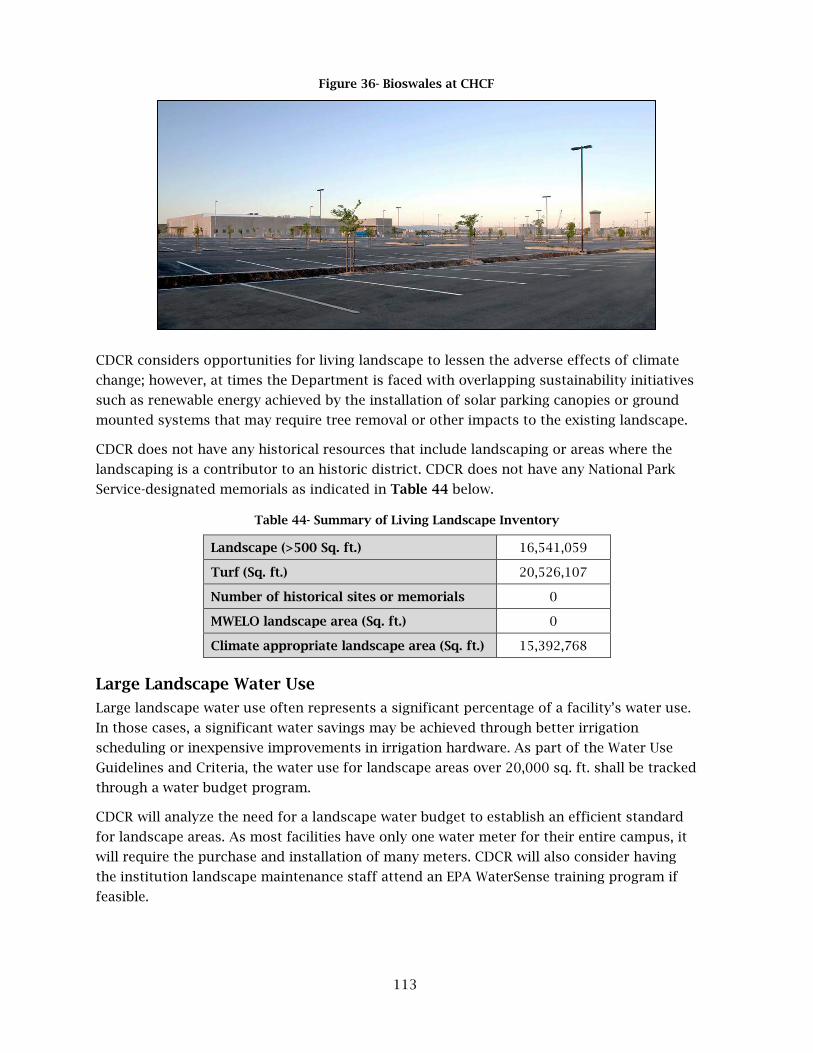
113
CDCR considers opportunities for living landscape to lessen the adverse effects of climate
change; however, at times the Department is faced with overlapping sustainability initiatives
such as renewable energy achieved by the installation of solar parking canopies or ground
mounted systems that may require tree removal or other impacts to the existing landscape.
CDCR does not have any historical resources that include landscaping or areas where the
landscaping is a contributor to an historic district. CDCR does not have any National Park
Service-designated memorials as indicated in Table 44 below.
Table 44- Summary of Living Landscape Inventory
Landscape (>500 Sq. ft.) 16,541,059
Turf (Sq. ft.) 20,526,107
Number of historical sites or memorials 0
MWELO landscape area (Sq. ft.) 0
Climate appropriate landscape area (Sq. ft.) 15,392,768
Large Landscape Water Use
Large landscape water use often represents a significant percentage of a facility’s water use.
In those cases, a significant water savings may be achieved through better irrigation
scheduling or inexpensive improvements in irrigation hardware. As part of the Water Use
Guidelines and Criteria, the water use for landscape areas over 20,000 sq. ft. shall be tracked
through a water budget program.
CDCR will analyze the need for a landscape water budget to establish an efficient standard
for landscape areas. As most facilities have only one water meter for their entire campus, it
will require the purchase and installation of many meters. CDCR will also consider having
the institution landscape maintenance staff attend an EPA WaterSense training program if
feasible.
Figure 36- Bioswales at CHCF

114
CDCR has implemented a number of natural
infrastructure solutions to mitigate the
impacts of its projects. Earlier projects have
funded and planned wetlands restoration or
preservation projects, such as the installation
of bioswales at the California Health Care
Facility in Stockton, and more recently,
wetlands avoidance and restoration at a
construction site completed in 2016.
With drought restrictions lessened at most
CDCR locations, CDCR will evaluate living
landscape opportunity in future planning
efforts. For example, planting additional trees
to mitigate heat island impacts and using drought-tolerant native plants and landscape is a
clear opportunity for inclusion in new projects. Reducing the heat island effect within prison
yards is also underway, as the Department has completed several gardens inside prison walls
with more planned. These gardens are also meant to be therapeutic and help educate the
offender population about the value of preserving the natural environment.
Table 45- Summary of Large Landscape Inventory and Water Budget
Number of Facility Sites/Locations with > 20,000 Sq. ft. of Landscaping
40
Average Total Landscape Area per Facility (Sq. ft.) 375,433
Total Water Budget per Facility TBD
Total EPA WaterSense or Irrigation Association Certified Staff
TBD
Best Management Practices CDCR developed Best Management Practices (BMPs) for water conservation in 2008. Each
institution developed site-specific water conservation practices based upon a statewide
template. During the recent drought, CDCR developed a Statewide Drought Action Plan and
required each institution to develop a site-specific plan and designate a WCM to lead Drought
Task Force Teams. The Drought Action Plan required the institutions to update their site
specific BMPs. After the BMPs were updated, institution staff were tasked with monitoring and
inspecting to ensure compliance. Any issues or discrepancies were addressed at the
institutional level. The BMPs will continue to be updated as needed and CDCR will consider
incorporating a matrix for priority watering of key landscape areas. Below is the most recent
statewide compilation of BMPs.
General
• Verify preventive maintenance schedules and work order requests are current for all
water related systems identified in the checklist.
Figure 37- Climate-appropriate Landscape at CCI

115
• Do not duplicate already completed activities. Coordinate all inspection and routine
maintenance indicated below with recently completed regular inspections/preventive
maintenance activities. Accelerate activities only as required to meet the goals of the
Water Management and Conservation "Quick Check."
• Verify that all maintenance and repair activities related to water systems are
documented in all standard maintenance activity logs, work order request systems, and
SAPMS.
• Identify and investigate all miscellaneous water use that could be considered
non-essential.
• Identify, modify, or establish procedures to minimize or eliminate non-essential water
use.
o Examples: Unused building areas, building wash-downs, sweeping instead of
mopping or wash-downs.
• Institutions shall maintain landscape irrigation systems at designed levels unless
directed otherwise by CDCR Executive Management. Comply with 2017 CDCR Statewide
Drought Action Plan.
Water Management Planning
• Create a written water management and conservation policy statement addressed to
staff that addresses CDCR's short-term water conservation goal, as well as expresses a
commitment to long-term water management efficiency at the institution.
• Publicize the water management and conservation policy statement to staff and send a
copy of the statement to Facilities Asset Management Branch (see contact information).
• Establish procedures to read the main facility water meter monthly and to report
information to Facilities Asset Management Branch as required (see contact information
and water use reporting information).
Information and Education Programs
• Post informational graphics and other staff outreach information provided to each
institution according to accompanying instructions as part of a CDCR departmental
water conservation outreach campaign.
• Develop a method to make staff aware of monthly water consumption.
Distribution System Audits, Leak Detection and Repair
• Perform a basic visual/audible leak detection survey of the primary water delivery and
distribution systems.
• Identify all leaks as to location, affected building system, and relative severity
(severe/minor).
• Repair all leaks as feasible; otherwise verify that all non-repairable leaks are adequately
documented in maintenance management logs, SAPMS, etc.

116
Water-Efficient Landscaping
• Identify, modify, or establish procedures to prevent over-fertilizing and over-pruning.
• Identify, modify, or establish procedures to apply mulch regularly around ground
covers, trees and shrubs.
• Identify, modify, or establish procedures to mow regularly, avoid scalping the turf, and
alternate turf mowing height between low and high to promote deep rooting and less
frequent watering.
• Weed regularly to avoid unwanted plants consuming water.
• Install shut-off nozzles or quick connect couplers for all hoses.
• Replace leaking shut-off nozzles, quick connect couplers and hoses.
• Install faucet timers for hose or hand irrigation.
• Identify, modify, or establish procedures to eliminate using water to clean walkways
adjacent to landscaped areas.
Water-Efficient Irrigation
• Perform a basic visual leak detection survey of the primary irrigation system valves and
distribution lines.
• Identify all leaks as to location and relative severity (severe/minor).
• Repair all leaks as feasible; otherwise temporarily cap off any unrepairable breaks or
significant leaks at the closest feasible location.
• Inspect sprinkler and drip irrigation head function. Identify poor-performing or broken
sprinkler heads. Replace, repair or adjust as required
• Adjust system to minimum specified pressure.
• Verify automatic irrigation controls and timers are functioning correctly.
• Verify irrigation schedules are appropriate for time of day, climate, soil conditions,
plant materials, grading and season.
• Identify, modify, or establish procedures to avoid watering during heavy winds, or
following 48 hours after rain.
• Identify, modify, or establish procedures to adjust irrigation times and durations
seasonally.
Toilets and Urinals
• Repair leaks and restore fixtures to design level of function.
• Adjust fixtures to use the minimum amount of water required for proper function.
• If replacing broken fixtures, install water conserving devices.

117
Faucets and Showerheads
• Repair leaks and fix problems.
• Adjust fixtures to use the minimum amount of water required for proper function.
• If replacing broken fixtures, install water conserving devices.
Boiler/Steam Systems
• Perform a basic visual/audible leak detection survey of the primary steam distribution
pipes and steam traps.
• Identify all leaks as to location and relative severity (severe/minor).
• Repair all leaks as feasible; otherwise verify that all non-repairable leaks are adequately
documented in maintenance management logs, SAPMS, etc. (Be prepared to report data.)
• Inspect piping and main tank insulation; repair or replace as necessary.
• Identify, modify, or establish procedures to reuse steam condensate and boiler
blow-down water for other purposes where feasible.
• Identify, modify, or establish procedures to avoid once-through/single pass operations.
Single Pass Cooling Equipment
• Perform a basic visual/audible leak detection survey of the primary cooling water
distribution pipes.
• Identify all leaks as to location and relative severity (severe/minor).
• Repair all leaks as feasible; otherwise verify that all non-repairable leaks are adequately
documented in maintenance management logs, SAPMS, etc. (Be prepared to report data.)
• Inspect piping, chiller and storage tank insulation; repair or replace as necessary.
Cooling Tower Management
• Perform a basic visual/audible leak detection survey of the primary cooling tower water
distribution pipes.
• Identify all leaks as to location and relative severity (severe/minor).
• Repair all leaks as feasible; otherwise verify that all non-repairable leaks are adequately
documented in maintenance management logs, SAPMS, etc. (Be prepared to report data.)
• Identify, modify, or establish procedures to eliminate once-through/single pass cooling,
or for reusing the water elsewhere in the institution.
• Identify, modify, or establish procedures to use air cooling where feasible.
• Identify, modify, or establish procedures for water treatment to maximize cycles of
concentration.
• Identify, modify, or establish procedures to reuse cooling tower effluent where possible.

118
• Identify, modify, or establish procedures to reuse treated wastewater or other
non-potable water sources for cooling tower make-up.
Commercial Kitchen Equipment
• Perform a basic visual/audible leak detection survey of all kitchen devices using water.
• Identify all leaks as to location and relative severity (severe/minor).
• Repair all leaks as feasible; otherwise verify that all non-repairable leaks are adequately
documented in maintenance management logs, SAPMS, etc. (Be prepared to report data.)
• Clean or replace high pressure pre-rinse spray valves.
• Identify, modify, or establish procedures to eliminate wasteful water use (e.g. do not use
running water to melt ice; operate dishwashing equipment only when needed; wash only
full loads).
• Identify, modify, or establish procedures to reuse final rinse water for garbage disposal
and pre-wash functions.
• Limit garbage disposal use; hand-scrape food trays, receptacles, and utensils into
garbage containers or equip sinks with strainers or mesh screens to divert food waste
from the garbage disposal.
Laboratory/Medical Equipment
• Perform a basic visual/audible leak detection survey of all water distribution systems.
• Identify all leaks as to location and relative severity (severe/minor).
• Repair all leaks as feasible; otherwise verify that all non-repairable leaks are adequately
documented in maintenance management logs, SAPMS, etc. (Be prepared to report data.)
• Identify, modify, or establish procedures to turn off any equipment not in use.
• Inspect solenoids and automatic shut-off valves for proper function and repair or
replace as feasible.
• Verify that all equipment is set to minimum manufacturer pressure and flow rates.
Other Water Use
• Laundries
o Identify, modify, or establish procedures to evaluate wash cycles and
detergent/chemical formulation for maximum efficiency.
o Identify, modify, or establish procedures to avoid excess filter and softener back-
flush.
o Identify, modify, or establish procedures to restrict use of equipment to only full
loads.

119
o Identify, modify, or establish procedures to minimize use of stand-alone washing
machines.
• Vehicle Washing
o Identify, modify, or establish procedures to keep records of water used per
vehicle washed.
o Determine the impacts of eliminating vehicle washing activities.
o Verify all solenoids, valves, nozzles and other equipment are adjusted for
minimum manufacturer pressure and flow rates.
o Inspect jets and hose parts and replace as necessary.
o Identify, modify, or establish procedures to reduce "show foam" to reduce need
for rinse water.
o Identify, modify, or establish procedures to use higher pressure rinses instead of
flood arches.
o Identify, modify, or establish procedures to use chemically compatible washing
solutions and waxes to enable recycling together.
Moving forward, CDCR will continue to evaluate the BMPs and make modifications to
incorporate other water conservation methodologies such as grasscycling, rainwater harvesting,
and other new technologies as they become available.
Monitoring, Reporting, and Compliance
Each State Agency is responsible for monitoring water use and reporting baseline and annual
water use for compliance with the water use reduction targets. Water use shall be measured at
facilities that have meters and sub meters.
CDCR monitors and records water data from each institution on a monthly basis and the data is
entered into the ESPM regularly. CDCR internally tracks and reports the average water usage at
institutions and the percentage of water savings compared to the 2003 Baseline Usage. CDCR
actively participates in the monthly Sustainable Building Workgroup meetings and also reviews
the California Water Plan eNews publication to keep abreast of State legislation, mandates, and
current trends related to water conservation.

120
SUSTAINABILITY MILESTONES &
TIMELINE

121
SUSTAINABILITY MILESTONES & TIMELINE
2012 - EXECUTIVE ORDER B-18-12 & B-16-12 ISSUED
- NEW & RENOVATED BUILDINGS EXCEED T-24 BY 15%
2013 - BUILDINGS <10,000 SQ. FT. MEET CALGREEN TIER 1
- BEGIN WATER USE BENCHMARKING
2015 - LEED O+M CERT. FOR ALL EXIST. BLDGS >50,000 SQ. FT.
- REDUCE WATER USE 10%
- 10% OF FLEET LDV PURCHASES ZEV
2016 - REDUCE WATER USE 25% FROM 2013 TO FEB 28, 2016
2018 - 20% ENERGY USE REDUCTION
2020 - 50% OF NEW & RENOVATED BUILDINGS ZNE
- REDUCE WATER USE 20%
- 25% OF FLEET LDV PURCHASES ZEV
2025 - 100% OF NEW & RENOVATED BUILDINGS ZNE
- 50% OF EXISTING BUILDINGS ZNE

122
APPENDICES
APPENDICES APPENDICES

123
List of Tables Table 1- Top 5 Facilities Most Affected by Changing Temperature (Degrees Fahrenheit) .......................................... 10 Table 2- Five Facilities that Will Experience the Largest Increase in Extreme Heat Events ....................................... 12 Table 3- Facilities that will be Most Impacted by Projected Changes in Precipitation (Inches) ............................... 14 Table 4- Projected Sea Level Rise along the California Coast .................................................................................................... 16 Table 5- Facilities Located in Disadvantaged Communities ...................................................................................................... 18 Table 6- Top Five Facilities Located in Urban Heat Islands (Sorted by highest UHII) ................................................... 19 Table 7- Integration of Climate Change into Department Planning ....................................................................................... 22 Table 8- Engagement and Planning Processes ................................................................................................................................. 22 Table 9- CDCR Renewable Energy Portfolio ..................................................................................................................................... 28 Table 10- GHG Emissions Since 2007 .................................................................................................................................................. 30 Table 11- New Construction Since July 1, 2012 ............................................................................................................................... 31 Table 12- LEED for Existing Buildings and Operations ................................................................................................................ 35 Table 13- Existing Pest Control Contracts.......................................................................................................................................... 40 Table 14- State Agency Buy Recycled Campaign (SABRC) - 2016 Performance by CDCR ........................................... 43 Table 15- Smart Location Score for New Leases ............................................................................................................................. 46 Table 16- Lowest Smart Location Score Leases .............................................................................................................................. 46 Table 17- Total Purchased Energy 2016 (excluding Renewables) ......................................................................................... 51 Table 18- CDCR Institutions with Largest Energy Consumption (including Renewables) .......................................... 51 Table 19- Zero Net Energy Buildings ................................................................................................................................................... 59 Table 20- Zero Net Energy Projects ...................................................................................................................................................... 59 Table 21- New Construction/Major Renovations Exceeding Title 24 by 15% .................................................................. 64 Table 22- Department-wide Energy Trends (without Renewables) ...................................................................................... 66 Table 23- 2016 Energy Reductions Achieved (without Renewables) ................................................................................... 67 Table 24- Energy Surveys .......................................................................................................................................................................... 68 Table 25- Summary of Energy Savings Achieved through Energy Efficiency Projects .................................................. 69 Table 26- Demand Response .................................................................................................................................................................... 73 Table 27- On-Site Renewable Energy ................................................................................................................................................... 75 Table 28- Total Purchased Fuel in 2017 ............................................................................................................................................. 82 Table 29- Vehicles in Department Fleet Currently Eligible for Replacement .................................................................... 83 Table 30- ZEV Additions to the Department Fleet (Owned Assets) by Fiscal Year ......................................................... 83 Table 31- High Priority EVSE Projects ................................................................................................................................................. 88 Table 32- Analysis of Site Assessments ............................................................................................................................................... 93 Table 33- Historical Annual Water Usage ....................................................................................................................................... 103 Table 34- Properties with Largest Water Use Per Capita in 2016 ....................................................................................... 103 Table 35- Properties with Largest Landscape Area .................................................................................................................... 104 Table 36- Department-wide Water Use Trends - Baseline Years 2010, 2013, and 2016 .......................................... 105 Table 37- Total Water Reductions Achieved in 2016 Compared to Baseline Years ..................................................... 105 Table 38- Summary of Boilers and Cooling Systems Projects Completed or In Progress ......................................... 107 Table 39- Institutions with Urban Water Shortage Contingency Plans and in Critical Groundwater Basins ... 108 108 Table 40- Summary of Indoor Water Efficiency Projects Completed or In Progress .................................................. 110 Table 42- Summary of Boilers and Cooling Systems Inventory ............................................................................................ 111 Table 43- Summary of Irrigation Hardware Inventory ............................................................................................................. 112 Table 44- Summary of Living Landscape Inventory ................................................................................................................... 113 Table 45- Summary of Large Landscape Inventory and Water Budget ............................................................................. 114

124
List of Figures Figure 1- Cal-Adapt 2016 Temperature Forecast ........................................................................................................................... 10 Figure 2- CDCR Facilities and Climate Impact Regions ................................................................................................................ 11 Figure 3- Cool Roofs at CHCF ................................................................................................................................................................... 13 Figure 4- Solar Parking Canopies at RJD ............................................................................................................................................. 18 Figure 5- Solar Array at PVSP .................................................................................................................................................................. 28 Figure 6- California Health Care Facility ............................................................................................................................................. 33 Figure 7- IEQ Monitoring During Construction at PVSP .............................................................................................................. 34 Figure 8- Clerestory Windows at SAC .................................................................................................................................................. 37 Figure 9- CDCR Process Flow ................................................................................................................................................................... 38 Figure 10- IAQ Monitoring During Construction at SAC .............................................................................................................. 39 Figure 11- Air Handling Unit .................................................................................................................................................................... 52 Figure 12- Variable Frequency Drive ................................................................................................................................................... 52 Figure 13- CDCR Zero Net Energy Case Study .................................................................................................................................. 62 Figure 14- Daylighting in MCSP Level II Dorms .............................................................................................................................. 64 Figure 15- Installation of New Energy Efficient Boilers at CCI ................................................................................................. 69 Figure 16- High Pressure Sodium Fixtures ........................................................................................................................................ 70 Figure 17- Energy Efficient LED Fixtures ........................................................................................................................................... 70 Figure 18- Central Health Services at SQ ............................................................................................................................................ 71 Figure 19- CDCR LEED Case Study ........................................................................................................................................................ 72 Figure 20- Solar Array at ISP .................................................................................................................................................................... 74 Figure 21- Wind Turbine at LAC ............................................................................................................................................................. 74 Figure 22- Employee Electric Vehicle Charging Survey – Question 11 Results ................................................................ 86 Figure 23- Employee Electric Vehicle Charging Survey Results .............................................................................................. 87 Figure 24- Preliminary Site Assessments ........................................................................................................................................... 91 Figure 25- Preliminary Site Assessment Survey (Example) ...................................................................................................... 92 Figure 26- Workplace Electric Vehicle Charging – CHCF ............................................................................................................ 94 Figure 27- Workplace Electric Vehicle Charging – LAC ............................................................................................................... 94 Figure 28- Workplace Electric Vehicle Charging – MCSP ............................................................................................................ 95 Figure 29- Workplace Electric Vehicle Charging – RJD ................................................................................................................ 95 Figure 30- Workplace Electric Vehicle Charging – CAC ............................................................................................................... 96 Figure 31- Flushometers at CMF ......................................................................................................................................................... 105 Figure 32- New Dishwasher at ASP.................................................................................................................................................... 106 Figure 33- 2017 CDCR Statewide Drought Action Plan ............................................................................................................ 109 Figure 34- Original Toilet and Sink at CIW ..................................................................................................................................... 111 Figure 35- Retrofitted Toilet/Sink Combo at CIW ....................................................................................................................... 111 Figure 36- Bioswales at CHCF ............................................................................................................................................................... 113 Figure 37- Climate-appropriate Landscape at CCI ...................................................................................................................... 114

125
List of Graphs Graph 1- GHG Emissions Since 2007 .................................................................................................................................................... 31 Graph 2- CDCR’s Fleet Vehicle Type Breakdown ............................................................................................................................ 81 Graph 3- Composition of Department’s Light-Duty Vehicle Fleet ........................................................................................... 81 Graph 4- Parking Facilities (39 State-Owned and 85 Leased) .................................................................................................. 85

126
Acronyms
AB Assembly Bill
AC Alternating Current
ACA American Correctional Association
A/E Architects and Engineers
AP Action Plan
ARRA American Recovery and Reinvestment Act
ARB Air Resources Board
ASHRAE American Society of Heating, Refrigerating and Air-Conditioning
Engineers
ASU Administrative Segregation Unit
BIS Business Information Systems
BMP Best Management Practices
CALGREEN California Green Building Code (Title 24, Part 11)
CALPCA California Procurement and Contract Academy
CALPIA California Prison Industry Authority
CCHCS California Correctional Health Care Services
CDCR California Department of Corrections and Rehabilitation
CDs Construction Documents
CPP Centralized Procurement Program
CEC California Energy Commission
CEQA California Environmental Quality Act
COBCP Capital Outlay Budget Change Proposal
CPPS Capital Planning and Project Services Branch
CPUC California Public Utilities Commission
DAC Disadvantaged Communities
DCG Design Criteria Guidelines
DD Design Development
DESS Design and Environmental Services and Standards Branch

127
DGS Department of General Services
DWR Department of Water Resources
ECAA Energy Conservation Assistance Act
EEM Energy Efficiency Measure
EHT Extreme Heat Threshold
EIS Enterprise Information Services
EMS Energy Management System
EIR Environmental Impact Report
EO Executive Order
EPEAT Electronic Product Environmental Assessment Tool
EPP Environmentally Preferred Purchasing
ESCO Energy Service Company
ESPM Energy Star Portfolio Manager
ESS Energy and Sustainability Section
EUI Energy Usage Index
EVgo EVgo Services LLC
EVSE Electric Vehicle Supply Equipment (charging equipment)
FAMB Facilities Asset Management Branch
FPCM Division of Facility Planning, Construction and Management
FY Fiscal Year
GCM Global Circulation Model
GFMR General Facilities Maintenance and Repair
GGE Gasoline Gallon Equivalent
GHG Greenhouse Gas
GHGe Greenhouse Gas Emission
GO-Biz Governor’s Office of Business and Economic Development
GPS Global Positioning System
GS Green Seal
GSP Groundwater Sustainability Plan
GVWR Gross Vehicle Weight Rating

128
HCAB Health Care Administration Building
HCFC Hydrochlorofluorocarbons
HCFIP Health Care Facility Improvement Program
HFC Hydrofluorocarbons
HFM Healthcare Facility Maintenance
HVAC Heating, Ventilation, and Air Conditioning
IAQ Indoor Air Quality
IEQ Indoor Environmental Quality
IOU Investor-Owned Utility
IPCC Intergovernmental Panel on Climate Change
IPM Integrated Pest Management
kBTU Thousand British Thermal Unit
kWh Kilowatt hour
LCM Landscape Coefficient Method
LED Light Emitting Diode
LEED Leadership in Energy and Environmental Design®
LEED BD+C LEED® for Building Design and Construction
LEED ID+C LEED® for Interior Design and Construction
LEED O+M LEED® for Building Operations and Maintenance
MAWA Maximum Applied Water Allowance
MBCx Monitoring Based Commissioning
MERV Minimum Efficiency Reporting Value
MM Management Memo
MPAR Master Plan Annual Report
MPG Miles Per Gallon
MW AC Megawatts Alternating Current
MW Megawatt
MWELO Model Water Efficient Landscape Ordinance
NEM Net Energy Metering
OBF On-Bill Financing

129
OBR On-Bill Repayment
OBS Office of Business Services
OPC Ocean Protection Council
OPOS Office of Peace Officer Selection
PCC Public Contract Code
PD Project Director
PES Performance and Environmental Standards
PG&E Pacific Gas & Electric
PHEV Plug-In Hybrid Electric Vehicles
PPA Power Purchase Agreement
PPM Project Procedures Manual
PSREC Plumas Sierra Rural Electric Cooperative
PUC Public Utility Code
PV Photovoltaic
RCP Representative Concentration Pathway
SABRC State Agency Buy Recycled Campaign
SAM State Administrative Manual
SAPMS Statewide Automated Preventive Maintenance System
SB Senate Bill
SBD Savings By Design
SCE Southern California Edison
SCG Southern California Gas
SCM State Contracting Manual
SCPRS State Contract and Procurement Registration System
SDD Standard Design Document
SDG Sustainable Design Guidelines
SDG&E San Diego Gas & Electric
SGA Sustainable Groundwater Agency
SGC Strategic Growth Council
SGMA Sustainable Groundwater Management Act

130
SMUD Sacramento Municipal Utility District
SPLC Sustainable Purchasing Leadership Council
SPPA Solar Power Purchase Agreement
STU Statewide Transportation Unit
SUV Sports Utility Vehicle
UHII Urban Heat Island Index
US DOE United States Department of Energy
US EPA United States Environmental Protection Agency
USGBC United States Green Building Council
VFD Variable Frequency Drive
VOC Volatile Organic Chemical
WMC Water Management Coordinator
ZEV Zero Emission Vehicle
ZNE Zero Net Energy

131
CDCR Facility Acronyms ASP Avenal State Prison
CAL Calipatria State Prison
CAC California City Correctional Facility
CCC California Correctional Center
CCI California Correctional Institution
CCWF Central California Women’s Facility
CEN Centinela State Prison
CHCF California Health Care Facility
CIM California Institution for Men
CIW California Institution for Women
CMC California Men’s Colony
CMF California Medical Facility
COR California State Prison, Corcoran
CRC California Rehabilitation Center
CTC Richard A. McGee Correctional Training Center
CTF California Training Facility
CVSP Chuckawalla Valley State Prison
DVI Deuel Vocational Institution
FSP Folsom State Prison
HDSP High Desert State Prison
ISP Ironwood State Prison
KVSP Kern Valley State Prison
LAC California State Prison, Los Angeles County
MCSP Mule Creek State Prison
NCYCC Northern California Youth Correctional Center
NKSP North Kern State Prison
PBSP Pelican Bay State Prison
PVSP Pleasant Valley State Prison
RJD Richard J. Donovan Correctional Facility

132
SAC California State Prison, Sacramento
SATF Substance Abuse Treatment Facility
SCC Sierra Conservation Center
SOL California State Prison, Solano
SQ San Quentin State Prison
SVSP Salinas Valley State Prison
VSP Valley State Prison
VYCF Ventura Youth Correctional Facility
WSP Wasco State Prison
133
Glossary Acre-foot: volume equal to water one acre in area and one foot deep
Cogeneration: also known as combined heat and power, use of a heat engine or power station to
generate electricity and heat (and sometimes cooling and/or industrial chemicals)
Easement: right to use or enter land owned by another partner
Grasscycling: the leaving of chopped grass clippings on a mowed lawn as a fertilizer
Level 1 charging: provides 120 V charging of approximately 2-5 miles of range per hour
charged
Level 2 charging: provides 208 or 240 V charging of approximately 10-20 miles of range per
hour charged
Lighting Power Density: watts per square foot, or energy consumed divided by the size of a
space
Minimum Efficiency Reporting Value (MERV): scale for rating the effectiveness of air filters
Plug Load Management: tracking and/or controlling energy used through a building’s electrical
outlets
Rainwater harvesting: rainwater collection and storage systems used to offset potable water
needs for a building and/or landscape, usually consisting of a surface for collecting
precipitation (roof or other impervious surface) and a storage system
Real property: legally defined land with man-made improvements
Urban forest: a densely wooded area located in a city
vermicompost/vermiculture: compost resulting from use of worms to create mixture of
decomposing organic waste and worm manure