sustainability presentation hsbc sri / esg conference 2018 · china 117g/km japan 122g/km europe...
TRANSCRIPT
Sustainability Presentation
13th HSBC SRI / ESG Conference 2018
Frankfurt – February 5-6, 2018Rolf Woller, Head of IR
Sabine Reese, IR Manager
Ticker: CON
ADR-Ticker: CTTAY
http://www.continental-ir.com Investor Relations
Sustainability Presentation
13th HSBC SRI / ESG Conference 2018
Frankfurt – February 5-6, 2018
Technologies in the Automotive Group4 19
Agenda
2EDMR – Equity and Debt Markets Relations
Continental at a Glance1 3
Sustainability at Continental2 8
Environmental Responsibility3 11
Technologies in the Rubber Group5 25
Outlook 326
Sustainability Presentation
13th HSBC SRI / ESG Conference 2018
Frankfurt – February 5-6, 2018
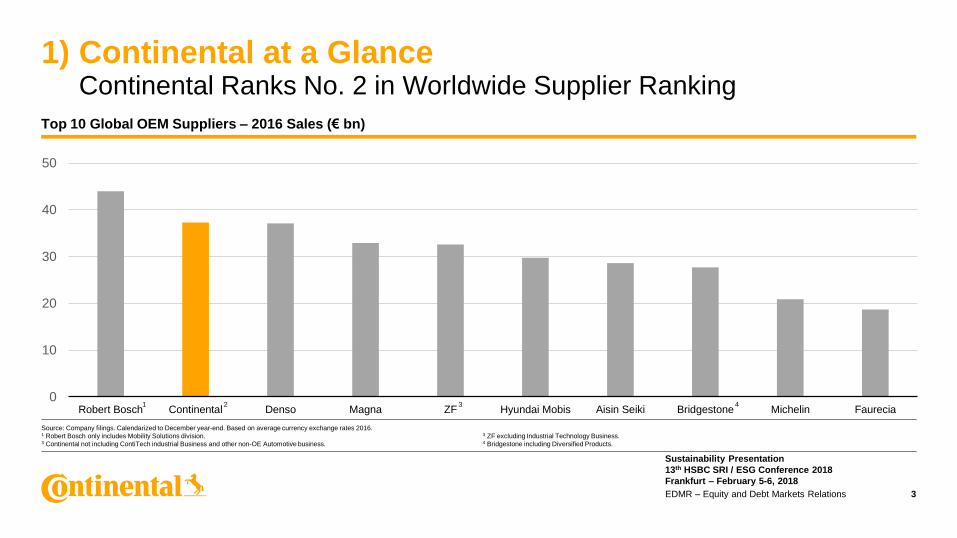
1) Continental at a GlanceContinental Ranks No. 2 in Worldwide Supplier Ranking
3EDMR – Equity and Debt Markets Relations
Source: Company filings. Calendarized to December year-end. Based on average currency exchange rates 2016.1 Robert Bosch only includes Mobility Solutions division. 3 Continental not including ContiTech industrial Business and other non-OE Automotive business.
3 ZF excluding Industrial Technology Business.4 Bridgestone including Diversified Products.
Top 10 Global OEM Suppliers – 2016 Sales (€ bn)
0
10
20
30
40
50
Robert Bosch Continental Denso Magna ZF Hyundai Mobis Aisin Seiki Bridgestone Michelin Faurecia1 2 3 4
Sustainability Presentation
13th HSBC SRI / ESG Conference 2018
Frankfurt – February 5-6, 2018
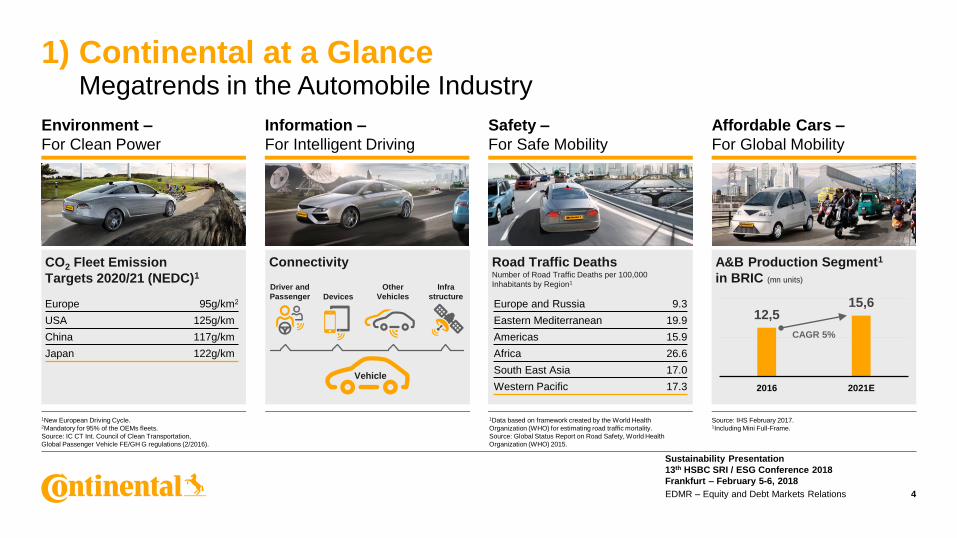
1) Continental at a GlanceMegatrends in the Automobile Industry
4EDMR – Equity and Debt Markets Relations
Environment –
For Clean Power
Information –
For Intelligent Driving
Safety –
For Safe Mobility
Affordable Cars –
For Global Mobility
CO2 Fleet Emission
Targets 2020/21 (NEDC)1
Road Traffic DeathsNumber of Road Traffic Deaths per 100,000
Inhabitants by Region1
Connectivity A&B Production Segment1
in BRIC (mn units)
Europe 95g/km2
USA 125g/km
China 117g/km
Japan 122g/km
Europe and Russia 9.3
Eastern Mediterranean 19.9
Americas 15.9
Africa 26.6
South East Asia 17.0
Western Pacific 17.3Vehicle
12,515,6
2016 2021E
CAGR 5%
Driver and
Passenger Devices
Infra
structure
Other
Vehicles
1New European Driving Cycle.2Mandatory for 95% of the OEMs fleets.
Source: IC CT Int. Council of Clean Transportation,
Global Passenger Vehicle FE/GH G regulations (2/2016).
1Data based on framework created by the World Health
Organization (WHO) for estimating road traffic mortality.
Source: Global Status Report on Road Safety, World Health
Organization (WHO) 2015.
Source: IHS February 2017. 1Including Mini Full-Frame.
Sustainability Presentation
13th HSBC SRI / ESG Conference 2018
Frankfurt – February 5-6, 2018
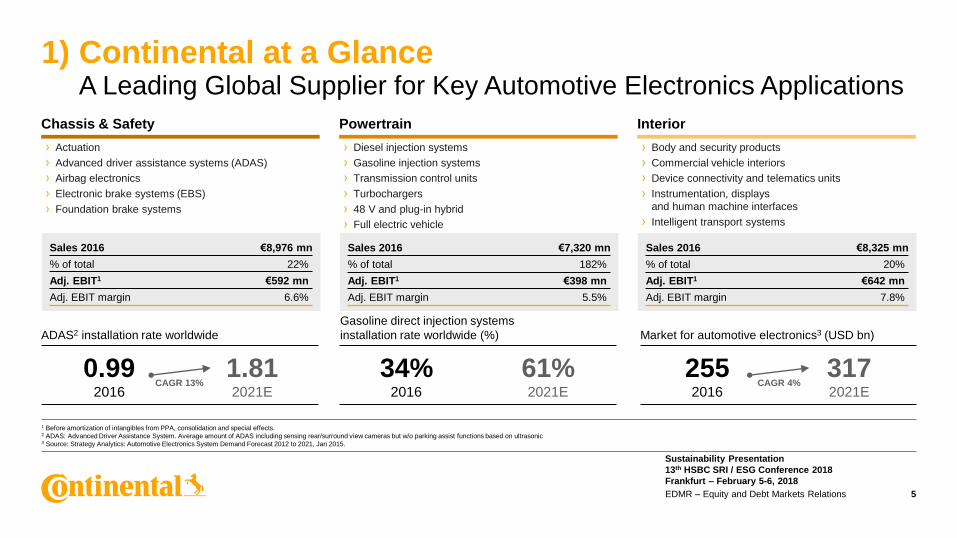
› Actuation
› Advanced driver assistance systems (ADAS)
› Airbag electronics
› Electronic brake systems (EBS)
› Foundation brake systems
› Diesel injection systems
› Gasoline injection systems
› Transmission control units
› Turbochargers
› 48 V and plug-in hybrid
› Full electric vehicle
› Body and security products
› Commercial vehicle interiors
› Device connectivity and telematics units
› Instrumentation, displays
and human machine interfaces
› Intelligent transport systems
Chassis & Safety
1) Continental at a GlanceA Leading Global Supplier for Key Automotive Electronics Applications
5EDMR – Equity and Debt Markets Relations
Sales 2016 €8,976 mn
% of total 22%
Adj. EBIT1 €592 mn
Adj. EBIT margin 6.6%
Powertrain Interior
Sales 2016 €7,320 mn
% of total 182%
Adj. EBIT1 €398 mn
Adj. EBIT margin 5.5%
Sales 2016 €8,325 mn
% of total 20%
Adj. EBIT1 €642 mn
Adj. EBIT margin 7.8%
ADAS2 installation rate worldwide
Gasoline direct injection systems
installation rate worldwide (%) Market for automotive electronics3 (USD bn)
1 Before amortization of intangibles from PPA, consolidation and special effects.2 ADAS: Advanced Driver Assistance System. Average amount of ADAS including sensing rear/surround view cameras but w/o parking assist functions based on ultrasonic3 Source: Strategy Analytics: Automotive Electronics System Demand Forecast 2012 to 2021, Jan 2015.
CAGR 4%2552016
3172021E
34%2016
61%2021E
CAGR 13%0.99
2016
1.812021E
Sustainability Presentation
13th HSBC SRI / ESG Conference 2018
Frankfurt – February 5-6, 2018
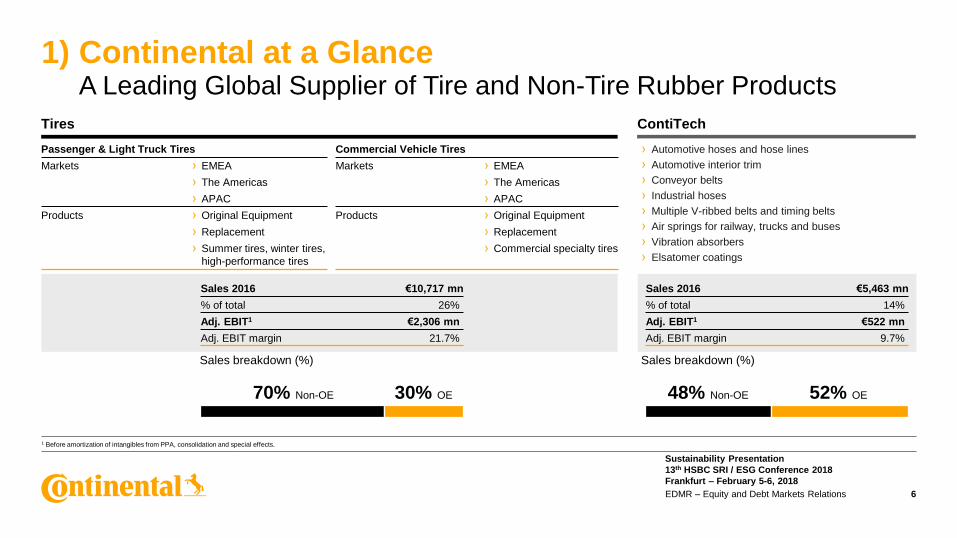
Tires
1) Continental at a GlanceA Leading Global Supplier of Tire and Non-Tire Rubber Products
6EDMR – Equity and Debt Markets Relations
ContiTech
› Automotive hoses and hose lines
› Automotive interior trim
› Conveyor belts
› Industrial hoses
› Multiple V-ribbed belts and timing belts
› Air springs for railway, trucks and buses
› Vibration absorbers
› Elsatomer coatings
Sales 2016 €5,463 mn
% of total 14%
Adj. EBIT1 €522 mn
Adj. EBIT margin 9.7%
Sales breakdown (%) Sales breakdown (%)
1 Before amortization of intangibles from PPA, consolidation and special effects.
Sales 2016 €10,717 mn
% of total 26%
Adj. EBIT1 €2,306 mn
Adj. EBIT margin 21.7%
Passenger & Light Truck Tires
Markets › EMEA
› The Americas
› APAC
Products › Original Equipment
› Replacement
› Summer tires, winter tires,
high-performance tires
Commercial Vehicle Tires
Markets › EMEA
› The Americas
› APAC
Products › Original Equipment
› Replacement
› Commercial specialty tires
70% Non-OE 30% OE 48% Non-OE 52% OE
Sustainability Presentation
13th HSBC SRI / ESG Conference 2018
Frankfurt – February 5-6, 2018
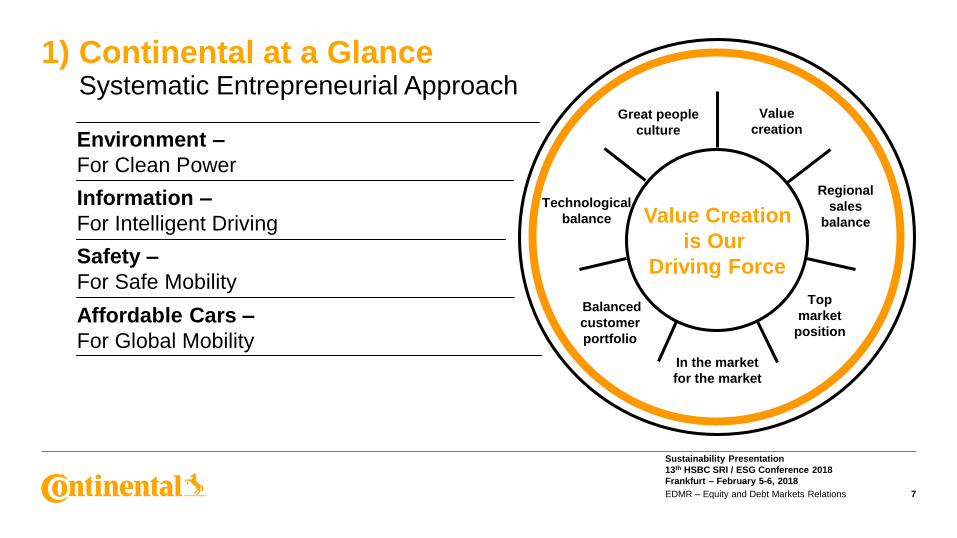
1) Continental at a GlanceSystematic Entrepreneurial Approach
7EDMR – Equity and Debt Markets Relations
Value Creation
is Our
Driving Force
Great people
culture
Value
creation
Regional
sales
balance
Technological
balance
In the market
for the market
Balanced
customer
portfolio
Top
market
position
Environment –
For Clean Power
Information –
For Intelligent Driving
Safety –
For Safe Mobility
Affordable Cars –
For Global Mobility
Sustainability Presentation
13th HSBC SRI / ESG Conference 2018
Frankfurt – February 5-6, 2018
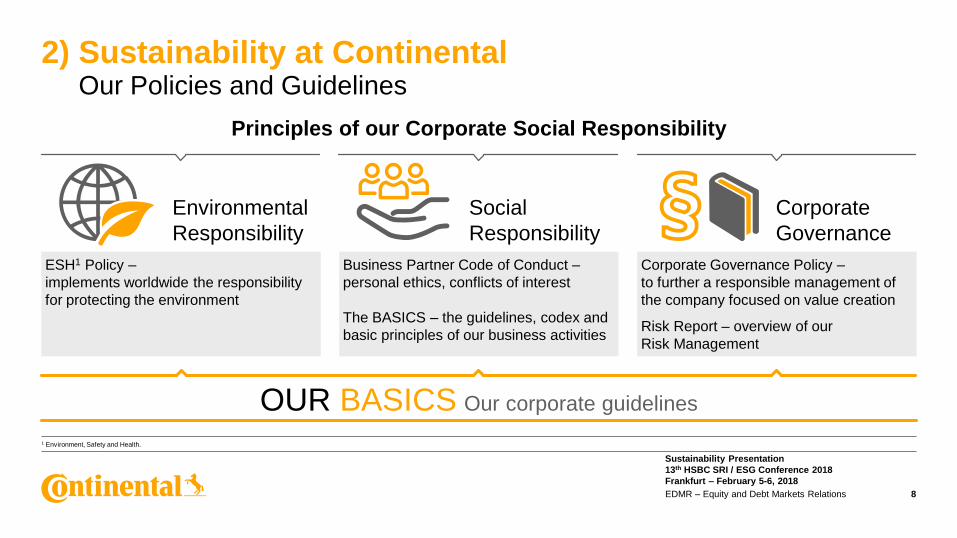
2) Sustainability at ContinentalOur Policies and Guidelines
8EDMR – Equity and Debt Markets Relations
1 Environment, Safety and Health.
Principles of our Corporate Social Responsibility
Environmental
Responsibility
Social
Responsibility
ESH1 Policy –
implements worldwide the responsibility
for protecting the environment
Business Partner Code of Conduct –
personal ethics, conflicts of interest
The BASICS – the guidelines, codex and
basic principles of our business activities
Corporate Governance Policy –
to further a responsible management of
the company focused on value creation
Risk Report – overview of our
Risk Management
OUR BASICS Our corporate guidelines
Corporate
Governance
Sustainability Presentation
13th HSBC SRI / ESG Conference 2018
Frankfurt – February 5-6, 2018
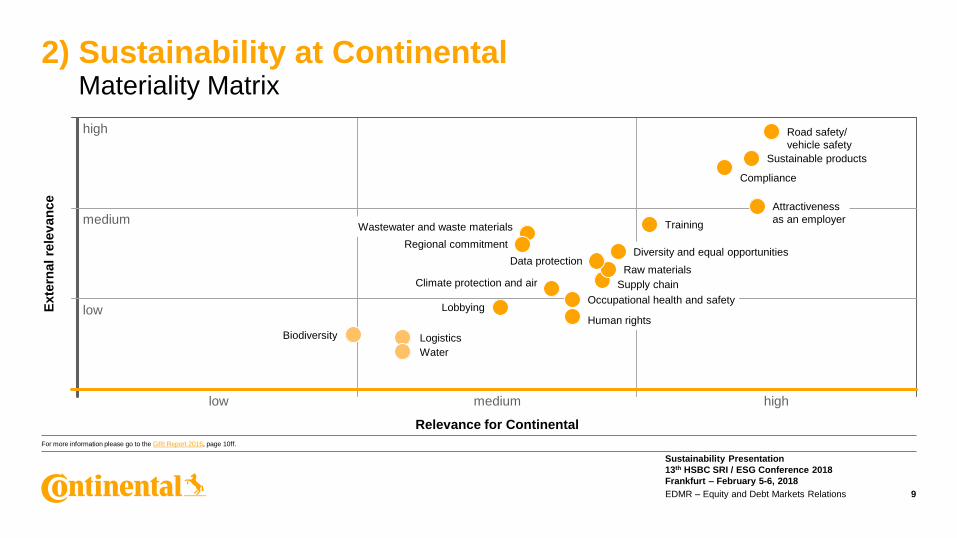
2) Sustainability at ContinentalMateriality Matrix
9EDMR – Equity and Debt Markets Relations
Exte
rnal re
lev
an
ce
Relevance for Continental
medium highlow
medium
high
low
Logistics
Water
Biodiversity
Lobbying
Climate protection and air
Wastewater and waste materials
Regional commitment
Human rights
Occupational health and safety
Supply chain
Raw materialsData protection
Diversity and equal opportunities
Training
Attractiveness
as an employer
Compliance
Sustainable products
Road safety/
vehicle safety
For more information please go to the GRI Report 2016, page 10ff.
Sustainability Presentation
13th HSBC SRI / ESG Conference 2018
Frankfurt – February 5-6, 2018
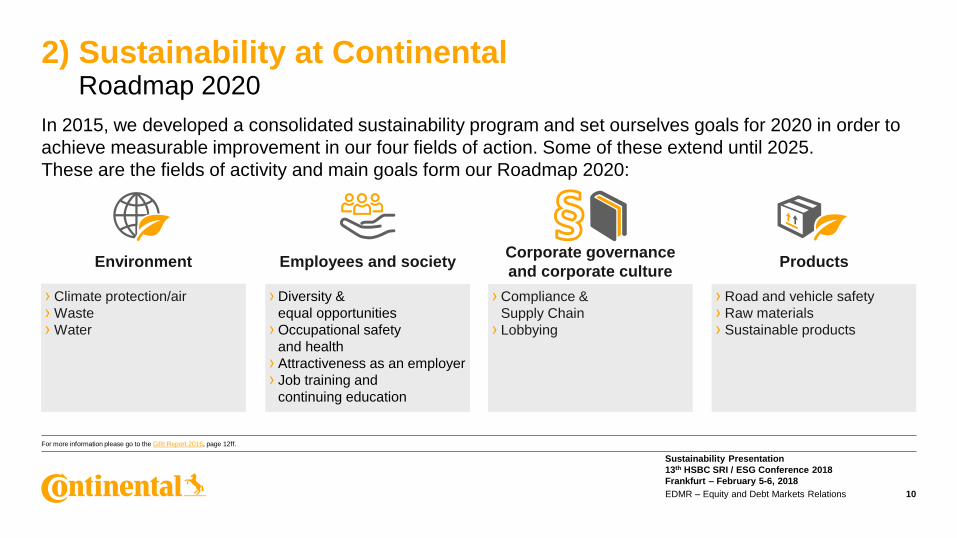
In 2015, we developed a consolidated sustainability program and set ourselves goals for 2020 in order to
achieve measurable improvement in our four fields of action. Some of these extend until 2025.
These are the fields of activity and main goals form our Roadmap 2020:
2) Sustainability at ContinentalRoadmap 2020
10EDMR – Equity and Debt Markets Relations
› Compliance &
Supply Chain
› Lobbying
› Diversity &
equal opportunities
› Occupational safety
and health
› Attractiveness as an employer
› Job training and
continuing education
› Road and vehicle safety
› Raw materials
› Sustainable products
Corporate governance
and corporate cultureEnvironment Employees and society Products
› Climate protection/air
› Waste
› Water
For more information please go to the GRI Report 2016, page 12ff.
Sustainability Presentation
13th HSBC SRI / ESG Conference 2018
Frankfurt – February 5-6, 2018
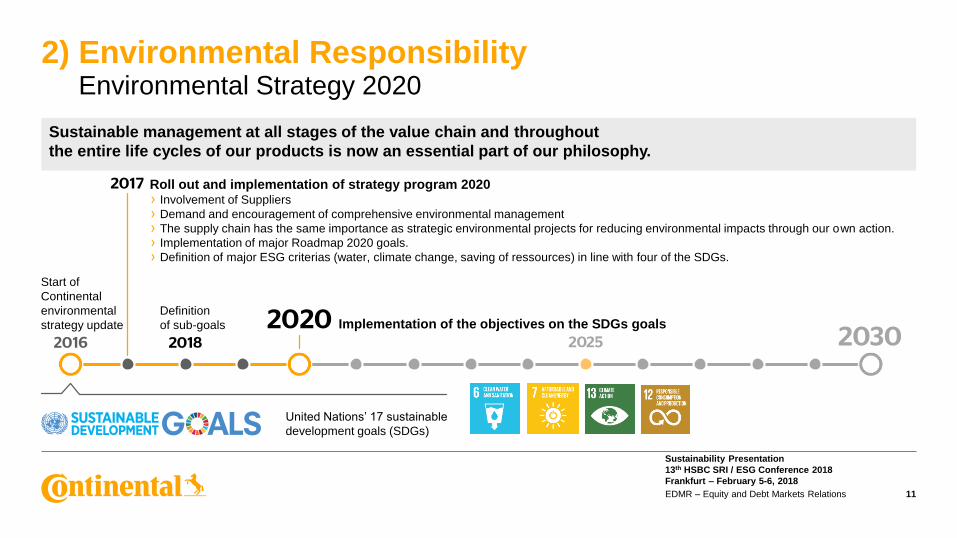
2) Environmental ResponsibilityEnvironmental Strategy 2020
11
Sustainable management at all stages of the value chain and throughout
the entire life cycles of our products is now an essential part of our philosophy.
United Nations’ 17 sustainable
development goals (SDGs)
Start of
Continental
environmental
strategy update
Roll out and implementation of strategy program 2020› Involvement of Suppliers
› Demand and encouragement of comprehensive environmental management
› The supply chain has the same importance as strategic environmental projects for reducing environmental impacts through our own action.
› Implementation of major Roadmap 2020 goals.
› Definition of major ESG criterias (water, climate change, saving of ressources) in line with four of the SDGs.
Implementation of the objectives on the SDGs goalsDefinition
of sub-goals
EDMR – Equity and Debt Markets Relations
Sustainability Presentation
13th HSBC SRI / ESG Conference 2018
Frankfurt – February 5-6, 2018
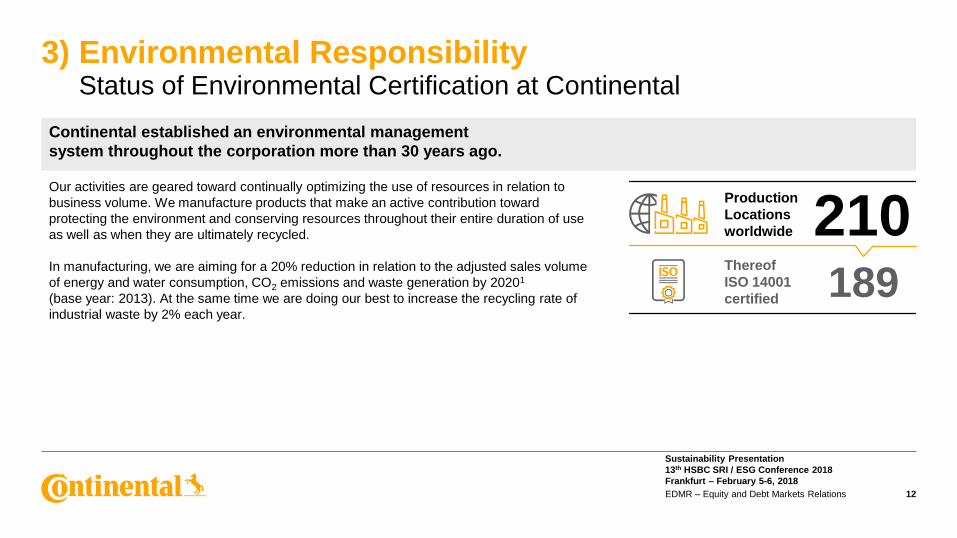
3) Environmental ResponsibilityStatus of Environmental Certification at Continental
12EDMR – Equity and Debt Markets Relations
Our activities are geared toward continually optimizing the use of resources in relation to
business volume. We manufacture products that make an active contribution toward
protecting the environment and conserving resources throughout their entire duration of use
as well as when they are ultimately recycled.
In manufacturing, we are aiming for a 20% reduction in relation to the adjusted sales volume
of energy and water consumption, CO2 emissions and waste generation by 20201
(base year: 2013). At the same time we are doing our best to increase the recycling rate of
industrial waste by 2% each year.
Continental established an environmental management
system throughout the corporation more than 30 years ago.
210Production
Locations
worldwide
189Thereof
ISO 14001
certified
Sustainability Presentation
13th HSBC SRI / ESG Conference 2018
Frankfurt – February 5-6, 2018
3) Environmental ResponsibilityStatus of Quality Certification at Continental
13EDMR – Equity and Debt Markets Relations
1 Source: ISO (International Organization of Standardization) www.iso.org/iso/home.html.
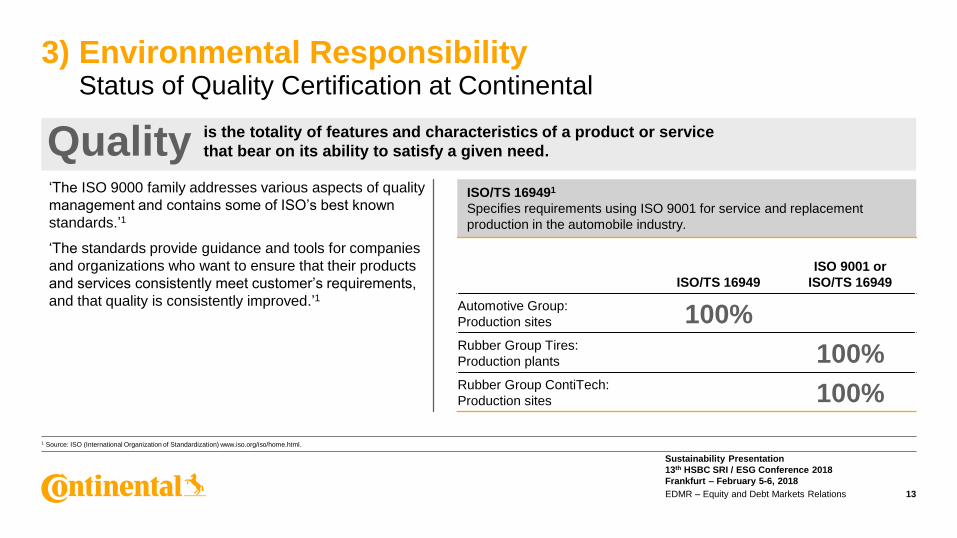
‘The ISO 9000 family addresses various aspects of quality
management and contains some of ISO’s best known
standards.’1
‘The standards provide guidance and tools for companies
and organizations who want to ensure that their products
and services consistently meet customer’s requirements,
and that quality is consistently improved.’1
is the totality of features and characteristics of a product or service
that bear on its ability to satisfy a given need.Quality
ISO/TS 16949
ISO 9001 or
ISO/TS 16949
Automotive Group:
Production sites 100%Rubber Group Tires:
Production plants 100%Rubber Group ContiTech:
Production sites 100%
ISO/TS 169491
Specifies requirements using ISO 9001 for service and replacement
production in the automobile industry.
Sustainability Presentation
13th HSBC SRI / ESG Conference 2018
Frankfurt – February 5-6, 2018
3) Environmental ResponsibilityCertification of Suppliers
14EDMR – Equity and Debt Markets Relations
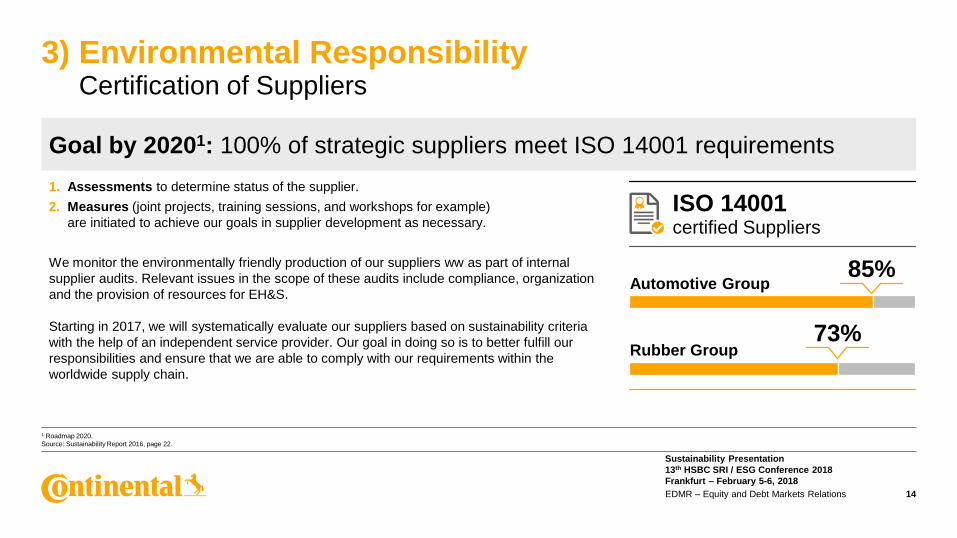
1. Assessments to determine status of the supplier.
2. Measures (joint projects, training sessions, and workshops for example)
are initiated to achieve our goals in supplier development as necessary.
We monitor the environmentally friendly production of our suppliers ww as part of internal
supplier audits. Relevant issues in the scope of these audits include compliance, organization
and the provision of resources for EH&S.
Starting in 2017, we will systematically evaluate our suppliers based on sustainability criteria
with the help of an independent service provider. Our goal in doing so is to better fulfill our
responsibilities and ensure that we are able to comply with our requirements within the
worldwide supply chain.
Goal by 20201: 100% of strategic suppliers meet ISO 14001 requirements
ISO 14001certified Suppliers
Automotive Group
Rubber Group
85%
73%
1 Roadmap 2020.
Source: Sustainability Report 2016, page 22.
Sustainability Presentation
13th HSBC SRI / ESG Conference 2018
Frankfurt – February 5-6, 2018
3) Environmental ResponsibilityCorporate Environmental Key Performance Indicators
15EDMR – Equity and Debt Markets Relations
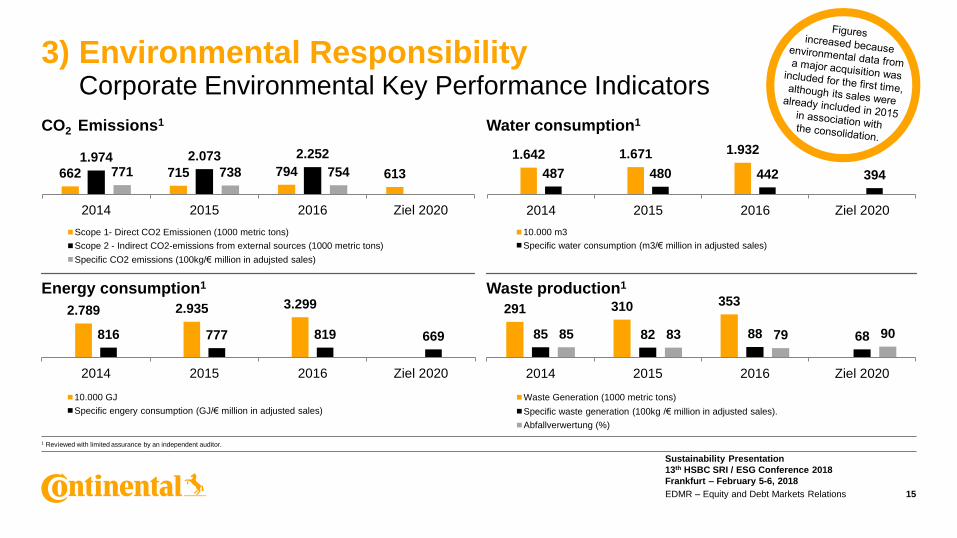
1 Reviewed with limited assurance by an independent auditor.
662 715 794 613
1.974 2.073 2.252
771 738 754
2014 2015 2016 Ziel 2020
Scope 1- Direct CO2 Emissionen (1000 metric tons)
Scope 2 - Indirect CO2-emissions from external sources (1000 metric tons)
Specific CO2 emissions (100kg/€ million in adujsted sales)
2.789 2.935 3.299
816 777 819 669
2014 2015 2016 Ziel 2020
10.000 GJ
Specific engery consumption (GJ/€ million in adjusted sales)
1.642 1.671 1.932
487 480 442 394
2014 2015 2016 Ziel 2020
10.000 m3
Specific water consumption (m3/€ million in adjusted sales)
291 310 353
85 82 88 6885 83 79 90
2014 2015 2016 Ziel 2020
Waste Generation (1000 metric tons)
Specific waste generation (100kg /€ million in adjusted sales).
Abfallverwertung (%)
CO2 Emissions1 Water consumption1
Energy consumption1 Waste production1
Sustainability Presentation
13th HSBC SRI / ESG Conference 2018
Frankfurt – February 5-6, 2018
17EDMR – Equity and Debt Markets Relations
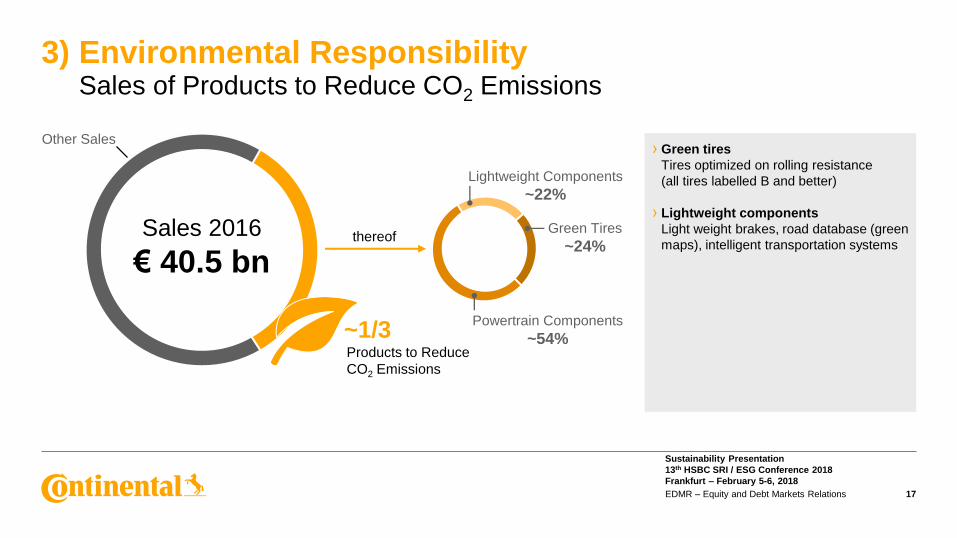
Other Sales
3) Environmental Responsibility Sales of Products to Reduce CO2 Emissions
Sales 2016
€ 40.5 bn
~1/3
thereof
Products to Reduce
CO2 Emissions
› Green tires
Tires optimized on rolling resistance
(all tires labelled B and better)
› Lightweight components
Light weight brakes, road database (green
maps), intelligent transportation systems
Green Tires
~24%
Powertrain Components
~54%
Lightweight Components
~22%
Sustainability Presentation
13th HSBC SRI / ESG Conference 2018
Frankfurt – February 5-6, 2018
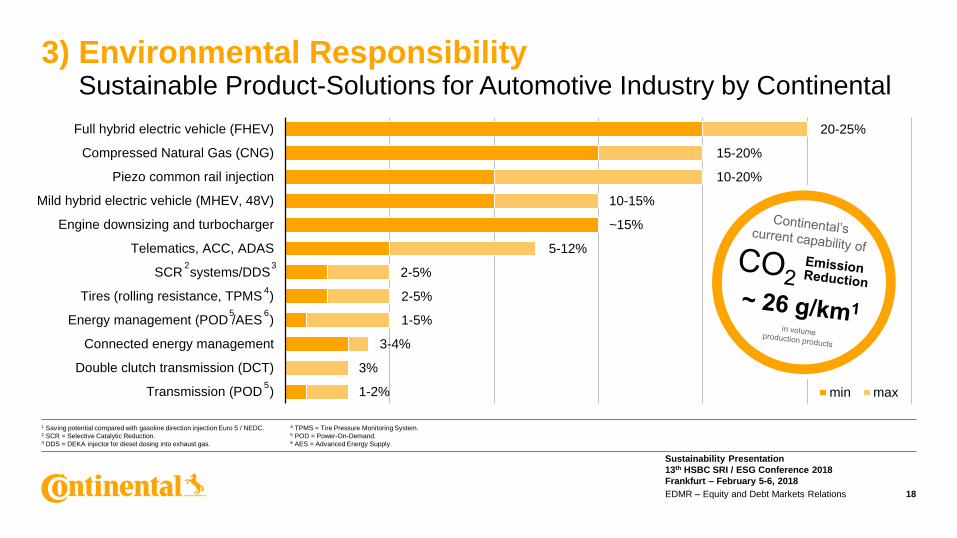
3) Environmental ResponsibilitySustainable Product-Solutions for Automotive Industry by Continental
18EDMR – Equity and Debt Markets Relations
1 Saving potential compared with gasoline direction injection Euro 5 / NEDC.2 SCR = Selective Catalytic Reduction.3 DDS = DEKA injector for diesel dosing into exhaust gas.
4 TPMS = Tire Pressure Monitoring System.5 POD = Power-On-Demand.6 AES = Advanced Energy Supply.
Full hybrid electric vehicle (FHEV)
Compressed Natural Gas (CNG)
Piezo common rail injection
Mild hybrid electric vehicle (MHEV, 48V)
Engine downsizing and turbocharger
Telematics, ACC, ADAS
SCR systems/DDS
Tires (rolling resistance, TPMS )
Energy management (POD /AES )
Connected energy management
Double clutch transmission (DCT)
Transmission (POD ) min max
20-25%
15-20%
10-20%
5-12%
2-5%
1-5%
3-4%
3%
1-2%
2-5%
~15%
10-15%
2 3
5
4
5 6
Sustainability Presentation
13th HSBC SRI / ESG Conference 2018
Frankfurt – February 5-6, 2018
19EDMR – Equity and Debt Markets Relations
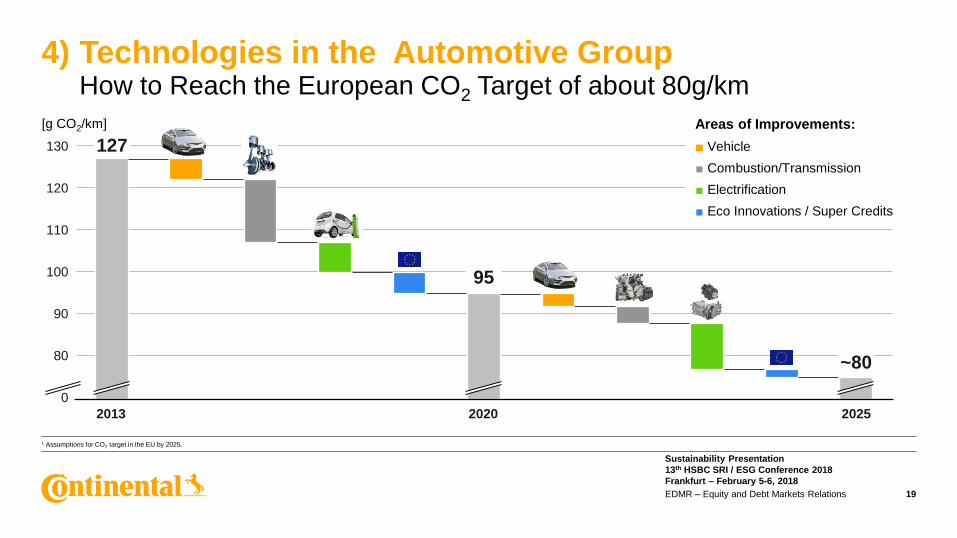
4) Technologies in the Automotive GroupHow to Reach the European CO2 Target of about 80g/km
1 Assumptions for CO2 target in the EU by 2025.
[g CO2/km]
0
80
90
100
110
120
130 127
95
~80
2013 2020 2025
■ Vehicle
■ Combustion/Transmission
■ Electrification
■ Eco Innovations / Super Credits
Areas of Improvements:
Sustainability Presentation
13th HSBC SRI / ESG Conference 2018
Frankfurt – February 5-6, 2018
20EDMR – Equity and Debt Markets Relations
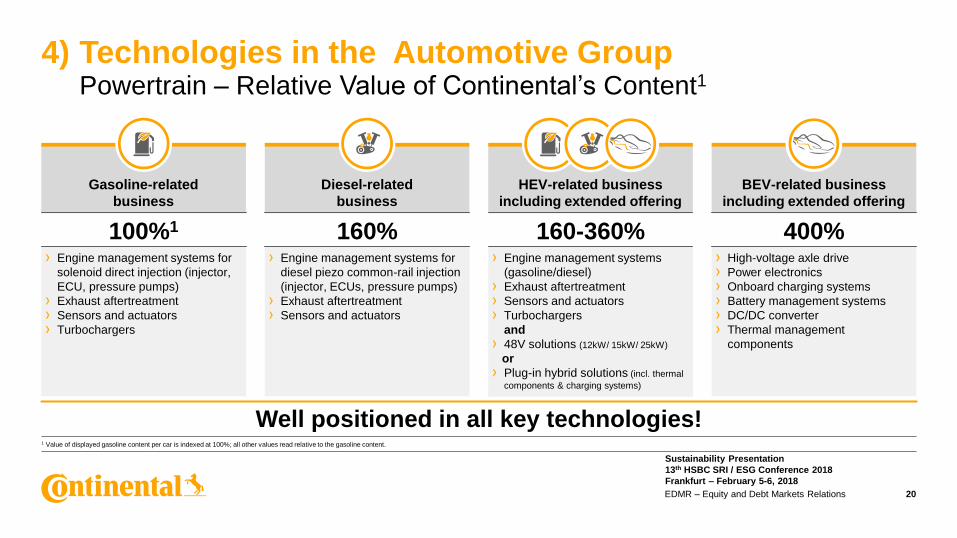
4) Technologies in the Automotive GroupPowertrain – Relative Value of Continental’s Content1
1 Value of displayed gasoline content per car is indexed at 100%; all other values read relative to the gasoline content.
HEV-related business
including extended offering
Gasoline-related
business
Diesel-related
business
BEV-related business
including extended offering
100%1 160% 160-360% 400%› Engine management systems for
diesel piezo common-rail injection
(injector, ECUs, pressure pumps)
› Exhaust aftertreatment
› Sensors and actuators
› Engine management systems for
solenoid direct injection (injector,
ECU, pressure pumps)
› Exhaust aftertreatment
› Sensors and actuators
› Turbochargers
› Engine management systems
(gasoline/diesel)
› Exhaust aftertreatment
› Sensors and actuators
› Turbochargers
and
› 48V solutions (12kW/ 15kW/ 25kW)
or
› Plug-in hybrid solutions (incl. thermal
components & charging systems)
› High-voltage axle drive
› Power electronics
› Onboard charging systems
› Battery management systems
› DC/DC converter
› Thermal management
components
Well positioned in all key technologies!
Sustainability Presentation
13th HSBC SRI / ESG Conference 2018
Frankfurt – February 5-6, 2018
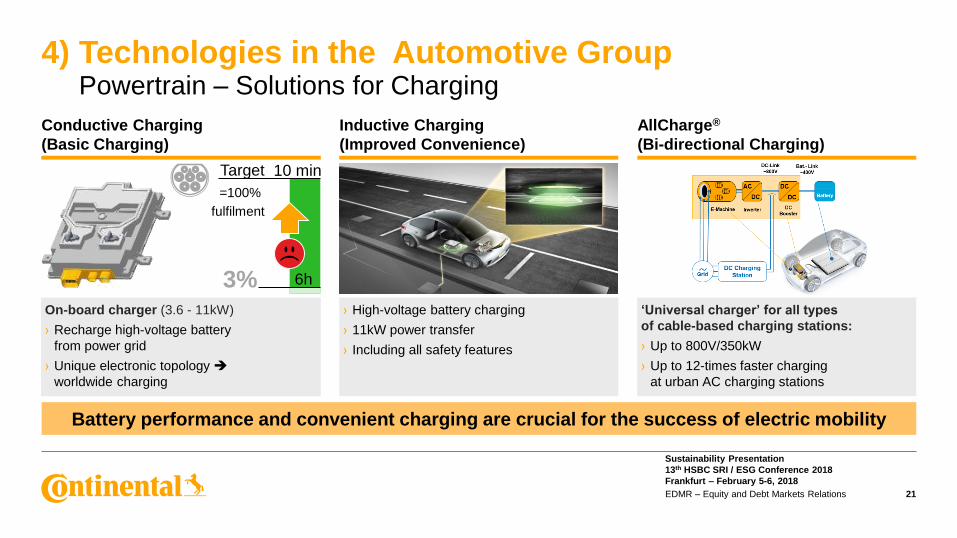
Inductive Charging
(Improved Convenience)
4) Technologies in the Automotive GroupPowertrain – Solutions for Charging
21EDMR – Equity and Debt Markets Relations
Conductive Charging
(Basic Charging)
AllCharge®
(Bi-directional Charging)
On-board charger (3.6 - 11kW)
› Recharge high-voltage battery
from power grid
› Unique electronic topology
worldwide charging
‘Universal charger’ for all types
of cable-based charging stations:
› Up to 800V/350kW
› Up to 12-times faster charging
at urban AC charging stations
› High-voltage battery charging
› 11kW power transfer
› Including all safety features
Battery performance and convenient charging are crucial for the success of electric mobility
10 min
6h3%
Target
=100%
fulfilment
Sustainability Presentation
13th HSBC SRI / ESG Conference 2018
Frankfurt – February 5-6, 2018
22EDMR – Equity and Debt Markets Relations
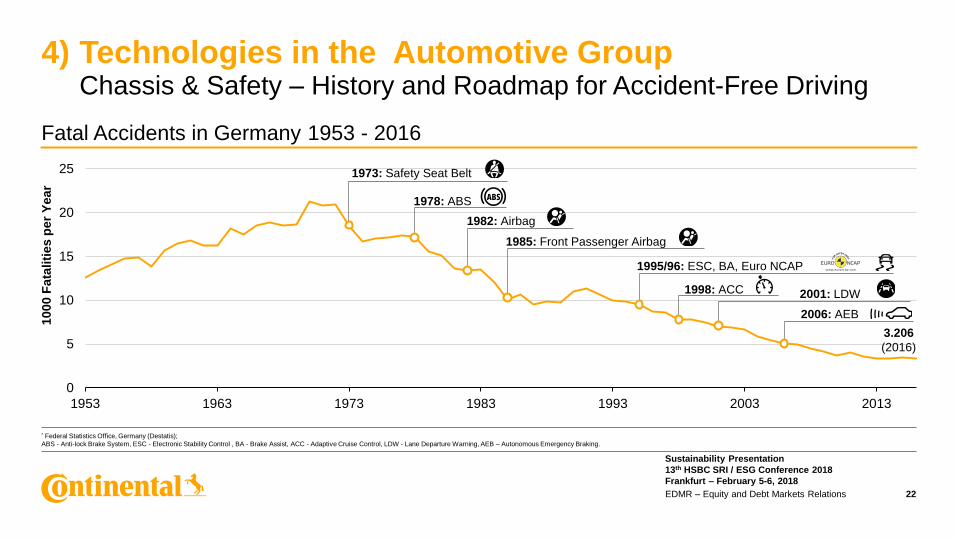
4) Technologies in the Automotive GroupChassis & Safety – History and Roadmap for Accident-Free Driving
* Federal Statistics Office, Germany (Destatis);
ABS - Anti-lock Brake System, ESC - Electronic Stability Control , BA - Brake Assist, ACC - Adaptive Cruise Control, LDW - Lane Departure Warning, AEB – Autonomous Emergency Braking.
1000
Fata
liti
es p
er
Year
0
5
10
15
20
25
1953 1963 1973 1983 1993 2003 2013
3.206
(2016)
1973: Safety Seat Belt
1978: ABS
1982: Airbag
1985: Front Passenger Airbag
1995/96: ESC, BA, Euro NCAP
1998: ACC 2001: LDW
2006: AEB
Fatal Accidents in Germany 1953 - 2016
Sustainability Presentation
13th HSBC SRI / ESG Conference 2018
Frankfurt – February 5-6, 2018
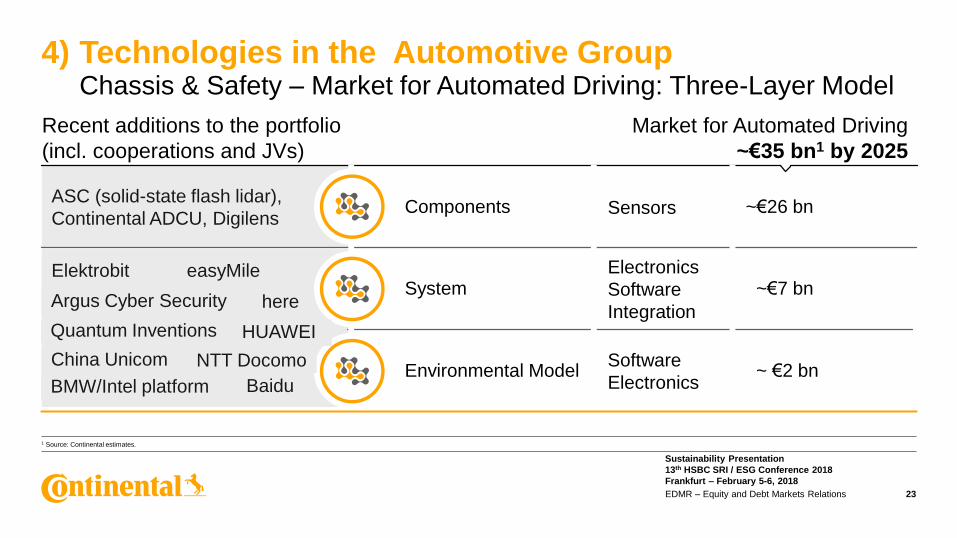
ASC (solid-state flash lidar),
Continental ADCU, Digilens
Quantum Inventions
Market for Automated Driving
~€35 bn1 by 2025
Recent additions to the portfolio
(incl. cooperations and JVs)
23EDMR – Equity and Debt Markets Relations
4) Technologies in the Automotive GroupChassis & Safety – Market for Automated Driving: Three-Layer Model
1 Source: Continental estimates.
Components
System
Environmental Model
~€26 bn
~€7 bn
~ €2 bn
Sensors
Electronics
Software
Integration
Software
ElectronicsBMW/Intel platform
China Unicom NTT Docomo
Baidu
Elektrobit easyMile
Argus Cyber Security here
HUAWEI
Sustainability Presentation
13th HSBC SRI / ESG Conference 2018
Frankfurt – February 5-6, 2018
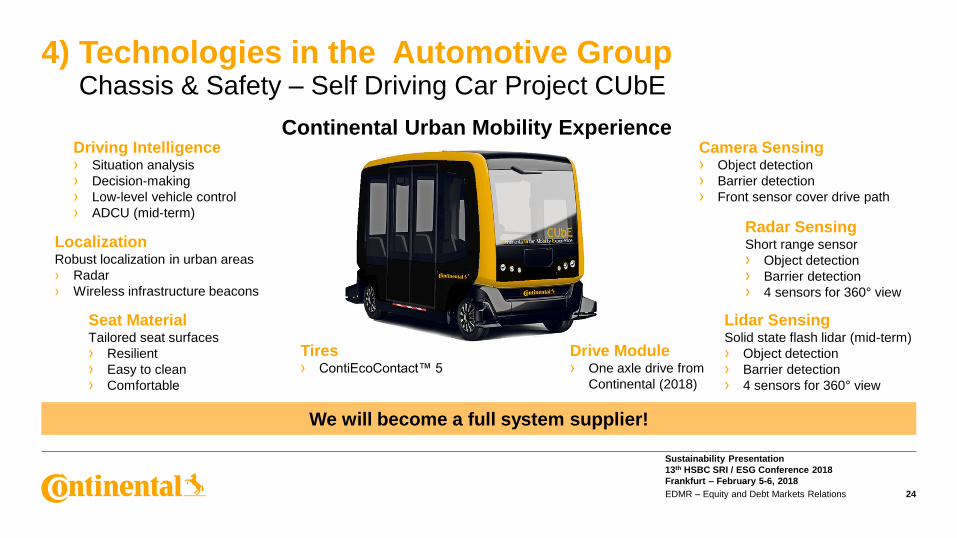
4) Technologies in the Automotive GroupChassis & Safety – Self Driving Car Project CUbE
24EDMR – Equity and Debt Markets Relations
We will become a full system supplier!
Driving Intelligence› Situation analysis
› Decision-making
› Low-level vehicle control
› ADCU (mid-term)
Seat Material Tailored seat surfaces
› Resilient
› Easy to clean
› Comfortable
LocalizationRobust localization in urban areas
› Radar
› Wireless infrastructure beacons
Radar SensingShort range sensor
› Object detection
› Barrier detection
› 4 sensors for 360° view
Camera Sensing› Object detection
› Barrier detection
› Front sensor cover drive path
Drive Module› One axle drive from
Continental (2018)
Tires› ContiEcoContact™ 5
Lidar SensingSolid state flash lidar (mid-term)
› Object detection
› Barrier detection
› 4 sensors for 360° view
Continental Urban Mobility Experience
Sustainability Presentation
13th HSBC SRI / ESG Conference 2018
Frankfurt – February 5-6, 2018
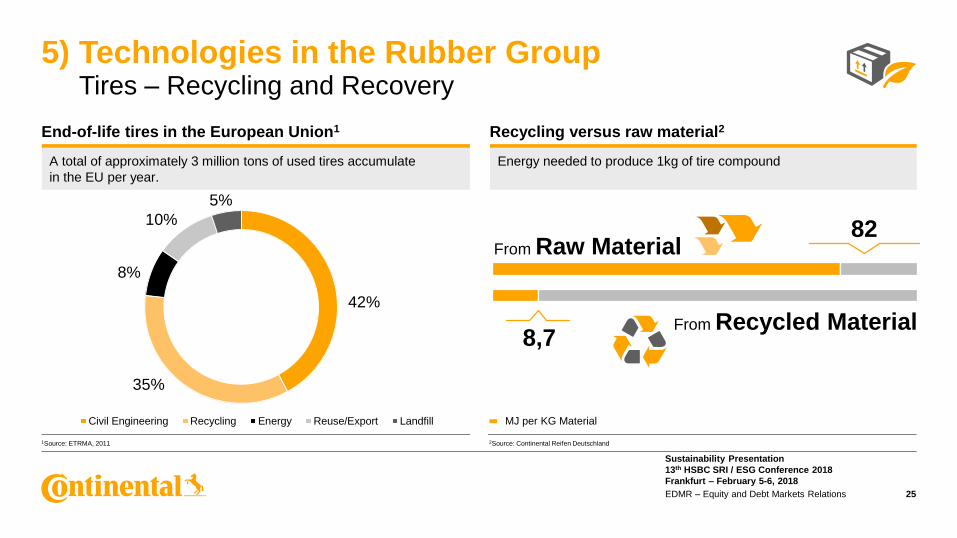
5) Technologies in the Rubber GroupTires – Recycling and Recovery
25EDMR – Equity and Debt Markets Relations
1Source: ETRMA, 2011 2Source: Continental Reifen Deutschland
42%
35%
8%
10%
5%
Civil Engineering Recycling Energy Reuse/Export Landfill
End-of-life tires in the European Union1
A total of approximately 3 million tons of used tires accumulate
in the EU per year.
Recycling versus raw material2
Energy needed to produce 1kg of tire compound
From Raw Material
From Recycled Material
82
8,7
MJ per KG Material
Sustainability Presentation
13th HSBC SRI / ESG Conference 2018
Frankfurt – February 5-6, 2018
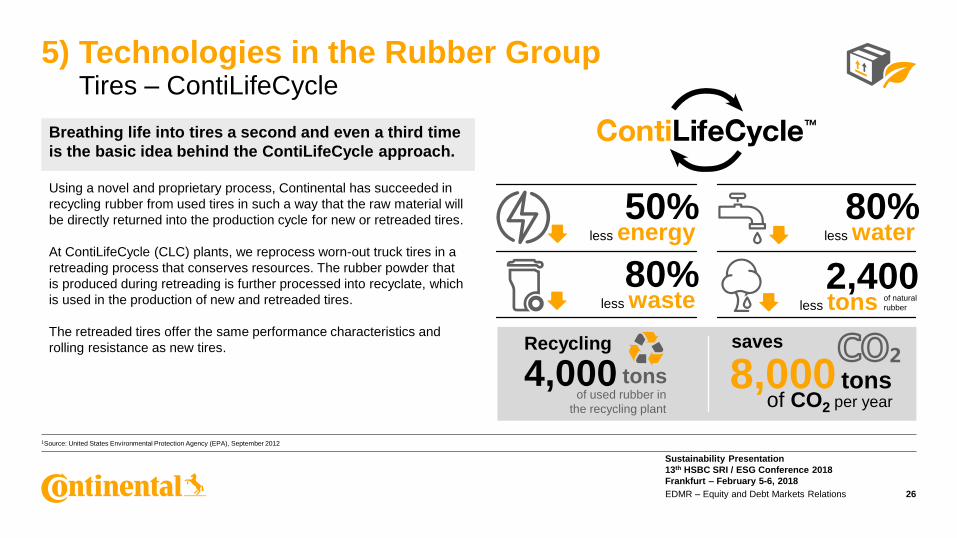
8,000 tons
Breathing life into tires a second and even a third time
is the basic idea behind the ContiLifeCycle approach.
5) Technologies in the Rubber GroupTires – ContiLifeCycle
26EDMR – Equity and Debt Markets Relations
Using a novel and proprietary process, Continental has succeeded in
recycling rubber from used tires in such a way that the raw material will
be directly returned into the production cycle for new or retreaded tires.
At ContiLifeCycle (CLC) plants, we reprocess worn-out truck tires in a
retreading process that conserves resources. The rubber powder that
is produced during retreading is further processed into recyclate, which
is used in the production of new and retreaded tires.
The retreaded tires offer the same performance characteristics and
rolling resistance as new tires.
50%less energy
1Source: United States Environmental Protection Agency (EPA), September 2012
80%
4,000 tons
Recycling
of used rubber in
the recycling plant
saves
of CO2 per year
less water
80%less waste
2,400less tons of natural
rubber
Sustainability Presentation
13th HSBC SRI / ESG Conference 2018
Frankfurt – February 5-6, 2018
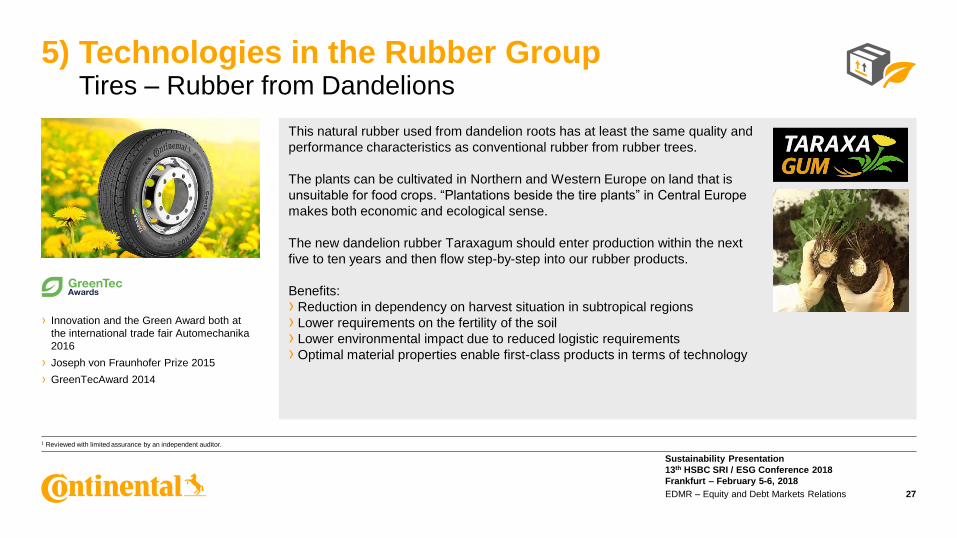
This natural rubber used from dandelion roots has at least the same quality and
performance characteristics as conventional rubber from rubber trees.
The plants can be cultivated in Northern and Western Europe on land that is
unsuitable for food crops. “Plantations beside the tire plants” in Central Europe
makes both economic and ecological sense.
The new dandelion rubber Taraxagum should enter production within the next
five to ten years and then flow step-by-step into our rubber products.
Benefits:
› Reduction in dependency on harvest situation in subtropical regions
› Lower requirements on the fertility of the soil
› Lower environmental impact due to reduced logistic requirements
› Optimal material properties enable first-class products in terms of technology
5) Technologies in the Rubber GroupTires – Rubber from Dandelions
27EDMR – Equity and Debt Markets Relations
1 Reviewed with limited assurance by an independent auditor.
› Innovation and the Green Award both at
the international trade fair Automechanika
2016
› Joseph von Fraunhofer Prize 2015
› GreenTecAward 2014
Sustainability Presentation
13th HSBC SRI / ESG Conference 2018
Frankfurt – February 5-6, 2018
28EDMR – Equity and Debt Markets Relations
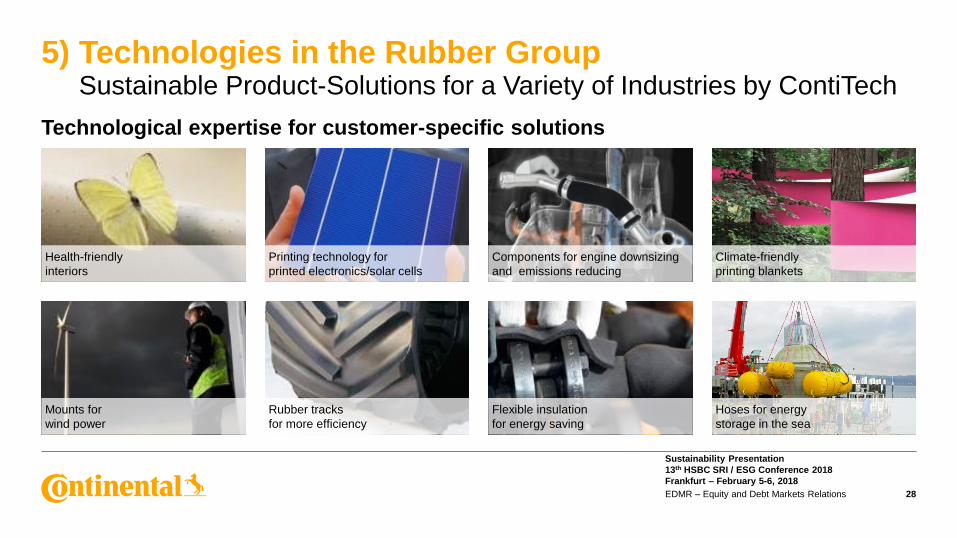
Technological expertise for customer-specific solutions
Health-friendly
interiors
Climate-friendly
printing blankets
Mounts for
wind power
Flexible insulation
for energy saving
Hoses for energy
storage in the sea
Printing technology for
printed electronics/solar cells
Rubber tracks
for more efficiency
Components for engine downsizing
and emissions reducing
5) Technologies in the Rubber GroupSustainable Product-Solutions for a Variety of Industries by ContiTech
Sustainability Presentation
13th HSBC SRI / ESG Conference 2018
Frankfurt – February 5-6, 2018
Sustainability Presentation
13th HSBC SRI / ESG Conference 2018
Frankfurt – February 5-6, 2018
Disclaimer
› This presentation has been prepared by Continental Aktiengesellschaft solely in connection with the 13th HSBC SRI / ESG Conference 2018 on February 5&6, 2018, in Frankfurt. It
has not been independently verified. It does not constitute an offer, invitation or recommendation to purchase or subscribe for any shares or other securities issued by Continental
AG or any subsidiary and neither shall any part of it form the basis of, or be relied upon in connection with, any contract or commitment concerning the purchase or sale of such
shares or other securities whatsoever.
› Neither Continental Aktiengesellschaft nor any of its affiliates, advisors or representatives shall have any liability whatsoever (in negligence or otherwise) for any loss that may arise
from any use of this presentation or its contents or otherwise arising in connection with this presentation.
› This presentation includes assumptions, estimates, forecasts and other forward-looking statements, including statements about our beliefs and expectations regarding future
developments as well as their effect on the results of Continental. These statements are based on plans, estimates and projections as they are currently available to the
management of Continental. Therefore, these statements speak only as of the date they are made, and we undertake no obligation to update publicly any of them in light of new
information or future events. Furthermore, although the management is of the opinion that these statements, and their underlying beliefs and expectations, are realistic as of the date
they are made, no guarantee can be given that the expected developments and effects will actually occur. Many factors may cause the actual development to be materially different
from the expectations expressed here. Such factors include, for example and without limitation, changes in general economic and business conditions, fluctuations in currency
exchange rates or interest rates, the introduction of competing products, the lack of acceptance for new products or services and changes in business strategy.
› All statements with regard to markets or market position(s) of Continental or any of its competitors are estimates of Continental based on data available to Continental. Such data are
neither comprehensive nor independently verified. Consequently, the data used are not adequate for and the statements based on such data are not meant to be an accurate or
proper definition of regional and/or product markets or market shares of Continental and any of the participants in any market.
› Unless otherwise stated, all amounts are shown in millions of euro. Please note that differences may arise as a result of the use of rounded amounts and percentages.
Sustainability Presentation
13th HSBC SRI / ESG Conference 2018
Frankfurt – February 5-6, 2018
ContactEquity and Debt Markets Relations
Vahrenwalder Str. 9
30165 Hanover
Germany
e-mail: [email protected]
Fax: +49 511 938 1080
www.continental-ir.com
Michael Saemann
Analysts, Institutional Investors and
Sustainability Investors
Phone: +49 511 938 1307
E-mail: [email protected]
Klaus Paesler
Analysts, Institutional Investors, ADR
and Private Investors
Phone: +49 511 938 1316
E-mail: [email protected]
Christopher Macke
Analysts, Institutional Investors
Phone: +49 511 938 1062
E-mail: [email protected]
Sabine Reese
Sustainability, ASM, CMD
Organization, IR Website, Capital
Market Disclosure Requirements
Phone: +49 511 938 1027
E-mail: [email protected]
Marvin Kalberlah
Social Media
Phone: +49 511 938 14034
E-mail: [email protected]
Rolf Woller
Head of IR
Phone: +49 511 938 1068
e-mail: [email protected]
Jana Cross
Assistant to the Head of IR
Roadshow and Conference Organization
Phone: +49 511 938 1163
e-mail: [email protected]
Sustainability Presentation
13th HSBC SRI / ESG Conference 2018
Frankfurt – February 5-6, 2018
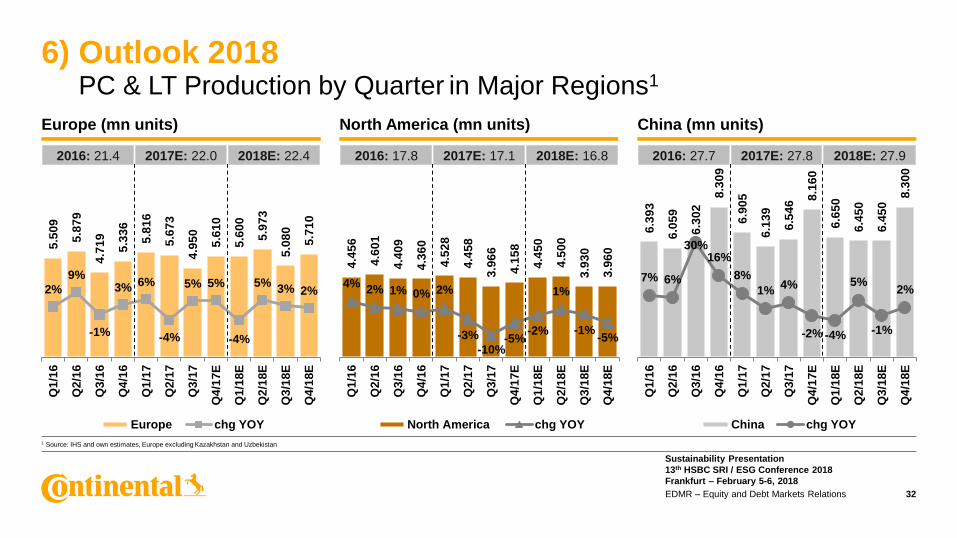
5.5
09
5.8
79
4.7
19
5.3
36
5.8
16
5.6
73
4.9
50
5.6
10
5.6
00
5.9
73
5.0
80
5.7
10
2%
9%
-1%
3% 6%
-4%
5% 5%
-4%
5%3% 2%
Q1
/16
Q2
/16
Q3
/16
Q4
/16
Q1
/17
Q2
/17
Q3
/17
Q4
/17E
Q1
/18E
Q2
/18E
Q3
/18E
Q4
/18E
Europe chg YOY
4.4
56
4.6
01
4.4
09
4.3
60
4.5
28
4.4
58
3.9
66
4.1
58
4.4
50
4.5
00
3.9
30
3.9
60
4%2% 1% 0% 2%
-3%
-10%-5%
-2%
1%
-1%-5%
Q1
/16
Q2
/16
Q3
/16
Q4
/16
Q1
/17
Q2
/17
Q3
/17
Q4
/17E
Q1
/18E
Q2
/18E
Q3
/18E
Q4
/18E
North America chg YOY
6.3
93
6.0
59
6.3
02
8.3
09
6.9
05
6.1
39
6.5
46
8.1
60
6.6
50
6.4
50
6.4
50
8.3
00
7% 6%
30%16%
8%
1%4%
-2% -4%
5%
-1%
2%
Q1
/16
Q2
/16
Q3
/16
Q4
/16
Q1
/17
Q2
/17
Q3
/17
Q4
/17E
Q1
/18E
Q2
/18E
Q3
/18E
Q4
/18E
China chg YOY
North America (mn units)
6) Outlook 2018 PC & LT Production by Quarter in Major Regions1
32EDMR – Equity and Debt Markets Relations
Europe (mn units) China (mn units)
1 Source: IHS and own estimates, Europe excluding Kazakhstan and Uzbekistan
2016: 21.4 2017E: 22.0 2018E: 22.4 2016: 17.8 2017E: 17.1 2018E: 16.8 2016: 27.7 2017E: 27.8 2018E: 27.9
Sustainability Presentation
13th HSBC SRI / ESG Conference 2018
Frankfurt – February 5-6, 2018
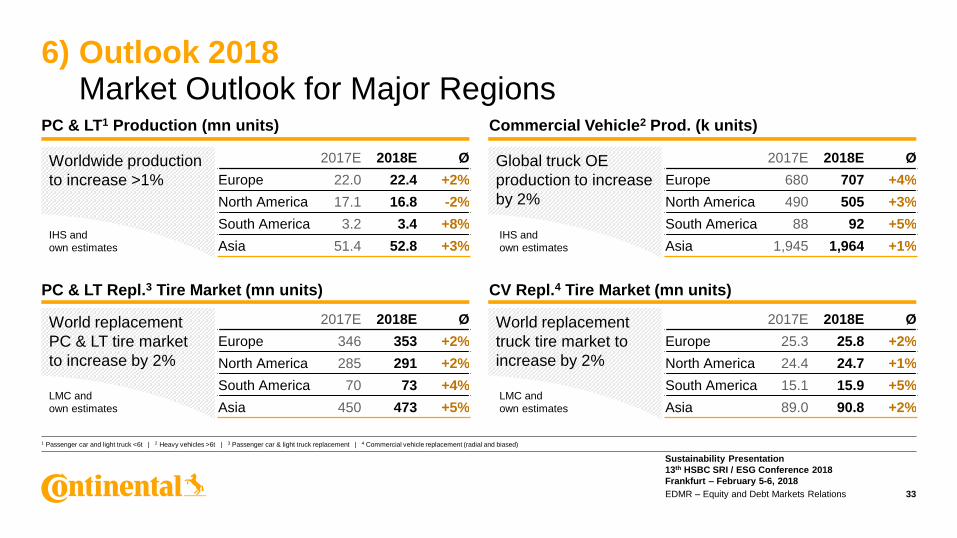
Commercial Vehicle2 Prod. (k units)
CV Repl.4 Tire Market (mn units)
6) Outlook 2018 Market Outlook for Major Regions
33EDMR – Equity and Debt Markets Relations
PC & LT1 Production (mn units)
PC & LT Repl.3 Tire Market (mn units)
Worldwide production
to increase >1%
Global truck OE
production to increase
by 2%
World replacement
PC & LT tire market
to increase by 2%
World replacement
truck tire market to
increase by 2%
IHS and
own estimates
LMC and
own estimates
IHS and
own estimates
LMC and
own estimates
2017E 2018E Ø
Europe 22.0 22.4 +2%
North America 17.1 16.8 -2%
South America 3.2 3.4 +8%
Asia 51.4 52.8 +3%
2017E 2018E Ø
Europe 680 707 +4%
North America 490 505 +3%
South America 88 92 +5%
Asia 1,945 1,964 +1%
2017E 2018E Ø
Europe 346 353 +2%
North America 285 291 +2%
South America 70 73 +4%
Asia 450 473 +5%
2017E 2018E Ø
Europe 25.3 25.8 +2%
North America 24.4 24.7 +1%
South America 15.1 15.9 +5%
Asia 89.0 90.8 +2%
1 Passenger car and light truck <6t | 2 Heavy vehicles >6t | 3 Passenger car & light truck replacement | 4 Commercial vehicle replacement (radial and biased)
Sustainability Presentation
13th HSBC SRI / ESG Conference 2018
Frankfurt – February 5-6, 2018
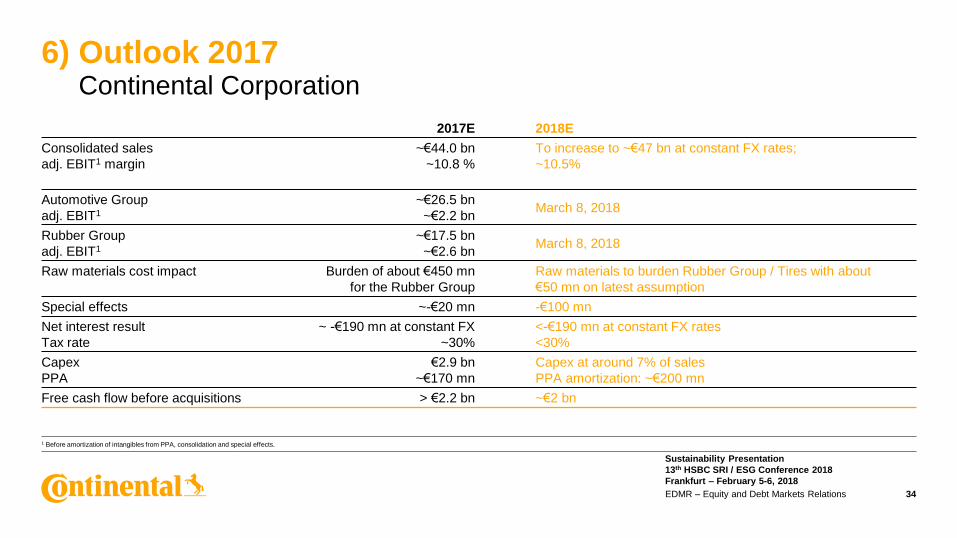
2017E 2018E
Consolidated sales
adj. EBIT1 margin
~€44.0 bn
~10.8 %
To increase to ~€47 bn at constant FX rates;
~10.5%
Automotive Group
adj. EBIT1
~€26.5 bn
~€2.2 bnMarch 8, 2018
Rubber Group
adj. EBIT1
~€17.5 bn
~€2.6 bnMarch 8, 2018
Raw materials cost impact Burden of about €450 mn
for the Rubber Group
Raw materials to burden Rubber Group / Tires with about
€50 mn on latest assumption
Special effects ~-€20 mn -€100 mn
Net interest result
Tax rate
~ -€190 mn at constant FX
~30%
<-€190 mn at constant FX rates
<30%
Capex
PPA
€2.9 bn
~€170 mn
Capex at around 7% of sales
PPA amortization: ~€200 mn
Free cash flow before acquisitions > €2.2 bn ~€2 bn
6) Outlook 2017Continental Corporation
34EDMR – Equity and Debt Markets Relations
1 Before amortization of intangibles from PPA, consolidation and special effects.