sustainability of us public debt: estimating smoothing
TRANSCRIPT
Working Paper No. 83
Sustainability of US public debt: Estimating
smoothing spline regressions
by
Alfred Greiner and Goran Kauermann
University of Bielefeld
Department of Economics
Center for Empirical Macroeconomics
P.O. Box 100 131
33501 Bielefeld, Germany
Sustainability of US public debt: Estimating
smoothing spline regressions∗
Alfred Greiner Goran Kauermann
Department of Business Administration and Economics
Bielefeld University, P.O. Box 100131
33501 Bielefeld, Germany
Abstract
In this paper we analyze how the primary surplus to GDP ratio in the US
reacts to variations in the public debt-GDP ratio. In contrast to earlier studies we
perform non-parametric and semi-parametric estimations. Our results show that
the response of the primary surplus to GDP ratio is a positive nonlinear function
of the debt-GDP ratio. Further, our estimations demonstrate that the coefficient
giving the response of the surplus ratio to a change in the debt ratio declines over
time when we assume a linear model with time dependent coefficients.
JEL: H63, E62
Keywords: Public Debt, Sustainability, Non-parametric estimation, smoothing splines
∗We thank Andreas Handl for helpful comments on an earlier version.
1 Introduction
Bohn (1998) presented a new sustainability test for public debt because, as he argues,
conventional tests are restrictive since they conclude too soon that a given policy is un-
sustainable. As an alternative, Bohn suggests to investigate how the primary surplus
reacts to increases in the debt ratio. If the primary surplus to GDP ratio increases at
least linearly with a rising debt ratio, public debt is sustainable. Intuitively, the reasoning
behind this test is obvious. If the government raises the primary surplus to GDP ratio as
the debt to GDP ratio increases it takes corrective actions which guarantee that the gov-
ernment remains solvent. Formally, this was proven by Bohn (1998) assuming a constant
reaction coefficient. Canzonerie et al. (2001) generalized the proof by allowing for a time
dependent reaction coefficient.1
For the US, Bohn (1998) estimated OLS regressions and found that the primary
surplus-GDP ratio is a positive function of the debt ratio implying that US debt pol-
icy is sustainable. In addition, Bohn estimated parametric regression where the debt
ratio enters the equation to be estimated in a nonlinear way. He found evidence that the
marginal effect of the debt ratio on the primary surplus-GDP ratio rises with higher debt
ratios suggesting a nonlinear, convex relationship. The latter is also supported by Sarno
(2001) who tested for nonlinearities and detected strong evidence for nonlinearities in the
process generating the US debt-GDP time series.
However, neither of these authors apply non-parametric estimation techniques and
they do not present an explicit estimate for the function giving the relation between the
primary surplus ratio and the debt ratio. In this paper we take the next step by exploring
functional shapes of the effects. To do so, we take advantage of recent developments
in statistics. About a decade ago Hastie & Tibshirani (1990) introduced Generalized
1The proof is restrictive since it requires that the reaction coefficient is positive at any moment in
time. However, using continuous time it can be shown that a reaction coefficient which is positive on
average guarantees sufficiency for dynamically efficient economies, see Greiner (2004).
1
Additive Models as a new flexible class of regression model. The theoretical achievements
were accompanied by numerical developments which led to the success of the software
packages S-PLUS and later on R (see also Venables & Ripley, 2003). The main idea behind
this class of models is, that the effect of an explanatory variable on some measurement
of interest is not modelled as parametric (usually linear) function, but kept flexible by
just postulating that the effect is smooth in the sense of differentiability. The functional
shape is thereby to be estimated from the data, either using local, that are kernel based
methods, or spline smoothing. Available software readily allows to fit such models. With
the contributions by Wood (2000, 2001) also the disputable point of choosing the right
amount of smoothing has been settled in practice. A motivating overview of the state of
art in this field can be found in Ruppert, Wand & Carroll (2003).
In this paper we apply non-parametric estimation to US data. We are focussing the
question whether the relation between the primary surplus to GDP ratio and the debt-
GDP ratio is characterized by nonlinearities. In particular, we want to visualize the
function governing the response of the primary surplus ratio to changes in the debt ratio.
To get insight into this question we pursue smoothing spline regression. Furthermore,
we estimate a semi-parametric regression where we assume a linear relation between the
primary surplus ratio and the debt ratio. However, the coefficients associated with the
predictor variables are assumed to be time varying. This leads to a varying coefficient
model as introduced in Hastie & Tibshirani (1993).
The rest of the paper is organized as follows. In the next section, we test for nonlin-
earities in the relationship between the primary surplus to GDP ratio and the debt-GDP
ratio. Section 3 estimates a semi-parametric function where the exogenous variables en-
ter the equation to be estimated in a linear way but the coefficients are allowed to be
nonlinear functions of time. Section 4, finally, concludes.
2
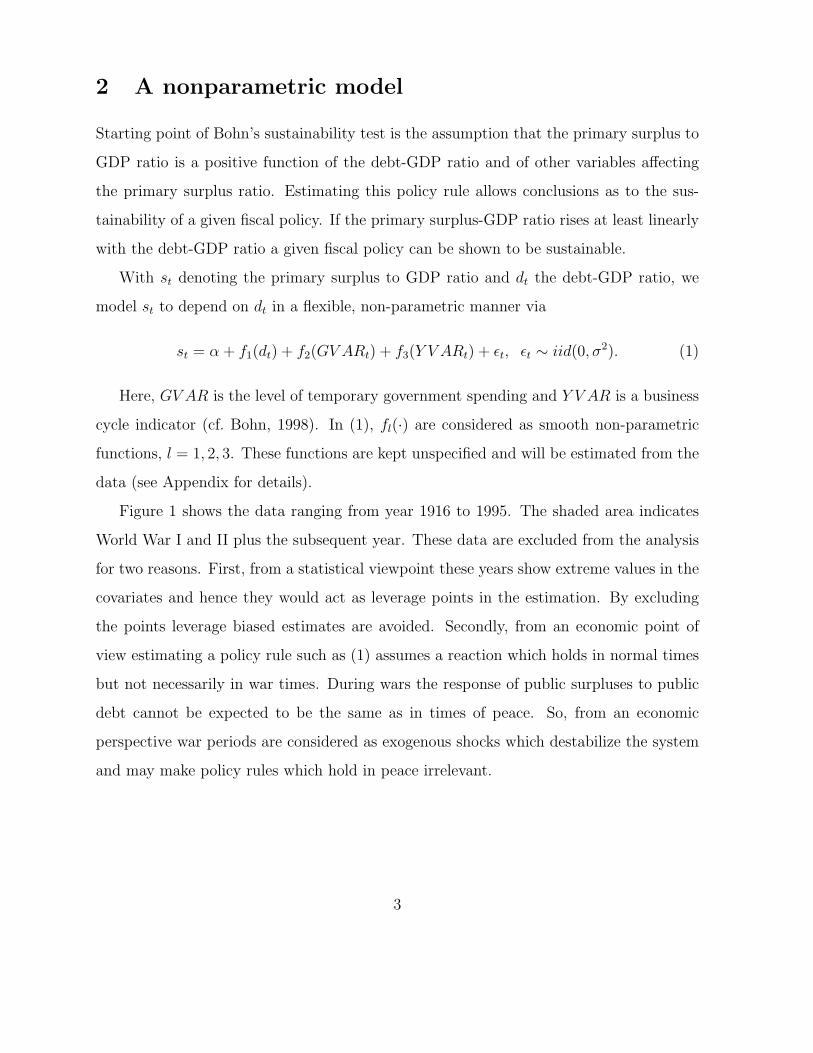
2 A nonparametric model
Starting point of Bohn’s sustainability test is the assumption that the primary surplus to
GDP ratio is a positive function of the debt-GDP ratio and of other variables affecting
the primary surplus ratio. Estimating this policy rule allows conclusions as to the sus-
tainability of a given fiscal policy. If the primary surplus-GDP ratio rises at least linearly
with the debt-GDP ratio a given fiscal policy can be shown to be sustainable.
With st denoting the primary surplus to GDP ratio and dt the debt-GDP ratio, we
model st to depend on dt in a flexible, non-parametric manner via
st = α + f1(dt) + f2(GV ARt) + f3(Y V ARt) + ǫt, ǫt ∼ iid(0, σ2). (1)
Here, GV AR is the level of temporary government spending and Y V AR is a business
cycle indicator (cf. Bohn, 1998). In (1), fl(·) are considered as smooth non-parametric
functions, l = 1, 2, 3. These functions are kept unspecified and will be estimated from the
data (see Appendix for details).
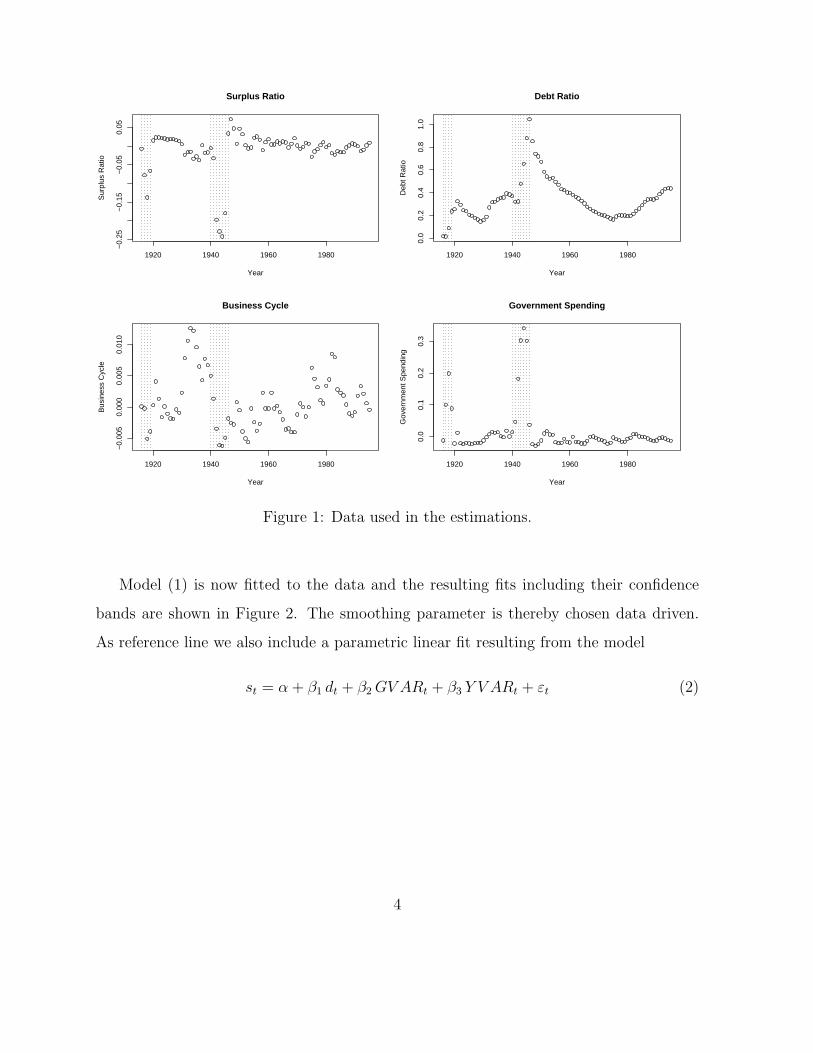
Figure 1 shows the data ranging from year 1916 to 1995. The shaded area indicates
World War I and II plus the subsequent year. These data are excluded from the analysis
for two reasons. First, from a statistical viewpoint these years show extreme values in the
covariates and hence they would act as leverage points in the estimation. By excluding
the points leverage biased estimates are avoided. Secondly, from an economic point of
view estimating a policy rule such as (1) assumes a reaction which holds in normal times
but not necessarily in war times. During wars the response of public surpluses to public
debt cannot be expected to be the same as in times of peace. So, from an economic
perspective war periods are considered as exogenous shocks which destabilize the system
and may make policy rules which hold in peace irrelevant.
3
1920 1940 1960 1980
−0.
25−
0.15
−0.
050.
05
Year
Sur
plus
Rat
ioSurplus Ratio
1920 1940 1960 1980
0.0
0.2
0.4
0.6
0.8
1.0
Year
Deb
t Rat
io
Debt Ratio
1920 1940 1960 1980
−0.
005
0.00
00.
005
0.01
0
Year
Bus
ines
s C
ycle
Business Cycle
1920 1940 1960 1980
0.0
0.1
0.2
0.3
Year
Gov
ernm
ent S
pend
ing
Government Spending
Figure 1: Data used in the estimations.
Model (1) is now fitted to the data and the resulting fits including their confidence
bands are shown in Figure 2. The smoothing parameter is thereby chosen data driven.
As reference line we also include a parametric linear fit resulting from the model
st = α + β1 dt + β2 GV ARt + β3 Y V ARt + εt (2)
4
0.2 0.3 0.4 0.5 0.6 0.7 0.8
−0.
040.
000.
020.
040.
06
d
s(d,
2.66
)Debt Ratio
−0.03 −0.02 −0.01 0.00 0.01
−0.
040.
000.
020.
040.
06
GVAR
s(G
VA
R,4
.63)
Government Spending
−0.005 0.000 0.005 0.010
−0.
040.
000.
020.
040.
06
YVAR
s(Y
VA
R,6
.39)
Business Cycle
1920 1940 1960 1980
−4
−2
02
4
Years
Sta
ndar
dize
d R
esid
uals
Residuals
Linear ModelNonparametric Model
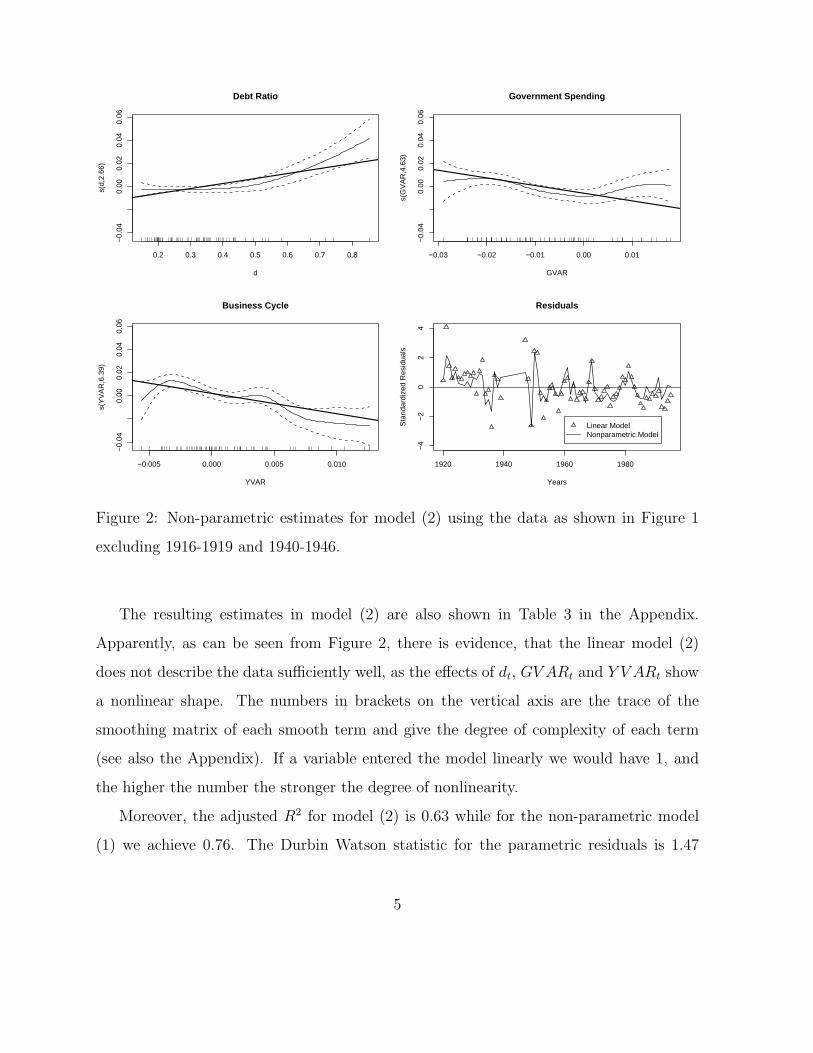
Figure 2: Non-parametric estimates for model (2) using the data as shown in Figure 1
excluding 1916-1919 and 1940-1946.
The resulting estimates in model (2) are also shown in Table 3 in the Appendix.
Apparently, as can be seen from Figure 2, there is evidence, that the linear model (2)
does not describe the data sufficiently well, as the effects of dt, GV ARt and Y V ARt show
a nonlinear shape. The numbers in brackets on the vertical axis are the trace of the
smoothing matrix of each smooth term and give the degree of complexity of each term
(see also the Appendix). If a variable entered the model linearly we would have 1, and
the higher the number the stronger the degree of nonlinearity.
Moreover, the adjusted R2 for model (2) is 0.63 while for the non-parametric model
(1) we achieve 0.76. The Durbin Watson statistic for the parametric residuals is 1.47
5
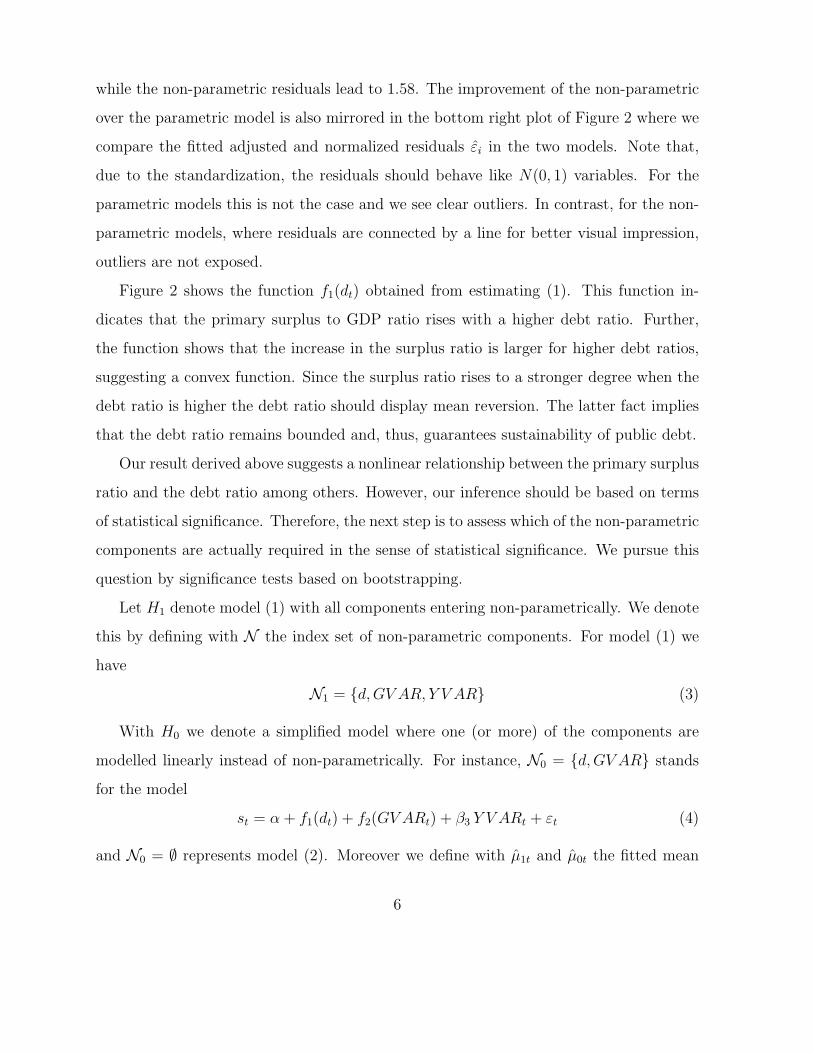
while the non-parametric residuals lead to 1.58. The improvement of the non-parametric
over the parametric model is also mirrored in the bottom right plot of Figure 2 where we
compare the fitted adjusted and normalized residuals εi in the two models. Note that,
due to the standardization, the residuals should behave like N(0, 1) variables. For the
parametric models this is not the case and we see clear outliers. In contrast, for the non-
parametric models, where residuals are connected by a line for better visual impression,
outliers are not exposed.
Figure 2 shows the function f1(dt) obtained from estimating (1). This function in-
dicates that the primary surplus to GDP ratio rises with a higher debt ratio. Further,
the function shows that the increase in the surplus ratio is larger for higher debt ratios,
suggesting a convex function. Since the surplus ratio rises to a stronger degree when the
debt ratio is higher the debt ratio should display mean reversion. The latter fact implies
that the debt ratio remains bounded and, thus, guarantees sustainability of public debt.
Our result derived above suggests a nonlinear relationship between the primary surplus
ratio and the debt ratio among others. However, our inference should be based on terms
of statistical significance. Therefore, the next step is to assess which of the non-parametric
components are actually required in the sense of statistical significance. We pursue this
question by significance tests based on bootstrapping.
Let H1 denote model (1) with all components entering non-parametrically. We denote
this by defining with N the index set of non-parametric components. For model (1) we
have
N1 = {d,GV AR, Y V AR} (3)
With H0 we denote a simplified model where one (or more) of the components are
modelled linearly instead of non-parametrically. For instance, N0 = {d,GV AR} stands
for the model
st = α + f1(dt) + f2(GV ARt) + β3 Y V ARt + εt (4)
and N0 = ∅ represents model (2). Moreover we define with µ1t and µ0t the fitted mean
6
values for the t-th observation st under model H1 and H0, respectively. In order to test
model H0 against H1 we calculate the F type statistic
F =RSS0 − RSS1
RSS1
(5)
where RSSl =∑
n
t=1(st − µlt)
2, l = 0, 1. If both models H0 and H1 are parametric (and
nested) we can use classical asymptotic theory for assessing the significance of F with
reference distribution given by the F distribution. This asymptotic theory does not hold
for non-parametric tests (see e.g. Hardle & Mammen, 1993). We therefore assess F by
bootstrapping. To do so we generate new observations
s∗t
= µ0t + ε∗t
(6)
from the fitted H0 model, where ε∗t
is a bootstrapped residual. In principle, there are
several options to draw ε∗t
(see for instance Shao & Tu, 1995, or Efron & Tibshirani,
1993). We decided for a residual bootstrap, that is we draw ε∗t
from the fitted residuals
ε11, . . . , ε1n in the H1 model with ε1t = st − µ1t. Note that bootstrap residuals must not
be drawn from the fitted H0 residuals ε0t. This would be wrong, because if the H0 model
is not correct, this results in biased residuals. Hence, bootstrapping with residuals drawn
from the H0 model would mean simulating from a false model.
With (6) we now run the standard ideas of bootstrapping by refitting models H1 and
H0 to the bootstrapped data s∗t
to obtain a bootstrapped F statistic F ∗. Repeating this
B times provides a simulated reference distribution of F under H0 which finally allows to
assess significance.
We have now gathered the prerequisites to run a model selection which is pursued in a
stepwise backward selection by replacing one non-parametric function by a linear function
after the other. The results are listed in Table 1. The final model shows a non-parametric
structure in the debt ratio d and in government spending GV AR yielding (4) as the final
model. It should be noted that the business cycle variable Y V AR does not enter the
equation non-parametrically and the shape shown in Figure 2 is not significantly different
7
from a straight line. The fact that Y V AR does not enter non-parametrically holds because
we cannot reject H0 : N0 = {d,GV AR} against H1 : N1 = {d,GV AR, Y V AR} while
H0 : N0 = {d, Y V AR} and H0 : N0 = {GV AR, Y V AR} are both rejected in favour
of H1 : N1 = {d,GV AR, Y V AR}. Further, both the debt ratio d as well as temporary
government spending GV AR enter the equation in a non-parametric way as the last two
lines in Table 1 clearly show. Now, both H0 : N0 = {d} and H0 : N0 = {GV AR} are
rejected in favour of H1 : N1 = {d,GV AR}.
The corresponding fitted smooth functions f1(·) and f2(·) of (4) are basically the same
as those shown in Figure 2 and are therefore not reproduced again. Especially, the primary
surplus ratio again turns out to be a convex function of the debt ratio.
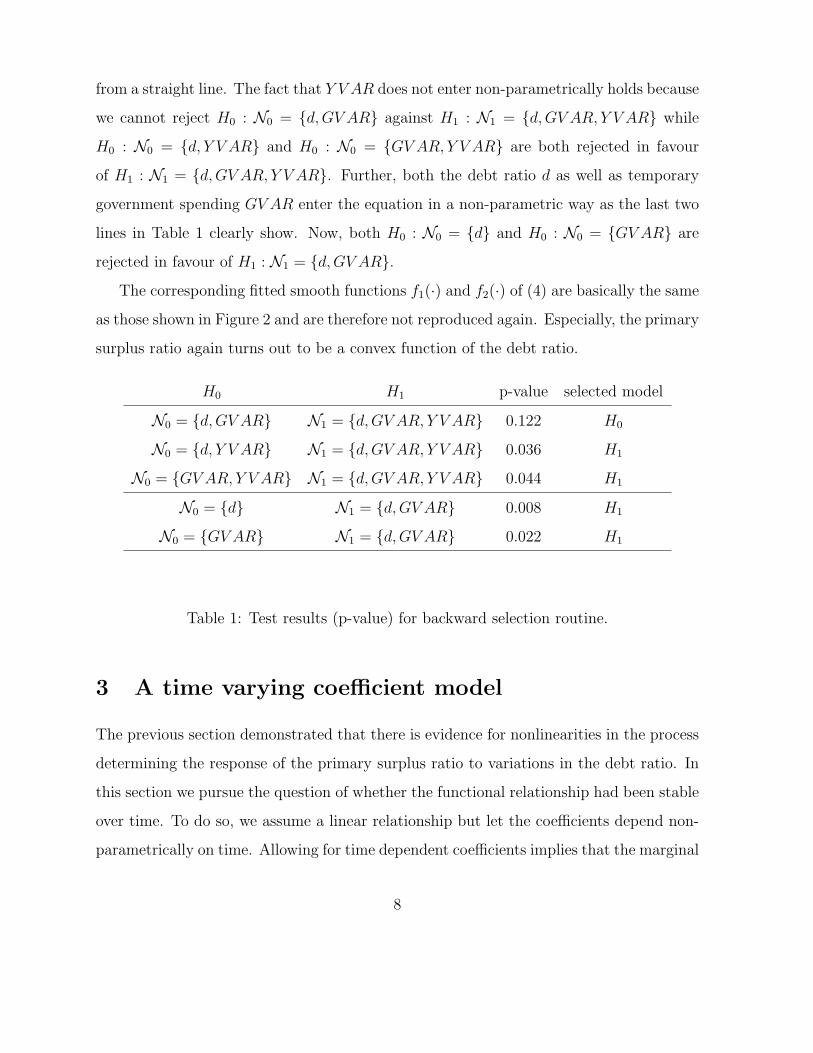
H0 H1 p-value selected model
N0 = {d,GV AR} N1 = {d,GV AR, Y V AR} 0.122 H0
N0 = {d, Y V AR} N1 = {d,GV AR, Y V AR} 0.036 H1
N0 = {GV AR, Y V AR} N1 = {d,GV AR, Y V AR} 0.044 H1
N0 = {d} N1 = {d,GV AR} 0.008 H1
N0 = {GV AR} N1 = {d,GV AR} 0.022 H1
Table 1: Test results (p-value) for backward selection routine.
3 A time varying coefficient model
The previous section demonstrated that there is evidence for nonlinearities in the process
determining the response of the primary surplus ratio to variations in the debt ratio. In
this section we pursue the question of whether the functional relationship had been stable
over time. To do so, we assume a linear relationship but let the coefficients depend non-
parametrically on time. Allowing for time dependent coefficients implies that the marginal
8
effect of the variables may change over time giving sufficient flexibility. Therefore, a linear
structure can be justified in the estimation of the functional relationship between the
surplus ratio and the debt ratio.
The equation to be estimated, then, is given by
st = α + β1(t) dt + β2 GV ARt + β3 Y V ARt + εt (7)
Now, β1(t) gives the effect of the debt ratio depending on time t. In principle, one could
also allow β2 as well as β3 to depend on t. However there is no evidence in the data for
such dynamic structure, tested in an analogous way as in the previous section. From an
economic point of view this implies that the effects of temporary government spending and
of business cycles on the primary surplus ratio are constant over time. Thus, there is no
indication that the fiscal behaviour of the government as to variations in public spending
and business cycles has changed. This can be justified by resorting to the tax smoothing
model stating that public deficits should be used to compensate declining tax revenues
such that tax rates are smoothed over time. Therefore, there should be no systematic
time trend in the coefficients of GV AR and Y V AR giving policy makers’ response to
temporary government spending and to business cycle variations.
As database we now consider post World War II years starting with 1947. The fitted
coefficient β1(t) is shown in Figure 3 together with the estimated residuals εt. The Durbin
Watson statistic for εt takes the value 1.65 and R2 is calculated as 0.72. The parametric
estimates β2 and β3 are listed in Table 2.
9
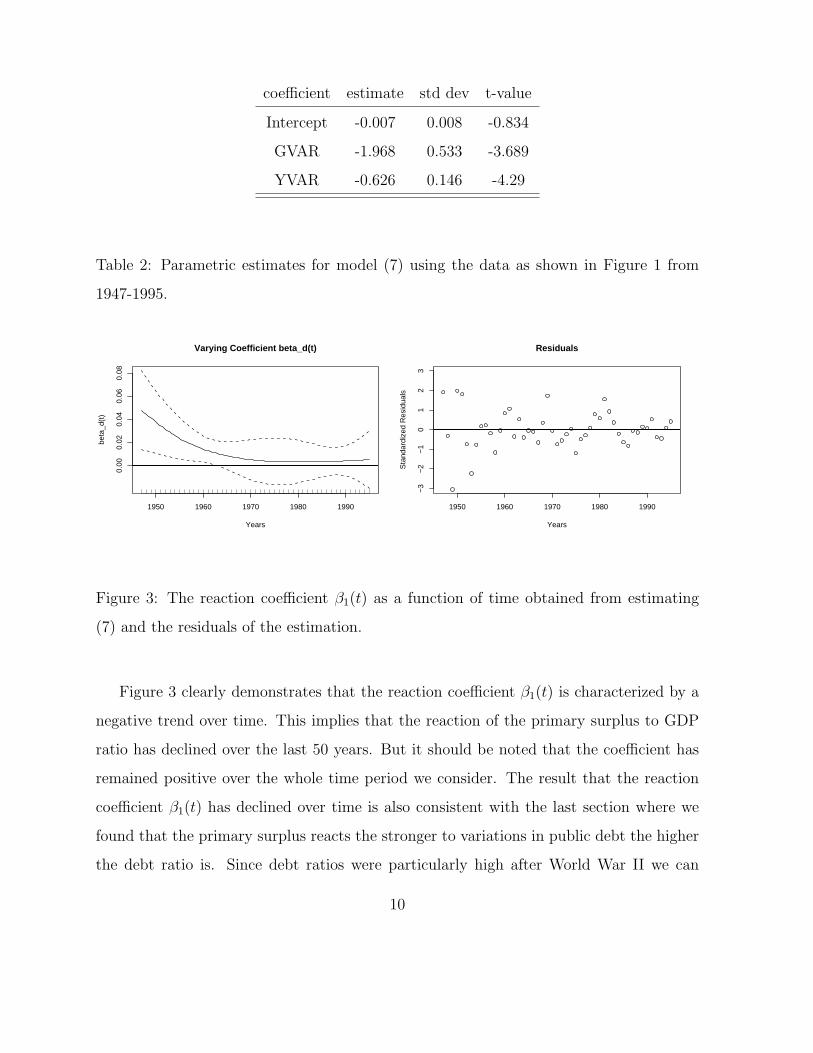
coefficient estimate std dev t-value
Intercept -0.007 0.008 -0.834
GVAR -1.968 0.533 -3.689
YVAR -0.626 0.146 -4.29
Table 2: Parametric estimates for model (7) using the data as shown in Figure 1 from
1947-1995.
1950 1960 1970 1980 1990
Years
beta
_d(t
)
0.00
0.02
0.04
0.06
0.08
Varying Coefficient beta_d(t)
1950 1960 1970 1980 1990
−3
−2
−1
01
23
Years
Sta
ndar
dize
d R
esid
uals
Residuals
Figure 3: The reaction coefficient β1(t) as a function of time obtained from estimating
(7) and the residuals of the estimation.
Figure 3 clearly demonstrates that the reaction coefficient β1(t) is characterized by a
negative trend over time. This implies that the reaction of the primary surplus to GDP
ratio has declined over the last 50 years. But it should be noted that the coefficient has
remained positive over the whole time period we consider. The result that the reaction
coefficient β1(t) has declined over time is also consistent with the last section where we
found that the primary surplus reacts the stronger to variations in public debt the higher
the debt ratio is. Since debt ratios were particularly high after World War II we can
10
expect that the reaction coefficient β1(t) is high in those periods when we assume a linear
but time varying relationship.
We should also like to point out that GV AR and Y V AR have the expected signs as in
the paper by Bohn (1998). However, in contrast to Bohn, the GV AR coefficient is larger
than one and the Y V AR coefficient is smaller than one in absolute values. This implies
that the primary surplus falls by less than GDP in a recession and by more than GDP as
temporary government spending rises.
4 Conclusion
This paper has tested for sustainability of US public debt by analyzing how the primary
surplus reacts to variations in the debt ratio. Estimating smoothing spline regressions
demonstrated that the primary surplus to GDP ratio is a nonlinearly increasing function
of the debt ratio. In addition, we could provide an estimate for the function giving
the response of the primary surplus ratio to the debt ratio. This function showed that
the response of primary surplus-GDP ratio seems to increase with a rising debt ratio
confirming Bohn’s conjecture.
Further, we performed a semi-parametric estimation where we assumed a linear re-
lationship, but with the parameter giving the response of the primary surplus ratio to
changes in the debt ratio being time dependent. With the parameter being time de-
pendent the linear model is sufficiently flexible to reflect the situation in the US. This
estimation demonstrated that the sustainability coefficient declined over time but seems to
remain positive over the time period under consideration. Thus, our estimations provide
additional evidence that US public debt was sustainable over the time period considered
although there was a negative trend.
From a methodological point of view this paper has provided an example for smooth-
ing spline regressions which allow to perform non-parametric and semi-parametric esti-
mations. These are more flexible than OLS estimations and contain the latter as a special
11

case. Surprisingly, there are only few applications of smoothing spline estimations in eco-
nomics although these estimations may yield insights into economic structure which are
difficult to detect with ordinary OLS estimation.
12
A Nonparametric estimation
The subsequent algorithm is based on Wood (2000) and implemented in the public domain
software package R (see Ihaka & Gentleman, 1996). The program and more information
about it can be downloaded from http://www.r-project.org/. We exemplify the fit with
the simplified model
st = α + f(dt) + εt
Let st and dt be the observed values for t = 1, 2, . . .. For fitting we replace f(dt) by
the parametric form
f(dt) = dt βd + Z(dt) γ (8)
where Z(dt) is a high dimensional basis in dt, for instance a cubic spline basis, and γ as
corresponding coefficient. Conventionally, Z(dt) is 10 to 40 dimensional. In practice, if
a larger basis is used this is reduced to a smaller basis using only those basis functions
corresponding to the largest Eigenvalues of Z(dt)Z(dt)T , see Wood (2000) for more details.
In principle, with replacement (8) one ends up with a parametric model. However, fit-
ting the model in a standard OLS fashion is unsatisfactory due to the large dimensionality
of Z(dt) which will lead to highly variable estimates. This can be avoided by imposing an
additional penalty term on γ, shrinking its values to zero. To be more specific, we obtain
an estimate by minimizing the penalized OLS criterion
∑
t
{st − dtβd − Z(dt)γ}2 + λγT Pγ
with λ called the smoothing or penalty parameter and γT Pγ as penalty. Matrix P is
thereby chosen in accordance to the basis (see Ruppert, Wand & Carroll, 2003, for more
details). It is easy to see that choosing λ = 0 yields an unpenalized OLS fit, while λ → ∞
typically implies γ = 0 depending on the choice of P . Hence, λ steers the amount of
smoothness of the function with a simple linear fit as one extreme and a high dimensional
parametric as the other extreme.
13
The fitted function itself can be written as f1(d) = H(λ)s where s = (s1, s2, . . .) is
the vector of observed surplus values and analogous definition for d. The matrix H(λ)
results thereby as
H(λ) =(
d Z(d))
dT
ZT (d)
(
d Z(d))
+ λ
0 0
0 P
−1
dT
ZT (d)
.
Matrix H(λ) is also called the smoothing matrix and its trace is conventionally defined
as the degree of complexity of the fit. Note that as special case we get trace of H(∞)
equals 1 while trace of H(0) is p+1 with p as dimension of Z(d). The parameter λ steers
the compromise between goodness of fit and complexity of the fit.
To obtain a reliable fit, λ should be chosen data driven. One possibility is to use a
generalized cross validation criterion defined through
GCV (λ) =∑
t
(
st − f(dt)
1 − tr(H)/n
)2
with n as overall sample size. A suitable choice for λ is achieved by minimizing GCV (λ).
This can be done iteratively using a Newton-Raphson algorithm, as has been pointed out
and implemented by Wood (2000, 2001).
If there is more than one smooth function involved, estimation can be carried out
using a backfitting strategy. This means, in order to fit one smooth component all other
terms in the model are kept fixed and smoothing like demonstrated above is pursued.
One then cycles over the different smooth components by always fitting just one of the
smooth functions. This is the major idea behind fitting additive models and we refer to
Hastie & Tibshirani (1990) for further technical details.
14
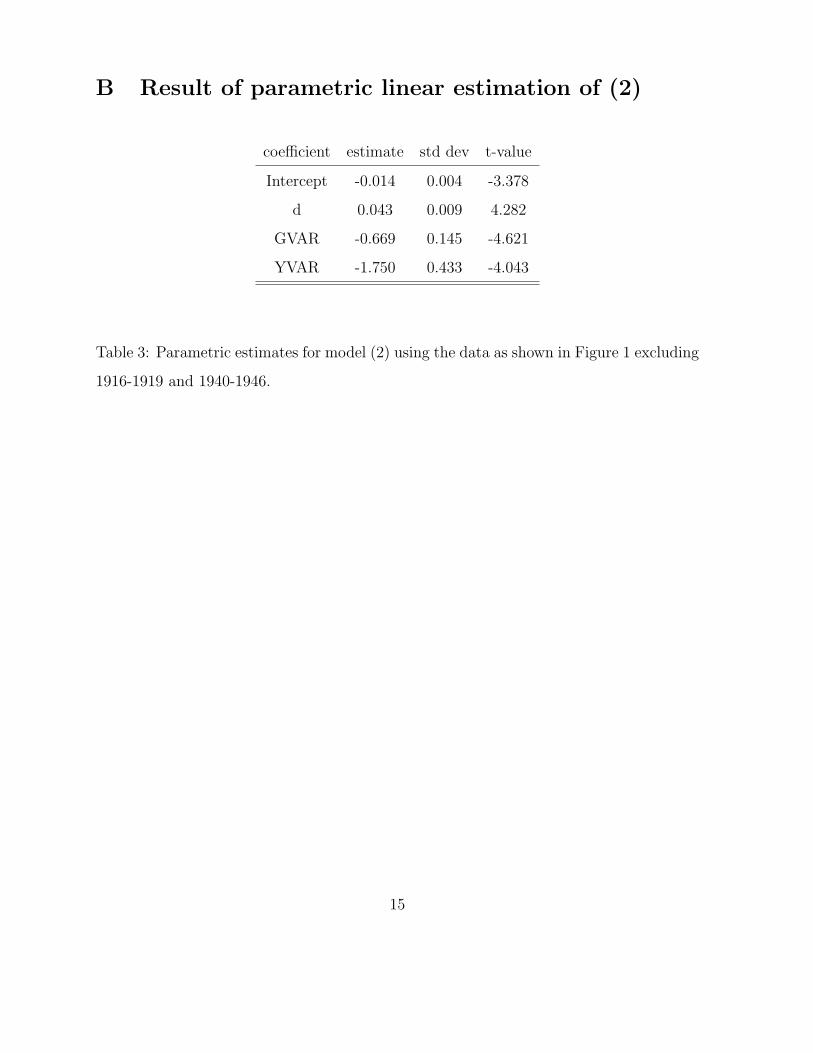
B Result of parametric linear estimation of (2)
coefficient estimate std dev t-value
Intercept -0.014 0.004 -3.378
d 0.043 0.009 4.282
GVAR -0.669 0.145 -4.621
YVAR -1.750 0.433 -4.043
Table 3: Parametric estimates for model (2) using the data as shown in Figure 1 excluding
1916-1919 and 1940-1946.
15
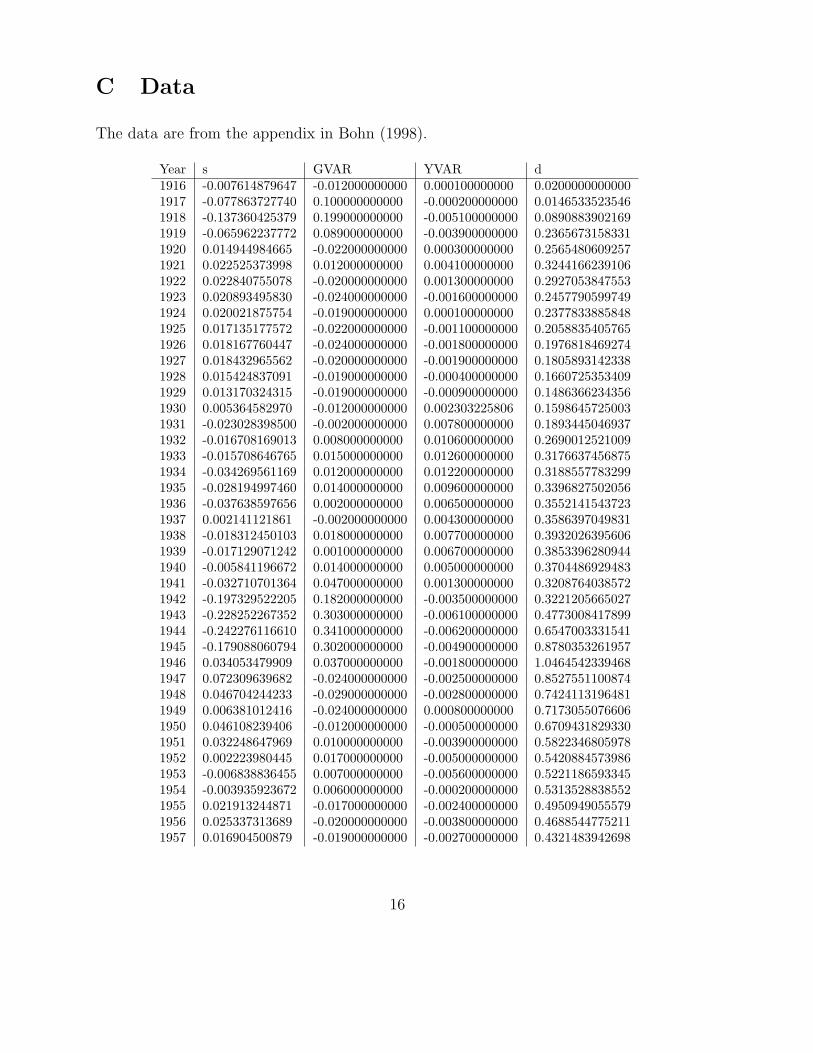
C Data
The data are from the appendix in Bohn (1998).
Year s GVAR YVAR d1916 -0.007614879647 -0.012000000000 0.000100000000 0.02000000000001917 -0.077863727740 0.100000000000 -0.000200000000 0.01465335235461918 -0.137360425379 0.199000000000 -0.005100000000 0.08908839021691919 -0.065962237772 0.089000000000 -0.003900000000 0.23656731583311920 0.014944984665 -0.022000000000 0.000300000000 0.25654806092571921 0.022525373998 0.012000000000 0.004100000000 0.32441662391061922 0.022840755078 -0.020000000000 0.001300000000 0.29270538475531923 0.020893495830 -0.024000000000 -0.001600000000 0.24577905997491924 0.020021875754 -0.019000000000 0.000100000000 0.23778338858481925 0.017135177572 -0.022000000000 -0.001100000000 0.20588354057651926 0.018167760447 -0.024000000000 -0.001800000000 0.19768184692741927 0.018432965562 -0.020000000000 -0.001900000000 0.18058931423381928 0.015424837091 -0.019000000000 -0.000400000000 0.16607253534091929 0.013170324315 -0.019000000000 -0.000900000000 0.14863662343561930 0.005364582970 -0.012000000000 0.002303225806 0.15986457250031931 -0.023028398500 -0.002000000000 0.007800000000 0.18934450469371932 -0.016708169013 0.008000000000 0.010600000000 0.26900125210091933 -0.015708646765 0.015000000000 0.012600000000 0.31766374568751934 -0.034269561169 0.012000000000 0.012200000000 0.31885577832991935 -0.028194997460 0.014000000000 0.009600000000 0.33968275020561936 -0.037638597656 0.002000000000 0.006500000000 0.35521415437231937 0.002141121861 -0.002000000000 0.004300000000 0.35863970498311938 -0.018312450103 0.018000000000 0.007700000000 0.39320263956061939 -0.017129071242 0.001000000000 0.006700000000 0.38533962809441940 -0.005841196672 0.014000000000 0.005000000000 0.37044869294831941 -0.032710701364 0.047000000000 0.001300000000 0.32087640385721942 -0.197329522205 0.182000000000 -0.003500000000 0.32212056650271943 -0.228252267352 0.303000000000 -0.006100000000 0.47730084178991944 -0.242276116610 0.341000000000 -0.006200000000 0.65470033315411945 -0.179088060794 0.302000000000 -0.004900000000 0.87803532619571946 0.034053479909 0.037000000000 -0.001800000000 1.04645423394681947 0.072309639682 -0.024000000000 -0.002500000000 0.85275511008741948 0.046704244233 -0.029000000000 -0.002800000000 0.74241131964811949 0.006381012416 -0.024000000000 0.000800000000 0.71730550766061950 0.046108239406 -0.012000000000 -0.000500000000 0.67094318293301951 0.032248647969 0.010000000000 -0.003900000000 0.58223468059781952 0.002223980445 0.017000000000 -0.005000000000 0.54208845739861953 -0.006838836455 0.007000000000 -0.005600000000 0.52211865933451954 -0.003935923672 0.006000000000 -0.000200000000 0.53135288385521955 0.021913244871 -0.017000000000 -0.002400000000 0.49509490555791956 0.025337313689 -0.020000000000 -0.003800000000 0.46885447752111957 0.016904500879 -0.019000000000 -0.002700000000 0.4321483942698
16
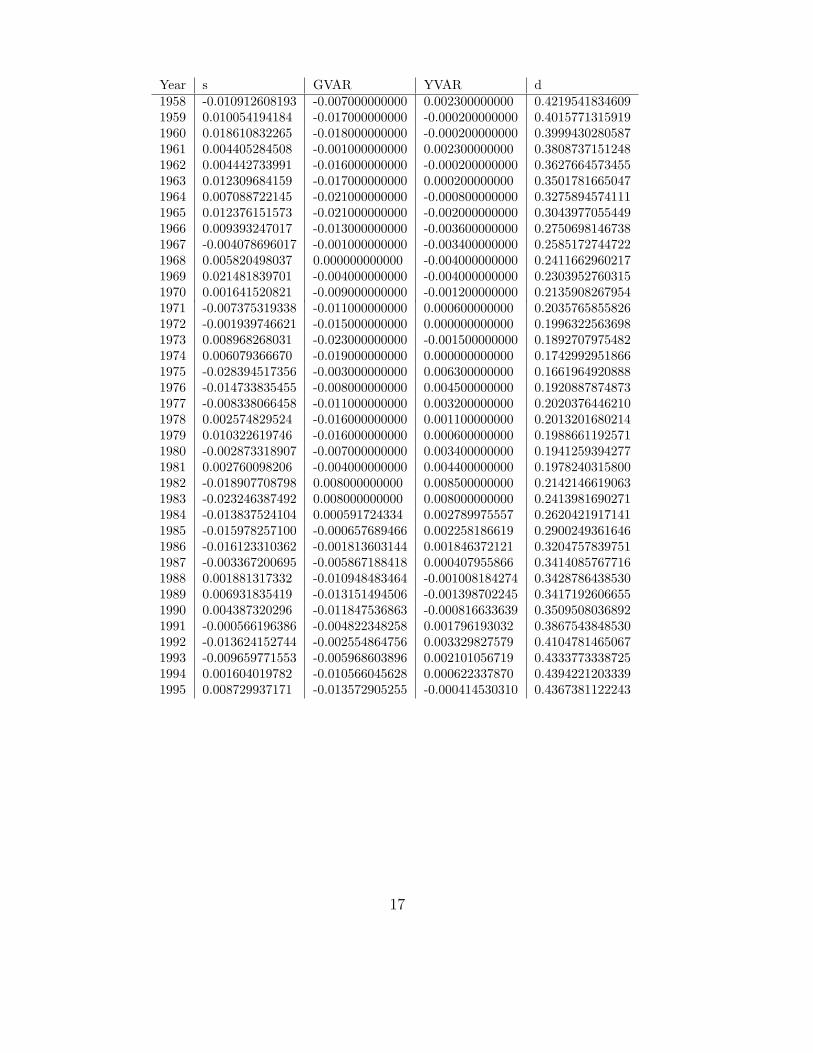
Year s GVAR YVAR d1958 -0.010912608193 -0.007000000000 0.002300000000 0.42195418346091959 0.010054194184 -0.017000000000 -0.000200000000 0.40157713159191960 0.018610832265 -0.018000000000 -0.000200000000 0.39994302805871961 0.004405284508 -0.001000000000 0.002300000000 0.38087371512481962 0.004442733991 -0.016000000000 -0.000200000000 0.36276645734551963 0.012309684159 -0.017000000000 0.000200000000 0.35017816650471964 0.007088722145 -0.021000000000 -0.000800000000 0.32758945741111965 0.012376151573 -0.021000000000 -0.002000000000 0.30439770554491966 0.009393247017 -0.013000000000 -0.003600000000 0.27506981467381967 -0.004078696017 -0.001000000000 -0.003400000000 0.25851727447221968 0.005820498037 0.000000000000 -0.004000000000 0.24116629602171969 0.021481839701 -0.004000000000 -0.004000000000 0.23039527603151970 0.001641520821 -0.009000000000 -0.001200000000 0.21359082679541971 -0.007375319338 -0.011000000000 0.000600000000 0.20357658558261972 -0.001939746621 -0.015000000000 0.000000000000 0.19963225636981973 0.008968268031 -0.023000000000 -0.001500000000 0.18927079754821974 0.006079366670 -0.019000000000 0.000000000000 0.17429929518661975 -0.028394517356 -0.003000000000 0.006300000000 0.16619649208881976 -0.014733835455 -0.008000000000 0.004500000000 0.19208878748731977 -0.008338066458 -0.011000000000 0.003200000000 0.20203764462101978 0.002574829524 -0.016000000000 0.001100000000 0.20132016802141979 0.010322619746 -0.016000000000 0.000600000000 0.19886611925711980 -0.002873318907 -0.007000000000 0.003400000000 0.19412593942771981 0.002760098206 -0.004000000000 0.004400000000 0.19782403158001982 -0.018907708798 0.008000000000 0.008500000000 0.21421466190631983 -0.023246387492 0.008000000000 0.008000000000 0.24139816902711984 -0.013837524104 0.000591724334 0.002789975557 0.26204219171411985 -0.015978257100 -0.000657689466 0.002258186619 0.29002493616461986 -0.016123310362 -0.001813603144 0.001846372121 0.32047578397511987 -0.003367200695 -0.005867188418 0.000407955866 0.34140857677161988 0.001881317332 -0.010948483464 -0.001008184274 0.34287864385301989 0.006931835419 -0.013151494506 -0.001398702245 0.34171926066551990 0.004387320296 -0.011847536863 -0.000816633639 0.35095080368921991 -0.000566196386 -0.004822348258 0.001796193032 0.38675438485301992 -0.013624152744 -0.002554864756 0.003329827579 0.41047814650671993 -0.009659771553 -0.005968603896 0.002101056719 0.43337733387251994 0.001604019782 -0.010566045628 0.000622337870 0.43942212033391995 0.008729937171 -0.013572905255 -0.000414530310 0.4367381122243
17
References
[1] Bohn, H. (1998), ”The behaviour of U.S. public Debt and deficits” Quarterly Journal
of Economics, Vol. 113: 949-963.
[2] Canzonerie, M.B., R.E. Cumby and B.T. Diba (2001), ”Is the price level determined
by the needs of fiscal solvency?” American Economic Review, Vol. 91: 1221-38.
[3] Efron, B. and R.J. Tibshirani (1993) An Introduction to the Bootstrapping. Chapman
& Hall, London.
[4] Greiner, A. (2004) ”Debt sustainability in the Euro-area: Evidence for Germany and
Italy using smoothing spline regressions.” CEM Working Paper, No. 80, Bielefeld
University, http://www.wiwi.uni-bielefeld.de/∼cem/.
[5] Hardle, W. and E. Mammen (1993) ”Comparing non-parametric versus parametric
regression fits.” The Annals of Statistics, Vol. 21: 1926-1947.
[6] Hastie, T.J. and R.J. Tibshirani (1990) Generalized Additive Models. Chapman and
Hall, London.
[7] Hastie, T.J. and R.J. Tibshirani (1993) ”Varying–coefficient Models.” Journal of the
Royal Statistical Society, Series B, Vol. 55: 757-796.
[8] Ihaka, R. and R. Gentleman (1996) ”R: A language for data analysis and graphics.”
Journal of Computational and Graphical Statistics, Vol. 5: 299-314.
[9] Ruppert R., Wand M.P. and R.J. Carroll (2003) Semiparametric Regression. Cam-
bridge University Press, Cambridge.
[10] Sarno, L. (2001) ”The behaviour of US public debt: a nonlinear perspective” Eco-
nomics Letters, Vol. 74: 119-125.
[11] Shao, J. and D. Tu (1995) The Jackknife and Bootstrap. Springer Verlag, New York.
18
[12] Venables, W.N. and B.D. Ripley (2002) Modern Applied Statistics with S. (4th edi-
tion) Springer, New York.
[13] Wood, S.N. (2000) ”Modelling and smoothing parameter estimation with multiple
quadratic penalties.” Journal of the Royal Statistical Society, Series B, Vol. 62: 413-
428.
[14] Wood, S.N. (2001) ”mgcv: GAM’s and Generalized Ridge Regression for R.” R News,
Vol. 1(2): 20-25.
19