sustainability of forest management practices: …web.forestry.ubc.ca/ecomodels/pubs/blanco et al...
TRANSCRIPT

www.elsevier.com/locate/foreco
Forest Ecology and Management 213 (2005) 209–228
Sustainability of forest management practices: Evaluation through
a simulation model of nutrient cycling
Juan A. Blanco a, Miguel A. Zavala b, J. Bosco Imbert a, Federico J. Castillo a,*
a Departamento de Ciencias del Medio Natural, Edificio los Olivos, Universidad Publica de Navarra, E-31006 Pamplona, Navarra, Spainb Departamento de Ecologıa, Edificio de Ciencias, Universidad de Alcala, E-28871 Alcala de Henares, Madrid, Spain
Received 11 May 2004; received in revised form 25 January 2005; accepted 30 March 2005
Abstract
Forest harvesting may interfere with long-term ecosystem structure and function and different harvesting methods will differ
in their effects on soil fertility (e.g. whole-tree harvesting versus stem removal). In the case of thinning, effects of thinning
intensity, rotation length and site quality must be assessed in order to formulate sustainable management practices. Assessment
of the relative impact of these practices is difficult, however, given the long temporal scales involved. In this study, we implement
a process-based model of nutrient cycling to evaluate temporal changes in ecosystem nutrient dynamics of managed and non-
managed forest stands. The model was specifically designed to asses differences between two contrasting site-quality Pinus
sylvestris L. stands in the western Pyrenees (Navarre, Spain) managed under two thinning intensities. The model describes the
main nutrient fluxes in the stand: litterfall, decomposition, retranslocation, root uptake and management type, and it was
parameterized and verified with 3 years of field data. After model verification we examined the effects of thinning intensity,
thinning frequency and harvesting method (whole-tree versus stem removal) on potential nutrient losses. The results suggest that
in this heterogeneous region, sustainability of forestry practices is strongly site dependent. N and P were particularly sensitive to
overexploitation and in no case could whole-tree removal be recommended as it may have a strong negative effect on nutrient
reserves. In relation to previous nutrient cycling models, our model offers a satisfactory compromise between simplicity,
biological realism and predictability, and it proved to be a useful tool to predict short-term changes in nutrient reserves as well as
to evaluate possible negative effects of applying current thinning prescriptions on long-term sustainability of managed forests in
the western Pyrenees.
# 2005 Elsevier B.V. All rights reserved.
Keywords: Thinning; Pinus sylvestris L.; Scots pine; Navarre; Whole-tree removal; Forest harvesting; Nitrogen; Phosphorus; Mediterranean
pine forests
* Corresponding author. Tel.: +34 948 169 115;
fax: +34 948 168 930.
E-mail address: [email protected] (F.J. Castillo).
0378-1127/$ – see front matter # 2005 Elsevier B.V. All rights reserved
doi:10.1016/j.foreco.2005.03.042
1. Introduction
To achieve ecosystem and economic sustainability
a forest practice must achieve three different goals: (1)
to be economically profitable and to perpetuate forest
.
J.A. Blanco et al. / Forest Ecology and Management 213 (2005) 209–228210
cover, (2) to preserve ecosystem structure (e.g. for
biodiversity values) and (3) to preserve ecosystem
function (e.g. nutrient cycling) (Zavala and Oria,
1995; Sverdrup and Svensson, 2002). Among other
effects, thinning reduces stand biomass, nutrient
contents, litterfall (Klemmedson et al., 1990; Har-
rington and Edwards, 1999) and can alter decom-
position rates (Piene and Van Cleve, 1978; Perez-
Batallon et al., 1998). Continuous long-term studies of
the effect of management practices on nutrient budgets
are expensive and time consuming. As a compliment
to long-term experiments, simulation models are
useful tools that allow us to extrapolate observed
short-term changes in nutrient dynamics to longer
time scales (Landsberg, 2003). Experimental studies
and modelling are complementary approaches within
an adaptive management context that can identify
essential mechanisms controlling short- and long-term
processes that are critical for maintaining ecosystem
structure and function (Kirschbaum, 1999; Grigal,
2000). Once identified, a field-monitoring program
can be designed that maximizes the efficiency of
sampling and laboratory analyses, which are neces-
sary to confirm that management is sustainable.
Models of nutrient cycling are of particular
importance for evaluation of sustainability of forest
practices. Typically these models include feedbacks
among litterfall, retranslocation, tree growth, root
uptake and decomposition while aboveground pro-
cesses are directly related to tree growth. A number of
modelling approaches have been used to describe
decomposition and root uptake processes. These
models differ both in structure and applicability for
forest management. The first decomposition models
were correlational (Andersson et al., 2000) and were
based on statistical relationships among the different
variables involved (Olson, 1963; Swift et al., 1979). A
second generation of models explicitly considered
different fractions of soil organic matter characterized
by chemical composition and decomposition rates
(CENTURY, Parton et al., 1987). These models are
currently used for forest research and management as
well as modules within biosphere carbon cycle
simulators (e.g. FORSANA, Grote et al., 1998;
FORECAST, Kimmins et al., 1999; CenW, Kirsch-
baum, 1999; EFIMOD 2, Komarov et al., 2003;
ForNBM, Zhu et al., 2003). Although they provide
adequate biological realism, these models tend to be
very complex. This adds uncertainty to the causes
underlying their final predictions and weakens their
heuristic value (Andersson et al., 2000). Finally,
analytical models, such as the ‘‘Q’’ model (Agren and
Bosatta, 1996), provide useful theoretical insights but
they often omit too much critical detail (Kimmins,
2004) or are based on parameters difficult to estimate
under field conditions. Therefore, the applicability of
these simpler models for forest management is often
quite limited (Battaglia and Sands, 1998). From a
management perspective the most adequate model can
be defined as the simplest one among those that meet
the users needs both in terms of resolution and
precision (Battaglia and Sands, 1998; Botkin, 2001;
Landsberg, 2003). Based on this idea, in this study, we
have developed a relatively simple model that can be
easily parameterized with field data and that allows us
to quantify and compare the sustainability of different
thinning regimes and harvesting methods for Pinus
sylvestris L. stands of contrasting site quality. The
model has been developed in response to current forest
management needs in Navarre (Spain), and to our
knowledge is the first biologically informed model
developed in Spain resulting from the cooperation
between the university system, the public adminis-
tration and a forestry enterprise. Data and model
validation were performed on two contrasting experi-
mental forests located in the western Pyrenees which
represent the two extremes of a site quality gradient.
Aspurz is a highly productive Mediterranean forest
with relatively fast decomposition rates. Garde in turn
exhibits a more continental climate and has a lower
production and slower decomposition rates (Blanco
et al., 2003a,b). P. sylvestris L. forests have been
extensively studied in northern Europe (e.g. Berg and
Lousier, 2000; Agren and Knecht, 2001, among
others). Results from these studies, however, may not
be directly applicable to the Iberian P. sylvestris
forests (the southern and western distribution limits
for this species) where ecological factors and
processes can be qualitatively different from those
operating in northern forests. For example, thinning
has been shown to reduce decomposition rates in the
western Pyrenees forests (Blanco et al., 2003b), while
the opposite has been found at higher latitudes
(Edmonds, 1990). This, among other observations,
points out the need to develop simple biologically
based models of nutrient cycling specifically suited for

J.A. Blanco et al. / Forest Ecology and Management 213 (2005) 209–228 211
Mediterranean forests that can assist us in the
evaluation of sustainability of current forest manage-
ment practices (e.g. Harmon, 2001; Verbug and
Johnson, 2001). Our modelling approach is based
on the simplification strategy proposed by Tiktak and
Van Grinsven (1995). These authors propose to
minimize the dynamic feedback between geochemical
processes and stand growth using independent
submodels, to omit or aggregate short time scale
processes (daily and seasonal) and to pool compart-
ments, simplifying and aggregating process descrip-
tions. The main objectives of our work are: (1) to
assess whether site quality influences sustainability of
thinning practices in western Pyrenees forests, (2) to
forecast long-term changes of nutrient pools in two
contrasting site-quality stands as a function of
harvesting method (whole-tree versus log removal),
thinning intensity and rotation length (3) and to
evaluate how predicted nutrient losses for different
management scenarios, including those currently
recommended in P. sylvestris forests in Spain,
influence stand nutrient balance and therefore, long-
term sustainability of thinning practices.
2. Materials and methods
2.1. Study sites
The model was tailored to describe nutrient cycling
of P. sylvestris stands in the western Pyrenees (Spain).
The model was parameterized with data from two
contrasting experimental sites, representing the two
extremes of a site quality gradient throughout this
region. The lower elevation site (Aspurz, 4284203100N,
18804000W) is one of the most productive P. sylvestris
forests in Spain. The stand has developed on a Dystric
Cambisol, with mean A horizon organic C of 7.0%.
Site mean altitude is 642 m asl with mean annual
precipitation and mean annual temperature
912 mm year�1 and 12 8C, respectively. The site is
an even-aged P. sylvestris stand resulting from strip-
like clear-cutting carried out in the mid-1960s. Mean
stand age is 37 years and stand density is
3555 trees ha�1, with a dominant height of 14 m
and a mean dbh of 24.9 cm. The higher elevation site
(Garde, 4284805000N, 085203000W) is an example of a
low-production P. sylvestris forest in Spain. The stand
is located on a Haplic Alisol, with mean A horizon
organic C of 6.3% at a mean altitude of 1335 m asl.
Mean annual precipitation is 1268 mm year�1, and
mean annual temperature is 8.2 8C. Stand structure is
even-aged resulting from clear-cutting during the
early sixties. Mean stand age is 32 years, with a
density of 3500 trees ha�1, a dominant height of
15.2 m and a mean dbh of 25.0 cm. Fagus sylvatica L.
saplings are relatively important on a percentage
cover basis in Aspurz but not in Garde. Bedrock for
both sites consists of flysch of sandstone and
limestones.
2.2. Experimental design
Data were gathered across nine rectangular
(30 m � 40 m) plots per location. Silvicultural treat-
ments were implemented by the ‘Departamento del
Medio Ambiente, Gobierno de Navarra’ according to
the guidelines of the International Union of Forestry
Research Organizations (IUFRO). The experimental
design consisted of three treatments with three
replicates per location: treatment 1 (P0) control with
no thinning; treatment 2 (P20) moderate low-thinning
(20% of basal area removed according to future tree
selection method; felled trees were mainly canopy
suppressed but included dominant or codominant trees
with malformed stems); treatment 3 (P30) heavy low-
thinning (30% of basal area removed using the future
tree selection method as in P20). To avoid edge effects,
the silvicultural treatments were applied within a 5–
10 m strip adjacent to each plot.
2.3. Model structure, parameterization and data
gathering
Our main objective was to estimate changes in N, P,
K, Ca and Mg contents in the major nutrient pools. The
model was designed to reach a satisfactory compro-
mise between mathematical complexity and biologi-
cal realism (e.g. Landsberg, 2003) and the number of
parameters were kept as low as possible. Fig. 1 shows
the main fluxes and pools considered in the model and
Fig. 2 shows model inputs and outputs. Tree to soil
feedbacks are integrated into the empirical growth
function (Tiktak and Van Grinsven, 1995; Agren and
Knecht, 2001). Summer drought in these two locations
is only moderate and hydrological processes were not

J.A. Blanco et al. / Forest Ecology and Management 213 (2005) 209–228212
Fig. 1. Model fluxes and nutrient pools. Nd: needle demand; Bd: branch demand; Sd: stem demand; Rd: root demand; Ab: root uptake; Re:
retranslocation; Wl: branch litterfall; Nl: needle litterfall; Wm: branch mineralization; Nm: needle mineralization; Rm: root mineralization.
explicitly simulated. Thus, model results are restricted
to non-water limited forests (Verbug and Johnson,
2001). All combined processes were simulated with 1-
year time-steps with program language STELLA
Fig. 2. Information fluxes followed to evaluate sustainability of thinning
model outputs in bold letters.
Research 5.1.1 (High Performance Systems Inc.,
1997), which is particularly suited for modelling
ecosystem level processes (Costanza and Gottlieb,
1998).
practices with our model. Required inputs are shown in italics and
J.A. Blanco et al. / Forest Ecology and Management 213 (2005) 209–228 213
Stand growth functions were simulated with
SILVES (Del Rıo and Montero, 2001) which simulates
diameter distributions and thinning of P. sylvestris
stands in Spain and calculates stand growth as a
function of site index, stand basal area and tree
density. Original parameter values were modified
based on growth and yield tables developed for this
species in Navarre (Puertas, 2003) (data provided by
‘‘Departamento de Medio Ambiente, Gobierno de
Navarra’’). Equations describing stem growth were:
Mass (Mg ha�1) = 495.348 ln (age, years) �1473.729 (R2 = 0.99, P < 0.001) for Aspurz, and mass
(Mg ha�1) = 308.595 ln (age, years) � 902.013 (R2 =
0.99, P < 0.001) for Garde. Stem, needle and branch
mass were predicted from stem mass through the
following allometric equations determined from field
data: needles (kg) = 0.0258 � stem (kg) + 0.9428
(R2 = 0.66, P < 0.001); branches (kg) = 0.0992 � stem
stem (kg) + 1.2482 (R2 = 0.74, P < 0.001). To esti-
mate needle, branch and stem biomass before thinning,
trees were classified into five dbh classes. Then, the
modal tree per dbh class was felled for each plot, for a
total of five trees per plot. After determining the
component biomass for felled trees, total stand above-
ground biomass was calculated by multiplying the
biomass of each dbh class by the number of trees in that
class. To determine nutrient amounts in needles,
branches and stems, we multiplied tissue concentra-
tions by the appropriate component. Root biomass was
not estimated in the field, so we assumed that root
nutrient content represent a constant fraction of the
aboveground tree nutrients contents as did Margolis
et al. (1995), and used above/belowground ratios
(Table 1) reported by Malkonen (1974) and Litton et al.
(2003). A similar assumption has been made in more
complex forest models such as HYBRID (Friend et al.,
1993) and C_CHANGE (Beets et al., 1999).
Litterfall in litter traps was collected monthly from
April 2000 to October 2002 in both forests (9 litter traps
of 0.29 m2 per plot � 3 treatments � 3 replicates � 2
sites � 31 months = 5022 samples). Samples were
separated in the laboratory into six components
(needles, branches, fruits, bark, other pine organs and
other litter) dried at 72 8C and weighed. For comparison
with the simulation only two litterfall fractions were
used: (1) needles and (2), a combined branches, bark
and fruit (referred to below as the woody litter fraction).
Litterfall inputs from tree species other than P. sylvestris
and from understory plant species were small,
particularly in Garde, and therefore, they have not
been included in the model. Leaf litterfall and wood
biomass has been assumed to be a fraction of total
aboveground leaf and stemwood biomass, respectively
(Kimmins et al., 1999; Kirschbaum, 1999; Komarov
et al., 2003). Litterfall values for our two experimental
sites (Table 1) were similar to mean litterfall values of
pine forests reported by Agren (1983), and to those used
in models developed by Agren and Knecht (2001).
Green and senescent needles were collected bimonthly
from December 2001 until October 2002. Three
branches per plot at 5 m above forest floor were cut
every sampling date, and green needles were separated
into three cohorts. A total of 972 green samples were
collected during this study (3 branches per plot � 3
cohorts � 3 treatments � 3 replicates � 2 sites � 6
sampling dates). Mean retranslocation efficiency for
all cohorts together was calculated following Aerts et al.
(1999) as: % retranslocation = 100 � (mean concen-
tration in green needles � mean concentration in
senescent needles)/mean concentration in green nee-
dles. Change in nutrient content of the green needles
after retranslocation was calculated by multiplying
retranslocation percentage by total needle nutrient
content. We assumed that retranslocation from roots
and woody litter fractions was negligible (Verbug and
Johnson, 2001). To calculate the uptake of nutrients by
the roots we assumed that the uptake equalled nutrients
requirements by trees (Cole and Rapp, 1981; Waring
and Running, 2001), which were provided in part by
nutrient retranslocation from senescing needles. To
estimate tree nutrient requirements we added up the
amount of nutrients used for needle, branch, stem and
root growth, plus losses through litterfall of branches
and needles, plus belowground transfers of dead roots
and root exudates to the soil.
Decomposition rates for needles were obtained
from 50 litterbags (2 mm mesh size, 10 g of needles)
per plot placed in the stands in November 2000. Three
bags were collected for mass loss measurement,
monthly for the first three months and then bimonthly
(from December 2000 to October 2002). A total of 702
samples were collected in this study (3 bags per
plot � 3 treatments � 3 replicates � 2 sites � 13
sampling dates). Decomposition of needle and woody
litter were simulated assuming that both fractions
consisted of a single type of material and exhibited
J.A.
Bla
nco
eta
l./Fo
restE
colo
gy
an
dM
an
ag
emen
t2
13
(20
05
)2
09
–2
28
21
4
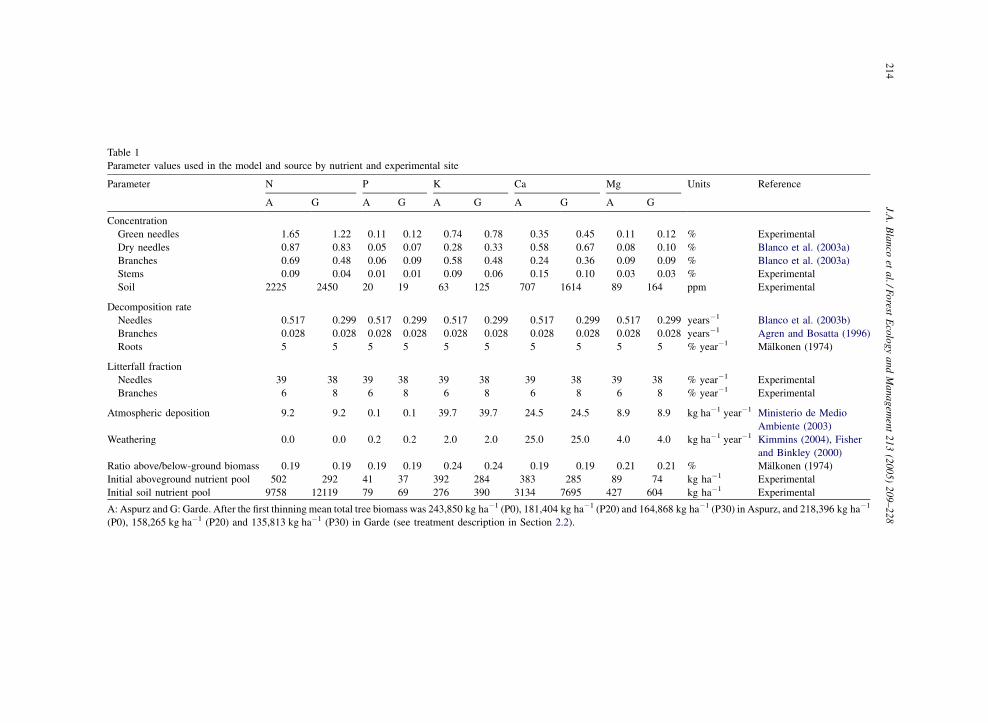
Table 1
Parameter values used in the model and source by nutrient and experimental site
Parameter N P K Ca Mg Units Reference
A G A G A G A G A G
Concentration
Green needles 1.65 1.22 0.11 0.12 0.74 0.78 0.35 0.45 0.11 0. % Experimental
Dry needles 0.87 0.83 0.05 0.07 0.28 0.33 0.58 0.67 0.08 0. % Blanco et al. (2003a)
Branches 0.69 0.48 0.06 0.09 0.58 0.48 0.24 0.36 0.09 0. % Blanco et al. (2003a)
Stems 0.09 0.04 0.01 0.01 0.09 0.06 0.15 0.10 0.03 0. % Experimental
Soil 2225 2450 20 19 63 125 707 1614 89 164 ppm Experimental
Decomposition rate
Needles 0.517 0.299 0.517 0.299 0.517 0.299 0.517 0.299 0.517 0. 9 years�1 Blanco et al. (2003b)
Branches 0.028 0.028 0.028 0.028 0.028 0.028 0.028 0.028 0.028 0. 8 years�1 Agren and Bosatta (1996)
Roots 5 5 5 5 5 5 5 5 5 5 % year�1 Malkonen (1974)
Litterfall fraction
Needles 39 38 39 38 39 38 39 38 39 38 % year�1 Experimental
Branches 6 8 6 8 6 8 6 8 6 8 % year�1 Experimental
Atmospheric deposition 9.2 9.2 0.1 0.1 39.7 39.7 24.5 24.5 8.9 8. kg ha�1 year�1 Ministerio de Medio
Ambiente (2003)
Weathering 0.0 0.0 0.2 0.2 2.0 2.0 25.0 25.0 4.0 4. kg ha�1 year�1 Kimmins (2004), Fisher
and Binkley (2000)
Ratio above/below-ground biomass 0.19 0.19 0.19 0.19 0.24 0.24 0.19 0.19 0.21 0. % Malkonen (1974)
Initial aboveground nutrient pool 502 292 41 37 392 284 383 285 89 74 kg ha�1 Experimental
Initial soil nutrient pool 9758 12119 79 69 276 390 3134 7695 427 604 kg ha�1 Experimental
A: Aspurz and G: Garde. After the first thinning mean total tree biomass was 243,850 kg ha�1 (P0), 181,404 kg ha�1 (P20) and 164,86 kg ha�1 (P30) in Aspurz, and 218,396 kg ha�1
(P0), 158,265 kg ha�1 (P20) and 135,813 kg ha�1 (P30) in Garde (see treatment description in Section 2.2).
12
10
09
03
29
02
9
0
21
8

J.A. Blanco et al. / Forest Ecology and Management 213 (2005) 209–228 215
negative exponential weight losses over time (Olson,
1963). We considered different needles cohorts, which
fell down in different years and did not change either
their chemical composition or their decomposition
rate through the decomposition process. Nutrients
released from decomposing litter were estimated as
Mt ¼ M0 e�kt
where Mt is mass remnant at time t, M0 the initial mass
and k is the decomposition rate (Olson, 1963). To
estimate the amount of organic matter decomposition
at a given time t (OMDt), we estimated variation in
soil organic matter as the balance between inputs
from litterfall and losses from decomposition accor-
ding to:
OMDt ¼ OMlitterfallt � OMdecompositiont
This is
OMdecomposedt ¼ OMlitterfallt � OMDt
¼ OMlitterfallt � ðOMt � OMt�1Þ
where OMt is the organic matter content in decom-
posing litter. Litter is composed of a number of
cohorts generated at different times. At a given time
organic matter is the sum of the remnant fraction in
each of these cohorts, which can be estimated as a
sum of negative exponential curves (see a CEN-
TURY-based simplification by Bolker et al., 1998).
Thus, the amount of organic matter that is lost at
any given time from decomposing litter was esti-
mated as
OMdecomposedt ¼OMlitterfallt
��Xx¼t
x¼0
ðOMlitterfallx�e�kxÞ
�Xx¼t
x¼0
ðOMlitterfallx�1�e�kðx�1ÞÞ�
To calculate the decomposition of woody materials
we used the rates reported by Agren and Bosatta
(1996) (Table 1), following the same procedure as for
needles. To simplify the model we assumed that
nutrients and organic matter were lost at the same rate
over the decomposition process (Andersson et al.,
2000; Chertov et al., 2001; Potter et al., 2001). By
expressing organic matter changes through time as a
sum of first order exponential curves, we can quantify
the sensitivity of the model to organic matter changes
and make a better use of the data available (Bolker
et al., 1998). As for roots, and given that they were not
directly studied, we kept the decomposition process as
simple as possible. Therefore, dead roots and roots
exudates were pooled together and decomposition rate
was estimated as a fixed percentage of total root
biomass for all the soil profile following Malkonen
(1974) (Table 1)
Soil B horizon samples were collected once in
November 1999. To better characterize the upper A
horizon we collected soil samples 5 cm deep
bimonthly in all plots from April 2001 to April
2003. Soil and leaves (green and senescent) samples
were ground with an electric mill. N (soil and leaves)
was analyzed using the Kjeldhal method (Harwitte,
1980). Soil and foliar P were analyzed following Bray
and Kurtz (1945) and the phosphomolibdo-vanadate
method (MAFF, 1986), respectively. For both soil and
leaves samples, Ca and Mg were analyzed by atomic
absorption spectrophotometry and K by flame photo-
metry. In the model, all soil horizons were pooled
together excluding branches and needles in the forests
floor. To calculate initial forest floor total nutrient
content from which to initiate all simulations, we ran
the model for 30 years starting from a soil with no
organic layer. Values for different litter fractions at the
end of the simulation were used as the initial values on
posterior runs of the model (Makipaa et al., 1998;
Kimmins et al., 1999).
Simulation of leaching losses of N, Ca and Mg was
based on simulated available quantity of these
nutrients less the amounts taken up by the trees. This
approach is also used in BIOME-BGC (Hunt and
Running, 1992), Q (Rolff and Agren, 1999), CenW
(Kirschbaum, 1999), FORECAST (Kimmins et al.,
1999) and NuCSS (Verbug and Johnson, 2001). In the
case of P and K, it was assumed that nutrients not used
by trees were inmobilized in the soil (Cooke, 1981).
Atmospheric inputs data (wet and dry deposition) used
in the model were taken from a nearby site (<40 km
distant) by the Spanish Forest Protection Service
(Ministerio de Medio Ambiente, Madrid, 2003); the
values were similar to mean deposition rates in non-
polluted areas in Europe. Given that both experimental
sites have similar parent material and that distance
between them is less than 40 km, we assumed similar

J.A. Blanco et al. / Forest Ecology and Management 213 (2005) 209–228216
atmospheric inputs and geological weathering for both
locations. Forest soil weathering rates for this type of
bedrock have been reported in Global data base sets
elaborated by Kimmins (2004) and Fisher and Binkley
(2000).
2.4. Model analysis: verification and sensitivity
analysis
We verified our model in several ways. Predicted
versus observed values for short-term responses to
thinning were evaluated for the 3 years following
thinning. We simulated changes in nutrient contents in
the control plots after thinning, and then compared
model estimates with data from the thinned plots at
both locations. A more detailed deviation analysis
between observed and simulated data was carried out
for N as this nutrient is the most commonly limiting
nutrient in forests (e.g. Parton et al., 1996; Gilmanov
et al., 1997). The mean absolute deviation (Dabs) was
calculated as:
Dabs ¼1
n�Xn
i¼1
jXestðtiÞ � XobsðtiÞj
where Xest and Xobs are estimated and observed values
for a given variable, and ti (i = 1, . . ., n) represents time
in years. Maximum N was defined as the maximun
observed value of a particular flux or pool of N in the
experimental plots. We compared for each type of N
flux or pool the percentage of the maximum N value
accounted by the Dabs with the percentage of the
maximum N value accounted by the standard error
of the observed data.
To determine the sensitivity of the output variables to
variation in input parameter values, we varied each
parameter input 10% when the trees reached 100
years, and then assessed the changes shown by
aboveground nutrient content of tree biomass (stems + -
branches + needles), decomposing plant debris (woody
litter + needles) and the totals for all soil horizons
(soil + woody litter + needles). The percentage change
in the output variables was partitioned into percentage
variation due to each parameter, obtaining a sensitivity
percentage. Thus, a sensitivity value higher than 100%
indicates that the model amplifies parameter changes
while a value lower than 100% indicates that model
internal dynamics reduce them (Kirschbaum, 1999).
2.5. Management scenarios
To simulate different thinning treatments we
imposed different combinations of thinning intensity
(percentage removal of basal area), thinning frequency
(number of years between two successive thinnings)
and removal types (stems or whole-trees). In addition,
we have analyzed current management prescriptions
for these forests in Spain (Dıez and Fernandez-Golfın,
1997; Del Rıo and Montero, 2001) and specifically
those adapted to Navarre (Puertas, 2003). According
to these prescriptions the exploitation cycle may be
reduced to 80 years in high quality stands. Thinning
initiates when stands are 20 or 25 years old, and
continues every 10 years removing 30% of the total
basal area when timber extracted exceeds 50 m3 ha�1
(economic criteria). This prescription was simulated
for Aspurz. A low intensity thinning in low quality
stands, however, is not profitable and production
cycles can be as long as 120 years, with a thinning
program that removes 20% of the total basal area every
15 years. This was the thinning program simulated for
Garde. We established a 100-year production cycle for
both localities.
3. Results
3.1. Model analysis: verification and sensitivity
analysis
There was a strong correlation between predicted
and observed values for all nutrients inspected
(Table 2). Dabs of N removed within the stems was
3.9 kg N ha�1, representing 5% of the maximum
observed value in this pool (89.1 kg N ha�1). This
percentage was similar to the result of the maximum
observed N pool accounted for by the standard error of
the observed values (6%). For N in branches, the Dabs
percentage (6%) was slightly lower than the percentage
for the observations error (7%). For N in needles, the
Dabs percentage (12%) was similar to the observational
error percentage (9%). Dabs for N in needle litterfall
(1.3 kg N ha�1) was within the precision range of the
measurements and its percentage (5%) was almost
equal to the observational error percentage (4%).
Finally, for woody litterfall (10.1 kg N ha�1), the Dabs
percentage (11%) was bigger than the observational

J.A. Blanco et al. / Forest Ecology and Management 213 (2005) 209–228 217
Table 2
Results of verification regressions (R2) of observed data vs. simulated data for nutrient amount (kg ha�1) in five different fluxes
Nutrient Extracted stems Extracted branches Extracted needles Leaf litterfall Woody litterfall
N 0.832** 0.866** 0.898** 0.725* 0.760**
P 0.821** 0.836** 0.900** 0.715* 0.761**
K 0.840** 0.862** 0.888** 0.720* 0.755**
Ca 0.831** 0.871** 0.891** 0.716* 0.761**
Mg 0.812** 0.860** 0.890** 0.723* 0.765**
* P < 0.01.** P < 0.001.
error percentage (6%). Sensitivity analysis showed that
the model behaved similarly in both localities,
diminishing the changes for all the parameters (less
than 100% of variation for all variables, see Section 2).
The most sensitive variable was N content in decom-
posing leaf litter (needles + woody litter), as it varied
55%inAspurzwhen the litterfall fractionparameterwas
changed. For other parameters sensitivity values were
lower than those for the N content in decomposing litter.
3.2. Changes in nutrient pools over time
Woody litter was the main pool for N in the control
stands as its low decomposition rates favoured
accumulation, particularly in Garde (Olson’s k was
42% lower than in Aspurz; Blanco et al., 2003b) (Figs. 3
and 4). On the contrary, stems were the pool with the
lowest N contents in the control stands. A total of
1819 kg N ha�1 had accumulated in Aspurz at the end
of the simulation, which represented 55% more than
that accumulated in Garde (1177 kg N ha�1). The
simulated thinning cycle caused a 60 and a 27% total N
reduction in Aspurz and Garde, respectively (Figs. 3
and 4). The most and the least sensitive pools were
needles and woody litter, respectively. These differ-
ences caused changes in the relative importance of each
pool, particularly for needles, which ranked first before
thinning, and second after thinning in both sites. For P,
the branches were the most important pool in the control
stands with 39 kg P ha�1 in Aspurz and 44 kg P ha�1 in
Garde at the end of the simulation. The relative
importance of woody litter increased over time, and
became the second most important pool in both sites at
the end of the simulation. Total aboveground content of
P was 145 and 131 kg ha�1 in Aspurz and Garde,
respectively. The distribution of P among pools
changed dramatically after applying the recommended
management practices (Figs. 3 and 4). Thus, total P
content in leaf litter increased 69% and 37% in Aspurz
and Garde, respectively, while total aboveground
content of P decreased 19% and 21% in Aspurz and
Garde, respectively.
Unlike P and N, K content in the thinning plots was
smallest in the decomposing pools (leaf litter and
woody litter), while in the control plots the pools with
the highest K content were stems and branches. At the
end of the simulation, the stems had 322 kg K ha�1 in
Aspurz and 296 kg K ha�1 in Garde. Total K content
was similar in both forests (913 kg kg K ha�1 in Aspurz
and 834 kg K ha�1 in Garde; Figs. 3 and 4). The
decomposing woody litter was the most important pool
for K in Aspurz after thinning, but in Garde the stems
and the branches were the most important pool before
and after thinning (Figs. 3 and 4). In addition, only 39
and 73% of K remained in Aspurz and in Garde,
respectively, at the end of the simulation. The response
of Ca reflected its structural role in stems, being the pool
with the highest contents. In the reference plots, Ca
accumulation in the stems was 780 kg ha�1 in Aspurz
and 468 kg ha�1 in Garde. After thinning, total Ca
showed a 52% reduction, but in Garde it only
diminished 2%. Finally, differences between sites were
higher for Mg than for Ca (Figs. 3 and 4). Decomposing
leaf litter was the most important pool (170 kg Mg ha�1
at the end of the simulation) in Aspurz baseline plots. In
Garde, however, stems were the most important pool
with 124 kg Mg ha�1. Thinning caused little changes in
the relative importance of Mg among pools in both sites,
although the total content of Mg decreased 68% in
Aspurz and 27% in Garde.
3.3. Potential nutrient losses due to the thinning
and tree removal method
Potential nutrient losses are defined as the sum of
nutrients extracted due to tree removal and nutrients

J.A. Blanco et al. / Forest Ecology and Management 213 (2005) 209–228218
Fig. 3. Mass evolution of N, P, K, Ca and Mg in every pool along stand life in Aspurz. Left column is a non-managed forest and right column is a
simulation under recommended thinning prescription (thinning of 30% basal area every 10 years, stem removal).
lixiviation when mineralization rates exceed root
absorption. Accumulated potential losses resulting
from simulations in Aspurz averaged 345 kg N ha�1
when only tree stems were removed, and 635 kg N ha�1
for whole-tree removal. These values were lower in
Garde: 269 and 523 kg N ha�1, respectively. An
increase in thinning intensity up to 20% resulted in
higher potential losses particularly for whole-tree

J.A. Blanco et al. / Forest Ecology and Management 213 (2005) 209–228 219
Fig. 4. Mass evolution of N, P, K, Ca and Mg in every pool along stand life in Garde. Left column is a non-managed forest and right column is a
simulation under recommended thinning prescriptions (thinning of 20% basal area every 15 years, stem removal).
removal (Fig. 5). The rate of increase diminished after a
thinning intensity of approximately 20%. Phosphorus
mean potential losses for stem removal equalled
18 kg P ha�1 in Aspurz and 10 kg P ha�1 in Garde,
and considerably increased if the whole tree was
removed (41 kg P ha�1 in Aspurz and 42 kg P ha�1 in
Garde). Maximum losses in Garde occurred for a range
of thinning intensities between 20 and 30%, while in
Aspurz, nutrient losses increased and reached a plateau
after 10% of the basal area was removed (Fig. 6). Mean
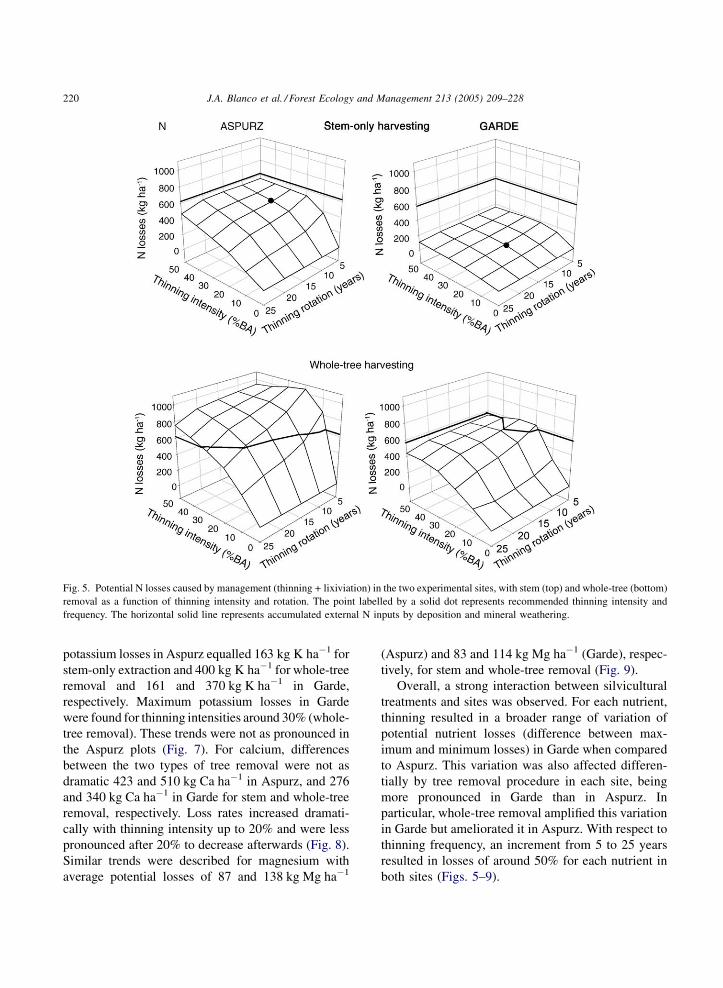
J.A. Blanco et al. / Forest Ecology and Management 213 (2005) 209–228220
Fig. 5. Potential N losses caused by management (thinning + lixiviation) in the two experimental sites, with stem (top) and whole-tree (bottom)
removal as a function of thinning intensity and rotation. The point labelled by a solid dot represents recommended thinning intensity and
frequency. The horizontal solid line represents accumulated external N inputs by deposition and mineral weathering.
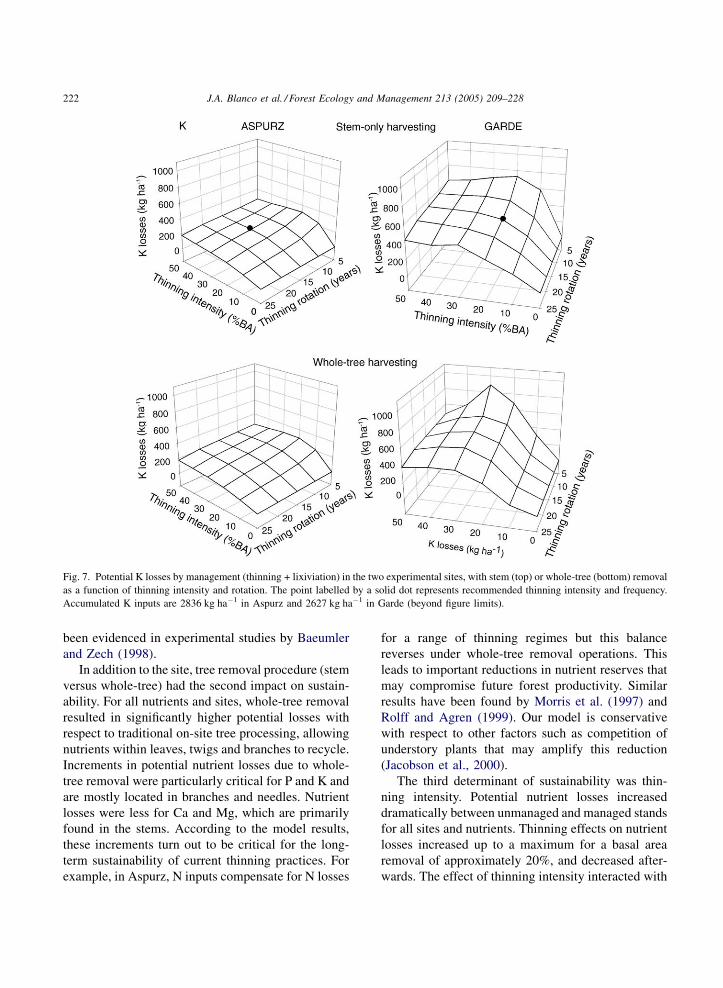
potassium losses in Aspurz equalled 163 kg K ha�1 for
stem-only extraction and 400 kg K ha�1 for whole-tree
removal and 161 and 370 kg K ha�1 in Garde,
respectively. Maximum potassium losses in Garde
were found for thinning intensities around 30% (whole-
tree removal). These trends were not as pronounced in
the Aspurz plots (Fig. 7). For calcium, differences
between the two types of tree removal were not as
dramatic 423 and 510 kg Ca ha�1 in Aspurz, and 276
and 340 kg Ca ha�1 in Garde for stem and whole-tree
removal, respectively. Loss rates increased dramati-
cally with thinning intensity up to 20% and were less
pronounced after 20% to decrease afterwards (Fig. 8).
Similar trends were described for magnesium with
average potential losses of 87 and 138 kg Mg ha�1
(Aspurz) and 83 and 114 kg Mg ha�1 (Garde), respec-
tively, for stem and whole-tree removal (Fig. 9).
Overall, a strong interaction between silvicultural
treatments and sites was observed. For each nutrient,
thinning resulted in a broader range of variation of
potential nutrient losses (difference between max-
imum and minimum losses) in Garde when compared
to Aspurz. This variation was also affected differen-
tially by tree removal procedure in each site, being
more pronounced in Garde than in Aspurz. In
particular, whole-tree removal amplified this variation
in Garde but ameliorated it in Aspurz. With respect to
thinning frequency, an increment from 5 to 25 years
resulted in losses of around 50% for each nutrient in
both sites (Figs. 5–9).

J.A. Blanco et al. / Forest Ecology and Management 213 (2005) 209–228 221
Fig. 6. Potential P losses caused by management (thinning) in the two experimental sites, with stem (top) and whole-tree (bottom) removal as a
function of thinning intensity and rotation. The point labelled by a solid dot represents recommended thinning intensity and frequency. The
horizontal solid line represents accumulated external P inputs by deposition and mineral weathering.
4. Discussion
Despite its simplicity, our model was in a good
agreement with the observations over a short-time
frame (Table 2). Also, low model sensitivity suggests
that model structure is robust with respect to error
propagation of initial estimates (Chertov et al., 2001).
4.1. Factors influencing sustainability of forestry
practices
Site quality at each location was the most important
factor influencing sustainability of forest manage-
ment. Potential N losses in Garde, a site with poorer
site productivity and N stem content, were signifi-
cantly lower than those found in Aspurz (Fig. 5).
Similar patterns were observed for Ca and Mg. For P
and K, however, lower outputs were compensated by
larger nutrient concentrations found in Garde trees.
Thus, potential nutrient P and K losses were similar in
both sites. Comparable results have been found by
Morris et al. (1997) who pointed out that sustainability
of forestry practices may critically depend on site
ecological features such as decomposition rate (in our
study higher in Aspurz than in Garde, see Blanco et al.,
2003b). Potential lixiviation rates for N, Ca and Mg
were estimated as the difference between mineraliza-
tion release and root uptake. Thus, higher mineraliza-
tion rates may result in higher potential losses. Also,
an increment in lixiviated nutrients after thinning has
J.A. Blanco et al. / Forest Ecology and Management 213 (2005) 209–228222
Fig. 7. Potential K losses by management (thinning + lixiviation) in the two experimental sites, with stem (top) or whole-tree (bottom) removal
as a function of thinning intensity and rotation. The point labelled by a solid dot represents recommended thinning intensity and frequency.
Accumulated K inputs are 2836 kg ha�1 in Aspurz and 2627 kg ha�1 in Garde (beyond figure limits).
been evidenced in experimental studies by Baeumler
and Zech (1998).
In addition to the site, tree removal procedure (stem
versus whole-tree) had the second impact on sustain-
ability. For all nutrients and sites, whole-tree removal
resulted in significantly higher potential losses with
respect to traditional on-site tree processing, allowing
nutrients within leaves, twigs and branches to recycle.
Increments in potential nutrient losses due to whole-
tree removal were particularly critical for P and K and
are mostly located in branches and needles. Nutrient
losses were less for Ca and Mg, which are primarily
found in the stems. According to the model results,
these increments turn out to be critical for the long-
term sustainability of current thinning practices. For
example, in Aspurz, N inputs compensate for N losses
for a range of thinning regimes but this balance
reverses under whole-tree removal operations. This
leads to important reductions in nutrient reserves that
may compromise future forest productivity. Similar
results have been found by Morris et al. (1997) and
Rolff and Agren (1999). Our model is conservative
with respect to other factors such as competition of
understory plants that may amplify this reduction
(Jacobson et al., 2000).
The third determinant of sustainability was thin-
ning intensity. Potential nutrient losses increased
dramatically between unmanaged and managed stands
for all sites and nutrients. Thinning effects on nutrient
losses increased up to a maximum for a basal area
removal of approximately 20%, and decreased after-
wards. The effect of thinning intensity interacted with

J.A. Blanco et al. / Forest Ecology and Management 213 (2005) 209–228 223
Fig. 8. Potential Ca losses by management (thinning + lixiviation) in the two experimental sites, with stem (top) or whole-tree (bottom)
extraction as a function of thinning intensity and rotation. The point labelled by a solid dot represents recommended thinning intensity and
frequency. Accumulated Ca inputs are 3366 kg ha�1 in Aspurz and 3069 kg ha�1 in Garde (beyond figure limits).
site. In Garde, maximum P and K losses were found
under thinning intensities around 30% and tended to
decrease at higher intensities. These variations,
however, were significantly smoother in Aspurz
(Figs. 6 and 7). At intermediate thinning intensities,
the increment in standing crop due to increased growth
of released trees, compensates for the decrease in
production derived from lower tree density. Hence, it
may be possible to maintain or even to increase wood
extraction relative to that of lower intensity thinning
regimes. At higher thinning intensities, however, a
point is reached in which reduction in tree density is so
severe than growth increments of remnant trees do not
compensate for the density reduction and, thus wood
extracted in each cycle tends to decrease. On the other
hand, decrease in decomposition rates in response to
thinning in Aspurz (Blanco et al., 2003b) results in a
decrease in mineralization rates and likely a reduction
in lixiviation. Nutrient losses due to extraction were
relatively higher than those caused by an increase in
lixiviation and were therefore in agreement with
previous studies (Grigal, 2000; Zhu et al., 2003;
Kimmins, 2004). Johnson and Todd (1987) also
showed that this difference had significant effects for
N and P concentrations in forests in Tennessee (USA).
As these authors suggest it is unlikely that lixiviation
alone results in a decrease in productivity, even
during late successional stages when losses due to
lixiviation equal ecosystem inputs (Vitousek and
Reiners, 1975).
Finally, according to model results, sustainability
of the thinning regime is influenced by its frequency or

J.A. Blanco et al. / Forest Ecology and Management 213 (2005) 209–228224
Fig. 9. Potential Mg losses by management (thinning + lixiviation) in the two experimental sites, with stem (top) or whole-tree (bottom)
extraction, depending on thinning intensity and frequency. The point labelled by a solid dot represents recommended thinning intensity and
frequency. Accumulated Mg inputs are 877 kg ha�1 in Aspurz and 813 kg ha�1 in Garde (beyond figure limits).
rotation cycle, which determines the average number
of years between two consecutive forest operations.
The shorter the cycle, the larger the number of
interventions and thus, the larger potential losses of
nutrients. This trend can be observed for all the
nutrients considered (Figs. 5–9), and interacts with
thinning intensity, so its effect is relatively larger for
low-thinning intensities. This reflects forest capability
to recover initial biomass after moderate interven-
tions. The remnant trees can restore or even surpass
the previous standing crop density, providing that
operational lag is long enough (Thornley and Cannell,
2000). However, if thinning intensity is greater than
30% stand ability to restore its initial biomass
decreases (Montero et al., 1999). In this case, a
longer interval between interventions does not allow
for stand recovery and the relative impact of thinning
frequency decreases. Short rotations also may increase
the time of soil exposure and low forest cover
(increasing the period over which mineralization rates
are greater than tree demand) therefore, increasing
lixiviation. Rolff and Agren (1999) predicted a
decrease in productivity for shorter time intervals
between interventions, while Seely et al. (2002)
observed that shorter rotations can result in a
substantial decrease in forest nutrient reserves in the
long-term. Our modelling results suggest that thinning
frequency effects on nutrient reserves are not as
critical as those of the tree removal procedure and
thinning intensity. This does not imply, however, that

J.A. Blanco et al. / Forest Ecology and Management 213 (2005) 209–228 225
this aspect of forest management is not critical for
other components of sustainability.
4.2. Silvicultural implications
All situations that compromise ecosystem nutrient
recharge capability should be avoided as they will
result in a gradual decrease of nutrient reserves and
productivity (Kimmins, 2004). Nevertheless, it is
possible, to attain a level of exploitation that allows to
sustain long-term forest productivity or even to induce
a recovery of nutrient reserves (Morris et al., 1997).
Our modelling study suggests that P reserves can be
particularly sensitive to overexploitation (Fig. 6). This
is in agreement with previous experimental studies
conducted at our site, which suggest P limitations
(Blanco et al., unpublished data) and indicate the need
to pay more attention to phosphorus cycling under
different site and thinning regimes, as well as its
effects on site productivity and community composi-
tion. The strong variability across sites regarding their
response to thinning suggests that results should not be
extrapolated from one site to another. Chiefly, site
dependency of tree growth rates result in quantitative
and qualitative differential responses in nutrient
dynamics (Figs. 3 and 4). Thus, forestry prescriptions
for P. sylvestris in the Central and Iberian ranges in
Spain (Del Rıo and Montero, 2001) may result in
nutrient reserve dynamics close to recharge capability.
In particular, for P reserves application of these
prescriptions may result in values above the sustain-
ability threshold in the most productive site, and on the
verge of this threshold in the least productive site. On
the high quality site these practices may result in N
losses below inputs, but for P reserves the balance
results in significant net losses suggesting the need to
reduce thinning intensity or rotation cycles. Whole-
tree extraction is not advised in any of our sites as it
resulted into unsustainable P losses for all thinning
regimes considered. This practice would only be
justified if applied along with N–P fertilization as
proposed by Rolff and Agren (1999), although its costs
are likely not viable in this region.
Finally, other forest interventions such as fine wood
extraction to decrease fire risk, slash crushing to
accelerate decomposition or the use of litter for
gathering game or domestic range could have very
different impact on natural versus managed forests.
This may be especially true when decomposing
material is the most important forest nutrient reserve,
which among other factors, depends on the nutrient
considered, locality and management practice. In this
context, in order to ameliorate CO2 emissions, using
biomass such as leaves and branches as a substitute for
fossil fuels has been claimed to be more beneficial
from social and economic perspectives than seques-
tering the carbon in forests (Hall, 1997). However, the
results from this study suggest caution to favour this
practice without proper evaluation as forest sustain-
ability may be negatively affected by removing the
whole tree from the forest.
4.3. Model limitations and further work
Firstly, we have only considered nutrient cycling
associated with P. sylvestris while understory effects
that can have an influence on nutrient retention and
reduce lixiviation have been ignored. Secondly, we
have oversimplified root description and despite low
model sensitivity, the decomposition of dead roots and
exudates should be adequately described as they can
constitute an important soil biomass input (Beets et al.,
1999). Thirdly, our experimental data do not indicate
effects of thinning on decomposition rates at Garde
after 2 years of study but show a lowering effect at
Aspurz, possibly due to alterations of the decomposer
community (Blanco et al., 2003b). We have tentatively
explored how these latter results may affect nutrient
losses but we need further empirical studies to
understand in which direction these changes will take
place. For example, increments in incident radiation
and temperature, due to a reduction in tree density,
may stimulate mineralization and result in losses from
lixiviation higher than the ones described in our
model. Fourthly, if nutrient concentration in trees
declines with age (Kimmins, 2004), losses from wood
removal would be lower than those simulated. Fifth,
the external components of the nutrient cycle (runoff,
erosion, etc.) should be adequately described to assess
its relative contribution to other fluxes in our model.
Finally, simulated estimates of nutrient losses can be
misleading. For example, in unmanaged forests
nutrient outputs can be naturally high (e.g. Ca
in calcareous locations), or there may be managed
forests in which high-nutrient reserves allow for
more intense exploitation. Thus, it may be more

J.A. Blanco et al. / Forest Ecology and Management 213 (2005) 209–228226
suitable to establish relative comparisons among
alternate thinning regimes to rank them in terms of
potential risk. All these limiting factors caution
against our quantitative predictions. Despite these
limitations, our work shows how simple simulation
models, based on parameters which can be easily
obtained from standard forest ecosystem studies (litter
traps and decomposition bags, chemical analyses of
soil, needles, branches, wood) can be used as
diagnosis tools to compare the potential impact of
alternate interventions on long-term sustainability and
suggest critical processes that may not be intuitively
obvious. The main challenge to developing explana-
tory and yet useful models of ecosystem function from
a management point of view is to achieve a reasonable
balance between model complexity, parameter obser-
vability and biological realism. We feel that an
iterative approximation of experimental studies and
modelling within an adaptive management context is
the most promising direction.
5. Conclusions
It has been shown that suitability of recommended
forestry practices in such a heterogeneous region is
very site dependent. Firstly, we caution against
extrapolation from one site to another without a
specific impact evaluation. It is possible that many
studies from temperate P. sylvestris regions must be
interpreted with caution. Secondly, differences in
ecosystem function in nutrient cycling between a
Mediterranean climate (Aspurz) and a more con-
tinental climate (Garde), are in part overridden by
the impact of biomass extraction. However, faster
decomposition rates under Mediterranean conditions
can make these forests more sensitive to human
intervention. Thirdly, current recommendations
seem adequate for N, K, Ca and Mg but their
consequences on P reserves should be investigated in
more detail. Finally, the single most important
silvicultural factor in a thinning operation is the tree
harvesting method. For all the cases analyzed in this
study whole-tree removal should not be used as it
may compromise long-term sustainability. Results
from simple models of this sort for evaluation of
long-term effects on current silvicultural practices
must be evaluated for management effects on
regeneration, harvesting age or size as well as forest
operation costs to compile with current economic
demands and ecological sustainability of forest
resource management.
Acknowledgements
Juan A. Blanco was supported by a research grant
from CICYT (‘Ministerio de Ciencia y Tecnologıa’)
during his stay at the University of Alcala. We thank
‘‘Gobierno de Navarra, Departamento de Educacion y
Cultura’’ for financial support and ‘Departamento del
Medio Ambiente’ for experimental setting of silvi-
cultural treatments and financial support. In particular,
we acknowledge Fernando Puertas, Carmen Traver
and Ana Iriarte for assistance at several stages of this
work. We are grateful to the scientific forest network
GLOBIMED (http://www.globimed.net) for hosting
meetings where the cooperation between our uni-
versities was initiated. We are also grateful to Dr. J.P.
Kimmins, Tanya Seebacher and two anonymous
reviewers for their useful suggestions and comments
on the manuscript.
References
Aerts, R., Verhoeven, J.T.A., Whigham, D.F., 1999. Plant-mediated
controls on nutrient cycling in temperate fens and bogs. Ecology
80, 2170–2181.
Agren, G.I., 1983. Nitrogen productivity of some conifers. Can. J.
For. Res. 13, 494–500.
Agren, G.I., Bosatta, E., 1996. Theoretical Ecosystem Ecology.
Understanding Element Cycles. Cambridge University Press,
Cambridge.
Agren, G.I., Knecht, M., 2001. Simulation of soil carbon and
nutrient development under Pinus sylvestris and Pinus contorta.
For. Ecol. Manage. 141, 117–129.
Andersson, F.O., Agren, G.I., Fuhrer, E., 2000. Sustainable tree
biomass production. For. Ecol. Manage. 132, 51–62.
Baeumler, R., Zech, W., 1998. Soil solution chemistry and impact of
forest thinning in mountain forests in the Bavarian Alps. For.
Ecol. Manage. 108, 231–238.
Battaglia, M., Sands, P.J., 1998. Process-based forest productivity
models and their application in forest management. For. Ecol.
Manage. 102, 13–32.
Beets, P.N., Robertson, K.A., Ford-Robertson, J.B., Gordon, J.,
Maclaren, J.P., 1999. Description and validation of C_Change:
a model for simulating carbon content in managed Pinus radiata
stands. N. Z. J. For. Sci. 29, 409–427.

J.A. Blanco et al. / Forest Ecology and Management 213 (2005) 209–228 227
Berg, B., Lousier, J.D., 2000. Litter decomposition and organic
matter turnover in northern forest soils. For. Ecol. Manage. 133,
13–22.
Blanco, J.A., Imbert, J.B., Arricibita, F.J., Castillo, F.J., 2003a.
Produccion de hojarasca en bosques de Pinus sylvestris L.
sometidos a diferentes intensidades de clara. In: Actas del
VII Congreso Nacional de la Sociedad Espanola de Ecologıa
Terrestre, Barcelona, pp. 267–279.
Blanco, J.A., Imbert, J.B., Ozcariz, A., Castillo, F.J., 2003b. Decom-
position and nutrient release from Pinus sylvestris L. leaf litter in
stands with different thinning intensity. In: Proceedings of the
IUFRO Meeting. Silviculture and Sustainable Management in
Mountain Forests in the Western Pyrenees, Navarre, Spain.
Bolker, B.M., Pacala, S., Parton, W.J., 1998. Linear analysis of soil
decomposition: insights from the CENTURY model. Ecol. Appl.
8, 425–439.
Botkin, D., 2001. The role of theory in forest science and forest
management. In: Proceedings of Forest Modelling for Ecosys-
tem Management, Forest Certification and Sustainable Manage-
ment Conference, University of British Columbia, Vancouver,
12–18 August.
Bray, J., Kurtz, H., 1945. Determination of total organic, and
available forms of phosphorus in soils. Soil Sci. 59, 39–45.
Chertov, O.G., Komarov, A.S., Bykhovets, S.S., Kobak, K.I., 2001.
Simulated soil organic matter dynamics of the Leningrad admin-
istrative area, northwestern Russia. For. Ecol. Manage. 169, 29–
44.
Cole, D.W., Rapp, M., 1981. Elemental cycling in forest ecosystems.
In: Reide, D.E. (Ed.), Dynamic Properties of Forest Ecosystems.
International Biological Programme 23. Cambridge University
Press, Cambridge, pp. 341–409.
Cooke, G.W., 1981. The fate of fertilizers. In: Greenland, D.J.,
Hayes, M.H.B. (Eds.), Soil Chemistry of Soil Processes. John
Wiley & Sons, Chichester, New York.
Costanza, R., Gottlieb, S., 1998. Modelling ecological and economic
systems with STELLA. Part II. Ecol. Model. 112, 81–84.
Del Rıo, M., Montero, G., 2001. Modelo de simulacion de claras en
masas de Pinus sylvestris L. Monografıas I.N.I.A. Forestal No. 3,
Madrid.
Dıez, M.R., Fernandez-Golfın, J.I., 1997. Influencia de las claras en
la calidad de la madera estructural de Pinus sylvestris L. en una
masa artificial. Montes 48, 54–57.
Edmonds, R.L., 1990. Organic Matter decomposition in Western
United States Forests. In: Harvey, A.E., Neuenschwander, L.F.
(Compilers). Proceedings on the Management and Productivity of
Western-Montane Forest Soils, GTR-INT-280, USDA, Forest
Service, IntermountainResearchStation,Ogden,UT,pp.118–128.
Fisher, F., Binkley, D., 2000. Ecology and Management of Forest
Soils. John Wiley & Sons, New York.
Friend, A.D., Shugart, H.H., Running, S.W., 1993. A physiology-
based gap model of forest dynamics. Ecology 74, 792–797.
Gilmanov, T.G., Parton, W.J., Ojima, D.S., 1997. Testing the ‘CEN-
TURY’ ecosystem level model on data sets from eight grassland
sites in the former U.S.S.R. representing a wide climatic/soil
gradient. Ecol. Model. 96, 191–211.
Grigal, D.F., 2000. Effects of extensive forest management on soil
productivity. For. Ecol. Manage. 138, 167–185.
Grote, R., Suckow, F., Bellmann, K., 1998. Modelling of carbon-,
nitrogen- and water balances in Scots pine stands. In: Huttl,
R.F., Bellmann, K. (Eds.), Changes of Atmospheric Effects
on Forest Ecosystems. Kluwer Academic Publishers, London,
pp. 251–281.
Hall, D.O., 1997. Biomass energy in industrialised countries—a
view of the future. For. Ecol. Manage. 91, 17–45.
Harmon, M.E., 2001. Carbon cycling in forests: simple simulation
models. H.J. Andrews Research Report Number 2, http://
www.fsl.orst.edu/lter/pubs/webdocs/reports/ccycleforest.cfm.
Harrington, T.B., Edwards, M.B., 1999. Understory vegetation,
resource availability, and litterfall responses to pine thinning
and woody vegetation control in longleaf pine plantations. Can.
J. For. Res. 29, 1055–1064.
Harwitte, H. (Ed.), 1980. Official methods of analysis of the
Association of Official Analytical Chemists. A.O.A.C.,
Washington, DC, pp. 127–129.
High Performance Systems Inc., 1997. STELLA Research Software,
v. 5.0. Hanover, New Hampshire, USA.
Hunt, E.R., Running, S.W., 1992. Simulated dry matter yields for
aspen and spruce stands in the North American boreal forest.
Can. J. Remote Sensing 18, 126–133.
Jacobson, S., Kukkola, M., Malkonen, E., Tveite, B., 2000. Impact of
whole-tree harvesting and compensatory fertilisation on growth of
coniferous thinning stands. For. Ecol. Manage. 129, 41–51.
Johnson, D.W., Todd, D.E., 1987. Nutrient export by leaching and
whole-tree harvesting in a loblolly pine and mixed oak forest.
Plant Soil 102, 99–109.
Kimmins, J.P., 2004. Forest Ecology. A Foundation for Sustainable
Management and Environmental Ethics in Forestry, third ed.
Prentice Hall, New Jersey.
Kimmins, J.P., Mailly, D., Seely, B., 1999. Modelling forest eco-
system net primary production: the hybrid simulation approach
used in FORECAST. Ecol. Model. 122, 195–224.
Kirschbaum, M.U.F., 1999. CenW, a forest growth model with
linked carbon, energy, nutrient and water cycles. Ecol. Model.
118, 17–59.
Klemmedson, J.O., Meier, C.E., Campbell, R.E., 1990. Litter fall
transfers of dry matter and nutrient in ponderosa pine stands.
Can. J. For. Res. 20, 1105–1115.
Komarov, A., Chertov, O., Zudin, S., Nadporozhskaya, M., Mikhai-
lov, A., Bykhovets, S., Zudina, E., Zoubkova, E., 2003. EFIMOD
2—a model of growth and cycling of elements in boreal forest
ecosystems. Ecol. Model. 10, 373–392.
Landsberg, J., 2003. Modelling forest ecosystems: state of the art,
challenges, and future directions. Can. J. For. Res. 33, 385–397.
Litton, C.M., Ryan, M.G., Tinker, D.B., Knight, D.H., 2003. Below-
ground and aboveground biomass in young postfire lodgepole pine
forests of contrasting tree density. Can. J. For. Res. 33, 351–363.
MAFF, 1986. The analysis of agricultural materials. Ministry of
Agriculture, Fisheries and Food. Reference Book 427. HMSO,
London, pp. 156–157.
Makipaa, R., Karjalainen, T., Pussinen, A., Kukkola, M., Kellomaki,
S., Malkonen, E., 1998. Applicability of a forest simulation
model for estimating effects of nitrogen deposition on a forest
ecosystem: test of the validity of a gap-type model. For. Ecol.
Manage. 108, 239–250.

J.A. Blanco et al. / Forest Ecology and Management 213 (2005) 209–228228
Malkonen, E., 1974. Annual primary production and nutrient cycle
in some Scots pine stands. Comm. Ins. For. Fenn. 84.5, 87.
Margolis, H., Oren, R., Whitehead, D., Kaufmann, M.P., 1995. Leaf
area dynamics of conifer forests. In: Smith, W.K., Hinckley,
T.M. (Eds.), Ecophysiology of Coniferous Forests. Academic
Press, San Diego.
Ministerio de Medio Ambiente, 2003. Deposicion atmosferica en la
estacion de Burguete (Navarra). Servicio de Proteccion Contra
Agentes Nocivos en los Montes, Madrid.
Montero, G., Ortega, C., Canellas, I., Bachiller, A., Elena, R., San
Miguel, A., 1999. Aboveground productivity and nutrient
dynamics in a reforestation of Pinus pinaster Ait. with different
intensities of thinning. Investig, Agrar., Sist. Recur. For., Fuera
de Serie No. 1, 175–206.
Morris, D.M., Kimmins, J.P., Duckert, D.R., 1997. The use of soil
organic matter as a criterion of the relative sustainability of
forest management alternatives: a modeling approach using
FORECAST. For. Ecol. Manage. 94, 61–78.
Olson, J.S., 1963. Energy storage and the balance of producers and
decomposers in ecological systems. Ecology 14, 322–331.
Parton, W.J., Schimel, D.S., Cole, C., Ojima, D.S., 1987. Analysis of
factors controlling soil organic matter levels in great plains
grasslands. Soil Sci. Soc. Am. J. 51, 1173–1179.
Parton, W.J., Coughneour, M.B., Scurlock, J.M.O., Ojima, D.S.,
Gilmanov, T.G., Scholes, R.J., Schimel, D.S., Kirchner, T.B.,
Meneaut, J.-C., Seastedt, R., Garcıa Moya, E., Kamnalrut, A.,
Kinyamario, J.I., Hall, D.O., 1996. Global grassland ecosystem
modelling: development and test of ecosystem models for grass-
land systems. In: Breymeyer, A.I., Hall, D.O., Melillo, J.M.,
Agren, G.I. (Eds.), SCOPE 56-Global Change: Effects on Con-
iferous Forests and Grasslands.John Wiley & Sons, Chichester,
New York, (Chapter 11), pp. 229–270.
Perez-Batallon, P., Ouro, G., Merino, A., Macıas, F., 1998. Des-
composicion de materia organica, biomasa microbiana y emi-
sion de CO2 en un suelo forestal bajo diferentes manejos
selvıcolas. Bol. Soc. Esp. Cienc. Suelo 5, 83–93.
Piene, H., Van Cleve, K., 1978. Weight loss of litter and cellulose
bags in a thinned white spruce forest in interior Alaska. Can. J.
For. Res. 8, 42–46.
Potter, C., Bubier, J., Crill, P., Lafleur, P., 2001. Ecosystem model-
ling of methane and carbon dioxide fluxes for boreal forest sites.
Can. J. For. Res. 31, 208–223.
Puertas, F., 2003. Scots pine in Navarre: economic importance and
production.. In: Proceedings of the I.U.F.R.O. Meeting Silvi-
culture and Sustainable Management in Mountain Forests in the
Western Pyrenees, Navarre, Spain, 15–19 September.
Rolff, C., Agren, G.I., 1999. Predicting effects of different harvest-
ing intensities with a model of nitrogen limited forest growth.
Ecol. Model. 118, 193–211.
Seely, B., Welham, C., Kimmins, H., 2002. Carbon sequestration in
a boreal forest ecosystem: results from the ecosystem simulation
model, FORECAST. For. Ecol. Manage. 169, 123–135.
Sverdrup, H., Svensson, M.G.E., 2002. Defining sustainability. In:
Sverdrup, H., Stjernquist, I. (Eds.), Developing Principles and
Models for Sustainable Forestry in Sweden. Kluwer Academic
Publishers, Dordecht, pp. 21–32.
Swift, M.H., Heal, O.W., Anderson, J.M., 1979. Decomposition in
Terrestrial Ecosystems. University of California, Berkeley.
Thornley, J.H.M., Cannell, M.G.R., 2000. Managing forests for
wood yield and carbon storage: a theoretical study. Tree Physiol.
20, 477–484.
Tiktak, A., Van Grinsven, H.J.M., 1995. Review of sixteen forest-
soil-atmosphere models. Ecol. Model. 83, 35–53.
Verbug, P.S.J., Johnson, D.W., 2001. A spreadsheet-based biogeo-
chemical model to simulate nutrient cycling processes in forest
ecosystems. Ecol. Model. 141, 185–200.
Vitousek, P.M., Reiners, W.A., 1975. Ecosystem succession and
nutrient retention: a hypothesis. BioSci. 25, 376–381.
Waring, R.H., Running, S.W., 2001. Forest Ecosystems, Analysis at
Multiple Scales. Academic Press, San Diego.
Zavala, M.A., Oria, J.A., 1995. Preserving biological diversity in
managed forests: a meeting point for ecology and forestry. Land.
Urban Plann. 31, 363–378.
Zhu, Z., Arp, P.A., Meng, F., Bourque, C.P.-A., Foster, N.W.,
2003. A forest nutrient cycling and biomass model (ForNBM)
based on year-round monthly weather conditions, part II:
calibration, verification, and application. Ecol. Model. 170,
13–27.