sustainability assessment of machining processes by …
TRANSCRIPT

1
SUSTAINABILITY ASSESSMENT OF MACHINING PROCESSES
by
Syed Waqar Raza
A Thesis Presented to the Faculty of the
American University of Sharjah
College of Engineering
in Partial Fulfillment
of the Requirements
for the Degree of
Master of Science in
Mechanical Engineering
Sharjah, United Arab Emirates
December 2013

2
© 2013 Syed Waqar Raza. All rights reserved.

3
Approval Signatures
We, the undersigned, approve the Master‘s Thesis of Syed Waqar Raza.
Thesis Title: Sustainability Assessment of Machining Processes
Signature Date of Signature
(dd/mm/yyyy)
___________________________ _______________
Dr. Ibrahim Mostafa Deiab
Associate Professor
Department of Mechanical Engineering
Thesis Advisor
___________________________ _______________
Dr. Basil Mohammad Darras
Assistant Professor
Department of Mechanical Engineering
Thesis Committee Member
___________________________ _______________
Dr. Hazim Sayed El-Baz
Associate Professor
Department of Industrial Engineering & ESM
Thesis Committee Member
___________________________ _______________
Dr. Andreas Poullikkas
Visiting Associate Professor
Department of Mechanical Engineering
Thesis Committee Member
___________________________ _______________
Dr. Ibrahim Mostafa Deiab
Head, Department of Mechanical Engineering
___________________________ _______________
Dr. Hany El Kadi
Associate Dean, College of Engineering
___________________________ _______________
Dr. Leland Blank
Dean, College of Engineering
___________________________ _______________
Dr. Khaled Assaleh
Director of Graduate Studies

4
Acknowledgements
I would like to express my heartfelt gratitude to my advisor Dr. Ibrahim Deiab, for
without his insight and guidance (both technical and non-technical) this work would
not have been completed. A true mentor, he remains a figure of inspiration and I feel
fortunate to have come across him. I would also humbly thank Dr. Basil Darras, Dr.
Hazim El-Baz and Dr. Andreas Poullikkas for taking out time to review and improve
this work with their valuable insights and providing their kind guidance.
From the Manufacturing Laboratory at AUS, I would like to offer special
thanks to Engr. Salman Pervaiz, for he was always welcoming and available to assist
and guide me during this project. I also feel indebted to Mr. Ricardo de Jesus, who
was able to work tirelessly with me throughout the experimental work and provided
valuable opinions from time to time. Moreover, I would like to thank Engr. Baraa
Jamal Emran, Engr. Muhammad Taha and all those who have, in any way, been
instrumental in completion of this work. The support provided by Mr. Milan
Martinovic and Accu Svenska AB also needs a grateful mention. Lastly and most
importantly, I gratefully acknowledge the help and support provided by the National
Research Foundation (NRF) U.A.E. Their kind patronage was chiefly instrumental in
seeing this project through to the end.

5
Dedication
In the name of Almighty Allah, the source and origin of all knowledge of present and
otherwise, I dedicate this effort of mine to
My father, who in his life and death, is a constant source of strength
My mother, whose constant prayer is my guardian angel
My loving sister and brother

6
Abstract
There is an increased interest in sustainability assessment of manufacturing systems
and processes. Various machining practices are being proposed as sustainable and
require careful investigation. The current sustainability assessment models (e.g., Life
Cycle Analysis [LCA]) present a holistic approach without much focus on process
specific details. This project presents a more flexible ‗XSI‘ approach for defining
sustainability indices where X can be a sustainability perspective (e.g., Energy
Sustainability Index, ESI). These sustainability metrics can comprehensively quantify
machining processes in terms of impact on the environment and power consumption
in a flexible manner. In addition, introducing the concept of normalization with
respect to the ‗feature-of-interest‘ enables a flexible rating system in terms of process
types and perspectives. A user-friendly calculator is developed, which converts a set
of input machining parameters into a set of measurable rating quantities and indices
including but not limited to production rate, production cost, tool life/cost, energy
consumption and environmental burden. This will enable the manufacturing engineer
to make an informed decision about parameter selection and process design for
sustainability. Machinability of titanium alloy Ti-6Al-4v is used to validate and
improve the proposed approach and assess proposed practices like hybrid machining
and vegetable oil lubrication.
Search Terms: Sustainability, Sustainability indices, LCA, Ti-alloy, Machining

7
Table of Contents
Abstract .......................................................................................................................... 6
List of Figures ................................................................................................................ 9
List of Tables ............................................................................................................... 10
Nomenclature ............................................................................................................... 11
1. Introduction .............................................................................................................. 12
1.1 Preamble ............................................................................................................ 12
1.2 Literature Review............................................................................................... 13
1.2.1 Sustainability Measurement ........................................................................ 13
1.2.2 Environmentally Benign Lubrication Strategies ......................................... 23
1.3 Research Methodology ...................................................................................... 30
1.3.1 Phase-I: Literature Survey ........................................................................... 30
1.3.2 Phase-II: Analysis of Metrics ...................................................................... 30
1.3.3 Phase-III: Selection of Metrics .................................................................... 30
Phase-IV: Developing the Calculator ................................................................... 31
Phase-V: Test Case-studies / Experimental work ................................................. 31
Phase-VI: Process evaluation, Debugging and Reviewing .................................. 31
2. Measuring Machining Process Sustainability .......................................................... 32
2.1 Sustainability Metrics: The XSI-Approach ....................................................... 33
3. Development of the Sustainability Calculator ......................................................... 35
4. Turning of Titanium Alloy Ti-6Al-4V .................................................................... 41
4.1 Titanium Alloy Ti-6Al-4V ................................................................................. 41
4.2 Comparison of coolant and machining strategies‘ impact on machinability of
titanium alloy Ti6Al4V ............................................................................................ 42
4.2.1 Design of Experiments and Experimental Setup ......................................... 43
4.2.2 Results and Discussion ................................................................................ 48

8
4.2.3 Using the Sustainability Calculator ............................................................. 50
4.3 Comparison of environmentally benign cooling strategies ............................... 54
4.3.1 Design of Experiments and Experimental Setup ......................................... 54
4.3.2 Results and Analysis: ................................................................................... 59
Tool Wear ............................................................................................................. 60
Surface Roughness ............................................................................................... 61
Effect on Energy Consumption ............................................................................ 62
4.3.3 Using the Sustainability Calculator ................................................................ 64
6. Summary & Conclusions ......................................................................................... 67
6.1 Future Work ....................................................................................................... 68
7. References ................................................................................................................ 69
8. Appendices ............................................................................................................... 75
Appendix-A.............................................................................................................. 75
Appendix-B .............................................................................................................. 76

9
List of Figures
Fig. 1 Basic Elements of Sustainable Machining. ....................................................... 32
Fig. 2 Sustainability calculator: Excel format .............................................................. 37
Fig. 3 MATLAB-GUI, first-look. ................................................................................ 38
Fig. 4 MATLAB-GUI, later versions. ......................................................................... 39
Fig. 5 MATLAB-GUI, final version. ........................................................................... 40
Fig. 6. Schematic of Hybrid Turning ........................................................................... 44
Fig. 7. Design of Experiments Framework for first set of experiments. ..................... 45
Fig.8 Sequential/Conventional turning and grinding. ................................................. 47
Fig.9 Hybrid turning and grinding. .............................................................................. 47
Fig. 10 Measured Values DX8 screen shot. ................................................................. 48
Fig. 11 Optimized setting of cutting speed, feed rate, wheel type, insert type and
lubrication and machining strategies achieved using DX8 optimizer giving best
surface roughness, tool wear and energy consumption. .............................................. 49
Fig. 12 Sustainability indicators for all parameter settings.......................................... 51
Figure 13 'The higher the better' approach. .................................................................. 52
Fig. 14 PowerSight Manager Graph for a run. ............................................................. 53
Fig. 15 Design of Experiments Framework. ................................................................ 55
Fig. 16 Eco-Lubric Booster system. ............................................................................ 58
Fig. 17 Schematic diagram of experimental setup. ...................................................... 58
Fig. 18 Flank tool wear at feed=0.1 mm/rev and speed = 90 m/min using optical
microscope ................................................................................................................... 60
Fig. 19 Tool Wear with lubrication techniques. .......................................................... 61
Fig. 20 Surface Roughness with Lubrication Techniques ........................................... 62
Fig. 21 Cutting Energy Consumption with Lubrication Techniques. .......................... 63
Fig. 22 Revised Calculator Interface ........................................................................... 64
Fig. 23 Sustainability Indices plot ............................................................................... 65
Fig. 24 Sustainability Indices plot ............................................................................... 66

10
List of Tables
Table 1 List of indicators . ........................................................................................... 17
Table 2 Emission Intensities . ...................................................................................... 36
Table 3 Mechanical Properties of Ti-6Al-4V ............................................................. 41
Table 4. Design Of Experiments. ................................................................................. 46
Table 5 Extracted data sets of parameter settings from DOE. ..................................... 50
Table 6 Design of Experiments-II............................................................................... 56
Table 7 Measured values against replicated runs ........................................................ 59
Table 8 Test Matrix-II (Randomized) .......................................................................... 65

11
Nomenclature
ANN Artificial Neural Network
ANOVA Analysis Of Variance
CSI
d
Coolant Sustainability Index
Depth of Cut
DoE Design of Experiments
EPD Environmental Product Declaration
ESI Energy Sustainability Index
Econsumed Sum of dry run energy and Cutting Energy
Ecut Cutting Energy estimated using Power Factor
Edry run
fm
fR
Energy consumed in dry run with no depth of cut
Cutting Feed Rate
Cutting Feed
FSI Financial Sustainability Index
HVAC
L
Heat Ventilation & Air Conditioning
Length of Cut
LCA Life Cycle Assessment
LN2 Liquid Nitrogen
MQL Minimum Quantity Lubrication
MQCL
MRR
Minimum Quantity Cooled Lubrication
Material Removal Rate
OECD Organization for Economic Cooperation and Development
PSI
Tm
V
Product Sustainability Index
Machining Time
Cutting Speed

12
1. Introduction
1.1 Preamble
The manufacturing sector of today needs a comprehensive sustainability assessment
methodology. Usually LCA methodology can perform this task but for that it is
important that the manufacturing phase of the product or the use phase of the machine
tool is focused upon first. There is a need for sustainability metrics that can
comprehensively describe the machining process. This work aims to select a set of
sustainability metrics and then use these metrics to build a simulation tool, a
sustainability calculator, to investigate the sustainability of machining processes by
developing such metrics and a calculator that utilizes these metrics/indicators. The
calculator will assess various machining scenarios based on a set of proposed
sustainability indicators. The concept of normalization with respect to the desired
feature is applied in this regard. The calculator should be able to convert a set of input
machining parameters into a set of measurable rating quantities including but not
limited to production rate, production cost, tool life/cost, energy consumption and
environmental burden. This will enable the manufacturing engineer to make an
informed decision about the optimum manufacturing scenario. A set of cutting tests
were performed in the lab to collect real data for different case studies that were used
to validate and assess the feasibility of the calculator.
The objectives are of this study are:
Review open literature, select and develop set of elaborate, extensive and
generic sustainability metrics which are easy to use, comprehend and evaluate
regardless of the specifications of the processes and thus fill an existing void
of suitable sustainability indicators.
Establish a methodology for evaluating sustainability of machining processes.
Develop a reliable, user-friendly and interactive calculator for evaluating
sustainability of a given machining scenario.
Evaluate certain scenarios using the proposed metrics and developed
calculator.
13
1.2 Literature Review
The scope of this thesis is two-fold. The first objective is to support research in the
field of sustainability assessment of machining processes and the second is to analyze
the so-called ‗sustainable‘ practices in machining. The former thus requires a survey
of the work that has previously been done in order to rate sustainability. The latter
covers various lubrication methodologies that are proposed as sustainable alternatives
to conventional practices. Hence the literature review has been accordingly divided
into two sections.
1.2.1 Sustainability Measurement
The concept of sustainable manufacturing has been a key area of research in
recent times. Many efforts have been made to incorporate sustainability into
manufacturing systems so that environmental, economic and societal constraints can
all be satisfied. The U.S. Department of Commerce defines sustainable manufacturing
as ―the creation of manufactured products that use processes that minimize negative
environmental impacts, conserve energy and natural resources, are safe for
employees, communities, and consumers and are economically sound‖ [1]. To rate a
system or to measure the improvement in an existing system in terms of sustainability
is potentially very difficult [2]. This calls for a set of limited metrics based on
standardized measurements that help decision making at all levels [2],[3]. Metrics
‗enable technology‘ in design processes and even if they are subjective and variable,
they are still important for informed decision making [2],[4]. Various studies have
been carried out in different manufacturing sectors but the machining sector still
needs more in this regard. Machining processes are very important manufacturing
processes that lie at the core of almost every industry [5]. The advent of sustainability
principles has also lead to research in the field of machining processes.
Mani et al. [6] argued that the global trend towards sustainable manufacturing
practices calls for sustainability criteria to be developed. They show that the current
manufacturing indices of cost, time and quality need to be complemented by
sustainability. For this purpose they propose the idea of ‗Energy Monitoring‘. They

14
justify this proposition by first establishing the importance of energy in
manufacturing. . It is shown that almost 21.6 percent of the total energy consumption
in the US is covered by the industrial sector and out of this, 70 percent can be
attributed to manufacturing processes. Also, 5 percent of the US GDP is from the
manufacturing sector. Energy enables manufacturing operations that add value to
intermediate products as they are progressively transformed into final consumer
goods. It is explained that the activities that provide energy efficiency also provide
better control over plant assets and inputs. Thus energy efficiency is not only
important from an environmental perspective but is also significant in terms of
achieving corporate goals through better productivity. After sufficient study and
research, energy monitoring for sustainability through an energy consumption index
will minimize energy use and improve productivity through improved engineering of
product and process. It will also promote a business that is both environmentally and
economically competitive. Companies will be able to implement a comprehensive
monitoring and preventive maintenance program that considers energy usage by
factoring energy consumption into any plans that include asset acquisition, allocation,
or replacement. The use of ISO 14000 series is proposed as well, so as to assist the
execution of life cycle analysis (LCA).
Pusavec et al. [7] stressed the importance of incorporating sustainability in
manufacturing processes and especially machining processes. The landmarks of a
sustainable process are identified as machining costs, environmental friendliness,
energy consumption, waste management, personnel health and operational safety.
Building on these concepts the study proposes the idea of cryogenic machining.
However, more importantly, the study includes a comparison of two machining
processes in a very effective tabular representation that involves the necessary input
parameters of the machining process, the time and energy consumed and the cost at
different stages to give an overall cost comparison. This comparison can help in
developing a sustainability calculator by taking in input parameters and evaluating a
process.
A special report was prepared by General Motors in collaboration with research
groups [8]. This report proposes set of metrics for measuring sustainability in General

15
Motors from various perspectives. These perspectives involve six major categories:
costs, environmental friendliness, energy consumption, waste management, personnel
health and operational safety. These are further subdivided into other metrics, some of
which are of interest.
The report contains useful guidelines for metric characteristics:
• ―Address the needs of all stakeholders (community, government, and
business)
• Facilitate innovation and growth; continuous improvement must be the
cornerstone
• Harmonize local, state, national, and international levels of business units and
operations
• Be fully compatible with existing business systems (add value)
• Measure the right things – what is measured is what gets managed‖
The importance of using the 6Rs (reduce, remove, recycle, recover, redesign,
remanufacture) approach was discussed in the same study and based on the nature of a
production plant, metrics were suggested. Since the study at hand is more specific and
deals with performance in machining processes, the areas of interest are cost,
environmental friendliness and energy consumption. Regarding these areas, the key
indicators can be the annual energy consumption, rate of recycling, CO2 footprint and
the cost of material, process, etc. The study also discusses a number of relevant
existing standards that may help in the selection or development of metrics, along
with the best practices of peer industries while elaborating on the importance of
adopting sustainable practices in the modern era of manufacturing.
Diaz et al. [9] established the importance of energy consumption of machine tools
and discussed that the importance of the energy consumption in the manufacturing
phase is also important, something not done in previous work that focuses only on the
use phase. The study analyzed the lifetime energy consumption of a machine tool by
taking into account the effect of the manufacturing environment, transportation,
16
cutting fluid, HVAC, lighting, and automation. The results of this analysis are largely
discussed in terms of energy optimization and percentage CO2 reduction. The authors
believe that the analysis can be extended to other manufacturing processes apart from
machining, and provides greater clarity on the manufacturing phase as the purpose of
a machine tool is to manufacture other products. The results include a discussion on
the energy consumed during the life cycle of the machine tool and two certain milling
machine tools are studied and compared for that purpose. The manufacturing phase,
transportation, use phase and end of life are taken as the relevant life stages. Three
different scenarios of a job shop, community shop and commercial shop are studied as
the varying manufacturing environments and the impact of the manufacturing phase
and the previously untouched side of the use phase like HVAC, lighting, and
automation etc. are discussed.
Feng et al. [10] argued that the measurement of sustainability in manufacturing is an
enabler to quantitatively measure performance in sustainability in specific
manufacturing processes. A sustainable manufacturing measurement infrastructure
was proposed in the study. The components include sustainable indicators and metrics
repository, measurement methods, guidelines, and sustainability performance analysis
and report. A very comprehensive list of available systems of rating sustainability and
the standards that are serving the purpose for now along with their sources is
presented in Table 1.
A general outline of the characteristics of the metrics given from ISO 14031 standards
is presented in [10], stressing that they should be
• Measurable: Indicator must be capable of being measured quantitatively or
qualitatively in various perspectives.
• Relevant: Indicator must show useful meaning on the manufacturing processes
under evaluation.
Understandable: Indicator should be easy to understand.
• Reliable/Usable: Reliable measurement is necessary.
• Data accessible: Indicator has to be based on accessible data.

17
• Flexible: An indicator must be compatible with open standard expressions for
future use.
Indicator Set components Reference
Global Report Initiative
(GRI) 70 indicators
http://www.globalreporting.org/ReportingFr
amework/ReportingFrameworkDownloads/
Dow Jones Sustainability
Index (DJSI)
12 criteria based
single indicators
http://www.sustainability-
index.com/07_htmle/publications/guidebook
s.html
2005 Environmental
Sustainability Indicators 76 building blocks http://www.yale.edu/esi/ESI2005.pdf
2006 Environment
Performance Indicators 19 Indicators
http://sedac.ciesin.columbia.edu/es/epi/down
loads/2006EPI_Report_Full.pdf
United Nations
Committee on
Sustainable Development
Indicators
50 indicators http://www.un.org/esa/sustdev/natlinfo/indic
ators/guidelines.pdf
OECD Core indicators 46 indicators http://www.oecdbookshop.org/oecd/display.
asp?sf1=identifiers&st1=972000111E1
Indicator database 409 indicators http://www.Sustainablemeasures.com
Ford Product
Sustainability Index 8 indicators http://www.ford.com/doc/sr07-ford-psi.pdf
GM Metrics for
Sustainable
Manufacturing
46 Metrics
http://actionlearning.mit.edu/s-
lab/files/slab_files/Projects/2009/GM,%20re
port.pdf
ISO 14031
environmental
performance evaluation
155 example
indicators
http://www.iso.org/iso/iso_catalogue/catalog
ue_ics/catalogue_ics_browse.htm?ICS1=13
&ICS2=20&ICS3=10
Wal-Mart Sustainability
Product Index 15 questions http://walmartstores.com/download/3863.pdf
Environmental Indicators
for European Union 60 indicators
http://biogov.cpdr.ucl.ac.be/communication/
papers/tepi99rp_EN105.pdf
Eco-Indicators 1999 3 main factors based
single indicator
http://www.pre.nl/eco-indicator99/ei99-
reports.htm
A discussion of using the presented methods of sustainability measurement was
presented with a proposed infrastructure of methodologies and standards. After this a
sample case-study was presented in the perspective of CO2 emissions. The process
sustainability indices are selected to be the weight of CO2 produced and the energy
consumed during the process of machining.
Jayal et al. [11] discussed the issue of sustainability and its measurement in the
perspective of relevant levels. At the product level there is a need to move beyond the
traditional 3R concept promoting green technologies (reduce, reuse, recycle) to a
more recent 6R concept forming the basis for sustainable manufacturing (reduce,
Table 1 List of Indicators
[10].

18
reuse, recover, redesign, remanufacture, recycle), since this allows for transforming
from an open-loop, single life-cycle paradigm to a theoretically closed-loop, multiple
life-cycle paradigm. At the process level there is a need to achieve optimized
technological improvements and process planning for reducing energy and resource
consumptions, toxic wastes, occupational hazards, etc., and for improving product life
by manipulating process-induced surface integrity. At the system level there is a need
to consider all aspects of the entire supply chain, taking into account all the major life-
cycle stages – pre-manufacturing, manufacturing, use and post-use – over multiple
life-cycles.
In addition to this, a quantification method for rating sustainability is proposed by
suggesting Life Cycle Assessment (LCA) under the banner of a Product Sustainability
Index (PSI). Although no rating scale is defined for any kind of process, useful areas
of focus are suggested. At the end it was concluded that achieving overall
sustainability requires a holistic view spanning the entire supply chain, including
manufacturing systems and processes, and involving multiple product life cycles, and
this requires improved product performance models, predictive process models and
optimization of individual manufacturing processes, as well as optimization of the
entire closed-loop supply chain operations.
Schmidt et al. [12] explained the use of the Product Safety Index (PSI) at the Ford
Motor Company. The development of this system of sustainability management and
rating was developed under the guidelines provided by ISO 14040 in terms LCA
methodology. The set of relevant metrics includes eight indicators which belong to
three generic categories: environmental, social and economic. These indicators are
Life Cycle Global Warming Potential, Life Cycle Air Quality Potential, Sustainable
Materials, Restricted Substances, Drive-by-Exterior-Noise, Mobility Capability,
Safety, and Life Cycle cost of ownership. Owing their existence to a car
manufacturing company, most of the indicators are specifically related to the product
itself. It is also stated that the ―PSI is not reduced to a single score as sustainability is
by definition not one-dimensional but always measured by different indicators.‖ For
manufacturing operations in particular, a manufacturing sustainability index (MSI)

19
which is built on the same principles is proposed. Thus, improvements using PSI
comparisons show that this can serve as a useful tool.
Narita et al. [13] proposed the use of environmental burden analysis of a machining
operation to evaluate the process using the LCA approach. An environmental burden
analyzer was developed that breaks down machining processes into various
components and then calculates the environmental burden for each. To calculate the
environmental burden, the idea of using the relevant emission intensities is utilized.
These intensities are given in terms of kilograms of CO2 per unit of resource
consumption. It is also argued that the most significant and dominant of all gases in
terms of environmental burden is CO2. It can be seen that the environmental burden is
a very useful indicator for sustainability evaluation. Also, the idea of using emission
intensities is useful for evaluating energy consumption, coolant usage, etc. Thus the
study provided very useful input for developing a sustainability calculator.
Rajemi et al. [14] developed a model for optimizing the energy footprint for a
machined product. First of all, the total energy of machining a component by the
turning process for a specific material in dry cutting conditions was modeled and
optimized to derive an optimized tool-life that satisfies the minimum cost
requirements and then the one with the lowest energy footprint requirement. The
optimization criterion was extended in terms of minimum energy into two cases with
one of them accounting for embodied energy for tools. Three levels of cutting
velocities were used to find the velocity exponent. Then for one minimum cost and
two minimum energy cases the tool life was optimized. Additionally, the problem
regarding the effect of system boundaries in determining optimum machining
conditions and the conflict between economical and sustainability requirements is
explored.
Pusavec et al. [15] argued that to tackle the modern-day challenges regarding the
issue of sustainability, a sustainable development trend has to be synergistically
induced in a setup at all levels, which includes machining processes. It is advocated to
use of cryogenic machining with experimental results through the analysis of cutting
forces, tool-wear, temperatures and costs. The study proves that cryogenic machining
technology has a high potential to cut costs and improve competitiveness by reducing

20
resource consumption, creating less waste, and having less of an environmental and
social impact. The results show that, even though the initial cost and effort involved
with cryogenic machining are higher, it can obviously offer significant sustainability
benefits. They may come through shorter production cycles and the lower cost needed
to machine a part as well as the enhanced productivity due to higher output.
Pusavec et al. [16] stated that the idea of sustainable development is well defined and
implemented on the production macro level, but there is a severe lack of
implementation practices on the shop floor dealing with machining technologies. The
industry is striving to achieve sustainability through changes in product, material
cycles, the recovery of resources, and innovations in production practices in order to
fulfill the objectives of sustainable development. Sustainable production via the
alternative machining technologies, namely cryogenic and high pressure jet assisted
machining is promoted because these technologies have a high potential to cut costs
and improve competitiveness by reducing resource consumption, thus creating less
waste. The general issues of sustainable technologies are pointed out with a
comparative case study LCA performed for alternative machining processes,
concluding that the future of sustainable production is going to entail the use of
alternative machining technologies to reduce consumption rates, environmental
burdens, and health risks simultaneously, while increasing performance and
profitability.
A study also carried out an experimental technology evaluation to discuss the
importance of sustainable machining technologies in achieving sustainable
development objectives and to study the outcomes of adopting such techniques which
are sustainable [16]. A cost and benefit analysis was presented. The sustainability
evaluation was done for cryogenic and high pressure jet-assisted machining while
comparing them with conventional machining. The sustainability performance
measures used in the study refer to environmental impact, energy consumption,
safety, personal health, waste management, and cost. The case-study refers to the
machining of high-temperature Ni-alloy (Inconel 718). It is shown that tooling costs
represent the major contribution to the overall production cost, which contradicts
previous analyses, and that sustainable machining alternatives offer a cost-effective
21
route to improving economic, environmental, and social performance in comparison
to conventional machining. The disadvantages of initial high price and effort are also
discussed along with the payback periods and the improvement in productivity.
Gustowski et al. [17] pointed towards a new dimension in sustainability measurement
by proposing the adoption of a thermodynamic approach considering the ecosphere is
adapted to come up with a model of our system of interactions in the modern world.
The general widespread notion of the world acting in a sustainable way is challenged.
Sustainability was taken as defined by the UN. The idea of bio mimicry and industrial
ecology is promoted for incorporating sustainability. It is suggested that for the model
proposed by equations from thermodynamic principles, the mass, energy and entropy
changes can be expressed as exergy and the value of the non-conserved exergy can
serve as one of the metrics for sustainability regarding a particular system. However,
it is argued that is not possible to come up with a single metric for sustainability
assessment.
Gustowski et al. [18] proposed a thermodynamic framework, arguing that
thermodynamics is well suited to analyze the magnitude of the effects of
manufacturing processes on the environment and sustainability. It is also stated that
such a framework would be helpful in determining the related efficiencies of the
processes. Starting from the conventional mass and energy balance, the framework is
based upon exergy analysis and hence derived accordingly. After that, electrical
energy utilization is discussed and then a couple of model manufacturing process case
studies are solved based on the derived model. What is intriguing though is that no
machining process is discussed as a case study although data charts showing trends
for it are present. It would have been interesting to see the above mentioned
framework in action for the thermodynamic complexities of a machining process as a
case study using the exergy model. The reason may be the fact that this paper in itself
is somehow a ground-breaking effort and not much study has been done on the
subject before. Also, earlier the stress has been on product quality rather than
sustainability, so it may take some time to apply the model thoroughly to machining.
Gustowski et al. [19] also discussed various manufacturing processes and used
literature to plot their electrical energy consumption data. The model proposed for

22
analysis is exergy-based and the power required is given in terms of a relation. It is
argued by showing the graphical trends of practical data for different manufacturing
processes and the power relation that it is wrong to assume the specific energy
requirement of a process as a constant. This value depends on the material processing
rate of the process and hence the electrical energy requirements are also dependent on
the processing rates. Data regarding machining scenarios is also given showing
energy consumption of the processes, but how to measure the output exergy value still
remains a question. It is later proposed using the plots and data that the energy
consumption can be decreased by either improving the support systems of a process
or by increasing the material processing rate.
Jesweit et al. [20] proposed the use of the Carbon Emission Signature (CESTM) for
measuring the environmental burden of a manufacturing process. It is only required to
use the CESTM of the power grid being used by the manufacturing setup and then it
can be multiplied to the total energy consumed for the total part production by that
setup. Also the concept of a Carbon Emission Label is introduced.
Fiksel et al. [21] discussed the progress in the relatively new field of sustainability
performance measurement (SPM) and the principles and best practices of the process
in detail. It is stated that incorporating sustainability leads to economic growth of a
firm as well. The four basic principles of sustainability measurement are given. These
principles cover the attention for both resource and value indicators, representing the
triple bottom line of economic, environmental, and societal aspects, full consideration
of the product life cycle, and the idea of leading (outcome) and lagging (business
process) indicators, respectively. The best practices of five big industry clients have
been shown as application models developed on the given principles. Sustainability
metrics can be classified as qualitative or quantitative, absolute or relative. However,
they should best represent the system at hand.
Feng et al. [22] discussed the concept of sustainable development while providing an
overview of the metrics currently in use for measuring sustainability. The
characteristics of these metrics are listed, which are quite similar to those presented in
other studies and their importance is discussed. In addition to this, the current major
categories of sustainability indices are discussed with respect to the organization that

23
uses them, e.g., Ford‘s PSI, OECD toolkit, Dow Jones sustainability index, General
Motors metrics for sustainable manufacturing, Environment Pressure index for
Europe, UN-CSD, Wal-Mart index, etc. However, most of these indicator sets are not
for products and processes and there is currently a demand by the industry for such
indices. This requires an infrastructure including indicator repository and complete
guidelines. The metrics can be life-cycle activity-based or can be based on
organizational levels. An illustration of an important life-cycle phase, manufacturing,
shows the need for a set of metrics to analyze its sustainability.
Deiab et al. [23] investigated the effect of different coolant strategies on tool
performance during turning operations on a specific grade of hardened steel. The
coolant techniques included flood cooling, minimum quantity lubrication and
cryogenic machining. Coated carbides were used as the cutting tools under
observation. The cutting forces and the tool flank wear progression were predicted
using artificial neural network (ANN) models. The study revealed that cryogenic
machining gave encouraging results in terms of the tool wear and the energy
consumption perspective. Also, the use of flood cooling resulted in hardening up the
material which raised the forces and power required of the process. It was visible that
the ANN models were sufficiently convenient in terms of predicting the tool wear and
cutting forces and propose a modeling alternative to other techniques like ANOVA
where statistical tools are used to analyze the effect of variation of parameters.
1.2.2 Environmentally Benign Lubrication Strategies
As established earlier, sustainability has to be incorporated at all three levels:
social, economic and environmental. For machining processes, this is not complete
without the cutting process lubrication taken into account. Huge amounts of cutting
fluids consumption have been recorded in different countries, e.g. 100 million gallons
a year in the U.S. and 75491 tons in Germany. In Japan very high consumption and
disposal costs were recorded [24][25]. An estimate suggests that almost 16% of the
total manufacturing costs are comprised of cutting fluid costs and when it comes to
the machining of hard-to-machine materials, they reach up to 20-30 percent [26],[16].
Shokrani et al. [27] reviewed a considerable amount of working terms of
environmentally conscious machining. Most cutting fluids are not biodegradable and
24
contain various components, which can cause environmental and health hazards.
Dangerous bacteria can grow and mix with the shop floor environment allowing
dangerous biocides to be present. Moreover, the frequently used mineral oil is
carcinogenic and can cause skin cancer. Chlorinated and sulphurized additives are
also present in the shop-floor. The vaporized particles of such cutting fluids can be
readily inhaled by workers and cause severe damage while their smell can make the
work conditions uncomfortable [27], [28].
Zhang et al. [28], studied the effect of using minimum quantity cooled lubrication
(MQCL) for down-milling of Inconel 718. It is stated that due to environmental
concerns, sustainable machining technologies need to be used for machining. MQL is
often used but the low cooling capacity of air is a limitation to the utility of MQL.
However, refrigerated air can be used as a remedy in this regard. A study was
executed using MQCL with bio degradable vegetable oil dry machining strategies. It
was revealed that similar tool wear mechanisms showed up while using either the dry
or MQCL technique. However, the tool life increased by 1.57 times under MQCL.
MQCL also offered lower cutting forces due to better cooling and lubrication
performance. Moreover, with 100% biodegradability and no uncomfortable effects
like bad smell, MQCL turns out to be a more sustainable alternative to both
conventional MQL and dry machining.
Siniawski et al. [29] stated that dry machining and minimum quantity lubrication are
promising lubrication techniques that need to be considered for new machine tool
systems. While dry machining is the ultimate goal, MQL will always be a key method
to introduce nearly dry machining. In particular, for systems where a single machine
tool is used for one component, these technologies propose significant financial and
environmental incentives. It is also important to introduce environmentally safe
lubricating fluids that possess both good biodegradability and lubrication properties as
MQL fluids.
Pusavec et al. [30] proposed cryogenic machining as a sustainable machining
strategy. The challenges that the future of sustainable machining faces in terms of
competitive production and environmental hazards are established. An LCA of the
Cooling Lubricating Fluids (CLFs) is executed. The LCA revealed the significant
25
potential of cryogenic machining using liquid nitrogen (LN). The solid waste,
acidification and water usage would be reduced along with the global warming
potential. A comparative analysis between cryogenic and conventional machining in
terms of total production energy consumption shows that cryogenic machining is
more energy efficient because of high-energy consumption from tool production, even
though it appeared otherwise based on the nitrogen extraction energy burden.
Safian et al. [31] evaluated the use of biodegradable vegetable oil as an alternative
cutting lubricant. While the vegetable oil was used through the MQL technique, the
vegetable oil was compared with the dry and flood cooling strategies using coolant
with emulsion. The various machining trials for end-milling AISI 420 hardened
stainless steel revealed that the vegetable oil used through MQL produced the best
results in terms of tool life. The study also showed that the effects of the cutting fluid
and type of adopted cooling strategy on tool life and tool wear were significant. The
results thus showed the vegetable oil MQL as a viable alternative to wet and dry
machining.
Burton et al. [32] stated that the development and evaluation of vegetable based metal
working fluids or MWFs has been the subject of a considerable amount of research in
recent years. The emulsification of vegetable oil in water is also an interesting area of
research. Studies revealed that not only stable emulsification of canola vegetable is
achieved, but a reduction in cutting forces, chip thickness and burrs is observed in
end-milling operations.
Venugopal et al. [33] studied the effect of cryogenic cooling on the nature and growth
of tool wear in uncoated carbide cutting tools while turning titanium Ti-6Al-4V. The
importance of this study lies in the increased demand of titanium alloys in various
biomedical, engineering and other applications. Since it is a hard-to-machine material,
the main challenge in machining titanium is the rapid tool wear encountered. Liquid
nitrogen jets are used in comparison with dry and wet machining strategies. The wear
mechanisms were significantly reduced under the effect of cryogenic cooling, thus
promising environmentally safe machining with better productivity.
26
Bermingham et al. [34] indicated that adopting technologies such as cryogenic
coolants and high pressure emulsions is difficult for the industry because of the lack
of direct comparison research. Various benefits of both technologies, cryogenic
coolant and high pressure emulsion, have been identified for turning Ti-6Al-4V.
While both techniques turned out to be effective coolants extending the tool life, the
high-pressure water based emulsion offers a slightly better tool life. The high-pressure
emulsion also penetrated deeper into the tool-chip interface and produced smaller
chips. It was noted that the method of coolant delivery is of prime importance since
the optimization of nozzle position can in some cases improve tool life by up to 80
percent.
Cetin et al. [35] stated that vegetable based cutting fluids can replace the conventional
cutting fluids. It was expected that vegetable oils with extreme pressure additives
(EP) would perform better in terms of reduction of tool wear, surface roughness and
cutting forces. A Taguchi method study was executed with six different cutting fluids
that involved sunflower and canola oil based cutting fluids with 8 and 12 percent EP
additive (all with bio-degradability greater than 95 percent) and two commercial
cutting fluids of semi-synthetic and mineral types. The turning experiments on AISI-
304L aluminum indicated that both the sunflower and canola cutting fluids with EP
additives were the better option for cutting and feed forces. For surface roughness,
canola based fluid with EP additives and sunflower based fluid without EP additives
gave the best results. This confirmed the superiority of vegetable oils over
commercial cutting fluids.
Fratila et al. [36] used the Taguchi method to execute a parametric study to determine
the optimum cutting and lubrication conditions for face-milling of AlMg3. Three
lubrication strategies, namely flood, dry and MQL were used. The outputs of interest
were surface roughness and cutting power. Although dry machining gave better
surface roughness, the cutting power was less when flood cooling was used. Authors
noted that in neither case did MQL drastically challenge the optimal conditions or
show much negative effect on surface quality and cutting power.
Lawal et al. [37] reviewed various lubrication techniques for machining processes and
stated that it was impossible to rank them based on the variety that lies in the work

27
piece, tool materials and the process itself. Nevertheless, a detailed analysis revealed
that the MQL technique still holds an edge. The air/vapour /gas technique needs more
research to verify its suitability. The high-pressure coolant needs more research since
the process is not well understood and the available literature is restricted to hard-to-
machine materials. Cryogenic machining has shown promise in terms of quality and
performance. Although it has high initial costs, it provides effective long-term
solutions for coolant disposal and chip recycling. The MQL technique with vegetable
oil as a lubricant apparently offers the best environmental solution coupled with
improved performance as observed by researchers.
Kuram et al. [38] tried to optimize the cutting parameters and lubrication by using a
D-optimal response surface-based design of experiments. Milling operations on AISI-
304L aluminum were conducted using canola and sunflower-based vegetable oils with
different percentages of EP additives. It was concluded that a canola-based cutting
fluid with higher EP additives is more suited for energy consumption since it yields
lesser specific energy. However it gives lesser tool life than sunflower oil-based
cutting fluid with higher EP additive content. If surface roughness and total cost are
also considered, then the canola-based cutting fluid with higher EP additives gives an
overall better performance.
Andriya et al. [39] explored the cutting parameter settings for turning Ti-6Al-4V
using PVD-coated TiAlN cutting tools under dry machining conditions. The study
was focused on exploring the range of cutting force magnitudes and surface
roughness. For surface roughness, cutting velocity and feed were the most significant.
Alves et al. [40] proposed the use of vegetable oil-based cutting fluid to address the
scarcity of mineral oil and the potential pollution caused by commercial cutting fluids.
A new formulation of 40% sulphonate caster oil in water was proposed. A comparison
was made for grinding operations using neat oil, semi-synthetic oil and the new
vegetable oil-based formulation. It was concluded that the new formulation not only
resulted in good performance but was readily bio degradable and proved to be a good
corrosion inhibitor for the work piece.

28
Weinert et al. [41] stated that the minimum quantity cooling lubrication (MQCL),
unlike MQL, has not been widely used and that further investigation is needed. The
MQCL system holds a lot of potential for the future of efficient and safe machining.
While machining systems equipped with MQL, cryogenic or dry machining are
available today, more improvements have to come in the lubrication process design in
terms of delivery system, cooling and lubrication performance.
Kalyan Kumar et al. [42] compared dry machining with cryogenic machining and
observed a reduction in cutting forces by 14.83%. Cryogenic machining outperformed
dry cutting by 37.39% in terms of flank wear. Nevertheless, the N2 consumption was
high, making the process expensive.
Hong et al. [43] found that cryogenic machining using LN2 tends to increase the
cutting force when machining Ti-6Al-4V. This can be related to the hardening of the
work-piece at lower temperatures, which in turn is responsible for reducing the
frictional force. Thus, the reduction in feed force and the thickness of the secondary
deformation layer in the microstructure of the chips, along with the appropriate
coefficient of friction make LN2 a suitable lubricant.
In summary, a review of the open literature sources reveals that the energy
consumption of a manufacturing process emerges on top of time, cost and quality as a
very important metric of sustainability. These reviewed studies show again that cost
and energy consumption or foot-print are two very significant indicators regarding the
sustainability of a machining process. Also, the optimization of the machining
conditions can be very helpful in the design and development of the test-case studies
later proposed in this document. Although some of these studies propose a promising
method to measure process sustainability, they are still in a preliminary stage and do
not offer a practical model for measuring sustainability of cutting processes in
particular. However, this provides useful resources for tracking the energy
consumption of a process, which is of great interest currently and might also be
helpful in a more advanced and futuristic model of sustainability assessment
mechanisms. In addition to energy and time consumed, the cost of different sections
appears to be a good comparative metric for the sustainability calculator. Tool cost
and tool life are very important in this regard. It is also seen that during the life cycle

29
of a product, the manufacturing phase, or the use phase of the machine tool, is very
important and needs to be studied. It is important to note that the metrics selection or
building process proposed in the literature is very significant to the approach that shall
be adopted for the study at hand. Taking out the ones which are not directly related to
the area of focus for sustainability in this study, the rest of the approach is discussed
further.
Creating a list of ―reference metrics‖ by reviewing the work that has been done by
others.
Considering additional metrics that are considered important from any
perspective.
Examining all the proposed metrics and then coming up with a list that evaluates
all major aspects of sustainability to a reasonable extent with completeness and
coherence.
Specifying the detail of what must be measured and how so that meaningful
numbers are achieved that can be compared with some standard or existing work,
if possible.
Devising a way to normalize the measured quantities so that indexes are
independent actual process parameter quantities.
The review also provides a basis for developing test-case studies for sustainable
machining processes. It appears that vegetable oil lubrication and cryogenic
machining are also good techniques to be tested in case studies. The performance
measures adopted are very useful to be added and compared with our general pool of
sustainability indices at the end of this literature review. Thus it could be seen in the
end that a set of designed experiments has to be conducted to analyze the machining
performance under different circumstances from a sustainability perspective. The
sustainability calculator will be used to help predict the results and try to develop
practical compatibility for the calculator.

30
1.3 Research Methodology
The technical approach to achieve the aforementioned objectives was developed in a
step-by-step manner. Different activities were segregated into project phases to enable
parallel commencement. The project outline can be described by the following
phases.
1.3.1 Phase-I: Literature Survey
A literature survey on metrics and methods of evaluation used to assess sustainability
of machining process is conducted. Different databases and other available resources
are tapped in order to learn about the current methods to evaluate the sustainability of
a machining process.
1.3.2 Phase-II: Analysis of Metrics
Analysis of the different metrics and methods available in the literature is conducted.
This is so that relevant metrics and methods for sustainability calculation can be
selected after agreement and a collection of general metrics and methodologies can be
created.
1.3.3 Phase-III: Selection of Metrics
In this phase a pool of metrics to be used is selected to develop the calculator. This
will be a carefully selected set of metrics out of the general collection. The metrics
selection has to be justifiable. The literature survey reveals that the energy
consumption of a manufacturing process emerges on top of time, cost and quality as a
very important metric of sustainability. It can later contribute in many ways, like
being incorporated in CAPP (computer-aided planning), asset management, and most
importantly in environment burden assessment and productivity. In addition to energy
and time consumed, the cost of different sections appears to be a good comparative
metric for the sustainability calculator. Tool cost and tool life are very important in
this regard. Since metric selection (building process) is very important, only those
metrics which are directly related to the areas of focus in sustainability would be
chosen from the literature.
31
Phase-IV: Developing the Calculator
Using and building upon the data extracted from previous phases, the sustainability
calculator will be developed taking into consideration a selected set of generic input
parameters and evaluating response indicators. This will enable us to rate a given
process in terms of sustainability. It is to be noted that as soon as certain metrics are
agreed upon, the structure development of the calculator shall start. While the review
is still under progress, changes shall then be made as and when required.
Phase-V: Test Case-studies / Experimental work
The design of experiments is used to develop a test matrix to collect the needed data.
The test matrix is a set of designed experiments through the prevalent DoE techniques
that study the output responses like the material removal rate, cutting time, surface
quality, dimensional accuracy, tool wear etc. through standard input machining
parameters like cutting speed, feed rate, depth of cut etc. under different scenarios that
involve either variations in the cooling method (dry cutting/MQL/ cryogenic) or
cutting tool materials. The idea is to get output responses, evaluate them against
sustainability responses like energy consumption, carbon emission, cost etc. of the
processes, and then analyze the system using our proposed sustainability indicators
and check how well they portray the sustainability status of the scenario in the light of
the literature survey.
The activity involves using the LCA sustainability calculator for the machining phase.
One shall be able to check the compatibility of the sustainability indicators calculated
solely from the calculator and those that are based on measured response values,
which are input into the calculator directly. Finally, recommendations for further
enhancement of the calculator can be made along with an analysis of the effectiveness
of the selected sustainability metrics.
Phase-VI: Process evaluation, Debugging and Reviewing
In light of the case study evaluation and results, the proposed and agreed upon
changes in the calculator will be made and if necessary, further test runs may be
performed so that a finalized format and structure is achieved. The calculator should
then be able to rate a process and be helpful for recommending improvements or
verifying the recommended improvements.

32
2. Measuring Machining Process Sustainability
Machining is a collection of metal removal processes in which power-driven
machine tools, such as lathes, milling machines, and drill presses, are used with a
sharp cutting tool to mechanically cut the material to achieve the desired geometry by
straining the material to fracture and by thermal evaporation. Machining is a part of
the manufacture of almost all metal products, and it is common for other materials,
such as wood and plastic, to be machined. The precise meaning of the term
"machining" has evolved over the past 1.5 centuries as technology has advanced.
During the Machine Age, it referred to the "traditional" machining processes, such as
turning, boring, drilling, milling, broaching, sawing, shaping, planing, reaming, and
tapping, or sometimes grinding. Since the advent of new technologies such as
electrical discharge machining, electrochemical machining, electron beam machining,
photochemical machining, and ultrasonic machining, the retronym "conventional
machining" can be used to differentiate the classic technologies from the newer ones
[44],[45],
While the word ―sustainability‖ usually refers to keeping in existence or
maintaining, the United Nations‘ Brundtland Commission defines sustainability as:
―Development that meets the needs of the present without compromising the
ability of future generations to meet their own needs.‖
Fig. 1 Basic Elements of Sustainable Machining. [11]
Machining Cost
Environmental Friendliness
Sustainable Machining
Process
Power Consumption
Waste Management
Operational Safety
Personnel Health
Waste Management

33
It was established through the literature review that for a process to be deemed
‗sustainable‘, it should have less environmental burden, be positive for the society and
be economically sound. This is often shown as the elements of sustainable machining
shown in Fig. 1. But for knowing about the extent of sustainability a process
possesses, it is necessary to rate it. However, rating a system for sustainability can be
quite cumbersome. Thus a set of limited metrics is required that can cover the diverse
aspects of sustainability as much as possible and enable informed decision making for
the product or process design engineers. The importance of rating the machining
processes in this regard can be hardly over-stressed [1]–[5].
Thus the approach developed includes creating a list of ―reference metrics‖ by
reviewing the literature and considering additional metrics while examining all the
proposed metrics. This also includes the details of what must be measured and
devising a way to normalize the measured quantities so that indexes are independent
of process types. In the end it was observed through the literature review that the
energy consumption of a manufacturing process emerges on top of time, cost and
quality as a very important metric of sustainability. In addition to energy and time
consumed, the cost of different sections appears to be a good comparative metric and
cost and tool life are very important in this regard. It is also seen that during the life
cycle of a product, the manufacturing phase, or the use phase of the machine tool, is
very important and needs to be studied.
2.1 Sustainability Metrics: The XSI-Approach
While the sustainability concept emphasizes a holistic and synergistic approach
through techniques like LCA of a product, meaningful results cannot be achieved
unless phases like machining are rated for sustainability in detail. The machine tool
scale is one level in the scope of analyzing sustainability [46]. Open literature sources
reveal that the machining sector needs not just one but a set of flexible, easy-to-use
and meaningful sustainability indicators.
These indices should not only cover different perspectives for sustainability (e.g.,
coolant use, machining cost, energy consumed, CO2 emission, etc.) but also the
features of interest for the organization doing the production (material removal rate,

34
MRR, surface roughness, etc.). To develop the metrics with such qualities, an XSI-
approach is proposed, where X represents a given perspective for sustainability. To
achieve flexibility for comparison of various processes, the concept of normalization
is introduced [47], [48]. Hence a quantity like the environmental burden of machining
(kgCO2), can be divided by a feature of interest like MRR, to become the Carbon
Sustainability Index (CSI) which can be used to rate both turning and milling
processes. Similarly, the Financial Sustainability Index (FSI) and Energy
Sustainability Index (ESI) can be calculated. Such a set of indices can give insight
regarding process and parameter selection in a quantitative manner.
The material indices development process for material selection using
performance equations can be very helpful in this regard [49], [50]. In fact, the
proposed XSI approach is very similar to the latter. It appears that by taking
inspiration from the material indices, the normalized values should be inversed when
required. This would present a ―the higher the better‖ scenario for quantities that we
want to minimize. Thus the results will be easier to interpret. In later case studies, a
demonstration of this concept is presented.

35
3. Development of the Sustainability Calculator
As mentioned in the research methodology, the next step after reviewing the
sustainability indicators is the development of a sustainability calculator based on the
proposed XSI approach. This calculator would not only be a tool for rating the
sustainability of machining processes individually but would also be able to
contribute to the LCA of a certain product. Hence whether a product made by
machining is under examination of its ―manufacturing‖ phase or a machine tool is
reviewed for its ―use‖ phase, this tool shall find its application. The developed
sustainability calculator uses the selected sustainability indicators to evaluate a
process. The calculator uses the idea of using emission intensities for evaluating
environmental burden for electricity consumption and coolant usage as done by Narita
et al. [13]. It also shows the material removal rate and the cost of machining. The
values thus found after taking different factors into account are then normalized by
the material removal so that a uniform application for all conventional processes is
ensured for the calculator. Thus a set of new sustainability indices or metrics is
proposed.
The calculator uses the user-defined input parameter values to calculate different
quantities related to machining like the material removal rate, the energy consumed
and the amount of coolant used. These values are taken as intermediate values and are
then further converted into a set of proposed forms of selected sustainability
indicators. These include values like the Energy Sustainability Index (ESI), the
Financial Sustainability Index (FSI), the Environmental Sustainability Index (EnSI)
and the Coolant Sustainability Index (CoSI). The proposed form is the normalization
with the feature of interest, which in this case is the material removal.
The environmental burden of different segments of the machining process under study
is used by the multiplication of the quantity of the resource used with its respective
emission intensity. The set of emission intensity values, based on a Japanese energy
mix and used in the calculator for rating purposes, is given in Table 2 [13].

36
Table 2 Emission Intensities [13]
Electricity (kg-CO2/kWh) 0.381
Cutting fluid production(kg-CO2/L) 0.469
Cutting fluid disposal, water-miscible cutting fluid; type A1 (kg-CO2/L)
3.782
Cutting fluid disposal, water-miscible cutting fluid; type A2 (kg-CO2/L)
5.143
Cutting fluid disposal, water-miscible cutting fluid; type A3 (kg-CO2/L)
8.103
Cutting fluid disposal, distilling and condensing process (kg-CO2/L)
3.425
Cutting fluid disposal, water-insoluble cutting fluid; normal (kg-CO2/L)
2.555
Cutting fluid disposal, water-insoluble cutting fluid; thermal recycle (kg-CO2/L)
1.778
Cutting fluid disposal, water-insoluble cutting fluid; material recycle (kg-CO2/L)
0.261
Dilution fluid, water (kg-CO2/L) 0.189
Spindle and slideway lubricant oil production (kg-CO2/L)
0.469
Spindle and slideway lubricant oil disposal (kg-CO2/L)
0.0029
Cutting tool production (kg-CO2/kg) 33.7478
Cutting tool disposal(kg-CO2/kg) 0.01346
Re-grinding (kg-CO2/number) 0.0184
Metal chip processing (kg-CO2/kg) 0.0634
A first version of the calculator was developed using Microsoft Excel, which covers
the set of values being input, the response quantities and the sustainability indices
calculated from them. Later on a user-friendly Graphical User Interface (GUI) was
developed using Visual Basic Studios and .Net code. Efforts then commenced to
develop a more inter-active, user-friendly and flexible module using MATLAB. The
environmental burden was calculated using the emission intensities provided in [13]
and [51]. Also, the costs of machining were based on the UAE tool market and [52].
The process details were given as a set of input parameters. The calculator computes
the energy consumption through empirical formulas and evaluation of the tool path
from the NC-code along with idle-power considerations [53]. Together the set of

37
input parameters and output responses yield the sustainability indices, thus rating the
process. Figure 2-5 depicts various versions of the calculator.
Inputs
Outputs
Fig. 2 Sustainability calculator: Excel format

38
In itself, the sustainability calculator shall be able to predict the implications of using
a specific machine setting using a set of particular machining parameters and cutting
scenarios along with cooling configurations on the sustainability of the machining
process. Thus it will be providing the user with important information about the
feasibility of the process from different perspectives. This information shall be useful
in evaluating the machining phase of the life cycle of a product hence making this
calculator an LCA support tool. Although different in the method of evaluation and
usage, it takes part of its inspiration from virtual machining models for sustainability
analysis and financial models for GHG emissions proposed earlier [54],[55].
Fig. 3 MATLAB-GUI, first-look.

39
Fig. 4 MATLAB-GUI, later versions.

40
Fig
. 5 M
AT
LA
B-G
UI,
fin
al
ver
sion
.

41
4. Turning of Titanium Alloy Ti-6Al-4V
4.1 Titanium Alloy Ti-6Al-4V
Titanium has become a very important material in manufacturing these days because
of its high strength-to-weight ratio in addition to its characteristic corrosion resistance
which is highly reliable in various fields of application. The use of titanium brings
with it durability, reliability and economic feasibility in industry applications.
Especially in fields like the aerospace or automotive industry, along with surgical
procedures where very highly reliable equipment is required, titanium turns out to be
very useful. Other applications of a similar scale are also found in the oil and gas
sector, industries like competitive sports goods manufacturing, chemical industry
facilities and power plants. In the majority of these and other engineering applications
titanium has replaced heavier, less serviceable or less cost-effective materials. Today
various grades of titanium are available in the market offering a range of desired
characteristics. Titanium alloys like Ti-6Al-4V offer better strength than pure titanium
[56], [57].
Due to its excellent machinability and mechanical properties, Ti-6Al-4V is today the
titanium alloy that finds its application most widely in various fields. It offers very
good bio-compatibility in bone and tissue contact scenarios. For different cases where
the reduction of weight is the area of focus, it is very useful in the marine, aerospace
and automotive industry. Products as varied as gas turbines, biomechanical implants,
prototypes and components for the racing industry find Ti-6Al-4V particularly useful.
Mechanical properties of Ti-6Al-4V are given in Table 3 [56].
Table 3 Mechanical Properties of Ti-6Al-4V [56]
Ultimate Tensile Strength 1050 MPa
Fatigue Strength @600 MPa 100000 cycles
Rockwell hardness 33 HRC
Modulus of Elasticity 120 GPa
42
Due to the earlier established importance of titanium and its alloy Ti6Al4V, the
importance of machining titanium is also significant. This is why this area is being
researched across the globe and is the focus of this study. The study of assessing
sustainability in turning titanium is divided into two sections. The first study includes
the use of conventional and sustainable cooling and machining strategies varying
many parameters involved. The second study focused on comparing environmentally-
benign cooling strategies with a limited variation of other parameters.
4.2 Comparison of coolant and machining strategies’ impact on
machinability of titanium alloy Ti6Al4V
The first set of experiments was focused on comparing the effect of a coolant on the
machinability of Ti6Al4V. The test matrix was a set of experiments designed through
a prevalent DoE technique that studies output responses like the Material Removal
Rate, Cutting Time, Surface Quality, Dimensional Accuracy, Tool Wear, etc. through
standard input machining parameters like cutting speed, feed rate, depth of cut, etc.
under different scenarios that involve either variations in the cooling method (dry
cutting/MQL/cryogenic) or tool materials of different kinds. The idea is to get output
responses, evaluate them against sustainability responses like energy consumption,
carbon emission, cost, etc. of the processes, and then analyze the system using our
proposed sustainability indicators and check how well they portray the sustainability
status of the scenario in light of the literature survey.
The sustainability calculator designed for the machining phase shall be able to check
the effectiveness of the calculator. While the hybrid machining scenario could be
compared with conventional method without the indicators, the conventional process
settings are to be evaluated separately, in terms of the indicators. Finally,
recommendations for additions or subtractions for the calculator can be made along
with an analysis of the effectiveness of the selected sustainability metrics.
To develop the test matrix a set of input factors for the Design of Experiments
procedure was selected. These factors included the cutting speed, feed rate, the type of
lubrication applied and the type of tool used. Against a combination of these factors, a
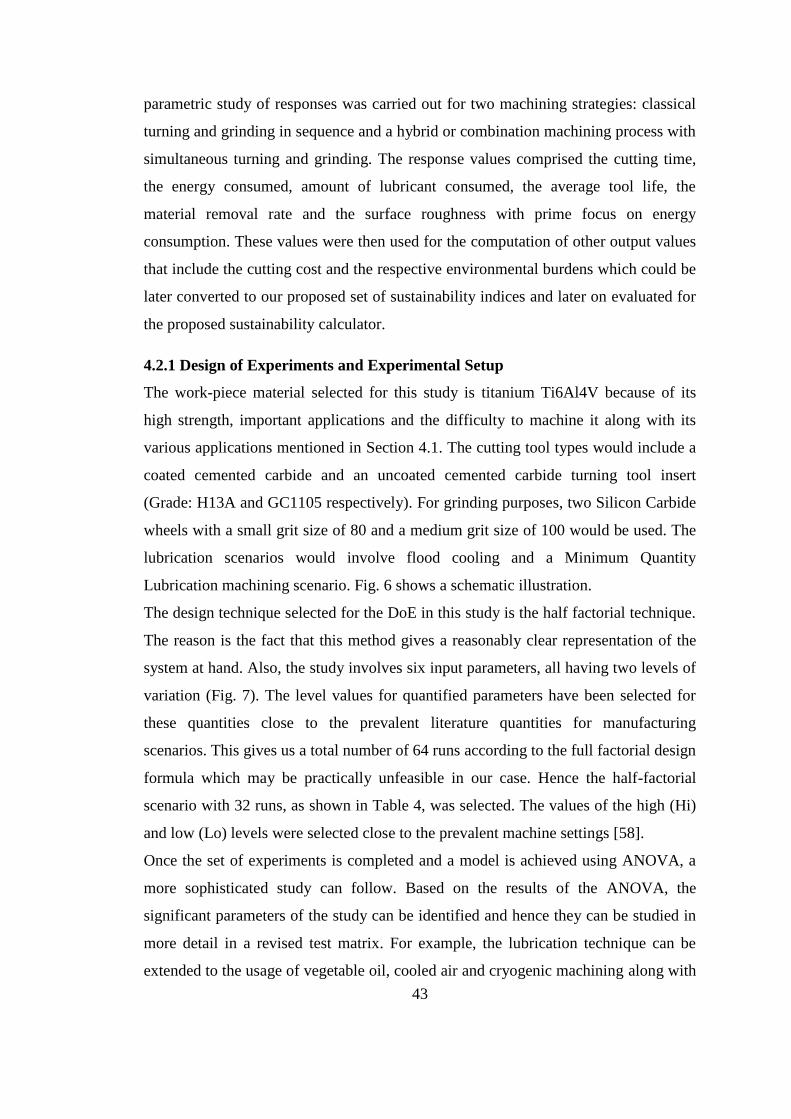
43
parametric study of responses was carried out for two machining strategies: classical
turning and grinding in sequence and a hybrid or combination machining process with
simultaneous turning and grinding. The response values comprised the cutting time,
the energy consumed, amount of lubricant consumed, the average tool life, the
material removal rate and the surface roughness with prime focus on energy
consumption. These values were then used for the computation of other output values
that include the cutting cost and the respective environmental burdens which could be
later converted to our proposed set of sustainability indices and later on evaluated for
the proposed sustainability calculator.
4.2.1 Design of Experiments and Experimental Setup
The work-piece material selected for this study is titanium Ti6Al4V because of its
high strength, important applications and the difficulty to machine it along with its
various applications mentioned in Section 4.1. The cutting tool types would include a
coated cemented carbide and an uncoated cemented carbide turning tool insert
(Grade: H13A and GC1105 respectively). For grinding purposes, two Silicon Carbide
wheels with a small grit size of 80 and a medium grit size of 100 would be used. The
lubrication scenarios would involve flood cooling and a Minimum Quantity
Lubrication machining scenario. Fig. 6 shows a schematic illustration.
The design technique selected for the DoE in this study is the half factorial technique.
The reason is the fact that this method gives a reasonably clear representation of the
system at hand. Also, the study involves six input parameters, all having two levels of
variation (Fig. 7). The level values for quantified parameters have been selected for
these quantities close to the prevalent literature quantities for manufacturing
scenarios. This gives us a total number of 64 runs according to the full factorial design
formula which may be practically unfeasible in our case. Hence the half-factorial
scenario with 32 runs, as shown in Table 4, was selected. The values of the high (Hi)
and low (Lo) levels were selected close to the prevalent machine settings [58].
Once the set of experiments is completed and a model is achieved using ANOVA, a
more sophisticated study can follow. Based on the results of the ANOVA, the
significant parameters of the study can be identified and hence they can be studied in
more detail in a revised test matrix. For example, the lubrication technique can be
extended to the usage of vegetable oil, cooled air and cryogenic machining along with
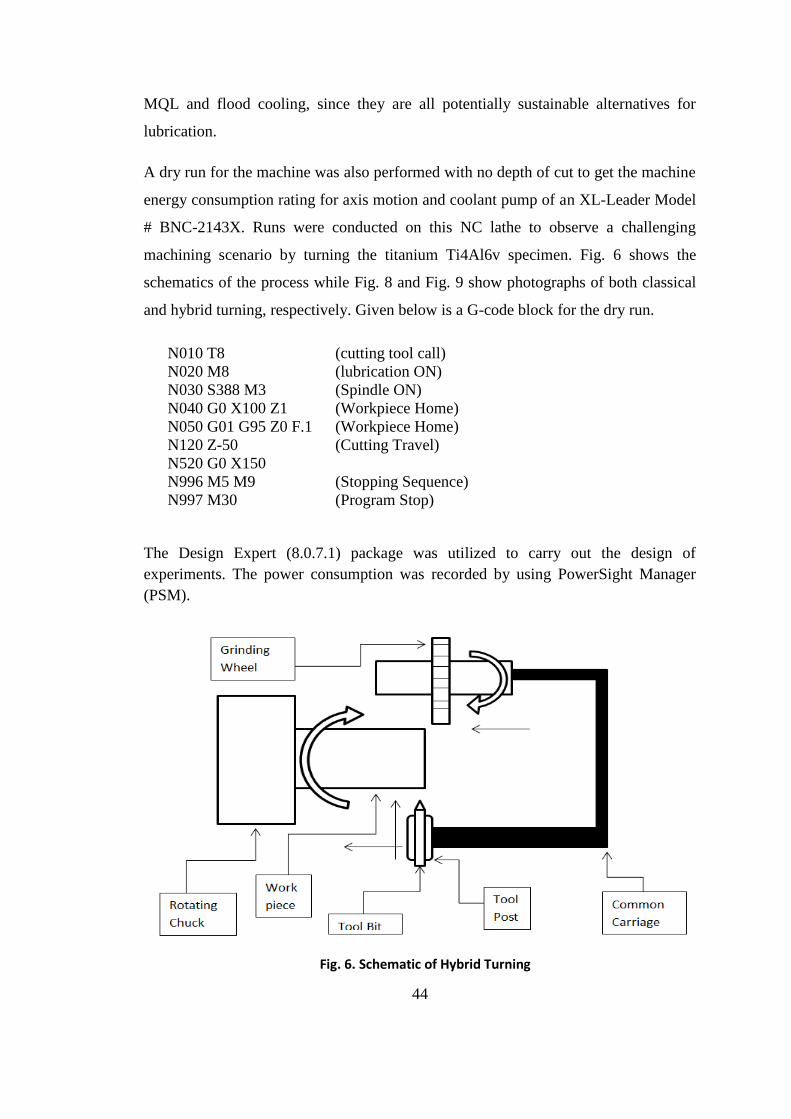
44
MQL and flood cooling, since they are all potentially sustainable alternatives for
lubrication.
A dry run for the machine was also performed with no depth of cut to get the machine
energy consumption rating for axis motion and coolant pump of an XL-Leader Model
# BNC-2143X. Runs were conducted on this NC lathe to observe a challenging
machining scenario by turning the titanium Ti4Al6v specimen. Fig. 6 shows the
schematics of the process while Fig. 8 and Fig. 9 show photographs of both classical
and hybrid turning, respectively. Given below is a G-code block for the dry run.
N010 T8 (cutting tool call)
N020 M8 (lubrication ON)
N030 S388 M3 (Spindle ON)
N040 G0 X100 Z1 (Workpiece Home)
N050 G01 G95 Z0 F.1 (Workpiece Home)
N120 Z-50 (Cutting Travel)
N520 G0 X150
N996 M5 M9 (Stopping Sequence)
N997 M30 (Program Stop)
The Design Expert (8.0.7.1) package was utilized to carry out the design of
experiments. The power consumption was recorded by using PowerSight Manager
(PSM).
Fig. 6. Schematic of Hybrid Turning

45
Fig. 7. Design of Experiments Framework for First Set of experiments.
Design of Experiments (DOE)
Cutting Speed
Level-1 Level-2
Feed Rate
Level-1 Level-2
Lubrication Technique
Level-1 Level-2
Cutting Tool M/t
Level-1 Level-2
Grinding Wheel
Level-1 Level-2
Machining Strategy
Level-1 Level-2
ENERGY CONSUMED
Cutting Time
Lubricant Used
MRR
Surface Roughness
Tool Life
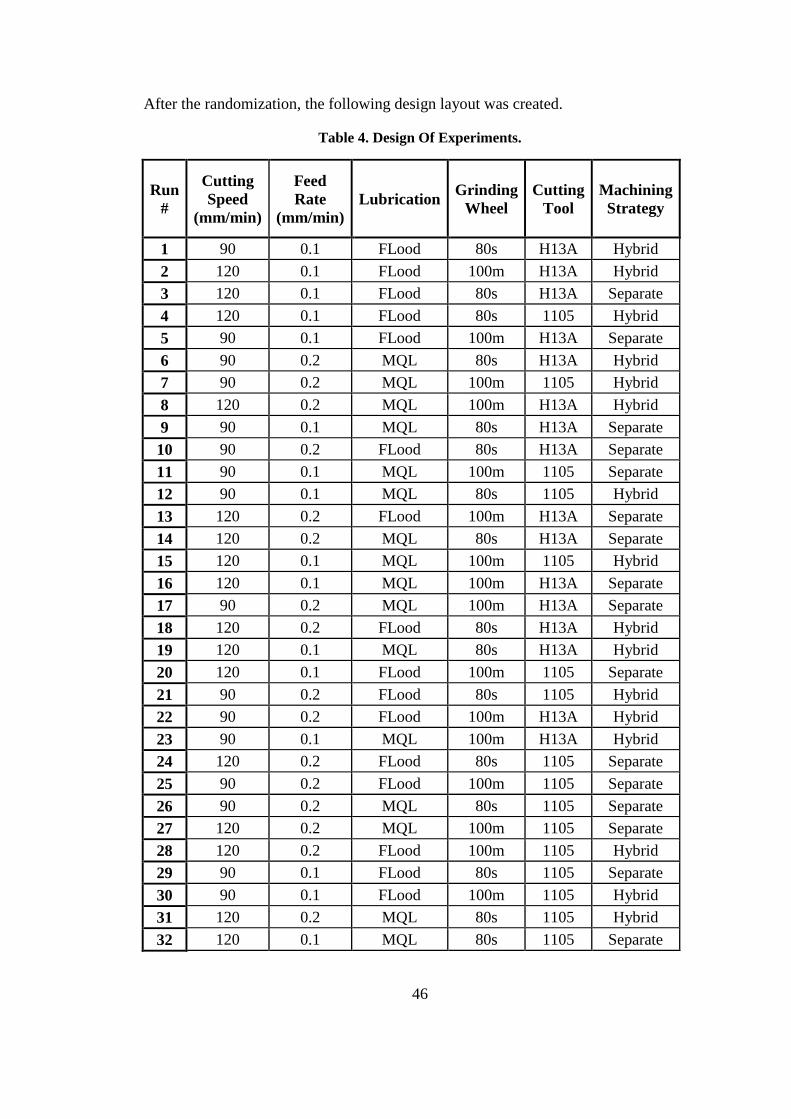
46
After the randomization, the following design layout was created.
Table 4. Design Of Experiments.
Run
#
Cutting
Speed
(mm/min)
Feed
Rate
(mm/min)
Lubrication Grinding
Wheel
Cutting
Tool
Machining
Strategy
1 90 0.1 FLood 80s H13A Hybrid
2 120 0.1 FLood 100m H13A Hybrid
3 120 0.1 FLood 80s H13A Separate
4 120 0.1 FLood 80s 1105 Hybrid
5 90 0.1 FLood 100m H13A Separate
6 90 0.2 MQL 80s H13A Hybrid
7 90 0.2 MQL 100m 1105 Hybrid
8 120 0.2 MQL 100m H13A Hybrid
9 90 0.1 MQL 80s H13A Separate
10 90 0.2 FLood 80s H13A Separate
11 90 0.1 MQL 100m 1105 Separate
12 90 0.1 MQL 80s 1105 Hybrid
13 120 0.2 FLood 100m H13A Separate
14 120 0.2 MQL 80s H13A Separate
15 120 0.1 MQL 100m 1105 Hybrid
16 120 0.1 MQL 100m H13A Separate
17 90 0.2 MQL 100m H13A Separate
18 120 0.2 FLood 80s H13A Hybrid
19 120 0.1 MQL 80s H13A Hybrid
20 120 0.1 FLood 100m 1105 Separate
21 90 0.2 FLood 80s 1105 Hybrid
22 90 0.2 FLood 100m H13A Hybrid
23 90 0.1 MQL 100m H13A Hybrid
24 120 0.2 FLood 80s 1105 Separate
25 90 0.2 FLood 100m 1105 Separate
26 90 0.2 MQL 80s 1105 Separate
27 120 0.2 MQL 100m 1105 Separate
28 120 0.2 FLood 100m 1105 Hybrid
29 90 0.1 FLood 80s 1105 Separate
30 90 0.1 FLood 100m 1105 Hybrid
31 120 0.2 MQL 80s 1105 Hybrid
32 120 0.1 MQL 80s 1105 Separate

47
Fig.8 Sequential/Conventional turning and grinding.
Fig.9 Hybrid turning and grinding.
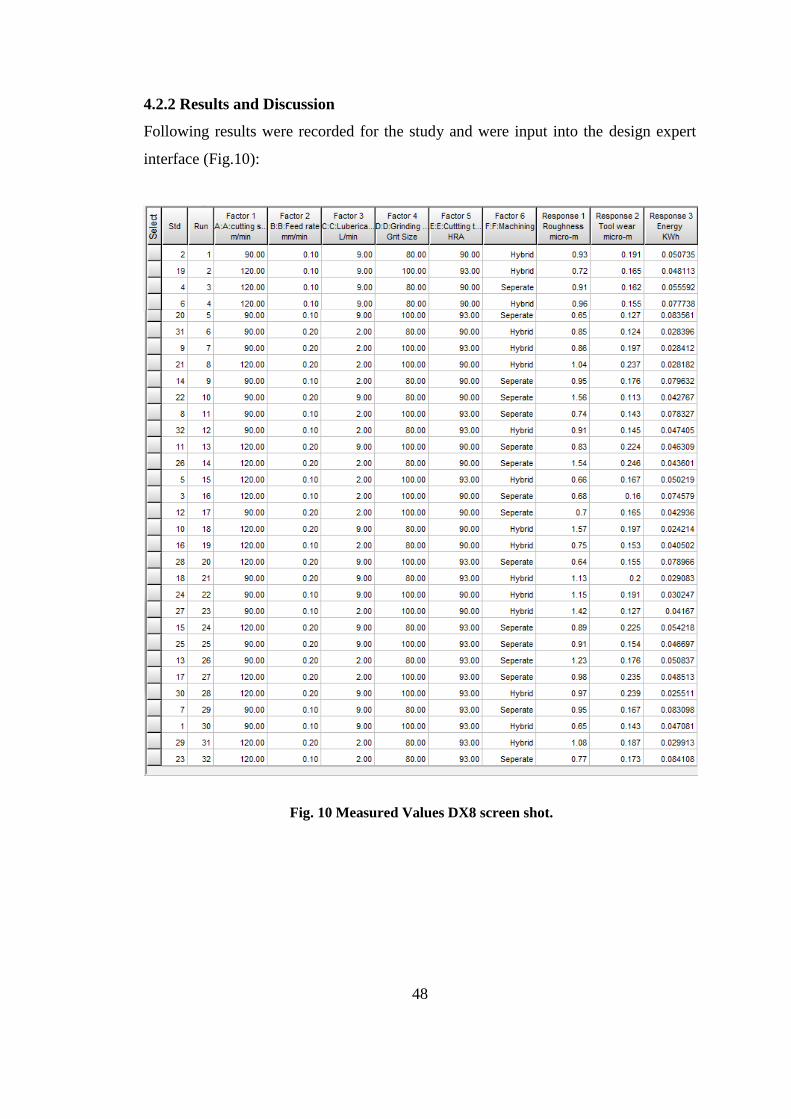
48
4.2.2 Results and Discussion
Following results were recorded for the study and were input into the design expert
interface (Fig.10):
Fig. 10 Measured Values DX8 screen shot.

49
The performance of ANOVA resulted in mathematical models for prediction of tool
wear, surface roughness and energy consumption in coded factors (See Appendix-B).
Separate un-coded models were also developed for the conventional and hybrid
settings. It turned out that for roughness the two most significant parameters were
feed and type of grinding wheel. For tool wear the feed and cutting speed and for
energy consumption feed and machining technique were significant parameters. The
lubrication technique was also significant for surface roughness and tool wear. The
predicted values of the models matched the measured value to a fair extent where the
maximum deviation (18 percent) occurred in only one case with the rest averaging 10
percent. The models can thus be optimized for each single output response. However,
a combined optimized setting with maximum desirability for all responses is shown in
Fig. 11.
The first six blocks on the top represent the input factors with their low and high
levels, on the left and right respectively, of the elevated line in each block. The red
pointers show the recommended optimized value of that factor. So, the optimized
cutting speed is 90 m/min, feed is 0.1mm/rev and controlled lubrication of 2liter/min
with grinding wheel of higher grit size. The recommended cutting tool is the uncoated
carbide insert and the strategy for machining is hybrid. The lower three blocks
Fig. 11 Optimized setting of cutting speed, feed rate, wheel type, insert type and
lubrication and machining strategies achieved using DX8 optimizer giving best surface
roughness, tool wear and energy consumption.

50
represent the resulting output responses and the blue pointers to the left in each block
show that all are at their low, optimized values. Hence the study confirms hybrid
machining, along with controlled lubrication at a much lower flow rate instead of
flood, as a viable machining strategy for sustainable output in terms of minimized tool
wear, surface roughness and energy consumption. More on the details of this
particular case study and prospective research for hybrid machining as a sustainable
strategy will be discussed elsewhere.
4.2.3 Using the Sustainability Calculator
The evaluation of the grinding process in both strategies using the calculator would
require a lot of input details and thus become quite user-―unfriendly‘. Also, this being
a pilot study, not a lot of machinability details has been accommodated in the
calculator like tool type, tool wear, surface roughness and grit size. Thus for practical
reasons and stand-alone assessment, only the turning process was rated by the
calculator. The feature of interest in focus for the calculator is the material removal
rate (MRR). Hence, the grinding wheel, tool type and machining strategy parameters
are struck out and the following out of our previously conducted DoE are extracted as
shown in Table 5.
Table 5 Extracted data sets of parameter settings from DOE.
S/No. Speed
(m/min)
Feed
(mm/rev)
Lubrication
(Litre/min)
1 120 0.1 9
2 90 0.1 9
3 90 0.1 2
4 120 0.2 2
5 120 0.1 2
6 90 0.2 2
7 120 0.2 9
8 90 0.2 9

51
After this, all the parameter setting blocks were input into the calculator. The
process type was selected to turning. A simplistic G-code file for the given tool-path
was also uploaded into the calculator so that the dry-run energy could also be
calculated using the motor-ratings of the machine. Thus the energy consumption is
calculated in three sections,
(1)
Given below are some basic formulas used for turning scenarios [59],
(2)
(3)
Following is the basic equation used to calculate the sustainability indices,
(4)
For the process at hand the four settings with a cutting speed of 120 m/min or 90
m/min and feed rate of 0.1 mm/rev gave energy consumption values close to 0.03
kWh, while the other four settings with a feed rate of 0.2 mm/rev returned energy
consumption values close to 0.02 kWh.
0
2
4
6
8
10
12
1 2 3 4 5 6 7 8
ESI
CSI
FSI
Parameter Setting #
Fig. 12 Sustainability indicators for all parameter settings.

52
As mentioned before, the resulting energy and coolant consumption were
converted into their corresponding environmental burdens. These values, along with
the cost of machining, were then divided by the process MRR and scaled to make
them presentable in terms of position of the decimal point. These values are now
comparable with not only themselves, but with values resulting from another
processes, e.g. milling. The results of the calculator were also fairly close to these
measured values. The less or more value of coolant consumption didn‘t have much
effect on energy. But it has a significant effect on environmental burden. After
conversion of these quantities the lowest value for all indices were at setting#4 with
an MRR of 9600 mm3/min when ESI=0.4771, for CSI=0.3271 and FSI=2.0 thus
resulting in the most sustainable of all eight settings in terms of cost, environmental
burden and production rate, all together. It can be seen in Fig.12 that parameter setting
2 and 3 both have the same FSI; however, the CSI value of setting 2 is much higher
than 3. Thus the rating system identifies the more sustainable setting, which is 3, even
when the cost effectiveness of the two processes is the same. It is visible that although
the tooling costs were same for each process and single part production yielded very
small energy consumption costs, the FSI still had an important role in the decision
making process.
Now the concept of Chapter 2 is applied in Fig.13 where the inverse values of the
same data points in Fig.12 are plotted. Now it can be seen that the same results are
obtained, i.e. setting no.4 is still the most sustainable. However, the presentation is
clearer than before. Hence the higher the value of an index, the better it is.
Figure 13 'The higher the better' approach.
0
1
2
3
4
5
6
1 2 3 4 5 6 7 8 9
ESI
CSI
FSI

53
Hence a more elaborate way of interpreting the phenomenon of sustainability was
proposed. Using the proposed approach a set of practical cases of machining were
studied and the resulting set of indices provided an all-inclusive evaluation of process
sustainability. A clear breakdown of energy consumption was presented based on
actual tool path evaluation. It is important to note that the idea of utilizing the ‗feature
of interest‘ can be extended to other outputs of the machining process like surface
quality, tool life and wear. If a decreasing feature of interest is desirable, e.g. tool
wear, then the high values of indices represent the best results. Moreover, if the
design space for parameter selection and/or the desired ‗level‘ of sustainability is
known, then the sustainability indices and the feature of interest can themselves be
normalized for even clearer representation of the system. It is important to note that
the lubrication for machining turns out to be a very important parameter. This can be
seen not only from the ANOVA results, but also from the CSI value of the parameter
settings under study. The importance of the lubrication technique becomes even more
evident if the cost of lubrication is taken into account. Therefore, it appears advisable
to further investigate various lubrication techniques and evaluate their effect on
process sustainability. More research and validation through case studies can follow,
with more precise energy and cost measurement models and techniques, to realize the
goal of easy and practical sustainability assessment of machining processes. Fig.14
shows a power consumption graph obtained using PSM.
Fig. 14 PowerSight Manager Graph for a run.

54
4.3 Comparison of environmentally benign cooling strategies
This case study is an extension of the previous study with necessary amendments.
Establishing the need of focus and leaving out the extra details, we now shall be more
interested in the lubrication techniques while using a specific cutting tool insert and
feed and speed levels. Our prime interest, like before, is to evaluate the techniques
which are dubbed ‗sustainable‘, like the vegetable oil lubrication, in terms of their
performance against surface roughness, tool wear and power consumption.
4.3.1 Design of Experiments and Experimental Setup
Again, the Design Expert (8.0.7.1) package was utilized to carry out the design of the
experiments. A total of 72 randomized runs were designed with a variation of
parameters. These runs include three blocks for replicating the results of the actual set
of 24 runs for satisfaction and surety in the results (Table.6). The six cooling
strategies were analyzed against a mix of the Hi and Lo levels of cutting speed and
feed, which have been selected close to the prevalent machine settings[58]. Fig.15
shows the DOE framework.
The results section includes the measuring of flank tool wear (Vb) and average
surface roughness (Ra) along with the energy consumption of the process. The power
consumption would be recorded by using PowerSight Manager (PSM) to be later on
converted into energy consumption.
The flood cooling is provided using an external setup for pumping with a flow-rate of
9 liter/min. For the administration of the MQL and MQCL using vegetable oil, a
stand-alone booster system is installed on the machine tool. A nominal oil flow rate of
2.8 ml/min is to be supplied by the booster pump. The vegetable oil used by this setup
is ECOLUBRIC E200, a cold-pressed rapeseed oil type without additives.
Manufactured according to the Swedish National Food Administration regulations, it
consists of biodegradable substances and is deemed fit for industrial use. The oil is
declared environmentally harmless and has a biodegradability of 90% in 28 days [60].
Figures 16 and 17 show the photographic and schematic illustrations of the
experimental set up respectively.
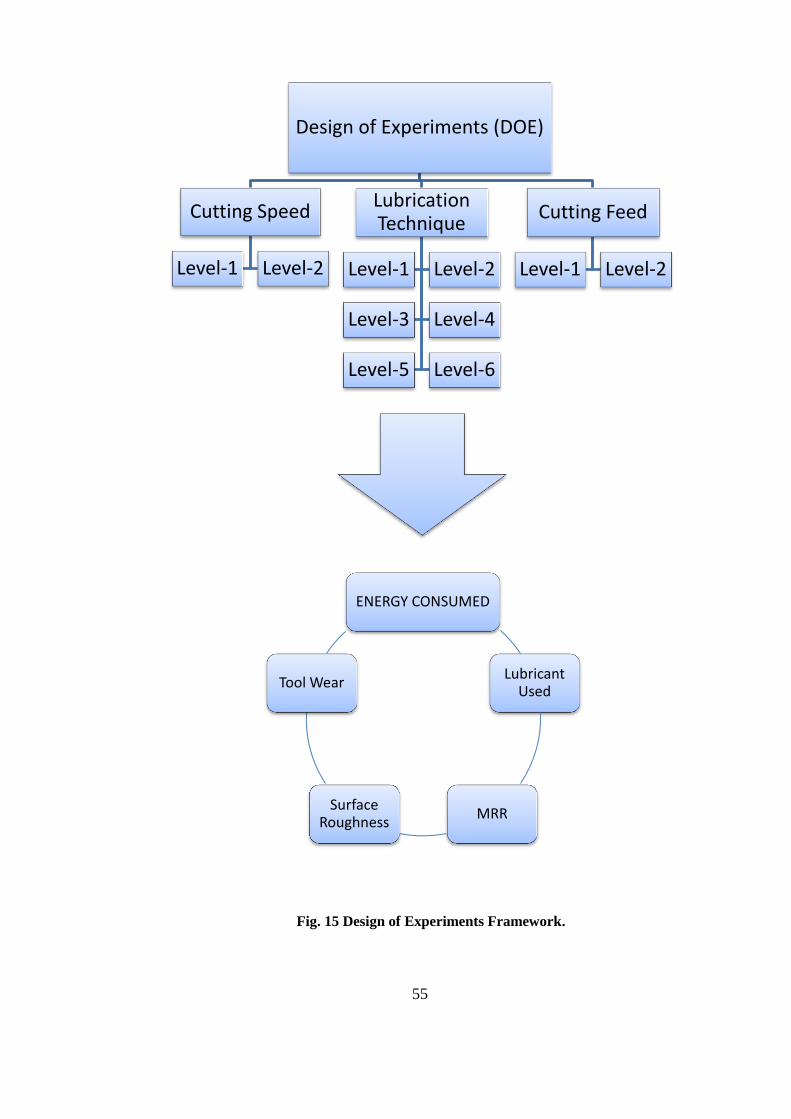
55
Design of Experiments (DOE)
Cutting Speed
Level-1 Level-2
Lubrication Technique
Level-1 Level-2
Level-3 Level-4
Level-5 Level-6
Cutting Feed
Level-1 Level-2
ENERGY CONSUMED
Lubricant Used
MRR Surface
Roughness
Tool Wear
Fig. 15 Design of Experiments Framework.
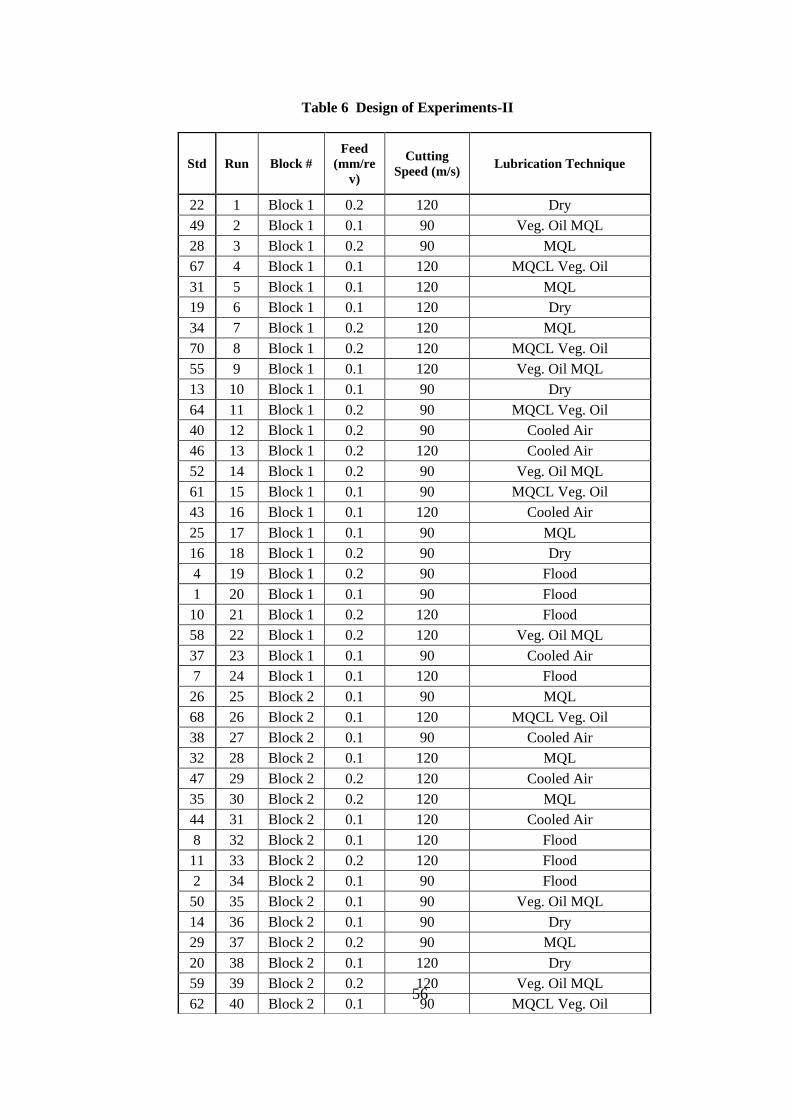
56
Std Run Block #
Feed
(mm/re
v)
Cutting
Speed (m/s) Lubrication Technique
22 1 Block 1 0.2 120 Dry
49 2 Block 1 0.1 90 Veg. Oil MQL
28 3 Block 1 0.2 90 MQL
67 4 Block 1 0.1 120 MQCL Veg. Oil
31 5 Block 1 0.1 120 MQL
19 6 Block 1 0.1 120 Dry
34 7 Block 1 0.2 120 MQL
70 8 Block 1 0.2 120 MQCL Veg. Oil
55 9 Block 1 0.1 120 Veg. Oil MQL
13 10 Block 1 0.1 90 Dry
64 11 Block 1 0.2 90 MQCL Veg. Oil
40 12 Block 1 0.2 90 Cooled Air
46 13 Block 1 0.2 120 Cooled Air
52 14 Block 1 0.2 90 Veg. Oil MQL
61 15 Block 1 0.1 90 MQCL Veg. Oil
43 16 Block 1 0.1 120 Cooled Air
25 17 Block 1 0.1 90 MQL
16 18 Block 1 0.2 90 Dry
4 19 Block 1 0.2 90 Flood
1 20 Block 1 0.1 90 Flood
10 21 Block 1 0.2 120 Flood
58 22 Block 1 0.2 120 Veg. Oil MQL
37 23 Block 1 0.1 90 Cooled Air
7 24 Block 1 0.1 120 Flood
26 25 Block 2 0.1 90 MQL
68 26 Block 2 0.1 120 MQCL Veg. Oil
38 27 Block 2 0.1 90 Cooled Air
32 28 Block 2 0.1 120 MQL
47 29 Block 2 0.2 120 Cooled Air
35 30 Block 2 0.2 120 MQL
44 31 Block 2 0.1 120 Cooled Air
8 32 Block 2 0.1 120 Flood
11 33 Block 2 0.2 120 Flood
2 34 Block 2 0.1 90 Flood
50 35 Block 2 0.1 90 Veg. Oil MQL
14 36 Block 2 0.1 90 Dry
29 37 Block 2 0.2 90 MQL
20 38 Block 2 0.1 120 Dry
59 39 Block 2 0.2 120 Veg. Oil MQL
62 40 Block 2 0.1 90 MQCL Veg. Oil
Table 6 Design of Experiments-II

57
56 41 Block 2 0.1 120 Veg. Oil MQL
5 42 Block 2 0.2 90 Flood
41 43 Block 2 0.2 90 Cooled Air
23 44 Block 2 0.2 120 Dry
17 45 Block 2 0.2 90 Dry
53 46 Block 2 0.2 90 Veg. Oil MQL
71 47 Block 2 0.2 120 MQCL Veg. Oil
65 48 Block 2 0.2 90 MQCL Veg. Oil
36 49 Block 3 0.2 120 MQL
21 50 Block 3 0.1 120 Dry
42 51 Block 3 0.2 90 Cooled Air
15 52 Block 3 0.1 90 Dry
60 53 Block 3 0.2 120 Veg. Oil MQL
12 54 Block 3 0.2 120 Flood
63 55 Block 3 0.1 90 MQCL Veg. Oil
66 56 Block 3 0.2 90 MQCL Veg. Oil
18 57 Block 3 0.2 90 Dry
3 58 Block 3 0.1 90 Flood
9 59 Block 3 0.1 120 Flood
51 60 Block 3 0.1 90 Veg. Oil MQL
39 61 Block 3 0.1 90 Cooled Air
30 62 Block 3 0.2 90 MQL
72 63 Block 3 0.2 120 MQCL Veg. Oil
24 64 Block 3 0.2 120 Dry
27 65 Block 3 0.1 90 MQL
57 66 Block 3 0.1 120 Veg. Oil MQL
54 67 Block 3 0.2 90 Veg. Oil MQL
6 68 Block 3 0.2 90 Flood
45 69 Block 3 0.1 120 Cooled Air
33 70 Block 3 0.1 120 MQL
48 71 Block 3 0.2 120 Cooled Air
69 72 Block 3 0.1 120 MQCL Veg. Oil

58
Fig. 17 Schematic diagram of experimental setup.
Fig. 16 Eco-Lubric Booster system.

59
4.3.2 Results and Analysis:
After conducting all the 72 runs, an overall presentation of the replicated results is
given in Table 7 below.
Table 7 Measured values against replicated runs
Cutting
Feed
(mm/rev)
Cutting
Speed
(m/min)
Lubrication
Tech.
Tool
Wear
Vb
(mm)
Surface
Roughness Ra
(µm)
Energy
Consumed
(kWh)
0.1 90 Dry 0.126 0.893 0.0288
0.1 90 Veg. Oil MQL 0.101 0.91 0.0181
0.1 90 MQCL Veg. Oil 0.088 0.846 0.0298
0.1 90 Cooled Air 0.119 0.823 0.0306
0.1 90 Flood 0.104 0.833 0.0286
0.1 90 Cryogenic 0.088 1.413 0.0287
0.2 90 Dry 0.156 2.33 0.0174
0.2 90 Veg. Oil MQL 0.1623 2.253 0.0108
0.2 90 MQCL Veg. Oil 0.152 2.206 0.0175
0.2 90 Cooled Air 0.154 2.123 0.0177
0.2 90 Flood 0.118 2.286 0.0173
0.2 90 Cryogenic 0.129 1.776 0.0154
0.1 120 Dry 0.163 0.903 0.0308
0.1 120 Veg. Oil MQL 0.174 0.976 0.0123
0.1 120 MQCL Veg. Oil 0.1625 0.87 0.0246
0.1 120 Cooled Air 0.135 0.943 0.0231
0.1 120 Flood 0.119 0.753 0.0305
0.1 120 Cryogenic 0.120 0.976 0.0178
0.2 120 Dry 0.605 1.513 0.0191
0.2 120 Veg. Oil MQL 0.525 1.486 0.0081
0.2 120 MQCL Veg. Oil 0.359 1.92 0.0116
0.2 120 Cooled Air 0.402 1.605 0.0119
0.2 120 Flood 0.250 2.123 0.0182
0.2 120 Cryogenic 0.227 1.913 0.0114
It must be noted here that the number of digits after the decimal is a result of taking
the average of the replicate blocks.

60
Tool Wear
When each parameter setting comprising of high and/or low levels of cutting speed
and feed are plotted versus the lubrication techniques, the effects on the tool wear can
be seen. A closer look at each setting tells us that at low speed and feed, which is the
representative setting with the insert and the study at hand, the best performance in
terms of lowest flank wear of the tool is given by the MQCL with vegetable oil.
Fig.18 shows this behavior.
It was seen that while the flood cooling technique using a synthetic coolant yielded
the least tool wear overall, cryogenic machining was the second best and MQCL also
offered less tool wear. The use of cooled air emerges as a better alternative against dry
machining and so does MQCL with vegetable oil against MQL using the same. This
is true even though the cooled air used in this setup is not as cold and compressed as
Fig. 18 Flank tool wear at feed=0.1 mm/rev and speed = 90 m/min using
optical microscope

61
conventional air cooling systems for machining; plus the importance of nozzle
configuration cannot be neglected in this regard [28], [41], [61]. Another observation
is that unless the speed and feed are both at their Hi levels, the tool wear for all
techniques remains below or close to 0.3mm [62]. However the surge in the resulting
tool wear at the high-feed-high-speed combination suggests that perhaps this
combination is not appropriate for titanium machining using an uncoated carbide tool.
This applies to cases of techniques other than flood and cryogenic strategies and
MQCL to some extent. Fig. 19 is a bar chart showings these effects
Fig. 19 Tool Wear with lubrication techniques.
Surface Roughness
The effect of changing parameters on the surface roughness using various lubrication
techniques can be seen in Fig. 20. It can be seen that at low feeds the surface
roughness is much less and increases slightly upon using higher speed for the same
feed. Flood cooling appears to be the lubrication of choice when using low feed but
not for high feed, with cryogenic machining giving slightly better results. At high
speed, however, the use of cooled air as the lubricant emerges as the better alternative.
However, at low speed, it does not yield good surface finish [63]. It is also visible
0
0.1
0.2
0.3
0.4
0.5
0.6
0.7
f1v1 f2v1 f1v2 f2v2
Flan
k w
ear
VB (
mm
)
Parameter Settings
f1=0.1mm/rev, f2=0.2mm/rev, v1=90m/min, v2=120m/min
Dry
Veg. Oil MQL
MQCL Veg. Oil
Cooled Air
Flood
Cryogenic

62
that in low feed cases, the surface roughness achieved through all techniques is close
to each other, a trend not found at the high feed. Moreover, an important point to note
is the promise shown by both MQL and MQCL using vegetable oil overall. Referring
back to Fig. 19, it was seen that the high-feed-high-speed setting yielded very high
tool wears (above 0.4 mm) compared to other settings in some strategies. This high
wear is responsible for generating a smoother surface than the high-feed-low-speed
case while incorporating dimensional inaccuracy, which means the material removed
is reduced, as the turning progressed.
Fig. 20 Surface Roughness with Lubrication Techniques
Effect on Energy Consumption
The plot showing the effect of various lubrication techniques on cutting energy
consumption at various parameter settings is given in Fig. 21. It is clearly visible that
the MQL using vegetable oil provides the best lubrication and thus yields lesser
energy consumption for cutting. Vegetable oil MQCL also shows good results overall
again due to the good lubricity provided by it. Also, cryogenic machining closely
follows this trend except at the low feed and speed case. However, cooled air
performs better than flood and dry machining overall with dry machining as the least
suitable alternative. It is also observable that the cutting energy consumption increases
with a decrease in feed.
0
0.5
1
1.5
2
2.5
f1v1 f2v1 f1v2 f2v2
Ra
(µm
)
Parameter Settings
f1=0.1mm/rev, f2=0.2mm/rev, v1=90m/min, v2=120m/min
DryVeg. Oil MQLMQCL Veg. OilCooled AirFloodCryogenic

63
Fig. 21 Cutting Energy Consumption with Lubrication Techniques.
Looking at Figures 18, 19, 20 and 21 together tells about the overall performance of
the lubrication techniques. It can be seen that the vegetable oil MQL and MQCL
techniques provide promising results in terms of tool wear and surface roughness and
supersede the others in terms of cutting energy consumption as well. Owing to the
efficient coolant delivery and good lubricity offered in these techniques, sustainable
results like better quality of surface, less tool wear and less energy consumption are
yielded. Especially, at lower feeds and speeds, the MQCL of vegetable oil is very
promising, thus confirming that the use of vegetable oil in machining is a sustainable
practice in comparison with others. Also, the smaller wattage of the booster pump for
ECOLUBRIK is another advantage against the normally prevalent flood cooling
technique using a heavier pump. The results also show the high effectiveness of
cryogenic machining using liquid nitrogen as a highly recommendable alternative at
all the levels. However, the high cost associated with the supply of the liquid nitrogen
cooling system in comparison with the vegetable oil booster system still remains an
issue. The tradeoff appears to be in the cooling temperature where the small booster
system cannot provide temperatures as low as in cryogenic or conventional low
temperature air-cooling systems for machining.
0
0.005
0.01
0.015
0.02
0.025
0.03
0.035
f1v1 f2v1 f1v2 f2v2
Cu
ttin
g En
erg
y (k
Wh
)
Parameter Settings
f1=0.1mm/rev, f2=0.2mm/rev, v1=90m/min, v2=120m/min
DryVeg. Oil MQLMQCL Veg. OilCooled AirFloodCryogenic

64
4.3.3 Using the Sustainability Calculator
Following the methodology involved in first set of experiments, another set of
sample runs (Table 8) was separated for analysis using the sustainability calculator.
New modifications were made to account for the lubrication techniques as shown in
Fig. 22. The analysis of the second study data is discussed further. This time the
values of the sustainability indices received from the calculator were scaled and
adjusted to round numbers. This time again, it was easy to select the most suitable
parameter setting by looking at the plot in Fig. 23.
Fig. 22 Revised Calculator Interface

65
0
2
4
6
8
10
12
14
1 2 3 4 5 6 7 8
Parameter Set ID#
ESI
CSI
FSI
In this study the MQCL and MQL use vegetable oil ECOLUBRIK E200L which is a
cold pressed rapeseed oil without additives. Since vegetable oil is supposed to be an
environmentally-friendly lubricant [31], its environmental burden is taken as zero.
The same is the case with cooled air, etc. By looking at the plot in Fig.23, it can be
seen that not only is it environmentally sustainable but the related financial and
energy sustainability indices for using MQCL with vegetable oil are promising. In
fact, the most sustainable is the parameter set #2 which shows the lowest amount of
sustainability indices.
Table 8 Test Matrix-II (Randomized)
S/No. Speed
(m/min)
Feed
(mm/rev) Lubrication
ESI CSI FSI
1 0.1 120 MQCL Veg. Oil 8 0 5
2 0.2 120 MQCL Veg. Oil 3 0 3
3 0.2 90 MQCL Veg. Oil 5 0 3
4 0.1 90 MQCL Veg. Oil 12 0 7
5 0.2 90 Flood 4 2 3
6 0.1 90 Flood 11 7 7
7 0.2 120 Flood 3 1 3
8 0.1 120 Flood 7 4 5
Fig. 23 Sustainability Indices plot

66
The plot shown in Fig. 23 is based on a ―the lower the better approach‖. The approach
discussed earlier in Chapter 2 is utilized in Fig. 24. Similar to the material indices
development method [49], [50], the indices values are inversed in Fig. 23 so that the
highest value of the index indicates the best scenario. It must be noted that the results
measured are the same, only the values of the indices change. This representation,
while giving the same conclusion, makes it even easier to interpret the plot. Moreover,
it must be noted that since inversing an environmental burden of zero gCO2/cc of
coolant would yield an ‗NaN‘ error in MATLAB, an arbitrarily small environmental
burden of 1 gCO2/cc is allocated to vegetable oil lubrication.
Fig. 24 Sustainability Indices plot
It is visible that again, the most feasible parameter setting is set #2 with competitively
close ESI and FSI along with a very high CSI. It is also important to note that, for the
sake of visibility, the very high values for the vegetable oil lubrication with extremely
low environmental burden were trimmed to 3000, so that all indices could be viewed
and compared on the same graph.
0
500
1000
1500
2000
2500
3000
3500
1 2 3 4 5 6 7 8
Parameter Set ID#
ESI
CSI
FSI
67
6. Summary & Conclusions
The need for a more elaborate way of interpreting the phenomenon of
sustainability was identified and a new approach of sustainability indices was
proposed. Using the proposed approach a set of practical cases of machining was
studied and the resulting set of indices provided an all-inclusive evaluation of process
sustainability. A clear breakdown of energy consumption was presented based on
actual tool path evaluation. It is important to note that the idea of utilizing the ‗feature
of interest‘ can be extended to other outputs of the machining process like surface
quality, tool life and wear, etc. If a decreasing feature of interest is desirable, e.g. tool
wear, then the high values of indices represent the best results. Moreover, if the design
space for parameter selection and/or the desired ‗level‘ of sustainability is known,
then the sustainability indices and the features of interest can themselves be
normalized for even clearer representation of the system. Thus more research and
validation through case studies can follow, with more precise energy and cost
measurement, to realize the goal of easy and practical sustainability assessment of
machining processes.
The sustainability calculator thus developed proved useful in providing insight for
the parameter selection process. Various details were added to the interface to make it
more and more flexible for handling various machining scenarios. More effort in this
area can still result in better process assessment. It is important to note that in the case
studies presented, the use of the calculator was for putting forth the idea of such an
interface and to present the concept of using our proposed sustainability indices as
one way of sustainability assessment. Hence a better representation of machining
costs, environmental burdens for sustainable lubrication and dry run power
consumption will improve the working of the calculator.
The sustainability of various techniques and practices dubbed as sustainable
practices was assessed both by sustainability indices and conventional performance in
terms of tool wear, surface roughness, etc. The exercise involved a detailed case study
of evaluating hybrid turning/grinding with sequential turning and grinding along with
a comparison between controlled and flood lubrication using ANOVA. It was
confirmed that hybrid machining and controlled lubrication are indeed sustainable

68
alternatives. The second set of experiments involved analysis of various lubrication
techniques. The often proposed use of vegetable oil as a machining lubricant was
tested in titanium turning. Again, it was concluded that it really is a more sustainable
alternative to synthetic cooling in terms of tool wear, surface quality and cutting
energy consumed, combined. Also the booster pumps required for the small flow of
vegetable oil and air mixtures are much lighter than the pumping system required for
the flood cooling technique. Although the flood cooling technique is the more
prevalent practice in the industry these days, this study shows that it is feasible to use
the sustainable alternative of vegetable oil, especially at feeds and speeds close to 0.1
mm/min and 90 m/min, respectively, for titanium. This means it would be sustainable
by default for softer metals and alloys. The application of cooled air as a lubricant
also appeared to be effective as presented in the literature. Especially when compared
with dry machining, it turns out to be a good alternative. Moreover, following the
trends shown in literature, cryogenic machining also turned out to be a
recommendable alternative by outperforming flood cooling at the overall three levels,
even at higher feeds and speeds. Although in cutting energy consumption its
performance was inferior to vegetable oil, this was compensated to some extent by the
low tool wear achieved at higher feeds and speeds.
6.1 Future Work
A newer version of the sustainability calculator will be developed with the ability
to take into account a more detailed cost model and more machinability aspects. The
cost-to-effectiveness extent needs to be further investigated between cryogenic and
vegetable oil booster systems. It would, however, be appropriate to further execute
this study using a coated carbide grade because, while the aim was to push for
challenging machining scenarios, the higher speed selected might be a little more than
an uncoated tool can deal with. Hence, further studies, perhaps with detailed LCA can
follow with more detail and a wider range of parameters. The development of a
mathematical model in this regard will also be a promising contribution for titanium
machining.

69
7. References
[1] I. T. A. U.S. Department of Commerce, ―How Does Commerce Define
Sustainable Manufacturing? .,‖ 2007. [Online]. Available:
http://trade.gov/competitiveness/sustainablemanufacturing/how_doc_defines_S
M.asp. [Accessed: 21-Sep-2012].
[2] S. Bell and S. Morse, Sustainability indicators: measuring the immeasurable.
London: Earthscan, 1999, p. xiv,175.
[3] Z. Bi, ―Revisiting System Paradigms from the Viewpoint of Manufacturing
Sustainability,‖ Sustainability, vol. 3, no. 9, pp. 1323–1340, Aug. 2011.
[4] D. Dornfeld, ―Opportunities and Challenges to Sustainable Manufacturing and
CMP,‖ in MRS Spring Meeting, San Francisco, April 14-16, 2009.
[5] F. Jovane, Y. Koren, and C. R. Boër, ―Present and Future of Flexible
Automation: Towards New Paradigms,‖ CIRP Ann. - Manuf. Technol., vol. 52,
no. 2, pp. 543–560, Jan. 2003.
[6] M. Mani, K. Lyons, and S. Rachuri, ―Introducing Sustainability Early Into
Manufacturing Process Planning,‖ in 14th International Conference on
Manufacturing Science and Engineering October 7-10, 2008, Evanston, IL,
USA, 2008, pp. 1–8.
[7] F. Pusavec and J. Kopac, ―Achieving and implementation of sustainability
principles in machining processes,‖ J. Adv. Prod. Eng. Manag., vol. 3, pp. 58–
69, 2009.
[8] J. Dreher, M. Lawler, J. Stewart, G. Strasorier, and M. Thorne, ―Metrics for
Sustainable Manufacturing. 15.992 – Strategies for Sustainable Business
Sustainability Metrics for General Motors,‖ 2009.
[9] N. Diaz, M. Helu, and S. Jayanathan, ―Environmental analysis of milling
machine tool use in various manufacturing environments,‖ in IEEE
International Symposium on Sustainable Systems and Technology (ISSST) .,
2010, pp. 1–6.
[10] S. Feng and C. Joung, ―An overview of a proposed measurement infrastructure
for sustainable manufacturing,‖ in Proceedings of the 7th Global Conference
on Sustainable Manufacturing., 2009, pp. 355–360.
[11] A. D. Jayal, F. Badurdeen, O. W. Dillon, and I. S. Jawahir, ―Sustainable
manufacturing: Modeling and optimization challenges at the product, process
and system levels,‖ CIRP J. Manuf. Sci. Technol., vol. 2, no. 3, pp. 144–152,
Jan. 2010.

70
[12] W. Schmidt and A. Taylor, ―Ford of Europe‘s Product Sustainability Index,‖ in
Proceedings of 13th CIRP International Conference on Life Cycle
Engineering., 2006, pp. 5–10.
[13] H. Narita, N. Desmira, and H. Fujimoto, ―Environmental burden analysis for
machining operation using LCA method,‖ in Manufacturing Systems and
Technologies for the New Frontier., 2008, pp. 65–68.
[14] M. F. Rajemi, P. T. Mativenga, and a. Aramcharoen, ―Sustainable machining:
selection of optimum turning conditions based on minimum energy
considerations,‖ J. Clean. Prod., vol. 18, no. 10–11, pp. 1059–1065, Jul. 2010.
[15] F. Pusavec, P. Krajnik, and J. Kopac, ―Transitioning to sustainable production
– Part I: application on machining technologies,‖ J. Clean. Prod., vol. 18, no.
2, pp. 174–184, Jan. 2010.
[16] F. Pusavec, D. Kramar, P. Krajnik, and J. Kopac, ―Transitioning to sustainable
production – part II: evaluation of sustainable machining technologies,‖ J.
Clean. Prod., vol. 18, no. 12, pp. 1211–1221, Aug. 2010.
[17] T. G. Gutowski, D. P. Sekulic, and B. R. Bakshi, ―Preliminary thoughts on the
application of thermodynamics to the development of sustainability criteria,‖
2009 IEEE Int. Symp. Sustain. Syst. Technol., pp. 1–6, May 2009.
[18] T. G. Gutowski, M. S. Branham, J. B. Dahmus, A. J. Jones, and A. Thiriez,
―Thermodynamic analysis of resources used in manufacturing processes.,‖
Environ. Sci. Technol., vol. 43, no. 5, pp. 1584–90, Mar. 2009.
[19] T. Gutowski, J. Dahmus, and A. Thiriez, ―Electrical Energy Requirements for
Manufacturing Processes,‖ no. Cvd, 2006.
[20] J. Jeswiet and S. Kara, ―Carbon emissions and CESTM
in manufacturing,‖ CIRP
Ann. - Manuf. Technol., vol. 57, no. 1, pp. 17–20, Jan. 2008.
[21] J. Fiksel, J. McDaniel, and C. Mendenhall, ―Measuring progress towards
sustainability principles, process and best practices,‖ in Greening of Induatry
Network Conference, Best Practice Proceedings, 1999, vol. 2693, no. 614.
[22] S. Feng, C. Joung, and G. Li, ―Development overview of sustainable
manufacturing metrics,‖ in Proceedings of the 17th CIRP international
conference on life cycle engineering., 2010, pp. pp. 6–12.
[23] I. Deiab, L. Pang, H. A. Kishawy, and N. A. Al-Kheily, ―On A Benign
Approach For Machining,‖ in Proceedings of The Canadian Society for
Mechanical Engineering Forum, 2010.

71
[24] S. Feng and M. Hattori, ―Cost and Process Information Modeling for Dry
Machining,‖ in In Proc. of the International Workshop for Environment
Conscious Manufacturing-ICEM-2000, 2000, pp. 1–8.
[25] F. Klocke and G. Eisenblätter, ―Dry Cutting,‖ CIRP Ann. - Manuf. Technol.,
vol. 46, no. 2, pp. 519–526, 1997.
[26] G. Byrne and E. Scholta, ―Environmentally Clean Machining Processes — A
Strategic Approach,‖ CIRP Ann. - Manuf. Technol., vol. 42, no. 1, pp. 471–
474, 1993.
[27] a. Shokrani, V. Dhokia, and S. T. Newman, ―Environmentally conscious
machining of difficult-to-machine materials with regard to cutting fluids,‖ Int.
J. Mach. Tools Manuf., vol. 57, pp. 83–101, Jun. 2012.
[28] S. Zhang, J. F. Li, and Y. W. Wang, ―Tool life and cutting forces in end milling
Inconel 718 under dry and minimum quantity cooling lubrication cutting
conditions,‖ J. Clean. Prod., vol. 32, pp. 81–87, Sep. 2012.
[29] M. Siniawski and C. Bowman, ―Metal working fluids: finding green in the
manufacturing process,‖ Ind. Lubr. Tribol., vol. 61, no. 2, pp. 60–66, 2009.
[30] F. Pušavec and J. Kopač, ―Sustainability Assessment: Cryogenic Machining of
Inconel 718,‖ Strojniški Vestn. – J. Mech. Eng., vol. 57, no. 09, pp. 637–647,
Sep. 2011.
[31] S. Safian, M. A. Hisyam, and S. Aman, ―Evaluation Of Vegetable Oil As An
Alternative Cutting Lubricant When End Milling Martensitic Stainless Steel
Using Uncoated Carbide Tool,‖ J. Adv. Manuf. Technol., vol. 3, no. 2, pp. 49–
56, 2009.
[32] G. Burton and M. B. G. Jun, ―Feasibility of Vegetable Oil in Water Emulsion
Achieved through Ultrasonic Atomization as Cutting Fluids,‖ vol. 40, 2012.
[33] K. A. Venugopal, S. Paul, and A. B. Chattopadhyay, ―Tool wear in cryogenic
turning of Ti-6Al-4V alloy,‖ Cryogenics (Guildf)., vol. 47, no. 1, pp. 12–18,
Jan. 2007.
[34] M. J. Bermingham, S. Palanisamy, D. Kent, and M. S. Dargusch, ―A
comparison of cryogenic and high pressure emulsion cooling technologies on
tool life and chip morphology in Ti–6Al–4V cutting,‖ J. Mater. Process.
Technol., vol. 212, no. 4, pp. 752–765, Apr. 2012.
[35] M. H. Cetin, B. Ozcelik, E. Kuram, and E. Demirbas, ―Evaluation of vegetable
based cutting fluids with extreme pressure and cutting parameters in turning of
AISI 304L by Taguchi method,‖ J. Clean. Prod., vol. 19, no. 17–18, pp. 2049–
2056, Nov. 2011.

72
[36] D. Fratila and C. Caizar, ―Application of Taguchi method to selection of
optimal lubrication and cutting conditions in face milling of AlMg3,‖ J. Clean.
Prod., vol. 19, no. 6–7, pp. 640–645, Apr. 2011.
[37] S. A. Lawal, I. A. Choudhury, and Y. Nukman, ―A critical assessment of
lubrication techniques in machining processes: a case for minimum quantity
lubrication using vegetable oil-based lubricant,‖ J. Clean. Prod., vol. 41, pp.
210–221, Feb. 2013.
[38] E. Kuram, B. Ozcelik, M. Bayramoglu, E. Demirbas, and B. T. Simsek,
―Optimization of cutting fluids and cutting parameters during end milling by
using D-optimal design of experiments,‖ J. Clean. Prod., vol. 42, pp. 159–166,
Mar. 2013.
[39] N. Andriya, P. Rao, and S. Ghosh, ―Dry Machining of Ti-6Al-4V using PVD
Coated TiAlN Tools,‖ in Proceedings of The World Congress on Engineering,
2012, vol. III, pp. 1492–1497.
[40] S. Alves and J. De Oliveira, ―Vegetable based cutting fluid–an environmental
alternative to grinding process,‖ in 15th CIRP International Conference on Life
Cycle Engineering, 2008.
[41] K. Weinert, I. Inasaki, J. W. Sutherland, and T. Wakabayashi, ―Dry Machining
and Minimum Quantity Lubrication,‖ CIRP Ann. - Manuf. Technol., vol. 53,
no. 2, pp. 511–537, 2004.
[42] K. V. B. S. Kalyan Kumar and S. K. Choudhury, ―Investigation of tool wear
and cutting force in cryogenic machining using design of experiments,‖ J.
Mater. Process. Technol., vol. 203, no. 1–3, pp. 95–101, Jul. 2008.
[43] S. Y. Hong, Y. Ding, and W. Jeong, ―Friction and cutting forces in cryogenic
machining of Ti–6Al–4V,‖ Int. J. Mach. Tools Manuf., vol. 41, no. 15, pp.
2271–2285, Dec. 2001.
[44] M. P. Groover, “Theory of Metal Machining”. Fundamentals of Modern
Manufacturing, 3rd ed. John Wiley & Sons, Inc., 2007, pp. 491–504.
[45] S. Kalpakjian and S. R. Schmid, Manufacturing Engineering and Technology.
Pearson Education, 2006.
[46] D. Dornfeld, Green Manufacturing, First. Springer New York Heidelberg,
2013, pp. 68–78.
[47] D. Krajnc and P. Glavič, ―A model for integrated assessment of sustainable
development,‖ Resour. Conserv. Recycl., vol. 43, no. 2, pp. 189–208, Jan.
2005.

73
[48] D. Krajnc and P. Glavič, ―How to compare companies on relevant dimensions
of sustainability,‖ Ecol. Econ., vol. 55, no. 4, pp. 551–563, Dec. 2005.
[49] M. F. Ashby, Materials Selection in Mechanical Design Third Edition.
Elsevier, 2005.
[50] M. F. Ashby and D. Cebon, Case Studies in Material Selection. Elsevier Sci &
Tech Book Div, 2002.
[51] Dubai Electricity And Water Authority (DEWA), ―Tender For The Acquisition
Of Cdm Project Opportunities In Dubai , UAE October 2009,‖ 2009.
[52] ―Clean Development Mechanism, UAE Solar Programme of Activities
Version.02,‖ 2012.
[53] D. Kong, S. Choi, Y. Yasui, S. Pavanaskar, D. Dornfeld, and P. Wright,
―Software-based tool path evaluation for environmental sustainability,‖ J.
Manuf. Syst., vol. 30, no. 4, pp. 241–247, Oct. 2011.
[54] G. Shao, D. Kibira, and K. Lyons, ―A virtual machining model for
sustainability analysis,‖ in Proceedings of ASME 2010 International Design
Engineering Technical Conference & Computers and Information in
Engineering Conference ASME CIE ., 2010, pp. 1–9.
[55] K. Branker, J. Jeswiet, and I. Y. Kim, ―Greenhouse gases emitted in
manufacturing a product—A new economic model,‖ CIRP Ann. - Manuf.
Technol., vol. 60, no. 1, pp. 53–56, Jan. 2011.
[56] Arcam AB Inc., ―Ti-6Al-4V.‖ [Online]. Available: http://www.arcam.com/wp-
content/uploads/Arcam-Ti6Al4V-Titanium-Alloy.pdf. [Accessed: 28-Mar-
2012].
[57] C. Richt, ―Turning Titanium—Developments in Application Technology,‖
Sanvik Coromant, Sandviken, Sweden, 2003. [Online]. Available:
www2.coromant.sandvik.com/coromant/pdf/.../tekn_art_titan.pdf ] .Accessed :
17-Nov-2013.[
[58] M. Donachie, Titanium: a technical guide. Meterials Park, OH: ASM
International, 1988, pp. 75–85.
[59] E. P. DeGarmo, J. T. Black, and R. A. Kohser, Materials & Processes in
Manufacturing, 10th Ed. Wiley, 2010, p. 529.
[60] ACCU-Svenska AB, ―Material Safety Data Sheet (according to EU Directive
91/155/EEC) ECOLUBRIC E200L.‖ [Online]. Available: http://www.accu-
svenska.se/wp-content/uploads/2012/04/ECULUBRIC-E200L-CAS-8002-13-
9-eng.pdf. [Accessed: 25-Jan-2012].

74
[61] B. Boswell and T. T. Chandratilleke, ―Air-Cooling Used For Metal Cutting,‖
Am. J. Appl. Sci., vol. 6, no. 2, pp. 251–262, 2009.
[62] ISO, International Standard ISO 3685:1993, Second., vol. 1993. 1993, p. 11.
[63] Y. Su, N. He, L. Li, a. Iqbal, M. H. Xiao, S. Xu, and B. G. Qiu, ―Refrigerated
cooling air cutting of difficult-to-cut materials,‖ Int. J. Mach. Tools Manuf.,
vol. 47, no. 6, pp. 927–933, May 2007.

75
8. Appendices
Appendix-A
ANOVA regression model for coded factors (1,-1 as high or low-level of parameters)
using Design Expert.
ANOVA regression model for un-coded factors (actual values of parameters)

76
Appendix-B
R
u
n
Block # Feed Rate
(mm/rev)
Cutting
Speed
(m/s)
Lubrication
Technique
Tool
Wear
Vb
(mm)
Surface
Roughness
Ra (µm)
Energy
Consumption
1 Block 1 0.2 120 Dry 0.661 1.43 0.019147
2 Block 1 0.1 90 Veg. Oil MQL 0.105 0.91 0.018489
3 Block 1 0.2 90 Cryogenic 0.109 2.27 0.017649
4 Block 1 0.1 120 MQCL Veg. Oil 0.159 0.88 0.030362
5 Block 1 0.1 120 Cryogenic 0.13 1.01 0.018503
6 Block 1 0.1 120 Dry 0.162 0.87 0.031147
7 Block 1 0.2 120 Cryogenic 0.264 1.76 0.012007
8 Block 1 0.2 120 MQCL Veg. Oil 0.591 1.63 0.020033
9 Block 1 0.1 120 Veg. Oil MQL 0.166 0.82 0.012871
10 Block 1 0.1 90 Dry 0.134 1.07 0.028964
11 Block 1 0.2 90 MQCL Veg. Oil 0.18 1.95 0.017722
12 Block 1 0.2 90 Cooled Air 0.212 1.81 0.019154
13 Block 1 0.2 120 Cooled Air 0.676 1.25 0.019647
14 Block 1 0.2 90 Veg. Oil MQL 0.148 2.52 0.011436
15 Block 1 0.1 90 MQCL Veg. Oil 0.11 0.83 0.029753
16 Block 1 0.1 120 Cooled Air 0.336 0.84 0.032041
17 Block 1 0.1 90 Cryogenic 0.077 0.9 0.028773
18 Block 1 0.2 90 Dry 0.166 2.07 0.017922
19 Block 1 0.2 90 Flood 0.12 2.42 0.018701
20 Block 1 0.1 90 Flood 0.099 0.76 0.028904
21 Block 1 0.2 120 Flood 0.206 2.09 0.017854
22 Block 1 0.2 120 Veg. Oil MQL 0.533 1.46 0.008459
23 Block 1 0.1 90 Cooled Air 0.111 0.86 0.030949
24 Block 1 0.1 120 Flood 0.114 0.73 0.030345
25 Block 2 0.1 90 Cryogenic 0.093 0.96 0.028909
26 Block 2 0.1 120 MQCL Veg. Oil 0.402 0.87 0.029919
27 Block 2 0.1 90 Cooled Air 0.116 0.81 0.031193
28 Block 2 0.1 120 Cryogenic 0.122 1.07 0.017003
29 Block 2 0.2 120 Cooled Air 0.664 1.33 0.020112
30 Block 2 0.2 120 Cryogenic 0.171 2.19 0.011374
31 Block 2 0.1 120 Cooled Air 0.15 0.98 0.031177
32 Block 2 0.1 120 Flood 0.132 0.72 0.031369
33 Block 2 0.2 120 Flood 0.321 2.08 0.018531
34 Block 2 0.1 90 Flood 0.112 0.93 0.028677

77
35 Block 2 0.1 90 Veg. Oil MQL 0.091 0.9 0.017982
36 Block 2 0.1 90 Dry 0.143 0.75 0.028803
37 Block 2 0.2 90 Cryogenic 0.113 2.55 0.017242
38 Block 2 0.1 120 Dry 0.177 0.91 0.031224
39 Block 2 0.2 120 Veg. Oil MQL 0.554 1.38 0.008298
40 Block 2 0.1 90 MQCL Veg. Oil 0.082 0.83 0.030247
41 Block 2 0.1 120 Veg. Oil MQL 0.178 1.33 0.011972
42 Block 2 0.2 90 Flood 0.138 2.09 0.01648
43 Block 2 0.2 90 Cooled Air 0.147 2.16 0.017098
44 Block 2 0.2 120 Dry 0.622 1.49 0.019102
45 Block 2 0.2 90 Dry 0.162 2.55 0.017097
46 Block 2 0.2 90 Veg. Oil MQL 0.169 2.18 0.010652
47 Block 2 0.2 120 MQCL Veg. Oil 0.598 1.92 0.020163
48 Block 2 0.2 90 MQCL Veg. Oil 0.114 2.45 0.016933
49 Block 3 0.2 120 Cryogenic 0.247 1.79 0.011076
50 Block 3 0.1 120 Dry 0.15 0.93 0.030261
51 Block 3 0.2 90 Cooled Air 0.308 1.86 0.018438
52 Block 3 0.1 90 Dry 0.102 0.86 0.028709
53 Block 3 0.2 120 Veg. Oil MQL 0.489 1.62 0.007727
54 Block 3 0.2 120 Flood 0.224 2.2 0.018424
55 Block 3 0.1 90 MQCL Veg. Oil 0.074 0.88 0.029678
56 Block 3 0.2 90 MQCL Veg. Oil 0.163 2.22 0.017888
57 Block 3 0.2 90 Dry 0.141 2.37 0.017478
58 Block 3 0.1 90 Flood 0.101 0.81 0.028382
59 Block 3 0.1 120 Flood 0.111 0.81 0.029983
60 Block 3 0.1 90 Veg. Oil MQL 0.107 0.92 0.017991
61 Block 3 0.1 90 Cooled Air 0.13 0.8 0.029668
62 Block 3 0.2 90 Cryogenic 0.107 0.87 0.017262
63 Block 3 0.2 120 MQCL Veg. Oil 0.607 1.36 0.020141
64 Block 3 0.2 120 Dry 0.534 1.62 0.018998
65 Block 3 0.1 90 Cryogenic 0.096 2.38 0.028592
66 Block 3 0.1 120 Veg. Oil MQL 0.18 0.78 0.012249
67 Block 3 0.2 90 Veg. Oil MQL 0.17 2.06 0.010342
68 Block 3 0.2 90 Flood 0.098 2.35 0.017011
69 Block 3 0.1 120 Cooled Air 0.483 0.93 0.031264
70 Block 3 0.1 120 Cryogenic 0.11 0.85 0.01805
71 Block 3 0.2 120 Cooled Air 0.659 1.31 0.019951
72 Block 3 0.1 120 MQCL Veg. Oil 0.287 1.01 0.031196

78
Vita
Syed Waqar Raza was born in Sahiwal, Pakistan, on 29th
of November, 1987. After
getting his early education from O.P.F. Public School Pakpattan, he enrolled in and
graduated from Pakistan Air Force (P.A.F) Public School Sargodha with the
Academic Roll of Honor. He earned two consecutive Quaid-e-Azam Merit
scholarships, the most prestigious scholarship awarded by the educational boards of
Pakistan, during 2004 to 2010.
In 2006, after he was selected in the P.A.F, Mr. Raza chose a career in
engineering over fighter flying. He got admission in the Industrial & Manufacturing
Engineering program at the University of Engineering & Technology (UET) Lahore.
He received the second best technical presentation award in the Asia-Pacific Region
by the American Society of Mechanical Engineers (ASME) in 2010 and graduated
with the University Gold Medal for academic excellence.
After spending a year working in the industry, Mr. Raza moved to the U.A.E.
in 2011 and enrolled in the MSME program at the American University of Sharjah.
There he also worked as a Graduate Teaching Assistant at AUS from 2011 to 2013.
Mr. Raza likes debates, English prose, Urdu poetry and maintains a keen interest in
field Hockey, Cricket and European football.