sustainability assessment of large-scale carbon …
TRANSCRIPT

Purdue UniversityPurdue e-Pubs
Open Access Dissertations Theses and Dissertations
January 2016
SUSTAINABILITY ASSESSMENT OF LARGE-SCALE CARBON CAPTURE ANDSEQUESTRATION DEPLOYMENT OUTSIDETHE SYSTEM BOUNDARIES -OPPORTUNITIES AND CHALLENGESMohammed AbotalibPurdue University
Follow this and additional works at: https://docs.lib.purdue.edu/open_access_dissertations
This document has been made available through Purdue e-Pubs, a service of the Purdue University Libraries. Please contact [email protected] foradditional information.
Recommended CitationAbotalib, Mohammed, "SUSTAINABILITY ASSESSMENT OF LARGE-SCALE CARBON CAPTURE AND SEQUESTRATIONDEPLOYMENT OUTSIDE THE SYSTEM BOUNDARIES - OPPORTUNITIES AND CHALLENGES" (2016). Open AccessDissertations. 1205.https://docs.lib.purdue.edu/open_access_dissertations/1205

Graduate School Form 30 Updated 12/26/2015
PURDUE UNIVERSITY GRADUATE SCHOOL
Thesis/Dissertation Acceptance
This is to certify that the thesis/dissertation prepared
By
Entitled
For the degree of
Is approved by the final examining committee:
To the best of my knowledge and as understood by the student in the Thesis/Dissertation Agreement, Publication Delay, and Certification Disclaimer (Graduate School Form 32), this thesis/dissertation adheres to the provisions of Purdue University’s “Policy of Integrity in Research” and the use of copyright material.
Approved by Major Professor(s):
Approved by: Head of the Departmental Graduate Program Date
Mohammad Abotalib
SUSTAINABILITY ASSESSMENT OF LARGE-SCALE CARBON CAPTURE AND SEQUESTRATION DEPLOYMENT OUTSIDE THE SYSTEM BOUNDARIES - OPPORTUNITIES AND CHALLENGES
Doctor of Philosophy
Fu ZahoCo-chair
Loring Nies
Co-chair
Suresh Rao
Andres Clarens
Fu Zhao
Linda Lee 11-21-2016

i
SUSTAINABILITY ASSESSMENT OF LARGE-SCALE CARBON CAPTURE AND
SEQUESTRATION DEPLOYMENT OUTSIDE THE SYSTEM BOUNDARIES -
OPPORTUNITIES AND CHALLENGES
A Dissertation
Submitted to the Faculty
of
Purdue University
by
Mohammad Abotalib
In Partial Fulfillment of the
Requirements for the Degree
of
Doctor of Philosophy
December 2016
Purdue University
West Lafayette, Indiana

ii
To my sponsor, Kuwait University, my family, and friends. Thanks for your support
along the way.

iii
ACKNOWLEDGEMENTS
First and foremost, I would like to thank each of my committee members: Dr. Fu
Zhao, Dr. Larry Nies, Dr, Suresh Rao and Dr. Andres Clarnes for agreeing to supervise
me throughout my Doctorate of Philosophy degree at Purdue University.
I would also like to dedicate a special thank Dr. Fu Zhao, who was instrumental
for providing guidance on my research, devoting time for discussions, and agreeing to
become my main advisor. The same appreciation goes to Dr. Andres Clarnes for his
unique perspective and feedback in my research area. Also a special recognition goes to
Dr. Larry Nies for agreeing to become my co-advisor.
Finally, I would like to express my sincere appreciation to my wife, Aseel, for her
indefatigable support, my parents, and my children and I realize that this accomplishment
will mean a lot to them.

iv
TABLE OF CONTENTS
Page
LIST OF TABLES ............................................................................................................ vii
LIST OF FIGURES ........................................................................................................... ix
LIST OF ABBREVIATIONS ............................................................................................ xi
ABSTRACT ...................................................................................................................... xv
CHAPTER 1. INTRODUCTION ................................................................................. 1
1.1 Statement of the Problem ..................................................................................... 1
1.2 Objective ............................................................................................................... 4
CHAPTER 2. LITERATURE REVIEW .................................................................... 11
2.1 Background ......................................................................................................... 11
2.2 Technology Description ..................................................................................... 12
2.2.1 Post-combustion Capture System ............................................................... 13
2.2.2 Pre-combustion Capture System ................................................................. 15
2.2.3 Oxy-fuel Capture System ............................................................................ 16
2.3 CO2 Transportation ............................................................................................. 17
2.4 Suitable CO2 Storage Sites ................................................................................. 17
2.5 Potential Storage Sites ........................................................................................ 19
2.6 LCA of CCS Deployment in Coal-Fired Power Plants ...................................... 20
2.7 Making CCS Attractive ...................................................................................... 21
2.8 Challenges for CCS Deployment ....................................................................... 25
CHAPTER 3. METHEDOLOGY............................................................................... 28
3.1 Overview ............................................................................................................ 28
3.1.1 Method for LCA Harmonization ................................................................ 28
3.1.2 Method for LCA GIS Integration ............................................................... 29

v
Page
3.1.3 Method for LCA GIS Integration ............................................................... 29
CHAPTER 4. LCA HARMONIZATION .................................................................. 30
4.1 Background and Motivation ............................................................................... 30
4.2 Harmonization Method ....................................................................................... 33
4.3 Results ................................................................................................................ 40
4.3.1 Global Warming potential........................................................................... 40
4.3.2 Cumulative Energy Demand ....................................................................... 44
4.4 Summary ............................................................................................................. 46
CHAPTER 5. LCA-GIS INTEGRATION ................................................................. 49
5.1 Background and Motivation ............................................................................... 49
5.2 Method and Model Description .......................................................................... 52
5.2.1 Functional Unit and Emission Credits ........................................................ 59
5.2.2 Data Sources for GHG Life Cycle Emissions for Energy .......................... 61
5.3 Results and Discussion ....................................................................................... 62
5.4 Summary ............................................................................................................. 64
CHAPTER 6. CCS DEPLOYEMNT FROM GAME THEORY PERSPECTIVE .... 69
6.1 Background and Motivation ............................................................................... 69
6.2 CCS Game-Theory Model .................................................................................. 74
6.2.1 Potential CO2 Supply .................................................................................. 76
6.2.1.1 Potential Supply from Ethanol Plants ..................................................... 76
6.2.1.2 Potential Supply from Coal-fired Power Plants ...................................... 77
6.2.2 Geospatial Data Sources ............................................................................. 77
6.3 Results and Discussion ....................................................................................... 79
6.3.1 Non-Cooperative Game Scenarios .............................................................. 79
6.3.2 Cooperation Opportunities .......................................................................... 82
6.4 Summary ............................................................................................................. 85
CHAPTER 7. CONCLUSION AND FUTURE WORK ............................................ 88
7.1 Conclusion .......................................................................................................... 88
7.2 Future Work ........................................................................................................ 91

vi
Page
LIST OF REFERENCES ................................................................................................. 94
APPENDICES ................................................................................................................ 106
Appendix A CCS and CO2 Storage ....................................................................... 106
Appendix B Technical Parameters ......................................................................... 110
VITA ............................................................................................................................... 131
PUBLICATIONS ............................................................................................................ 132

vii
LIST OF TABLES
Table .............................................................................................................................. Page
Table 2-1 Commercial CCS projects in the United States as of 2013 .............................. 22
Table 4-1 Published LCA studies that passed the LCA harmonization screening
requirements with key performance parameters ............................................................... 35
Table 4-2 Share of life-cycle process to the total impacts for GWP for each coal-fired
technology ......................................................................................................................... 41
Table 4-3 Share of life cycle process to the total impact for CED for each coal-fired
technology ......................................................................................................................... 45
Table 5-1 Processes included in the scenario and pathways examined in the present
analysis .............................................................................................................................. 55
Table 5-2 Displacement factors for co-products in each pathway when system expansion
is applied ........................................................................................................................... 60
Table 6-1 Key parameters for possible scenarios and subsequent associated cost for each
player................................................................................................................................. 75
Table 6-2 Games 1-4: Payoffs for players 1 and 2 with current carbon regulations under
different CCS costs and market conditions ....................................................................... 80
Table 6-3 Games 5-8: No carbon tax. Incentive for anthropogenic CO2 of $30 instead of
$10. Changes in oil prices and CCS technologies ............................................................ 81

viii
Table .............................................................................................................................. Page
Table 6-4 Games 9-12: $20 carbon tax. Incentive for anthropogenic CO2 of $30 instead
of $10. Changes in oil prices and CCS technologies ........................................................ 81
Table 6-5 Game 2R: cooperation assumed between players, no change in current
regulations, no reduction in the cost of CCS technologies, high oil prices ...................... 85

ix
LIST OF FIGURES
Figure ............................................................................................................................. Page
Figure 1.1 Historical and projected global energy-related CO2 emissions [in billion metric
tons] by fuel type between 1990 and 2040 ......................................................................... 2
Figure 1.2 Dissertation outline ............................................................................................ 7
Figure 2.1 Representation of different CCS technologies ................................................ 13
Figure 2.2 Schematic diagram of post-combustion capture .............................................. 14
Figure 2.3 Schematic diagram of pre-combustion capture ............................................... 15
Figure 2.4 Schematic diagram of oxyfuel combustion ..................................................... 16
Figure 2.5 Characteristics of an appropriate CO2 storage site .......................................... 18
Figure 2.6 Schematic showing geological sequestration of carbon dioxide emissions from
a power station with CO2 capture system ......................................................................... 20
Figure 2.7 Spatial distribution of pathways and CO2-EOR infrastructure in the lower 48
states of the U.S. ............................................................................................................... 24
Figure 4.1 Generalized system boundaries of post-combustion CCS technology ............ 31
Figure 4.2 System screening procedure ............................................................................ 33
Figure 4.3 Geographic map showing the spatial distribution of data analyzed ................ 38
Figure 4.4 Box plot of published estimates considered in the analysis ............................ 39

x
Figure ............................................................................................................................. Page
Figure 4.5 Box plots of studies considered in the analysis, illustrating the percentage of
change in GWP for each evaluated coal-firing technology compared to the no-CCS
scenario, using technology-specific information .............................................................. 40
Figure 4.6 Box plots of studies considered in the analysis, illustrating the percentage of
change in GWP for each evaluated coal-firing technology compared to the no-CCS
scenario, using technology-specific information .............................................................. 44
Figure 5.1 Map of CO2 pathways within 100 miles of EOR fields in the lower 48 states of
the U.S. Quantities of CO2available from the pathways were converted to barrels of crude
oil to be recovered via EOR .............................................................................................. 54
Figure 5.2 Model system boundaries for pathways 1, 2, and 3 ........................................ 58
Figure 5.3 Carbon intensity of crude oil recovered via CO2-EOR from investigated
pathways in different EOR fields ...................................................................................... 62
Figure 5.4 LCA net GHG emissions for major EOR fields in the three pathways ........... 64
Figure 6.1 Schematic representation of different non-cooperative game scenarios
analyzed under different policy and market conditions. A detailed description of each
game is provided in appendix B........................................................................................ 74
Figure 6.2 Map of EOR infrastructure and potential CO2 supply from ethanol and coal
power plants. Quantities of CO2 are based on annual emission profiles from the sources79
Figure 6.3 Illustrative map of potential CO2 supply from ethanol and coal power plants
near the Illinois Basin. Quantities of CO2 are based on annual emission profiles from the
sources............................................................................................................................... 83

xi
LIST OF ABBREVIATIONS
AEO Annual Energy Outlook
BBL Barrel of Oil
Btu British Thermal Unit
CED Cumulative Energy Demand
CCS Carbon Capture and Sequestration
°C Degree Celsius
CH4 Methane
CO Carbon Monoxide
CO2 Carbon Dioxide
CO2-e Carbon Dioxide Equivalent
COE Cost of Electricity
DOE Department of Energy
EIA Energy Information Administration
EOR Enhanced Oil Recovery
EPA Environmental Protection Agency
°F Degree Fahrenheit
FG Flue Gas
FGD Flue Gas Desulfurization

xii
GHG Greenhouse Gases
GWP Global Warming Potential
HCL Hydrogen Chlorid
H2S hydrogen Sulphide
HF Hydrogen Fluoride
Hg Mercury
HHV Higher Heating Value
I-6 Illinois No. 6
IGCC Integrated Gasification Combined Cycle – a technology that converts coal to gas
and then burn it to produce electricity
IPCC Intergovernmental Panel on Climate Change
ISO International Organization of Standardization
kg Kilogram
kWe Kilowatt of Electricity
kWh Kilowatt-Hour
lb. Pound
LC Life Cycle
LCA Life Cycle Analysis
LCC Life Cycle Cost
LCI Life Cycle Inventory
LCI&C Life Cycle Inventory and Cost Analysis
LCIA Life Cycle Impact Assessment
LCOE Levelized Cost of Electricity
xiii
MEA Monoethanolamine
MDEA Methyl Diethanolamine
MW Megawatt
MWe Megawatts (electric)
MWh Megawatt Hours
N Nitrogen
N2O Nitrous Oxide
NETL National Energy Technology Laboratory
NGCC Natural Gas Combined Cycle
NH3 Ammonia
NOX Oxides of Nitrogen
O&M Operations and Maintenance
O3 Ozone
P Phosphorus
Pb Lead
PM Particulate Matter
PM10 Particulate Matter (diameter 10 micrometer)
PM2.5 Particulate Matter (diameter 2.5 micrometer)
ppm Parts per Million Volume
PC Pulverized Coal
R&D Research and Development
SCPC Supercritical Pulverized Coal
SF6 Sulfur Hexafluoride

xiv
SO2 Sulfur Dioxide
SOx Sulfur Oxides
VOC Volatile Organic Chemical

xv
ABSTRACT
Abotalib, Mohammad. Ph.D., Purdue University, December 2016. Sustainability Assessment of Large-scale Carbon Capture and Sequestration Deployment Outside the System Boundaries – Opportunities and Challenges. Major Professors: Fu Zhao and Larry Nies.
Most power generation in the United States is derived from the combustion of
fossil fuels, primarily coal and natural gas. As a result, greenhouse gases (GHGs) are
generated, and they act to trap radiant heat from the Earth. When GHGs are discussed,
attention is usually concentrated on carbon dioxide (CO2) because it is believed to be the
most manageable anthropogenic GHG. Therefore, introducing new technologies,
primarily those which deal with CO2 capture and storage, is seen as a potential option for
managing GHGs. Oil and gas reservoirs, saline formations, and un-mineable coal beds
are examples of underground CO2 storage sites. In the United States, it has been
estimated that these sites together have the potential capacity to store the country’s CO2
emissions for the next 500 years. For this reason, carbon capture and sequestration (CCS)
has become a very attractive approach by several industries, including the coal-fired
power industry, to reduce their GHG emissions. However, the implementation of CCS on
a broad scale will require an enormous input of resources and energy, which will be used
during the CCS production, installation, and operation phases. The eventual result of this
implementation will be an increased demand for fuel, which in turn will lead to further

xvi
mining activities to provide the additional energy required. Input materials such as
pipelines, water, and chemicals are also required throughout the technology’s life cycle.
According to the literature, CCS with a post-capture system reduces the total CO2-
equivalent (CO2-e) emissions of a coal power plant by 65% to 87%. The magnitude of
this reduction depends on the study boundaries that are considered in the life-cycle
assessment (LCA), and on other parameters considered in the study, such as the plant’s
power-generation thermal efficiency and capacity, fuel type, raw material transportation
method, distance to power plants, distance to storage sites, and depth of storage sites.
This dissertation address this issue and uses the LCA harmonization approach
with the aim of reducing the variability observed in the published literature, particularly,
for amine-based post- combustion CCS technologies on coal-fired power plants. The
levels of GHG reduction, both the published and harmonized results indicated a large
decrease in global warming potential (GWP) for the various coal-fired technologies
examined. However, because of the requirements of energy and other input materials,
there was a notable increase in cumulative energy demand (CED), which would
subsequently increase the footprint of the technology in term of resources.
To expand the foreseen benefits of CCS and widen it applications, CCS
integration with EOR was investigated from an LCA-GIS perspective in which the CO2 is
utilized from ethanol, coal-fired, and natural gas power plants in the lower 48 states of
the U.S. the results indicated that that crude oil with lower carbon intensity can be
produced from EOR reservoirs that are less efficient in terms of crude recovered per ton
of CO2 injected. However, it should be acknowledged that using less efficient reservoirs
would be associated with greater CO2 supply which has a parasitic energy requirement

xvii
and would in turn entail a higher cost burden. With a focus of future CCS deployment in
the U.S., the game-theory approach was applied to determine the impacts of possible
changes in carbon policies, the carbon market, and the cost of CCS technologies on the
decisions of industrial carbon emitters.
In conclusion, CCS have great potential to reduce the carbon intensity of electric or
transportation fuel. However, under existing carbon policies and at the current cost of
CCS deployment, the strategy of the ethanol industry would be dominated by CCS
deployment. By contrast, coal power plants would not have sufficient governmental or
economic incentives to deploy CCS because of the gap between the cost capturing and
transporting CO2 and the price of CO2.

1
CHAPTER 1. INTRODUCTION
1.1 Statement of the Problem
The growing global population and the economic growth in industrialized and
developing countries give rise to a continuous increase in demand for energy. Energy
production worldwide depends on the combustion of fossil fuels, which produces
greenhouse gases (GHGs) and other undesired emissions. GHGs such as carbon dioxide
(CO2), methane (CH4), nitrous oxide (N2O), and ozone (O3) trap heat in the atmosphere
by absorbing infrared radiation. The term “global warming potential” (GWP) refers to the
potential that GHGs have to trap heat in the atmosphere over a certain time period and is
generally based on their cumulative radiative forcing (IPCC, 2007). GWP is typically
calculated for various GHGs over a span of 20, 100, or 500 years and expressed in the
form of CO2-equivalent (CO2-e) (Metz, Davidson, de Coninck, Loos, & Meyer, 2005;
Solomon, 2007).
Discussion of GHGs is usually focused on carbon dioxide because (1) CO2 is the
largest contributor to radiative forcing, and (2) human beings are adding CO2 to the
atmosphere at a historically high rate (Chen, 2005). In the United States, the electricity
generation sector is the largest source of anthropogenic GHG emissions, accounting for
30% of the total GHG emission as of 2013, followed by the transportation sector (U.S.
EPA, 2015).

2
Coal is the primary fossil fuel used for power generation, and it produces more
than 40% the country’s electricity (EIA, 2014b). Coal is the predominant fuel for
electricity generation not only in the U.S., but also worldwide, generating 30% of global
anthropogenic CO2 emissions and about 40% of energy-related CO2 emissions (EIA,
2016; Epstein et al., 2011). In the future, coal will continue to be a major source of
energy, both in the United States and around the world, because of its abundance and low
cost (EIA, 2011).
Figure 1.1 Historical and projected global energy-related CO2 emissions [in billion metric
tons] by fuel type between 1990 and 2040
Source: (EIA, 2016)
According to the Intergovernmental Panel on Climate Change (IPCC), preventing
the catastrophic impacts of climate change will require maintaining the global average
temperature at 1.1 o C/2 o F below the present level (IPCC, 2007). To avoid an increase in
temperature, the atmospheric concentrations of CO2 would need to be stabilized within

3
the range of 400-450 ppm at maximum, and they could not exceed 400 ppm in the long
term (IPCC, 2007). Achieving these targets requires that global CO2 emissions be
reduced by approximately 60% by 2050 in comparison to 2010 levels (Kasibhatla &
Chamedies, 2007). Kasibhatla and Chamedies (2007) have found that industrialized
countries, including the U.S., would need to decrease their GHG emissions by 80% in the
same time period. In theory, this goal could be achieved with an annual reduction of only
2%, which would be approximately 136 million metric tons of CO2-e per year.
In view of making substantial CO2 reductions, the IPCC has explored various
technological options for generating low-carbon energy. Among the most promising
options is carbon capture and sequestration (CCS). In brief, CCS collects and compresses
CO2 from point sources, including those in the power-generation industry, and then
transports the CO2 by pipeline, truck, ship, or train to suitable geological formations. A
detailed description of CCS is presented in Chapter 2. CCS technologies have the
potential to become a widely-used means of providing low-carbon energy. For example,
CCS could be used in the power-generation industry in general, and more specifically in
the coal-fired power industry, to produce low-carbon electricity (UK DECC, 2012). The
most applicable CCS technology for existing industrial facilities, including coal-fired
power plants, is post-combustion capture, in which an amine-based solvent such as
monoethanolamine (MEA) or methyl diethanolamine (MDEA) is used as an absorbent.
Furthermore, integration of CCS with CO2-enhanced oil recovery (EOR) could allow the
production of transportation fuel that is less carbon-intensive than conventional
petroleum-based fuels such as gasoline and diesel (De Oliveira, Marcelo E Dias,
Vaughan, & Rykiel, 2005). In CCS-CO2-EOR, carbon dioxide is sequestered and

4
compressed from point sources, and subsequently transported and injected into mature oil
reservoirs to enhance the recovery of trapped oil (ARI, 2010b).
Although the fundamentals of CCS are well understood, the technology has not
been strongly endorsed by a number of environmentalists and scholars because of their
limited experience with it. The implementation of CCS on a broad scale would require an
enormous input of resources and energy during the operation phase (Gibbins &
Chalmers, 2008; Marx et al., 2011). The eventual result of this implementation would be
an increased demand for fuel, which in turn would lead to further mining activities to
provide the additional energy required. Input materials such as pipelines, water, and
chemicals are also required throughout the technology’s life cycle. Random application
of CCS without clear guidance could have undesirable environmental and economic
consequences. Therefore, a comprehensive understanding of the environmental impacts
of CCS technologies is critically needed. The discussion is already turning to practical
challenges in the application of CCS. Large-scale implementation of CCS must include
an in-depth assessment of these technologies from a life-cycle perspective.
1.2 Objective
The primary objective of this research is to enrich the current understanding of the
sustainability of CCS, first, by use of the life cycle assessment (LCA) approach; second,
by extending the value of LCA through integration with region-specific geospatial
information using a geographic information system (GIS); and finally, by assessing the
potential application of CCS in line with the existing and future carbon market and
policies.
5
In the first component of the research, the LCA harmonization method is used to
deal with variations in recent LCA results for coal power plants. Although the literature
in this field has continued to mature, some variations in LCA results exist for legitimate
reasons, such as the assumptions made, the definitions of system boundaries, and the
methodologies followed (Heath & Mann, 2012). A similar challenge existed when the
LCA approach was used to assess the environmental footprint of biofuels (Farrell et al.,
2006).It is assumed here that LCA harmonization can provide more consistent estimates
by adjusting published results to common gross system boundaries (Whitaker, Heath,
O’Donoughue, & Vorum, 2012). Chapter 4 of this dissertation focuses on the use of LCA
harmonization in assessing the GWP and cumulative energy demand (CED) of post-
combustion CCS in a coal-fired power plant in terms of input and output resources. The
analysis identifies these resources, their environmental impacts, and their associated
emissions in terms of GWP by harmonizing the LCA results from relevant published
literature. In addition to producing varied results, most of the published CCS LCA studies
have had an “attributional” framework that focuses primarily on the environmental
impacts within the system boundary, independently of other systems. The second and
third components of this research, rather than following the approach of attributional
LCA (ALCA), involve a consequential life cycle assessment (CLCA) in order to
anticipate the effects of CCS adoption on market responses and current policy (Helin,
Sokka, Soimakallio, Pingoud, & Pajula, 2013). The deployment of CCS-EOR in various
industrial sectors has been investigated through the lens of the system expansion method
and the game-theory approach to facilitate the decision-making process.

6
This document is organized into seven chapters. Chapter 1 introduces the research
problem and expands on the objective of the research. Chapter 2 defines CCS and
comprehensively describes various CCS technologies. This chapter also presents current
CCS demonstration projects and highlights knowledge gaps. Chapter 3 briefly explains
the methodology that will be used for each research component in order to achieve the
objectives. Chapter 4 applies the LCA harmonization approach for various coal-fired
technologies in order to reduce variability in the results and provide more consistent
estimates. Chapter 5 extends the value of LCA by integrating the tool with GIS, and
explores the use of the system expansion approach in coal power plants, natural gas
plants, and ethanol facilities in the lower 48 states of the U.S. Chapter 6 establishes a
framework for assessing CCS-EOR deployment in industrial sectors, with a specific
focus on coal power plants and ethanol facilities, from a game-theory perspective under
various carbon market and policy scenarios. Finally, Chapter 7 summarizes the previous
chapters, highlights the existing gaps in knowledge, and provides recommendations for
future work. The research outline and the subjects to be investigated in this dissertation
are presented in Figure 1.2.

7
Figure 1.2 Dissertation outline
Chapter 1 is an introduction to the topic with the following objectives:
Objective I: Present the current and proposed CO2 emissions under the business-as-usual
scenario.
1. What are the problems with existing business-as-usual electricity generation?
2. How can a reduction in the current level of CO2 emissions be achieved?
Objective II: Underscore the potential role of CCS in mitigating anthropogenic CO2
emissions from major industrial sectors.
3. How can we mitigate CO2 emissions from power plants?
4. How can we reduce CO2 emissions from the transportation sector?
Objective III: Define the scope and state the problem to be investigated.
Out
line
Chapter 1
Overview
Statement of the problem
Chapter 2 Literature review
Chapter 3 Methodology
Chapter 4 LCA harmonization Various coal-fired technologies
Chapter 5 LCA-GIS Integration for CCS-EOR
Ethanol facilities
Coal-fired power plants
Natural gas power plants
Chapter 6 Potential for CCS-EOR deployment
Policy framework using game theory
Chapter 7 Conclusion Future work

8
5. Why is it important to use the LCA approach when assessing CCS as an option
for CO2 mitigation?
Chapter 2 discusses various CCS techniques, and presents current CCS demonstration
projects worldwide and U.S. efforts in further deployment. This chapter will address the
following:
Objective I: Describe the main principles of CCS technology and the available CO2
capture techniques.
1. What is CCS?
2. How can CO2 be captured from power plants? What types of technologies are
currently available?
3. What types of geologic formation are suitable for CO2 storage? What is the CO2
storage capacity in the U.S.?
Objective II: Highlight U.S. efforts in further deployment of CCS.
4. Why does post-combustion CCS have potential for implementation in coal-fired
power plants in the U.S.?
5. What is the current status of CCS in the U.S. and its application?
Objective III: Discuss the current knowledge gaps.
6. Why should the LCA approach be used to assess the sustainability of CCS
technology?
7. What are some of the issues that are encountered in the use of LCA?
8. What are the knowledge gaps in existing CCS LCA analysis?

9
Chapter 3 describes the research methodology and data collection process, as well as the
computer software used in the assessment. This chapter will address the following:
Objective I: Provide a framework for the research strategy.
Objective II: Highlight the tools that have been used in the pursuit of the research goals.
The subsequent chapters will address diverse objectives in order to provide a
comprehensive understanding of the potential for large-scale CCS deployment from
environmental, technical, and political perspectives:
Chapter 4: Analytical assessment of LCA studies in peer-reviewed scientific journals and
government publications, and LCA harmonization of the GWP and CED from previous
studies of post-combustion CCS technology in coal-fired power plants.
Objective I: Present the results of various LCA studies in the field.
Objective II: Provide a reasonable estimate of GWP and CED and improve the range of
variability among different sets of LCA results.
Chapter 5: Integration of LCA with GIS in order to compare GHG emissions in the EOR
process, utilizing CO2 from three industrial pathways (i.e., ethanol refineries, coal power
plants, and natural gas power plants).
Objective I: Explore the use of the system expansion approach from life-cycle and
geospatial perspectives for each source (pathway).
Objective II: Rank pathways geospatially in terms of their net life-cycle carbon intensity
for supplying the CO2 required to produce a barrel of crude oil via EOR.

10
Chapter 6: Framework for assessing CCS-EOR deployment in industrial sectors, with a
specific focus on coal power plants and ethanol facilities, from a game-theory
perspective.
Objective I: Highlight current and future challenges under various carbon policy
scenarios.
Objective II: Explore CCS-EOR deployment in industrial sources, with a specific focus
on coal power plants and ethanol facilities, and a strategy for existing and future carbon
policy approaches and incentives in terms of potential variations in carbon market
conditions.
Chapter 7: Conclusions and recommendations.
Objective I: Summarize the findings of this dissertation.
Objective II: Identify knowledge gaps and provide recommendations for future work.

11
CHAPTER 2. LITERATURE REVIEW
2.1 Background
Current energy consumption trends show a continuous increase in energy demand
that is driven by economic and population growth in both developing and developed
countries. The U.S. Energy Information Administration (EIA) predicts a 48% increase in
the world energy consumption by 2040 as compared to 2012 (EIA, 2016). The main
factor in this increase is the world’s basic need for electricity, which is generate by the
combustion of fossil fuel, produces GHGs. Therefore, energy experts, non-government
organizations (NGOs), international organizations, and scholars have studied the
effectiveness of CCS as a solution that will meet environmental, social, and political
goals for CO2 reduction. This subject has also attracted the attention of several
environmental NGOs, including the World Wildlife Fund (WWF). In 2007, the WWF
developed a model to examine the global technical and economic feasibility of a variety
of GHG emissions-mitigation technologies by utilizing the knowledge of experts in the
field. The exercise assessed promising technologies with maximum permissible CO2
emissions of 400 GtC – 500 GtC (billion metric tons of carbon) between 2004 and 2050.
The study concluded that implementation of CCS in 25% of the global energy supply by
2050 would reduce worldwide CO2 emissions by approximately 8 GtC per year.

12
This conclusion was found to be valid even when radical improvements in energy
efficiency and contributions of renewable energy sources were taken into account (WWF,
2007). Similarly, the United Kingdom Department of Trade and Industry (UK DTI)
studied the potential role of CCS in achieving a UK CO2 emissions reduction target of
60% by the year 2050. The study concluded that this target was realistic and that it could
be achieved only if CCS were implemented in at least 50% of fossil-fuel power plants
(UK DTI, 2005). The conclusion assumed that no new nuclear power stations would be
constructed. CSS has gained strong acceptance by different stakeholders and is widely
thought to be a valid CO2 mitigation tool, but it is critical to understand the technology in
greater depth before making fundamental decisions.
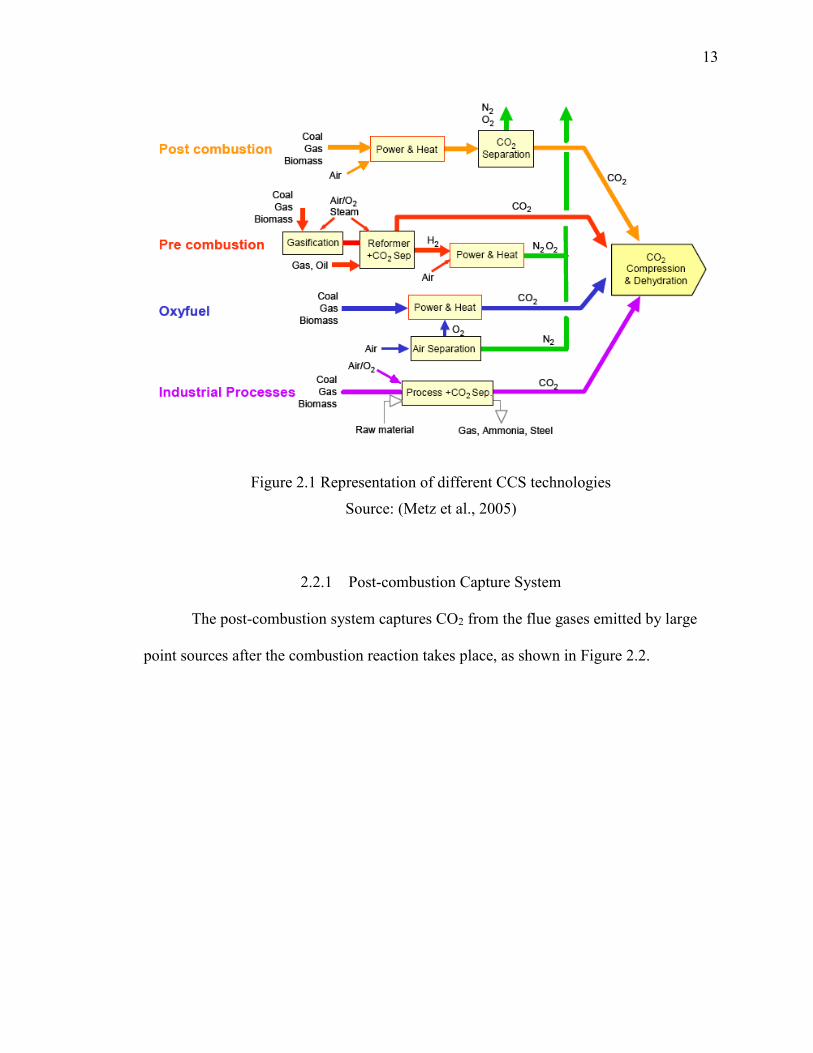
2.2 Technology Description
CCS is the process of storing CO2 underground in deep geologic formations (Metz
et al., 2005). The three main steps in the process are capture, transport, and sequestration
(Metz et al., 2005). Capture of CO2 can be achieved by means of three different
technological concepts: post-combustion systems, pre-combustion systems, and oxy-fuel
systems (Gibbins & Chalmers, 2008). Figure 2.1 provides a generic overview of the
different CO2 capture techniques.
13
Figure 2.1 Representation of different CCS technologies
Source: (Metz et al., 2005)
2.2.1 Post-combustion Capture System
The post-combustion system captures CO2 from the flue gases emitted by large
point sources after the combustion reaction takes place, as shown in Figure 2.2.

14
Figure 2.2 Schematic diagram of post-combustion capture
Source: (Global CCS Institute, 2014)
Post-combustion capture is an established, well-understood technology with CO2
removal efficiency of up to 90% (Rochelle, 2009), and it is used in a number of industrial
applications. The biggest advantage of the post-combustion capture system is that it
permits modifications to existing plants without operational disruption (Rochelle, 2009).
Therefore, this option is favored by several industries, including the power-generation
industry. The name of this technique is self-explanatory, as CO2 is removed after the
process of combustion has taken place. CO2 is captured either by liquid or solid chemical
absorbents (Metz et al., 2005). In the chemical absorption method, which is the most
widely used, an amine-based solvent such as MEA or MDEA is used as an absorbent.
The main principle of this method is the removal of CO2 from the flue gas using a lean
amine-based solvent, which is then cleaned with water to remove any ammonia residue
(Figueroa, Fout, Plasynski, McIlvried, & Srivastava, 2008). Next, the CO2-rich solvent is

15
sent to a stripper to be separated by the application of heat. The highly concentrated CO2
is then compressed and transported, primarily by pipelines, to storage sites where the
remaining solvent is recycled to the absorber system (Figueroa et al., 2008). This
technique is very energy intensive, in that a large amount of energy is required during the
stripping phase for effective separation. The technique also requires water for cooling,
CO2 absorption and stripping, and CO2 compression (Fluor Ltd., 2005; Rao & Rubin,
2002; Zhai & Rubin, 2010).
2.2.2 Pre-combustion Capture System
The main principle of this technique is the capture of CO2 before combustion by
converting carbon to an intermediary gas mixture of hydrogen (H2) and carbon monoxide
(CO) that burns to produce heat (Metz et al., 2005), as shown in Figure 2.3.
Figure 2.3 Schematic diagram of pre-combustion capture
Source: (Global CCS Institute, 2014)

16
In most cases, a gasifier is used to oxidize carbon. The products of this reaction
are CO and H2O, which react to form CO2 and additional H2. Then the CO2 is captured,
and the H2 is used as fuel. This technology is widely applied in the production of
fertilizer, chemicals, gaseous fuel (H2 and CH4), and power (Metz et al., 2005).
2.2.3 Oxy-fuel Capture System
In the oxy-fuel technique, an air separation unit (ASU) is used to generate
oxygen, which is used in a burner instead of air (Metz et al., 2005), as shown in Figure
2.4.
Figure 2.4 Schematic diagram of oxyfuel combustion
Source: (Global CCS Institute, 2014)
The products of this reaction are pure CO2, which is directly transported and stored,
and water vapor. Although this technique is promising, it is energy intensive, especially

17
in the initial air-separation step, which is responsible for oxygen generation (Metz et al.,
2005).
2.3 CO2 Transportation
Another part of the CCS technology, the transportation of CO2, is already well
understood in many industrialized countries. The U.S. has the necessary infrastructure
and experience to deal with transportation because CO2 is used commercially to enhance
oil recovery (Metz et al., 2005). The most challenging aspect of the transportation process
would be cohesive coordination between CO2 producers and end users. Network integrity
is also a concern because of possible pipeline corrosion, but the use of appropriate
corrosion inhibitors would solve this problem.
2.4 Suitable CO2 Storage Sites
A suitable CO2 geologic storage site must be at a minimum depth of 800 meters
underground (Metz et al., 2005). At the temperature and pressure that are reached at this
depth, CO2 enters the supercritical state and behaves like a liquid (Metz et al., 2005).
Greater quantities of CO2 can be stored as the depth and temperature increase (NETL,
2010b). The relationship between depth and pressure and the volume of CO2 to be stored
is shown in Figure 2.5.

18
Figure 2.5 Characteristics of an appropriate CO2 storage site
Source: (NETL, 2010b)
The blue numbers in Figure 2.5 indicate the volume of CO2 at different depths as
compared to standard atmospheric pressure. In addition to being sufficiently deep
underground, a suitable site for CO2 storage must meet the following requirements (Metz
et al., 2005):
1. Sufficient capacity: sequestering large volumes of CO2.
2. Sufficient injectivity: receiving CO2 at an efficient and economic rate of
injection.
3. Effective storage: retaining CO2 safely over extended periods of time.
The third requirement is the most difficult to evaluate because the standards for
storage effectiveness and duration have not been defined. According to the IPCC (2005),

19
appropriate, well-managed geologic reservoirs are very likely and likely to retain 99% of
the stored CO2 for 100 and 1000 years, respectively. Worldwide, guidelines for 99%
successful storage range from several thousand years to 5,000 years (Metz et al., 2005).
2.5 Potential Storage Sites
There are three major types of potential onshore geologic storage reservoirs for CO2:
depleted oil and gas reservoirs, un-mineable coal beds, and deep saline formations
(Hendriks, 1994; Holloway et al., 1996). In 2010, National Energy Technology
Laboratory (NETL) estimated that oil and gas reservoirs have the capacity to store U.S.
CO2 emissions for 21 years at the current CO2 emission rates (NETL, 2010b).
An overview and a description of potential CO2 geologic storage reservoirs is
presented in provided in Appendix A. All these sites meet the criteria listed in the
previous section. A basic illustration of the technology’s principles and potential geologic
storage options is provided in Figure 2.6.

20
Figure 2.6 Schematic showing geological sequestration of carbon dioxide emissions from a power station with CO2 capture system
Source: (Alberta Energy, 2011)
2.6 LCA of CCS Deployment in Coal-Fired Power Plants
Marx, Schreiber, Zapp, Haines, Hake, and Gale (2011) have suggested using the
life cycle assessment (LCA) approach as a tool to evaluate the environmental impacts of
CCS implementation (Marx et al., 2011). Schreiber and colleagues (2012) conducted a
meta-analysis of 15 LCA studies focusing on the GHG emissions of various CCS
technologies implemented in hard coal, lignite, and natural gas power plants. Such
findings can be constructive when comparing CCS technologies with one another in
terms of a given environmental impact category (Schreiber, Zapp, & Marx, 2012).
However, when various published studies of the same CCS technology are compared,
inconsistencies are observed in the results. According to Whitaker and colleagues, the use

21
of the LCA harmonization approach reduces variability in the results and provides more
consistent estimates by adjusting published results to common gross system boundaries
(Whitaker et al., 2012). The LCA harmonization project managed by the National
Renewable Energy Laboratory (NREL), with funding from the U.S. DOE, has covered
various fossil fuel based and a number of renewable power generation technologies, but
the incorporation of CCS in coal-fired power plants was not covered (NREL, 2013).
Therefore, investigating this gap will complement the NREL effort in this area. The LCA
harmonization approach has been applied to the amine-based post- combustion CCS with
the aim of reducing the variability observed in the published literature for GWP and
CED, see Chapter 4 for details.
2.7 Making CCS Attractive
Several studies have suggested the integration of CCS with CO2- EOR as another unique
approach for improving the energy outlook and reducing GHG emissions by producing
crude oil with low carbon intensity (Hussain, Dzombak, Jaramillo, & Lowry, 2013;
Jaramillo, Griffin, & McCoy, 2009; Khoo & Tan, 2006a; Middleton et al., 2015; Rhodes,
Clarens, Eranki, & Long, 2015). Table 2-1 lists the largest operational CCS projects in
the United States, with CO2-capturing capacities ranging from 0.68 to 8.4 MMT of CO2
per year. Most of these projects were not developed explicitly to target CO2 storage; the
decisions were instead based on economic considerations (McQuale, 2010).

22
Table 2-1 Commercial CCS projects in the United States as of 2013
Notes: MMT = million metric tons, EOR = enhanced oil recovery Source: (Global CCS Institute, 2012) personal analysis
As shown in Table 2-1, most of the CCS projects were developed to enhance oil
recovery, in which case it was possible to recover the initial capital cost (McQuale,
2010). In depleted oil and gas reservoirs, CO2 has been commercially used to increase
pressure and recover residual oil and gas (Lokhorst & Wildenborg, 2005). In CCS- CO2-
EOR, carbon dioxide is sequestered and compressed from point sources, and
subsequently transported and injected into mature oil reservoirs. CO2-EOR is a tertiary
oil recovery method that has been employed by the oil industry for more than 40 years to
increase pressure and recover residual oil from depleted reservoirs (ARI, 2010b; Hussain
et al., 2013).
In the United States, about 60 million metric tons (MMT) of CO2 are injected per
year in EOR, which produces more than 90 million barrels of oil (MMbo) annually. In
Project Name Country Stage / Status Purpose Transport MMT CO2 / Year
1 Century Plant United States,
TX Operational / Active
2010 EOR
Onshore to onshore pipeline, 43 miles
8.4
2 Shute Creek Gas Processing Facility
United States, WY
Operational / Active 1986
EOR Onshore to onshore
pipeline, 403 km 7
3 Val Verde Natural Gas Plants
United States, TX
Operational / Active 1972
EOR Onshore to onshore
pipeline, 132 km 1.3
4 Air Products Steam Methane Reformer
United States, TX
Operational / Active 2013
EOR Onshore to onshore pipeline, 101-150
km 1
5 Coffeyville Gasification Plant
United States, OK
Operational / Active 2013
EOR Onshore to onshore
pipeline, 112 km 1
6 Enid Fertilizer CO2-EOR Project
United States, OK
Operational / Active 1982
EOR Onshore to onshore
pipeline, 225 km 0.680
7 Lost Cabin Gas Plant United States,
WY Operational / Active
2013 EOR
Onshore to onshore pipeline
1

23
addition to natural CO2 supply, anthropogenic CO2 has been recovered from gas
processing and fertilizer production facilities in Texas and Wyoming for EOR projects
(MITEI, 2016). In 2013, the CO2-EOR technology produced, on average, 276000 barrels
of crude oil per day (bbl/d) (EIA, 2014a).
Advances Resources International (ARI) estimates that productive use of CO2 for
EOR could produce approximately 3.0-3.6 million additional barrels of oil per day
(MMbo/d) by 2030 and play an important role in reducing U.S. reliance on imported oil
(ARI, 2010b). In addition to current CO2-EOR production, it is estimated that there are
more than 24 billion barrels of economically recoverable oil, with the use of current EOR
practices in the lower 48 states of the U.S., with approximately 24% in East/Central
Texas, 22% in the Permian Basin of West Texas, and 30% split between California and
the Mid-Continent (Kuuskraa, Van Leeuwen, Wallace, & DiPietro, 2011a).When
considering the application of next generation EOR technologies, those estimates could
nearly triple (Kuuskraa et al., 2011a). It is important to highlight that about 70% of the
CO2 utilized in current CO2-EOR practices is from natural CO2-dedicated wells
(Middleton, Clarens, Liu, Bielicki, & Levine, 2014a). More than 83% of the remaining
30% of the CO2 used in EOR is supplied from acid gas processing plants such as natural
gas and oil refineries (Xu, Isom, & Hanna, 2010). Because the supply of natural CO2 is at
capacity, the role of CO2-EOR can be extended if combined with other innovative
methods such as utilizing CO2 from various industrial sources (Kuuskraa et al., 2011a).
An overview of the U.S. CO2 merchant market and the CO2 demand by EOR is presented
in Appendix A. Among industrial sources that have potential CO2 supply are ethanol

24
refineries, natural gas plants, and coal-fired power plants. Besides the potential CO2
supply from these sources, the geographical distribution of the plants makes them good
candidates as suppliers of CO2 and as substitutes for natural CO2 wells (Middleton et al.,
2014a). Figure 2.7 shows the distribution of corn ethanol plants (green dots), pulverized
coal-fired plants (grey hexagons), and natural gas power plants (yellow circles) in the
U.S., along with the various EOR fields. This map will be further refined in order to
identify viable CO2 sources in Chapter 5
Figure 2.7 Spatial distribution of pathways and CO2-EOR infrastructure in the lower 48
states of the U.S.
Source: (Abotalib, Zhao, & Clarens, 2016)
However, it is important to consider the environmental ramifications of CO2
capture from each source (pathway) by accounting for the net GHG impacts on the basis
of upstream, direct, and downstream impacts (i.e., from a life cycle perspective).
Capturing CO2 from ethanol plants, coal-fired power plants, and natural gas facilities

25
would increase the demand for primary fuel, chemicals, and infrastructure materials and
would subsequently increase indirect emissions throughout the value chain of each
industry. In contrast to ethanol plants, which produce a pure CO2 stream (i.e., biogenic
CO2 from the fermentation process), coal-fired and natural gas power plants produce a
stream with low CO2 concentration, between 10 to 17% by volume, with higher
associated energy and economic penalties.
2.8 Challenges for CCS Deployment
Recently developed geotechnical solutions have made it possible to capture CO2
emissions from industrial point sources by means of carbon capture and storage (CCS)
technologies (Metz et al., 2005). In this context, CCS can be applied directly to the power
generation sector or other industrial sources, and the captured CO2 can be utilized for
enhanced oil recovery (EOR). As discussed in the literature, CCS integration with CO2-
EOR has significant potential to reduce the carbon footprint of the U.S. transportation
sector by producing crude oil with lower carbon intensity than in conventional crude
recovery (Abotalib et al., 2016; Hornafius & Hornafius, 2015; Rhodes et al., 2015; U.S.
DOE, 2013; U.S. EPA, 2015). Finding an alternative and consistent CO2 supply would
allow the expansion of EOR projects and further the objectives of the Energy Policy Act
of 2005 (Energy Policy Act, 2005). However, current carbon policies do not provide
sufficient economic incentives for major carbon emitters to invest in CCS projects (Mills,
2014). Under the existing Federal 45Q Tax Credit, anthropogenic CO2 emitters that
capture at least 500,000 metric tons of CO2 during a taxable year receive a tax credit of
$10 per metric ton of CO2 captured (IRS, 2011). This allocated carbon credit creates a

26
huge gap between the costs associated with capturing and transporting CO2 from major
sources such as power plants under current market conditions and carbon price (Mills,
2014). Furthermore, the 45Q provision excludes potential biogenic CO2 sources such as
ethanol facilities (IRS, 2011). Although finding the right set of incentives can be a
complex and time-consuming process, establishing a framework that is more inclusive
and attractive for various industrial CO2 emitters would motivate more players to
participate and compete in order to maximize their benefits.
To determine the effects of polices on the decision-making of stakeholders, game
theory has been applied to a wide range of disciplines including the social sciences,
international relations, economics, ecology, and climate science (Başar, 2015; Dong, Li,
Li, Wang, & Huang, 2010; Kutasi, 2010; Morbee, 2014; Turocy & von Stengel, 2001).
Game theory can be defined simply as a mathematical decision-making tool. Participants
in a game (called “players”) aim to maximize their benefits or payoffs or, in some
situations, minimize their losses, regardless of the consequences for other players (Başar,
2015; Dong et al., 2010). This type of game is considered non-cooperative, meaning that
the players tend to act independently because they do not benefit from unilaterally
altering their choices when the strategies of other players stay the same. As a result,
players’ decisions are based on rational factors. Their optimal strategy in such a game is
referred to as a non-cooperative equilibrium or Nash equilibrium, a concept first
proposed by John Nash (Turocy & von Stengel, 2001). Recently, the literature has
presented climate policy in the form of game theory, with a focus on encouraging the
development of clean technologies, carbon price, and carbon-abatement-related policies
and on creating international negotiation frameworks among major carbon economies

27
(Helm, Hepburn, & Ruta, 2012; Knox‐Hayes, 2012; Kutasi, 2010; Urpelainen, 2013).
Chapter 6 presents a framework for assessing CCS-EOR deployment by industrial
emitters, with a specific focus on coal power plants and ethanol facilities, from a game-
theory perspective under various carbon policy scenarios, in the United States, with a
focus on the Illinois Basin.

28
CHAPTER 3. METHEDOLOGY
3.1 Overview
This chapters provides a brief description of the methodologies followed in
chapters 4, 5, and 6. In this chapter, section 3.1 describes the method of the LCA
harmonization. Section 3.2 describes the framework used for integrating LCA with GIS
for EOR. Section 3.3 describes the methodology implemented for establishing a
framework for assessing the CCS-EOR deployment from a game theory perspective.
3.1.1 Method for LCA Harmonization
In Chapter 4, the LCA harmonization approach to post-combustion CCS has been
implemented with an emphasis on GWP and CED to adjust variations in previously
published LCA studies and provide more robust and consistent conclusions. Data for this
analysis has been collected primarily from secondary sources, such as recent national and
international studies in the field as reported in peer-reviewed journal articles and
technical papers. Publications from intergovernmental organizations and governmental
departments were also used as resources for assessing the results of various LCAs in the
field:

29
3.1.2 Method for LCA GIS Integration
The LCA-GIS model has been designed to calculate the carbon intensity of CO2-
based enhanced oil recovery, where CO2 is utilized from three different industrial
sources, which are referred to as “pathways” throughout the analysis. The first pathway is
a corn-based ethanol plant with CCS (EtOH-CCS). The second and third pathways are a
coal-fired (PC-CCS) and a natural gas (NG-CCS) power plant, respectively; both use
amine-based post-combustion CO2 capture technology. Geospatial data for pathways was
obtained from the National Renewable Energy Laboratory’s (NREL) interactive mapping
tool, the National Energy Technology Laboratory’s (NETL) NATCARB database in
addition to the U.S. EPA Facility Level Information on Greenhouse Gases (FLIGHT) to
denote the CO2 emissions of 2014 (NETL, 2016; U.S EPA, 2015).
3.1.3 Method for LCA GIS Integration
The future of CCS-EOR deployment in ethanol refineries and coal power plants was
examined using the game theory approach. The framework has been designed to explore
the impacts of possible changes in carbon policies, the carbon market, and the cost of
CCS technologies on the decisions of industrial carbon emitters.

30
CHAPTER 4. LCA HARMONIZATION
4.1 Background and Motivation
The identification of more representative results requires a careful assessment of
the technology’s footprint during its entire life cycle. This chapter focuses on assessing
the GWP and CED of post-combustion CSS in a coal-fired power plant in terms of input
and output resources, by following the principles of the ISO-14040: 2006/14044:2006
standard, titled “Life-Cycle Assessment -- Principles and Framework,” to identify
resources, energy flows, and the potential impact of CCS deployment (ISO, 2006b).
According to ISO (14040:2006), an LCA should include four phases. The focus of Phase
I is to describe the aim of the LCA, define the functional unit to be compared, and draw
the system boundaries. In Phase II, the system’s input and output flows are identified to
generate life cycle inventories (LCIs) for all life cycle stages or processes. In Phase III,
life cycle impact assessment (LCIA), the LCI flows are converted into environmental
impact indicators targeting important local/global environmental concerns such as global
warming, cumulative energy demand, etc. The final phase (Phase IV) consists of
analytical interpretation of the LCIA results and addresses the questions posed in Phase I.
Data for this analysis has been collected primarily from secondary sources, such as recent
national and international studies in the field as reported in peer-reviewed journal articles
and technical papers.

31
Publications from intergovernmental organizations and governmental departments
were also used as resources for assessing the results of various LCAs in the field. This
analysis uses 1 kWh of electricity generated by a power plant with post-combustion CCS
as a functional unit. The selected power plants range in size from 400 to 800 MW prior to
the addition of CO2 capture. The system boundaries in this analysis incorporate the
processes shown in Figure 4.1.
Figure 4.1 Generalized system boundaries of post-combustion CCS technology
Source: (Abotalib & Zhao, 2015)
As illustrated in Figure 4.1, processes can be grouped as upstream and operational
processes:
1. Upstream processes
(I) Coal mining, including extraction, processing, and transportation of
coal required for plant operations.

32
(II) Amine production, including raw material, energy consumption, and
transportation.
2. Operational processes
(I) Coal combustion (direct emission from the stack, waste generated
from plant operations), and the CCS capture system operations (energy
requirement for amines regeneration and CO2 compression).
(II) CO2 transport and storage including CO2 transportation infrastructure
and energy required storing CO2 in deep geologic formations.
On the basis of the above considerations, the analysis focuses on GWP and CED.
GWP has been selected to assess the effectiveness of achieving the objective of CCS
throughout the technology life cycle. Whereas CED has been considered because it
accounts for the cumulative energy consumption during the life cycle of a product or
service, including the energy used in the production phase, use, and disposal phases of
the process. Therefore, CED can be used as an environmental as well as an economic
indicator. Although it is considered that all LCA studies follow the ISO standards, some
variations have been observed in the existing literature in the results for GWP and CED.
Therefore, the LCA harmonization approach has been implemented in order to adjust
variations in previously published LCAs and thus provide more robust and consistent
results, as described by Whitaker et al. (Whitaker et al., 2012). The following section
describes in further detail the approach that has been adopted.

33
4.2 Harmonization Method
The LCA harmonization in this research was conducted in accordance with a
harmonization project managed by the National Renewable Energy Laboratory (NREL),
with funding from the U.S. DOE, which consists of (1) system harmonization and (2)
technical harmonization (NREL, 2013). Because the NREL harmonization method has
been followed, the outcomes of this work will be more relevant to the NREL objective of
identifying representative estimates of the GWP and CED of CCS post-combustion
power generation technologies.
1. System Harmonization
System harmonization was applied to data from 42 studies representing 57
environmental impact estimates, according to the procedure in Figure 4.2.
Figure 4.2 System screening procedure
Source: adapted from (NREL, 2013)
• Published�a er�1990�• LCA�with�at�least�two�phases�• Consider�electricity�as�a�product�Round�1�
• ISO�14001�• Methodology�and�calcula on�• Quality�of�input�data�
Round�2�
Studies�considered�

34
Each LCA study went through two rounds of screening to ensure consistency and
comparability. The initial screening round eliminated publications that met any of the
following criteria:
� Published prior to 1990;
� LCA with fewer than two phases
� Did not consider electricity as a product of the technology;
� Presentation, abstract, or poster;
� Trade journal article of three or fewer published pages; or
� Conference paper of five or fewer double-spaced pages (or equivalent).
After the first screening round, a second, more comprehensive, screening exercise
was carried out for the remaining publications to ensure the quality of the frameworks
used and the outcomes of each publication, on the basis of:
� Adherence to the ISO-14040 framework for conducting LCA, as described above;
� Methodology used for calculating the investigated indicators; and
� Quality of the input data used (i.e., whether or not both empirical and theoretical).
System harmonization was applied to data from 42 studies representing 57
environmental impact estimates, according to the procedure in Figure 2 in main
manuscript. This screening exercise yielded 44 environmental impact estimates, which
were then used in the technical harmonization phase. (see Table 4-1 for details).

35
Table 4-1 Published LCA studies that passed the LCA harmonization screening requirements with key performance parameters
No. Author/s Tech. Eff. Eff. (CCS) Country
Decrease in power output
Increase in Fuel
Distance (km)
Depth (m)
1 (Muramatsu & Iijima, 2002) PC 41% 31% Japan 24% 32% 20 1250-
2000
2 (Spath & Mann, 2004) PC 41% 31% USA 24% 31% 300 800
3 (IEA GHG, 2006) USPC 44% 35% Netherlands 21% 27% NA NA 4 (Viebahn et al., 2007) PC 49% 40% Germany 18% 23% 300 NA
5 (Viebahn et al., 2007) PC (L) 46% 34% Germany 26% 35% 300 NA
6 (Odeh & Cockerill, 2008) SPC 40% 30% UK 24% 32% 300 800
7 (Dones, Bauer, Heck, Mayer-Spohn, & Blesl, 2007)min
USPC 43% 31% Europe 28% 34% 200 800
8 (Dones et al., 2007)max USPC 43% 31% Europe 30% 36% 400 2500
9 (Dones et al., 2007)min
PC (L) 43% 31% Europe 27% 38% 200 800
10 (Dones et al., 2007)max
PC (L) 43% 31% Europe 30% 43% 400 2500
11 (UKERC, 2008) PC 44% 35% UK 21% 26% 300 NA
12 (Koornneef, van Keulen, Faaij, & Turkenburg, 2008)
USPC 46% 35% Netherlands 24% 31% 100 3000
13 (Fripp, 2009) PC 33% 25% USA 24% 31% NA NA
14 (Pehnt & Henkel, 2009) RC
PC (L) 45% 27% Germany 39% 65% 325 NA
15 (Pehnt & Henkel, 2009)SD
PC (L) 46% 28% Germany 40% 65% 325 NA
16 (Schreiber, Zapp, Markewitz, & Vögele, 2010) 2010
SPC 46% 36% Germany 23% 30% 300 NA
17 (Korre, Nie, & Durucan, 2010) PC 40% 30% USA/global 25% 33% NA NA
18 (NETL, 2010c) PC 35% 24% USA 31% 45% 160 1236
19 (Schreiber et al., 2010)RETRO PC 46% 33% Germany 29% 41% 400 800
20 (Schreiber et al., 2010)ND_after_2020 PC 49% 38% Germany 23% 31% 400 800
21 (Schreiber et al., 2010)2010-2020 retrofit
PC (L) 45% 30% Germany 33% 49% 400 800
22 (Schreiber et al., 2010)ND_after_2020
PC (L) 48% 35% Germany 26% 36% 400 800
23 (Singh, 2010) SPC 43% 33% USA 23% 30% 500 1000
24 (Ziębik, Hoinka, & Liszka, 2010) PC 44% 33% Unknown 25% 33% NA NA
25 (Nie, Korre, & Durucan, 2011) PC 45% 34% USA 25% 33% 300 1000
26 (Suebsiri & Wilson, 2011)
PC (L) 31% 22% Canada 30% 43% NA NA

36
Table 4-1 Continued
27 (Marx et al., 2011) (Min.) PC 50% 40% Global 20% 25% NA NA
28 (Marx et al., 2011) (Max.) PC 50% 30% Global 40% 66% NA NA
29 (Marx et al., 2011) (Min.)
PC (L) 49% 40% Global 25% 18% NA NA
30 (Marx et al., 2011) (Max.)
PC (L) 46% 28% Global 65% 40% NA NA
31 (Singh, Strømman, & Hertwich, 2011a) SPC 43% 33% USA 24% 31% 500 NA
32 (Sathre, 2011) PC 44% 33% Global 25% 33% NA NA
33 (Sathre, 2011) PC (L) 46% 32% Global 30% 44% NA NA
34 (U.S. DOE, 2011) SPC 44% 33% USA 25% 33% 300 NA
35 (Singh, Strømman, & Hertwich, 2011b) SPC 43% 33% USA 24% 31% 500 NA
36 (Wangen, 2012) SPC 43% 33% Europe 24% 32% 250 1000
37 (Castelo Branco, Moura, Szklo, & Schaeffer, 2013)
PC 30% 25% Brazil 17% 21% 200 NA
38 (Śliwińska & Czaplicka‐Kolarz, 2013)
PC 37% 25% Poland 32% 48% NA NA
39 (Śliwińska & Czaplicka‐Kolarz, 2013)
SPC 39% 27% Poland 30% 44% NA NA
40 (Śliwińska & Czaplicka‐Kolarz, 2013)
PC 37% 25% Poland 32% 48% NA NA
41 (Śliwińska & Czaplicka‐Kolarz, 2013)
SPC 39% 27% Poland 30% 44% NA NA
42 (Liang et al., 2013) USPC 43% 33% China 23% 30% 100 3000
43 (Koiwanit et al., 2014) PC (L) 31% 21% Canada 33% 49% NA NA
44 (Zhang et al., 2014) SPC 46% 34% Norway 26% 35% 200 800
Table 4-1 presents studies passed the two-harmonization screening rounds. Some
studies provided more than one estimates based different scenarios and assumptions
made. In Table 4-1, each estimate is presented in a separate row to include the
followings:
1. Author and year,
2. Coal-fired technology,

37
3. Thermal efficiency before CCS deployment (Eff.),
4. Thermal efficiency with CCS deployment (Eff. CCS),
5. Country or region,
6. Decrease in plant’s power output,
7. Increase in fuel demand,
8. Distance to CO2 storage sites,
9. Depth of CO2 storage formations
Some studies, in Table 4.1, have passed the system and technical screening rounds,
but did not cover all the processes defined within the system boundaries as illustrated in
Figure 4.1.
2. Technical Harmonization
Coal-fired technologies can be classified into four groups: pulverized coal (PC),
pulverized coal (lignite) (PC) (L), supercritical pulverized coal (SPC), and ultra-
supercritical pulverized coal (USPC). It was found that some of the studies that passed
the two screening rounds did not cover all the processes defined within the system
boundaries in Figure 4.1. Therefore, an emission profile, which expresses the relative
impact of each process on the LCIA results, was established for each technology, and an
adjustment was made for those estimates with incomplete system boundaries. After the
estimates had been adjusted to common system boundaries by incorporating the effects of
missing processes, the outliers, i.e., any estimates that were outside the “whiskers” in
box-and-whisker plots of the data, were eliminated. In other words, estimates that were
greater or less than 1.5 times the interquartile (IQ) range were omitted from the

38
harmonized results. In Figure 4.3, the LCA studies considered in this analysis are
presented in a geographic map in order to highlight the regions that have shown interest
in researching the topic and to aid in interpretation of results in relation to regional
differences.
Figure 4.3 Geographic map showing the spatial distribution of data analyzed
Source: (Abotalib & Zhao, 2015)
It can be seen that most of the studies have focused on Europe as a baseline,
followed by North America (USA and Canada). Details of each study and their
underlying assumptions are provided in Table 4-1. The results, henceforth, are presented
in the form of relative changes in GWP and CED per 1 kWh of electricity generated with
the use of CCS. Two statistical indicators are employed: (1) the arithmetic mean, which
refers to the average value of the data, and (2) the Q3 value, which refers to the 75th

39
percentile, where 75% of the data fall at or below that value. As can be seen in Figure
4.4, the published estimates show a significant reduction in GWP, ranging from 65% to
85% for all coal-fired technologies.
Figure 4.4 Box plot of published estimates considered in the analysis
In regard to CED, the Q3 and mean values indicate a considerable increase input
resources. The results in Figure 4 were further refined by breaking down coal-fired
technologies into four groups: pulverized coal (PC), pulverized coal (lignite) (PC) (L),
supercritical pulverized coal (SPC), and ultra-supercritical pulverized coal (USPC). This
classification allows a comparison of various coal-fired technologies in terms of the
environmental impact categories considered.

40
Figures 4.5 and 4.6 show published estimates and harmonized estimates of GWP
and CED, respectively, for each technology with CCS, compared to the same
technologies without CCS. The mean and Q3 values are again used as general
representative indicators for the impact categories that were investigated in each case.
4.3 Results
4.3.1 Global Warming potential
Note: (PC) = pulverized coal, (PC) (L) pulverized coal (lignite), (SPC) = supercritical pulverized coal, and
(USPC) = ultra-supercritical pulverized coal. 1 = published estimates, and 2 = harmonized estimates.
Figure 4.5 Box plots of studies considered in the analysis, illustrating the percentage of change in GWP for each evaluated coal-firing technology compared to the no-CCS
scenario, using technology-specific information
Source: (Abotalib & Zhao, 2015)
Figure 4.5 confirms the general assumption that CCS can provide a signification
reduction in GWP in all coal-fired technologies. The level of decrease in GWP is affected
primarily by the fuel production process and direct emissions from plant operations. Fuel

41
production process and direct emissions from plant operations are accountable for about
40% and 50% of the overall GWP respectively. However, lignite has a different emission
profile, and in this case the fuel production process contributes 25% and direct emissions
from the plant 60%, due to lower efficiency, of the overall GWP. The remaining GWP
for all fuel types is generally distributed between amine production and CO2 transport
and storage processes. Technology-specific emission profiles of the GWP for each
process are provided in Table 4-2.
Table 4-2 Share of life-cycle process to the total impacts for GWP for each coal-fired technology
Process Upstream Operational
Technology Coal mining & transport
Amine production Fuel combustion CO2 transport & storage
Averaged PC 48% 6% 40% 5% Averaged PC (L) 25% 9% 60% 6% Averaged SPC 40% 4% 54% 3%
Averaged USPC 45% 5% 44% 5%
Averaged and 75th percentile results
In the GWP category, the estimates suggest a significant reduction regardless of
the coal-fired technology considered. The mean reduction in GWP was 80% for the PC
(L) technology, 72 % for SPC, 70% for PC, and 68% for USPC. The results indicate that
the Q3 values for PC, USPC, and SPC were nearly equal, with a reduction in GWP of
66%, 67%, and 68%, respectively. For example, a conventional pulverized coal power
plant (PC) without CCS and a thermal efficiency of 38% would emit 960 g of CO2 per
kWh of electricity generated from a life cycle standpoint (UChicago Argonne, 2014).
When CCS to be applied to same plant, the net GWP would be 288 g of CO2 per kWh of
electricity. The PC (L) technology shows a possible additional reduction in GWP of 10%,
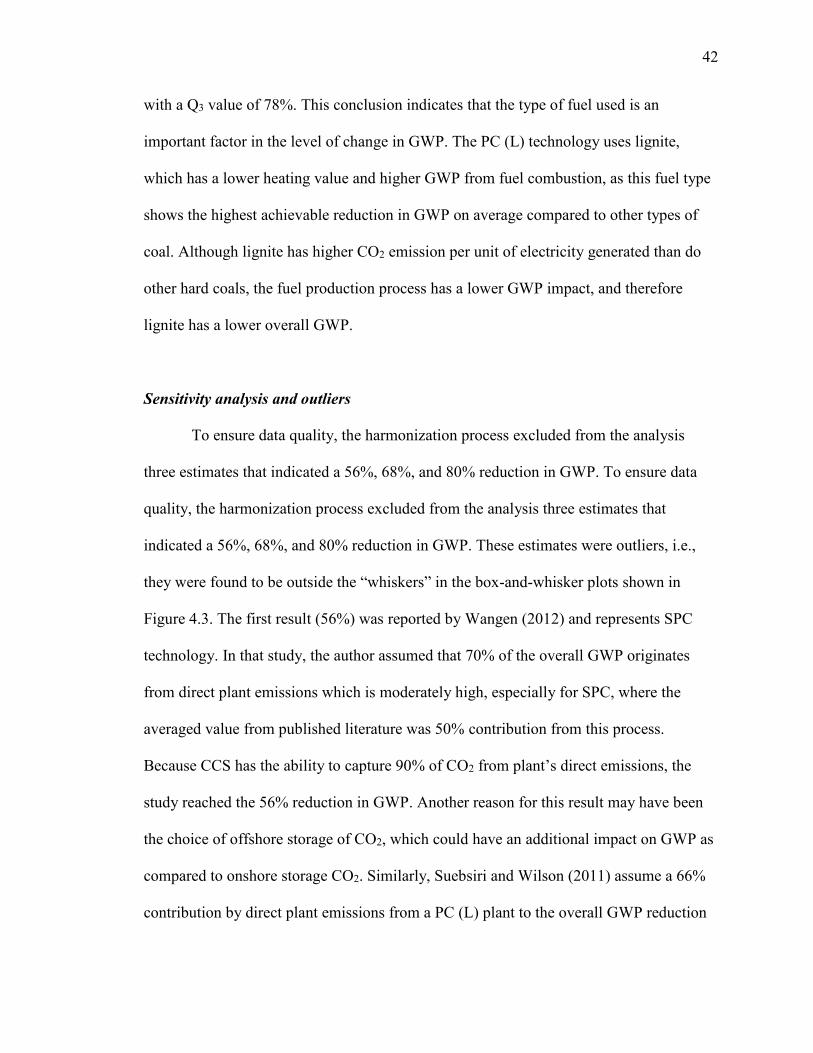
42
with a Q3 value of 78%. This conclusion indicates that the type of fuel used is an
important factor in the level of change in GWP. The PC (L) technology uses lignite,
which has a lower heating value and higher GWP from fuel combustion, as this fuel type
shows the highest achievable reduction in GWP on average compared to other types of
coal. Although lignite has higher CO2 emission per unit of electricity generated than do
other hard coals, the fuel production process has a lower GWP impact, and therefore
lignite has a lower overall GWP.
Sensitivity analysis and outliers
To ensure data quality, the harmonization process excluded from the analysis
three estimates that indicated a 56%, 68%, and 80% reduction in GWP. To ensure data
quality, the harmonization process excluded from the analysis three estimates that
indicated a 56%, 68%, and 80% reduction in GWP. These estimates were outliers, i.e.,
they were found to be outside the “whiskers” in the box-and-whisker plots shown in
Figure 4.3. The first result (56%) was reported by Wangen (2012) and represents SPC
technology. In that study, the author assumed that 70% of the overall GWP originates
from direct plant emissions which is moderately high, especially for SPC, where the
averaged value from published literature was 50% contribution from this process.
Because CCS has the ability to capture 90% of CO2 from plant’s direct emissions, the
study reached the 56% reduction in GWP. Another reason for this result may have been
the choice of offshore storage of CO2, which could have an additional impact on GWP as
compared to onshore storage CO2. Similarly, Suebsiri and Wilson (2011) assume a 66%
contribution by direct plant emissions from a PC (L) plant to the overall GWP reduction

43
of 68%. This share is not significantly higher than the averaged estimate of 59% for PC
(L), but the system boundaries in the study excluded the impact of two processes: amine
production and CO2 transport and storage. When the effects of these processes were
incorporated, the reduction in GWP decreased from 80% to 68%, which is outside the
whisker box for PC (L), as shown in Figure 4.3. The third outlier removed from the
harmonized GWP category was the IEA GHG (2006) estimate for the case of USPC,
which suggests an overall reduction of 79%. Although that study focused on the USPC
coal-fired technology, lignite was the main type of coal considered. The study’s
conclusion of a 79% reduction is not within the harmonized reduction range for USPC,
although it may be valid for PC (L). Furthermore, the study addresses a European case in
which lignite is typically surface mined and transported over a relatively short distance to
the power plant via conveyors, with the result of a lower GWP impact in the upstream
processes (IEA GHG, 2006).

44
4.3.2 Cumulative Energy Demand
Note: (PC) = pulverized coal, (PC) (L) pulverized coal (lignite), (SPC) = supercritical pulverized coal, and
(USPC) = ultra-supercritical pulverized coal. 1 = published estimates, and 2 = harmonized estimates. Figure 4.6 Box plots of studies considered in the analysis, illustrating the percentage of
change in GWP for each evaluated coal-firing technology compared to the no-CCS scenario, using technology-specific information
Source: (Abotalib & Zhao, 2015)
As shown in Figure 4.6, CCS deployment causes an increase in CED without
regard to the specific coal-fired technology. The increase in CED occurs because more
auxiliary energy is needed for CO2 capture and compression, and this higher energy
requirement will eventually increase the demand for natural resources throughout the
technology’s life cycle. For example, a conventional pulverized coal power plant (PC)
without CCS and a thermal efficiency of 38% would require about 11 MJ of natural
resources (i.e. CED including fossil and non-fossil resources) per kWh of electricity
produced (UChicago Argonne, 2014). The PC (L) and PC technologies, which are less

45
efficient, have exhibited a larger increase in CED, which is primarily due to
corresponding increases in fuel consumption of as high as 65% and 66%, respectively. In
contrast, SPC and USPC are more efficient technologies and have exhibited an increase
in fuel demand of only 30-38%. Therefore, they would have a smaller effect on the
overall CED impact category. Technology-specific emission profiles of the CED for each
process are provided in Table 4-3.
Table 4-3 Share of life cycle process to the total impact for CED for each coal-fired technology
Process Upstream Operational
Technology Mining and transport
Amine production Fuel combustion CO2 transport & storage
Averaged PC 97% 3% 1% 2% Averaged PC (L) 100% 5% 0% 0% Averaged SPC 97% 3% 1% 2%
Averaged USPC 97% 3% 1% 2%
Averaged and 75th percentile results
In Figure 4.6, the averaged estimates of CED for PC, PC (L), SPC, and USPC
indicate increases of 41%, 49%, 36%, and 37% respectively. The harmonized Q3
estimates show a similar trend, with an increase in CED of 52% for PC, 57% for PC (L),
and 38% for SPC and USPC. These findings indicate that PC and PC (L) technologies
have a higher energy penalty than SPC and USPC.
Sensitivity analysis and outliers
While there is a consensus in the literature in regard to an increase in CED for all
technologies, Marx and colleagues (2011), Pehnt and Henkel (2009), and Śliwińska and
Czaplicka‐Kolarz, (2013) determine either a lower or higher increase in CED compared

46
to published literature. Therefore, these estimates were not included in the harmonized
results. Marx and colleagues (2011) evaluated the worst-case CCS scenario and a
scenario for a PC plant that used the best available CCS technology (BAT CCS). In the
worst-case scenario a significant drop in the plant’s efficiency is anticipated, from 46% to
28%. This prediction represents a skeptical view of the technology, in which CED
increases by 77% because of the reduction in efficiency. In contrast, the second scenario
assumes an efficient CCS system, which represents a very optimistic view of the
technology, with an increase in CED of 21%. This finding was also omitted from the
harmonized results because it was far outside the IQ range for PC power plants. The other
estimate removed from the analysis that reported by Pehnt and Henkel (2009) for the PC
(L) coal-fired technology. Their study used a relatively high net efficiency of 46% for a
lignite plant without CCS, which would drop to 28% with the deployment of CCS. This
drop represents a decrease in plant efficiency of about 40% and is two times the
estimated values in the literature for similar plants. The final omitted estimate, reported
by Śliwińska and Czaplicka‐Kolarz (2013), is that of 56% increase in CED. The study
used a slightly lower net plant efficiency of 39% for SPC, whereas other SPC studies
have assumed net plant efficiency in the range of 40% to 46%. This lower efficiency led
to a 52% increase in the CED category, which appears to be reasonable for conventional
power plants but not for SPC coal-fired technologies.
4.4 Summary
The LCA approach has been suggested as a holistic tool for evaluating the
environmental impact of CCS implementation. CCS is a relatively new technology, and

47
various LCA studies have provided differing results. In this analysis, the LCA
harmonization approach has been applied to post-combustion carbon capture and
sequestration with the aim of reducing the variability observed in the published literature,
and with a focus on GWP and CED. Despite the observed variations among various
LCAs studies, they agree in regard to a significant reduction in GWP and a considerable
increase in CED. The CED category mainly increases due to an increase in energy
demand, which results in greater exploitation of natural resources throughout the life
cycle of the technology. Therefore, more efficient technologies have less environmental
impacts. Assuming the deployment of amine-based post-combustion CCS technology
with 90% CO2 capture efficiency, two processes recognized to have substantial impacts
on the results are the coal combustion process (operational phase) and the fuel production
process (upstream phase). Furthermore, it has been demonstrated that MEA production
and CO2 transport and storage have marginal effects on GWP. The harmonized results for
the CCS amine-based post-combustion technology indicate a potential reduction in GWP
ranging from 56% to 80%. Although the results from the published literature were
adjusted to common system boundaries, variations in the harmonized results still existed
because of differences in the underlying assumptions made by each study, such as fuel
type and characteristics, boiler type, methods of transporting fuel and chemicals,
transportation distance, MEA requirements and losses due to chemical regeneration, and
distance to CO2 storage sites. Lignite provides a good example of the impact of coal type
on emissions profiles for each process. Lignite has a lower heating value than that of sub-
bituminous and bituminous coal and therefore a greater GWP impact during combustion.
However, lignite is normally surface-mined and transported to the power plant over a

48
relatively short distance and hence has a lower impact on GWP. To improve the level of
consistency in the results, it is essential to establish standardized values for key
parameters, such as the development of plant efficiencies and energy penalties, capture
efficiency, purity of the CO2, and location of the fuel source and composition (Marx et
al., 2011). In addition to the above considerations, with the acknowledged environmental
trade-offs associated with CCS deployment for all coal-fired technologies, it is crucial to
make a distinction between global and regional consequences. For example, global
warming has global significance, whereas the effects of CED are observed on a more
regional level. Hence, any potential increase in these categories should be carefully
evaluated on a case-by-case basis, taking into account the potential impacts on the
regional ecosystem. Such an evaluation can be accomplished by integrating LCA findings
with a region’s specific spatial and temporal records in order to better evaluate the
significance of each impact category independently.
49
CHAPTER 5. LCA-GIS INTEGRATION
5.1 Background and Motivation
In the United States, the transportation sector is the second largest source of
greenhouse gas (GHG) emissions, after the electricity generation sector, accounting for
27% of the total GHG emissions as of 2013 (U.S. EPA, 2015). In 2007, California
introduced the Low Carbon Fuel Standard (LCFS), which was the world’s first regulation
aimed at reducing carbon intensity in transportation fuels. The U.S. Department of
Energy (U.S. DOE) has also examined the future of transportation fuel through the lens
of the Transportation Energy Futures project, which addressed multiple futuristic
approaches, such as controlling the growth of the transportation sector, increasing the use
of biofuels, and escalating electric and hydrogen-power vehicle technologies (U.S. DOE,
2013). Similarly, the U.S. Environmental Protection Agency (U.S. EPA) has initiated the
Renewable Fuel Standard (RFS) Program with the objectives of reducing the GHG
emissions of transportation fuel as well as reducing the nation’s reliance on foreign oil.
Under the RFS legislation, the U.S. biofuel industry is projected to produce 36 billion
gallons of biofuels (primarily ethanol), which would be equivalent to 16% of
transportation fuels consumed in the U.S., by 2022 (Hornafius & Hornafius, 2015). In
2010, the ethanol production capacity in the U.S. was 13.9 billion gallons, which was
equivalent to 10% of the country’s gasoline consumption (RFA, 2012).
50
Although the proposed strategies can play important roles in reducing GHG
emissions from the transportation sector, a combined set of strategies can achieve better
outcomes (Rhodes et al., 2015). Integrating CCS with CO2-EOR could be a unique
prospect, leading to escalate the deployment of commercial CCS projects, increased local
oil supply, and the production of less carbon intensive transportation fuel as an alternative
to conventional petroleum-based transportation fuels such as gasoline and diesel (De
Oliveira, Marcelo E Dias et al., 2005). Recently, the literature has examined the life cycle
GHG emissions of CO2-EOR deployment from various anthropogenic (e.g., coal or
natural gas (NG) power plants and NG processing plants) and biogenic (e.g., ethanol
plants) industrial sources. For example, the life cycle GHG emissions of pulverized coal
with CCS (PC-CCS) and CO2-EOR applications have been examined in previous studies
(Cooney, Littlefield, Marriott, & Skone, 2015; Jaramillo et al., 2009; Khoo & Tan,
2006b; Kuuskraa et al., 2011a). Other studies have examined the GHG emissions of
crude oil produced via EOR using the CO2 from natural gas power plants (Rhodes et al.,
2015; Zapp et al., 2012). Rhodes et al. (2015) analyzed emissions in California and used
a crude production rate of 2.5 bbl/tCO2 injected. According to data for 2012, the crude oil
CO2-EOR production rate is a site-specific parameter and varies by oil basin, ranging
from 0.9 to 3.8 bbl/tCO2 (NETL, 2014b). This point was partially addressed by Cooney et
al (2015) by using two different crude recovery rates of 2 and 4.35 bbl/tCO2 for current
EOR and advanced EOR technologies, respectively (Cooney et al., 2015). Therefore, this
parameter would play an important role in the life cycle assessment (LCA) results for
EOR geospatially. Hussain et al. (2013) evaluated switchgrass and livestock manure
biogas as biogenic CO2 sources; they did not consider corn ethanol plants as candidates

51
despite ethanol’s wide-spread use. Furthermore, the analysis compared CO2 sources on
the basis of their net GHG emissions without taking into account their geospatial
distribution in relation to candidate EOR basins (Hussain et al., 2013). The life cycle
GHG emissions of EOR using biogenic CO2 from biomass and corn ethanol refineries
have been addressed in other studies (Hornafius & Hornafius, 2015; Laude, Ricci,
Bureau, Royer-Adnot, & Fabbri, 2011). Hornafius and Hornafius (2015) assigned a
monetary carbon credit based on reduced carbon content in fuel rather than reporting the
carbon intensity of the CO2-EOR crude. In another study, Laude et al. (2011) focused on
a gate-to-gate LCA approach that excluded the biofuel’s upstream emissions as well as
emissions associated with crude refining and combustion.
In summary, these studies have used inconsistent system boundaries, different
functional units, and different LCA allocation methods. In addition, some studies rely on
site-specific assumptions, which are not representative for other locations. The objective
of the present analysis is to extend the value of LCA by integrating the LCA tool with
geospatial information using GIS. This analysis also explores the use of the system
expansion approach (for details, see the Method section) from life cycle and geospatial
perspectives for each source (pathway). The scenario examined represents a cradle-to-
grave case, which accounts for the upstream GHG emissions associated with CO2 supply
from each pathway and subsequently allocates carbon emissions credit on the basis of
other products produced in parallel. The combined LCA-GIS approach integrates LCA
results from each CO2 pathway (coal power plants, natural gas plants, and ethanol
refineries) with site-specific geospatial data for potential recoverable crude oil basins and
information about existing/proposed CO2-EOR infrastructure in the lower 48 states of the

52
United Sates. Coupling LCA with GIS can be a powerful environmental decision-making
tool for deepening our understanding of the overall carbon footprint of each pathway with
respect to potential EOR crude oil basins. Subsequently, the pathways can be ranked
geospatially in terms of their net life cycle carbon intensity for supplying the CO2
required to produce a barrel of crude oil via EOR. The analysis covers the processes of
CO2 capture and sequestration from potential sources (pathways), crude recovery and
transport to a U.S. petroleum refinery, crude refining, and end-use consumption of
refined products.
5.2 Method and Model Description
The model has been designed to calculate the carbon intensity of CO2-based
enhanced oil recovery, where CO2 is utilized from three different industrial sources,
which are referred to as “pathways” throughout the analysis, as illustrated in Figure 5.1.
Geospatial data for pathway one was obtained from the National Renewable Energy
Laboratory’s (NREL) interactive mapping tool and CO2 form ethanol fermentation
process was calculated using the generalized stoichiometric ratio approach based on
annual ethanol production, as approached by Middleton et al. (2014) (Middleton, Clarens,
Liu, Bielicki, & Levine, 2014b; NREL, 2016). For pathways 2 and 3, we used the
National Energy Technology Laboratory’s (NETL) NATCARB database in addition to
the U.S. EPA Facility Level Information on Greenhouse Gases (FLIGHT) to denote the
CO2 emissions of 2014 (NETL, 2016; U.S EPA, 2015).
In order to identify viable CO2 candidates for existing and planned EOR fields,
ArcGIS, a geographical mapping software developed by ESRI, was used to perform

53
spatial analysis on the basis of two key parameters: 1) minimum power generating
capacity of 400 MW for sources in pathways 2 and 3 (ESRI, 2011; IEA, 2011), and 2)
maximum distance of 100 miles between a CO2 pathway and an EOR oil basin. We
understand that current CO2 EOR pipelines exist from Colorado to West Texas for EOR
at much greater distance (about 600 miles) (Middleton et al., 2015). However, using
similar value or even half the distance would have significant economic implications on
CO2 transport, as illustrated by the FE/NETL model (NETL, 2014a). The NETL model
uses a default CO2 transport distance of 62 miles to eliminate the needs for additional
pumps to transport the CO2 from the source to EOR reservoirs. We examined increasing
the distance to cover more CO2 candidates and at the same time keep cost attractive for
EOR operators. At 100-miles transport distance, cost would only increase by 40% as
opposed to 300% when the distance was increased to 300 miles. No minimum capacity
restriction was placed on pathway 1, as it produces a pure CO2 stream. This consideration
yielded a total of 76 CO2 candidates consisting of 21 ethanol plants (pathway 1), 22 coal
power plants (pathway 2), and 33 natural gas power plants (pathway 3). Using the CO2
supply from each pathway, we generated a map that illustrates recoverable crude oil in
each EOR basin with respect to region-specific CO2 to crude oil recovery rates, as shown
in Figure 5.1.

54
Figure 5.1 Map of CO2 pathways within 100 miles of EOR fields in the lower 48 states of the U.S. Quantities of CO2available from the pathways were converted to barrels of crude
oil to be recovered via EOR
Source:(Abotalib et al., 2016)
To illustrate possible future CCS directions, the LCA scenario examined applies
the system expansion approach, which accounts for upstream emissions of co-products,
such as electricity and ethanol fuels, produced within the CO2 supply process from the
pathways, as well as credits displacement values for these co-products. In this model, the
entire credit goes to the functional unit defined, which is a barrel of crude oil recovered
and consumed via EOR, based on the GHG emissions emitted by conventional ethanol
and electricity production in pathways 1,2, and 3. Table 5-1 highlights the key
assumptions made in the pathways and the scenario examined in this analysis. Because
this analysis aimed at comparing the carbon intensity of crude oil extracted via EOR for

55
each pathway, GHG emissions is the primary environmental indicator used throughout
the analysis; other environmental impact categories were considered to be outside the
scope of this work. We used the calculation method of the IPCC (2007) to express GHG
emissions in the form of CO2-e over a span of 100 years (Solomon et al., 2007).
Table 5-1 Processes included in the scenario and pathways examined in the present analysis
System process
Pathway 1 Pathway 2 Pathway 3
CO
2 sup
ply
Includes LCA GHG emissions
stages related to ethanol
manufacturing with CO2
capture:
� Corn farming
(including land use
change)
� Corn transport to
ethanol facility
� Ethanol
manufacturing (i.e.,
fermentation)
Regional electricity grid mixes
supply required energy for
CO2 compression.
Includes LCA GHG emissions
stages related to electricity
generation from coal with CO2
capture:
� Coal mining
� Coal transport
� Coal combustion
� Amine production
The same plant provides
necessary energy for CO2
separation from flue gas (CCS
system) by increasing fuel
input.
Includes LCA GHG emissions
stages related to electricity
generation from natural gas
with CO2 capture:
� Natural gas
production
� Natural gas transport
� Natural gas
combustion
� Amine production
The same plant provides
necessary energy for CO2
separation from flue gas (CCS
system) by increasing fuel
input.
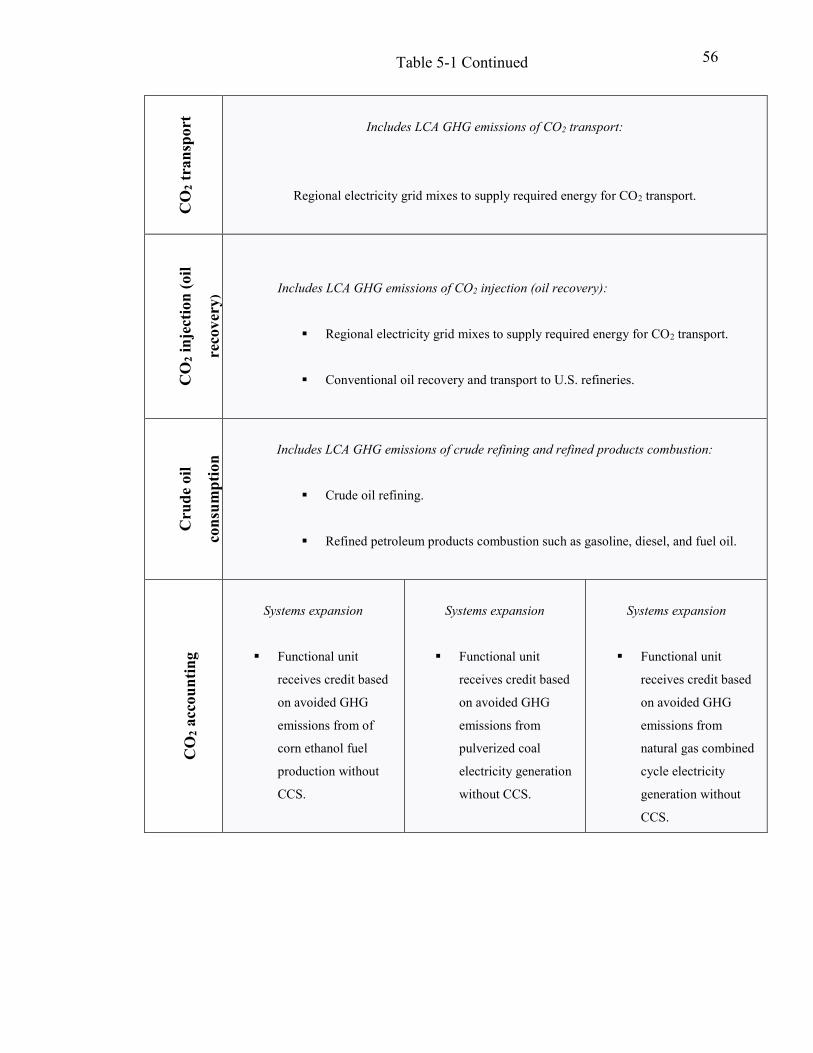
56
CO
2 tra
nspo
rt
Includes LCA GHG emissions of CO2 transport:
Regional electricity grid mixes to supply required energy for CO2 transport.
CO
2 inj
ectio
n (o
il
reco
very
)
Includes LCA GHG emissions of CO2 injection (oil recovery):
� Regional electricity grid mixes to supply required energy for CO2 transport.
� Conventional oil recovery and transport to U.S. refineries.
Cru
de o
il
cons
umpt
ion
Includes LCA GHG emissions of crude refining and refined products combustion:
� Crude oil refining.
� Refined petroleum products combustion such as gasoline, diesel, and fuel oil.
CO
2 acc
ount
ing
Systems expansion
� Functional unit
receives credit based
on avoided GHG
emissions from of
corn ethanol fuel
production without
CCS.
Systems expansion
� Functional unit
receives credit based
on avoided GHG
emissions from
pulverized coal
electricity generation
without CCS.
Systems expansion
� Functional unit
receives credit based
on avoided GHG
emissions from
natural gas combined
cycle electricity
generation without
CCS.
Table 5-1 Continued

57
Poss
ible
cre
dite
d en
titie
s
At least two of the following three entities
1. Operating facility as the party responsible for preventing escape into the atmosphere.
2. CO2 operator as the party responsible for injecting the CO2 underground.
3. Oil refinery for purchasing crude oil of lower CI.
Notes:
� Pathways 1, 2, and 3 are compared to the business-as-usual (BAU) baseline, which is conventional crude recovery. � The BAU case includes LCA GHG emissions stages related to crude oil recovery, transport to U.S. refineries, and
combustion (see appendix B for details).
As mentioned earlier, the LCA model expands the system boundaries in order to
account for negative emission credits for co-products using the system expansion or
displacement method in accordance with ISO standards 14040-14044 (ISO, 2006a; ISO,
2006b). Appendix B provides additional information about the technical performance
parameters for each pathway. A schematic of the system boundaries for pathways 1, 2,
and 3 is shown in Figure 5.2, where the grey boxes represent co-products. As shown in
Figure 5.2, all pathways generate a common product, which is crude oil, and two distinct
co-products, which are ethanol in pathway 1 and electricity in pathways 2 and 3.
Table 5-1 Continued

58
Figure 5.2 Model system boundaries for pathways 1, 2, and 3
Source: (Abotalib et al., 2016)
In Figure 5.2, the system boundaries for each pathway are shown as multiple
system processes, where each system process is treated as a discrete black box. The GHG
emissions for each system process were calculated separately and then combined on the
basis of the specific pathways examined. For example, in pathway 1, the “CO2 supply”
system process accounts for the life cycle GHG emissions throughout the corn ethanol
production process, which includes corn farming, transport to the ethanol facility,
fermentation, and ethanol delivery to end users as well as the energy requirement for CO2
capture from the fermentation process. A detailed description of each system process is
provided in Appendix B. The system boundaries for the pathways excluded the physical
infrastructure required in each of the system processes, and thus their associated GHG
emissions were considered to be outside the scope of this analysis.

59
5.2.1 Functional Unit and Emission Credits
In this analysis, we use the GREET model developed by Argonne Laboratory as a
reference for our LCA results for ethanol production, coal, and natural power generation
(UChicago Argonne, 2014). This model has been used in regulatory compliance
standards in California, such as the LCFS (Rhodes et al., 2015). The functional unit
selected here is a barrel of crude oil produced via CO2-EOR and consumed. Because
CO2-EOR fields have historically produced oil at different recovery rates (0.9 to 3.8
bbl/tCO2), the results were calculated on the basis of geospatial characteristics of the
major EOR fields in the lower 48 states of the U.S. for the pathways investigated. In this
analysis, we define crude recovery rates as the amount of oil produced (in barrels) per a
metric ton of CO2 injected. The results were calculated with assigning negative emission
credits for co-products, as per the system expansion approach. In the system expansion, it
was assumed that the co-products would displace alternative production methods such as
the production of ethanol from corn without CO2 capture and conventional electricity
generation from pulverized coal (PC) and natural gas combined cycle (NGCC) without
CCS. Accordingly, the functional unit obtains a credit based on the GHG emissions
emitted by conventional ethanol, in pathway 1 and electricity production in pathways 2
and 3. Table 5.2 shows some of the key results and credit values that were used for the
investigated CO2-EOR oil fields.

60
Table 5-2 Displacement factors for co-products in each pathway when system expansion is applied
Pathway Oil Basin 1: EtOH-CCS-EOR Permian Gulf Coast Rockies Mid-Continent California
Co-product [gallons of EtOH] 169 395 124 91 140
Displacement Value [tCO2-e]* -0.87 -2.04 -0.64 -0.47 -0.72
Crude recovery rate [bbl/tCO2] 2.1 0.9 2.8 3.8 1.8
Product [bbl. crude oil] 1 barrel of crude oil recovered via EOR
Displaced Products Corn ethanol via dry milling
2: PC-CCS-EOR Permian Gulf Coast Rockies Mid-Continent California
Co-product [kWh] 485 1135 355 261 402
Displacement Value [tCO2-e] * -0.51 -1.20 -0.38 -0.28 -0.42
Crude recovery rate [bbl/tCO2] 2.1 0.9 2.8 3.8 1.8
Product [bbl. crude oil] 1 barrel of crude oil recovered via EOR
Displaced Products Electricity from coal
3: NG-CCS-EOR Permian Gulf Coast Rockies Mid-Continent California
Co-product [kWh] 1041 2434 762 560 862
Displacement Value [tCO2-e] * -0.56 -1.30 -0.41 -0.30 -0.46
Crude recovery rate [bbl/tCO2] 2.1 0.9 2.8 3.8 1.8
Product [bbl. crude oil] 1 barrel of crude oil recovered via EOR
Displaced Products Electricity from natural gas Note: * Subject plants are assumed to be retrofitted with CCS as opposed to the construction of new plants without CCS.
Source: (Abotalib et al., 2016)
Equation (5.1) shows the key variables used to calculate net GHG emissions for
each pathway at various EOR fields, allowing the results to be compared with one other.
The findings were also compared to a business-as-usual (BAU) baseline scenario, which
refers to conventional crude recovery and transport to U.S. refineries and refined crude
oil combustion (see Appendix B for details).
𝐍𝐞𝐭 𝐆𝐇𝐆(𝐲) 𝐄𝐎𝐑 = 𝐆𝐇𝐆𝐄𝐎𝐑 + 𝐝𝐜 = [𝐭𝐂𝐎𝟐𝐞 𝐩𝐞𝐫 𝐛𝐛𝐥. ] 𝐄𝐪. 𝟓. 𝟏
where

61
𝐺𝐻𝐺 (𝑦)𝐸𝑂𝑅 = ∑ 𝑥𝑖
𝑛
𝑖=1
= 𝑥1 + 𝑥2 … + 𝑥𝑛 [𝑡𝐶𝑂2𝑒 𝑝𝑒𝑟 𝑏𝑏𝑙. ] 𝐸𝑞. 5.1.1
𝑦 = 𝐸𝑂𝑅 𝑓𝑖𝑒𝑙𝑑 (𝑟𝑒𝑔𝑖𝑜𝑛 𝑠𝑝𝑒𝑐𝑖𝑓𝑖𝑐 𝑐𝑟𝑢𝑑𝑒 𝑟𝑒𝑐𝑜𝑣𝑒𝑟𝑦 𝑟𝑎𝑡𝑒 𝑎𝑛𝑑 𝑒𝑛𝑒𝑟𝑔𝑦 𝑚𝑖𝑥)
𝑥1 = 𝐺𝐻𝐺𝑠 𝐶𝑂2 𝑠𝑢𝑝𝑝𝑙𝑦
𝑥2 = 𝐺𝐻𝐺𝑠 𝐶𝑂2 𝑡𝑟𝑎𝑛𝑠𝑝𝑜𝑟𝑡
𝑥3 = 𝐺𝐻𝐺𝑠 𝐶𝑂2 𝑖𝑛𝑗𝑒𝑐𝑡𝑖𝑜𝑛 (𝑜𝑖𝑙 𝑟𝑒𝑐𝑜𝑣𝑒𝑟𝑦 𝑎𝑛𝑑 𝑡𝑟𝑎𝑛𝑠𝑝𝑜𝑟𝑡 𝑡𝑜 𝑎 𝑟𝑒𝑓𝑖𝑛𝑒𝑟𝑦)
𝑥4 = 𝐺𝐻𝐺𝑠 𝑐𝑟𝑢𝑑𝑒 𝑜𝑖𝑙 𝑟𝑒𝑓𝑖𝑛𝑒𝑟𝑦 𝑎𝑛𝑑 𝑟𝑒𝑓𝑖𝑛𝑒𝑑 𝑐𝑟𝑢𝑑𝑒 𝑐𝑜𝑚𝑏𝑢𝑠𝑡𝑖𝑜𝑛
𝑑𝑐 = 𝑑𝑖𝑠𝑝𝑙𝑎𝑐𝑒𝑚𝑒𝑛𝑡 𝑐𝑟𝑒𝑑𝑖𝑡 [ 𝑡𝐶𝑂2𝑒 𝑝𝑒𝑟 𝑏𝑏𝑙. ]
𝑑𝑐 = (𝑁𝑜. 𝑜𝑓 𝑢𝑛𝑖𝑡𝑠𝑐𝑜−𝑝𝑟𝑜𝑑𝑢𝑐𝑡) ∗ (𝐺𝐻𝐺𝑠 𝑑𝑖𝑠𝑝𝑙𝑎𝑐𝑒𝑑 𝑝𝑟𝑜𝑑.
𝑢𝑛𝑖𝑡 ) 𝐸𝑞. 5.1.2
5.2.2 Data Sources for GHG Life Cycle Emissions for Energy
In pathways investigated, the energy required for CO2 capture, for pathways 2 and
3 was assumed to be supplied by the same pathway. On the other hand, the energy
required for CO2 compression, for pathway 1, and for CO2 transport via pipeline, and
injection into an EOR reservoir was assumed to be supplied by an independent source
using the regional electricity grid mix as defined by the North American Electric
Reliability Corporation (NERC) (NERC, 2014). The life cycle GHG emissions and
geographical distribution for each NERC entity are provided in appendix B. In addition,
the model’s technical performance parameters are highlighted in appendix B
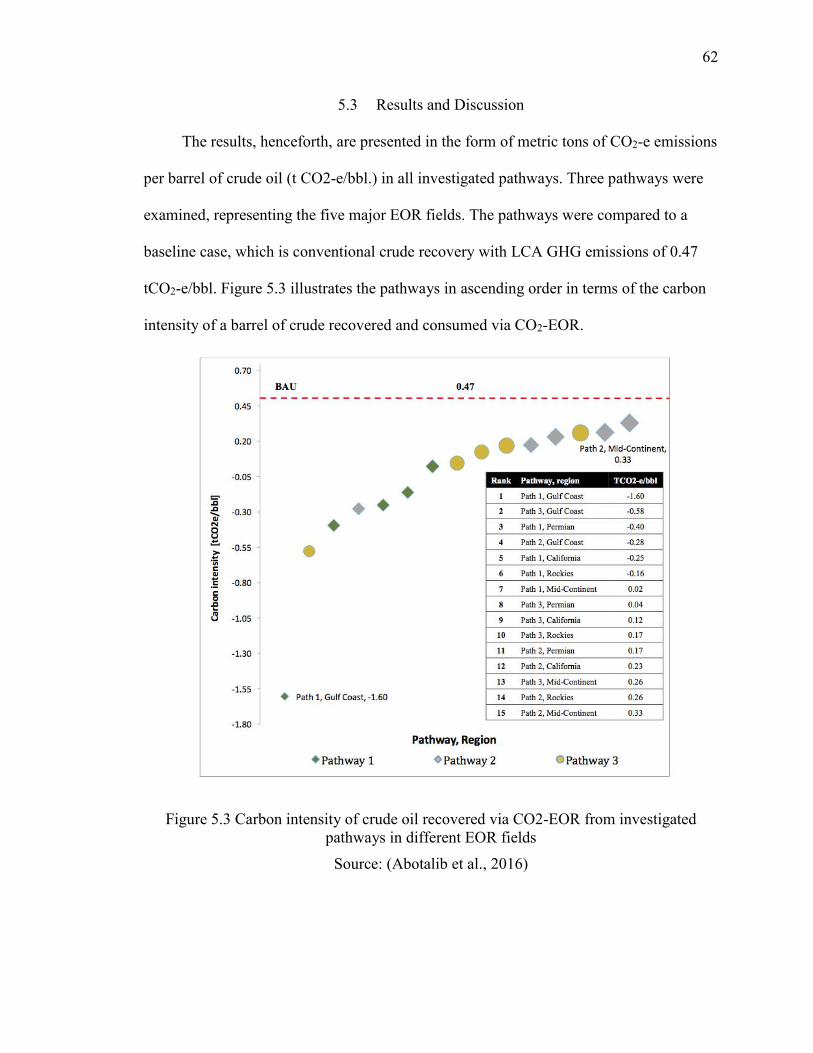
62
5.3 Results and Discussion
The results, henceforth, are presented in the form of metric tons of CO2-e emissions
per barrel of crude oil (t CO2-e/bbl.) in all investigated pathways. Three pathways were
examined, representing the five major EOR fields. The pathways were compared to a
baseline case, which is conventional crude recovery with LCA GHG emissions of 0.47
tCO2-e/bbl. Figure 5.3 illustrates the pathways in ascending order in terms of the carbon
intensity of a barrel of crude recovered and consumed via CO2-EOR.
Figure 5.3 Carbon intensity of crude oil recovered via CO2-EOR from investigated pathways in different EOR fields
Source: (Abotalib et al., 2016)

63
As shown in Figure 5.3, the LCA results varied among the investigated oil basins.
Therefore, the impacts of individual system processes were further examined in order to
identify the GHG emissions contributions from the processes included in the study
system boundary, as shown in Figures 5.4. However, one key factor in the LCA variation
was the crude recovery rate in each EOR field. For example, the Gulf Coast, which has a
lowest crude recovery rate of 0.9 bbl/tCO2, requires about 1.13 tCO2 to recover one barrel
of crude oil via CO2-EOR. This is approximately double the average requirement for
CO2-EOR in the U.S. (0.54 tCO2/bbl) and more than four times the CO2 needed in EOR
fields in the Mid-Continent basin (0. 26 tCO2/bbl). In view of that, storing more carbon at
a given oil reservoir would correspond to an increase in the displacement credit for co-
products.
Figure 5.4 illustrates the carbon intensity in terms of system process, which
includes the upstream emissions from CO2 sources and allocates displacement credits on
the basis of the resulting co-products. The results show that lower carbon intensive crude
oil was produced via CO2-EOR for the three pathways compared to conventional crude
recovery (BAU), despite the fact that the system boundary was expanded to include
upstream emissions from the three pathways.
Pathway 1 generally exhibited significant GHGs benefits than other pathways in
all EOR oil basins, whereas pathway 2 had highest GHGs profile. In pathway 1, the
capture of biogenic CO2 has added value compared to the capture of non-biogenic CO2 in
pathways 2 and 3. Biogenic CO2 capture not only enables the production of low-carbon
crude oil; it also removes carbon from the natural carbon cycle. Furthermore, the model
allocates displacement credits for co-products, which balance a significant amount of the

64
CO2 generated in other system processes. For example, CO2 injection plays an important
role in determining the extent of co-product credits, where the magnitude of the reduction
in GHGs depends on a site’s specific crude recovery rate. The results show that co-
product credits in pathways 2 and 3 offset at least 60% of the GHG emissions (in the
Mid-continent) of the crude refinement and refined product combustion system
processes.
Figure 5.4 LCA net GHG emissions for major EOR fields in the three pathways
Source: (Abotalib et al., 2016)
5.4 Summary
EOR basins with a higher CO2 requirement per incremental barrel of oil exhibit a
greater reduction in the carbon intensity for produced crude oil. This finding provides a
potential future direction for CO2-EOR from a carbon mitigation perspective. However,
EOR operators tend to increase the efficiency of the EOR process in order to maximize

65
the crude yield from purchased CO2. This point was addressed in a study by Middleton et
al. (2015), which suggested that CO2 supply cost and oil prices would determine the
economic viability of CCS-EOR applications in different EOR fields (Middleton et al.,
2015). The study also suggested that utilizing CO2 from industries that produce high
purity CO2 would be an attractive financial alternative to primary crude production under
certain oil market conditions (Middleton et al., 2015).
As highlighted earlier, pathway 1 illustrates greater GWP benefits as opposed to
pathways 2 and 3 and would be a favorable pathway for EOR operators as it produces
almost pure CO2 stream. Next, the results indicate that pathway 3 was somehow less
carbon intensive than pathway 2. However, the deployment of pathway 3 is unlikely to
take place before pathway 2 because it has lower CO2 emissions profile and considerably
higher subsequent economic implications (Middleton & Eccles, 2013). In this study,
recovering crude oil by use of CO2 from pathway 1 was less carbon intensive than with
the use of CO2 from the other pathways for individual EOR basins. The results indicated
that pathway 1 was the preferable option, as its carbon intensity was only 3 to 7 percent
that of as pathways 2 and 3. Pathway 3 was marginally less carbon intensive than
pathway 2. This difference can be explained by the displacement credit that pathway 3
receives and lower GHGs emission from the CO2 supply system process. Although the
process of CO2 transport via pipeline, and injection into an EOR reservoir uses a different
regional electricity grid mix as per the NERC classification, variations in GHG among
NERC entities did not have a significant impact on the final LCA results in pathways
examined. For the pathways investigated, under the technical and geospatial constraints
of this study, the results indicate that 1.25 million barrels of crude can be recovered per

66
day through the use of CO2-EOR in five major oil regions: Permian Basin, Gulf Coast,
Mid-Continent, Rockies, and California. As mentioned previously, we considered only
those candidates within a distance of 100 miles from EOR oil basins. Under this
assumption, coal-fired power plants alone would have the potential to supply about 88%
of the CO2 required for EOR. For example, in the Rockies, about 0.6 million barrels can
be recovered per day from only eight coal-fired power plants, with potential CO2 supply
of 210,000 tCO2 per day. Natural gas power plants would have the capacity to supply
about 10%, while ethanol facilities would supply the remaining 2%.
Increasing the distance parameter alone would yield even more CO2 candidates,
providing additional CO2 supply for EOR. For example, when we enlarged the distance
restriction from 100 to 300 miles, the number of CO2 candidates, in all oil basins,
increased to 88, 105, and 193 compared to 21, 22, and 33 for pathways 1,2, and 3,
respectively. However, we noticed that most of those additional CO2 candidates were
located in the Midwestern region, where CO2 pipelines are lacking and oil deposits are
not significant (See Figure S8 in the SI document for details).
Furthermore, the RFS target of increasing biofuel production to 36 billion gallons
by 2022 can be seen as an opportunity to increase the CO2 supply from ethanol facilities
by expanding the ethanol industry in regions close to EOR fields, in particular in
locations with favorable climatic conditions. Furthermore, the study focused on CCS-
CO2-EOR applications in the top five major oil regions, where 80% of all EOR oil is
trapped and readily available for recovery. Therefore, evaluating the investment
opportunities in CCS-EOR projects in these regions would be a sensible choice for EOR
operators. However, additional recoverable EOR crude oil deposits do exist at fair

67
capacities in other regions. For example, the Illinois Basin has about 220-300 million
recoverable oil and at the same time reasonable ethanol capacity, producing about 3
million gallons of ethanol in 2014. Using the CO2 supply from ethanol plants would be
relatively cheap enough to recover 10 to 40 million barrels of oil every year (RFA, 2016).
Therefore, the case of the Illinois basin deserves complete investigation by a separate
dedicated study.
The main limitations of the model are the technical performance parameters related
to the individual EOR reservoirs in the investigated oil basins. The quantity of crude oil
recovered from an EOR reservoir is highly dependent on geological characteristics, crude
properties, and EOR technology-specific operations. The hydrostatic pressure in an oil
reservoir depends on fluid extraction rates and other geophysical parameters such as,
porosity and temperature. Therefore, a reservoir pressure is variable in both space and
time (Hoversten, Gritto, Washbourne, & Daley, 2002). In this study, we did not account
for such variations and assumed that the pressure in each EOR reservoirs does not change
over time. Instead, we used crude recovery rates for each oil basin on the basis of historic
oil production rates. (See appendix B for detailed technical performance parameters).
Also, it is very important to recognize that storing more carbon at a given reservoir would
correspond to an increase in the displacement credit for co-products. In our model, we
assumed that “like displaces like,” i.e., that the two co-products, ethanol and electricity,
would displace the production of corn ethanol and electricity from coal and natural gas
without CCS. However, it can be argued that the choice of substitutes for ethanol and
electricity should be based on the purpose that each co-product serves. For example, the

68
co-product in pathway 2 supplies additional electricity to the power grid mix, and
therefore it may be argued that it should not be assumed to displace electricity from coal,
which would yield greater displacement credit; rather, it would replace the regional
electricity grid mix. The same argument applies to pathway 1, where additional ethanol
produced could be assumed as a replacement for cellulosic ethanol, which has 80% less
GHG emissions compared to corn ethanol. Thus, exploring alternative substitutes for co-
products would have a significant impact on the displacement credits; especially if that
alternative has lower LCA GHG emissions per unit produced. Finally, because of the
linear relationship between energy requirements and the CO2 to be injected to recover a
barrel of oil, greater CO2 storage in a less efficient EOR field places a cost burden on this
option. Therefore, investigating the economic dimension associated with CO2 capture
from each pathway along with the reduction in fuel carbon intensity would lead to a more
comprehensive understanding of industrial CO2-EOR practices.

69
CHAPTER 6. CCS DEPLOYEMNT FROM GAME THEORY PERSPECTIVE
6.1 Background and Motivation
The introduction or revision of operative laws, regulations, standards, or other
government incentive programs can be a time-intensive process, as it involves careful
categorization of potentially affected stakeholders as well as holistic evaluation of
anticipated positive and negative consequences on stakeholders, in particular, and on
society as a whole (Swanson & Lin, 2009). Effective environmental regulations should
apply to the existing market and also guide industries in the desired political direction.
Among environmental standards and regulations are those related to controlling
greenhouse gas emissions from industrial sources. Such regulations are viewed by
developing countries as a constraint on economic growth and the improvement of public
welfare (Li, Zhang, Shi, & Zhou, 2016). In recent years, and especially in the post-
Copenhagen era, climate policy has shifted towards a new paradigm, which considers a
wide range of strategies such as the green economy and low-carbon development projects
between public and private sectors and encourages the involvement of potentially
affected stakeholders in the decision-making process (Bäckstrand & Lövbrand, 2016). In
2016, key global CO2 emitters including China, India, and the United States were among
the committed participants in the Paris Agreement (Bäckstrand & Lövbrand, 2016; X.
Yang & Teng, 2016).

70
In view of substantially reducing CO2 emissions, the Paris Agreement recognized
the importance of de-carbonizing the world’s leading economies by creating a balance
between emission of anthropogenic CO2 by sources and elimination by sinks (Bäckstrand
& Lövbrand, 2016). In the United States, the electricity generation and transportation
sectors are the two main sources of anthropogenic CO2 emissions (U.S. EPA, 2015). One
way of reducing GHG emissions from the transportation sector is the production of fuel
that is less carbon intensive. Recently developed geotechnical solutions have made it
possible to capture CO2 emissions from industrial point sources by means of CCS
technologies (Metz et al., 2005). In this context, CCS can be applied directly to the power
generation sector or other industrial sources, and the captured CO2 can be utilized for
enhanced oil recovery EOR.
Although there is a general consensus in the literature that CCS has a parasitic
energy load and increases resource consumption, the technology has shown promising
reductions in GHG emissions when analyzed from a life cycle perspective (Abotalib et
al., 2016; H. Herzog, Meldon, & Hatton, 2009; Hornafius & Hornafius, 2015; Hussain et
al., 2013; Melzer, 2012; NETL, 2011; Rhodes et al., 2015; Singh et al., 2011b; Singh,
Bouman, Strømman, & Hertwich, 2015). However, the magnitude of the reduction in
GHG emissions from a source is dependent on the energy requirement for sequestering
the CO2 from the flue gas stream. For example, ethanol facilities produce a nearly pure
CO2 gas steam (from the fermentation process), whereas coal-fired and natural gas power
plants produce a gas stream with low CO2 concentration, between 10 and 17% by volume
(Katzer, Moniz, Deutch, Ansolabehere, & Beer, 2007).

71
As discussed in the literature, CCS integration with CO2-EOR has significant
potential to reduce the carbon footprint of the U.S. transportation sector by producing
crude oil with lower carbon intensity than in conventional crude recovery (Abotalib et al.,
2016; Hornafius & Hornafius, 2015; Rhodes et al., 2015; U.S. DOE, 2013; U.S. EPA,
2015). In the United States, more than 90 million barrels of oil (MMbo) are produced
annually via CO2-EOR. This figure may increase significantly, as estimates suggest that
there are more than 24 billion barrels of economically recoverable oil in the lower 48
states of the U.S. (Kuuskraa, Van Leeuwen, Wallace, & DiPietro, 2011b; MITEI, 2016).
The majority of these oil deposits are trapped in the Permian, Gulf Coast, Mid-Continent,
Rockies, and California oil basins (ARI, 2010a). Currently, about 70% of the CO2 used in
EOR projects is obtained from natural CO2 wells. Finding an alternative and consistent
CO2 supply would allow the expansion of EOR projects and further the objectives of the
Energy Policy Act of 2005 (Energy Policy Act, 2005). However, current carbon policies
do not provide sufficient economic incentives for major carbon emitters to invest in CCS
projects (Mills, 2014).
The first objective of this chapter is to establish a framework for assessing CCS-
EOR deployment by industrial emitters, with a specific focus on coal power plants and
ethanol facilities, from a game-theory perspective under various carbon policy scenarios.
Second, we assess the payoffs of possible dynamic changes in climate policies and in the
carbon market, and the effects of policy changes on the ethanol and coal power industries
in the United States, with a focus on the Illinois Basin. The results from the games
(scenarios) explored here are envisioned as the players’ possible strategies, i.e., their

72
responses to existing and futuristic carbon policy approaches and incentives, in terms of
potential variations in carbon market conditions.
Based on technical and economic information from the literature (see Method
section in this chapter for details), twelve combinations of game scenarios were
established in order to determine players’ chosen strategies and the corresponding
payoffs under each scenario, as shown in Figure 6.1. The games are considered to be non-
cooperative; i.e., each player tends to act independently with the aim of maximizing its
payoff or, in some situations, minimizing its loss, regardless of the consequences for
other players (see Table 6-2 - 6-4 for details). The best outcome of such a game is
referred to as a non-cooperative equilibrium or Nash equilibrium. The outcomes or
payoffs from the games can be illustrated in a classic two-player, two-strategy game
matrix, as shown in the Results section.

73
Game Description Notes
1 Existing carbon policies and current price of CCS technology at oil price of $60 per bbl.
No change in existing carbon regulations
2 Existing carbon policies and current price of CCS technology at oil price of $110 per bbl.
3 Existing carbon policies and future price of CCS technology at oil price of $60 per bbl.
4 Existing carbon policies and future CCS technology at oil price of $110 per bbl
5 Future carbon policies and current price of CCS technology at oil price of $60 per bbl.
Increasing carbon incentive from $10 to $30 per ton of CO2 captured
and used for EOR
6 Future carbon policies and current price of CCS technology at oil price of $110 per bbl.
7 Future carbon policies and future price of CCS technology at oil price of $60 per bbl.
8 Future carbon policies and future price of CCS technology at oil price of $110 per bbl

74
9 Future carbon policies and current price of CCS technology at oil price of $60 per bbl.
$20 carbon tax for anthropogenic CO2 emitters, and increasing
carbon incentive from $10 to $30 per ton CO2 captured and used for
EOR
10 Future carbon policies and current price of CCS technology at oil price of $110 per bbl.
11 Future carbon policies and future price of CCS technology at oil price of $60 per bbl.
12 Future carbon policies and future price of CCS technology at oil price of $110 per bbl
Figure 6.1 Schematic representation of different non-cooperative game scenarios analyzed under different policy and market conditions. A detailed description of each
game is provided in appendix B
6.2 CCS Game-Theory Model
In this analysis, we use non-cooperative game theory to assess the future of CCS
deployment in ethanol production facilities and coal power plants. The participants in a
game are referred to as “players.” Their payoffs in the game are determined by whether
or not they change their business-as-usual (BAU) practices by integrating CCS into their
operations and subsequently selling captured CO2 to EOR operators. The strategy chosen
by a player in a specific game scenario is determined by the payoff in that scenario. For
example, for ethanol production facilities (player 1) and coal power plants (player 2), the
payoffs are calculated under different carbon policies, costs of CO2 capture technologies,
and market prices of carbon as a commodity for EOR operations. Payoffs are calculated
on the basis of the economic costs/benefits of capturing one metric ton of CO2 and
transporting it to an EOR operator. The cost of CO2 capture represents the current and
future costs of technology deployment in ethanol facilities and coal power plants. The
CO2 sale price is based on the amount that EOR operators are willing to pay per mass
unit of CO2. Historical market prices for oil and CO2 indicate that an EOR operator
would purchase CO2 at 2.5% of the oil price per thousand cubic feet (Mcf) of CO2, or at

75
47% of the oil price per metric ton of CO2 (Kuuskraa et al., 2011a). Equation 1 is the
mathematical formula for calculating payoffs. The variables are defined below.
𝑹 (𝒊)𝑵(𝑷𝒏) = ∑ 𝑪𝒋 =𝒏𝒋=𝟏 𝑪𝟏 + 𝑪𝟐 +……𝑪𝒏 Equation 6.1
𝑅𝑁 = 𝑃𝑎𝑦𝑜𝑓𝑓 𝑓𝑟𝑜𝑚 𝐵𝐴𝑈 𝑎𝑛𝑑 𝐶𝐶𝑆 𝑑𝑒𝑝𝑙𝑜𝑦𝑚𝑒𝑛𝑡
𝑖 = 𝑆𝑝𝑒𝑐𝑖𝑓𝑖𝑐 𝑠𝑐𝑒𝑛𝑎𝑟𝑖𝑜 𝑜𝑓 𝑐𝑎𝑟𝑏𝑜𝑛 𝑟𝑒𝑔𝑢𝑙𝑎𝑡𝑖𝑜𝑛𝑠 𝑎𝑛𝑑 𝑎𝑑𝑣𝑎𝑛𝑐𝑒𝑚𝑒𝑛𝑡 𝑖𝑛 𝐶𝐶𝑆 𝑡𝑒𝑐ℎ𝑛𝑜𝑙𝑜𝑔𝑖𝑒𝑠
𝑃1 = 𝑃𝑙𝑎𝑦𝑒𝑟 1, 𝑒𝑡ℎ𝑎𝑛𝑜𝑙 𝑓𝑎𝑐𝑖𝑙𝑖𝑡𝑦
𝑃2 = 𝑃𝑙𝑎𝑦𝑒𝑟 2, 𝑐𝑜𝑎𝑙 𝑝𝑜𝑤𝑒𝑟 𝑝𝑙𝑎𝑛𝑡
𝐶1 = 𝐶𝑜𝑠𝑡 𝑡𝑜 𝑐𝑎𝑝𝑡𝑢𝑟𝑒 𝑎𝑛𝑑 𝑡𝑟𝑎𝑛𝑠𝑝𝑜𝑟𝑡 𝑜𝑛𝑒 𝑚𝑒𝑡𝑟𝑖𝑐 𝑡𝑜𝑛 𝑜𝑓 𝐶𝑂2 𝑖𝑛 𝑈. 𝑆. $/𝑡𝐶𝑂2
𝐶2 = 𝐶𝑎𝑟𝑏𝑜𝑛 𝑝𝑟𝑖𝑐𝑒 𝑖𝑛𝑐𝑙𝑢𝑑𝑖𝑛𝑔 𝑡𝑎𝑥 𝑎𝑛𝑑 𝑐𝑟𝑒𝑑𝑖𝑡𝑠, 𝑖𝑓 𝑎𝑛𝑦, 𝑖𝑛 𝑈. 𝑆. $/𝑡𝐶𝑂2
𝐶3 = 𝐶𝑜𝑚𝑚𝑜𝑑𝑖𝑡𝑦 𝑝𝑟𝑖𝑐𝑒 𝑜𝑓 𝐶𝑂2 𝑖𝑛 𝑈. 𝑆. $/𝑡𝐶𝑂2
Table 6-1 Key parameters for possible scenarios and subsequent associated cost for each player
Parameter Player 1: ethanol facility
Player 2: coal power plant
Notes and references
CC
S te
chni
cal a
ssum
ptio
ns
CO2 supply* [$/TCO2] a 22.7 66.2
� The cost includes CO2 capture from source and transport to EOR operator in [$/TCO2]
� Cost of CO2 capture from ethanol = $12.7 (Global CCS Institute, 2012)
� Cost of CO2 capture from coal = $56.2 (NETL, 2015)
� Cost to transport CO2 100 miles = $10 (NETL, 2015)
CO2 supply* [$/TCO2] b 16 51
� The cost includes CO2 capture from source and transport to EOR operator in [$/TCO2]
� Cost of CO2 capture from ethanol = $6 (Global CCS Institute, 2012)
� Cost of CO2 capture from coal = $41 (NETL, 2015)
� Cost to transport CO2 100 miles = $10 (NETL, 2015)
Reg
ulat
ion
Carbon Tax [$/TCO2] a 0 0 � Current regulations
Carbon Tax [$/TCO2] b 0 20 � Future carbon tax assumed
Tax credit [$/TCO2] a 0 10 � Section 45Q (IRS, 2011)
Tax credit [$/TCO2] b 0 30 � Proposed revision of section 45Q (NEORI, 2016)

76
Table 6-1 Continued
Eco
nom
y
CO2 sale price [$/TCO2] a 28 28
� At oil price of $60 per bbl (Kuuskraa et al.,
2011a)
CO2 sale price [$/TCO2] b 52 52 � At oil price of $110 per bbl (Kuuskraa et al.,
2011a) * CO2 supply includes the cost of CO2 capture from source and transport to EOR operators, a current or existing cost or technology, b proposed or future cost.
Table 6-1 lists the key parameters used to calculate the payoff for each player
examined in each game scenario. Data from the literature were used in these calculations.
On the basis of the information provided in Table 6-1, twelve combinations of game
scenarios were established in order to determine players’ chosen strategies and the
corresponding payoffs under each scenario, as shown in Figure 6.1. The games are
considered to be non-cooperative; i.e., each player tends to act independently with the
aim of maximizing its payoff or, in some situations, minimizing its loss, regardless of the
consequences for other players (see Tables 6-2-6-4 for details). The best outcome of such
a game is referred to as a non-cooperative equilibrium or Nash equilibrium. The
outcomes or payoffs from the games can be illustrated in a classic two-player, two-
strategy game matrix, as shown in the Results section
6.2.1 Potential CO2 Supply
6.2.1.1 Potential Supply from Ethanol Plants
Currently, the amount of CO2 potentially recoverable from ethanol plants is
estimated at 23.4 MMT, of which less than 20% is used as a commodity by other
industries in the U.S. CO2 merchant market (Supekar & Skerlos, 2014). Ethanol plants
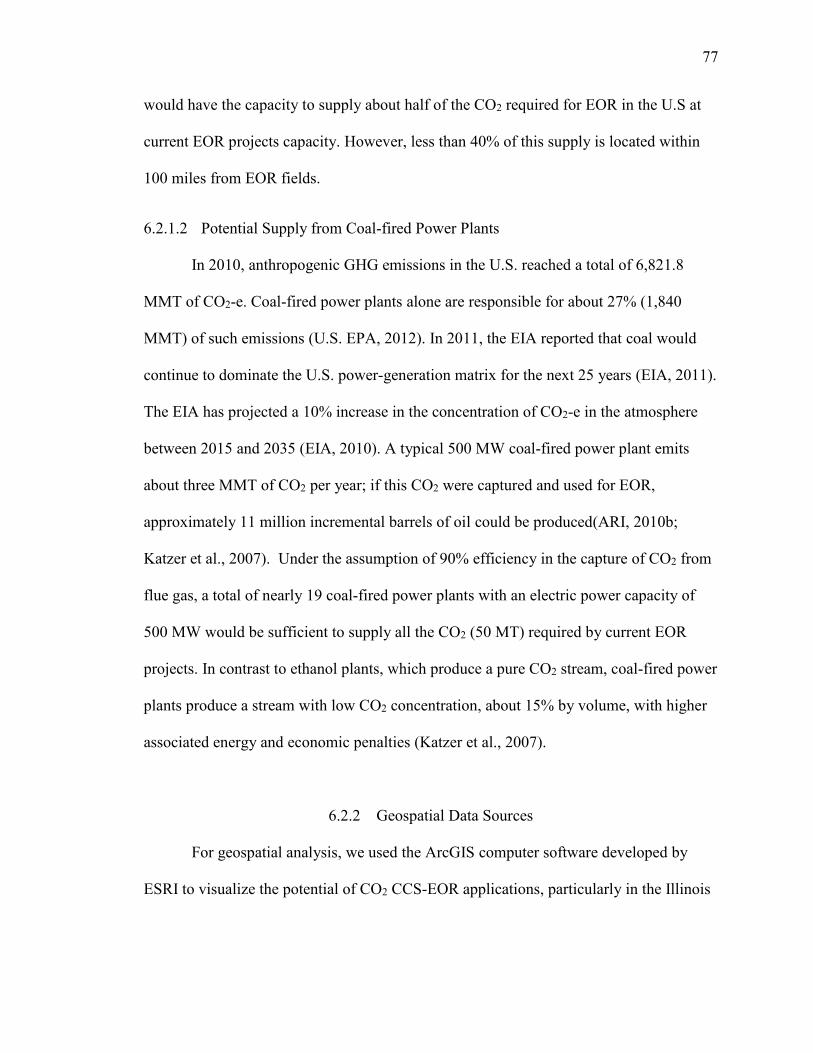
77
would have the capacity to supply about half of the CO2 required for EOR in the U.S at
current EOR projects capacity. However, less than 40% of this supply is located within
100 miles from EOR fields.
6.2.1.2 Potential Supply from Coal-fired Power Plants
In 2010, anthropogenic GHG emissions in the U.S. reached a total of 6,821.8
MMT of CO2-e. Coal-fired power plants alone are responsible for about 27% (1,840
MMT) of such emissions (U.S. EPA, 2012). In 2011, the EIA reported that coal would
continue to dominate the U.S. power-generation matrix for the next 25 years (EIA, 2011).
The EIA has projected a 10% increase in the concentration of CO2-e in the atmosphere
between 2015 and 2035 (EIA, 2010). A typical 500 MW coal-fired power plant emits
about three MMT of CO2 per year; if this CO2 were captured and used for EOR,
approximately 11 million incremental barrels of oil could be produced(ARI, 2010b;
Katzer et al., 2007). Under the assumption of 90% efficiency in the capture of CO2 from
flue gas, a total of nearly 19 coal-fired power plants with an electric power capacity of
500 MW would be sufficient to supply all the CO2 (50 MT) required by current EOR
projects. In contrast to ethanol plants, which produce a pure CO2 stream, coal-fired power
plants produce a stream with low CO2 concentration, about 15% by volume, with higher
associated energy and economic penalties (Katzer et al., 2007).
6.2.2 Geospatial Data Sources
For geospatial analysis, we used the ArcGIS computer software developed by
ESRI to visualize the potential of CO2 CCS-EOR applications, particularly in the Illinois

78
Basin (ESRI, 2011). Geospatial data for players 1 and 2 were obtained from the NREL
interactive mapping tool and the National Energy Technology Laboratory’s (NETL)
NATCARB database (NETL, 2016; U.S EPA, 2015). The CO2 emission profiles for
ethanol facilities were calculated from annual ethanol production data using the mole-to-
mole stoichiometric ratio method (Middleton et al., 2014a). Figure 6.2 is a geographic
map of existing/proposed EOR and CO2 infrastructure in addition to ethanol and coal
power plants in the lower 48 states of the U.S. Eighty percent of all EOR oil is trapped in
the top five oil regions: Permian, Gulf Coast, Mid-Continent, Rockies, and California.
However, reasonable capacities exist in other regions such as the Illinois Basin, where
estimates suggest that there are about 220-300 million barrels of recoverable oil (Abotalib
et al., 2016). Currently, there are no commercial CO2-EOR projects or dedicated CO2
pipelines in the Illinois Basin because of the absence of dedicated natural CO2 wells or
other supplies (Damico et al., 2014). However, as shown in Figure 6.2, this region has
numerous industrial CO2 sources, such as ethanol facilities and coal-fired power plants,
which are potential suppliers of CO2 for EOR projects in place of natural CO2 wells.

79
Figure 6.2 Map of EOR infrastructure and potential CO2 supply from ethanol and coal power plants. Quantities of CO2 are based on annual emission profiles from the sources
6.3 Results and Discussion
6.3.1 Non-Cooperative Game Scenarios
The payoffs from the game scenarios, hereafter, are presented in U.S. dollars and
based on the parameters considered in the scenarios (as illustrated in Figure 6.1). The
payoff matrix for a given game demonstrates the rational strategy to be followed by each
player according to the expected outcome or payoff, and subsequently a Nash equilibrium
(highlighted in red in Tables 6-2 to 6-4) can be determined at which each player’s
strategy is optimal to the game. The twelve games in Figure 6.1 represent three carbon
policy scenarios with varying exogenous impacts such as changes in the cost of CO2
technologies and the EOR operator’s willingness to pay for CO2 captured from industrial
sources. The first set of game scenarios (1-4) represent four possible cases with existing

80
carbon regulations and changes in oil prices and in the cost of CCS and delivery to EOR
operators. Their payoff matrices are shown in Table 6-2. The second set of games (5-8)
explore four possible cases in which the incentive credit allocated to anthropogenic CO2
emitters during a taxable year is increased from $10 to $30 per metric ton of CO2
captured and utilized for EOR. This set also explores two different oil prices, and the
existing and future costs of CCS deployment in ethanol facilities and coal power plants
and of CO2 delivery to EOR operators, as illustrated in Table 6-3. Lastly, the third set of
game scenarios (9-12) specify a carbon tax on anthropogenic industrial CO2 emitters of
$20/tCO2 emitted. These scenarios also provide incentives for these entities in the form of
tax credits for CCS deployment and integration with EOR under two different costs for
CCS deployment and two different carbon prices. The payoffs matrices for the third set
of games are shown in Table 6-4. For a detailed description of the game scenarios, see
Figure 6.1 and section B3 in appendix B.
Table 6-2 Games 1-4: Payoffs for players 1 and 2 with current carbon regulations under different CCS costs and market conditions

81
Table 6-3 Games 5-8: No carbon tax. Incentive for anthropogenic CO2 of $30 instead of $10. Changes in oil prices and CCS technologies
Table 6-4 Games 9-12: $20 carbon tax. Incentive for anthropogenic CO2 of $30 instead of $10. Changes in oil prices and CCS technologies
According to the results, the ethanol facilities (player 1) would increase their
payoffs when implementing CCS-EOR in all scenarios. In other words, the dominant
strategy of player 1 would always be to switch to CCS as opposed to BAU. In games 1, 5,
and 9, the payoffs for player 1 were the lowest, yet still positive. In these situations, the
sale price of CO2 was relatively low because of the low price of oil (at $60 per bbl), and
there was no reduction in the cost of CCS technology deployment. The payoffs for player
1 were the highest in games 4, 8, and 12, where oil prices were at $110 and the cost of
capturing and delivering CO2 for EOR was reduced by 30%.

82
Next, the results show that coal power plants (player 2) would be reluctant to
change their BAU strategy under existing carbon regulations and the current cost of CCS
technologies (i.e., in games 1 and 2). This outcome is justified by the fact that switching
to CCS would not make sense economically even if the oil price were assumed to be
$110 per bbl. Player 2 would also tend to maintain a BAU strategy in game 3, under the
CO2 price of $28 per metric ton, despite the reduction in the cost of CCS technologies
from $66.2 to $51 per metric ton of CO2 captured. CCS integration in coal power plants
would be a financially viable option only in game 4, with existing carbon regulations, a
23% reduction in the cost of CCS, oil prices of $110 per bbl, and a carbon price of about
$52 per metric ton. In scenarios where the government increases the carbon tax credit
(games 5-12), the payoff for player 2 becomes mostly positive (except in games 5 and 9).
In other words, coal power plants would be likely to reject their BAU strategy adopt
CCS. For example, if the government increased the carbon tax credit from $10 to $30,
coal plants would increase their payoffs by applying CCS, except in the case in which the
cost of CCS technologies has not decreased and oil prices are $60 per bbl (game 5). The
same outcome is expected for the coal power industry in the case where a carbon tax on
anthropogenic CO2 emitters is introduced (game 9).
6.3.2 Cooperation Opportunities
In the Illinois Basin, oil deposits that are recoverable via EOR geographically
underlie some parts of the state of Illinois and extend to parts of neighboring states such
as Indiana and Kentucky (REX Energy, 2012). This region has no existing commercial
CO2-EOR projects or dedicated CO2 pipelines, as shown in Figures 6.2 and 6.3.

83
However, this region has the potential to establish a market for CO2-EOR, since the CO2
required for commercial projects could be obtained from the ethanol facilities and coal-
fired power plants that are abundant in the region (Abotalib et al., 2016). This potential
CO2 supply could provide a reliable input for upcoming EOR projects in the Illinois
Basin and further the objectives of the Energy Policy Act of 2005 (Energy Policy Act,
2005).
Figure 6.3 Illustrative map of potential CO2 supply from ethanol and coal power plants
near the Illinois Basin. Quantities of CO2 are based on annual emission profiles from the sources
In game scenarios 1-12, the strategy of ethanol facilities (player 1) was dominated
by rejection of BAU and adoption of CCS. However, the CO2 supply from ethanol

84
facilities is small compared to that from coal power plants and may not be sufficient to
motivate investment in new EOR projects. For example, the ADM Decatur plant is the
largest ethanol facility in the Illinois basin and has the capacity to provide about a million
metric tons of CO2 (MTCO2) annually, whereas the average CO2 supply from an ethanol
facility is estimated to be approximately 260,000 metric tons per year (Middleton et al.,
2014a). Meanwhile, the largest coal power plant in the region, the Gibson generating
station in northwestern Indiana, emits about 16.3 MTCO2 annually, whereas the average
CO2 emissions from a coal power plant is estimated to be approximately 5.6 MT of CO2
per year (NETL, 2016; U.S EPA, 2015). In the lower 48 states of the U.S., the crude
recovery rate is a site-specific parameter; it varies from 0.9 to 3.8 bbl/t CO2 among the
various CO2-EOR fields (NETL, 2014b).
To overcome the limitation of CO2 supply from ethanol facilities, players could
cooperate with one another rather than acting independently. This cooperation would
ensure that the CO2 supply is sufficient for making capital investments in future EOR
projects, and it would reduce the costs associated with establishing a dedicated CO2
infrastructure. In other words, clustering CO2 from various industrial sources, such as
ethanol facilities and even coal power plants, might be an economically feasible way to
provide the necessary CO2 quantities, and it could motivate players to invest in
commercial EOR projects in the Illinois Basin.
Cooperation would allow players to consider opportunities for minimizing some
of the costs associated with CCS deployment, and subsequently their game strategies
could change. Game 2 was selected for investigation of this possible change. In game 2,
the payoff from adopting CCS would be negative ($ - 4.2) for player 2. In other words,

85
adoption of CCS would entail a cost burden. Thus, player 2 would not be motivated to
change its BAU strategy and invest in CCS, despite a carbon price of $52 per metric ton.
However, at that price, player 1 would make a profit of $29.3 per tCO2 sold to EOR
operators, and therefore its strategy would be dominated by switching to CCS. Under a
new scenario for the case of cooperation, it is assumed that both players evenly share the
cost associated with establishing a joint CO2 transport infrastructure to deliver CO2 to an
EOR operator. Without cooperation, the cost to transport CO2 from a source to an EOR
operator is $10/tCO2 for each player. With cooperation, in which this cost is evenly
shared, the payoff for each player would increase by $5/tCO2. This small change would
be just enough to encourage player 2 to switch to CCS, even though the payoff would not
be significant in comparison to that in the BAU scenario. The payoff matrix for this new
scenario (game 2R) is shown in Table 6-5.
Table 6-5 Game 2R: cooperation assumed between players, no change in current regulations, no reduction in the cost of CCS technologies, high oil prices
Game 2R) Cooperation for CO2 transport with current CCS tech at oil price of $110 per bbl.
Player 2: Coal
BAU CCS
Player 1: Ethanol BAU (0, 0) (0, 0.8)
CCS (34.3, 0) (34.3, 0.8)
6.4 Summary
Integrating CCS with CO2-EOR can play an important role in the large-scale
deployment of CCS by various industries under economic condition in which the returns
from selling CO2 to EOR operators exceed the costs associated with CCS deployment.
Furthermore, as CCS becomes more widely applied and a reliable supply of CO2 more

86
readily available, a significant expansion in EOR projects is expected. In this analysis, a
number of game scenarios were used to evaluate CCS-EOR deployment in the ethanol
and coal power production industries, with a focus on the Illinois oil basin. We explored
the impacts of possible changes in carbon policies, the carbon market, and the cost of
CCS technologies on the decisions of carbon emitters regarding the integration of CCS
into their operations. We did not select these scenarios in order to advocate for a specific
case. Rather, they represent possible changes in carbon policies and CCS-EOR market
conditions. Our framework is intended as a decision-making tool for industrial CO2
emitters in response to dynamic changes in policy and market conditions. In this sense,
the framework can provide regulatory and industrial players with a better perspective on
CCS-EOR deployment from an economic standpoint.
In the absence of established carbon regulations and the necessary economic
incentives, industrial CO2 emitters will tend to avoid additional costs in order to
maximize their profits. According to the game scenarios examined here, the coal power
industry would not be likely to invest in CCS under the existing cost of CCS technologies
and current carbon regulations. However, investment in CCS becomes an economically
viable option in cases in which the cost of supplying the CO2 for EOR is competitive with
the cost of sourcing the CO2 from other sources such as natural CO2 wells. For example,
coal power plants would consider CCS deployment if the price of carbon was above $57
per metric ton. From an economic perspective, EOR operators would not be likely to
purchase CO2 at this price unless the price of oil rose above $120 per bbl. Historically,
however, oil market statistics have been fluid, and oil prices have fluctuated over the past
six decades (Macrotrends LLC, 2016). Thus, there is significant financial uncertainty for

87
potential EOR operators who are making economically based decisions about investing in
the technology. Reducing the dependence of CCS deployment on oil prices by means of
government carbon regulation and incentives would decrease the risk for both CO2
emitters and end-users. Hence, tools such as a carbon tax and carbon credits can be used
for incentivizing industrial CO2 emitters to consider operating at a lower carbon footprint
and start investing in cleaner technologies and practices (Tang, Shi, Yu, & Bao, 2015; J.
Yang et al., 2016). In short, individual stakeholders tend to act independently: first, to
maximize benefits, and second, to minimize loss. However, working with other
stakeholders may open the door to a third option that is better than losing. For example, if
players had the opportunity to cooperate with one another and evaluate other possible
economic avenues, as highlighted in game 2R, their strategy would change

88
CHAPTER 7. CONCLUSION AND FUTURE WORK
7.1 Conclusion
This research addresses the potential role of carbon capture and sequestration in
near-term mitigation of anthropogenic CO2 emissions. In the United States, the electricity
generation sector, which is dominated by the use of coal, and the transportation sector
together account for two thirds of total anthropogenic GHG emissions (EIA, 2014b; U.S.
EPA, 2015). CCS has the potential to become a widely-used option for producing low-
carbon electricity. When integrated with enhanced oil recovery, CCS is also an avenue to
the production of transportation fuel that is less carbon intensive than conventional
petroleum-based fuels such as gasoline and diesel. Because CCS will soon be capable of
storing carbon dioxide from large point sources, the technology will continue to be an
attractive option for CO2 mitigation in a fossil fuel-dependent economy.
Therefore, CCS has been evaluated here from a life-cycle perspective to provide a
better understanding of its environmental and economic consequences. Although the
LCAs of various studies revealed some differences in the levels of GHG reduction, both
the published and harmonized results indicated a large decrease in GWP for the various
coal-fired technologies investigated.

89
However, because of the requirements of energy and other input materials, there
was a notable increase in CED, which would subsequently increase the footprint of the
technology in term of resources. This energy burden is seen as the main constraint for
large-scale deployment of CCS in coal-fired power generation. According to optimistic
financial estimates, the implementation of CCS at an existing conventional coal-fired
power plant would increase the price of delivered electricity by 40% (IEA, 2012).The
integration of CCS with CO2-EOR is seen as a more realistic approach to advancing
large-scale CCS deployment and thus reducing anthropogenic CO2 emissions. The merits
of the integrated technologies are clear at each stage, from point sources such as power
plants to the oil produced by EOR, in which some of the CO2 is offset during the
production phase. In other words, using mature oil wells, rather than storing CO2
underground in saline formations, could play an important role in lowering the carbon
intensity of transportation fuel. This approach would help to achieve the goal of reducing
U.S. carbon emissions by 26-28% by 2025 in comparison with 2005 levels, which
translates into an annual reduction target of 2.3-2.8% (White House Press, 2015).
Looking at CCS from this perspective requires the identification of potential industrial
CO2 sources (pathways). In this dissertation, coal power plants, natural gas plants, and
ethanol refineries were selected as potential industrial sources of CO2 for the EOR
process. These sources were investigated from a life-cycle perspective in terms of their
ability to provide the CO2 needed to produce a barrel of crude oil. The LCA scenario
examined here represents a cradle-to-grave case, which accounts for the upstream GHG
emissions associated with CO2 supply from each pathway and subsequently allocates
carbon emissions credit on the basis of other products produced in parallel. The model
90
developed in this dissertation extends the value of LCA by integrating the LCA results
from each CO2 pathway with GIS using site-specific geospatial data for potential
recoverable crude oil basins, and considers information about existing/proposed CO2-
EOR infrastructure in the lower 48 states of the U.S. The pathways were compared to a
conventional crude recovery, transport, refinement, and end-use combustion baseline,
which had net GHG emissions of 0.47 tCO2-e/bbl. Overall, net GHG emissions from
pathways 1, 2, and 3 were lower than in the baseline case. However, our results clearly
indicated that ethanol-based CCS-EOR (pathway 1) was the best alternative. Still, the
CO2 supply from ethanol plants was limited; the plants would have the capacity to
produce only about 25,000 bbl/d, compared to 1.1 Mbbl/d in pathway 2 and 125,000
bbl/d in pathway 3. Among the system processes that were assessed, the CO2 injection
had the greatest influence on the LCA results, where the magnitude of the reduction in
GHGs depended on each site’s specific crude recovery rate, and that rate determines the
extent of the displacement credits for coproducts. This finding indicates that crude oil
with lower carbon intensity can be produced from EOR reservoirs that are less efficient in
terms of crude recovered per ton of CO2 injected. However, it should be acknowledged
that the use of less efficient reservoirs would be associated with greater CO2 supply,
which has a parasitic energy requirement and would in turn entail a higher cost burden.
The results also indicated that natural gas power plants produce a low-CO2 stream;
the energy requirement for CO2 separation was twice that of ethanol plants and 1.12
times greater than that of coal power plants. As a result, these power plants are less
attractive for CO2 supply from an economic perspective. Therefore, the future of CO2

91
supply from natural gas power plants has been eliminated when looking at the future of
CCS deployment from a game-theory perspective.
In this dissertation, we adopted the game-theory approach to evaluate CCS-EOR
deployment in the ethanol (player 1) and coal power production (player 2) industries,
with a focus on the Illinois oil basin. Following this approach, we explored the impacts of
possible changes in carbon policies, the carbon market, and the cost of CCS technologies
on the decisions of industrial carbon emitters. The results were first assessed on the basis
of a non-cooperative type of game, and then in terms of the opportunity for cooperation
between players. In a non-cooperative game, participants (players) act independently:
first, to maximize their benefits, and second, to minimize their losses, regardless of the
consequences for other players. According to our analysis, under existing carbon policies
and at the current cost of CCS deployment, the strategy of the ethanol industry would be
dominated by CCS deployment. By contrast, coal power plants would not have sufficient
governmental or economic incentives to deploy CCS because of the gap between the cost
of capturing and transporting CO2 and the price of CO2. However, cooperation between
the two players could lead to a third option that might have a greater payoff for each
individual. The findings of this study have demonstrated the potential costs and benefits
of CCS-EOR advancement in line with prospective changes in carbon regulations and
market conditions.
7.2 Future Work
The goal of this dissertation was to develop a more inclusive approach to determining
the role CCS in providing low-carbon electricity and transportation fuel in the United

92
States. A comprehensive, in-depth assessment of CCS from a sustainability perspective is
also needed. The assessment should target three typical aspects of sustainability:
environmental, economic, and social considerations. However, the latter component is
very hard to quantify at this stage and is therefore considered outside the scope of this
research.
� Although the results of the post-combustion studies are quite robust, other
emerging CCS technologies such as chemical looping and membrane-based
capture systems have also been investigated. Experimental trials with these
alternatives have shown lower energy penalties and lesser economic implications
than those of amine-based capture systems. The present research addressed the
amine-based post combustion process because it has been deployed at existing
point sources on a commercial scale. In addition, the analysis here focused mainly
on the problem of global warming potential because GWP reduction is the
intended purpose of CCS. In fact, region-specific constraints such as water
consumption and land requirement are equally important in the consideration of
post-combustion technology. Including additional environmental indicators is
possible, but at this point we need to understand the possible reduction in GWP in
greater depth before moving on to other impact categories. Because of our limited
experience with CCS, it is not yet clear where and when these technologies can be
used. Future analysis should take into account region-specific environmental
conditions along with carbon policies.

93
� The LCA-GIS approach uses an averaged crude recovery rate for each of the
major oil basins in the lower 48 states, but the recovery rate can vary considerably
from well to well within the same basin. Existing data sources do not provide a
specific crude recovery rate for each individual oil well that could potentially be
used in EOR. Such information would enable the development of a more
comprehensive LCA-CCS-EOR optimization model. Furthermore, the model
could include an economic component that would indicate the return on
investment for obtaining CO2 from various industrial sources. For example, an
EOR operator would be able to analyze all possible options on the basis of GWP
and the ability to supply enough CO2 at a feasible price, before making a large-
scale CO2- EOR investment.
� The game-theory framework is limited by few possible scenarios in carbon
policies and CO2 market value. Existing and potential carbon regulations and CO2
prices are not likely to promote cooperation among the various CO2 emitters.
However, this may not be true in all situations, particularly in the cases of high
carbon taxes and stringent carbon cap-and-trade scenarios. In such situations, the
game-theory framework would provide more opportunities for cooperation among
CO2 emitters and among CO2 end-users. The payoffs for each player can be
calculated with the use of the Shapley value approach in order to allocate the
gains from cooperation fairly among different players.

LIST OF REFERENCES

94
LIST OF REFERENCES
Abotalib, M., & Zhao, F. (2015). Life cycle harmonization of carbon capture and sequestration for coal-fired power plants. Proceedings from the LCA XV International Conference, Vancouver, Canada. , XV 76-88.
Abotalib, M., Zhao, F., & Clarens, A. (2016). Deployment of a geographical information system life cycle assessment integrated framework for exploring the opportunities and challenges of enhanced oil recovery using industrial CO2 supply in the united states. ACS Sustainable Chemistry & Engineering, 4(9), 4743-4751.
Alberta Energy. (2011). Carbon capture and storage fact sheet. Retrieved from http://www.energy.alberta.ca/ccs/pdfs/factsheet_ccs.pdf
ARI. (2010a). Optimization of CO2 storage in CO2 enhanced oil recovery projects. (Technical Report No. November, 30). Arlington, VA 22203 USA: Department of Energy & Climate Change (DECC).
ARI. (2010b). U.S. oil production potential from accelerated deployment of carbon capture and storage. ( No. March 2010). Arlington, VA: Advanced Resources International, Inc.
Bäckstrand, K., & Lövbrand, E. (2016). The road to paris: Contending climate governance discourses in the post-copenhagen era. Journal of Environmental Policy & Planning, , 1-19.
Başar, T. (2015). Game theory: Historical overview. Encyclopedia of Systems and Control, , 499-504.
Castelo Branco, D. A., Moura, M. C. P., Szklo, A., & Schaeffer, R. (2013). Emissions reduction potential from CO2 capture: A life-cycle assessment of a brazilian coal-fired power plant. Energy Policy, 61, 1221-1235.
Chen, C. (2005). A technical and economic assessment of CO2 capture technology for IGCC power plants (Ph.D.).

95
Cooney, G., Littlefield, J., Marriott, J., & Skone, T. (2015). Evaluating the climate benefits of CO2-enhanced oil recovery using life cycle analysis. Environmental Science & Technology,
Damico, J. R., Monson, C. C., Frailey, S., Lasemi, Y., Webb, N. D., Grigsby, N., . . . Berger, P. (2014). Strategies for advancing CO 2 EOR in the illinois basin, USA. Energy Procedia, 63, 7694-7708.
De Oliveira, Marcelo E Dias, Vaughan, B. E., & Rykiel, E. J. (2005). Ethanol as fuel: Energy, carbon dioxide balances, and ecological footprint. Bioscience, 55(7), 593-602.
Dones, R., Bauer, C., Heck, T., Mayer-Spohn, O., & Blesl, M. (2007). Life cycle assessment of future fossil technologies with and without carbon capture and storage. Materials Research Society, 1041(Symposium Proceedings), 1041-R05-01.
Dong, X., Li, C., Li, J., Wang, J., & Huang, W. (2010). A game-theoretic analysis of implementation of cleaner production policies in the chinese electroplating industry. Resources, Conservation and Recycling, 54(12), 1442-1448.
EIA. (2010). Annual energy outlook 2010: With projections to 2035. ( No. IEA-0383[2010]). Washington, DC 20585: U.S Energy Information Administration.
EIA. (2011). Annual energy review 2010. ( No. DOE/EIA-0384). Washington, DC 20585: U.S Energy Information Administration.
EIA. (2014a). Annual energy outlook 2014 with projections to 2040. ( No. DOE/EIA- 0383). Washington, DC: U.S. Department of Energy, Energy Information Administration.
EIA. (2014b). Monthly energy review. ( No. DOE/EIA-0035). Washington, DC 20585: U.S. Energy Information Administration.
EIA. (2016). International energy outlook 2016. ( No. DOE/EIA-0484). Office of Energy Analysis U.S. Department of Energy Washington, DC 20585: U.S. Energy Information Administration.
Subtitle E - production incentives: Section 354, Public LawU.S.C. 109-58 109th Congress (2005).
Epstein, P. R., Buonocore, J. J., Eckerle, K., Hendryx, M., Stout, B. M., Heinberg, R., . . . Glustrom, L. (2011). Full cost accounting for the life cycle of coal. Annals of the New York Academy of Sciences, 1219(1), 73-98.

96
ESRI. (2011). ArcGIS desktop (10th ed.). Redlands, CA: Environmental Systems Research Institute.
Farrell, A. E., Plevin, R. J., Turner, B. T., Jones, A. D., O'hare, M., & Kammen, D. M. (2006). Ethanol can contribute to energy and environmental goals. Science, 311(5760), 506-508.
Figueroa, J. D., Fout, T., Plasynski, S., McIlvried, H., & Srivastava, R. D. (2008). Advances in CO2 capture technology—The US department of energy's carbon sequestration program. International Journal of Greenhouse Gas Control, 2(1), 9-20.
Fluor Ltd. (2005). Study and estimate for CO2 capture facilities for the proposed 800 MW combined cycle power plant-tjeldbergodden, norway. (Final Report to Statoil No. CB2005-0022). London, U.K.: Fluor Ltd.
Fripp, M. (2009). Lifecycle greenhouse gas emissions from clean coal, clean gas and wind generators. Retrieved from http://www.manoa.hawaii.edu/reis/wp-content/files_mf/fripp_2009_generator_lca.pdf
Frischknecht, R., Jungbluth, N., Althaus, H., Hischier, R., Doka, G., Bauer, C., . . . Humbert, S. (2007). Ecoinvent V2 Ecoinvent Centre, Swiss Federal Laboratories for Materials Testing and Research (EMPA), Duebendorf (Switzerland).
Gibbins, J., & Chalmers, H. (2008). Carbon capture and storage. Energy Policy, 36(12), 4317-4322.
Global CCS Institute. (2012). The global status of CCS: 2012. ( No. ISBN 978-0-9871863-1-7). Canberra, Australia.: Global CCS Institute.
Global CCS Institute. (2014). The global status of CCS: 2014. ( No. ISSN 1619840819). Melbourne, Australia.:
Heath, G. A., & Mann, M. K. (2012). Background and reflections on the life cycle assessment harmonization project. Journal of Industrial Ecology, 16(s1), S8-S11.
Helin, T., Sokka, L., Soimakallio, S., Pingoud, K., & Pajula, T. (2013). Approaches for inclusion of forest carbon cycle in life cycle assessment–a review. GCB Bioenergy, 5(5), 475-486.
Helm, D., Hepburn, C., & Ruta, G. (2012). Trade, climate change, and the political game theory of border carbon adjustments. Oxford Review of Economic Policy, 28(2), 368-394.

97
Hendriks, C. (1994). Energy & environment: Carbon dioxide removal from coal-fired power plants Springer Science & Business Media.
Herzog, H., Meldon, J., & Hatton, A. (2009). Advanced post-combustion CO2 capture, prepared for the clean air task force. ( No. 04/09).Doris Duke Foundation.
Herzog, H. J. (2001). Peer reviewed: What future for carbon capture and sequestration? Environmental Science & Technology, 35(7), 148A-153A.
Herzog, H. J. (2011). Scaling up carbon dioxide capture and storage: From megatons to gigatons. Energy Economics, 33(4), 597-604.
Holloway, S., Rochelle, C., Bateman, K., Pearce, J., Baily, H., & Metcalfe, R. (1996). The underground disposal of carbon dioxide: Final report British Geological Survey.
Hornafius, K. Y., & Hornafius, J. S. (2015). Carbon negative oil: A pathway for CO2 emission reduction goals. International Journal of Greenhouse Gas Control, 37, 492-503.
Hoversten, G., Gritto, R., Washbourne, J., & Daley, T. (2002). CO2 gas/oil ratio prediction in a multi-component reservoir bycombined seismic and electromagnetic imaging. Geophysics, 68(LBNL--51408)
Hussain, D., Dzombak, D. A., Jaramillo, P., & Lowry, G. V. (2013). Comparative lifecycle inventory (LCI) of greenhouse gas (GHG) emissions of enhanced oil recovery (EOR) methods using different CO 2 sources. International Journal of Greenhouse Gas Control, 16, 129-144.
IEA. (2011). Cost and performance of carbon dioxide capture from power generation . (Working paper No. 05). Paris, France: International Energy Agency.
IEA. (2012). A policy strategy for carbon capture and storage. ( No. 01). Paris, France: International Energy Agency.
IEA GHG. (2006). Environmental impact of solvent scrubbing of CO2. Technical Study, 14(2006), 14.
IPCC. (2007). The fourth assessment report of the intergovernmental panel on climate change. ( No. 2007). Cambridge, UK and New York, NY.: Cambridge University Press.
United states code, 2006 edition, supplement 5, title 26 - INTERNAL REVENUE CODE. Credit for carbon dioxide sequestration under section 45Q, Bills and StatutesU.S.C. 45Q (2011).

98
ISO. (2006a). Environmental management - life cycle assessment - Requirements and guidelines. . (Guideline No. 14044). Geneva, Switzerland: International Organization for Standardization.
ISO. (2006b). Environmental management - life cycle assessment - principles and framework. (Guideline No. 14040). Geneva, Switzerland: International Organization for Standardization.
Jaramillo, P., Griffin, W. M., & McCoy, S. T. (2009). Life cycle inventory of CO2 in an enhanced oil recovery system. Environmental Science & Technology, 43(21), 8027-8032.
Kasibhatla, P., & Chamedies, H. (2007). G8 leadership is critical to curbing energy-related CO2 emissions. (Policy Brief No. NI PB 07-03). Duke University: Nicholas School of the Environment and Earth Sciences.
Katzer, J., Moniz, E. J., Deutch, J., Ansolabehere, S., & Beer, J. (2007). The future of coal: An interdisciplinary MIT study. technical report. ( No. 63). Cambridge, MA: Massachusetts Institute of Technology.
Khoo, H. H., & Tan, R. B. (2006a). Life cycle evaluation of CO2 recovery and mineral sequestration alternatives. Environmental Progress, 25(3), 208-217.
Khoo, H. H., & Tan, R. B. (2006b). Life cycle evaluation of CO2 recovery and mineral sequestration alternatives. Environmental Progress, 25(3), 208-217.
Knox‐Hayes, J. (2012). Negotiating climate legislation: Policy path dependence and coalition stabilization. Regulation & Governance, 6(4), 545-567.
Koiwanit, J., Piewkhaow, L., Zhou, Q., Manuilova, A., Chan, C. W., Wilson, M., & Tontiwachwuthikul, P. (2014). A life cycle assessment study of a canadian post-combustion carbon dioxide capture process system. The International Journal of Life Cycle Assessment, 19(2), 357-369.
Koornneef, J., van Keulen, T., Faaij, A., & Turkenburg, W. (2008). Life cycle assessment of a pulverized coal power plant with post-combustion capture, transport and storage of CO 2. International Journal of Greenhouse Gas Control, 2(4), 448-467.
Korre, A., Nie, Z., & Durucan, S. (2010). Life cycle modelling of fossil fuel power generation with post-combustion CO2 capture. International Journal of Greenhouse Gas Control, 4(2), 289-300.
Kutasi, G. (2010). Game theory modelling of climate change aspects Corvinus University of Budapest, Department of World Economy.

99
Kuuskraa, V. A., Van Leeuwen, T., Wallace, M., & DiPietro, P. (2011a). Improving domestic energy security and lowering CO2 emissions with “Next generation” CO2-enhanced oil recovery (CO2-EOR). National Energy Technology Laboratory, Pittsburgh, PA, USA,
Kuuskraa, V. A., Van Leeuwen, T., Wallace, M., & DiPietro, P. (2011b). Improving domestic energy security and lowering CO2 emissions with “Next generation” CO2-enhanced oil recovery (CO2-EOR). National Energy Technology Laboratory, Pittsburgh, PA, USA,
Laude, A., Ricci, O., Bureau, G., Royer-Adnot, J., & Fabbri, A. (2011). CO2 capture and storage from a bioethanol plant: Carbon and energy footprint and economic assessment. International Journal of Greenhouse Gas Control, 5(5), 1220-1231.
Li, N., Zhang, X., Shi, M., & Zhou, S. (2016). The prospects of china’s long-term economic development and CO2 emissions under fossil fuel supply constraints. Resources, Conservation and Recycling, doi:http://dx.doi.org.ezproxy.lib.purdue.edu/10.1016/j.resconrec.2016.03.016
Liang, X., Wang, Z., Zhou, Z., Huang, Z., Zhou, J., & Cen, K. (2013). Up-to-date life cycle assessment and comparison study of clean coal power generation technologies in china. Journal of Cleaner Production, 39(0), 24-31. doi:http://dx.doi.org.ezproxy.lib.purdue.edu/10.1016/j.jclepro.2012.08.003
Lokhorst, A., & Wildenborg, T. (2005). Introduction on CO2 geological storage-classification of storage options. Oil & Gas Science and Technology, 60(3), 513-515.
Macrotrends LLC. (2016). Crude oil prices - 70 year historical chart. Retrieved from http://www.macrotrends.net/1369/crude-oil-price-history-chart
Marx, J., Schreiber, A., Zapp, P., Haines, M., Hake, J. -., & Gale, J. (2011). Environmental evaluation of CCS using life cycle Assessment–A synthesis report. Energy Procedia, 4(0), 2448-2456. doi:10.1016/j.egypro.2011.02.139
McQuale, C. R. (2010). The global development of a CCS-based service and technology market with a focus on the US, france, and china
Melzer, L. S. (2012). Carbon dioxide enhanced oil recovery (CO 2 EOR): Factors involved in adding carbon capture, utilization and storage (CCUS) to enhanced oil recovery. Center for Climate and Energy Solutions,
100
Metz, B., Davidson, H., de Coninck, C., Loos, M., & Meyer, L. A. (2005). IPCC special report on carbon dioxide capture and storage. prepared by working group III of the intergovernmental panel on climate change. ( No. Prepared by working group III of the intergovernmental panel on climate change). Cambridge, United Kingdom and New York, NY, USA: Intergovernmental Panel on Climate Change, Cambridge University Press.
Meyer, J. P. (2007). Summary of carbon dioxide enhanced oil recovery (CO2EOR) injection well technology. American Petroleum Institute, , 54.
Middleton, R. S., Clarens, A. F., Liu, X., Bielicki, J. M., & Levine, J. S. (2014a). CO2 deserts: Implications of existing CO2 supply limitations for carbon management. Environmental Science & Technology, 48(19), 11713-11720.
Middleton, R. S., Clarens, A. F., Liu, X., Bielicki, J. M., & Levine, J. S. (2014b). CO2 deserts: Implications of existing CO2 supply limitations for carbon management. Environmental Science & Technology, 48(19), 11713-11720.
Middleton, R. S., & Eccles, J. K. (2013). The complex future of CO2 capture and storage: Variable electricity generation and fossil fuel power. Applied Energy, 108, 66-73.
Middleton, R. S., Levine, J. S., Bielicki, J. M., Viswanathan, H. S., Carey, J. W., & Stauffer, P. H. (2015). Jumpstarting commercial‐scale CO2 capture and storage with ethylene production and enhanced oil recovery in the US gulf. Greenhouse Gases: Science and Technology, 5(3), 241-253.
Mills, S. (2014). The energy frontier of combining coal and renewable energy systems.
MITEI. (2016). Commercial EOR projects using anthropogenic carbon dioxide. Retrieved from http://sequestration.mit.edu
Morbee, J. (2014). International transport of captured CO2: Who can gain and how much? Environmental and Resource Economics, 57(3), 299-322.
Muramatsu, E., & Iijima, M. (2002). Life cycle assessment for CO2 capture technology from exhaust gas of coal power plant. The 6th International Conference on Greenhouse Gas Control Technologies, Kyoto, Japan. , 1 57-62.
NEORI. (2012). CO2-EOR and agriculture National Enhanced Oil Recovery Initiative.
NEORI. (2016). Industry, labor, environmental coalition urges congress to support upcoming carbon capture utilization and storage incentive bill. Retrieved from http://neori.org/neori-others-welcome-steps-to-improve-existing-incentive/

101
NERC. (2014). The 2014 summer reliability assessment. ( No. May).North American Electric Reliability Corporation.
NETL. (2010a). An assessment of gate-to-gate environmental life cycle performance of water-alternating-gas CO2-enhanced oil recovery in the permian basin. ( No. DOE/NETL-2010/1433). Pittsburgh, PA: National Energy Technology Laboratory.
NETL. (2010b). Carbon sequestration atlas of the united states and canada. ( No. 3rd edition).National Energy Technology Laboratory.
NETL. (2010c). Life cycle analysis: Existing pulverized coal (EXPC) power plant. ( No. DOE/NETL-403-110809).National Energy Technology Laboratory.
NETL. (2010d). Life cycle analysis: Supercritical pulverized coal (SCPC) power plant. ( No. DOE/NETL-403-110609).National Energy Technology Laboratory.
NETL. (2011). Coal-fired power plants in the united states: Examination of the costs of retrofitting with CO2 capture technology. ( No. DOE/NETL- 402/102309).National Energy Technology Laboratory.
NETL. (2014a). FE/NETL CO2 Transport cost model (1st ed.) National Energy Technology Laboratory.
NETL. (2014b). Near-term projections of CO2 utilization for enhanced oil recovery. (Technical report No. 1648).National Energy Technology Laboratory.
NETL. (2015). Cost and performance baseline for fossil energy plants volume 1a: Bituminous coal and natural gas to electricity. ( No. DOE/NETL-2015/1723).National Energy Technology Laboratory.
NETL. (2016). NATCARB atlas. Retrieved from http://www.netl.doe.gov/research/coal/carbon-storage/natcarb-atlas
Nie, Z., Korre, A., & Durucan, S. (2011). Life cycle modelling and comparative assessment of the environmental impacts of oxy-fuel and post-combustion CO2 capture, transport and injection processes. Energy Procedia, 4, 2510-2517.
NREL. (2013). Life cycle assessment harmonization. Retrieved from http://www.nrel.gov/analysis/sustain_lcah.html
NREL. (2016). Interactive mapping tool . Retrieved from https://maps.nrel.gov
Odeh, N. A., & Cockerill, T. T. (2008). Life cycle GHG assessment of fossil fuel power plants with carbon capture and storage. Energy Policy, 36(1), 367-380.

102
Pehnt, M., & Henkel, J. (2009). Life cycle assessment of carbon dioxide capture and storage from lignite power plants. International Journal of Greenhouse Gas Control, 3(1), 49-66.
Rao, A. B., & Rubin, E. S. (2002). A technical, economic, and environmental assessment of amine-based CO2 capture technology for power plant greenhouse gas control. Environmental Science & Technology, 36(20), 4467-4475.
REX Energy. (2012). IL basin. Retrieved from http://www.rexenergy.com/il-basin.html
RFA. (2012). Accelerating industry innovation: 2012 ethanol industry outlook. (Annual Outlook No. 2012).Renewable Fuels Association;.
RFA. (2016). Renewable fuel association ethanol biorefinery 2014 production. Retrieved from http://www.ethanolrfa.org/resources/biorefinery-locations/
Rhodes, J., Clarens, A., Eranki, P., & Long, J. (2015). Electricity from natural gas with CO2 capture for enhanced oil recovery. ( No. ISBN 978-1‐930117-98-3). Sacramento, California: California Council on Science and Technology.
Rochelle, G. T. (2009). Amine scrubbing for CO2 capture. Science (New York, N.Y.), 325(5948), 1652-1654. doi:10.1126/science.1176731; 10.1126/science.1176731
Sathre, R. (2011). The role of life cycle assessment in identifying and reducing environmental impacts of CCS. Lawrence Berkeley National Laboratory,
Schreiber, A., Zapp, P., & Marx, J. (2012). Meta‐Analysis of life cycle assessment studies on electricity generation with carbon capture and storage. Journal of Industrial Ecology, 16(s1), S155-S168.
Schreiber, A., Zapp, P., Markewitz, P., & Vögele, S. (2010). Environmental analysis of a german strategy for carbon capture and storage of coal power plants. Energy Policy, 38(12), 7873-7883.
Singh, B. (2010). Environmental evaluation of carbon capture and storage technology and large scale deployment scenarios (PhD).
Singh, B., Strømman, A. H., & Hertwich, E. G. (2011a). Comparative life cycle environmental assessment of CCS technologies. International Journal of Greenhouse Gas Control, 5(4), 911-921.
Singh, B., Bouman, E. A., Strømman, A. H., & Hertwich, E. G. (2015). Material use for electricity generation with carbon dioxide capture and storage: Extending life cycle analysis indices for material accounting. Resources, Conservation and Recycling, 100, 49-57.

103
Singh, B., Strømman, A. H., & Hertwich, E. G. (2011b). Comparative impact assessment of CCS portfolio: Life cycle perspective. Energy Procedia, 4, 2486-2493.
Śliwińska, A., & Czaplicka‐Kolarz, K. (2013). Reducing life‐cycle environmental impacts of coal‐power by using coal‐mine methane. International Journal of Energy Research, 37(9), 1044-1058.
Solomon, S. (2007). Climate change 2007-the physical science basis: Working group I contribution to the fourth assessment report of the IPCC Cambridge University Press.
Solomon, S., Qin, D., Manning, M., Chen, Z., Marquis, M., Averyt, K., . . . Miller, H. (2007). Contribution of working group I to the fourth assessment report of the intergovernmental panel on climate change, 2007 Cambridge University Press, Cambridge.
Spath, P. L., & Mann, M. K. (2004). Biomass power and conventional fossil systems with and without CO2 sequestration-comparing the energy balance, greenhouse gas emissions and economics. ( No. NREL/TP-510-32575). Golden, Colorado: National Renewable Energy Laboratory.
Suebsiri, J., & Wilson, M. (2011). A model of carbon capture and storage with demonstration of global warming potential and fossil fuel resource use efficiency. Energy Procedia, 4, 2465-2469.
Supekar, S. D., & Skerlos, S. J. (2014). Market-driven emissions from recovery of carbon dioxide gas. Environmental Science & Technology, 48(24), 14615-14623.
Swanson, T., & Lin, T. (2009). Economic growth and environmental regulation: China's path to a brighter future Routledge.
Tang, L., Shi, J., Yu, L., & Bao, Q. (2015). Economic and environmental influences of coal resource tax in china: A dynamic computable general equilibrium approach. Resources, Conservation and Recycling, doi:http://dx.doi.org.ezproxy.lib.purdue.edu/10.1016/j.resconrec.2015.08.016
Tanner, M. (2010). Projecting the scale of the pipeline network for CO2-EOR and its implications for CCS infrastructure development. US Energy Information Administration, Office of Petroleum, Gas & Bio-Fuels Analysis,
Turocy, T. L., & von Stengel, B. (2001). Game theory*: Draft prepared for the enciclopedia of information systems. Dept.Math., London School Econ., London, UK, Tech.Rep.LSE-CDAM-2001-09,

104
U.S EPA. (2015). Facility level information on greenhouse gases (FLIGHT). 2014 greenhouse gas emissions from large facilities. Retrieved from https://ghgdata.epa.gov/ghgp/main.do
U.S. DOE. (2011). Sustainability assessment of coal- fired power plants with carbon capture and storage . (Laboratory Directed Research and Development (LDRD) project No. DE-AC05-76RL01830). Washington, DC.: U.S. Department of Energy, Pacific Northwest National Laboratory Richland.
U.S. DOE. (2013). Transportation energy futures: Combining strategies for deep reductions in energy consumption and GHG emissions. (Technical No. DOE/GO-102013-3845). National Renewable Energy Laboratory (NREL), Golden, CO.: US Department of Energy, Office of Energy Efficiency and Renewable Energy Analysis and Evaluation.
U.S. EPA. (2012). Inventory of U.S. greenhouse gas emissions and sinks:1990-2010(april 2012). ( No. EPA 430-R-12). Washington, DC. U.S.A.: U.S. Environmental Protection Agency.
U.S. EPA. (2015). Inventory of US greenhouse gas emissions and sinks: 1990-2013. ( No. EPA 430-R-15-004). Washington, DC 20460, USA: US EPA.
UChicago Argonne, L. (2014). In Elgowainy A., Dieffenthaler D., Sokolov V., Sabbisetti R., Cooney C. and Anjum A.(Eds.), GREET.NET model. (GREET v 1.2.0.11425 ed.). Lemont, IL.: Argonne National Laboratory.
UK DECC. (2012). CCS roadmap: Supporting deployment of carbon capture and storage in the UK. ( No. URN 12D/016). 3 Whitehall Place, London: Department of Energy and Climate Change.
UK DTI. (2000). Best practice brochure: Use of extracted coalbed methane for power production at tower colliery. ( No. Best Practice Brochure 002). London: Department of Trade and Industry.
UK DTI. (2005). The role of fossil fuel carbon abatement technologies (CATs) in a low carbon energy system. ( No. A Report Undertaken to Advise the DTI’s CAT Strategy). London: United Kingdom Department of Trade and Industry.
UKERC. (2008). Environmental sustainability of electricity generation systems with carbon dioxide capture and storage. ( No. WP/ES/2008/002).UK Energy Research Centre.
Urpelainen, J. (2013). Can strategic technology development improve climate cooperation? A game-theoretic analysis. Mitigation and Adaptation Strategies for Global Change, 18(6), 785-800.

105
Viebahn, P., Nitsch, J., Fischedick, M., Esken, A., Schüwer, D., Supersberger, N., . . . Edenhofer, O. (2007). Comparison of carbon capture and storage with renewable energy technologies regarding structural, economic, and ecological aspects in germany. International Journal of Greenhouse Gas Control, 1(1), 121-133.
Whitaker, M., Heath, G. A., O’Donoughue, P., & Vorum, M. (2012). Life cycle greenhouse gas emissions of Coal‐Fired electricity generation: Systematic review and harmonization. Journal of Industrial Ecology, 16(s1), S53-S72.
White House Press. (2015). Fact sheet: U.S. reports its 2025 emissions target to the UNFCCC. Retrieved from https://www.whitehouse.gov/the-press-office/2015/03/31/fact-sheet-us-reports-its-2025-emissions-target-unfccc
WWF. (2007). Climate solutions: The WWF vision for 2050. ( No. 2-88085-277-3).World Wildlife Foundation.
Xu, Y., Isom, L., & Hanna, M. A. (2010). Adding value to carbon dioxide from ethanol fermentations. Bioresource Technology, 101(10), 3311-3319.
Yang, J., Wu, J., He, T., Li, L., Han, D., Wang, Z., & Wu, J. (2016). Energy gases and related carbon emissions in china. Resources, Conservation and Recycling, 113, 140-148.
Yang, X., & Teng, F. (2016). The air quality co-benefit of coal control strategy in china. Resources, Conservation and Recycling, 113, 140-148. doi:http://dx.doi.org.ezproxy.lib.purdue.edu/10.1016/j.resconrec.2016.08.011
Zapp, P., Schreiber, A., Marx, J., Haines, M., Hake, J., & Gale, J. (2012). Overall environmental impacts of CCS technologies—A life cycle approach. International Journal of Greenhouse Gas Control, 8(0), 12-21.
Zhai, H., & Rubin, E. S. (2010). Performance and cost of wet and dry cooling systems for pulverized coal power plants with and without carbon capture and storage. Energy Policy, 38(10), 5653-5660.
Zhang, X., Singh, B., He, X., Gundersen, T., Deng, L., & Zhang, S. (2014). Post-combustion carbon capture technologies: Energetic analysis and life cycle assessment. International Journal of Greenhouse Gas Control, 27(0), 289-298.
Ziębik, A., Hoinka, K., & Liszka, M. (2010). Life cycle assessment analysis of supercritical coal power units. Archives of Thermodynamics, 31(3), 115-130.

APPENDICES

106
Appendix A CCS and CO2 Storage
A.1 Saline Formation
Saline formations exist at a greater depth compared to oil reservoirs and coal seams.
These types of formation are globally available with great storing capacities (Lokhorst &
Wildenborg, 2005). The rocks in these formations are classified as porous containing
extremely salty water. There are limited encouraging projects worldwide. A famous
project is the Sleipner project off the coast of Norway. In this project, over 10 million
tons of CO2 have been injected so far with no leakage noticed yet (Lokhorst &
Wildenborg, 2005).
A.2 Depleted Oil and Gas Reservoirs
In depleted oil and gas reservoirs, CO2 has been commercially used to increase pressure
and recover residual oil and gas from the reservoirs. This process is known as enhanced
oil recovery (EOR). According to the U.S. DOE, this option has an added-value besides
CO2 storage, as an additional 39-48 billion barrels of domestic oil could be produced
prior to 2030 as a consequence of this technology (NETL, 2010d). As of 2013, there were
seven large-scale CCS projects in the United States, with CO2-capturing capacities
ranging from 0.68 to 8.4 MMT of CO2 per year (Global CCS Institute, 2014).
A.3 Un-minable coal seams
Naturally, coal seams contain gases such CH4 that are held in pores in the coal and
adsorbed on the surface of the coal (Lokhorst & Wildenborg, 2005). Certain coal seems

107
such as those that are too deep or too thin to be economically viable can be feasible CO2
storage sites. The UK Department of Trade and Industry (UK DTI) estimates that
undisrupted coal seams can contain extensive amounts of CH4, as much as 25 m3 per ton
of coal. CO2 injection in this type of formation will displace the CH4, which can then be
recovered for energy generation (UK DTI, 2000).
A.4 United States CO2 supply and demand market
Table A-1 lists a number of CO2 end-users, where CO2 is supplied from either natural or
industrial sources. The latter are primarily industries that produce an almost pure CO2
stream. Among these industries is the refining of ethanol, where only the dehydration and
compression of CO2 are required before its delivery to consumers (Middleton et al.,
2014b). In 2014, Superkar and Skerlos published an overview of the U.S. CO2 merchant
market that listed major suppliers and buyers, as shown in Figure A.1 “merchant market”
is a free market controlled by supply and demand, in which suppliers and buyers of a
commodity are independent and are not owned by the same entity. Under this definition,
the supply of CO2 for enhanced oil recovery was not included in the CO2 merchant
supply portfolio for the U.S. (Supekar & Skerlos, 2014).

108
Figure A1. Sources of CO2 supply in the U.S. merchant market excluding CO2 used for EOR
Source: (Supekar & Skerlos, 2014)
As shown in Figure A.1, about 4.3 MMT is supplied from ethanol, 3.15 from natural CO2
wells, and about 3 MMT each from hydrogen and ammonia. Table A-1 lists the major
CO2 consumers in the U.S. in terms of annual demand.
Table A-1: Demand for CO2 in the U.S. market in millions of metric tons (MMT) per year
Industry Market Demand MMT Enhanced Oil Recovery (EOR) 50 Food Processing 6.38 Carbonated Beverages 1.98 Agriculture 0.77 Chemical Processing 0.11 Metal Fabrication 0.44 Others 1.32 Approximate Total CO2 Annual Demand 61
Notes: EOR data is for 2007; other data represents the U.S merchant market for CO2 in 2013.
Sources: (Middleton et al., 2014b; Supekar & Skerlos, 2014)
As shown in Table A-1, enhanced oil recovery consumes significantly more CO2 than
any other industry, followed by the food processing industry. Currently, more than 50

109
MMT of CO2 are injected per year in EOR, which produces more than 90 million barrels
of oil (MMbo) (Meyer, 2007). About 70% of this figure comes from natural CO2-
dedicated wells (Middleton et al., 2014b).

110
Appendix B Technical Parameters
B.1.0 Technical parameters for pathways for LCA-GIS integration
B.1.1 Pathway 1
Figure B.1 shows processes that have been included in the ethanol production system
boundaries. We used the uses a different regional electricity grid mix as per the NERC
classification for energy related requirements focusing on the ethanol drying milling
process. The system boundary for ethanol production was utilized from the GREET
model of Argonne Lab, which assumes natural gas as the main source of heat (about
84%). The remaining heat is supplied from coal (7%) and electricity grid mix (9%). The
ethanol production process is described in detail in the Supporting Information document.
Figure B.1. System boundaries of corn-based ethanol manufacturing via dry milling.
Table B-1: GHG emission of CO2 supply from dry milling corn based ethanol including LCA emission of ethanol manufacturing.
Parameter Value Reference
1.0 CO2 Supply
1.1 Corn ethanol [g CO2-e/gallon] 4929 GREET.2014

111
1.2 Gallons of EtOH [gallon / bbl.] 90-395 (This is co-product generated from
one bbl. of crude, region specific)
1.3 Electricity for CO2 purification [kWh / tCO2] 171.8 This CO2 is utilized fermentation
(ISGS 2006, p15)
B.1.1.1 Biogenic CO2 accounting
Capturing biogenic CO2 would lower the upstream emission from ethanol production. In
other words, subtracting captured CO2 (from the fermentation process) from upstream
ethanol production would lower the net GHG emission of ethanol production. Figure 2
illustrates the carbon flow for pathway one by considering this assumption.
Figure B.2 Carbon flow diagram for pathway 1. The green arrow represents biogenic CO2 captured from the fermentation process. This value is subtracted from non-biogenic CO2
emissions associated with ethanol production NOTE: Note: We assumed that 0.25-ton CO2 would recover one bbl. of crude via EOR as an example.
B.1.2 Pathway 2
Ethanol�produc on�• corn�farming�• Corn�transport�to�EtOH�refinery��• Corn�Dry�miliing�at�refinery�• EtOH�transport�to�end-users�• Biogenic�femninta on�
CCS�system�• Energy�for�CO2�cpature�and�compression�
CO2�transport�• Mainly�in�the�form�of�energy�for�CO2�transport�via�pipelines�
EOR�recovery�• Conve onal�oirl�recovery�• Add onal�energy�for�CO2�injce on�• CO2�leakage�rate�
0.43
1�t�CO
2-e�
0.25�t�CO2-e�
0.03
2�t�CO
2-e�
0.00
55��t�CO2-e�
0.04
2�t�CO
2-e�
Non
-biogenic�
CO2�
Biog
enic�CO2�
0.25�t�CO
2-e�
0.181�tCO2-e�
0.213�tCO2-e�
0.2185�tCO2-e�
Stored
�CO2�

112
Figure B.3 System boundaries of coal-fired electricity generation via 99.9% steam power generation
The life cycle GHG emissions for a coal-fired power plant covers coal mining and
cleaning, transport, amine production, and direct emission from stack (released). CO2
transport and storage are covered separately.
Table B-2: Performance parameters of a coal-fired power plant with CCS No. Process Value Reference
1.1 CCS total energy penalty [kWh/kWh (PC-CC)] 0.25 (H. J. Herzog, 2001; H. J. Herzog,
2011)
1.2 CCS electricity requirements [ kWh/tCO2
captured (PC-CC)]
317 (H. J. Herzog, 2001; H. J. Herzog,
2011)
1.3 Emission of CCS capture [tCO2e/tCO2 captured]
(w/o amine production, transport & injection)
0.21003 (Frischknecht et al., 2007;
Koornneef et al., 2008; Odeh &
Cockerill, 2008)
1.4 Solvent Production [t CO2e/tCO2 captured] 0.00525 (Frischknecht et al., 2007;
Koornneef et al., 2008; Odeh &
Cockerill, 2008)

113
1.5 Net GHG from CCS [tCO2e/tCO2 captured] 0.2153 Not to be included because we
capture 90%
B.1.3 Pathway 3
Figure B.4 System boundaries of natural gas electricity generation at 82% by natural gas combined cycle (NGCC) power generation
Table B-3 Performance parameters of CO2 supply from a NG-fired power plant with CCS
No. Process Value Reference
1.1 CCS total energy penalty [ kWh/kWh (NG-CC)] 0.13 (H. J. Herzog, 2001; H. J. Herzog,
2011)
1.2 CCS electricity requirements [ kWh/tCO2
captured (NG-CC)]
354 (H. J. Herzog, 2001; H. J. Herzog,
2011)
1.3 Emission of CCS capture [ tCO2e/tCO2 captured]
( w/o amine production, transport & injection)
0.235 (Frischknecht et al., 2007;
Koornneef et al., 2008; Odeh &
Cockerill, 2008)

114
1.4 Solvent Production [t CO2e/tCO2 captured] 0.00525 (Frischknecht et al., 2007;
Koornneef et al., 2008; Odeh &
Cockerill, 2008)
1.5 Net GHG from CCS [t CO2e/t CO2 captured] 0.24 Not to be included because we
capture 90%
B.2.0 CO2 Transport parameters
Table B-4: Performance parameters CO2 transport and emissions profile CO2 EOR storage location.
Process Value Reference
2.1 Energy intensity of pipeline transport [btu/ton-mi] 127 (Rhodes et al., 2015)
2.2 Pipeline distance [mi] 100 Assumed based on geographic
information.
Using the existing CO2 pipelines make more economic sense if capacity is not a
constraint. We agree that 100-mile radius seems to be restrictive, however our choice was
guided based on the information found in the literature that indicate the need for
additional CO2 infrastructure. The literature has indicated that existing CO2 pipelines
would not to support further expansion in EOR oil production and for that reason major
EOR regions such as, the Permian basin, Rockies, Mid-continent and the Gulf Coast
basin are planning to build additional dedicated CO2 pipelines networks(Melzer, 2012;
NEORI, 2012; Tanner, 2010). Because this study considers the opportunity of increasing
the share of low carbon intensive oil production (CO2-EOR) as opposed to conventional
oil production, we think that it would be more reasonable to select a restrictive distance
(100-miles) versus using the distance of existing CO2 pipelines. This choice would help

115
to avoid the inclusion of impractical CO2 candidates, which could overestimate the
number of potential CO2 candidates. For the pathways investigated under this restrictive
assumption, the results indicate that 1.25 million barrels of crude can be recovered per
day through the use of CO2-EOR, which more than 4 times current CO2-EOR oil
production. Therefore, we investigated different distance values using the FE/NETL CO2
transport model which considers capital as well as operational cost of CO2 transport
infrastructure. We highlighted this point in the limitation section and mentioned the
opportunity of increasing the distance parameter.
Nevertheless, reviewer’s comment was taking into consideration and the use of less
restrictive distance value has also been investigated. Results were shown in Figure B.5 to
illustrate the potential CO2 candidates within 300 miles from EOR regions. With the 300
miles’ distance restriction, the number of CO2 candidates increases to 88, 105, and 193
compared to 21, 22, and 33 with the 100 miles for pathways 1,2, and 3, respectively. We
noticed that most of those additional candidates were located in the Midwestern region,
where oil deposits are not significant, and therefore would not be able to use existing CO2
pipelines even if capacity is not an issue.

116
Figure B.5 Potential CO2 candidates within 300 miles from EOR oil basins
B.3.0 Crude recovery parameters
Table B-5: GHG of Enhanced oil recovery per barrel of recovered crude. Process Value Reference
U.S Conventional oil recovery [g CO2/bbl.] 29911 GREET.2014
U.S Conventional transport process [g CO2/bbl.] 10889 GREET.2014
Additional energy for EOR [1.78 kWh/bbl] 1329.6 (Rhodes et al., 2015)
Total GHGs U.S EOR to Refinery (Recovery, EOR, and transport) 42129.6 Calculated
Table B-6 EOR technology parameters Parameter Value Reference Remarks

117
Energy for EOR [kWh/bbl.] 1.78 (Middleton et al.,
2014b)
This includes energy needed for
CO2 injection into EOR reservoir
and CO2 recovery from recovered
crude.
Oil production rate [bbl./ tCO2] 4 (ARI, 2010b; NETL,
2010a)
This value represents historical
EOR practices and can be adjusted
based on EOR reservoir specific
characteristics.
Sequestered CO2 [tCO2/ bbl.] 0.26-
1.13
Calculated from oil
production rate
Depending to oil basin (see Table
7)
CO2 sequestration rate 0.991 (Middleton et al.,
2014b)
Table B-7 Crude recovery rates from major oil basins in the lower 48 sates of the U.S. Region Annual bbl.
produced via
CO2 EOR
TCO2
injected per
year
BBL/tCO2 TCO2/bbl Reference
Permian Basin 67890000 32802597.4 2.07 0.48 (NETL, 2014b)
Gulf Coast 15695000 17728571.43 0.89 1.13 (NETL, 2014b)
Rockies 13140000 4645454.545 2.83 0.35 (NETL, 2014b)
Mid-Continent 6205000 1611688.312 3.85 0.26 (NETL, 2014b)

118
California NA NA 2.5 0.4 (Middleton et al.,
2014b)
Table B-8 Operational parameters for EOR from the literature
Source: (NETL, 2010a)
B.4.0 GHG life cycle emissions for electricity
The energy requirement for CO2 transport via pipeline, and injection in the EOR assumed
to be supplied by regional NERC entities in all scenarios. The life cycle GHG emissions
of each entity are provided in Table B-9. The U.S. electrical grid is regulated by the
North American Electric Reliability Corporation (NERC), which insures the reliability of
bulk power systems in the United States, Canada, and the northern part of Baja
California, Mexico (NERC, 2014). The NERC delegates its authority to eight regional

119
electric reliability entities that cover the 48 contiguous states and the District of
Columbia. Each regional entity is accountable for compliance with NERC regulations
and standards as well as distribution of electricity in areas under the entity’s jurisdiction.
Table B-9 shows the eight regional players, distribution of electricity sources and CO2e
per kWh of electricity distributed for end users.
1. Florida Reliability Coordinating Council
2. Midwest Reliability Organization (MRO)
3. Northeast Power Coordinating Council (NPCC)
4. Reliability First (RF)
5. Southwest Power Pool, RE (SPP)
6. Texas Reliability Entity (TRE)
Table B-9 shows the eight regional players, distribution of electricity sources from coal
and CO2e per kWh of electricity distributed for end users.
Table B-9 NERC regional entities profile and their LCA GHG emissions Regional NERC entity Population
served
Geography LCA GHG
(g CO2/ kWh)
(%)
Electricity
from coal
Florida Reliability
Coordinating Council
(FRCC)
Over 16
million
About 50,000 square miles over
peninsular Florida.
628.8 0.24381
Midwest Reliability
Organization (MRO)
Over 20
million
Covers roughly one million square
miles spanning the provinces of
Saskatchewan and Manitoba, and all or
parts of the states of Illinois, Iowa,
Minnesota, Michigan, Montana,
747 0.64302

120
Nebraska, North Dakota, South Dakota
and Wisconsin.
Northeast Power
Coordinating Council
(NPCC)
About 35
million
State of New England, New york, and
Maritimes area.
329.8 0.04269
NPCC New York About 19.4
million
State of New York
NPCC- New England About 14
million
New England
NPCC- Maritimes About 1.9
million
New Brunswick and Nova Scotia
NPCC-Ontario ~ 13 million Province of Ontario
NPCC- Québec About 8million Province of Québec
Reliability First (RF) About 61
million
All or parts of Delaware, Illinois,
Indiana, Kentucky, Maryland,
Michigan, New Jersey, North Carolina,
Ohio, Pennsylvania, Tennessee,
Virginia, West Virginia, and the
District of Columbia.
705.8 0.54487
Southwest Power Pool,
RE (SPP)
About 15
million
all or parts of Arkansas, Kansas,
Louisiana, Mississippi, Missouri, New
Mexico, Oklahoma, and Texas and the
entire state of Nebraska covering
370,000 square miles.
625.25 0.43394
Texas Reliability Entity
(TRE)
About 23
million
State of Texas 662.5 0.3735

121
Western Electricity
Coordinating Council
(WECC)
Approximately
81 million
people
Serving an area of nearly 1.8 million
square miles It extends from Canada to
Mexico. It includes the provinces of
Alberta and British Columbia in
Canada, the northern portion
of Baja California in Mexico, and all
or portions of the 14 Western states in
between.
489.5 0.27323
SERC Reliability
Corporation (SERC)
About 39.4
million
All or portions of Alabama, Florida,
Georgia, Iowa, Kentucky, Mississippi,
Missouri, North Carolina, Oklahoma,
South Carolina, Tennessee, and
Virginia. Covers an approximate area
of 308,900 square miles
664.4 0.46113
US Electricity Grid Mix About 330 628 0.41471
Source: (NERC, 2014; UChicago Argonne, 2014)
B.5.0 Co-product sensitivity impacts
In our model, we assumed that “like displaces like,” i.e., that the two co-products, ethanol
and electricity, would displace the production of corn ethanol and electricity from coal.
However, the choice of different substitutes for ethanol and electricity based on the
purpose that co-product serves can be argued. For example, the co-product, in pathway 2,
supplies additional electricity to power grid mix and therefore it may be argued that it
should not assumed to displace electricity from coal which would yield greater
displacement credit. The same argument also applies to pathway 1, where ethanol is
mostly used as a blending agent in gasoline. Thus, we chose to explore different
substitutes for corn ethanol and electricity from coal, where we assumed that ethanol and

122
electricity would displace gasoline blend stock (~ 55% less LCA GHG emissions than
corn ethanol) and U.S. electricity grid mix (~ 70% less LCA GHG emissions than
electricity from coal), respectively.
Table B-10 Displaced co-products in each pathway Pathway Product Co-product Displaced products GHG
displacement
Value [g CO2-e]
1: EtOH-CCS-
EOR Recovered oil
88 gallons
Ethanol fuel
Ethanol production
(Like-displaces-like)
-436655
1: EtOH-CCS-
EOR Recovered oil
88 gallons
Ethanol fuel
Gasoline blend stock
(Alternative-substitute)
-235997
1: EtOH-CCS-
EOR Recovered oil
88 gallons
Ethanol fuel
Cellulosic ethanol
(Alternative-substitute)
-0.077
2: PC-CCS-
EOR Recovered oil 279 kWh Electricity
Regional electricity
(Like-displaces-like)
-224473
2: PC-CCS-
EOR Recovered oil 279 kWh Electricity
U.S. electricity grid mix
(Alternative-substitute)
-208483
NOTE: Note: We assumed that 0.25-ton CO2 would recover one bbl. of crude via EOR as an example.
B.6.0 Sensitivity Analysis of the Results
Based on the CO2 recovery rates in each region we estimated the potential recoverable
barrels of oil per year from the pathways considered.

123
Figure B.6 The recoverable barrels of oil with respect to CO2 supply from sources and crude recover rates in each oil basin
As seen in Figure B.6, pathway 2 was the major supplier for CO2 compared to the other
two pathways. However, the LCA results have shown that pathway 2 was not the most
favorable carbon intensive option. Figure B.7 illustrates pathways in an ascending order
based on the CI of a barrel of crude recovered via CO2-EOR. Figures B.8-B.11 illustrate
the share of GHG emissions from various system processes in the form of tons of CO2
equivalent per a barrel of crude produced and consumed.
0.0E+00
5.0E+07
1.0E+08
1.5E+08
2.0E+08
2.5E+08
3.0E+08
3.5E+08
4.0E+08
4.5E+08
Pathway 1: EtOH Pathway 2: Coal Pathway 3: Natural gas
Re
cove
rab
le b
bl p
er
year
California
Permianbasin
Rockies
Gulf coast
Mid-Continent
Michigan/Indiana

124
Figure B.7 Ranking of pathways in major EOR fields

125
B.6.1 Pathway 1
Figure B.8. Share of GHG emissions from different system processes in pathway 1
B.6.2 Pathway 2
Figure B.9 Share of GHG emissions from different system processes in pathway 2

126
B.6.3 Pathway 3
Figure B.10 Share of GHG emissions from different system processes in pathway 3

127
B.7.0 Details on the methodology used for game-theory assessment
Table B-11 Description of each game and parameters for calculating payoffs sc
enar
io
Gam
e N
o.
C1 = CO2 capture C2 = CO2 regulation C3 = CO2 price to EOR
1.
No
chan
ge in
cur
rent
regu
latio
n. C
hang
es in
oil
pric
es a
nd C
CS
tech
nolo
gies
1
x CO2 emitters responsible for any cost associated with CCS
x $22.7 for ethanol and $66.2 for coal based on current CCS technologies.
x No carbon cap regulatory limit on industries.
x Carbon credit is $10 for coal power plants.
x EOR operator offset some of the CCS cost by purchasing CO2 from emitters.
x The price is assumed to be $28 per metric ton of CO2. [at $60 oil price per bbl]
2
x CO2 emitters responsible for any cost associated with CCS
x $22.7 for ethanol and $66.2 for coal based on current CCS technologies.
x No carbon cap regulatory limit on industries.
x Carbon credit is $10 for coal power plants.
x EOR operator offset some of the CCS cost by purchasing CO2 from emitters.
x The price is assumed to be $52 per metric ton of CO2. [at $110 oil price per bbl]
3
x CO2 emitters responsible for any cost associated with CCS.
x $16 for ethanol and $51 for coal based on future CCS technologies.
x No carbon cap regulatory limit on industries.
x Carbon credit is $10 for coal power plants.
x EOR operator offset some of the CCS cost by purchasing CO2 from emitters.
x The price is assumed to be $28 per metric ton of CO2. [at $60 oil price per bbl]
4
x CO2 emitters responsible for any cost associated with CCS.
x $16 for ethanol and $51 for coal based on future CCS technologies.
x No carbon cap regulatory limit on industries.
x Carbon credit is $10 for coal power plants.
x EOR operator offset some of the CCS cost by purchasing CO2 from emitters.
x The price is assumed to be $52 per metric ton of CO2. [at $110 oil price per bbl]

128
2.
No
carb
on T
ax. C
hang
e in
cur
rent
regu
latio
n by
incr
easi
ng c
redi
t to
$30.
Cha
nges
in o
il pr
ices
and
CC
S te
chno
logi
es
5 x CO2 emitters responsible for any cost associated with CCS.
x $22.7 for ethanol and $66.2 for coal based on current CCS technologies.
x No carbon cap regulatory limit on industries.
x Carbon credit is $30 for coal power plants.
x EOR operator offset some of the CCS cost by purchasing CO2 from emitters.
x The price is assumed to be $28 per metric ton of CO2. [at $60 oil price per bbl]
6 x CO2 emitters responsible for any cost associated with CCS.
x $22.7 for ethanol and $66.2 for coal based on current CCS technologies.
x No carbon cap regulatory limit on industries.
x Carbon credit is $30 for coal power plants.
x EOR operator offset some of the CCS cost by purchasing CO2 from emitters.
x The price is assumed to be $52 per metric ton of CO2. [at $110 oil price per bbl]
7 x CO2 emitters responsible for any cost associated with CCS.
x $16 for ethanol and $51 for coal based on future CCS technologies.
x No carbon cap regulatory limit on industries.
x Carbon credit is $30 for coal power plants.
x EOR operator offset some of the CCS cost by purchasing CO2 from emitters.
x The price is assumed to be $28 per metric ton of CO2. [at $60 oil price per bbl]
8 x CO2 emitters responsible for any cost associated with CCS.
x $16 for ethanol and $51 for coal based on future CCS technologies.
x No carbon cap regulatory limit on industries.
x Carbon credit is $30 for coal power plants.
x EOR operator offset some of the CCS cost by purchasing CO2 from emitters.
x The price is assumed to be $52 per metric ton of CO2. [at $110 oil price per bbl]

129
3.
$20
car
bon
Tax.
Cha
nge
in c
urre
nt re
gula
tion
by in
crea
sing
cre
dit t
o $3
0. C
hang
es in
oil
pric
es a
nd C
CS
tech
nolo
gies
9 x CO2 emitters responsible for any cost associated with CCS.
x $22.7 for ethanol and $66.2 for coal based on current CCS technologies.
x Carbon cap on industrial anthropogenic CO2 emitters.
x $ 20 carbon tax per metric ton CO2 emitted.
x Carbon credit is $30 for coal power plants.
x EOR operator offset some of the CCS cost by purchasing CO2 from emitters.
x The price is assumed to be $28 per metric ton of CO2. [at $60 oil price per bbl]
10 x CO2 emitters responsible for any cost associated with CCS.
x $22.7 for ethanol and $66.2 for coal based on current CCS technologies.
x Carbon cap on industrial anthropogenic CO2 emitters.
x $ 20 carbon tax per metric ton CO2 emitted.
x Carbon credit is $30 for coal power plants.
x EOR operator offset some of the CCS cost by purchasing CO2 from emitters.
x The price is assumed to be $52 per metric ton of CO2. [at $110 oil price per bbl]
11 x CO2 emitters responsible for any cost associated with CCS.
x $16 for ethanol and $51 for coal based on future CCS technologies.
x Carbon cap on industrial anthropogenic CO2 emitters.
x $ 20 carbon tax per metric ton CO2 emitted.
x Carbon credit is $30 for coal power plants.
x EOR operator offset some of the CCS cost by purchasing CO2 from emitters.
x The price is assumed to be $28 per metric ton of CO2. [at $60 oil price per bbl]
12 x CO2 emitters responsible for any cost associated with CCS.
x $16 for ethanol and $51 for coal based on future CCS technologies.
x Carbon cap on industrial anthropogenic CO2 emitters.
x $ 20 carbon tax per metric ton CO2 emitted.
x Carbon credit is $30 for coal power plants.
x EOR operator offset some of the CCS cost by purchasing CO2 from emitters.
x The price is assumed to be $52 per metric ton of CO2. [at $110 oil price per bbl]

130

13
VITA

131
VITA
Abotalib, Mohammad was born in Kuwait on May 3, 1983. At the age of 18, he
decided to pursue his undergraduate studies overseas. In 2001 he received a scholarship
from the Ministry of Higher Education, Kuwait to pursue his undergraduate studies at
Griffith University, Brisbane, Australia. After graduation, he joined Kuwait Oil Company
(KOC) as and environmental engineer and there he got exposed to several environmental
problems such as air pollution, land contamination and industrial waste management.
During his time at KOC, he became keenly aware of the urgency of addressing
environmental challenges properly, especially for a country like Kuwait, which is highly
dependent on oil.
In 2010 he received a scholarship from Kuwait University to purse his master and
Ph.D. in the United Sates. In January, 2011, he started his master degree at the University
of Pennsylvania and graduated in December 2012. In 2013, he joined the Ecological
Sciences and Engineering Ph.D. program at Purdue University.

PUBLICATIONS

132
PUBLICATIONS
Abotalib, M., & Zhao, F. (2015). Life cycle harmonization of carbon capture and
sequestration for coal-fired power plants. Paper Proceedings from the LCA XV
International Conference, October 6-8, 2015 Vancouver, Canada, 76-88.
Abotalib, M., Zhao, F., & Clarens, A. (2016). Deployment of a geographical information
system life cycle assessment integrated framework for exploring the opportunities
and challenges of enhanced oil recovery using industrial CO2 supply in the united
states. ACS Sustainable Chemistry & Engineering, 4(9), 4743-4751.