sustainability assessment of food and agriculture … · safa sustainability assessment of food and...
TRANSCRIPT

SAFA Sustainability Assessment of Food and Agriculture systems
Guidelines (Test Version 1.0)
NATURAL RESOURCES MANAGEMENT AND ENVIRONMENT DEPARTMENT

FAO, Rome, 12 June 2012

3
The designations employed and the presentation of material in this information product do not imply the expression of any opinion whatsoever on the part of the Food and Agriculture Organization of the United Nations (FAO) concerning the legal or development status of any country, territory, city or area or of its authorities, or concerning the delimitation of its fron-tiers or boundaries. The mention of specific companies or products of manufacturers, whether or not these have been patented, does not imply that these have been endorsed or recommended by FAO in preference to others of a similar nature that are not mentioned. The views expressed in this information product are those of the author(s) and do not nec-essarily reflect the views of FAO. All rights reserved. FAO encourages the reproduction and dissemination of material in this information product. Non-commercial uses will be authorized free of charge, upon request. Reproduction for resale or other commercial purposes, including educational purposes, may incur fees. Applications for permission to reproduce or disseminate FAO copyright materials, and all queries concerning rights and licences, should be addressed by e-mail to [email protected] or to the Chief, Publishing Policy and Support Branch, Office of Knowledge Exchange, Re-search and Extension, FAO, Viale delle Terme di Caracalla, 00153 Rome, Italy.
Acknowledgements
The Natural Resources Management and Environment Department is grateful for the re-
search work provided by Sasha Courville, Jan Grenz, Elisabeth Guttenstein, Julia Jawtusch,
Madeleine Kaufmann, Jonathan Loh, Noémi Nemes, Christian Schader, Susanne Stalder and
Christian Thalmann.
Special thanks go to the hundreds individuals who provided their insights on the occasion of
the SAFA experts consultations held in November 2009 and April 2011, electronic fora held
in early 2011 and 2012, and numerous stakeholders’ surveys and interviews. Last but not
least, the knowledge of nearly one hundred colleagues across the legal, agriculture, forestry,
fisheries, social and economic Departments of FAO is acknowledged.
© FAO 2012

4
Preface
The SAFA guidelines are produced in the same spirit of codes of practice, guidelines and
other recommended measures to assist in achieving fair practices in food and agriculture
production and trade. This publication is intended to guide and promote the elaboration and
establishment of definitions and requirements for sustainable food and agriculture systems
and to assist in their harmonisation.
The SAFA guidelines are the result of an iterative process, built on the cross-comparisons of
codes of practice, corporate reporting, standards, indicators and other technical protocols
currently used by food and other companies and organizations that implement sustainability
tools. The structure and methodology of the SAFA Guidelines draw specifically upon: ISO
14040:2006 (International Organization for Standardization, 2009), the ISEAL Code of Good
Practice (version 1.0; International Social and Environmental Accreditation and Labelling Alli-
ance, 2010), the Reference Tools of the Global Social Compliance Programme (GSCP, 2010)
and the Sustainability Reporting Guidelines and Food Sector Supplement of the Global Re-
porting Initiative (version 3.1; GRI, 2011a; 2011b).
The SAFA Guidelines consist of three parts. Part A contains the rationale, purpose, vision,
goals and principles of SAFA. Part B outlines the procedure of SAFA implementation. Part C
contains the list of SAFA categories and indicators.
This Guidelines version will be pilot tested in a number of settings, including small and large
food and non-food chains, at the agriculture, processing and retail levels, in both developed
and developing countries. Based on the pilot tests’ outcomes, the SAFA Guidelines will be
revised and finalised in 2013 in order to improve their practicality, applicability, usefulness
and soundness.
Further information on SAFA may be obtained from:
Nadia El-Hage Scialabba
Natural Resources Management and Environment Department
Food and Agriculture Organization of the United Nations
Viale Terme di Caracalla
00153 Rome, Italy
Tel: +39 06 5705 6729
Fax: +39 06 5705 3064
E-mail: [email protected]
Website: www.fao.org/nr/sustainability/sustainability-assessments

5
Foreword
These guidelines have been prepared for the purpose of providing an agreed approach to
the requirements which underpin sustainable production, manufacturing and retailing of
food and agriculture products.
The aims of these guidelines are:
to offer a fair playing field to primary producers, manufacturers and retailers in the
food and agriculture sector, including crops, livestock, forestry and fisheries produc-
tion of food, fibre, energy and other biomass-related products;
to provide a benchmark that defines the essential components of sustainable food
and agriculture systems, including the natural, social, economic and institutional
components;
to provide a template for agriculture and food sustainability assessment, for those
who wish to substantiate sustainability claims.
These guidelines are the result of three years of participatory development, together with
practitioners from civil society and private sector. At this stage, the guidelines are a first step
into international harmonisation of the requirements for sustainability in terms of produc-
tion and marketing of sustainable agriculture, forestry and fisheries commodities. Experi-
ence with the development of such requirements and their implementation is still limited.
Moreover, perception on what sustainability entails differs widely among stakeholders.
Therefore, the following is recognised at this stage:
the guidelines are a useful instrument in assisting producers, manufacturers and re-
tailers to undertake sustainable management and reporting;
the guidelines need regular improvement and updating in order to take into account
technical progress and the experience with their implementation;
the guidelines do not prejudice the implementation of more customised arrange-
ments and more detailed requirements by stakeholders in order to respond to spe-
cific consumer demands.
The guiding vision of SAFA is that food and agriculture systems worldwide are characterised
by environmental integrity, economic resilience, social well-being and good governance. The
SAFA Guidelines support a sustainability management that facilitates continuous progress
towards this vision. A SAFA is a voluntary rating of sustainability performance at the level of
a company or production site, according to an authoritative and verifiable reference. The
SAFA Guidelines specify principles, procedure, thematic scope and rating criteria.

6
Twenty years have passed since the principle of sustainable development received nearly
universal agreement at the 1992 Earth Summit. Recent years have seen some progress in the
realisation of a socially, economically and environmentally sustainable development. Many
stakeholders in the food and agriculture sector have contributed to this progress, by improv-
ing agricultural productivity, protecting human and natural resources and conceiving and
implementing frameworks, standards and indicators for assessing and improving sustainabil-
ity across the sector and along the value chain. Yet, enormous challenges remain. The world
is confronted with a multitude of crises, from food and fuel crises to climate and financial
crises. Tackling these challenges could be greatly facilitated by a common language for sus-
tainability and accountability that integrates all dimensions of sustainability.
The SAFA Guidelines support the development of such a common language by providing a
globally adaptable template for assessments of the sustainability of primary production,
manufacturing, processing and retail. They provide guidance on how to conceptualise and do
a sustainability assessment, and include a generic set of sustainability themes and sub-
themes, goals and indicators to rate sustainability performance. SAFA implementation in-
volves an adaptation to geographic, sector-specific and individual conditions of the assessed
entity, and the comprehensive use of existing documentation, standards and tools. To assist
the sustainability assessment, example indicators and a generic rating scheme are provided
in the Guidelines.
Sustainability assessments based on the SAFA Guidelines serve internal management and
business-to-business communication. Assessments based on the Guidelines can take the
form of a self-evaluation. The Guidelines do not replace existing systems, but set a frame to
which such systems can be related. Companies, organisations and other stakeholders who
want to improve the sustainability performance of their value chains are encouraged to take
up the SAFA Guidelines as a framework for sustainability assessment and monitoring, and to
transparently report on results and experiences. This will enable others to benchmark their
activities and eventually allow a dynamic improvement of value chains towards sustainabil-
ity. The Guidelines build on and acknowledge existing standards, attempt to add value rather
than duplicate, and are meant to be the basis of an open learning system.
7
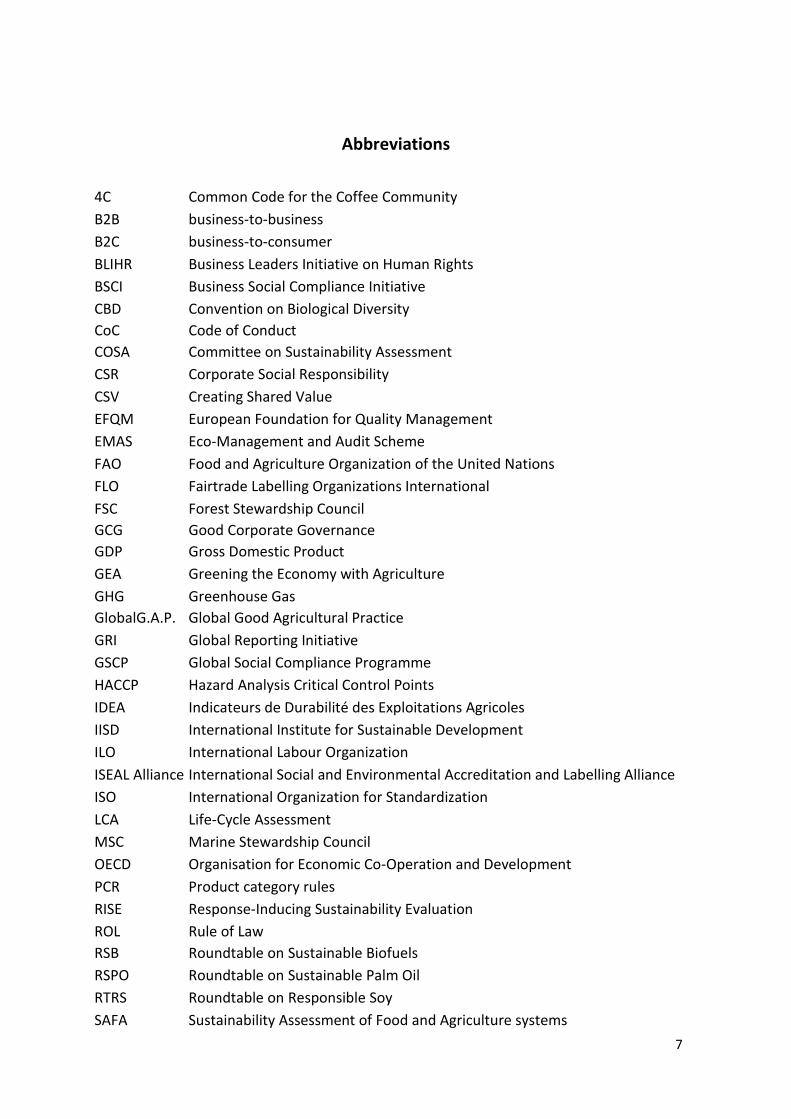
Abbreviations
4C Common Code for the Coffee Community
B2B business-to-business
B2C business-to-consumer
BLIHR Business Leaders Initiative on Human Rights
BSCI Business Social Compliance Initiative
CBD Convention on Biological Diversity
CoC Code of Conduct
COSA Committee on Sustainability Assessment
CSR Corporate Social Responsibility
CSV Creating Shared Value
EFQM European Foundation for Quality Management
EMAS Eco-Management and Audit Scheme
FAO Food and Agriculture Organization of the United Nations
FLO Fairtrade Labelling Organizations International
FSC Forest Stewardship Council
GCG Good Corporate Governance
GDP Gross Domestic Product
GEA Greening the Economy with Agriculture
GHG Greenhouse Gas
GlobalG.A.P. Global Good Agricultural Practice
GRI Global Reporting Initiative
GSCP Global Social Compliance Programme
HACCP Hazard Analysis Critical Control Points
IDEA Indicateurs de Durabilité des Exploitations Agricoles
IISD International Institute for Sustainable Development
ILO International Labour Organization
ISEAL Alliance International Social and Environmental Accreditation and Labelling Alliance
ISO International Organization for Standardization
LCA Life-Cycle Assessment
MSC Marine Stewardship Council
OECD Organisation for Economic Co-Operation and Development
PCR Product category rules
RISE Response-Inducing Sustainability Evaluation
ROL Rule of Law
RSB Roundtable on Sustainable Biofuels
RSPO Roundtable on Sustainable Palm Oil
RTRS Roundtable on Responsible Soy
SAFA Sustainability Assessment of Food and Agriculture systems

8
SAI Platform Sustainable Agriculture Initiative Platform
SAN Sustainable Agriculture Network
SME Small and Medium Enterprises
UNCED United Nations Conference on Environment and Development
UNCSD United Nations Conference on Sustainable Development
UNEP United Nations Environment Programme
UNESCO United Nations Educational, Scientific and Cultural Organization
UNGC United Nations Global Compact
WBCSD World Business Council for Sustainable Development
WCED World Commission on Environment and Development
WEF World Economic Forum
WHO World Health Organization

9
Glossary of terms and definitions
Agricultural biodiversity: agricultural biodiversity encompasses the variety and variability of animals,
plants and microorganisms which are necessary to sustain the functions of the agro-ecosystem, its
structure and processes for, and in support of, food production and food security.
Areas of high biodiversity value: habitats recognised for important biodiversity features by govern-
mental or non-governmental organisations, or through a biodiversity assessment. This in-
cludes, but is not restricted to, areas protected by law.
Audit: a systematic and functionally independent examination to determine whether activities and
related results comply with planned objectives (CAC, 1995).
Auditor: individual or group of individuals, belonging to an organisation, or a natural or legal person
external to that organisation, acting on behalf of that organisation, carrying out an assessment
of the sustainability management system in place and determining conformity with the organi-
sation's sustainability policy and programme, including compliance with the applicable re-
quirements relating to sustainability (modified after EC, 2009).
Benchmark: in SAFA, benchmarks are values, with which the performance of an enterprise in an indi-
cator domain is compared to facilitate a rating of sustainability performance. Regional and/or
sectoral averages, as well as defined average (standard) and best practice values can be used
as benchmarks.
Best practice: similar to “leading practices”, as defined by GSCP (2010); proactive identification, de-
velopment and adoption of the latest technology, techniques or practices that contribute to a
better sustainability performance.
Biodiversity: the diversity within species, between species and of ecosystems, including terrestrial,
marine and other aquatic ecosystems, and the ecological complexes of which they are part1.
Critical review: process intended to ensure consistency between a SAFA study and the principles and
requirements of the SAFA Guidelines (modified after ISO, 2009).
CSR reporting: most common type of sustainability reporting. Regular communication of information
on economic, social, environmental and governance performance to shareholders, stake-
holders and the general public. Other types of sustainability reporting include CSV reporting
and triple bottom line reporting.
Cut-off criteria: specification of the amount of material or energy flow, or the level of environmental
significance, associated with unit processes or product system to be excluded from a study
(ISO, 2009).
Due diligence: identification, prevention and mitigation of the actual and potential adverse impacts
of an enterprise’s activities; integral part of business decision-making and risk management
systems (OECD, 2011).
1 Convention on Biological Diversity: www.cbd.int

10
Food and agriculture systems: in the context of the SAFA Guidelines, systems that serve the produc-
tion and marketing of goods that originate from agriculture, forestry or fisheries.
Food security: food security exists when all people, at all times, have physical, social and economic
access to sufficient, safe and nutritious food to meet their dietary needs and food preferences
for an active and healthy life. The pillars of food security are availability, access, utilisation and
stability (FAO, 1996).
Full-cost accounting: in SAFA, the collection and presentation of information about the direct and
indirect economic, environmental and social costs of operations (Triple Bottom Line, “true cost
accounting”).
Gender: social, economic and cultural roles and relations between women and men. Gender takes
into account the different responsibilities of women and men in a culture or location, and in
different population groups (FAO, 1997).
Generic: “characteristic of, or relating to, a class or group of things; not specific“(Oxford Dictionary).
Here, the term refers to the meaning in mathematics, where properties are shared by almost
all objects of a certain type. The SAFA Guidelines provide principles, processes and themes that
should apply to (almost) all sustainability assessments in the food and agriculture sector.
Good corporate governance: the political system of an enterprise. It defines the rights of stake-
holders, provides the separation of powers between management and supervisory board, and
seeks to insure responsible leadership in all dimensions of the organisation (Maak & Ulrich,
2007).
Governance: the process of decision-making and the process by which decisions are implemented
(UNESCAP, 2009).
Greening the Economy with Agriculture (GEA): refers to ensuring the right to adequate food, as well
as food and nutrition security (see above) and contributing to the quality of rural livelihoods,
while efficiently managing natural resources and improving resilience and equity throughout
the food supply chain, taking into account countries’ individual circumstances (FAO Council,
2011).
Impact: primary and secondary long-term effects directly or indirectly produced by an intervention
(OECD, 2002).
Indicator: quantitative or qualitative factor or variable that provides a simple and reliable means to
measure achievement, to reflect the changes connected to an intervention, or to help assess
performance (adapted after OECD, 2002).
Livelihood: capabilities, assets (both material and social resources) and activities required for a
means of living. A livelihood is sustainable when it can cope with and recover from stresses and
shocks, and maintain or enhance its capabilities or assets while not undermining the natural re-
source base (Chambers & Conway, 1991).
Living wage: a wage ensuring for a person and his/her family an existence worthy of human dignity,
and supplemented by other means of social protection (UN 1948, Article 23.3). It ensures a stan-
dard of living adequate for the health and well-being, including food, clothing, housing, medical
care, necessary social services and the right to security (UN, 1948, Article 25.1).

11
Marketing: is holding for sale or displaying for sale, offering for sale, selling, delivering or placing on
the market in any other form (CAC, 1999).
Performance: degree to which an intervention or an entity operates according to specific criteria,
standards and guidelines, or achieves results in accordance with stated goals or plans (OECD,
2002).
Product: any goods or service (ISO, 2009). For the purpose of SAFA, goods based on materials pro-
duced through agricultural, forestry or fisheries activities during the production and processing
of food, agricultural commodities or animal feeds.
Preparation: the operations of slaughtering, processing, preserving and packaging of food and agri-
cultural products and also alterations made to the labelling concerning the presentation of the
production method (CAC, 1999).
Production: the operations undertaken to supply food and agricultural products in the state in which
they occur on the farm, including initial packaging and labelling of the product (CAC, 1999).
Rare species: species listed as vulnerable, endangered or critically endangered on the IUCN2 Red List,
or found to be vulnerable or endangered by scientific sources or a field study.
Regional/local: regions can be defined based on homogeneity and functionality, both in relation with
the activities whose sustainability is assessed. There is no single definition of the perimeter (in
km) that can be used for distinguishing regional from supra-regional.
Renewable energy: energy derived from natural processes, such as sunlight and wind, replenished at
a higher rate than they are consumed; for example solar, wind, geothermal, hydro, and biomass3.
Resilience: the ability to resist disturbance and return to an equilibrium after perturbations (equilib-
rium resilience); ability to absorb or accommodate shocks before the system changes (Holling &
Meffe, 1996).
Site: distinct geographic location under the management control of an organisation covering activi-
ties, products and services, including all infrastructure, equipment and materials (EC, 2009).
Soil degradation: reduction in the capacity of a soil to provide ecosystem goods and services, and to
support agricultural and forestry production. Soil degradation can be caused by a variety of
processes4.
Sustainability management: environmental and social management and corporate governance, in
conjunction with financial management. Processes or structures that an organisation uses to
meet its sustainability goals and objectives while transforming inputs into a product or service
(modified after UNEPFI, 2006).
Sustainable: the capacity to sustain, or maintain. There are numerous definitions of sustainability but
all converge on the need to reconcile environmental, social and economic demands for pre-
sent and future generations.
2 International Union for Conservation of Nature and Natural Resources: www.iucnredlist.org
3 International Energy Agency Glossary of terms: www.iea.org/glossary/glossary_R.asp
4 FAO glossary of Land and Water Terms: www.fao.org/landandwater/glossary

12
Sustainable agriculture and rural development (SARD): management and conservation of the natu-
ral resource base, and the orientation of technological and institutional change in such a man-
ner as to ensure the attainment and continued satisfaction of human needs for present and fu-
ture generations. Such sustainable development (in the agriculture, forestry, and fisheries sec-
tors) conserves land, water, plant and animal genetic resources, is environmentally non-
degrading, technically appropriate, economically viable and socially acceptable (FAO, 1989).
Sustainable development: development processes that protect the natural resource base and eco-
system functions, enhance economic resilience and promote human rights and well-being in a
manner that preserves future generations’ ability to secure their needs.
Value chain: a mechanism that allows producers, processors, buyers, and sellers – separated by time
and space – to gradually add value to products and services, as they pass from one link in the
chain to the next until reaching the final consumer. The main actors in a value chain are sup-
pliers, producers, processors, marketers and buyers. They are supported by a range of private
and public technical, business and financial service providers. In a value chain, the various
business activities in the different segments become connected and to some degree coordi-
nated (UNIDO, 2011).
Well-being: the state of being or doing well in life; healthy, or prosperous condition; moral or physi-
cal welfare (of a person or community).

13
CONTENTS
Acknowledgements .......................................................................................................................................... 3
Preface ............................................................................................................................................................. 4
Foreword ......................................................................................................................................................... 5
Abbreviations ................................................................................................................................................... 7
Glossary of terms and definitions ..................................................................................................................... 9
PART A: PRINCIPLES ..................................................................................................................... 15
1. Background and introduction ..................................................................................................................... 16
2. Sustainability Assessment of Food and Agriculture Systems (SAFA) ........................................................... 17
2.1 Vision ........................................................................................................................................................... 17
2.2 Purpose and principles ................................................................................................................................ 18
2.3 Subject and scope ........................................................................................................................................ 19
2.4 Assessment procedure ................................................................................................................................ 21
2.5 Roles and responsibilities ............................................................................................................................ 21
PART B: PROCEDURE .................................................................................................................... 23
3. Doing a SAFA – step by step ....................................................................................................................... 24
3.1 Step 1: Setting goals and scope ................................................................................................................... 24
3.2 Step 2: Adapting the SAFA Guidelines ......................................................................................................... 25
3.3 Step 3: Selecting tools and indicators .......................................................................................................... 28
3.4 Step 4: Collecting data ................................................................................................................................. 31
3.5 Step 5: Analysing and interpreting SAFA results .......................................................................................... 32
3.6 Step 6: Reporting ......................................................................................................................................... 33
PART C: SUSTAINABILITY THEME PROTOCOLS .................................................................. 35
4. Sustainability dimensions and themes ....................................................................................................... 36
5. Sustainability theme protocols ................................................................................................................... 40
5.1 Governance structure (G1) .......................................................................................................................... 41
5.2 Accountability (G2) ...................................................................................................................................... 43
5.3 Participation (G3) ......................................................................................................................................... 45
5.4 Rule of law (G4) ........................................................................................................................................... 48
5.5 Holistic management (G5) ........................................................................................................................... 51
5.6 Atmosphere (E1) .......................................................................................................................................... 53
5.7 Freshwater (E2) ............................................................................................................................................ 56
5.8 Land (E3) ...................................................................................................................................................... 59

14
5.9 Biodiversity (E4) ........................................................................................................................................... 62
5.10 Materials and energy (E5) .......................................................................................................................... 66
5.11 Animal welfare (E6) ................................................................................................................................... 69
5.12 Investment (C1) ......................................................................................................................................... 71
5.13 Vulnerability (C2) ....................................................................................................................................... 73
5.14 Product safety and quality (C3) ................................................................................................................. 77
5.15 Local economy (C4) .................................................................................................................................... 80
5.16 Decent livelihood (S1) ................................................................................................................................ 82
5.17 Labour rights (S2) ...................................................................................................................................... 84
5.18 Equity (S3) .................................................................................................................................................. 87
5.19 Human health and safety (S4) ................................................................................................................... 90
5.20 Cultural diversity (S5) ................................................................................................................................. 93
References ..................................................................................................................................................... 95
Appendix A................................................................................................................................................... 106
Appendix B ................................................................................................................................................... 107
Appendix C ................................................................................................................................................... 109

15
Part A: Principles

16
1. Background and introduction
Sustainable development – progress and challenges
The ecological, economic and social principles of sustainable development (WCED, 1987) received
nearly universal agreement during and following the 1992 Earth Summit. One of the summit‘s major
outcomes, Agenda 21, includes a whole chapter (Chapter 14) on sustainable agriculture and rural
development. Much progress has been made in the past two decades. For most social and economic
Millennium Development Goals, improvements have been substantial (UN, 2011). Global per capita
Gross National Income has more than doubled between 1992 and 2010 (from 5,035 current interna-
tional USD at PPP to 11,058; World Bank, 2011). Yet, reaching the poorest, all over the world, re-
mains a challenge (UN, 2011) and it is today generally recognised that GDP growth alone is not a suf-
ficient indicator of development progress. The number of undernourished people was estimated by
FAO to be 925 million in 2010. This figure has increased by 75 million people since 1990-92 (FAO,
2010a). Rockström et al. (2009) estimate that humanity has transgressed three of the environmental
planetary boundaries within which we can operate safely, namely for climate change, biodiversity
loss and changes to the global nitrogen cycle. Boundaries for ocean acidification and possibly the
global phosphorus cycle might also be close to being crossed.
As agricultural land and forests occupy more than 60% of terrestrial surface, and fishery activities can
be found on virtually any water body, agriculture, forestry and fisheries are major contributors to the
ecological footprint of humanity. For example, 31% of global greenhouse gas emissions have been
attributed to agriculture and forestry (IPCC, 2007). Agriculture alone accounts for 70% of global
freshwater withdrawals (FAO, 2011). On the other hand, farming, animal husbandry, forestry and
fisheries produce the food and renewable materials basis of humanity’s existence and provide liveli-
hoods to more than 2.6 billion people (FAOSTAT, 2011), including many of the world’s poor.
One approach to tackle the risk of the human economy’s overstraining the capacities of Earth’s eco-
systems is the concept of a “Green Economy”5 that respects planetary boundaries and adopts eco-
efficiency as a guiding principle. This concept brings about major challenges in relation with freedom
and distributional equity (UNDP, 2011). The translation of the green economy concept for the food
and agriculture sector is reflected through the GEA concept that recognises the need to take an eco-
system- and rights-based approach to development, according to specific country circumstances
(FAO, 2012a). The challenge of delivering sustainability lies in an effective integration of the envi-
ronmental, economic and social dimensions of development. This can be only achieved through good
governance.
Need for a common language
Recent years have seen the development of frameworks, initiatives, standards and indicators for as-
sessing and improving the environmental and social impacts of human activities. More than one
hundred countries have established national strategies for sustainable development, as well as sets
of sustainability targets and indicators (UN, 2007). Thousands of companies have adopted concepts
such as corporate social responsibility, creating shared value, responsible supply chain management
5 An economy „that results in improved human well-being and social equity, while significantly reducing environmental
risks and ecological scarcities“ (UNEP, 2011).

17
and the triple bottom line6. These concepts are put into practice through internal management, B2B
and B2C communication. Systems for independent, third-party verification, certification and accredi-
tation have been put in place.
Of the many verification systems, tools, databases and other approaches for measuring, communi-
cating and improving sustainability, environmental impact or social impact, respectively, few cover
the whole value chain and all dimensions of sustainability at the same time (Appendix A). In the de-
velopment and application of sustainability systems and frameworks, SME and stakeholders from
developing and emerging countries are less represented than large companies and stakeholders from
industrialised countries, in spite of many systems’ building on transparent, participative mechanisms.
Despite the valuable efforts for making sustainability assessments in the food and agriculture sector
accurate and easy to manage, no internationally accepted benchmark unambiguously defines what
sustainable food production entails. There also is no widely accepted definition of the minimum re-
quirements that would allow a company to qualify as sustainable.
FAO and the SAFA Guidelines
In order to offer a fair playing field, FAO has built on existing efforts and developed the present
Guidelines for Sustainability Assessment of Food and Agriculture systems (SAFA) as part of its efforts
for the 2012 United Nations Conference on Sustainable Development (UNCSD). In line with the FAO
mandate, the vision of the SAFA Guidelines is to contribute to a sustainable development of the food
and agriculture sector. This shall be achieved by enhancing the measurability of sustainability per-
formance and the accessibility and transparency of sustainability measurements. The SAFA Guide-
lines provide a benchmark that defines what sustainable production is, and a template for agriculture
and food sustainability assessment, for the use by primary producers, food manufacturers and retail-
ers who wish to substantiate sustainability claims. Existing sustainability indicator systems and as-
sessment tools can be related to the content of the SAFA Guidelines.
2. Sustainability Assessment of Food and Agriculture Systems (SAFA)
2.1 Vision
The guiding vision of SAFA is a sustainable development of the food and agriculture sector, from pri-
mary production in agriculture, forestry and fisheries, through manufacturing and to the point of sale
to the consumer. This development ensures human rights and well-being without depleting or dimin-
ishing the capacity of Earth's ecosystems to support life. It allows for well-being that is not achieved
at the expense of the well-being of others or of future generations.
In agricultural production and rural development, sustainable development is characterised by an
appropriate balance between food self-sufficiency and food self-reliance, employment and income
generation in rural areas, and natural resource conservation and environment protection7. This vision
can be realised through different pathways, depending on local circumstances.
6 The triple bottom line is a business approach to full-cost accounting that refers to three pillars: people (social),
planet (environmental) and profit (economic). 7 FAO Council, 1989.
18
2.2 Purpose and principles
Purpose
A SAFA is an evaluation of the sustainability performance of a company or production site that forms
part of a supply chain rooted in primary production. The purpose of a SAFA is to contribute to the
realisation of the above-mentioned vision by supporting the implementation of effective sustainabil-
ity management and communication in the agriculture and food sector, worldwide. Stakeholders in
food production, distribution and retail can do a SAFA to substantiate sustainability claims and to
enhance sustainability management in their value chain.
The SAFA Guidelines specify principles (part A), procedure (part B), themes and assessment criteria of
a SAFA (part C). The target audience are producers, distributors and retailers who wish to substanti-
ate sustainability claims. The Guidelines do not replace existing systems but complement them and
put them into the perspective of a common sustainability language for the food and agriculture sec-
tor. Being science-based and generic in nature, they can be adapted to different contexts.
SAFA Principles
The SAFA Guidelines are based on the following methodological principles:
Relevance. A SAFA shall cover all relevant aspects of sustainability, such that the obtained
rating closely correlates with sustainability performance. All SAFA goals must be in line with
the sustainability paradigm as defined in Agenda 21 and specified in the above SAFA vision.
All SAFA goals should be in line with the current state of scientific knowledge on the eco-
nomic, environmental, social and governance impacts of human activities.
Cost efficiency. In order to leave a maximum of resources for improvement measures, the
cost of doing a SAFA is minimised by making the best use of existing data. Companies that
participate in systems with sustainability claims can use the SAFA Guidelines to identify areas
not yet covered by their sustainability management.
Goal orientation. By defining a vision and sustainability goals, the Guidelines establish a goal-
oriented, generic framework (von Wirén-Lehr, 2001). There are various ways by which the
SAFA sustainability goals can be reached.
Performance orientation. A SAFA serves to determine the degree to which the sustainability
performance of an enterprise is in accordance with SAFA sustainability goals. Commitments
and management plans alone do not suffice to qualify as sustainable. The same applies to
participation (e.g. in certification systems), as the evidence does not yet allow to universally
infer enhanced sustainability (Beuchelt & Zeller, 2011; Blackman & Rivera, 2011). For some
sustainability categories, a rating of measures can be acceptable in some instances.
Transparency. The disclosure of system boundaries, indicators, data sources and stakeholder
relations is a mandatory part of every SAFA report.
Adaptability. The Guidelines are generic in nature in order to be applied worldwide and
across the whole diversity of situations that exist in the agriculture and food sector, by
adapting the generic set of themes and subthemes’ indicators to different socio-economic
and environmental circumstances, type of entity and data availability.
Implementation, development and maintenance of SAFA:

19
Build on existing standards. The principles of the Bellagio STAMP8 (IISD, 2009; Pinter et al.,
2011) should be followed when doing a SAFA. The SAFA methodology draws upon the ISO
norms for Life Cycle Assessment (ISO, 2009), the ISEAL Code of Good Practice (version 1.0;
ISEAL Alliance, 2010), the Reference Tools of the GSCP (2010) and the GRI Sustainability Re-
porting Guidelines (version 3.1; GRI, 2011). No SAFA goal must contradict rules and principles
that emanate from national law and relevant international agreements. The conduction of a
SAFA must comply with all applicable legal provisions, in particular concerning privacy pro-
tection.
Add value instead of duplication. The SAFA Guidelines shall add to the value of existing sus-
tainability, environmental and social management and auditing systems by rendering it eas-
ier to integrate the information produced by these systems and to close thematic gaps. Im-
plementing the Guidelines should not impose an increased audit load on stakeholders.
Take place in an open and learning system. The SAFA Guidelines are developed and hosted
by FAO and are freely available to any interested party. They are the result of a continuing,
open development process, contributions to which are welcome from all who have a stake in
the sustainable development of food and agriculture systems. SAFA participation must al-
ways be voluntary. Implementing SAFA is in itself a learning pathway to create change and
ultimately, deliver sustainability.
2.3 Subject and scope
Subject
With a SAFA, the performance of a company, branch of a company or production site is rated con-
cerning economic, environmental, social and governance sustainability. A SAFA can address all enti-
ties in value chains based on primary production, from the site of primary production (agriculture,
fisheries, forestry) to that of final sales to the consumer (Fig. 1). A SAFA can be limited to a single
production site or step of the value chain. Sustainability ratings can be aggregated for multiple sites
and along a value chain. A SAFA neither is a rating of product sustainability, nor does it cover the use
and end-of-life phases of products (ISO, 2009).
Physical scope
A SAFA should cover the complete sphere of impact and influence of the assessed entity. This
includes processes (i) that are an inseparable part of production or of the chain, (ii) that generate
significant sustainability impact and (iii) over which the assessed entity exerts control or significant
influence regarding financial and operating policies and practices (GRI, 2011a). The substantiality of
impact and the scope of action of the company can serve as cut-off criteria. For example, the physical
and spatial scope of SAFA includes the production of procured raw materials and inputs, if (a) the
production and provision of these materials and inputs cause substantial sustainability impact (e.g.
by aggravating regional water scarcity) and (b) the extent of the sustainability impact can be
significantly influenced by the buyer.
8 www.iisd.org/pdf/2009/brochure_bellagiostamp.pdf

20
Dairy farmer
Dairy (incl.
transport)
Food
processor
Carrier
Retailer
Agrochemical
provider
Consumer
Waste
disposal
company
Butchery
By-product
processor
Cattle
breeder
Wholesaler
Waste
disposal
company
Agricultural
machinery
dealer
Waste
disposal
company
Waste
disposal
company
By-product
processor
Carrier
Waste
disposal
company
Waste
disposal
company
Figure 1. Two examples of SAFA scope in dairy value chains. Grey rectangles with bold writing symbolise actors
whose operations are covered by a SAFA done by a dairy (left) and a retail company (right), respectively.
Dashed rectangles represent actors outside the general scope of SAFA.
Time and space
The temporal scope of SAFA covers one year. For some indicators, multi-year trends should be as-
sessed or sustainability impacts be allocated to a longer period. The spatial coverage of SAFA extends
to production facilities and their surroundings, insofar as the assessed entities control or substan-
tially affect the utilisation of these areas (GRI, 2011a).
Thematic scope: sustainability dimensions and themes
The SAFA sustainability rating pertains to the four dimensions of sustainability. Within these dimen-
sion, 20 sustainability themes were identified, each of which contains sub-themes (Table 1; wording
based on UN, 2007). Details on dimensions, themes, sub-themes and indicators are provided in part
C of the SAFA Guidelines.

21
Table 1. SAFA sustainability dimensions, core sustainability themes (left) and sub-themes (right).
GOOD GOVERNANCE
G1 Governance structure Corporate ethics; Due diligence
G2 Accountability Holistic audits; Responsibility
G3 Participation Stakeholder dialogue; Grievance procedures; Conflict resolution
G4 Rule of law Commitment to fairness and legitimacy; Remedy, restoration and prevention; Co-responsibility; Resource appropriation
G5 Holistic management Sustainability in quality management; Certified production and sourcing; Full-cost accounting
ENVIRONMENTAL INTEGRITY
E1 Atmosphere Greenhouse gases; Air pollution
E2 Freshwater Water quantity; Water quality
E3 Land Organic matter; Physical structure; Chemical quality; Land degradation and de-sertification
E4 Biodiversity Habitat diversity and connectivity; Ecosystem integrity; Wild biodiversity; Agri-cultural biodiversity; Threatened species
E5 Materials and energy Non-renewable resources; Energy supply; Eco-efficiency; Waste disposal
E6 Animal welfare Freedom from stress; Species-appropriate conditions
ECONOMIC RESILIENCE
C1 Investment Internal investment; Community investment; Long-ranging investment
C2 Vulnerability Stability of supply; Stability of marketing; Liquidity and insurance; Employment; Stability of production
C3 Product safety and quality Product information; Traceability; Food safety; Food quality
C4 Local economy Value creation; Local procurement
SOCIAL WELL-BEING
S1 Decent livelihood Wage level; Capacity building
S2 Labour rights Employment; Forced labour; Child labour; Freedom of association and bargain-ing; Working hours
S3 Equity Non-discrimination; Gender equality; Support to vulnerable people
S4 Human health and safety Physical and psycho-social health; Health resources; Food security
S5 Cultural diversity Indigenous knowledge; Food sovereignty
2.4 Assessment procedure
For a detailed description of the SAFA assessment procedure, see part B of the Guidelines. To con-
duct a SAFA, the following phases must be run through:
1) Setting goal and scope of the assessment
2) Adapting the SAFA Guidelines: relevance and compliance check
3) Selecting tools and indicators
4) Collecting data
5) Analysing and interpreting SAFA results
6) Reporting
The final visible output of a SAFA is the SAFA report, comprising a descriptive and an analytical part.
22
2.5 Roles and responsibilities
Audience
The SAFA guidelines are intended for use by primary producers, food manufacturers and retailers,
primarily in internal management and for B2B communication. These stakeholders will either com-
mission independent audits by third parties or conduct self-declaratory assessments. In both cases,
the generic framework provided by the SAFA Guidelines must be concretised and adapted to re-
gional, sectoral and individual circumstances, in a transparent and responsible manner.
Auditors
Initially, SAFA can take the form of a self-assessment. The accordant audits can be conducted by staff
of the company itself or by qualified auditors. Once structures for verification and accreditation have
been established, SAFA can be done by independent third parties, if sustainability claims are to be
communicated to business partners, the public or administration. Where a SAFA forms part of a for-
mal certification procedure, compliance with the respective rules for certification and accreditation
must be ensured. The auditor’s responsibilities are subject to contractual arrangements between the
commissioning and the auditing company.
Provider
The SAFA Guidelines are provided by FAO. They are publicly available and no license fees may be
charged for their use as such. The correct application of the Guidelines is the responsibility of the
implementing company. FAO is neither liable nor responsible for consequences of using the SAFA
Guidelines.

23
Part B: Procedure
24
3. Doing a SAFA – step by step
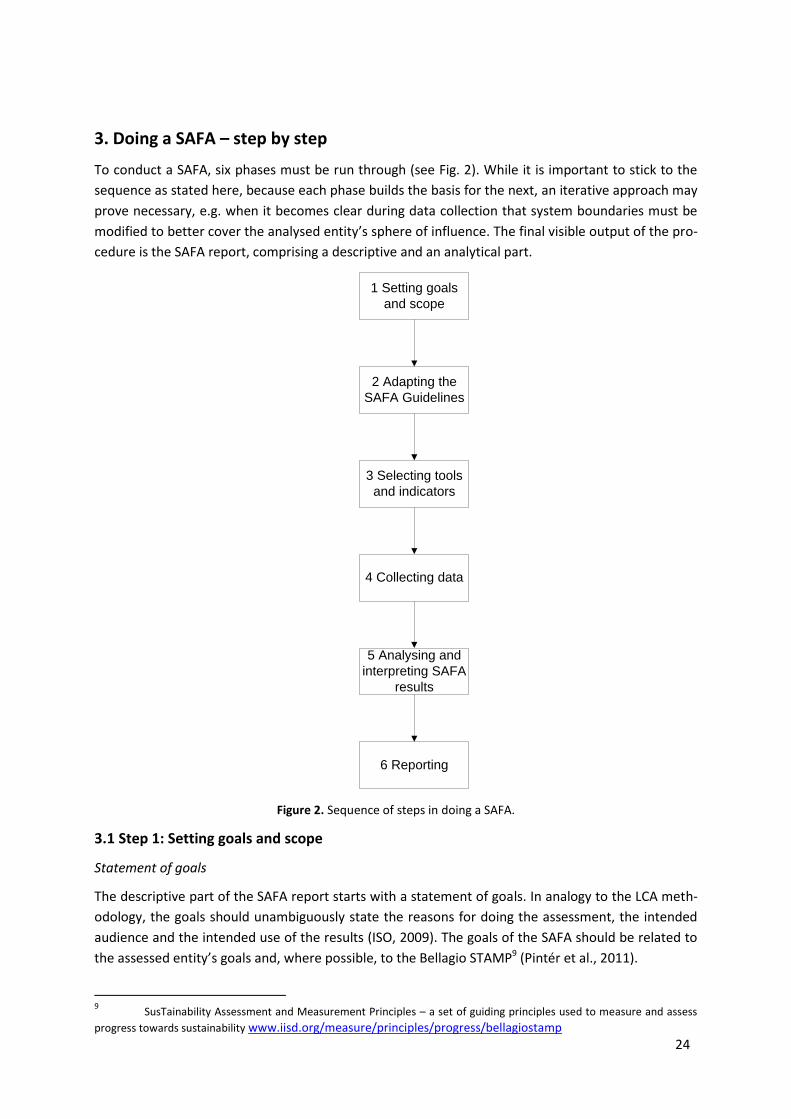
To conduct a SAFA, six phases must be run through (see Fig. 2). While it is important to stick to the
sequence as stated here, because each phase builds the basis for the next, an iterative approach may
prove necessary, e.g. when it becomes clear during data collection that system boundaries must be
modified to better cover the analysed entity’s sphere of influence. The final visible output of the pro-
cedure is the SAFA report, comprising a descriptive and an analytical part.
1 Setting goals
and scope
4 Collecting data
5 Analysing and
interpreting SAFA
results
6 Reporting
2 Adapting the
SAFA Guidelines
3 Selecting tools
and indicators
Figure 2. Sequence of steps in doing a SAFA.
3.1 Step 1: Setting goals and scope
Statement of goals
The descriptive part of the SAFA report starts with a statement of goals. In analogy to the LCA meth-
odology, the goals should unambiguously state the reasons for doing the assessment, the intended
audience and the intended use of the results (ISO, 2009). The goals of the SAFA should be related to
the assessed entity’s goals and, where possible, to the Bellagio STAMP9 (Pintér et al., 2011).
9 SusTainability Assessment and Measurement Principles – a set of guiding principles used to measure and assess
progress towards sustainability www.iisd.org/measure/principles/progress/bellagiostamp

25
Subject and scope of the assessment
A SAFA is an assessment of the sustainability performance of one or several entities forming part of a
value chain rooted in agriculture, forestry, fisheries or aquaculture. It can address all entities from
the site of primary production to that of final sales to the consumer. For details on the general scope
and principles of SAFA, see part A of the Guidelines. The thematic scope of SAFA is defined through
the set of sustainability themes and sub-themes (see part C of the Guidelines). Each SAFA implemen-
tation includes the adaptation of this thematic scope to the situation of the assessed entity. A SAFA
covers the entity’s material and spatial spheres of impact and influence10. The decision tree of the
GRI G3.1 Guidelines11 is recommended as a decision aid (GRI, 2011a). Decisions on the following
must be justified and documented in the SAFA report:
Subject of the analysis. Key properties of the entity: organisation, site(s), dimensions, prod-
ucts, sector, position in the value chain.
Material system boundaries. Which entities and processes are included in the assessment?
What is the entity’s sphere of influence? Which processes are excluded from the assessment,
for what reasons? A flow diagram of all assessed processes should be drawn, indicating
where processes were cut off.
Spatial system boundaries. How far do substantial environmental, economic and social im-
pacts occur beyond the land owned or directly used by the assessed entity? Which of these
impacts are included in the SAFA?
Temporal system boundaries. For what indicators does the assessment deviate from the one-
year time frame? By how many years is the temporal scope extended for an indicator12?
Rules for impact allocation. Where sustainability impacts are inseparable between assessed
and non-assessed processes, entities, locations and time periods, defined proportions of the-
se impacts have to be attributed to the processes, entities etc. Physical, spatial and temporal
system boundaries should be set such that allocation problems are minimised.
Critical review. Will a critical review be undertaken? If yes, what type of review (e.g. internal
or external)? What will be covered to what level of detail?
Output of Step 1
A precise statement of goals and purpose of the SAFA.
A description of the assessed entity and of its sphere of influence and impact.
A delineation of physical, spatial and temporal system boundaries, in relation with the sphere
of influence and impact.
A description and justification of cut-off and impact allocation criteria.
3.2 Step 2: Adapting the SAFA Guidelines
Use of existing information in a SAFA
10
This implies that larger companies have a much larger sphere of influence than, for instance, a single farmer. Thus SAFA
acknowledges the growing responsibility for sustainable production with growing company size. 11
www.globalreporting.org/resourcelibrary/G3.1-Guidelines-Incl-Technical-Protocol.pdf, pp. 17-19 12
Example: carbon sequestration in vegetation and soils may be calculated for the whole sequestration period, i.e. until a
new equilibrium has been reached. This can take several decades.
26
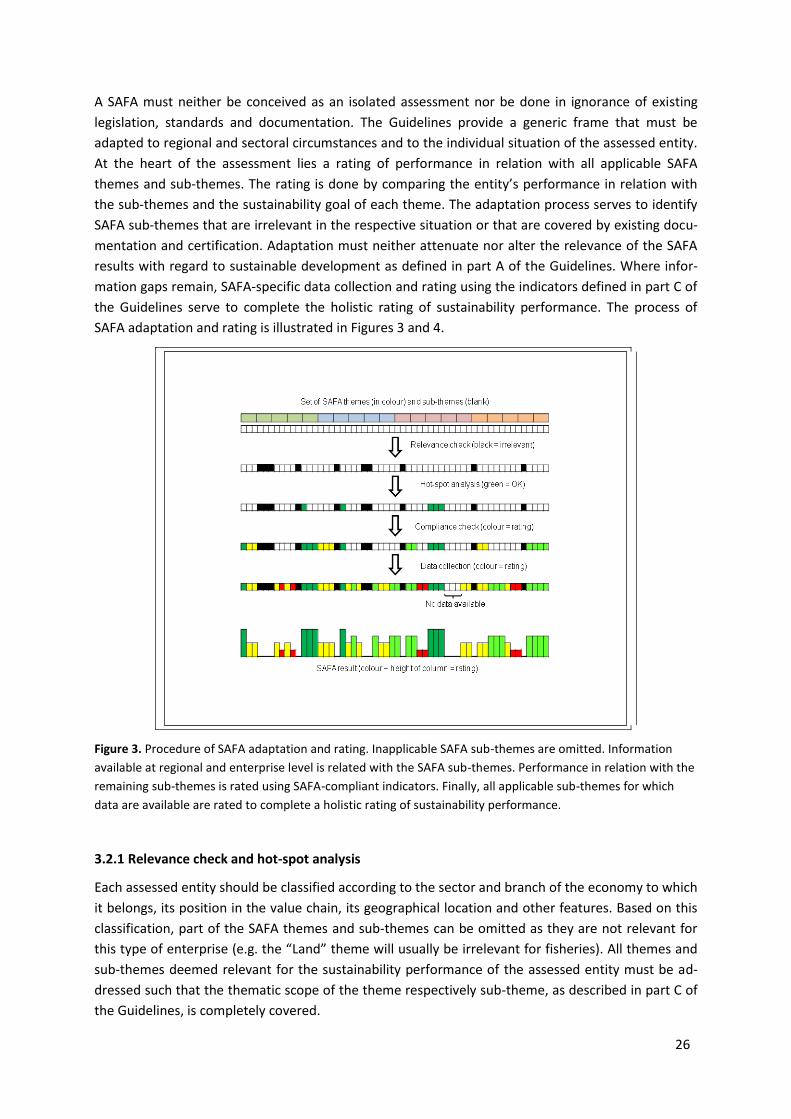
A SAFA must neither be conceived as an isolated assessment nor be done in ignorance of existing
legislation, standards and documentation. The Guidelines provide a generic frame that must be
adapted to regional and sectoral circumstances and to the individual situation of the assessed entity.
At the heart of the assessment lies a rating of performance in relation with all applicable SAFA
themes and sub-themes. The rating is done by comparing the entity’s performance in relation with
the sub-themes and the sustainability goal of each theme. The adaptation process serves to identify
SAFA sub-themes that are irrelevant in the respective situation or that are covered by existing docu-
mentation and certification. Adaptation must neither attenuate nor alter the relevance of the SAFA
results with regard to sustainable development as defined in part A of the Guidelines. Where infor-
mation gaps remain, SAFA-specific data collection and rating using the indicators defined in part C of
the Guidelines serve to complete the holistic rating of sustainability performance. The process of
SAFA adaptation and rating is illustrated in Figures 3 and 4.
Figure 3. Procedure of SAFA adaptation and rating. Inapplicable SAFA sub-themes are omitted. Information
available at regional and enterprise level is related with the SAFA sub-themes. Performance in relation with the
remaining sub-themes is rated using SAFA-compliant indicators. Finally, all applicable sub-themes for which
data are available are rated to complete a holistic rating of sustainability performance.
3.2.1 Relevance check and hot-spot analysis
Each assessed entity should be classified according to the sector and branch of the economy to which
it belongs, its position in the value chain, its geographical location and other features. Based on this
classification, part of the SAFA themes and sub-themes can be omitted as they are not relevant for
this type of enterprise (e.g. the “Land” theme will usually be irrelevant for fisheries). All themes and
sub-themes deemed relevant for the sustainability performance of the assessed entity must be ad-
dressed such that the thematic scope of the theme respectively sub-theme, as described in part C of
the Guidelines, is completely covered.
27
As a result of different climatic conditions, cultural norms, political and legal systems, the risk of oc-
currence of certain sustainability deficits is higher in some regions and countries than in others. It
should be checked whether a high sustainability performance in a SAFA theme or sub-theme can be
automatically concluded for the location where the entity is found.
Available publications, reports and maps should be consulted in this step. Sources must be presented
in the SAFA report. Examples of sustainability aspects that can be the subject of a regional relevance
check include physical water scarcity (e.g. Pfister et al., 2009), human rights situation and rule of law,
soil degradation risk and land use cover change (ecosystem degradation). Sustainability theme and
sub-theme omissions resulting from the hot-spot analysis must be declared and justified.
Omit goal
Information
on sector &
enterprise
Goal
applicable?
SAFA goal
Goal
covered?
NO
YES
Information
on region &
sector
Rate
performance
YES
Goal
covered?
Information on
enterprise &
standards
Rate
performance
NO
YES
SAFA rating
Tool
available?
Information
on tools
NO
Select tool & rate
performance
YES
Select SAFA
indicator & rate
performance
NO
Relevance check
Hot-spot analysis
Compliance check
Data collection
SAFA result
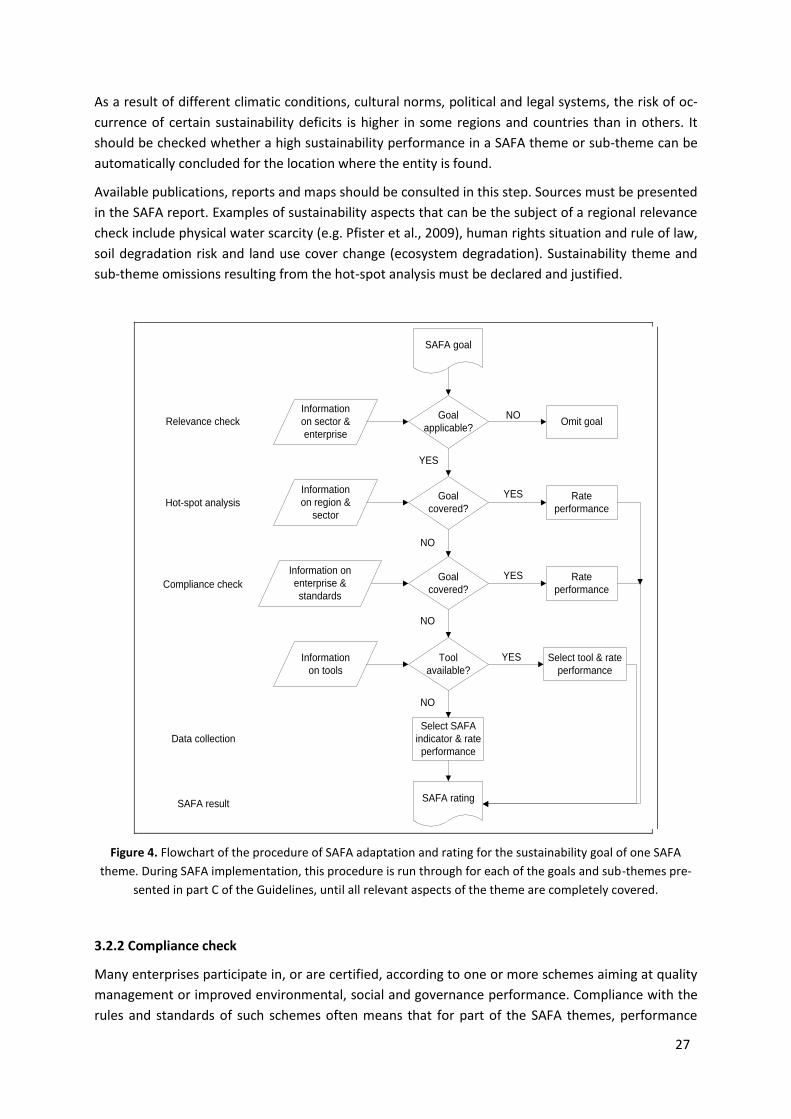
Figure 4. Flowchart of the procedure of SAFA adaptation and rating for the sustainability goal of one SAFA
theme. During SAFA implementation, this procedure is run through for each of the goals and sub-themes pre-
sented in part C of the Guidelines, until all relevant aspects of the theme are completely covered.
3.2.2 Compliance check
Many enterprises participate in, or are certified, according to one or more schemes aiming at quality
management or improved environmental, social and governance performance. Compliance with the
rules and standards of such schemes often means that for part of the SAFA themes, performance

28
data already exist or the respective sustainability goal has been reached to a certain degree. Exam-
ples of relevant systems include:
Quality or risk management, for example according to ISO 9001, EFQM and HACCP13.
Environmental management, for example according to ISO 14001 and EMAS.
Compliance with voluntary social and economic standards, such as FLO, BSCI and SA 8000.
Compliance with legal standards, such as the national implementation of the EU Cross Com-
pliance scheme or the Swiss Proof of Ecological Performance.
Participation in voluntary production standards, such as those of FSC, MSC, organic agricul-
ture, GlobalG.A.P., Rainforest Alliance (SAN), 4C, RSB, RSPO, RTRS, BSCI, and many others.
Corporate social responsibility, creating shared value or similar reporting, according to the
guidelines and goals set by e.g. GRI, GSCP and UN Global Compact.
A recent analysis with a science-based method, such as LCA, Water Footprinting, Carbon
Footprinting, RISE, COSA, IDEA or AgBalance.
For an overview of the thematic coverage of selected schemes, see Appendix A.
Output of Step 2
A list of SAFA sustainability themes and sub-themes that are applicable to the assessed situa-
tion and have not yet been covered in the existing documentation.
A declaration and justification of omissions of sustainability themes and sub-themes.
An overview of sustainability performance concerning those themes and sub-themes already
covered by the existing documentation.
3.3 Step 3: Selecting tools and indicators
3.3.1 Selecting appropriate tools
Sustainability performance must be assessed for every relevant SAFA theme and sub-theme. Perfor-
mance in relation to relevant, not yet covered (Step 2) themes and sub-themes is preferably assessed
using existing tools and standards. The above list used for the compliance check can provide guid-
ance in identifying appropriate standards and tools. The selection of tools must be based on (a) the
sustainability themes and sub-themes identified as relevant in SAFA step 2, (b) the availability of in-
formation on the entity’s performance, and (c) the budgetary frame of the assessment.
3.3.2 Selecting sustainability indicators and rating thresholds
Indicator selection
Performance in relation with a SAFA is rated using one or more performance indicators for each sub-
theme - either from existing standards, or from part C of the Guidelines -, such that the sub-theme
scope is completely covered. Indicator suggestions presented in part C of the SAFA Guidelines should
be checked for applicability in descending order. Choosing an indicator from a lower category is ap-
propriate where no information is available for any higher category. In such cases, the enterprise
should strive to improve data availability and upgrade their indicators to a higher level. Where no
suitable performance indicators can be used, measure-based tools or indicators can be selected. Per-
formance indicators provide information that directly reflects the degree to which the enterprise op-
erates according to the sustainability goals of the respective SAFA theme. With measure-based indi- 13
See list of abbreviations.

29
cators, measures taken to meet the sustainability goal are rated for their expected efficacy; hence,
this is a more indirect and thus, less rigorous type of indicator. For some SAFA themes, particularly in
the governance dimension, performance and measures can overlap, as the goals require, for in-
stance, the existence of a mission statement meeting specified criteria. An overview of SAFA indica-
tor types is given in Table 2. The classification of indicators in part C refers to the hierarchy estab-
lished in this Table. Decisions concerning the choice of indicators and the omission of themes and
sub-themes must be declared and justified in the SAFA report.
Table 2. Hierarchy of SAFA indicator types.
Type of indicator Indicator example
Type of information
on which rating is based
Quantitative or qualitative
data?
Rating based on absolute scale or on benchmark
comparison?
State or trend data?
1 Performance-based Quantitative Absolute State Total freshwater use (m3) in 2012
2 Performance-based Quantitative Benchmark14
State Total freshwater use (m
3) per kg of milk
solids, in % of regional average in 2012
3 Performance-based Qualitative Absolute State Does the enterprise meet criteria for water use efficiency stated e.g. by local government or a standard?
4 Performance-based Qualitative Benchmark State
Does the enterprise meet stricter criteria for water use efficiency (see above) than other enterprises in the same sector and region?
5 Measure-based15
Qualitative Absolute State Rating of irrigation and other water use technology, based on standard data on the efficiency of these technologies
6 Measure-based Qualitative Benchmark State Rating of irrigation and other water use technology, in comparison with the re-gional average
Threshold determination
Quantitative and qualitative threshold definitions facilitate the translation of collected and calculated
data into one sustainability rating per indicator. Where more than one indicator is assessed per sub-
theme, scores should be aggregated into a single rating per sub-theme. A four-level rating scale is
used in SAFA. It can be visualised using an extended “traffic light” color code. Generic definitions of
the thresholds separating performance levels are provided in Table 3. For examples of classification
thresholds, see Table 4.
14
Comparison with a reference value, e.g. regional average, sector average or a defined situation. Note that combi-nations of absolute and benchmark comparisons are a further appropriate option. 15
Qualitative rating of technologies or measures based (e.g. on resource efficiency).

30
Table 3. “Traffic light” scale for rating and visualising performance in relation to SAFA sub-themes.
Rating Performance
Best sustainability performance
Performance: All operations of the assessed entity fully comply with the sustainability
goal, as proven through performance data.
Compliance: All operations fully comply with applicable law and agreements.
Measures (only for some categories): All applicable measures have been taken, best
practice.
Good sustainability performance
Performance: The sustainability goal is reached in more than 80% of operations16
.
Compliance: All operations fully comply with applicable law and agreements.
Measures (only for some categories): In more than 80% of operations, substantial17
measures to improve sustainability performance have been taken.
Moderate sustaina-bility performance
Performance: The sustainability goal is reached in less than 80% of operations.
Compliance: All operations fully comply with applicable law and agreements.
Measures (only for some categories): In less than 80% of operations, substantial
measures to improve sustainability performance have been taken.
Insufficient sustain-ability performance
Performance: Operations damage environment and society.
Compliance: Operations violate applicable law and relevant agreements.
Measures: No effective improvement measures have been taken.
Threshold values must be adapted to the conditions of the sector and region under consideration.
The adaptation must be done transparently, with sound justifications provided for each value. In
some instances, few or no intermediate levels exist. When checking for forced labour, there normally
are just two clearly distinguishable cases – either it exists or it does not. If it exists, the rating will be
“insufficient sustainability performance”, if it does not, it will be “best sustainability performance”. In
order to refine the rating scale, proactive measures to remove forced labour, e.g. in supplier opera-
tions, can be rated as well.
16
In terms of the number of employees, the amount of produce, the area, the number of animals etc. directly af-
fected by improvement measures. 17
In terms of the investment made, the impact on operations (interruptions, restructuring, required training of
employees etc.) and the effects on sustainability performance.

31
Table 4. Example of SAFA rating for the “Land” sustainability theme.
Rating
Sustainability sub-themes
Organic matter Physical structure Chemical quality Land degradation
Indicators (examples)
Performance: soil organic matter content and C:N ratio
in topsoil
Measures: compaction prevention, reduced tillage since >3 years.
Performance: soil NPK balances, pH (5 years ago
and now), absence of pollutants
Performance: area lost or rehabilitated, area affect-ed by substantial erosion
(wind, water)
Best sustainability performance
Content and quality of soil
organic matter are at the
optimum level achievable
under the given pedo-climatic
conditions.
Bulk density and aggre-gate stability are at the
optimum achievable under the given pedo-
climatic conditions.
Nutrient status and pH are at optimum levels for
crop growth, and no chemical or biological soil
pollution occurs.
No soil is lost through erosion or sealing and all degraded land is rehabili-
tated.
Good sustainability performance
Substantial measures to en-
hance soil organic matter
implemented on >80% of the
area, for >5 years.
Substantial measures to enhance soil structure
implemented on >80% of the area, for >5 years.
Substantial measures to enhance soil nutrient
status and pH, on >80% of the area. No pollution
for >5 years.
No soil or land loss has occurred and degraded soils exist but were not
reclaimed.
Moderate sustaina-bility performance
Measures to enhance soil
organic matter were taken on
<80% of the area.
Measures to enhance soil structure were taken on
<80% of the area.
Measures to enhance chemical soil health were
taken on <80% of the area.
Soil is lost due to erosion or sealing. Losses are compensated through
reclamation elsewhere.
Insufficient sustain-ability performance
Operations cause a loss or
quality deterioration of soil
organic matter. No counter-
measures were taken.
Operations cause soil compaction or other
disturbances of soil struc-ture, without counter-
measures.
Soils are polluted, mined (NPK depletion), eutro-phicated, acidified or
salinised.
Soil has been lost through erosion or sealing, with-
out compensation.
Output of Step 3
Indicator descriptions with threshold values for all sustainability sub-themes deemed rele-
vant but not yet covered by existing documentation.
3.4 Step 4: Collecting data
Data collection can take different forms, for example a farm or factory visit, interviews with person-
nel, management, a stakeholder survey or data collection from public and other independent sources
of information. In small, poorly documents enterprises (e.g. most of the world’s farms) almost all en-
terprise-related information will have to be collected via a farmer interview and a personal inspec-
tion of farm and fields. This means that the “how” and “when” of data collection can have influence
on data quality and SAFA results. For some of the environmental themes (e.g. “Freshwater” and
“Land”), doing field measurements and laboratory analyses is desirable, but not a must. The form of
data collection must be documented, and its representativeness of the enterprise’s work routines
shall be justified. The following rules hold for the data collection phase:
Use the most precise and reliable performance data available. Where no performance data
exist, measures can be enumerated and rated. The indicator tables in part C of the Guidelines
provide initial guidance on data sources.
Data should have been collected using standardised measurement methods (IISD, 2009).
Where quantitative data are used, these should be expressed in SI units.
Output of Step 4
Complete set of data needed to calculate and rate scores for all indicators defined in Step 3.
32
3.5 Step 5: Analysing and interpreting SAFA results
A SAFA results in at least one sustainability indicator score, thus in at least one rating, per applicable
sustainability sub-theme. Some sub-themes require the measurement of more than one indicator. To
obtain ratings, the threshold values defined in Step 3 are applied to the collected and calculated da-
ta. Calculations are done individually for each indicator. Where the assessment covers production
sites with different performance regarding an indicator, the rating should be based on the worst per-
formance observed. For some indicators, a rating based on the percentage of area, employees, pro-
duce etc. where a certain performance is achieved, is possible as well. The following rules apply:
The calculation process must be transparent, with all functions presented.
Data insufficiencies can sometimes require the estimation of certain values. In order to en-
sure transparency, data quality must be indicated for all quantitative values used.
Decisions on rules for aggregation and weighting of indicator values must be justified and de-
scribed.
Calculation rules should be in line with standards already applied in the respective sector.
The achieved ratings are interpreted with respect to validity (inaccuracies due to lack of data or as-
sessment methods), context, scope and priorities for action. During the interpretation of results with
regard to context, a holistic approach should be adopted, i.e. the assessed entity should be perceived
and understood as a whole. For example, results for the “Freshwater”, “Land” and “Biodiversity”
themes will often be linked with the same activities, such as soil tillage, use of crop protection prod-
ucts and wastewater discharge. Such linkages should be identified and addressed explicitly, as the
resulting synergies, trade-offs and side effects of activities will affect the planning and implementa-
tion of improvement measures.
Aggregation and visualisation
The communication of SAFA results, be it internally, B2B or B2C, may require an aggregation of the
obtained scores. Aggregation can be done for sub-themes within a sustainability theme, for sustaina-
bility themes within a company, and for multiple companies along the value chain. A variety of ag-
gregation approaches can be employed, depending on the purpose and target audience of the SAFA.
For example, internal sustainability management may require a hot-spot analysis. In this case, aggre-
gation may consist in the identification of the sustainability theme for which the worst score was ob-
tained, hence where there is the greatest need for action. Other options include the calculation of
the mean or the median of all sustainability theme scores, or of the scores within each sustainability
dimension. All types of aggregation have in common that a gain in communicability is accompanied
by a loss of information and a risk of relevant information being masked.
Visualisation techniques can partly overcome the trade-off between the communicability and the
completeness of information. Two examples of illustrations of overall sustainability performance and
sustainability gaps are provided in Figures 3 and 5.

33
Figure 5. Visualisation of a SAFA sustainability polygon of a hypothetical enterprise. The thick black line con-
nects theme’ performance: best (dark green), good (light green), moderate (yellow) or insufficient (pink).
Output of Step 5:
A complete table of ratings for sustainability themes, sub-themes and indicators. A written
interpretation of the ratings.
A visual representation of SAFA results at entity level. Where entities at several steps of a
value chain have been assessed, a visualisation at chain level is required.
3.6 Step 6: Reporting
All documentation notes from the above steps are combined into a report that is the visible output
of the SAFA. The following principles, partly based on the Bellagio STAMP, apply to reporting:
The structure of the report reflects the structure of the SAFA process steps.
The report consists of a descriptive and an analytical part.
The report is written in clear and concise language.
All information is presented in a fair and objective way (both positive and negative results).
Data must be made available in as much detail as practically feasible.
Critical review
A critical review, either by the assessing or assessed organisation or a third party, is an essential part
of a SAFA. It fosters the quality, credibility and transparency of the assessment. This is in line with the

34
procedure outlines of LCA (ISO, 2009) and the G3.1 Guidelines (GRI, 2011a), and the transparency
principles of the Bellagio STAMP (IISD, 2009) and the ISEAL Impacts Code (ISEAL Alliance, 2010).
In a SAFA, the critical review can be handled in different ways. The disclosure of procedure should
provide all information needed for a critical appraisal by interested stakeholders. In addition, a rigor-
ous internal or external review can be undertaken. Where results are designated for B2B or B2C
communication, an external review is imperative. Type, comprehensiveness and complexity of the
review are defined during the SAFA scoping phase. Whether and how the review results are made
available to the public is decided by the commissioning entity.
Disclosure of procedure
Companies undertaking a SAFA should have the possibility of benefiting from the experiences of oth-
ers and of striving for the best sustainability performance and the strictest sustainability thresholds.
In line with the transparency principle of the Bellagio STAMP18 (IISD, 2009), the public should have
access to information that helps critical consumers understand how a SAFA was done.
Therefore, information on the selected system boundaries, indicators, threshold values, valuation
functions, data sources, inclusion of data from other audits, assumptions and uncertainties and
about stakeholder relations in each SAFA process should be made publicly accessible. This will allow
companies operating in the same region or industry sector to use previously used SAFA configura-
tions for orientation. The concept is analogous to the Product Category Rules (PCR) used in environ-
mental impact assessment (ISO, 2006). Since sustainability is often considered a pre-competitive is-
sue by the private sector, as testified by the cooperation of numerous companies in the frame of
multistakeholder initiatives (e.g. WEF, 2010), mutual access to SAFA-related information is in the in-
terest of participating companies.
Output of Step 6
A complete SAFA report, structured as outlined in Appendix C.
18
www.iisd.org/pdf/2009/brochure_bellagiostamp.pdf
35
Part C: Sustainability Theme Protocols
36
4. Sustainability dimensions and themes
All 20 sustainability themes presented in Table 1 (see Part A) must be reflected in a SAFA, unless one
or more themes are absolutely not applicable to the respective operations, or outside the assessed
entity’s sphere of influence (see Part B for details of the relevance check). The content and general
relevance of the sustainability dimensions is explained below, and theme descriptions with example
indicators are provided thereafter.
Good governance
Governance is the process of making and implementing decisions (UNESCAP, 2009). In a nation, this
is achieved through institutions. In a company, it translates into corporate governance, which, ac-
cording to the OECD Principles of Good Corporate Governance (GCG) is a set of relationships be-
tween management, board, shareholders and other stakeholders that furnishes the structure
through which the enterprise’s goals are set, and the means for achieving these goals and monitoring
performance (OECD, 2004). A definition inspired by business ethics states that “good corporate gov-
ernance describes the political system of an enterprise. It defines the rights of stakeholders, provides
the separation of powers between management and supervisory board, and seeks to ensure respon-
sible leadership in all dimensions of the organisation” (Maak & Ulrich, 2007).
While governance has not always been considered a separate dimension of sustainable develop-
ment, the first two versions of the Commission on Sustainable Development Core Indicator Frame-
work presented sustainability themes according to the social, environmental, economic and institu-
tional dimensions. SAFA has taken forward the “institutional” dimension, especially because SAFA
users are concerned with value chains and stakeholder relations, in which good corporate govern-
ance is of paramount importance. The weight given to governance in the SAFA Guidelines is in line
with other business-centered approaches, such as the UN Principles for Responsible Investment19,
the UN Global Compact (UNGC/IFC, 2009) and the G3.1 Guidelines (GRI, 2011a). The governance di-
mension of SAFA revolves around an understanding of GCG that explicitly takes into account all af-
fected stakeholders. Sustainability performance is not only of concern to shareholders, but equally to
all stakeholders affected by activities of an enterprise. This broad understanding of GCG is linked with
the idea of corporate citizenship (UNGC/IFC, 2009).
The sustainability performance of an enterprise rests on a conscious corporate strategy and man-
agement, ideally expressed in a binding corporate mission statement and code of conduct. A busi-
ness purpose that contradicts or ignores the sustainability principle will not lead to a sustainably op-
erating enterprise in the long run. Equally, where a firm anchorage of sustainability lacks at the top
level, parts of the enterprise may have a good sustainability performance, but the whole will lack tar-
geted control and long-term support and thus, not perform sustainably.
A mission statement should help to put operations into the context of ecological and social co-
responsibility, to create awareness at all management levels and among employees, and to align in-
dividual actions with corporate sustainability policy. It should shape corporate culture, while reflect-
ing to society the enterprise’s commitment to contribute to sustainable development (Maak & Ul-
rich, 2007). An enterprise committed to sustainable development needs a sustainability-oriented
19
www.unpri.org

37
governance structure, in which content, values and responsibilities of the company are clearly stated
and through which transparency and accountability are ensured. It organises processes that facilitate
an active participation of all stakeholders. Further elements include a strict orientation towards legit-
imacy and the rule of law and a rigorous sustainability management.
Environmental integrity
To protect the integrity of Earth’s ecosystems, the use of natural resources and the environmental
impacts of activities must be managed such that negative environmental impacts are minimised and
positive impacts fostered. The protection and sustainable utilisation of biotic and abiotic resources
can be fostered by adopting an ecosystem approach. This approach, defined by the Convention on
Biological Diversity (CBD), comprises complementary and interlinked principles20, as well as opera-
tional guidances21. The CBD considers that a general application of an ecosystem approach will help
achieve a balance of three objectives, namely conservation, sustainable use and the fair and equita-
ble sharing of benefits arising out of the utilisation of genetic resources. The need for an ecosystem
approach applies to the whole food and agriculture sector, including fisheries and forestry.
A variety of methods for quantifying, rating and managing environmental impact and resource use
exists, including LCA (ISO, 2009), ecological, water and carbon footprinting (e.g. Wackernagel & Rees,
1997), methods specified in the ISO 14000 series of norms, as well as methods for environmental
impact assessment. While some aspects of the environment, such as water quantity and quality and
energy use, are quite well measurable, others, like soil fertility, biodiversity and animal welfare, defy
straightforward quantification. Indicators of natural resource use and of emissions either refer to
absolute quantities, such as litres of water withdrawn or megajoules of energy used, or they are eco-
efficiency or “decoupling” measures that relate environmental pressure (resource consumption or
emissions) to the quantity or value of production (WBCSD, 2000; OECD, 2003). The downside of eco-
efficiency indicators is that what counts from an ecosystem perspective is absolute pressure on the
environment or absolute scarcity of a resource, both of which are not always linearly linked with eco-
efficiency. For example, a fruit grower whose orchards are highly water-efficient compared to others
in the region may very well deplete groundwater resources and thus not work sustainably. In a SAFA,
the following aspects of environmental sustainability are addressed: atmosphere, freshwater, land,
materials and energy, biodiversity and animal welfare. These categories were found to best reflect
the main areas of concern regarding adverse human impacts and unsustainable exploitation and to
give a comprehensive picture of environmental sustainability.
Economic resilience
Economic activity involves the use of labour, land and capital to produce goods and services to satisfy
peoples’ needs (Jörissen et al., 1999). This dimension of sustainability is directly linked with the ful-
filment of needs, a pillar of sustainable development as defined by the World Commission on Envi-
ronment and Development (WCED, 1987). Explicit and targeted sustainability management is in-
creasingly perceived as providing competitive advantages in business (Haanaes et al., 2011). Sustain-
ability in the social and environmental domains is supported by functioning businesses. It is therefore
necessary to assess economic sustainability as a sustainability dimension in its own right. In SAFA,
this assessment focuses on the micro-economic level. At this level, economic sustainability can be
understood as an enterprise’s ability to materially enable the stake- and shareholders taking part in,
20
www.cbd.int/ecosystem/principles.shtml 21
www.cbd.int/ecosystem/operational.shtml

38
and affected by, its activities to live a decent, humane life, continuously and in the short and long
run. In a wider sense, the company’s ability to contribute to social and environmental sustainability,
also at the regional level, adds to this definition (Doane & MacGillivray, 2001).
An enterprise should be capable of paying all its debts, generating a positive cash flow and ade-
quately remunerating staff and shareholders. To be considered economically sustainable, the enter-
prise must take precautions that ensure the maintenance of these capabilities in situations of eco-
nomic, social and environmental turbulence (e.g. extreme weather conditions). In brief, it must be
economically resilient. Some aspects of economic sustainability have been controversially discussed,
most prominently the question of “sustainable growth”. Steady and adequate economic growth is a
common proxy for positive socio-economic development. Economic growth is the declared goal of
most nation states and was endorsed by WCED (1987) and UNEP (2011). The possibility of endless
economic growth in a limited ecosphere has been contested by many, and even dismissed as an
oxymoron (Daly, 1990). Increasingly, the goal of decoupling economic growth from the use of limited
natural resources is becoming popular (UNEP, 2011). The SAFA Guidelines forego the rather macro-
economic issue of growth rates in favour of a micro-economic approach that focuses on the enter-
prise and the local community. The following themes are covered by the economic dimension of
SAFA: investment (into sustainability), vulnerability of operations, product safety and quality, and
local value creation.
Social well-being
The WCED, in its report “Our common future” (WCED, 1987), stated that social sustainability is about
the satisfaction of basic human needs and the provision of the right and the freedom to satisfy one’s
aspirations for a better life. This applies as long as the fulfilment of one’s needs does not compromise
the ability of others or of future generations to do the same. The social dimension of sustainability
pertains to human development, which is “the expansion of people’s freedoms to live long, healthy
and creative lives; to advance other goals they have reason to value; and to engage actively in shap-
ing development equitably and sustainably on a shared planet“ (UNDP, 2011).
Basic human needs and rights are defined in the International Bill of Human Rights, which consists of
the Universal Declaration of Human Rights (UN, 1948), the International Covenant on Civil and Politi-
cal Rights (UN, 1966a) and the International Covenant on Economic, Social and Cultural Rights (UN,
1966b). For the food and agriculture sector, Human Rights are translated into the Right to Adequate
Food (FAO, 2004). Human Rights are further specified for work environments in the Declaration of
Fundamental Principles and Rights at Work (ILO, 1998). Guidance on how to protect and respect Hu-
man Rights in business operations is provided by the ‘Protect, respect and remedy’ framework, pro-
posed by the Special Representative of the UN Secretary-General on the issue of Human Rights and
transnational corporations and other business enterprises. According to the framework, the signa-
tory states of the aforementioned treaties have the duty to guarantee protection from human rights
violations. Business enterprises are responsible of respecting human rights, both in their own busi-
ness activities and where human rights impacts are “directly linked to their operations, products and
services by their business relationships” (UNHRC, 2011). The framework was welcomed by stake-
holders from the civil society, multilateral, business and industry domains.
Widely adopted normative documents, including the OECD Guidelines for Multinational Enterprises
(OECD, 2011), the UN Global Compact and the SA 8000 International Standard (SAI, 2008), are in line
with the ‘Protect, respect and remedy’ framework and with the ILO Declaration of Fundamental Prin-
ciples and Rights at Work. The same applies to standards such as the Codes of Conduct of the Busi-
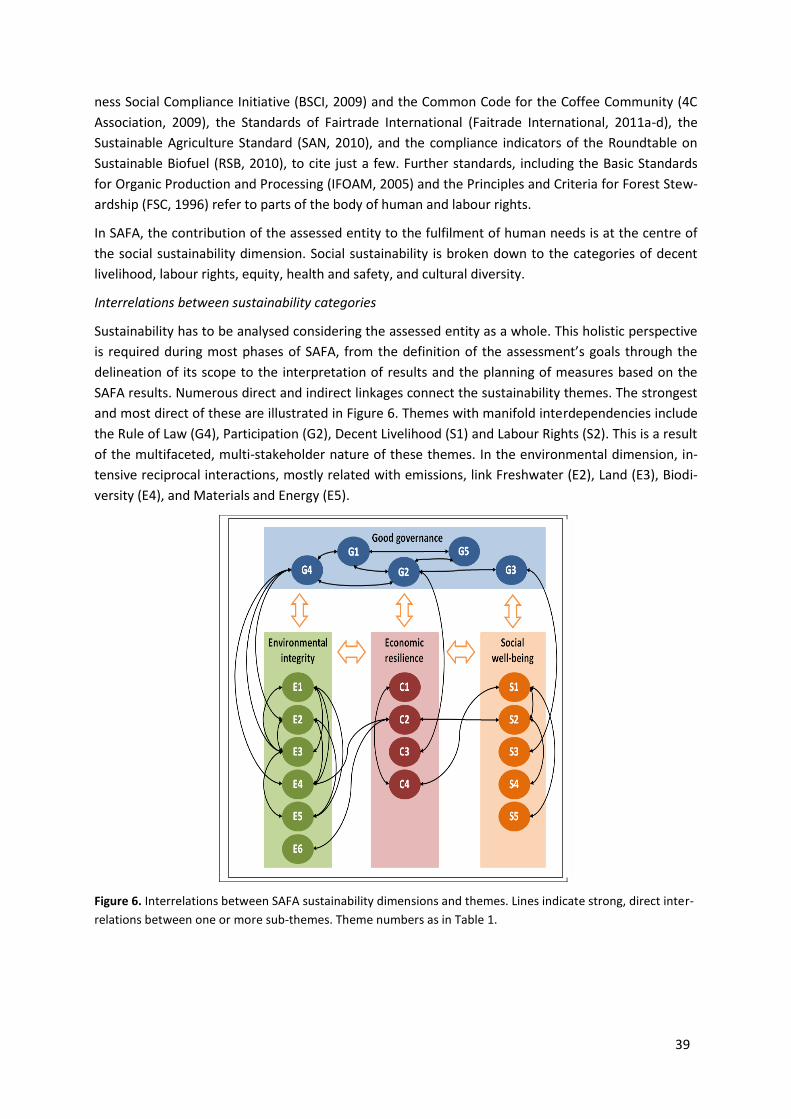
39
ness Social Compliance Initiative (BSCI, 2009) and the Common Code for the Coffee Community (4C
Association, 2009), the Standards of Fairtrade International (Faitrade International, 2011a-d), the
Sustainable Agriculture Standard (SAN, 2010), and the compliance indicators of the Roundtable on
Sustainable Biofuel (RSB, 2010), to cite just a few. Further standards, including the Basic Standards
for Organic Production and Processing (IFOAM, 2005) and the Principles and Criteria for Forest Stew-
ardship (FSC, 1996) refer to parts of the body of human and labour rights.
In SAFA, the contribution of the assessed entity to the fulfilment of human needs is at the centre of
the social sustainability dimension. Social sustainability is broken down to the categories of decent
livelihood, labour rights, equity, health and safety, and cultural diversity.
Interrelations between sustainability categories
Sustainability has to be analysed considering the assessed entity as a whole. This holistic perspective
is required during most phases of SAFA, from the definition of the assessment’s goals through the
delineation of its scope to the interpretation of results and the planning of measures based on the
SAFA results. Numerous direct and indirect linkages connect the sustainability themes. The strongest
and most direct of these are illustrated in Figure 6. Themes with manifold interdependencies include
the Rule of Law (G4), Participation (G2), Decent Livelihood (S1) and Labour Rights (S2). This is a result
of the multifaceted, multi-stakeholder nature of these themes. In the environmental dimension, in-
tensive reciprocal interactions, mostly related with emissions, link Freshwater (E2), Land (E3), Biodi-
versity (E4), and Materials and Energy (E5).
Figure 6. Interrelations between SAFA sustainability dimensions and themes. Lines indicate strong, direct inter-
relations between one or more sub-themes. Theme numbers as in Table 1.

40
5. Sustainability theme protocols
The following sustainability theme protocols provide detailed guidance on the contents of all SAFA
sustainability themes. Each protocol (Table 5) includes examples of suitable indicators to determine
sustainability performance for each sub-theme.
Table 5. Outline of SAFA sustainability theme protocols.
1. Relevance of the theme
Rationale for including the theme, acknowledged relation with sustainable development, important
challenges, relation with food and agriculture systems, important international agreements.
2. Sustainability Goal
Translation of societal and higher-level goals to the operational level. One sustainability goal is formu-
lated for each SAFA theme.
3. Sub-themes and Indicators
Tabular overview and description of sub-themes, examples of indicators for measuring performance in
relation to the sustainability goal of the theme, data sources and classification of indicators.
41
5.1 Governance structure (G1)
Relevance of the subject
A good governance structure is the foundation of a successful, sustainability- and integrity-oriented
enterprise culture (Loew & Braun, 2006; Erwin, 2010). Governance structure in SAFA means how the
sustainability principle is embedded in the fabric of the whole enterprise. Through the governance
structure, responsibilities for sustainability-related issues have to be assigned at the highest level of
the enterprise, as the commitment of the top decision-makers is essential for superior sustainability
performance (Loew & Braun, 2006). Many enterprises issue a mission statement in which purpose
and goals of the enterprise are expressed, and which provides guidance to strategy development (Hill
& Jones, 2007). Good governance includes the formulation of a statement that goes beyond profit to
embrace ethics and sustainability, with due reference to existing international agreements and defi-
nitions. A mission statement building on integrity and sustainability is not limited to corporate self-
interest (e.g. seeking market leadership), but should be based on a vision of a sustainable future that
is attractive to all stakeholders (Maak & Ulrich, 2007). The mission statement should state, in credi-
ble, clear and authentic words, how the enterprise intends to contribute to a sustainable develop-
ment. For the operational level, principles are defined through a Code of Conduct (CoC) defining
normative guidelines for the pursuit of the business purpose (Maak & Ulrich, 2007). The CoC provides
clear guidance in concrete situations, is authoritative, without limiting scopes of action too much,
and fosters desirable behaviour. It provides management guidance and priorities for decision making
in situations where trade-offs between the dimensions of sustainable development are encountered.
The agriculture and food sector hosts a diversity of enterprises whose structures range from a virtual
absence of governance to highly sophisticated systems. Size and market power of enterprises in the
same sector, region or value chain are equally variable. This often results in major imbalances and
disadvantages, particularly where small enterprises depend on large firms that are better organised,
but lack a business purpose going beyond profit. Larger size implies a larger sphere of impact and
influence and thus also of responsibility. Therefore, large, well-organised enterprises should contrib-
ute to the improvement of market structures and to the sustainability of production of their suppli-
ers, rather than capitalising on their weakness. A corporate leadership that is aware of the responsi-
bility of the enterprise in terms of sustainable development pays attention to the social and envi-
ronmental contexts in which it operates. In the respective sector or region, structural sustainable
deficits may occur. As a successful enterprise has expertise in understanding the complexity of its
operating environment, responsible leadership implies that the enterprise takes proactive measures
to improve the sustainability of this environment, where possible. As for the small enterprises typical
of agriculture and fisheries, operating culture depends on the personal integrity and values of the
entrepreneur, who is personally liable and responsible for the enterprise. In such situations, the SAFA
goals on governance structure are relevant insofar as they can inspire reflections on values and prin-
ciples.
Internationally valid recommendations on governance structure are established through the OECD
Principles of Good Corporate Governance (OECD, 2004), the UN Principles for Responsible Invest-
ment22 and the UN Global Compact (UNGC/IFC, 2009). Suitable indicators are described e.g. in the
G3.1 Guidelines (GRI, 2011a). While it does not deal with corporate governance, Agenda 21 provides
a basis for global governance, with the aim of a sustainable development (UN, 1992).
22
www.unpri.org

42
Sustainability goal
The enterprise disposes of explicit, publicly available sustainability objectives and effective means of
implementation and verification, as well as of identification and proactive addressing of major sus-
tainability challenges.
Sub-themes and indicators
Theme Sub-Themes Description
Indicators
What is being
measured? Data source Type23
G1
Governance structure
G1.1. Corpo-rate ethics
The enterprise has an explicitly and publicly stated busi-ness purpose, as well as a Code of Conduct, both of which are binding for management and employees, and the values and ethi-cal guidelines of which are in line with sustainable development.
Existence of a publicly acces-sible mission statement in-cluding social, economic and environmental objectives of the enterprise AND existence of a Code of Conduct provid-ing guidance concerning rules, information flow, sanctions and other important sustain-ability issues of the sector(s), supply chain(s) and region(s)
Mission state-ment, Code of Conduct, inter-view (manage-ment)
3
Existence of procedures and instruments (e.g. risk man-agement, environmental im-pact assessment) to identify and address sustainability challenges within sector and supply chain, in compliance with agreed international standards
Internal docu-mentation (e.g. on risk man-agement)
3
Number and substantiality (share of turnover or gain invested, number of people affected) of activities and initiatives to improve sustain-ability, such as a rolling-plan for improving sustainability, capacity-building and partner-ships, etc.
Internal docu-mentation, CSR or similar re-port
1
G1.2 Due diligence
Prior to decisions with potential major and long-term sus-tainability impact, due diligence proce-dures are done and relevant results made accessible to affected stake-holders in adequate form.
Share of important decisions in relation with which due diligence, risk assessment, or ex-ante and ex-post impact assessment on economic, environmental, social and governance issues were done, and the results shared with affected stakeholders
Internal docu-mentation, interview (management, stakeholders)
1
Existence of regular, timely, correct and adequate com-munication with all stake-holders affected by opera-tions
Internal docu-mentation, interview (stakeholders)
3
23
1: quantitative, absolute, performance; 3: qualitative, absolute, performance (re. Table 2).
43
5.2 Accountability (G2)
Relevance of the subject
Various meanings are attributed to the term “accountability”. In SAFA, it is interpreted as an account-
giving relationship: accountability is about voluntarily informing others about the activities of the
enterprise and justifying these activities, internally and externally. Since shareholders, contractors,
consumers, the neighbourhood and other stakeholders may have to take decisions based on infor-
mation disclosed by the enterprise such information must be complete, correct and accessible. The
accountability concept is enhanced in SAFA to cover the disclosure of information about financial,
environmental and social performance (the dimensions of the “triple bottom line” approach) and,
where possible and relevant, its governance performance. This theme further integrates the imple-
mentation of due diligence procedures, as these go beyond the reporting of activities and perform-
ance.
The success of an enterprise inter alia depends on the stakeholders’ view of its credibility, transpar-
ency and performance. For employees, for example, identification with a well-respected company
can be much better than with one that has a bad reputation. Consumers as well may prefer products
of respectable companies, and shareholders and investors increasingly tend to put their money in
operations of which they are convinced that all potential risks are thoroughly managed (G100, 2003).
Perceptions of an enterprise’s integrity and accountability are affected by how performance with
respect to the economic, environmental and social dimensions of sustainability is communicated.
There is increased awareness that an active and holistic management of accountability, including
multi-dimensional reports, compliance with auditable standards and labels as well as due diligence
procedures all are essential elements of the enterprise’s integrity system. Further elements of this
system include vision and mission statements of the board, a Code of Conduct (see “Governance
structure”) and the transparency of all of these elements and activities towards stakeholders and the
public (Maak & Ulrich, 2007). Holistic reporting requires the collection, evaluation and comprehen-
sive compilation of performance data. Accounting complexity can be very high, particularly in diverse
and internationally operating corporations. Reporting has to be adapted to the knowledge and inter-
ests of the concerned audience, meaning that a balance must be struck between complexity and ac-
cessibility. Assumptions e.g. in accountings and on the enterprise’s sphere of impact must be dis-
closed and justified.
The agriculture and food sector is at the nexus of the biosphere and the human economy and can
thus be considered a custodian of land, crops, animals and other resources. Its products are directly
used or consumed by everybody. This causes a high sensitivity of the public to actions and develop-
ments in this sector that impact on people and environment. Transparency and credibility are impor-
tant success factors in food and agriculture, as proven by the growth of sales of organic, fairtrade and
other credibly labelled products. Due diligence procedures can help anticipate and prevent negative
impacts on environment and people, and thus protect the enterprise’s image.
Guidance on how to deal with accountability is available, for example, through the G3.1 Guidelines
(GRI, 2011a), the AA1000 Principles Standard (AccountAbility, 2008), the SA8000 standard (SAI, 2008)
and similar instruments.
Sustainability goal
The enterprise assumes full responsibility for its business behaviour and regularly, transparently and
publicly reports on its sustainability performance.
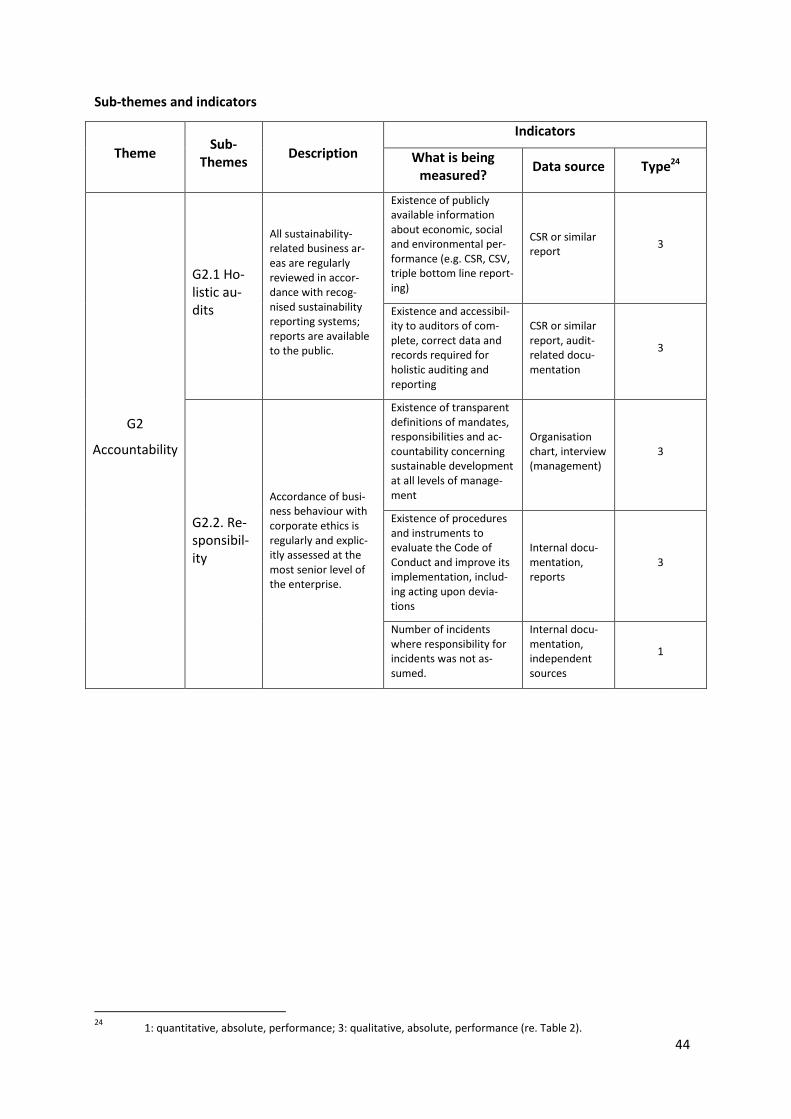
44
Sub-themes and indicators
Theme Sub-
Themes Description
Indicators
What is being measured?
Data source Type24
G2
Accountability
G2.1 Ho-listic au-dits
All sustainability-related business ar-eas are regularly reviewed in accor-dance with recog-nised sustainability reporting systems; reports are available to the public.
Existence of publicly available information about economic, social and environmental per-formance (e.g. CSR, CSV, triple bottom line report-ing)
CSR or similar report
3
Existence and accessibil-ity to auditors of com-plete, correct data and records required for holistic auditing and reporting
CSR or similar report, audit-related docu-mentation
3
G2.2. Re-sponsibil-ity
Accordance of busi-ness behaviour with corporate ethics is regularly and explic-itly assessed at the most senior level of the enterprise.
Existence of transparent definitions of mandates, responsibilities and ac-countability concerning sustainable development at all levels of manage-ment
Organisation chart, interview (management)
3
Existence of procedures and instruments to evaluate the Code of Conduct and improve its implementation, includ-ing acting upon devia-tions
Internal docu-mentation, reports
3
Number of incidents where responsibility for incidents was not as-sumed.
Internal docu-mentation, independent sources
1
24
1: quantitative, absolute, performance; 3: qualitative, absolute, performance (re. Table 2).
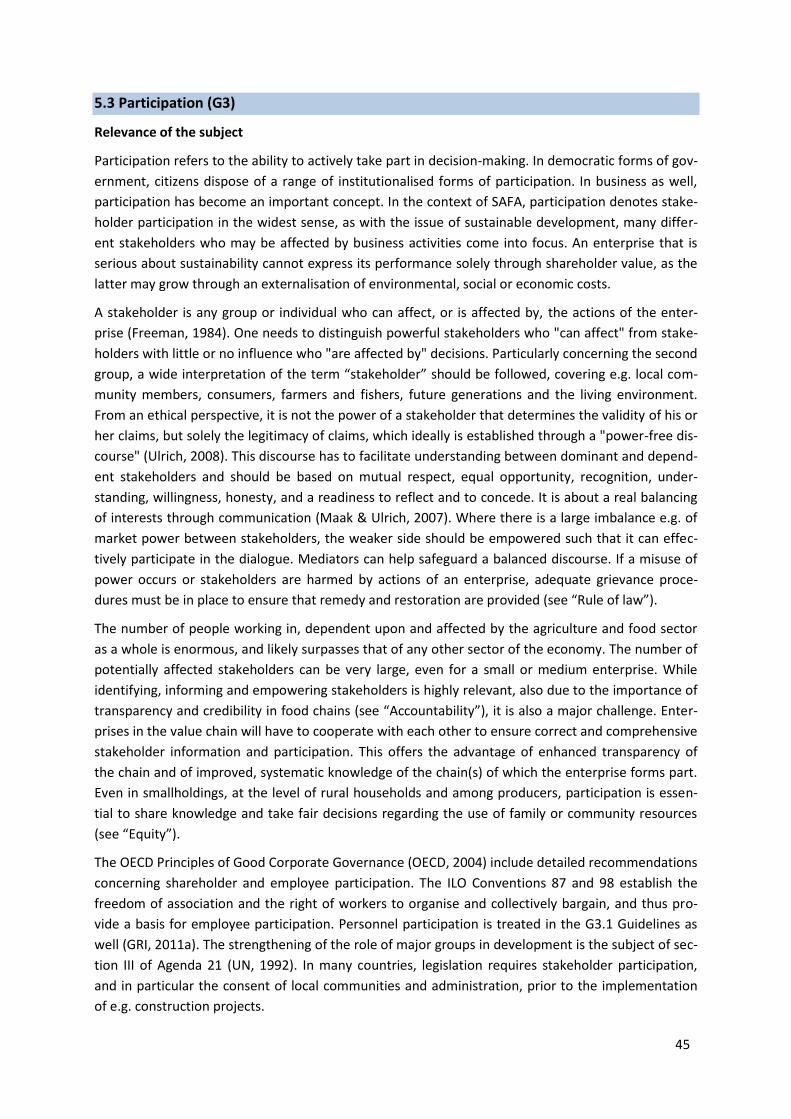
45
5.3 Participation (G3)
Relevance of the subject
Participation refers to the ability to actively take part in decision-making. In democratic forms of gov-
ernment, citizens dispose of a range of institutionalised forms of participation. In business as well,
participation has become an important concept. In the context of SAFA, participation denotes stake-
holder participation in the widest sense, as with the issue of sustainable development, many differ-
ent stakeholders who may be affected by business activities come into focus. An enterprise that is
serious about sustainability cannot express its performance solely through shareholder value, as the
latter may grow through an externalisation of environmental, social or economic costs.
A stakeholder is any group or individual who can affect, or is affected by, the actions of the enter-
prise (Freeman, 1984). One needs to distinguish powerful stakeholders who "can affect" from stake-
holders with little or no influence who "are affected by" decisions. Particularly concerning the second
group, a wide interpretation of the term “stakeholder” should be followed, covering e.g. local com-
munity members, consumers, farmers and fishers, future generations and the living environment.
From an ethical perspective, it is not the power of a stakeholder that determines the validity of his or
her claims, but solely the legitimacy of claims, which ideally is established through a "power-free dis-
course" (Ulrich, 2008). This discourse has to facilitate understanding between dominant and depend-
ent stakeholders and should be based on mutual respect, equal opportunity, recognition, under-
standing, willingness, honesty, and a readiness to reflect and to concede. It is about a real balancing
of interests through communication (Maak & Ulrich, 2007). Where there is a large imbalance e.g. of
market power between stakeholders, the weaker side should be empowered such that it can effec-
tively participate in the dialogue. Mediators can help safeguard a balanced discourse. If a misuse of
power occurs or stakeholders are harmed by actions of an enterprise, adequate grievance proce-
dures must be in place to ensure that remedy and restoration are provided (see “Rule of law”).
The number of people working in, dependent upon and affected by the agriculture and food sector
as a whole is enormous, and likely surpasses that of any other sector of the economy. The number of
potentially affected stakeholders can be very large, even for a small or medium enterprise. While
identifying, informing and empowering stakeholders is highly relevant, also due to the importance of
transparency and credibility in food chains (see “Accountability”), it is also a major challenge. Enter-
prises in the value chain will have to cooperate with each other to ensure correct and comprehensive
stakeholder information and participation. This offers the advantage of enhanced transparency of
the chain and of improved, systematic knowledge of the chain(s) of which the enterprise forms part.
Even in smallholdings, at the level of rural households and among producers, participation is essen-
tial to share knowledge and take fair decisions regarding the use of family or community resources
(see “Equity”).
The OECD Principles of Good Corporate Governance (OECD, 2004) include detailed recommendations
concerning shareholder and employee participation. The ILO Conventions 87 and 98 establish the
freedom of association and the right of workers to organise and collectively bargain, and thus pro-
vide a basis for employee participation. Personnel participation is treated in the G3.1 Guidelines as
well (GRI, 2011a). The strengthening of the role of major groups in development is the subject of sec-
tion III of Agenda 21 (UN, 1992). In many countries, legislation requires stakeholder participation,
and in particular the consent of local communities and administration, prior to the implementation
of e.g. construction projects.

46
Sustainability goal
All stakeholders substantially affected by the enterprise’s activities are identified, empowered and
invited to share decision-making on activities impacting their lives and having major environmental
impacts.
Sub-themes and indicators
Theme Sub-Themes Description
Indicators
What is being measured?
Data source Type25
G3
Participation
G3.1 Stake-holder dialogue
In decision-making processes, potentially affected stake-holders, including those unable to claim their rights (e.g. na-ture, future genera-tions) are proactively identified, informed, empowered and con-sidered, to the extent possible.
Existence of a thor-ough stakeholder analysis based on legitimacy of claims, including explicit justification AND (*)
Internal docu-mentation, interview (management)
3
Percentage of identi-fied stakeholders with whom the en-terprise is in dialogue or contact and whose claims are duly con-sidered in decision-making (*)
Internal docu-mentation, interview (stakeholders, management)
1
Rating of the quality of stakeholder par-ticipation in dialogues
Stakeholder survey
1
Percentage of identi-fied stakeholders with access to infor-mation that is suffi-cient to empower them to effectively participate in stake-holder dialogue
26 (*)
Stakeholder survey
1
Percentage of identi-fied stakeholders who are actively in-formed (*)
Internal docu-mentation, stakeholder survey
1
Percentage of deci-sions on disputed subjects, which are thoroughly justified and explained to affected stakeholders
Internal docu-mentation, stakeholder survey
1
G3.2 Grievance procedures
All stakeholders have access to appropriate grievance procedures without a risk of negative conse-quences.
Percentages of per-sonnel, customers and other stake-holders, respectively, with access formal,
Internal docu-mentation, interview (management)
1 / 3
25
1: quantitative, absolute, performance; 3: qualitative, absolute, performance (re. Table 2). 26
Processes involving free, prior, informed consent are a good example for an appropriate procedure.
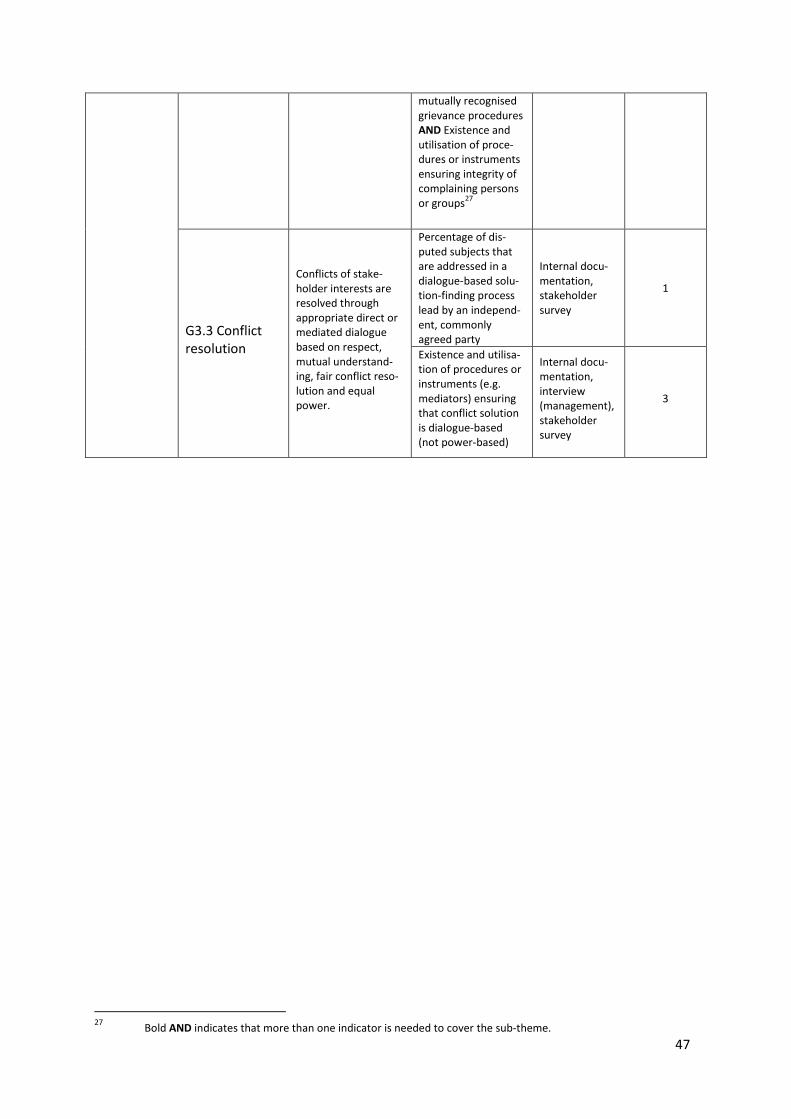
47
mutually recognised grievance procedures AND Existence and utilisation of proce-dures or instruments ensuring integrity of complaining persons or groups
27
G3.3 Conflict resolution
Conflicts of stake-holder interests are resolved through appropriate direct or mediated dialogue based on respect, mutual understand-ing, fair conflict reso-lution and equal power.
Percentage of dis-puted subjects that are addressed in a dialogue-based solu-tion-finding process lead by an independ-ent, commonly agreed party
Internal docu-mentation, stakeholder survey
1
Existence and utilisa-tion of procedures or instruments (e.g. mediators) ensuring that conflict solution is dialogue-based (not power-based)
Internal docu-mentation, interview (management), stakeholder survey
3
27
Bold AND indicates that more than one indicator is needed to cover the sub-theme.

48
5.4 Rule of law (G4)
Relevance of the subject
The rule of law (ROL) is a concept important to modern legal systems and international agreements.
The United Nations defines the ROL as a principle of governance by which all persons and entities are
“accountable to laws that are publicly promulgated, equally enforced and independently adjudicat-
ed”. These laws have to be consistent with international human rights standards (UN, 2004). Among
the key elements then is accountability before the law, legal certainty and legal transparency. The
ROL goes beyond the above by demanding that the laws themselves are consistent with universally
valid human rights, in particular the Universal Declaration of Human Rights (UN, 1948) and the rights
protected by human rights treaties. In SAFA, the ROL is considered in a business context, its main
central aim being the protection of the individual and group rights of all (Ehm, 2010).
Adherence to the ROL concept requires that (universal) justice be given absolute priority. Opportuni-
ties for profit are to be foregone where the moral, legitimate rights of others would be violated. An
enterprise committed to the ROL will only conduct business that can be considered legitimate in the
light of the moral rights of all humans, as expressed e.g. in the Universal Declaration of Human Rights
(UN, 1948). Businesses must respect and avoid being complicit in human rights violations by the
state, even if they are formally legal under applicable national law. Enterprises with a large sphere of
influence and impact should not only respect the ROL in their own operations, but require business
partners to do the same. Of 320 assessed cases of human rights abuses by international corpora-
tions, 40% included indirect forms of company involvement; most often, companies benefited from
the abuses of others, including suppliers. Nearly 75% of cases involved company sourcing from sup-
pliers (UNHRC, 2008).
In the context of agriculture, equitable access to and legal certainty over natural resources on which
agriculture depends, stakeholder participation in decisions affecting natural resource use and access,
the presence of mechanisms to monitor, enforce and ensure access to justice and the legal empow-
erment of stakeholders are of crucial importance. Enterprises in food and agriculture operate in a
variability of legal frameworks, with different degrees of legal certainty and recognition of a universal
ROL. Where states and judiciaries are weak, unclear or illegitimate situations can evolve, for example
concerning ownership of and access to land, clean water and other resources. This applies in particu-
lar to remote rural regions, where law enforcement tends to be particularly difficult. Major imbal-
ances between market players (see “Governance structure”) can further contribute to situations
where “might makes right”. Of the 320 alleged human rights abuses mentioned above, 7% concerned
the food and beverage sector, and 21% the retail and consumer products sector (UNHRC, 2008).
The moral rights of all humans emanate from the national laws (often the constitutions) of many
countries. At international level, they are established through the Universal Declaration of Human
Rights (UN, 1948). A clear position on human rights in business is available in the form of the “Pro-
tect, respect and remedy” framework (UNHRC, 2011). Through an online portal28, the UN provide
comprehensive knowledge resources on ROL. Most single aspects of the ROL are subject to national
legislation as well as of internationally applied standards. For example, anti-bribery and anti-
corruption are explicitly treated in the BSCI Code of Conduct (BSCI, 2009), the UN Global Compact
(UNGC, 2010) and the G3.1 Guidelines (GRI, 2011a).
28
http://unrol.org

49
Sustainability goal
The enterprise is uncompromisingly committed to fairness, legitimacy and protection of the Rule of
Law, including the explicit rejection of extortion, corruption and of the use of resources that are un-
der legal dispute, whose use contradicts international agreements or which is considered illegitimate
by affected stakeholders.
Sub-themes and indicators
Theme Sub-Themes Description
Indicators
What is being
measured? Data source Type29
G4
Rule of
law
G4.1 Commit-
ment to fair-
ness and le-
gitimacy
Legality of operations
and compliance with
national and interna-
tional laws, including
human rights, and with
voluntary responsible
business standards are
given absolute priority
over profit opportuni-
ties; actions that vio-
late the Rule of Law
are renounced.
Existence of a written
commitment to legality
and compliance (see
left), and to not com-
mitting or being com-
plicit in human rights
violation is explicitly
stated in the company’s
internal business prac-
tice and codes.
Code of con-
duct or other
protocols
3
Existence of internal
guidelines against brib-
ery and corruption AND
below indicator (*)
Internal docu-
mentation,
interview
(management)
3
Number of trainings for
employees who work in
areas vulnerable to
corruption AND below
indicator (*)
Internal docu-
mentation (e.g.
of human re-
sources de-
partment)
1
Number of cases of
bribery and corruption
involving the enterprise
(*)
Independent
external
sources
1
G4.2 Remedy,
restoration and
prevention
In case of infringe-
ments, effective rem-
edy is provided and
adequate actions for
restoration and pre-
vention are taken.
Existence of mecha-
nisms for adequate
remedy, restoration
and commitment to
non-repetition in case
of infringements
Internal docu-
mentation,
interview (re-
sponsible per-
sons)
3
Existence of simple and
accessible recourse
mechanism to address
complaints of infringe-
ments by internal or
external stakeholders
Internal docu-
mentation,
interview (re-
sponsible per-
sons)
3
29
1: quantitative, absolute, performance; 3: qualitative, absolute, performance (re. Table 2).

50
Number of infringe-
ments after liability was
assumed and adequate
remedy was provided
Independent
external
sources, court
files
1
G4.3 Co-
responsibility
Within its sphere of
influence, the enter-
prise does not seek to
escape strict laws on
social and environ-
mental aspects (e.g. by
relocating facilities),
but supports the im-
provement of the
regulatory framework
on all dimensions of
sustainability.
Existence of a state-
ment in the Code of
Conduct that requires
compliance with the
stricter environmental
and social laws, where
there are differences
between old and new
location
Code of Con-
duct 3
Number of incidents
where local or national
authorities were pres-
surised to offer condi-
tions convenient to the
enterprise, but detri-
mental to society or
environment.
Interview
(management),
independent
external
sources (au-
thorities)
1
Activities and initiatives
taken to improve the
regulatory framework
on sustainability
Interview
(management),
independent
external
sources (au-
thorities)
5
Number of attempts to
influence the legal
framework in the direc-
tion of sustainable de-
velopment
Independent
external
sources (au-
thorities)
1
G4.4 Resource
appropriation
Operations do not
involve any use of
water, land, biodiver-
sity and other re-
sources under legal or
legitimate dispute, and
are carried out with
due diligence and re-
spect for existing
claims and access and
use arrangements with
local stakeholders.
Existence of a written
protocol that excludes
ownership of any op-
eration involving the
use of natural resources
under legal or legiti-
mate dispute
Code of Con-
duct or other
documentation
3
Number of incidents
were due diligence for
recognition and respect
for formal and informal
claims, user or access
arrangements over
natural resources was
not carried out
Internal docu-
mentation,
interview
(stakeholders,
management)
1

51
5.5 Holistic management (G5)
Relevance of the subject
Sustainable development offers many opportunities to entrepreneurs (Haanaes et al., 2011). The
sustainability paradigm provides a basis for the strategic direction of entrepreneurial activities and
economic decisions (see “Governance structure”). The growing number of companies participating in
environmental and social management schemes, or reporting according to the standards of e.g. the
Global Reporting Initiative (“an increasing number of companies and organisations want to make
their operations sustainable”; GRI, 2011a) testifies to the rapidly increasing practical relevance of
holistic management or elements thereof. In SAFA, holistic management is understood as manage-
ment that aims at the continuous improvement of environmental integrity, economic resilience, so-
cial well-being and good governance, with the ultimate goal of operations being fully in line with a
sustainable development of society.
In business, a successful management of sustainability performance is achieved if the management
of environmental, social and governance issues is in line with increased competitiveness and eco-
nomic performance. The triangle of “people, planet and profit” is frequently used to illustrate this.
Holistic management thus requires the integration of environmental, social and economic manage-
ment; it thus covers all the links between non-market and economic issues (Schaltegger et al., 2003;
Porter, 2008). The implementation of such a view of sustainability faces challenges that require a
long development process, as well as time and know-how (GfaW, 2012). One particular challenge to
sustainability management is finding appropriate ways of dealing with trade-offs between sustaina-
bility goals. Holistic management is about striking a balance between short- and long-term interests,
economic, social and environmental concerns, stakeholders and shareholders. An appropriate Code
of Conduct (see “Governance structure”) provides guidance on how to deal with trade-offs.
Operations of enterprises, including those in the food and agriculture sector, cause external effects,
i.e. impacts that are not taken into account in rational decision making from a purely economic
standpoint and that are not normally reflected in the enterprise’s accounts. These external effects
can be positive or negative and may be of an environmental (e.g. air pollution), social (e.g. education
and training of young people) and economic (e.g. added value generated by NGOs due to donations
for development projects outside the company’s sphere of interest) nature. The fact that these ex-
ternal effects are neither accounted for nor considered in economic decisions leads to undesirable
consequences from a societal viewpoint. Therefore, the consideration of such external effects in de-
cision-making and accounting is a cornerstone of sustainable development. Full-cost accounting is an
integral part of holistic management that is particularly important in the agricultural sector, where
production intensively interacts with the natural environment. However, there still is a lack of ade-
quate methods for operationalising full-cost accounting in business.
The topic of holistic management (often termed sustainability management), is a relatively new one
and thus not treated in detail by international agreements or recommendations. The G3.1 Guidelines
provide guidance on the thematic scope and practice of holistic management (although their main
subject is sustainability reporting; GRI, 2011a). The activities that are part of holistic management are
as well described through the United Nations Global Compact Management Model (UNGC, 2010).
Some guidance may also be derived from the UN Principles for Responsible Investment30.
30
www.unpri.org/principles

52
Sustainability goal
Production and procurement are managed, and accounting is done, with equal consideration of all
dimensions of sustainability and of the trade-offs and synergies linking them.
Sub-themes and indicators
Theme Sub-Themes Description
Indicators
What is being
measured? Data source Type31
G5
Holistic man-
agement
G5.1 Sustain-
ability in qual-
ity manage-
ment
All relevant sustain-
ability categories are
managed effectively
and with a holistic
view; trade-offs be-
tween sustainability
dimensions are man-
aged actively and
synergies are built
with other partners in
order to address hot
spots.
Quality and complete-
ness of planning in-
struments and docu-
mentation, and of
implementation, in the
social, governance,
environment and eco-
nomic dimensions
Planning doc-
umentation,
interview (qual-
ity manage-
ment), quality
handbooks
3
G5.2 Certified
production
and sourcing
The sustainability of
production of the
enterprise and its
suppliers (first tier) is
assured.
Share of inputs
sourced from suppliers
that have passed inde-
pendent evaluations of
social, ethical, human
rights or environ-
mental compliance or
of sustainability per-
formance
Records of
purchases (dis-
aggregated into
certified and
non-certified)
1
Share of production
taking place, or share
of turnover generated,
at sites that are certi-
fied according to ac-
cepted systems for
environmental and
social management
Certificates 1
G5.3 Full-cost
accounting
Business success is
measured taking into
account direct and
indirect external ef-
fects in the social and
environment dimen-
sions
Rating of the compre-
hensiveness of inter-
nalisation of external
effects into accounts
Internal docu-
mentation,
accounts, pro-
tocol for full-
cost accounting
5
31
1: quantitative, absolute, performance; 3: qualitative, absolute, performance; 5: measures, absolute (re. Table 2).

53
5.6 Atmosphere (E1)
Relevance of the subject
Priority atmospheric issues include climate change, stratospheric ozone depletion, acidification and
eutrophication, urban air quality and tropospheric ozone. Their impact relates to human health, bio-
diversity, health of ecosystems, economic damage and global security. Many of the effects are long-
term, global in nature and irreversible, with consequences for future generations.
Global warming refers to the rising of average surface temperature, expected as a result of green-
house gas (GHG) emissions into the atmosphere from human activity. During the last 100 years,
global average surface temperature has risen by about 0.8°C, reflecting an increase of over 30% in
atmospheric CO2. If current GHG emission patterns continue unabated in coming decades, models
project global surface temperature increases of 1.1 to 6.4°C by the end of the 21st century (IPCC,
2007). Such projected warming, together with associated changes in precipitation patterns and the
frequency of extreme weather events, will modify the agro-ecological conditions that determine the
regional flora and fauna distribution on the planet. Such pressures, increasing at an accelerated pace
in coming decades, will threaten the very stability and thus productivity of ecosystems, with poten-
tial negative environmental, social and economic consequences at many scales.
Agriculture is strongly affected by global warming, as changes in temperature and rainfall patterns
and dramatic weather events can impair agricultural activities, particularly in poor developing regions
where people are already vulnerable to food insecurity. Agriculture activities and the food sector also
are major contributors to climate change. Some 20 to 30% of global GHG emissions can be associated
with food, while crop and livestock production alone account for 10 to 15 % of global GHG emissions
(Bellarby, 2008; EC, 2010). Direct driving factors are enteric fermentation from livestock production,
fertiliser application in agricultural lands, biomass burning, rice cultivation and management of ani-
mal waste. Indirect but significant emissions drivers are the agriculture-driven land use changes.
Energy use, motor transport and industrial food and agriculture, associated with high mobility and
urbanisation, release air pollutants such as particulate matter, sulphur dioxide, nitrous oxides, vola-
tile organic compounds and ground-level ozone. These pollutants impair human health and the in-
tegrity of ecosystems. The WHO attributes more than 2 million premature deaths per year to air pol-
lution with particulate matter, a figure that is steeply rising. Anthropogenic emissions of ozone-
depleting substances are caused by the use of solvents, refrigerants, foam-blowing agents, spray
propellants and pesticides. The resulting decrease of the protective ozone layer causes increased ul-
traviolet radiation at the earth surface that can damage human health. Terrestrial and marine eco-
systems are negatively affected e.g. through reduced photosynthesis.
Agriculture is the main source of anthropogenous N2O and NH3 emissions, which cause eutrophica-
tion in natural ecosystems. At the same time, food and agriculture activities are among the sectors
most exposed to acidifying and eutrophicating substances and of tropospheric ozone, which can all
impair plant growth and ultimately limit productivity.
The United Nations Framework Convention on Climate Change (UNFCCC) aims at stabilising atmos-
pheric GHG concentrations at a level that prevents dangerous climate change32. Linked to it are the
Kyoto Protocol (of which target to reduce the emissions of developed countries by at least 5% of
1990 levels by 2008-2012 was not reached), the Bali Road Map and the Cancún Agreements. The
32
http://unfccc.int/resource/docs/convkp/conveng.pdf
54
WHO has elaborated air quality guidelines,33 whereas standards for air quality and technical require-
ments for air filtration are specified by national law in many countries. The 1999 Gothenburg Proto-
col34 deals with the abatement of acidification, eutrophication and ground-level ozone. Production
and consumption of ozone-depleting substances are phased out under the Vienna Convention and
the Montreal Protocol35, and recovery of the ozone layer is expected towards 2050.
Sustainability goal
The enterprise’s actions contain greenhouse gases as much as possible and do not release quantities
of ozone-depleting substances and air pollutants (such as particulate matter, sulphur dioxide, nitro-
gen oxides, volatile organic compounds and ground-level ozone) that would be detrimental to the
health of ecosystems, plants, animals or humans.
Sub-themes and indicators
Theme Sub-Themes Description
Indicators
What is being
measured? Data source Type36
E1
Atmos-
phere
E1.1 Green-
house gases
Operations contain
greenhouse gases as
much as possible.
Net GHG emissions of
the enterprise (kg of
CO2-eq)
Records of land
use, livestock,
of fuel, elec-
tricity and N
fertiliser con-
sumption, of
de- and fores-
tation, GHG
balance
1
GHG intensity of opera-
tions (net emissions in
kg of CO2-eq per unit
product or revenue or
area etc.)
As for the
above indica-
tor, plus re-
cords of pro-
duction, land
use, accounts
etc.
List and efficacy rating of
GHG mitigation meas-
ures, including carbon
sequestration by soils
and vegetation, and
carbon off-set schemes
(e.g. Gold Standard37
,
Clean Development
Mechanism38
)
Documentation
of measures
taken
3 / 5
Reduction of GHG emis- GHG balance 1
33
www.who.int/phe/health_topics/outdoorair_aqg/en 34
www.unece.org/env/lrtap/multi_h1.html 35
http://ozone.unep.org/new_site/en/index.php 36
1: quantitative, absolute, performance; 3: qualitative, absolute, performance; 5: measures, absolute; (re. Table
2). 37
www.cdmgoldstandard.org 38
http://cdm.unfccc.int
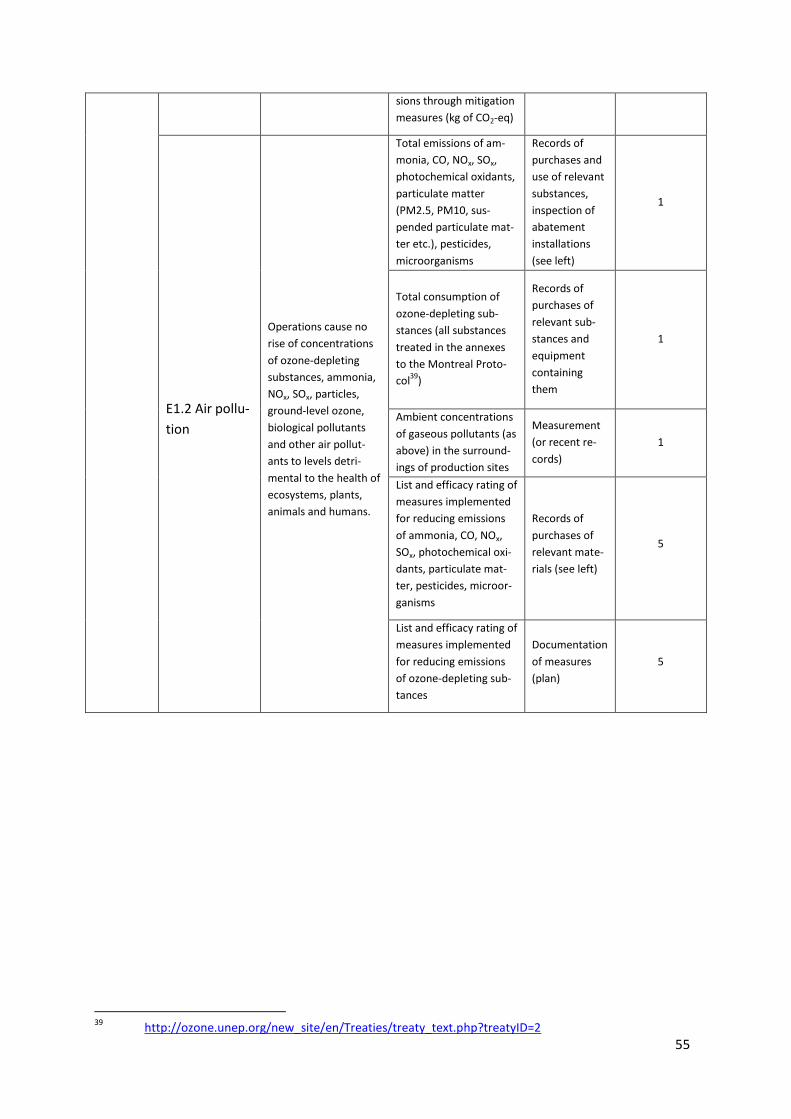
55
sions through mitigation
measures (kg of CO2-eq)
E1.2 Air pollu-
tion
Operations cause no
rise of concentrations
of ozone-depleting
substances, ammonia,
NOx, SOx, particles,
ground-level ozone,
biological pollutants
and other air pollut-
ants to levels detri-
mental to the health of
ecosystems, plants,
animals and humans.
Total emissions of am-
monia, CO, NOx, SOx,
photochemical oxidants,
particulate matter
(PM2.5, PM10, sus-
pended particulate mat-
ter etc.), pesticides,
microorganisms
Records of
purchases and
use of relevant
substances,
inspection of
abatement
installations
(see left)
1
Total consumption of
ozone-depleting sub-
stances (all substances
treated in the annexes
to the Montreal Proto-
col39
)
Records of
purchases of
relevant sub-
stances and
equipment
containing
them
1
Ambient concentrations
of gaseous pollutants (as
above) in the surround-
ings of production sites
Measurement
(or recent re-
cords)
1
List and efficacy rating of
measures implemented
for reducing emissions
of ammonia, CO, NOx,
SOx, photochemical oxi-
dants, particulate mat-
ter, pesticides, microor-
ganisms
Records of
purchases of
relevant mate-
rials (see left)
5
List and efficacy rating of
measures implemented
for reducing emissions
of ozone-depleting sub-
tances
Documentation
of measures
(plan)
5
39
http://ozone.unep.org/new_site/en/Treaties/treaty_text.php?treatyID=2

56
5.7 Freshwater (E2)
Relevance of the subject
Freshwater is essential to support all forms of life, as well as food production. Global issues of health,
poverty, deforestation, desertification and land use change are all directly associated with water re-
sources and their management. A fifth of the world’s population, more than 1.2 billion people, live in
areas of physical water scarcity (IWMI, 2007). With population increase and economic growth, it is
estimated that 2/3 of world population will live in water-stressed areas by 2025. Low- to medium-
income countries with high rates of population growth are particularly affected by environmental
stress and socio-economic tension, resulting from water supply’s being outstripped by demand (FAO,
2011). Of the 3900 km3 per year of freshwater withdrawn by humankind, 70% are used by agricul-
ture. Irrigated land largely contributes to food security. Worldwide irrigated area has increased by
117% from 1961 until 2009. A further increase of irrigated area, from 301 million hectares in 2009 to
318 million hectares in 2050 has been projected (FAO, 2011). With agricultural water use being com-
paratively low-profit, water availability to agriculture is a constraint especially in areas with a high
intensity of water use or inadequate management of water resources (FAO, 2011). The increase of
sealed surfaces aggravates the difficulty of maintaining well-balanced water cycles. Surface sealing,
not only in urbanised areas but also through the compaction of arable soils by heavy machinery, re-
duces soil infiltration capacity, resulting in surface runoff, soil erosion and floods.
Freshwater quality is as important as sufficient water quantities. It is impaired by industrial waste
and sewage pollution, intensive agrochemical use, saltwater intrusion and soil erosion. High nitrate
levels in freshwater threaten human health and cause algal growth and eutrophication. Pollution
with heavy metals, toxic xenobiotics, pathogens and other substances can impair the health of hu-
mans and ecosystems. Drinking water polluted with pathogens is a source of infectious disease, said
to claim 6 000 human lives each day (UNESCO, 2003). About 20% of the world’s irrigated land is salt-
affected, and salt water intrusion is of particular concern to arid and semi-arid regions and small is-
land states. Inappropriate agricultural water use can pollute waterways or cause secondary soil
salinisation. The latter problem affects large tracts of land, in areas already affected by land and wa-
ter scarcity (FAO, 2011). Agriculture is not only a non-point polluter of water, but also an important
point source polluter: 70% of the pesticide pollution in surface waters is estimated to originate from
point sources. Irrigation with insufficiently treated wastewater is a cause of infections by intestinal
worms and bacteria and of diarrhea (Blumenthal & Peasey, 2002).
Chapter 18 of Agenda 21 calls for safeguarding an appropriate supply of good quality water for the
entire population of the planet, while maintaining the hydrological, biological and chemical functions
of ecosystems (UN, 1992). Millennium Development Goal 7 includes target 7.C, “halve, by 2015, the
proportion of people without sustainable access to safe drinking water and basic sanitation”40. The
WHO has issued guidelines for drinking water quality, as well as for the safe use of wastewater, ex-
creta and greywater41. This is complemented by national laws, and international regulations, such as
the Nitrates Directive of the EU42.
40
www.mdgmonitor.org/goal7.cfm 41
www.who.int/water_sanitation_health/publications/2011/dwq_guidelines/en/index.html 42
http://ec.europa.eu/environment/pubs/pdf/factsheets/nitrates.pdf

57
Sustainability goal
Freshwater withdrawal and use do not hinder the functioning of natural water cycles and ecosystems
nor contribute to water pollution that would impair the health of human and animal communities.
Sub-themes and indicators
Theme Sub-
Themes Description
Indicators
What is being
measured? Data source Type43
E2
Fresh-
water
E2.1 Water
quantity
Surface water man-
agement (avoidance
of surface sealing
and deforestation)
and freshwater
withdrawal for oper-
ations do not con-
tribute to impairing
the functioning of
natural water cycles,
ecosystems and
human communi-
ties.
Total freshwater use
from all sources (tap
water, rivers, wells,
communal grid etc.;
in m3)
Records of water con-
sumption 1
Ratio of water with-
drawal to recharge
Records of water con-
sumption and local hydro-
logical data
1
Number of water-
related disputes (law-
suits, social unrest,
substantial and last-
ing dissonance)
Interview with concerned
personnel, stakeholder
survey
1
Number, intensity
and duration of dis-
turbances and disrup-
tions of production
due to lack of water
Internal documentation,
interview with concerned
personnel
1
Rating of irrigation
technologies and
their application (tim-
ing, installation etc.)
Documentation/inspection
of irrigation equipment 3
Hygienically safe wa-
ter re-use (including
water from rainwater
harvesting) and recy-
cling (in m3 or in % of
total water or treated
wastewater volume)
Records of water con-
sumption and or water re-
use and recycling
1
Water productivity,
expressed in unit of
product, or value of
output (including
services) per unit of
water supply (cubic
metre)
Records of water con-
sumption and of produc-
tion volumes
1
43
1: quantitative, absolute, performance; 3: qualitative, absolute, performance; 5: measures, absolute; (re. Table
2).

58
E2.2 Water
quality
Operations cause no
pollution of water
that would threaten
the health of hu-
mans or ecosystems.
Water quality in
groundwater and
open water on and
close to production
sites (downstream):
NO3, PO4, salts, faecal
coliforms, plant pro-
tection products;
BOD, COD (in ppm,
dS/m, l of O2 per l of
water etc.)
Measurements (or recent
records) 1
Rating of pollution
risk from excreta and
silage: safety of stor-
age facilities, prox-
imity to nearest wa-
ter body (precision
and efficiency of ap-
plication technology,
timing and conditions
during application)
Documentation/inspection
of storage facilities 5
Amount of pesticides
used that can have
detrimental effects
on aquatic ecosys-
tems (also consider
metabolites). If possi-
ble, rate the quality
of pesticide applica-
tion.
Records of pesticide use 1
Rating of pollution:
number of spills, vol-
umes discharged,
pollutant load of dis-
charged water
Interview with concerned
personnel, data of public
administration
3
Rating of wastewater
treatment procedures
by standard effluent
quality
Documentation/inspection
of treatment procedures 5

59
5.8 Land (E3)
Relevance of the subject
Healthy soils are the basis of virtually all life and also of rural lifestyles. Humans use soils to grow
food and fodder crops, renewable raw materials and energy. Soils provide ecosystem services includ-
ing water purification, nutrient cycling, carbon storage and buffer, filter and habitat functions. Due to
expanding human requirements, fertile land, suitable for primary production of biomass, is a scarce
resource. The magnitude of land cover change threatens the stability and resilience of ecosystems,
inter alia through its impacts on global warming. Soil health (fertility) is determined by several fac-
tors, including soil reaction (pH), soil texture and structure, cation exchange capacity, soil organic
matter content and quality, and the presence of soil organisms or biota. These in turn are the result
of factor combinations, and all interact with geology, climate, vegetation, landform and soil man-
agement.
Agriculture and forestry play a pivotal role in sustainable land use, as it occupies one third of terres-
trial surface, with forests occupying another third. Natural fertile soils can hardly be increased, but
can easily be destroyed (World Soil Charter, 1981). While the world’s cultivated area has grown by
12% from 1961 until 2009, it decreased from more than 0.4 ha to 0.25 ha (0.17 ha in low-income
countries) per capita in the same period. Given the limited availability of original fertile soils, more
than 80% of the required growth of agricultural production until 2050 will have to come from yield
enhancement on currently cultivated soils (FAO, 2011).
Maintaining and rehabilitating soil health is an absolute imperative. Yet land degradation occurs on
about 2 billion hectares, including 30% of irrigated and 40% of rainfed agricultural area, and 70% of
rangelands (ECOSOC, 2000). The most important processes (in terms of area) are water erosion, wind
erosion, salinisation, compaction and chemical pollution (Oldeman et al., 1991; MEA, 2005). Surface
sealing, soil nutrient depletion, acidification, compaction and the formation or salt or metal oxide
crusts are further problems. Land degradation causes off-site damages, such as sedimentation and
eutrophication of rivers, estuaries and ocean regions, dust emissions, floods and emissions of green-
house gases like N2O (MEA, 2005; van der Ploeg et al., 2006). It is caused by population pressure, un-
suitable land allocation, inappropriate farming and grazing practices and lack or misuse of appropri-
ate technologies.
Desertification was identified as one of the greatest challenges to sustainable development during
the Earth Summit in 1992. With a view to reverse and prevent desertification, the United Nations
Convention to Combat Desertification (UNCCD) was established in 199444. Chapter 10 of Agenda 21
provides a basis for sustainable soil use. In Chapter 14, a holistic approach to using an integrated,
ecosystem-based management is advocated to achieve sustainable land management (UN, 1992).
Soil protection is addressed by the 1982 World Soil Charter45, which is based upon the European Soil
Charter of 1972. At the national level, the sustainable utilisation of soils often is subject to laws on
environment protection and on agriculture.
Sustainability goal
No land is lost due to surface sealing or mismanagement of arable lands and pastures, and soil fertil-
ity is preserved or enhanced.
44
www.unccd.int 45
www.fao.org/docrep/T0389E/T0389E0b.htm

60
Sub-themes and indicators
Theme Sub-Themes Description
Indicators
What is being
measured? Data source Type46
E3. Land
E3.1 Organic
matter
Content (at least 1% of
organic matter in the
topsoil) and quality of
soil organic matter
provide the best condi-
tions for plant growth
and soil health.
Percentage of land
where soil organic mat-
ter in the topsoil ex-
ceeds 1%.
Measurement (or
recent records) 1
E3.2 Physical
structure
Bulk density and ag-
gregate stability pro-
vide the best condi-
tions for plant growth
and soil life that are
achievable under the
given soil and climate
conditions.
Percentage of land
where infiltration rate
is between 10 and 20
mm of water per hour
Measurement (or
recent records) 1
E3.3 Chemical
quality
Contents of plant nu-
trients in the soil and
soil pH provide the
best conditions for
plant growth and soil
life that are achievable
under the given soil
and climate conditions;
neither chemical nor
biological soil pollution
occurs.
Plant-available N, P and
K content in the root
zone
Measurements (or
recent records) 1
Ratio of nutrient (N, P.
K) supply to demand, at
farm or parcel level
Records of live-
stock and crop
production, fertil-
iser imports and
exports
1
Percentage of crop and
livestock nutrient (N, P,
K) demand covered
from farm sources
Records of live-
stock and crop
production, fertil-
iser imports and
exports
1
Percentage of land
where pH in the root
zone is between 5.5
and 7.0
Measurements (or
recent records) 1
E3.4 Land deg-
radation and
desertification
No soil is lost through
sealing, degraded land
is rehabilitated and soil
erosion is controlled at
a minimum level that
must not exceed 10
tons per ha and year.
Percentage of land
where soil erosion is
below 10 tons per hec-
tare and year AND indi-
cator marked with “*”
Risk assessment
e.g. based on the
Revised Universal
Soil Loss Equation
1
Net loss or gain of pro-
ductive land surface
(area where productiv-
ity was restored minus
Interview (con-
cerned personnel),
remote sensing,
1
46
1: quantitative, absolute, performance (re. Table 2).

61
area lost due to degra-
dation or sealing) (*).
visual inspection
Percentage of area used
for growing any ingre-
dient for a product,
where natural habitat
was destroyed during
the last ten years AND
indicator marked with
“*”.
Interview (con-
cerned personnel),
remote sensing,
land use map
1
Percentage of utilised
areas where effective
soil conservation or
rehabilitation measures
are in place AND indica-
tor marked with “*”
Interview (con-
cerned personnel),
remote sensing,
land use map
1

62
5.9 Biodiversity (E4)
Relevance of the subject
Biodiversity is the diversity of ecosystems, of species in these ecosystems and of the genome within
these species. Its preservation is essential for humankind, not only because we utilise a great diversi-
ty of species but also because healthy ecosystems provide vital services like pollination, pest man-
agement, filter functions of soils and the regulation of nutrient cycles. In 1997, the global economic
value of ecosystem services was estimated at USD 16 to 54 trillion (Costanza et al., 1997); global GDP
then was USD 18 trillion. Measures for the protection of biodiversity and ecosystems pay off, return
on investment being estimated to exceed cost by a factor of 10 to 100 (TEEB, 2009).
Humans have altered ecosystems at unprecedented scales and intensity. As a result, biodiversity is
adversely affected by pollution, land degradation, habitat fragmentation and loss, introduction of
exotic species, climate change and natural disasters. Consequences include a loss of species and an
impairment of ecosystem services (Pimm & Raven, 2000; MEA, 2005). In many ecosystems, the loss
of diversity is associated with reduced adaptive capability and resilience (CBD, 2010). The production
of genetically modified crops over large areas is increasingly associated with resistance by weeds to
glyphosate (UNEP, 2011), thus compromising the resilience of GM-based production systems.
Agricultural biodiversity encompasses the variety and variability of animals, plants and microorga-
nisms which are necessary to sustain the functions of the agro-ecosystem, its structure and processes
for, and in support of, food production and food security. Agriculture, forestry and fisheries dispose
of powerful levers to influence biodiversity, such as the allocation of areas to different uses, the
choice of species, varieties and breeds, fertilisation, harvesting etc. In agricultural landscapes, biodi-
versity depends on the landscape’s richness in biological structures and on the intensity of farming.
Networks of ecological infrastructures, including spacious protected areas and smaller stepping-
stone and corridor habitats, should pervade landscapes (Fischer et al., 2001; Boller et al., 2004).
A rich diversity is the foundation for sustainable production; yet most people depend on just 14
mammal and bird species for 90% of their food supply from animals. In industrialised societies,
wheat, maize, rice and potato alone provide half of the food calories derived from plants. As regards
fisheries, 32% of marine fish stocks were overexploited, depleted or recovering by 2008, 50% of
stocks were fully exploited, meaning there is no possibility to sustainably expand catches. The over-
use of fish resources endangers livelihoods, especially for small-scale fishers in developing countries
(FAO, 2010b). The situation in forestry is alarming, too. Net forest area declines by 5.2 million hec-
tares per year (FAO, 2010c).
To protect biodiversity, the Convention on Biodiversity (CBD) was adopted in 1992. In 2010, it was
complemented by the Aichi Biodiversity Targets47, which demand that at least 17% of terrestrial and
inland water and 10% of coastal and marine areas be conserved. Further biodiversity-related global
agreements include the Convention on International Trade in Endangered Species of Wild Fauna and
Flora (CITES), the Bonn Convention on Migratory Birds (CMB), the Cartagena Protocol on Biosafety,
the Marine Mammal Action Plan (MMAP), the UN Forum on Forests (UNFF)48 and the Nagoya Proto-
col on Access and Benefit-Sharing49.
47
www.cbd.int/sp/target 48
www.unep.org/dec/links/biodiversity.html 49
www.cbd.int/abs

63
Sustainability goal
The areas under agriculture, aquaculture and forestry are managed sustainably, ensuring conserva-
tion of all forms of biodiversity.
Sub-themes and indicators
Theme Sub-Themes Description
Indicators
What is being
measured? Data source Type50
E4.
Biodiversity
E4.1 Habitat
diversity and
connectivity
The diversity of
natural habitat is
conserved and cor-
ridors between
natural habitats are
maintained
Number of habitat
types51
within
sphere of influence
and presence of
biodiversity corri-
dors between the
natural habitats
Documentation/inspection
of habitats 1
E4.2 Ecosys-
tem integrity
Operations contrib-
ute to the achieve-
ment of the Aichi
conservation tar-
gets (17% of terres-
trial and inland
water, 10% of
coastal and marine
areas) and do not
threaten ecosys-
tem.
Percentage of total
area where natural
or near-natural
ecosystems and
habitats are pro-
tected from hu-
man interventions
Documentation (internal
or of public administra-
tion)
1
Net deforestation
(in ha) due to the
activities and share
of primary forest
damaged
Interview (concerned per-
sonnel), remote sensing,
maps and statistics of land
use
1
E4.3 Wild
biodiversity
The diversity of wild
species (from all
biological taxa) and
wild populations
are not impaired by
the activities.
Amount of toxic
substances used
for plant protec-
tion, livestock
treatments, clean-
ing etc., total or
per hectare
Records of pesticide pur-
chases and use 1
Number of inci-
dences of intro-
duction of poten-
tially invasive spe-
cies
Documentation (internal,
public administration,
nature protection organi-
sations, stakeholders)
1
Trends in catch per
unit effort Fishing operation reports
Percentage of util-
ised area and
stocks with certi-
fied organic or
Certification 1
50
1: quantitative, absolute, performance; 3: qualitative, absolute, performance; 5: measures, absolute;. (re. Table 2). 51
Example classification of habitat types: http://eunis.eea.europa.eu/habitats-code-browser.jsp

64
integrated produc-
tion
E4.4 Agricul-
tural biodi-
versity
The diversity of
used species and
their genome (crop
varieties, livestock
breeds, fish species)
is at the optimum
level achievable
under the given
conditions.
Percentage of util-
ised area where a
single plant species
is grown, without
rotation or per-
centage of the
livestock by breed
Records of crop produc-
tion,forest stands and
livestock
1
Existence of a writ-
ten policy promot-
ing the purchase of
wood products
from known, un-
controversial
sources audited on
their sustainable
forestry plan
Code of Conduct or specif-
ic protocol 3
Percentage of
wood-based mate-
rials (paper, cork,
wood) contained in
products, packages
and facilities that
come from certi-
fied sources (e.g.
FSC, PEFC) or were
recycled
Records of purchases of
wood-based materials
(diaggregated by source),
interview (procurement)
1
E4.5 Threat-
ened species
Operations contrib-
ute to the protec-
tion of threatened
and vulnerable
species and popula-
tions, both used
and wild.
Substantiality of
measures taken to
improve state of
threatened wild
species and trend
of their population
Inspection and IUCN Red
List 5
Number of wild
species and do-
mesticated plant
varieties and ani-
mal breeds recog-
nised as deserving
protection (e.g.
under national
programs) and
their population
trend with the
sphere of influence
Records of crop varieties
and livestock breeds and
IUCN red list
1
Existence of a writ-ten policy promot-ing the purchase of marine products from known, un-controversial sources
Code of Conduct or specif-
ic protocol 3

65
Percentage of ma-
rine-based prod-
ucts that come
from labelled
sources (e.g. MSC)
Records of purchases of
marine origin 1

66
5.10 Materials and energy (E5)
Relevance of the subject
The flows of materials into, within and out of the human economy have reached unprecedented lev-
els. Unsustainable consumption and production patterns fuel material consumption, energy use and
waste generation. For example, 30% of foods produced are not consumed, meaning the inputs made
to its production are wasted as well. To date, physical scarcity has not been a major constraint to the
global availability of most materials. But where recycling rates do not match demand, lower grade
ores and deposits (e.g. of rock phosphate and petrol) must be used. This requires growing inputs of
energy, labour and capital per unit output, causing a reversal of the long-term trend of falling re-
source prices. The large quantity of global waste poses great challenges with regard to recycling and
disposal. Improper transport of hazardous waste, especially its export to countries with insufficient
national regulations on waste treatment, poses serious threats to humans and ecosystems. Sustaina-
ble management of these flows is a key component of the green economy concept (UNEP, 2011),
which rests on the twin pillars of efficient resource utilisation and circular material flows (recycling
and reuse).
Nutrient losses from agriculture contribute to soil acidification, eutrophication of ecosystems, re-
duced biodiversity, health problems and global warming. Nitrogen (N) flows from terrestrial into
aquatic ecosystems have more than doubled compared to pre-industrial times (Vitousek et al., 1997).
N compounds (NO3, NH4, NOx) are very mobile and thus difficult to utilise in a targeted way and an
estimated 50% or less of the N applied to arable fields end up in crops (Crews & Peoples, 2004). Hu-
man actions have caused a fourfold increase of phosphorus (P) flows into the biosphere (MEA, 2005).
As this non-renewable resource is essential to all forms of life, avoiding physical or economic scarcity
of P is crucial. High-grade phosphate ores may be depleted much earlier and cause P scarcity to be-
come a critical geopolitical issue. Unproductive nutrient and energy losses can be minimised by op-
timising timing and rates of application of fertilisers, and implementing improved storage and recy-
cling technologies. Minimising post-harvest losses of produce is important for this as well.
Statistically recorded global energy use was 76.4 GJ per year and person in 2008 (IEA, 2009), a figure
projected to continue rising for decades. While demand for oil may outstrip supply soon, foreseeable
bottlenecks for natural gas and coal will not be related with geological availability (BGR, 2006), but
rather with rising prices and the capacity of the atmosphere to serve as a sink for CO2 released from
burning these fuels (see “Atmosphere”). Challenges to sustainable energy use include geological (lim-
ited stocks of fossil fuels), biological (limited productivity of vegetation), economic (cost of renewa-
bles) and social (limited acceptance of renewables) limitations. For a sustainable energy future, “a
global revolution” of energy supply and use is required, centered on efficient and clean energy tech-
nologies (OECD/IEA, 2008). The primary sector can raise its energy efficiency e.g. by optimising the
heating and cooling, ventilation, tillage, synthetic fertiliser use and irrigation. Primary producers can
be providers of biogas, firewood, biofuels, solar energy and wind and water power.
The Basel Convention on the Control of Transboundary Movements of Hazardous Wastes and Their
Disposal (UNEP, 1992) regulates waste exports, requiring informed consent about the nature of the
waste. While the convention recognises the urgency of the problem, an adequate international regu-
latory framework has not yet been established (UNDP, 2011). Energy efficiency and renewable ener-
gy supply are internationally accepted and feature prominently in national targets. The UNFCCC per-
tains to climate change (see “Atmosphere”), but has implications for energy use, too.

67
Sustainability goal
Damage to ecosystems and resource scarcity resulting from non-renewable material extraction, non-
renewable energy use and waste disposal are minimised through economical and efficient use, con-
sequent re-use and recycling, and safe disposal.
Sub-themes and indicators
Theme Sub-Themes Description
Indicators
What is being meas-
ured? Data source Type52
E5.
Materials
and en-
ergy
E5.1 Non-
renewable
resources
Operations cause
only minimal nega-
tive environmental,
social and economic
impact resulting from
the extraction of non-
renewable materials.
Percentage of total material
use (raw materials, associ-
ated process materials,
semi-manufactured goods)
made up of materials that
are rare (static range of few
decades) and cannot be
substituted
Records of ma-
terial purchases
and use
1
Total non-renewable mate-
rial use per unit produced
(by weight, volume, value
etc.)
Records of ma-
terial purchases
and use and of
production
volumes
1
E5.2 Energy
supply
Whenever possible,
the energy used in
operations is entirely
based on renewable
energy sources and
carriers.
Energy efficiency: amount of
final energy (in MJ) used per
unit of produce / revenue /
area / workforce. Calculate
from quantities of energy
carriers and energy densi-
ties, correct by energy ex-
ports and imports (e.g. con-
tractual work in agriculture).
Records of en-
ergy use and of
production
volumes, data-
bases with en-
ergy densities
1
Percentage of renewable
energy sources in total en-
ergy use
Records of en-
ergy use, by
energy source
1
E5.3 Eco-
efficiency
Recycling rates are at
the maximum, and
unproductive losses
of produce and en-
ergy, as well as waste
generation are at the
minimum achievable
given the existing
technology.
Percentage of total material
use that is made up of recy-
cled materials AND indicator
marked with “*”.
Records of total
material pur-
chases and use
and of recycled
material use
(may have to be
checked with
these materials’
suppliers)
1
Total amount of annual
waste (units volume or
weight) by category: hazard-
ous / non-hazardous and
Records of type
and quantities
of wastes
1
52
1: quantitative, absolute, performance; 5: measures, absolute (re. Table 2).

68
trend of waste avoidance
(*).
Total amount of waste and
of hazardous waste gener-
ated per unit produced and
trend of waste avoidance
Records of
waste quanti-
ties
1
Percentage of lost or wasted
food in relation to total
amount of food produced
and marketed
Records of food
waste, re-use
and recycling
1
E5.4 Waste
disposal
All wastes are dis-
posed of in a way
that does not pose
the health of ecosys-
tems, animals, plants
or humans at risk.
Percentage of total waste
segregated
Records of type
and quantities
of wastes
1
Share of disposal methods in
disposed waste (reuse/ recy-
cling/composting/ recovery/
burn/ deep well injec-
tion/landfill/export)
Records of type
and quantities
of wastes, by
way of disposal
1
Yearly amount of treated
waste classified as “hazard-
ous” by the Basel Conven-
tion, Annexes I through IV
Documentation
(internal or
public admini-
stration)
1
Amount of hazardous waste
stored and average age of
waste and compliance with
international standards53
.
Documentation,
inspection 1
53
http://www.fao.org/agriculture/crops/obsolete-pesticides/resources0/

69
5.11 Animal welfare (E6)
Relevance of the subject
Animals play a role in most agricultural production systems, in fisheries and in aquaculture. Globally,
1.5 billion cattle and buffalos, 2 billion sheep and goats, 0.9 billion pigs and 18.4 billion chicken were
kept in 2008 (FAOSTAT, 2010). In the savannas of the Sahel, the steppes of Central Asia and the al-
pine meadows, pasture management is the only option for agricultural land use. Permanent grass-
land covers 69% of the global agricultural area, (2009 figure; FAOSTAT, 2012) and livestock produc-
tion accounts for 40% of global agricultural production (FAO, 2006a). It thus, however, also account
for much of agriculture’s ecological impact. Some 20% of all pasture areas are affected by land deg-
radation. Livestock production is a major source of ammonia and methane emissions. Methane ac-
counts for about 14% of global GHG emissions (IPCC, 2007) and 2/3 of the emitted methane stems
from enteric fermentation of ruminants and manure management (see “Atmosphere”).
Livestock production under conditions inappropriate for animal welfare and health is a major con-
cern across production systems and geographical regions. Common problems include overstocking,
reliance on unadapted breeds, excessive or inadequate use of veterinary medicines, lack of space,
light, clean water and adequate fodder, and cruel treatment. Where animal husbandry systems are
not conducive to animal health, the excessive use of veterinary drugs is a potential ecological prob-
lem. Via animal excreta, these chemicals and their metabolites enter soils and water. The evolution
of pathogens resistant to antibiotics is a further risk (Boxall et al., 2003; Stoob et al., 2005; Helm-
holtz-Zentrum, 2007).
Ethical considerations are a major reason to take care of animal welfare. Being sentient creatures,
animals are respected in many cultures and protected by law in many countries. For agronomic rea-
sons as well, they have to be kept such that their well-being is ensured, meaning that animals must
be kept in an environmentally unproblematic and species-appropriate way. The latter encompasses
the “five freedoms“: freedom from hunger and thirst, from discomfort, from pain and disease, from
constraints to natural behavior, and from fear and distress (FAWC, 1979).
While animal welfare is protected, and the cruel treatment of animals prohibited, by national laws of
many countries, only proposals exist for international agreements, such as the “Universal Declaration
of Animal Welfare”. Animal welfare provisions also emanate from regulations of the EU.
Sustainability goal
Animals are kept such that they can express their natural behaviour and are free from hunger, thirst,
discomfort, pain, disease and other distress.
Sub-themes and indicators

70
Theme Sub-Themes Description
Indicators
What is being
measured? Data source Type54
E6.
Animal
welfare
E6.1 Freedom
from stress
Animals are kept free
from hunger and thirst,
discomfort, pain, injury
and disease, fear and
distress.
Assessment of housing
conditions, body condi-
tion and behaviour of
animals (e.g. based on
Welfare Quality55
proto-
cols)
Inspection
using standard
protocols
5
Assessment of lighting,
aeration, noise, space,
hygiene and water sup-
ply; signs of stress
Inspection
using standard
protocols
3
Assessment of condi-
tions and distances of
transportation to slaugh-
terhouses and methods
of killing
Inspection
using standard
protocols
3
Incidence of animals
affected by illnesses or
injuries, and animals lost
prematurely due to dis-
eases, injuries and acci-
dents (including during
transport to slaughter-
house)
Livestock-
related re-
cords
1
Annual cost of veterinary
treatments or amounts
of veterinary medicines,
including those used
prophylactically, cura-
tively and to boost per-
formance.
Records of
veterinary
treatments
1
Percentage of animals
subject to tail docking,
beak clipping etc. with-
out use of analgesics or
anaesthetics
Inspection or
livestock-
related re-
cords
1
E6.2 Species-
appropriate
conditions
Animals are free to
express their natural
behaviour.
Assessment of possibili-
ties for animals to ex-
press normal behaviour
(space, bedding, contact
with conspecifics, etc.)
Inspection
using standard
protocols
5
54
1: quantitative, absolute, performance; 3: qualitative, absolute, performance; 5: measures, absolute; (re. Table 2). 55
www.welfarequality.net

71
5.12 Investment (C1)
Relevance of the subject
Investment is an important factor in sustainable development. Improved production and marketing
and transfer of financial resources and knowledge are critical to ensure that economic growth leads
to social development, while preserving or enhancing the natural resource base. Decisions about
how and where to invest reflect the strategic direction of the enterprise. In SAFA, the term ‘invest-
ment’ is seen from a microeconomic perspective, i.e. it is putting money into something, such as
capital goods, human resources or ecosystems, with a view to gain. Financial speculation, another
form of investment, today has an enormous importance for the economy, including in the food and
agriculture sector. As no enterprise operates in isolation from the surrounding community and eco-
systems, the scope of SAFA is extended for this theme to cover investments into sustainable devel-
opment at the community level. Furthermore, investment in value chain development must be con-
sidered as well, since sustainable value chains require coordinated investment by actors along the
chain, with private enterprises having a key role in investing in improved logistics, transportation,
post harvest treatment, storage facilities etc. Investment that is solely aimed at public relations
(branding, advertisements etc.) does not fall into the scope of this theme.
Sustainable investment aims at supporting a development of the enterprise towards enhanced social,
environmental, economic and governance performance. Such investment can for example take the
form of research and development expenditures, development and/or acquisition of equipment that
reduces polluting emissions to the environment, measures or technologies that enhance buffering
capacity against any kind of shocks (e.g. build-up of soil organic matter to better withstand drought
spells), and measures directed at capacity building or creating awareness of sustainability in the or-
ganisation. Some investment into sustainability may have been done under different titles in the
past, for example “lean manufacturing”, or “eco-efficiency”. A survey by MIT Sloan Management Re-
view and The Boston Consulting Group revealed that “a growing number of companies are now in-
creasing their investments in sustainability“; 59% of respondents said they had increased their com-
mitment to sustainability from 2009 to 2010. As benefits, improved brand reputation (49%), reduced
costs due to energy efficiency (28%) and increased competitive advantage (26%) were most fre-
quently cited (Haanaes et al., 2011).
Investment in the agriculture and food sector includes investment into agricultural and agro-
ecological research, agricultural training, the improvement and utilisation of neglected and underutil-
ised crops, and smallholder agriculture (IAASTD, 2009). On the other hand, problematic investment
exists in the sector, with international investment in land being one controversely discussed issue
(HLPE, 2011). Furthermore, speculation on grains may have been one of the reasons of the 2007-08
price hikes of agricultural commodities, which had detrimental impacts on food security (IFPRI,
2009).
Guidance on sustainable investment is provided through the UN Principles for Responsible Invest-
ment56. A discussion note issued in 2010 by FAO, IFAD, UNCTAD and the World Bank Group stipulates
Principles for Responsible Agricultural Investment that Respects Rights, Livelihoods and Resources57.
56
www.unpri.org 57
http://siteresources.worldbank.org/INTARD/214574-1111138388661/22453321/Principles_Extended.pdf
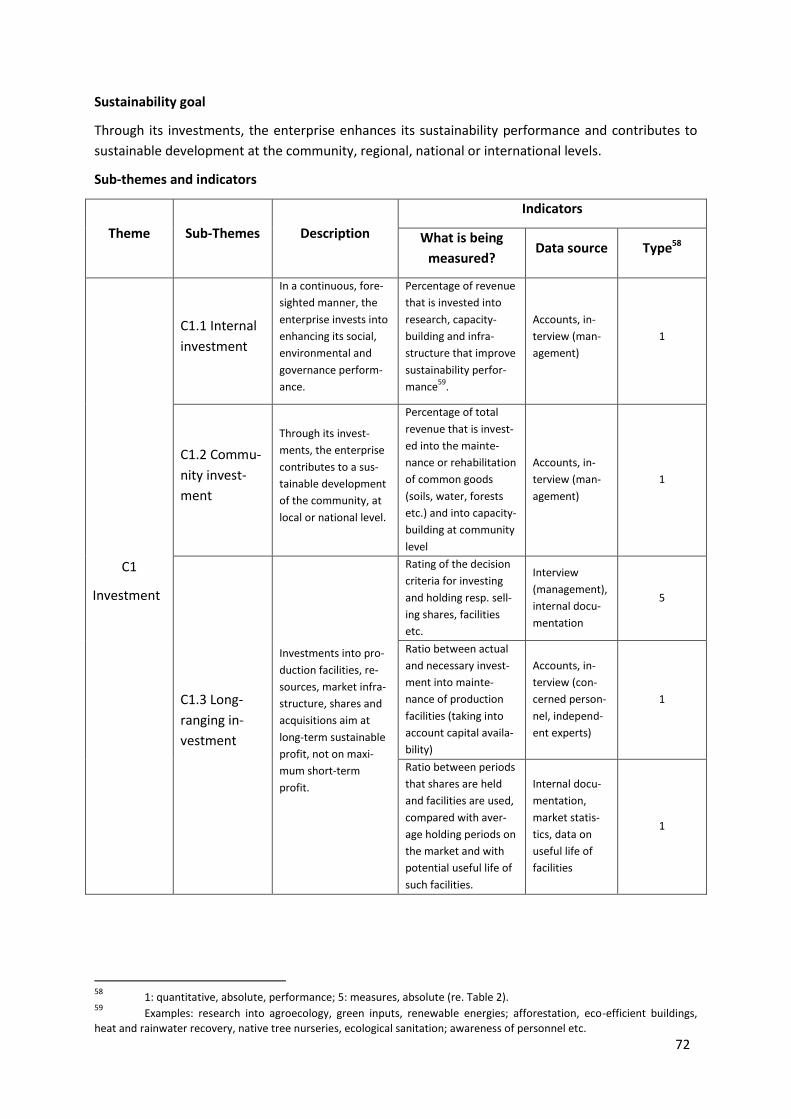
72
Sustainability goal
Through its investments, the enterprise enhances its sustainability performance and contributes to
sustainable development at the community, regional, national or international levels.
Sub-themes and indicators
Theme Sub-Themes Description
Indicators
What is being
measured? Data source Type58
C1
Investment
C1.1 Internal
investment
In a continuous, fore-
sighted manner, the
enterprise invests into
enhancing its social,
environmental and
governance perform-
ance.
Percentage of revenue
that is invested into
research, capacity-
building and infra-
structure that improve
sustainability perfor-
mance59
.
Accounts, in-
terview (man-
agement)
1
C1.2 Commu-
nity invest-
ment
Through its invest-
ments, the enterprise
contributes to a sus-
tainable development
of the community, at
local or national level.
Percentage of total
revenue that is invest-
ed into the mainte-
nance or rehabilitation
of common goods
(soils, water, forests
etc.) and into capacity-
building at community
level
Accounts, in-
terview (man-
agement)
1
C1.3 Long-
ranging in-
vestment
Investments into pro-
duction facilities, re-
sources, market infra-
structure, shares and
acquisitions aim at
long-term sustainable
profit, not on maxi-
mum short-term
profit.
Rating of the decision
criteria for investing
and holding resp. sell-
ing shares, facilities
etc.
Interview
(management),
internal docu-
mentation
5
Ratio between actual
and necessary invest-
ment into mainte-
nance of production
facilities (taking into
account capital availa-
bility)
Accounts, in-
terview (con-
cerned person-
nel, independ-
ent experts)
1
Ratio between periods
that shares are held
and facilities are used,
compared with aver-
age holding periods on
the market and with
potential useful life of
such facilities.
Internal docu-
mentation,
market statis-
tics, data on
useful life of
facilities
1
58
1: quantitative, absolute, performance; 5: measures, absolute (re. Table 2). 59
Examples: research into agroecology, green inputs, renewable energies; afforestation, eco-efficient buildings,
heat and rainwater recovery, native tree nurseries, ecological sanitation; awareness of personnel etc.

73
5.13 Vulnerability (C2)
Relevance of the subject
The vulnerability of enterprises, value chains and markets to the dynamics of natural and socio-
economic environments can be buffered and their resilience enhanced by building and maintaining
adaptive capacity. Building resilient social, economic and ecological systems is a key challenge on the
way to sustainable development (Folke et al., 2002).
Some lessons on factors and mechanisms affecting resilience may be drawn, with due caution, from
the study of ecosystems. The resilience and stability of ecosystems belonging to a variety of different
types was found to increase with species diversity in the system (McCann, 2000; see “Biodiversity”).
In economic systems, strong dependence on single suppliers and/or buyers due to a dominance of
one or few companies, or because only a single product is marketed, can reduce the resilience of the
enterprise. Factors that contribute to resilience include a diversity of suppliers of production factors
(including capital and labour), a diversity of income sources. Complementary to diversity, the dura-
tion and stability of business relationships are predictors of resilience. A stable long-term relationship
with the same contractor has proven a good means to buffer times of crisis, for example in value
chains of organic products. Striking a balance between the long-term goal of maintaining the diversi-
ty of production and marketing channels needed to maintain resilience on the one hand, and the
short-term drive to reduce unit costs through specialisation (i.e. reduce diversity) on the other, is a
major challenge. A third pillar of resilience is a sufficient buffering capacity, in the form of solvency,
stocks, and formal and informal insurance, with helps the enterprise withstand crises. Buffers are of a
social, environmental or economic nature, e.g. sufficient liquidity to withstand market turbulence,
formal and informal insurance and safety nets, sufficiently high soil organic matter content, water
and nutrient storage capacities etc.
Enterprises in the food and agriculture sector operate under very volatile conditions. Market dynam-
ics, political developments and technological progress tend to be unpredictable. In addition, the pri-
mary sector is particularly affected by intra- and inter-annual variations of temperature and rainfall,
by occurrences of extreme weather conditions and by outbreaks of pests and diseases. The globalisa-
tion and growth of markets, as well as climate change, enhance the uncertainty and volatility of eco-
nomic and environmental conditions (e.g. IPCC, 2007). These and other developments interact and
cause non-linear responses in human and natural systems, thus rendering it even more difficult to
anticipate future chances and risks. In most industrial agro-ecosystems, which rely on a very narrow
basis concerning species and genome, production can be disrupted if only one or few species sub-
stantially suffer e.g. from abiotic or biotic stress. While such agro-ecosystems mainly depend on the
availability of buffers in the form of energy (fuel), pesticides and financial liquidity, buffering capacity
can also be provided by soils with sufficient content and quality organic matter and a good water re-
tention capacity, by a diversity of utilised species, varieties and breeds, and by services provided by
intact natural ecosystems, e.g. biological pest control.
Vulnerability and resilience in agriculture and food systems are not internationally regulated. How-
ever, measures known to enhance resilience inter alia through increased diversity and buffer capac-
ity are defined in standards of organic (IFOAM, 2005) and integrated agriculture, as well as standards
for sustainable forestry (e.g. FSC, 1996), fisheries (MSC, 2010) and aquaculture60.
60
www.fao.org/focus/e/fisheries/sustaq.htm
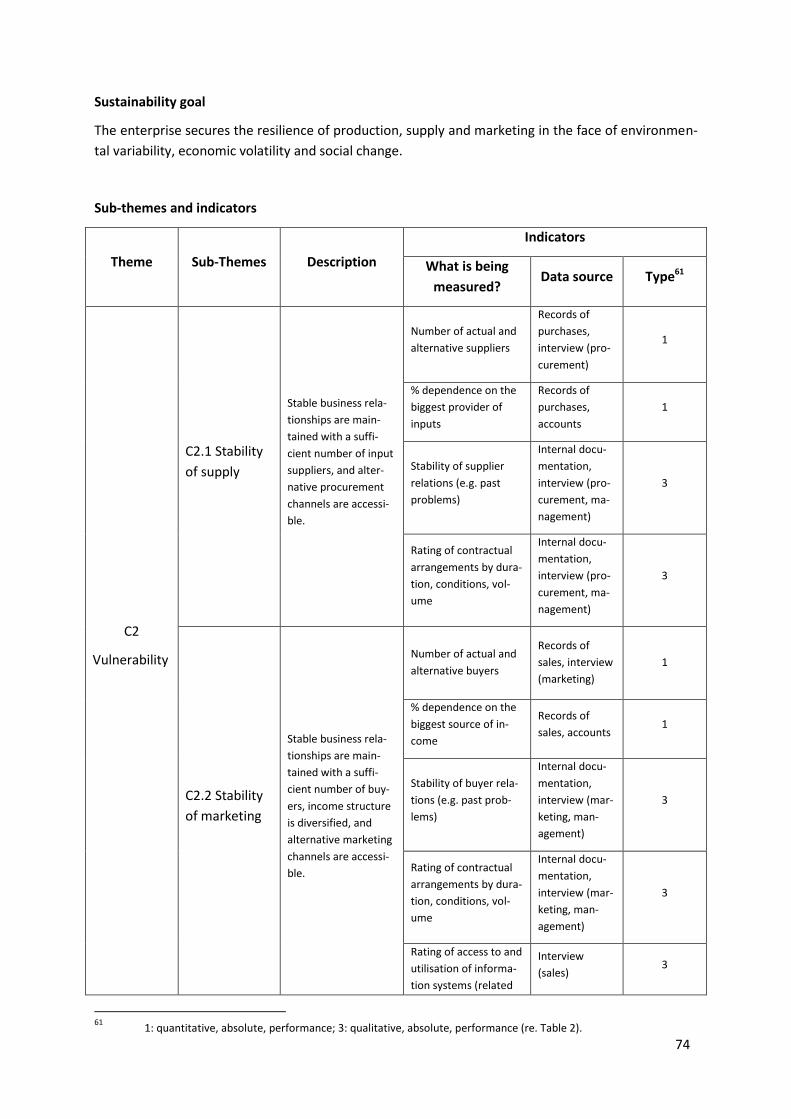
74
Sustainability goal
The enterprise secures the resilience of production, supply and marketing in the face of environmen-
tal variability, economic volatility and social change.
Sub-themes and indicators
Theme Sub-Themes Description
Indicators
What is being
measured? Data source Type61
C2
Vulnerability
C2.1 Stability
of supply
Stable business rela-
tionships are main-
tained with a suffi-
cient number of input
suppliers, and alter-
native procurement
channels are accessi-
ble.
Number of actual and
alternative suppliers
Records of
purchases,
interview (pro-
curement)
1
% dependence on the
biggest provider of
inputs
Records of
purchases,
accounts
1
Stability of supplier
relations (e.g. past
problems)
Internal docu-
mentation,
interview (pro-
curement, ma-
nagement)
3
Rating of contractual
arrangements by dura-
tion, conditions, vol-
ume
Internal docu-
mentation,
interview (pro-
curement, ma-
nagement)
3
C2.2 Stability
of marketing
Stable business rela-
tionships are main-
tained with a suffi-
cient number of buy-
ers, income structure
is diversified, and
alternative marketing
channels are accessi-
ble.
Number of actual and
alternative buyers
Records of
sales, interview
(marketing)
1
% dependence on the
biggest source of in-
come
Records of
sales, accounts 1
Stability of buyer rela-
tions (e.g. past prob-
lems)
Internal docu-
mentation,
interview (mar-
keting, man-
agement)
3
Rating of contractual
arrangements by dura-
tion, conditions, vol-
ume
Internal docu-
mentation,
interview (mar-
keting, man-
agement)
3
Rating of access to and
utilisation of informa-
tion systems (related
Interview
(sales) 3
61
1: quantitative, absolute, performance; 3: qualitative, absolute, performance (re. Table 2).

75
to markets and poli-
cies)
C2.3 Liquidity
and insurance
Financial liquidity,
access to credits and
insurance (formal and
informal) against eco-
nomic, environmental
and social risk enable
the enterprise to
withstand shortfalls in
payment.
Indebtedness (share of
debt in total assets) Accounts 1
Debt service coverage
ratio (% of short-term
debt service limit that
is utilised)
Accounts 1
Stability of lender rela-
tions (e.g. past prob-
lems)
Internal docu-
mentation,
interview (ac-
counting)
3
Existence of a formal
and informal safety
net that is sufficient to
withstand liquidity
crises
Interview
(management) 3
C2.4 Employ-
ment
Employment condi-
tions are stable (e.g.
legally recognised
contractual arrange-
ments).
Average duration from
announcement to
filling of positions
Internal docu-
mentation
(human re-
sources)
1
Fluctuation rate of
personnel (annual
percentage of total
personnel leaving the
enterprise)
Internal docu-
mentation
(human re-
sources)
1
Matching of job appli-
cant qualifications
with requirements
Internal docu-
mentation,
interview (hu-
man resources)
3
Percentage of person-
nel with legally recog-
nised, work contract of
unlimited duration
Employment
records 1
C2.5 Stability
of production
Production (quantity
and quality) is suffi-
ciently resilient to
withstand environ-
mental, social and
economic shocks.
Geographical distribu-
tion of production
sites in relation with
major production
risks62
Internal docu-
mentation,
maps and da-
tabases of cli-
mate risk (e.g.
re-insurances);
proxy: insur-
ance sums
3
Stability of production
(e.g. past interrup-
tions)
Records of
crop, livestock
etc. production
(multi-year)
3
62
Meaning environmental, political and socio-economic events that disrupt a large share of production at the af-
fected sites, and that are likely to occur within the lifecycle of the production facility, or the risk of whose occurrence has substantially inrease over the last years.

76
% dependence on a
single species or vari-
ety of crop, fish, tree,
livestock
Records of
crop, livestock
etc. production
1
Existence of stocks of
inputs, food etc. that
are sufficient to with-
stand crop shortfalls
and supply bottlenecks
Records of
stocks, inter-
view (manage-
ment, on short-
falls)
3
77
5.14 Product safety and quality (C3)
Relevance of the subject
All people have the right to expect the products they consume, in particular their food, to be safe
and suitable for consumption (FAO/WHO, 2003a). Likewise, producers, processors, retailers and con-
sumers have a right to be informed by their suppliers about all attributes of a product relevant for its
utilisation. As value chains have become more complex, the number of opportunities for contamina-
tion and other quality loss, and for deception concerning origins and quality have increased.
Food can easily be contaminated, for example, through environmental pollution of air, water and
soils, the intentional use of chemicals such as pesticides and animal drugs (Campbell, 1992), and
microbiological contamination and spoilage. Contaminants may also be present in food as a result of
the production, manufacture, processing, preparation, treatment, packing, packaging, transport or
holding of such food (CAC, 2011). Food quality and safety can be achieved through food quality and
safety management systems that are built on pre-requisite programmes, such as good agricultural
practices, good manufacturing practices, GHP’s and HACCP, and by controlling the flow of food in-
gredients and products along the entire food chain, as well as through traceability. Further measures
include the development of Codes of Practice to reduce contaminant levels in food, define maximum
levels of food additives and maximum residue levels of pesticides and veterinary drugs (WHO, 2009).
FAO and WHO, in an expert report released in 2003, presented scientific evidence on the relationship
of diet, nutrition and physical activity with the occurrence of chronic diseases. The WHO estimated
that more than 1.4 billion adults were overweight in 2008, 500 million of these being obese63. Often
persisting into adulthood, childhood obesity increases the risk of suffering from serious diseases.
Halting the global surge in chronic diseases requires strong linkages between those involved in health
and agriculture, at global, regional and national levels (FAO/WHO, 2003b). Improving the quality of
consumer information can improve understanding of the possible health effects of foods and stimu-
late changes in patterns of food choice that improve consumer health (European Advisory Service,
2004). Food advertising and marketing play an important role in encouraging unhealthy eating habits
in children (BHF, 2008).
The growing number of food safety problems and consumer concerns has prompted governments all
over the world to intensify their efforts to improve food safety (WHO, 2007). The Codex Alimen-
tarius64 is a collection of norms on food safety and product quality; it contains the recommendation
to adopt the HACCP concept. A further relevant standard is the Recommended International Code of
practice general principles of food hygiene (FAO/WHO, 2003a). Concerning the handling of food ad-
ditives, EU regulation 1333/2008 provides guidance and inter alia postulates that only additives that
are explicitly authorised may be used. Authorisation is grated only if the additive is technically neces-
sary, neither misleads consumers nor compromises their health (EC, 2008).
Sustainability goal
Any contamination of produce with potentially harmful substances is avoided, and nutritional quality
and traceability of all produce are clearly stated.
63
www.who.int/mediacentre/factsheets/fs311/en/index.html 64
www.codexalimentarius.net/web/index_en.jsp

78
Sub-themes and indicators
Theme Sub-Themes Description
Indicators
What is being meas-
ured? Data source Type65
C3
Product
safety
and qual-
ity
C3.1 Product
information
Products bear infor-
mation that is correct,
accessible, and by no
means misleading.
This information ena-
bles the subsequent
members of the food
chain to safely and
correctly handle,
store, process, pre-
pare and display the
product.
Percentage of compre-
hensively66
and correctly
labelled products in total
produced volume (or in
turnover or profit)
Records of
production (by
product, segre-
gated according
to quality of
labelling)
1
C3.2 Trace-
ability
Systems and proce-
dures ensure tracea-
bility over all stages of
production, processing
and distribution. The
lot or batch of a prod-
uct can be easily and
correctly identified
and recalled.
Percentage of stages of
production, processing
and distribution for which
traceability is guaranteed
and related sanctions
defined
Internal docu-
mentation,
documents
confirming
participation in
traceability-
related systems
1
C3.3 Food
safety
Any contamination of
food with potentially
harmful substances is
avoided. Food hazards
are systematically
controlled over the
entire process chain.
Number of production
facilities certified by an
independent party con-
cerning food safety man-
agement (e.g. HACCP,
Good Manufacturing
Practice)
Documents on
certification,
interview (qual-
ity manage-
ment)
1
Number of incidents of
chemical and biological
food contamination
(heavy metals, pesticides
and their metabolites,
mycotoxins, GMO)
Internal docu-
mentation,
records of pub-
lic or private
laboratories
1
C3.4 Food
quality
The quality of food
products meets the
highest nutritional
standards applicable
to the respective type
Percentage of food prod-
ucts that meet the high-
est nutritional standards,
e.g. low contents of satu-
rated and trans fat, added
sugars and added sodium,
Records of
production (or
sales): total and
“high-value”
volumes
1
65
1: quantitative, absolute, performance. (re. Table 2). 66
“Comprehensive“ means to provide at least the information required by Directive 2000/13/EC of the European Parliament and Council
(http://europa.eu/legislation_summaries/consumers/product_labelling_and_packaging/l21090_en.htm). Fur-
ther information deemed relevant by consumer organisations (e.g. on genetically modified organisms) should be provided, wherever possible.

79
of product. no food additives
Percentage of food prod-
ucts that achieve a high
rating in a nutritional
rating system, such as the
overall nutritional quality
index67
Internal docu-
mentation or
own rating,
information on
ingredients
1
Expenditures on adver-
tisement for children
under age 12 (except
healthy products) and in
primary schools
Records of
advertising
expenditures,
interview (in-
dependent
expert)
1
67
www.nuval.com/images/upload/file/ONQI Manual 5_5_09.pdf

80
5.15 Local economy (C4)
Relevance of the subject
In a sustainable economy, the region is not only a place to work, but one where incomes are also
spent and invested and where taxes are paid. Local economic development (LED) is a process in
which all sectors work together to stimulate local commercial activity. It has been considered a cor-
nerstone of sustainable development (UN Habitat, 2009). A sustainable local economy is diversified
and does not simply shift the costs of maintaining its good health onto other regions. LED can thus
reduce environmental pressures related to transportation of goods over large distances (Norberg-
Hodge & Gorelick, 2002). It adds as much value as possible in the region rather than just exporting
raw materials.
LED should foster employment, infrastructural development, as well as a high quality of life (OECD,
2010). Beyond economic growth, it is about providing opportunities for all to obtain decent work at
the local level. LED should be people-centered, promote participation and local social dialogue and
culture. It is meant to connect people and their resources for better employment and a higher quality
of life (ILO, 2012). It can contribute to a region’s becoming more resilient to turbulence in the global
economy, e.g. to fluctuating cereal prices on the world market (McInroy & Longlands, 2010). Rather
than opposing globalisation, LED strategies aim at strengthening local economies such that they ben-
efit from the exchange with other regions rather than becoming overly fragile and losing their func-
tionality. Localisation means to strike a balance between supra-regional trade and local production.
This can be achieved by diversifying economic activity and by shortening distances between produc-
ers and consumers (Norberg-Hodge & Gorelick, 2002). Regions, localities and cities around the world
are turning to LED strategies in response to the challenges of globalisation and the drive for decen-
tralisation. Labels testifying a product’s provenance from the region where it is sold (or from another
specified region) are increasingly becoming popular and motivate consumers to pay premium prices.
In rural areas, farming substantially contributes to LED through value and job creation and the crea-
tion and maintenance of infrastructure (FOAG, 2009). This is particularly relevant for a sustainable
development of these areas, as over the last 50 years, 800 million people have moved from rural ar-
eas to cities and to foreign countries (IFAD/FAO, 2008). This development often goes along with a
“brain drain”, i.e. a loss of competent, innovative workforce who could otherwise play a positive role
for the sustainable development of the region. The lack of investment in agriculture and rural areas,
not only by private investors, but also by goverments, is among the principal causes of rural poverty
and migration into cities (IFAD, 2007). This lack of investment has been identified as an underlying
cause of the recent food crisis and of the difficulties developing countries encountered in dealing
with it. Enterprises in the food and agriculture sector thus are in a particularly good position to con-
tribute to local economic development in those areas where local value creation is needed the most.
Reducing economic disparity between regions is a key objective in achieving balanced regional de-
velopment (WDC, 2007). For example the European Union, through the European Regional Develop-
ment Fund, tries to reduce the gap between the levels of development of the various regions by con-
tributing to balanced and sustainable development of economic activities, to a high degree of com-
petitiveness and a high level of employment, by supporting initiatives that foster the regional and
local economy (ERDF, 2010). In many countries, similar mechanisms exist at the national level.

81
Sustainability goal
Through production, employment, procurement, marketing and investments in infrastructure, the
enterprise contributes to sustainable local value creation.
Sub-themes and indicators
Theme Sub-Themes Description
Indicators
What is being
measured? Data source Type68
C4. Local
economy
C4.1 Value
creation
Operations substan-
tially benefit local
value creation through
employment at all
levels of qualification,
investment, marketing
and tax payments.
Ratio of lowest paid
wage to average re-
gional wage
Accounts,
payslips 1
Percentage of region-
ally hired workforce
and of new jobs cre-
ated in the region
Interview
(human re-
sources, per-
sonnel, man-
agement)
1
Ratio of value added
through operations (or
tax payments) to total
revenue (or profit)
Accounts 1
Percentage of total
revenue (or profit)
invested into the re-
gional economy
Accounts 1
Percentage of turnover
(or profit) coming from
short resp. local value
chains
Accounts (dis-
aggregated
according to
type of chain),
interview
(management)
1
C4.2 Local pro-
curement
Operations substan-
tially benefit local
value creation through
procurement from
local suppliers.
Percentage of inputs
procured from the
region (not for inputs
that are not regionally
available)
Records of
purchases,
interview
(procurement)
1
68
1: quantitative, absolute, performance (re. Table 2).
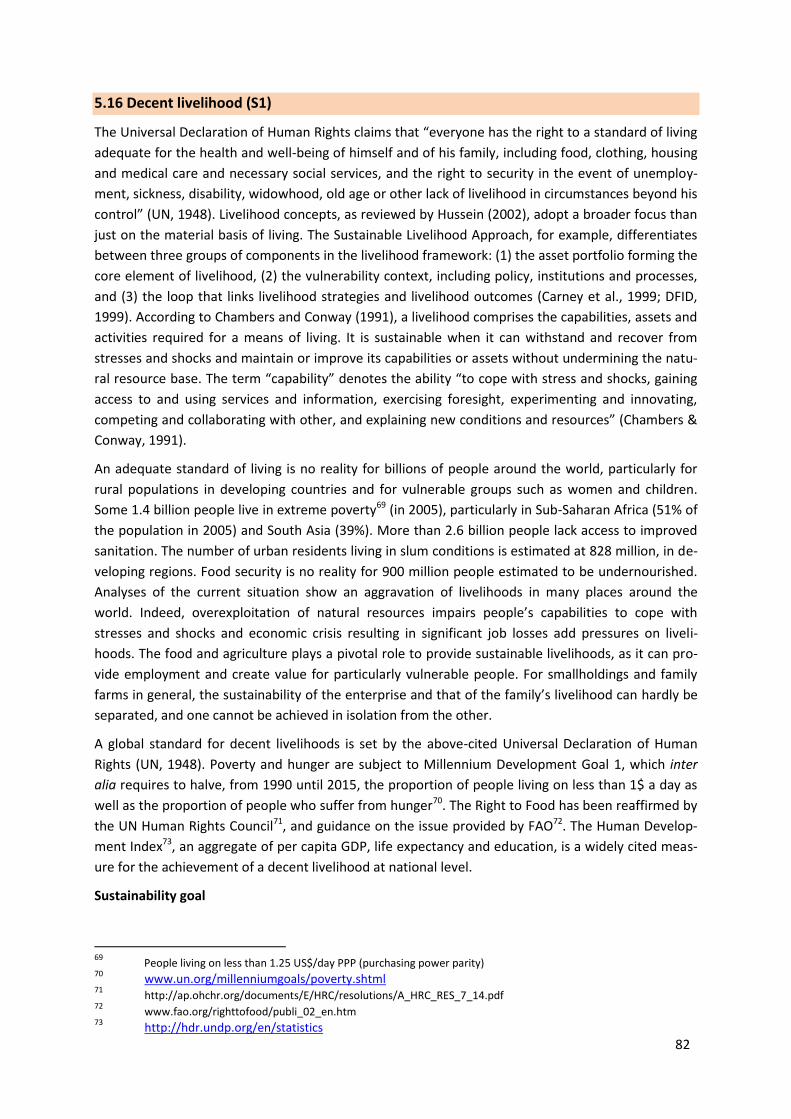
82
5.16 Decent livelihood (S1)
The Universal Declaration of Human Rights claims that “everyone has the right to a standard of living
adequate for the health and well-being of himself and of his family, including food, clothing, housing
and medical care and necessary social services, and the right to security in the event of unemploy-
ment, sickness, disability, widowhood, old age or other lack of livelihood in circumstances beyond his
control” (UN, 1948). Livelihood concepts, as reviewed by Hussein (2002), adopt a broader focus than
just on the material basis of living. The Sustainable Livelihood Approach, for example, differentiates
between three groups of components in the livelihood framework: (1) the asset portfolio forming the
core element of livelihood, (2) the vulnerability context, including policy, institutions and processes,
and (3) the loop that links livelihood strategies and livelihood outcomes (Carney et al., 1999; DFID,
1999). According to Chambers and Conway (1991), a livelihood comprises the capabilities, assets and
activities required for a means of living. It is sustainable when it can withstand and recover from
stresses and shocks and maintain or improve its capabilities or assets without undermining the natu-
ral resource base. The term “capability” denotes the ability “to cope with stress and shocks, gaining
access to and using services and information, exercising foresight, experimenting and innovating,
competing and collaborating with other, and explaining new conditions and resources” (Chambers &
Conway, 1991).
An adequate standard of living is no reality for billions of people around the world, particularly for
rural populations in developing countries and for vulnerable groups such as women and children.
Some 1.4 billion people live in extreme poverty69 (in 2005), particularly in Sub-Saharan Africa (51% of
the population in 2005) and South Asia (39%). More than 2.6 billion people lack access to improved
sanitation. The number of urban residents living in slum conditions is estimated at 828 million, in de-
veloping regions. Food security is no reality for 900 million people estimated to be undernourished.
Analyses of the current situation show an aggravation of livelihoods in many places around the
world. Indeed, overexploitation of natural resources impairs people’s capabilities to cope with
stresses and shocks and economic crisis resulting in significant job losses add pressures on liveli-
hoods. The food and agriculture plays a pivotal role to provide sustainable livelihoods, as it can pro-
vide employment and create value for particularly vulnerable people. For smallholdings and family
farms in general, the sustainability of the enterprise and that of the family’s livelihood can hardly be
separated, and one cannot be achieved in isolation from the other.
A global standard for decent livelihoods is set by the above-cited Universal Declaration of Human
Rights (UN, 1948). Poverty and hunger are subject to Millennium Development Goal 1, which inter
alia requires to halve, from 1990 until 2015, the proportion of people living on less than 1$ a day as
well as the proportion of people who suffer from hunger70. The Right to Food has been reaffirmed by
the UN Human Rights Council71, and guidance on the issue provided by FAO72. The Human Develop-
ment Index73, an aggregate of per capita GDP, life expectancy and education, is a widely cited meas-
ure for the achievement of a decent livelihood at national level.
Sustainability goal
69
People living on less than 1.25 US$/day PPP (purchasing power parity) 70
www.un.org/millenniumgoals/poverty.shtml 71
http://ap.ohchr.org/documents/E/HRC/resolutions/A_HRC_RES_7_14.pdf 72
www.fao.org/righttofood/publi_02_en.htm 73
http://hdr.undp.org/en/statistics

83
The enterprise provides assets, capabilities and activities that increase the livelihood security of all
personnel and the local community in which it operates.
Sub-themes and indicators
Theme Sub-Themes Description
Indicators
What is being
measured? Data source Type74
S1.
Decent
livelihood
S1.1 Wage
level
All persons (regardless
of sex, ethnicity, etc.)
working in the enter-
prise earn enough
money to guarantee
more than their ability
to earn a livelihood,
including sufficient
pension and social
security benefits for
preventing poverty.
Remuneration (lowest
wages paid, corrected
to account for in-kind
payments; including
informally employed
personnel) compared
with local living wage.
Accounts,
payment re-
cords interview
(human re-
sources, work-
ers, with local
experts to de-
fine living
wage)
1
S1.2 Capac-
ity building
All personnel are pro-
vided the skills, knowl-
edge and competences
they require to under-
take all current and
future tasks required
by the enterprise.
Percentage of work-
force undergoing train-
ing and further educa-
tion during their em-
ployment / during one
year disaggregated by
sex and ethnicity (if
available).
Records of
trainings, inter-
view (human
resources,
workers)
1
Percentage of suppliers
provided training on
sustainability-related
topics (e.g. integrated
or organic crop produc-
tion, health, nutrition,
human rights etc.)
Records of
trainings, inter-
view (human
resources, sup-
pliers)
1
Average quantity of
training and further
education of workers
Records of
trainings, inter-
view (human
resources,
workers)
1
74
1: quantitative, absolute, performance (re. Table 2).

84
5.17 Labour rights (S2)
Relevance of the subject
Basic human needs and rights are a framework for human development that has been acclaimed by
the vast majority of countries. However, enforcement of international labour standards still repre-
sents a major challenge for the sector. Overall, due in particular to its largely informal nature, rural
work is seldom covered by national labour legislation, in law and in practice. In some countries and
sectors of the economy, human rights violations are a reality, including beatings and violence, the
denial of basic freedoms, intimidation and harassment, and even torture and death75. The question
of how business, particularly multinational enterprises, should deal with human (and thus also la-
bour) rights issues not covered by national law is the subject of intensive debate. The position on the
issue adopted in SAFA is that of the UN ‘Protect, respect and remedy’ framework, proposed by the
Special Representative of the Secretary-General on the issue of Human Rights and transnational cor-
porations and other business enterprises (UNHRC, 2011). The ‘respect’ pillar of the framework ad-
dresses business enterprises. They are responsible of respecting human rights wherever their own
business activities and those directly linked with their business relationships cause human rights im-
pacts. Human rights can thus be considered “a universal benchmark for what should be standards of
behaviour for businesses” (BLIHR, 2009).
Where the principles underlying the international declarations and covenants on human and labour
rights have been put into national law, their relevance to the food and agriculture industries is obvi-
ous. Many companies in the food and agriculture sector pro-actively recognise their potential to sup-
port human rights within their value chains, and also the benefits that arise from doing so. Many in-
ternational standards and approaches also implemented in the sector address human and labour
rights. Human Rights and labour rights are also a central issue in the standards of multi-stakeholder
commodity roundtables, such as 4C Association, RSPO, RTRS, BCI and Bonsucro, to cite just a few. As
labour rights can be a sensitive topic, for example on family farms, indicator selection and data col-
lection in the context of a SAFA must be done very carefully. For example, it is recommendable to
gather evidence from local communities and civil society organisations, including producers’ and
workers’ organisations, as well as from labour inspectors, in addition to interviewing employees di-
rectly. Such mechanisms are particularly important in order to track the respect of main international
labour standards in the frame of business relationships established (e.g. subcontractors).
The International Bill of Human Rights76 and the Declaration of Fundamental Principles and Rights at
Work (ILO, 1998) provide an almost universally agreed standard. The afore-mentioned UN ‘Protect,
respect and remedy’ framework, pertains to the issue of Human Rights and transnational corpora-
tions and other business enterprises (UNHRC, 2011). Private standards include, for instance, SA 8000
(SAI, 2008), the Code of Conduct of the Business Social Compliance Initiative (BSCI, 2009) and the
Ethical Trading Initiative77, whose Base Code provided guidance to the formulation of SAFA goals.
Procedures for the implementation of human and labour rights in business enterprises have been
proposed, e.g. a twelve-step due diligence for Human Rights (Taylor et al., 2009), and the “essential
steps” recommended by the Business Leaders Initiative on Human Rights (BLIHR, 2009).
75
For explanations and examples, see www.business-humanrights.org/Categories/Issues/Abuses 76
www.ohchr.org/Documents/Publications/FactSheet2Rev.1en.pdf; www2.ohchr.org/english/law 77
www.ethicaltrade.org/eti-base-code

85
Sustainability goal
The enterprise provides regular78 employment that is fully compliant with national law and interna-
tional agreements on contractual arrangements, labour and social security.
Sub-themes and indicators
Theme Sub-Themes Description
Indicators
What is being
measured? Data source Type79
S2.
Labour
rights
S2.1 Employ-
ment relations
Operations are based
on regular employ-
ment and fully compli-
ant with national law
on contractual ar-
rangements, labour
and social security.
Percentage of person-
nel with a legally bind-
ing work contract and
no precarious employ-
ment AND who benefit
from a contribution of
the employer to formal
and safe pension and
other social security
schemes, and who can
take paid sick, personal
and annual leave
Work contracts,
employment
and payment
records, inter-
view (workers),
labour or hu-
man rights
audit (applies
for all of the
theme)
1
Percentage of person-
nel whose wages and
benefits are rendered
in full compliance with
all applicable laws and
wage setting proce-
dures involving social
partners
Internal docu-
mentation,
interview (hu-
man resources,
worker organi-
sation)
1
Number of human
rights abuses
Interview
(workers, inde-
pendent exter-
nal institutions
e.g. human
rights NGO)
1
Percentage of person-
nel who are paid a liv-
ing wage and who al-
ways receive their full
wage in time
Payment re-
cords, payslips,
interview
(workers)
1
S2.2 Forced
labour
The enterprise accepts
no form of forced or
involuntary labour, nor
in its own operations
nor those of business
Number of incidents of
forced, bonded or pris-
oner labour among
workers and subcon-
tractors
Interview
(workers, inde-
pendent exter-
nal institutions
e.g. human
rights NGO)
1
78
„Regular“ means that employment should not be precarious, illegal or otherwise illegitimate. 79
1: quantitative, absolute, performance (re. Table 2).

86
partners. Percentage of suppliers
pro-actively and posi-
tively influenced on the
issue of forced labour
Internal docu-
mentation,
interview (sup-
pliers, procu-
rement)
1
S2.3 Child la-
bour
The enterprise accepts
no child labour that
has a potential to harm
the physical or mental
health or hinder the
education of minors,
neither in its own op-
erations nor those of
business partners.
Number of incidents of
unacceptable forms of
child labour among
workers and subcon-
tractors
Interview
(workers, inde-
pendent exter-
nal institutions
e.g. human
rights NGO)
1
Percentage of workers
under the age of 18
engaged in hazardous
work, overtime or night
shifts
Interview (con-
cerned work-
ers)
1
Percentage of suppliers
pro-actively and posi-
tively influenced on the
issue of child labour
Internal docu-
mentation,
interview (sup-
pliers, procu-
rement)
1
S2.4 Freedom
of association
and bargaining
All persons in the en-
terprise can freely
execute the rights to (i)
form or adhere to an
association defending
workers’ rights and (ii)
collectively bargain.
Percentage of work-
force who are free to
organise, associate and
collectively bargain
Interview
(workers, hu-
man resources,
worker organi-
sation)
1
Percentage of work-
force adhering to an
association defending
workers’ rights
Interview
(workers, hu-
man resources,
worker organi-
sation)
1
S2.5 Working
hours
All persons in the en-
terprise have enough
free time to recover
physically and men-
tally. Overtime is vol-
untary and fully com-
pensated.
Percentage of work-
force whose working
time arrangements are
fully compliant with ILO
standards
Interview
(workers, hu-
man resources,
worker organi-
sation), work
contracts
1

87
5.18 Equity (S3)
Relevance of the subject
Social equity is one of the principal values underlying sustainable development, with all people and
their quality of life being recognised as a central issue. Equity involves the degree of fairness and in-
clusiveness with which resources are distributed, opportunities afforded and decisions made. It in-
cludes the provision of comparable opportunities of employment and social services, including edu-
cation, health and justice. Significant issues related to its achievement include the distribution of
productive resources and employment, gender and ethnic inclusiveness, and inter-generational op-
portunity. As discrimination of women prevails in many places, gender equality is particularly im-
portant. Women on average receive only 70 to 90% of men’s wages for equal work in order to avoid
reinforcing inequalities between men and women and to promote gender equality. In times of crisis,
women are disproportionally more affected by job loss than men. Substantially more women live in
poverty (829 million) than men (522 million). There is increased recognition of crucial links between
poverty eradication, employment and equality (ILO, 2011). Poverty eradication programmes that fo-
cus on general income levels only (e.g. by providing income support) frequently miss the underlying
causes of vulnerability. For example, schooling levels among poor children can be raised through
spending on education, but future income will not increase without policies that effectively address
causes of economic vulnerability, such as ethnic, racial and gender discrimination (UN, 2010).
In a business context, implementing the equity concept means that any discrimination of persons or
groups on the basis of whatever characteristics must be avoided. This requirement applies to hiring,
promotion, job assignment, termination, compensation, working conditions and even harassment,
and it pertains to direct as well as indirect forms of discrimination (ILO, 2011). Enterprises are con-
fronted with equity aspects also in their relations with suppliers, contractors, costumers or share-
holders. Equity in business relations is a principal pillar of Good Corporate Governance.
In the agriculture and food sector, vulnerable and precarious working conditions are particularly
prevalent. The sector employs large numbers of non-salaried family members, in particular women,
of workers that have not benefited from professional training, and of seasonal workers, many of
them foreigners at the location where they work. The provision of these types of work should on the
one hand be recognised as a substantial benefit of the sector to society. On the other hand, it implies
a need and responsibility to pay particular attention to equity at work and, on family farms, in the
household.
International declarations (e.g. UN, 1948, Declaration of Human Rights; FAO, 2004, Right to Adequate
Food), conventions (e.g. ILO 1951, Equal Remuneration Convention; ILO, 1958, Discrimination (Em-
ployment and Occupation) Convention), guidelines (e.g. FAO, 2012b, Voluntary Guidelines for the
Governance of Tenure), standards and recommendations (e.g. the UN Global Compact; ISO 26000)
build upon the universal validity of the concept of equity and postulate non-discrimination and fair-
ness in general, and in contexts related with employment, occupation and business behaviour in par-
ticular. Millennium Development Goal (MDG) 1 inter alia aims at achieving full and productive em-
ployment and decent work for all, including women and young people80. Gender equality is also ad-
dressed through MDG 3, which requires eliminating gender disparity at all levels of education81.
Sustainability goal
80
www.un.org/millenniumgoals/poverty.shtml 81
www.un.org/millenniumgoals/gender.shtml

88
The enterprise pursues a strict equity and non-discrimination policy and pro-actively supports vul-
nerable groups.
Sub-themes and indicators
Theme Sub-Themes Description
Indicators
What is being
measured? Data source Type82
S3. Eq-
uity
S3.1 Non-
discrimination
A strict equity and
non-discrimination
policy is pursued to-
wards all stakeholders.
Non-discrimination
and equal opportuni-
ties are explicitly men-
tioned in the Code of
Conduct and adequate
means for implemen-
tation and evaluation
are in place.
Equity and non-
discrimination commit-
ments are explicitly
mentioned in the Code
of Conduct AND means
for the implementation
of an equity policy (e.g.
equal pay audits) exist
Code of Con-
duct, Internal
documentation,
interview
(management,
workers),
equality audit
3
Number of incidences of
discrimination in hiring,
remuneration, access to
training, promotion,
termination, or retire-
ment
Interview
(workers, hu-
man re-
sources), em-
ployment sta-
tistics (to check
for inequalities)
1
Number of incidences of
harassment
Interview
(workers) 1
Wage gap: wage differ-
ential (in % of the higher
wage) between perma-
nent and temporary
staff, local and migrant
workers etc. doing simi-
lar work
Payment re-
cords 1
Assessment of recruit-
ment procedure (e.g.
job adverts, short-list,
interview, selection
criteria list) ensuring
that anti-discrimination
procedures are imple-
mented
Process de-
scription, inter-
view (human
resources),
equality audit
5
S3.2 Gender
equality
There is no gender
disparity concerning
hiring, remuneration,
access to resources
and education, and
career opportunities.
Similar indicators as for
S3.1, but with a focus on
gender (e.g. gender
wage gap)
See above. See above.
S3.3 Support to Vulnerable groups, Average number of Records of 1
82
1: quantitative, absolute, performance; 3: qualitative, absolute, performance; 5: measures, absolute (re. Table 2).
89
vulnerable
people
such as women, mi-
norities and disadvan-
taged staff are proac-
tively supported.
training days differenti-
ated by group (e.g. age,
sex, race)
training partici-
pation (disag-
gregated by
group)
Percentage of personnel
with access to trainings
and career development
programs and other
measures to promote
women, handicapped,
youth etc.
Interview (hu-
man resources,
workers), re-
cords of train-
ing participa-
tion
1
Assessment of policies
and programmes that
favour vulnerable
groups
Interview (hu-
man resources,
concerned
workers)
5
Share of workplaces
appropriately equipped
for disabled persons
Internal docu-
mentation,
inspection
1
Ratio of jobs that could
be done by disabled
persons to the actual
number of disabled
persons employed
Employment
statistics, inter-
view (workers,
human re-
sources)
1

90
5.19 Human health and safety (S4)
Relevance of the subject
Occupational safety and health are of paramount importance for the social sustainability of person-
nel relations, for the enterprise and for national economies. There is growing evidence that improv-
ing healthcare, fighting disease and increasing life expectancy are all essential for supporting eco-
nomic growth and long-term business success. Neither development nor operations of enterprise can
be sustained when a high proportion of the population and the workforce suffers from poor health. A
clean environment is important to health and well-being. Protecting and promoting human health
requires primary health care – especially in rural areas –, controlling communicable diseases and
preventing health hazards originating in the working environment and from diets (see “Product safe-
ty and quality”).
The health of employees has a direct impact on their productivity at all types of work (Nelson & Pres-
cott, 2008). Worldwide, more than 350,000 work-related fatal accidents and 2 million cases of work-
related fatal disease occur each year. The number of non-fatal accidents (causing more than four
days absence from work) is estimated to be 1,000 times higher (Al Tuwaijri, 2008). Beside the loss of
work performance, the company sustains follow-on expenses for administration, recruitment and
efforts for reintegration and due to loss of knowledge. According to the WHO healthy workplace
framework, workers and managers should collaborate in a healthy workplace to achieve continuous
improvement in protecting and promoting the health, safety and well-being of workers (Burton,
2010). The sustainability of the workplace should be improved by considering health and safety con-
cerns in the physical and psycho-social work environment, including the organisation of work and
workplace culture, as well as personal health resources in the workplace. Furthermore, participation
to improve the health of workers’ families and other members of the community is desirable (Bur-
ton, 2010).
In the food and agriculture sectors, the occupational security and health situation is characterised by
specific hazards and risks, with high numbers of incidences e.g. in agriculture (Toscano, 1997; EWCS,
2007). Straining physical work, exposure to harmful substances (e.g. chemicals, pesticides, dust),
work with machines, equipment and animals all can cause health problems. Many enterprises in the
sector are small and thus particularly suffer from absences from work. Working hours in the sector
are often very long, especially in family enterprises and during the harvesting season, which can be
critical for health and safety as well (see “Labour rights”).
While occupational health and safety are rather the subject of national legislation and private stand-
ards, some international standards exist. These include the ILO-OSH 2001 guidelines83, published by
ILO, and the OHSAS 1800084 occupational health and safety management system specification. Both
systems are based on the steps of policy, organising, planning and implementation, evaluation, and
action for improvement. Compliance is checked by auditing. In addition, a series of ISO norms, includ-
ing ISO 14000 and ISO 14001, pertains to workplace environmental standards.
Sustainability goal
83
www.ilo.org/wcmsp5/groups/public/---ed_protect/---protrav/---safework/documents/publication/wcms_110496.pdf 84
www.ohsas-18001-occupational-health-and-safety.com

91
The work environment is safe, hygienic and healthy and caters to the satisfaction of human needs,
such as clean water, food, accommodation and sanitary installations.
Sub-themes and indicators
Theme Sub-Themes Description
Indicators
What is being
measured? Data source Type85
S4.
Human
health
and
safety
S4.1 Physical
and psycho-
social health
The enterprise fosters
the health, safety and
well-being and caters
to the satisfaction of
human needs (clean
water, food, accom-
modation, sanitary
installations etc.), both
at the work place and
in the local community.
Number of work-related
accidents and injuries
Records on
work safety
(factory securi-
ty offices)
1
Recordable incident
rate: number of per-
sonnel involved in re-
cordable injury or illness
per 100 persons
Records on
work safety
(factory securi-
ty offices, hu-
man resources)
1
Severity rate (number
of lost days per inci-
dent)
Records on
work safety
(factory securi-
ty offices, hu-
man resources)
1
Percentage of personnel
with access to clean
drinking water and to
improved sanitary in-
stallations
Internal docu-
mentation,
safety audit
records, inspec-
tion
1
Percentage of personnel
adequately trained on
occupational health and
safety
Records of safe-
ty trainings,
interview
(workers)
1
Percentage of personnel
doing dangerous work
who is adequately
trained
Records of safe-
ty trainings,
interview
(workers)
1
Percentage of personnel
with access to adequate
protective gear and
medical assistance
Interview
(workers), in-
spection, safety
audit records
1
Rating of the storage
and application of dan-
gerous substances
Inspection,
safety audit
records
5
Rating of fire safety
Internal docu-
mentation,
safety audit
records, inspec-
tion
5
85
1: quantitative, absolute, performance; 3: qualitative, absolute, performance; 5: measures, absolute (re. Table 2).

92
Rating of personnel
exposure to hazardous
substances and situa-
tions
Interview
(workers), in-
spection, safety
audit records
5
Rating of security and
health concepts
safety audit
records 5
Number of activities,
effectiveness of activi-
ties addressing the psy-
cho-social work envi-
ronment
1/3
Extent and effectiveness
of activities addressing
community health is-
sues (e.g. promoting
healthy lifestyle)
Interview
(community),
documentation
of activities
3
S4.2 Health
resources
Personal health re-
sources are provided in
the workplace (e.g.
sport facilities, smoke-
free buildings, healthy
food in canteens).
Percentage of personnel
(both men and women)
with access to decent
housing (if applicable),
clean sanitary facilities,
clean drinking water
and effective medical
aid
Interview
(workers), in-
spection
1
Percentage of workers
with access to medical
assistance or minimum
levels of healthcare
Interview
(workers), in-
spection
1
Extent (e.g. money
spent) and efficacy of
activities, effectiveness
of activities addressing
personal health re-
sources
Interview
(workers), doc-
umentation of
activities
1/3
S4.3 Food
security
The enterprise contrib-
utes to food security of
its personnel and the
local community.
Share of production
sites where operations
contribute to the im-
provement of the eco-
nomic and physical
access of the local
population to sufficient,
safe and nutritious food
Interview
(workers,
community,
management),
food security
due diligence
1
Percentage of personnel
whose food security is
directly improved
through activities of the
enterprise
Interview
(workers,
community,
management)
1

93
5.20 Cultural diversity (S5)
Relevance of the subject
Cultural diversity is a common heritage of vital importance for humankind. It is a concept that defies
simple definition, with different meanings depending on context (De Guzman et al., 2007). The term
“culture” relates to combinations of ethnicity, language and religion characteristics. Awareness of
cultural diversity has become relatively commonplace, as a result of the globalisation of exchanges
and the greater receptiveness of many societies to one another (UNESCO, 2008). However, greater
awareness alone does not guarantee the preservation of cultural diversity. Awareness and preserva-
tion are all the more important, since culture is a determining factor for the relevance, failure and
success of development interventions. Cultural diversity is an asset that has been considered indis-
pensable for reducing poverty and achieving a sustainable development. Understanding this diversity
is therefore a prerequisite for development interventions (UNESCO, 2008).
Workplace diversity as well is related to cultural diversity. Changing demographics and an increas-
ingly diverse marketplace are urgent reasons for an increased interest in managing diversity at work.
Many employers have come to realise that a diverse work force is not a burden, but a potential
strength (Henderson, 1994). Companies providing culturally competent workplaces may gain a sus-
tainable advantage over competitors that are less aware and active in this regard. Cultural compe-
tence should therefore become a core value of the organisation. The key is to understand cultural
diversity well and manage it effectively (PENN Behavioral Health, 2008). Diversity management has
become important for many organisations, companies and governments, and valuing diversity is es-
sential for an effective management of human resources (Pitts, 2006). It is a strategy to promote the
perception, acknowledgement and implementation of diversity in organisations and institutions.
One – but not the only – aspect of cultural diversity that is very important in the food and agriculture
sector, also in economic terms, is the issue of intellectual rights emanating from traditional, indige-
nous knowledge for example of species and ecosystems. Particularly rural communities often dispose
of a wealth of knowledge and have found ways to use genetic resources that can be commercially
utilised to develop food, medicinal and other products. Where genetic resources and associated tra-
ditional knowledge are commercially used, this should take place with the prior informed consent of
indigenous and local communities. Benefits resulting from the use of genetic resources rightfully held
by indigenous and local communities should be shared with those communities (Nagoya Protocol,
2009).
The importance of cultural diversity was recognised in the Universal Declaration on Cultural Diversity,
adopted in 2001, which aims to “preserve cultural diversity as a living, and thus renewable, treasure
that must not be perceived as being unchanging heritage, but as a process guaranteeing the survival
of humanity” (UNESCO, 2001). Concerning indigenous knowledge, the above-mentioned Nagoya Pro-
tocol, adopted in 2010 at the Conference of Parties to the Convention on Biological Diversity (CBD),
contains access and benefit sharing requirements for the utilisation of traditional and cultural knowl-
edge.
Sustainability goal
The enterprise respects the intellectual property rights of indigenous communities and the rights of
all stakeholders to choose their lifestyle, production and consumption choices.

94
Sub-themes and indicators
Theme Sub-Themes Description
Indicators
What is being
measured? Data source Type86
S5. Cul-
tural di-
versity
S5.1 Indige-
nous knowl-
edge
Intellectual property
rights related with
traditional and cultural
knowledge are recog-
nised and communities
concerned are remu-
nerated in a fair and
equitable way, based
on mutually agreed
terms.
Monetary value of
benefits related with
traditional, cultural and
ecosystem knowledge
that is shared in a fair
and equitable way
based on mutually
agreed terms
Accounts (re-
corded pay-
ments), con-
tracts, inter-
view (man-
agement,
community)
1
S5.2 Food
sovereignty
The right of suppliers,
employees and clients
to pursue their own
food production and
consumption choices is
not compromised.
Percentage of stake-
holders who confirm
they can freely pursue
their own food produc-
tion and consumption
choices
Stakeholder
survey 1
86
1: quantitative, absolute, performance (re. Table 2).
95
References
4C Association. 2009. The 4C Code of Conduct. Common Code for the Coffee Community Association (available
at www.4c-
coffeeassociation.org/downloads/about4c/4CDoc_001a_CodeofConduct_v1.2_en.pdf).
AccountAbility. 2008. AA100 AccountAbility Principles Standard 2008. AccountAbility, New York (available at
www.accountability.org/about-us/publications/aa1000.html).
Al-Tuwaijri, S. et al. 2008. Beyond death and injuries: The ILO's role in promoting safe and healthy jobs. XVIII
World Congress on Safety and Health at Work, June 2008, Seoul, Korea – Introductory report. International
Labour Organization, Geneva.
Bellarby, J., Foereid, B., Hastings, A. & Smith, P. 2008. Cool Farming: Climate Change Impacts of Agriculture
and Mitigation Potential (available at
www.greenpeace.org/international/en/publications/reports/cool-farming-full-report).
Beuchelt, T. & Zeller, M. 2011. Profits and poverty: Certification's troubled link for Nicaragua's organic and fair-
trade coffee producers. Ecological Economics 70: 1316-1324.
BGR. 2006. Deutsche Bundesanstalt für Geowissenschaften und Rohstoffe. Jahresbericht 2006 (in German).
Hanover, Germany.
BHF. 2008. Protecting children from unhealthy food marketing. British Heart Foundation, London (available at
www.childrensfoodcampaign.net/BHFnonbroadcastreport.pdf).
Blackman, A. & Rivera, J. 2011. Producer-level benefits of sustainability certification. Conservation Biology 25:
1176-1185.
BLIHR. 2009. Policy Report 4. Business Leaders Initiative on Human Rights (available at
www.blihr.org/Legacy/Downloads/BLIHR Report 2009.pdf).
Blumenthal, U. & Peasey, A. 2002. Critical review of epidemiological evidence of the health effects of wastewa-
ter and excreta use in agriculture. Unpublished document prepared for WHO (available upon request),
World Health Organization, Geneva.
Boller, E.F., Häni, F. & Poehling, H-M. 2004. Ökologische Infrastrukturen. Ideenbuch zur funktionalen Biodiversi-
tät auf Betriebsebene (in German). LBL, Lindau, Switzerland.
Boxall, A., Kolpin, B., Soerensen, B. & Tolls, J. 2003. Are veterinary medicines causing environmental risks?
Environmental Science and Technology. August 1, 2003: 286-294
BSCI. 2009. Code of Conduct. Business Social Compliance Initiative. Foreign Trade Initiative, Brussels (available
at www.bsci-intl.org/resources/code-of-conduct).
Burton, J. 2010. WHO Healthy Workplace Framework and Model: Background and supporting literature and
practices. World Health Organization, Geneva (available at
www.who.int/occupational_health/healthy_workplaces_background_original.pdf).
CAC. 1995. Principles for food import and export inspection and certification. Codex Alimentarius Commission.
GL 20 (available at www.codexalimentarius.net/download/standards/37/CXG_020e.pdf).
CAC. 1999. Guidelines for the production, processing, labelling and marketing of organically produced foods.
Codex Alimentarius Commission. GL 32 (available at
www.codexalimentarius.net/download/standards/360/cxg_032e.pdf).
CAC. 2009. Guidelines for Organically Produced Foods. Second Editin. Joint FAO/WHO Food Standards Pro-
gramme. Codex Alimentarius Commission. GL 32 – 1999, Rev. 1 – 2001.

96
Carney, D., Drinkwater, M., Rusinow, T., Neejes, K., Wanmali, S. & Singh, N. 1999. Livelihoods approaches
compared. London: Department for International Development DFID (available at
www.livelihoods.org/info/docs/lacv3.pdf).
Campbell, C. 1992. Contaminants in the food system: The consumers’ response. Proc. Nutr. Soc. Aust. 17: 33-35
(available at http://apjcn.nhri.org.tw/server/apjcn/ProcNutSoc/1990-1999/1992/1992%2033-35.pdf).
CBD. 2010. Global Biodiversity Outlook 3. Secretariat of the Convention on Biological Diversity. Montréal, Cana-
da.
Chambers, R. & Conway, G. 1991. Sustainable Rural Livelihoods: Practical Concepts for the 21st Century (avail-
able at
http://opendocs.ids.ac.uk/opendocs/bitstream/handle/123456789/775/Dp296.pdf?sequence=1).
Commission on Sustainable Development. 2001. Indicators of Sustainable Development: Guidelines and Meth-
odologies. Second Edition. UN, NY, September 2001.
Costanza, R. et al. 1997. The value of the World’s ecosystem services and natural capital. Nature 387: 253-260.
Crews, T.W. & Peoples, M.B. 2004. Legume versus fertilizer sources of nitrogen: ecological tradeoffs and hu-
man needs. Agriculture, Ecosystems and Environment 102: 279-297.
Daly, H.E. 1990. Toward some operational principles of sustainable development. Ecological Economics 2: 1-6.
De Guzman, M., Hill-Menson, T. & Greve, V.L. 2007. Promoting cultural understanding and developing cultural
competence. University of Nebraska HE Form 575. Participant Manual (available at
www.extension.unl.edu/c/document_library/get_file?folderId=221677&name=DLFE-3223.pdf)
DFID. 1999. Sustainable livelihoods guidance sheets. Department for International Development, London
(available at www.eldis.org/vfile/upload/1/document/0901/section2.pdf).
Doane, D. & MacGillivray, A. 2001. Economic Sustainability. The business of staying in business. New Econom-
ics Foundation, London (available at
http://projectsigma.co.uk/RnDStreams/RD_economic_sustain.pdf).
EC. 2008. Regulation (EC) No. 1333/2008 of the European Parliament and of the Council on food additives.
European Council, Brussels (available at http://eur-
lex.europa.eu/LexUriServ/LexUriServ.do?uri=OJ:L:2008:354:0016:0033:en:PDF)
EC. 2009. Regulation (EC) No 1221/2009 of the European Parliament and of the Council of 25 November 2009
on the voluntary participation by organisations in a Community eco-management and audit scheme (EMAS).
European Council, Brussels (available at http://eur-
lex.europa.eu/LexUriServ/LexUriServ.do?uri=OJ:L:2009:342:0001:01:EN:HTML).
EC. 2010. Agriculture and climate change. European Commission (available at
http://ec.europa.eu/agriculture/climate_change/index_en.htm).
ECOSOC. 2000. Integrated planning and management of land resources. Report of the Secretary-General. UN
Economic and Social Council. United Nations, New York (available at
www.un.org/documents/ecosoc/cn17/2000/ecn172000-6.htm).
Ehm, F. 2010. The rule of law: concept, guiding principle and framework. Report to the European Commission
for Democracy through Law (Venice Commission) (available at www.venice.coe.int/docs/2010/CDL-
UDT(2010)022-e.pdf).
ERDF. 2010. European Regional Development Fund 2007-2013 (available at
http://europa.eu/legislation_summaries/agriculture/general_framework/g24234_en.htm).

97
Erwin, P.M. 2010. Corporate Codes of Conduct: the effects of Code content and quality on ethical performance.
Journal of Business Ethics 99: 535-548.
European Advisory Service. 2004. The Introduction of mandatory nutrition labeling in the European Union. Im-
pact assessment undertaken for the Directorate-General for Health and Consumers of the European Com-
mission (available at
http://ec.europa.eu/food/food/labellingnutrition/nutritionlabel/impact_assessment.pdf).
EWCS. 2007. Fourth European Working Conditions Survey. (European Foundation for the Improvement of Living
and Working Conditions) (Ed.), Luxemburg (available at
www.eurofound.europa.eu/pubdocs/2006/98/en/2/ef0698en.pdf).
Fairtrade International. 2011a. Generic Fairtrade. Trade Standard. Fairtrade Labelling Organizations Interna-
tional e.V., Bonn, Germany (available at www.fairtrade.net/standards.0.html).
Fairtrade International. 2011b. Generic Fairtrade Standard for Contract Production. Fairtrade Labelling Organi-
zations International e.V., Bonn, Germany (available at www.fairtrade.net/standards.0.html).
Fairtrade International. 2011c. Generic Fairtrade Standard for Hired Labour. Fairtrade Labelling Organizations
International e.V., Bonn, Germany (available at www.fairtrade.net/standards.0.html).
Fairtrade International. 2011d. Generic Fairtrade Standard for Small Producer Organizations. Fairtrade Label-
ling Organizations International e.V., Bonn, Germany (available at www.fairtrade.net/standards.0.html).
Falkenmark M. 1997. Meeting Water Requirements of an Expanding World Population. In DJ Greenland, PJ
Gregory, PH Nye: Land Resources: On the Edge of the Malthusian Precipice? CAB International, Wallingford,
UK.
FAO. 1989. Sustainable development and natural resources management. Twenty-Fifth Conference, Paper C
89/2 - Sup. 2. Food and Agriculture Organization of the United Nations, Rome.
FAO. 1995. FAO Trainer’s Manual, Vol. 1. Sustainability issues in agricultural and rural development policies.
Food and Agriculture Organization of the United Nations, Rome.
FAO. 1996. Rome Declaration on World Food Security and World Food Summit Plan of Action. World Food
Summit 13-17 November 1996. Rome.
FAO. 1997. Gender: the key to sustainability and food security. SD Dimensions, May 1997 (available at
ftp://ftp.fao.org/docrep/fao/005/y3969e/y3969e00.pdf).
FAO. 2004. Voluntary Guidelines to Support the Progressive Realization of the Right to Adequate Food in the
Context of National Food Security. Food and Agriculture Organization of the United Nations, Rome (availa-
ble at http://www.fao.org/righttofood/en/highlight_51596en.html)
FAO. 2001. Lecture notes of the major soils of the World. Food and Agriculture Organization of the United
Nations, Rome.
FAO. 2006a. Livestock’s long shadow. Environmental issues and options. Food and Agriculture Organization of
the United Nations, Rome (available at ftp.fao.org/docrep/fao/010/a0701e/a0701e00.pdf)
FAO. 2006b. Food Security, FAO Policy Brief, Issue 2, June 2006. Food and Agriculture Organization of the
United Nations , Rome (available at ftp://ftp.fao.org/es/esa/policybriefs/pb_02.pdf)
FAO. 2010a. State of Food Insecurity in the World. 2010 Report. Food and Agriculture Organization of the
United Nations, Rome (available at www.fao.org/publications/sofi/en).
FAO. 2010b. The State of World Fisheries and Aquaculture. Food and Agriculture Organization of the United
Nations, Rome (available at www.fao.org/docrep/013/i1820e/i1820e00.htm

98
FAO. 2010c. Global Forest Resources Assessment 2010. Food and Agriculture Organization of the United Na-
tions, Rome (available at www.fao.org/docrep/013/i1757e/i1757e.pdf).
FAO. 2011. The State of the World’s Land and Water Resources for Food and Agriculture. Managing systems at
risk. Food and Agriculture Organization of the United Nations, Rome (available at
http://www.fao.org/nr/solaw/solaw-home/en/).
FAO. 2012a. Greening the Economy with Agriculture (available at
http://www.fao.org/docrep/015/i2745e/i2745e00.pdf).
FAO. 2012b. Voluntary Guidelines on the Responsible Governance of Tenure of Land, Fisheries and Forests in the
Context of National Food Security (available at http://www.fao.org/nr/tenure/voluntary-guidelines/en/)
FAO Council. 2011. Greening the Economy with Agriculture (available at
www.fao.org/docrep/015/i2745e/i2745e00.pdf)
FAO/WHO. 2003a. Recommended International Code of practice general principles of food hygiene. Food and
Agriculture Organisation of the United Nations, Rome (available at
www.mhlw.go.jp/english/topics/importedfoods/guideline/dl/04.pdf).
FAO/WHO. 2003b. Expert report on diet, nutrition and prevention of chronic diseases. Food and Agriculture
Organisation of the United Nations, Rome (available at
www.who.int/mediacentre/news/releases/2003/pr32/en).
FAOSTAT. 2010/2011/2012. FAOSTAT-Agriculture Database (available at
http://faostat.fao.org/default.aspx).
FAWC. 1979. The five freedoms. Farm Animal Welfare Council of Great Britain (available at www.fawc.org.uk).
Fischer, C., Frangenberg, A. & Geissen, V. 2001. Naturschutz in und mit der Landschaft. Möglichkeiten und
Grenzen beim Schutz von Edaphon und Blütenpflanzen (in German). Gesellschaft zur Förderung des Integ-
rierten Landbaus, Bonn, Germany.
FOAG. 2009. Swiss agriculture on the move: The New Agriculture Act. Ten years on. Federal Office of Agriculture
of Switzerland (available at
www.blw.admin.ch/aktuell/index.html?lang=en&download=NHzLpZeg7t,lnp6I0NTU042l2Z6ln1ad
1IZn4Z2qZpnO2Yuq2Z6gpJCEdIJ9gGym162epYbg2c_JjKbNoKSn6A--).
Folke, C., Carpenter, S., Elmqvist, T., Gunderson, L., Holling, CS. & Walker, B. 2002. Resilience and sustainable
development: building adaptive capacity in a world of transformations. Ambio 31: 437-440.
Freeman, R.E. 1984. Strategic Management. A Stakeholder Approach. Cambridge University Press, Boston.
FSC. 1996. FSC International Standard. FSC Principles and Criteria for Forest Stewardship. Forest Stewardship
Council A.C., Bonn, Germany (available at www.fsc.org/fileadmin/web-
da-
ta/public/document_center/international_FSC_policies/standards/FSC_STD_01_001_V4_0_EN_FS
C_Principles_and_Criteria.pdf).
G100. 2003. Sustainability: A guide to triple bottom line reporting. Group of 100 Incorporated. Melbourne, Aus-
tralia (available at www.group100.com.au/publications/G100_guide-tbl-reporting2003.pdf).
GfaW. 2012. Certified Sustainable Economics. Standard for certification of sustainable business management.
Gesellschaft für angewandte Wirtschaftsethik. Version 01/2012. Bad Sooden-Allendorf, Germany (available
at http://angewandte-wirtschaftsethik.org/wp-content/uploads/2011/09/en-final-Certified-
Sustainable-Economics-Standard.pdf ).

99
GlobalG.A.P. 2011a. Control points and compliance criteria. Integrated farm assurance. All farm base. Version
4.0. GlobalG.A.P. c/o FoodPlus GmbH, Cologne (available at
www.globalgap.org/cms/front_content.php?idcat=3).
GlobalG.A.P. 2011b. Control points and compliance criteria. Integrated farm assurance. Crops base. Version
4.0. GlobalG.A.P. c/o FoodPlus GmbH, Cologne (available at
www.globalgap.org/cms/front_content.php?idcat=3).
GlobalG.A.P. 2011c. Control points and compliance criteria. Integrated farm assurance. Livestock base. Version
4.0. GlobalG.A.P. c/o FoodPlus GmbH, Cologne (available at
www.globalgap.org/cms/front_content.php?idcat=3).
Grenz, J., Thalmann, C., Schoch, M. & Stämpfli, A. 2011. RISE 2.0 Field Manual. Bern University of Applied Sci-
ences, Zollikofen, Switzerland.
GRI. 2011a. Sustainability Reporting Guidelines. Version 3.1. Global Reporting Initiative, Amsterdam (available
at https://www.globalreporting.org/Pages/default.aspx).
GRI. 2011b. Sustainability Reporting Guidelines. Version 3.1. Food Processing Sector Supplement. Global Re-
porting Initiative, Amsterdam (available at
www.globalreporting.org/ReportingFramework/SectorSupplements/FoodProcessing ).
GSCP. 2010. Reference Tools of the Global Social Compliance Programme. Issy-les-Moulineaux, France (avai-
lable at www.gscpnet.com/working-plan.html).
GWP. 2000. Towards water security: a framework for action. Global Water Partnership, Stockholm (available at
www.gwptoolbox.org/images/stories/Docs/water security_2000_doc_78_en.pdf
Haanaes, K., Arthur, S., Balagopal, B., Kong, M.T., Reeves, M., Velken, I., Hopkins, M.S. & Kruschwitz, N.
2011. Sustainability: the ‘embracers’ seize advantage. Findings from the 2010 Sustainability & Innovation
Global Executive Study and Research Project. MIT Sloan Management Review and The Boston Consulting
Group (available at http://c0426007.cdn2.cloudfiles.rackspacecloud.com/MIT-SMR-BCG-
sustainability-the-embracers-seize-advantage-2011.pdf).
Helmholtz-Zentrum. 2007. Antibiotika und Antibiotikaresistenzen (in German). FLUGS-Fachinformationsdienst.
Helmholtz-Zentrum, München.
Henderson, G. 1994. Cultural diversity in the workplace: issues and strategies. Praeger, Westport (CT).
Hill, C. & Jones. G. 2007. Strategic management theory: an integrated approach. Houghton Mifflin Company,
Boston.
HLPE. 2011. Land tenure and international investments in agriculture. A report by the High Level Panel of Ex-
perts on Food Security and Nutrition. Committee on World Food Security, Rome (available at
www.fao.org/fileadmin/user_upload/hlpe/hlpe_documents/HLPE-Land-tenure-and-international-
investments-in-agriculture-2011.pdf).
Holling, C.S. & Meffe, G.K. 1996. Command and control and the pathology of natural resource management.
Conservation Biology 10: 328-337.
Hussein, K. 2002. Livelihood approaches compared: A multi-agency review of current practice. Commissioned
by the UK Department for International Development's (DFID's) Sustainable Livelihoods Support Office
(SLSO). London: Overseas Development Institute (available at
www.eldis.org/vfile/upload/1/document/0812/LAC.pdf).
IAASTD. 2009. International Assessment of Agricultural Knowledge, Science and Technology for Development.
www.agassessment.org

100
IEA. 2009. World Energy Outlook. International Energy Agency, Paris (available at
www.iea.org/textbase/npsum/weo2009sum.pdf).
IFAD. 2007. Lack of investment in agriculture is driving massive migration from rural areas. International Fund
for Agricultural Development, Governing Council meeting 2007. Rome (available at
www.ifad.org/media/press/2007/15.htm).
IFAD/FAO. 2008. International migration, remittances and rural development. International Fund for Agricul-
tural Development, Rome (available at www.ifad.org/pub/remittances/migration.pdf).
IFOAM. 2007. The IFOAM Basic Standards for Organic Production and Processing (version 2005). International
Foundation for Organic Agriculture Movements, Bonn, Germany (available at
www.ifoam.org/about_ifoam/standards/norms.html).
IFPRI. 2009. When speculation matters. IFPRI issue brief 57, February 2009. International Food Policy Research
Institute (available at www.ifpri.org/sites/default/files/publications/ib57.pdf).
IISD. 2009. Bellagio STAMP: SusTainability Assessment and Measurement Principles. International Institute for
Sustainable Development, Winnipeg.
ILO. 1951.Equal Remuneration Convention. C100. International Labour Organization, Geneva (available at
www.ilo.org/ilolex/cgi-lex/convde.pl?C100)
ILO. 1958.Discrimination (Employment and Occupation) Convention. C111. International Labour Organization,
Geneva (available at www.ilo.org/ilolex/cgi-lex/convde.pl?C111)
ILO. 1998. ILO Declaration on Fundamental Principles and Rights at Work. International Labour Organization,
Geneva (available at www.ilo.org/declaration/lang--en/index.htm).
ILO. 2011. Equality at work: the continuing challenge. Report of International Labour Conference, 100th
session,
1 (B). International Labour Organization, Geneva (available at www.ilo.org/wcmsp5/groups/public/---
ed_norm/---declaration/documents/publication/wcms_166583.pdf).
ILO. 2012. Boosting local economies. International Labour Organization, Geneva (available at
www.ilo.org/wcmsp5/groups/public/---ed_emp/---emp_ent/---
led/documents/publication/wcms_175521.pdf).
IPCC. 2007. Climate Change 2007: Synthesis Report. Intergovernmental Panel on Climate Change, Geneva
(available at www.ipcc.ch/publications_and_data/ar4/syr/en/contents.html).
ISEAL Alliance. 2010. Assessing the impacts of environmental and social standards systems. ISEAL Code of Good
Practice, version 1.0. ISEAL Alliance, London (available at www.isealalliance.org/resources/p041-
impacts-code-of-good-practice).
Isenring, R. 2010. Pesticides and the loss of biodiversity. Pesticide Action Network Report. Pesticide Action
Network Europe, London (available at http://www.pan-
europe.info/Resources/Briefings/Pesticides_and_the_loss_of_biodiversity.pdf).
ISO 14025. 2006. Environmental labels and declarations – Type III environmental declarations – principles and
procedures. International Organization for Standardization, Geneva.
ISO 14040. 2009. Environmental management – Life cycle assessment – Principles and framework (ISO
14040:2006). German and English version, November 2009. Deutsches Institut für Normung e.V., Berlin.
IWMI. 2007. Water for food, water for life: A comprehensive assessment of water management in agriculture.
London: Earthscan, and Colombo: International Water Management Institute. 645 pp.
101
Jörissen, J., Kopfmüller, J. & Brandl, V. 1999. Ein integratives Konzept nachhaltiger Entwicklung (in German).
Wissenschaftliche Berichte FZKA 6393. Forschungszentrum Karlsruhe, Germany
Loew, T. & Braun, S. 2006. Organisatorische Umsetzung von CSR. Vom Umweltmanagement zur Sustainable
Corporate Governance. Institute 4 Sustainability, Berlin & future e.V., München (available at
www.4sustainability.org/downloads/Loew_Braun_2006_Organisatorische_Umsetzung_von_CSR.
pdf).
Maak, T. & Ulrich, P. 2007. Integre Unternehmensführung. Ethisches Orientierungswissen für die Wirtschafts-
praxis (in German). Schäefer Poeschel Verlag, Stuttgart, Germany.
McCann, K.S. 2000. The diversity-stability debate. Nature 405: 228-233.
McInroy, N. & Longlands, S. 2010. Productive local economies creating resilient places. Centre for Local Eco-
nomic Strategies, Manchester, UK (available at www.cles.org.uk/wp-
content/uploads/2011/01/Resilience-for-web1.pdf).
MEA. 2005. Ecosystems and Human Well-being: Synthesis. Millennium Ecosystem Assessment. (available at
www.maweb.org/en/index.aspx).
MSC. 2010. MSC Fisheries Standard. Principles and Criteria for Sustainable Fishing. Marine Stewardship Council
(available at www.msc.org/about-us/standards/standards/msc-environmental-standard).
Nagoya Protocol. 2009. Nagoya Protocol on access to genetic resources and the fair and equitable sharing of
benefits arising from their utilization to the convention on biological diversity (available at
www.cbd.int/abs/doc/protocol/nagoya-protocol-en.pdf).
Nelson, J. & Prescott, D. 2008. Business and the Millennium Development Goals: A Framework for Action (2nd
edition) (available at www-dev.iblf.org/docs/BMDG_final_w.pdf).
Norberg-Hodge, H. & Gorelick, S. 2002. Think Global... Eat Local. The Ecologist (UK) 32(7): 28-31 (available at
www.rightlivelihood.org/fileadmin/Files/PDF/Literature_Recipients/Ladakh/Norberg-Hodge_-
_Think_Globally.pdf ).
OECD. 2002. Glossary of key terms in evaluation and results based management. Organisation for Economic Co-
Operation and Development, Paris.
OECD. 2003. OECD Environmental Indicators. Development, measurement and use. Reference paper. Organisa-
tion for Economic Co-Operation and Development, Paris (available at
www.oecd.org/document/28/0,3746,en_2649_33793_39681244_1_1_1_1,00.html).
OECD. 2004. Principles of Good Corporate Governance. OECD, Paris.
OECD. 2010. Local development benefits from staging global events: Achieving the local development legacy
from 2012. Organisation for Economic Co-operation and development. Department of communities and lo-
cal government. Paris (available at www.oecd.org/dataoecd/57/61/46207013.pdf).
OECD. 2011. OECD Guidelines for multinational enterprises. 2011 Edition. Organisation for Economic Co-
Operation and Development (available at www.oecd.org/dataoecd/43/29/48004323.pdf).
OECD/IEA. 2008. Towards a sustainable energy future. International Energy Agency, Paris (available at
www.iea.org/G8/2008/G8_Towards_Sustainable_Future.pdf).
Oldeman, L.R., Hakkeling, R.T.A.& Sombrock W.G. 1991. Global Assessment of Soil Degradation - GLASOD.
World map of the status of human-induced soil degradation. ISRIC, Wageningen and UNEP, Nairobi.

102
PENN Behavioral Health. 2008. Developing cultural competency at work: How organizations can benefit from
opportunities provided by a multi-cultural staff. University of Pennsylvania, Philadephia (PA) (available at
www.pennbehavioralhealth.org/documents/cultural_competency.pdf).
Pfister, S., Koehler, A. & Hellweg, S. 2009. Assessing the Environmental Impacts of Freshwater Consumption in
LCA. Environ. Sci. Technol., 43: 4098-4104.
Pimm, S.L. & Raven, P. 2000. Extinction by numbers. Nature Volume 403: 843-845
Pinter, L., Hardi, P., Martinuzzi, A. & Hall, J. 2011. Bellaggio STAMP: Principles for sustainability assessment
and measurement. Ecological Indicators 17: 20-28.
Pitts, D. 2006. Implementation of Diversity Management Programs in Public Organizations: Lessons from Policy
Implementation Research. Georgia State University, Department of Public Administration and Urban Studies
Fiscal Research Center. Working Paper 6-17. Atlanta (GA) (available at
http://aysps.gsu.edu/pitts_implementationdiversity.pdf).
Porter, T. 2008. Managerial applications of corporate social responsibility and systems thinking for achieving
sustainability outcomes. Systems Research and Behavioral Science 25: 397-411.
Rockström et al., 2009. A safe operating space for humanity. Nature 461: 472-475.
RSB. 2010. RSB Principles & Criteria for Sustainable Biofuel Production. Roundtable on Sustainable Biofuels,
Lausanne, Switzerland (available at http://rsb.epfl.ch/page-67254-en.html).
RSB. 2011a. RSB Conservation Impact Assessment Guidelines. Roundtable on Sustainable Biofuels, Lausanne ,
Switzerland (available at http://rsb.epfl.ch/page-67254-en.html).
RSB. 2011b. RSB Social Impact Assessment (SIA) Guidelines. Roundtable on Sustainable Biofuels, Lausanne ,
Switzerland (available at http://rsb.epfl.ch/page-67254-en.html).
SAI Platform. 2008. Social accountability 8000. SAI Standard SA8000. Social Accountability International.
SAI Platform. 2012. Sustainability performance assessment of farming practices. Guidelines for developers of
quantitative monitoring tools. Version 1.0 (available at www.saiplatform.org).
SAM. 2011. SAM Research Corporate Sustainability Assessment Questionnaire. SAM Group Holding AG, Zürich,
Switzerland (available at www.sam-group.com/images/sample-questionnaire_tcm794-267819.pdf).
SAN. 2010a. Sustainable Agriculture Standard. Sustainable Agriculture Network. San José, Costa Rica (available
at http://sanstandards.org/sitio).
SAN. 2010b. Standard for Sustainable Cattle Production Systems. Sustainable Agriculture Network. San José,
Costa Rica (available at http://sanstandards.org/sitio).
SAN. 2011a. Group Certification Standard (version 2). Sustainable Agriculture Network. San José, Costa Rica
(available at http://sanstandards.org/sitio).
SAN. 2011b. SAN Climate Module. Criteria for mitigation and adaptation to climate change. Sustainable Agri-
culture Network. San José, Costa Rica (available at http://sanstandards.org/sitio).
Schaltegger, S. et al., 2003. Managing and measuring the business case for sustainability. Capturing the Rela-
tionship between Sustainability Performance, Business Competitiveness and Economic Performance (availa-
ble at www.greenleaf-publishing.com/content/pdfs/bcsintro.pdf).
Stoob, K., Schmitt, H. & Wanner, M. 2005. Antibiotikaeinsatz in der Landwirtschaft – Folgen für die Umwelt (in
German). EAWAG News 59d. EAWAG, Dübendorf, Switzerland.

103
Taylor, M.B., Zandvliet, L. & Forouhar, M. 2009. Due diligence for human rights: a risk-based approach. Work-
ing Paper No. 53. Corporate Social Responsibility Initiative, Harvard University (available at
www.hks.harvard.edu/m-rcbg/CSRI/publications/workingpaper_53_taylor_etal.pdf).
TEEB. 2009. The Economics of Ecosystems and Biodiversity for National and International Policy Makers. Sum-
mary: Responding to the Value of Nature 2009 (available at www.teebweb.org).
Toscano, G. 1997. Brief: Dangerous jobs. In Bureau of Labor Statistics. Compensation and Working Conditions,
Summer, 57–60.
Ulrich, P. 2008. Integrative economic ethics: foundations of a civilized market economy. Cambridge University
Press.
UN, 1948. Universal Declaration of Human Rights. United Nations, Geneva (available at
www.un.org/en/documents/udhr).
UN. 1966a. International Covenant on Economic, Social and Cultural Rights. United Nations Organization, New
York.
UN. 1966b. International Covenant on Civil and Political Rights. United Nations Organization, New York.
UN. 1992. Agenda 21. The United Nation’s Programme of Action from Rio. UN, New York (available at
www.un.org/esa/dsd/agenda21).
UN. 2004. The rule of law and transitional justice in conflict and post-conflict societies. Report of the Secretary-
General. United Nations Security Council (available at www.unrol.org/files/2004 report.pdf).
UN. 2007. Indicators of Sustainable Development: Guidelines and Methodologies – Third edition. Methodology
sheets. United Nations Publications, New York (available at
www.un.org/esa/sustdev/natlinfo/indicators/guidelines.pdf).
UN. 2010. Retooling global development. World Economic and Social Survey 2010. United Nations, Department
of Economic and Social Affairs, New York (available at
www.un.org/esa/policy/wess/wess2010files/wess2010.pdf).
UN. 2011. The Millennium Development Goals Report 2011. United Nations, New York (available at
www.un.org/millenniumgoals/11_MDG Report_EN.pdf).
UNDP. 2011. Sustainability and Equity: A Better Future for All. 2011 Human Development Report. United Na-
tions Development Programme, New York (available at
http://hdr.undp.org/en/reports/global/hdr2011).
UNECE. 2007. Guidance Document on Control Techniques for Preventing and Abating Emissions of Ammonia.
United Nations Economic Commission for Europe (available at
www.unece.org/env/documents/2007/eb/wg5/WGSR40/ece.eb.air.wg.5.2007.13.e.pdf)
UNEP. 1992. Basel Convention on the Control of Transboundary Movements of Hazardous Waste and Their Dis-
posal. United Nations Environment Programme (available at www.basel.int/Portals/4/Basel Conventi-
on/docs/text/BaselConventionText-e.pdf).
UNEP. 2011. Towards a Green Economy. Pathways to sustainable development and poverty eradication. United
Nations Environment Programme (available at www.unep.org/greeneconomy).
UNEPFI. 2006. Sustainability management and reporting. Benefits for financial institutions in developing and
emerging economies. UNEP Finance Initiative Sustainability Management and Reporting Project. UNEP, Ge-
neva.
UNESCAP. 2009. What is Good Governance? United Nations Economic and Social Commission for Asia and the
Pacific, Bangkok.

104
UNESCO. 2001. UNESCO Universal declaration on cultural diversity (available at
http://unesdoc.unesco.org/images/0012/001271/127160m.pdf).
UNESCO. 2003. 1st UN World Water Development Report: Water for People, Water for Life. Paris, New York and
Oxford. UNESCO (United Nations Educational, Scientific and Cultural Organization) and Berghahn Books.
UNESCO. 2008. UNESCO and cultural diversity (available at www.unescobkk.org/culture/cultural-
diversity/cultural-diversity-programming-lens/unesco-and-cultural-diversity).
UNESCO. 2009. Water in a Changing World. The United Nations World Water Development Report 3. UJESCO
Publishing, Paris, and Earthscan, London (available at
www.unesco.org/water/wwap/wwdr/wwdr3/pdf/WWDR3_Water_in_a_Changing_World.pdf)
UNGC. 2010. United Nations Global Compact Management Model. Framework for Implementation. United Na-
tions Global Compact, New York (available at
www.unglobalcompact.org/docs/news_events/9.1_news_archives/2010_06_17/UN_Global_Com
pact_Management_Model.pdf).
UNGC/IFC. 2009. Corporate Governance. The foundation for corporate citizenship and sustainable business.
United Nations Global Compact / International Finance Corporation. New York & Washington D.C. (available
at
www.unglobalcompact.org/docs/issues_doc/Corporate_Governance/Corporate_Governance_IFC
_UNGC.pdf).
UN Habitat. 2009. Promoting Local Economic Development through Strategic Planning. Volume 5: Trainer’s
Guide. United Nations Human Settlements Programme, Nairobi (available at
www.unhabitat.org/pmss/listItemDetails.aspx?publicationID=1922).
UNHRC. 2008. Report of the Special Representative of the Secretary-General on the issue of human rights and
transnational corporations and other business enterprises. Addendum. Corporations and human rights: a
survey of the scope and patterns of alleged corporate-related human rights abuse (available at
www.reports-and-materials.org/Ruggie-2-addendum-23-May-2008.pdf).
UNHRC. 2011. Report of the Special Representative of the Secretary-General on the issue of human rights and
transnational corporations and other business enterprises. Guiding Principles on Business and Human
Rights: Implementing the United Nations “Protect, Respect and Remedy” Framework. A/HRC/17/31 (availa-
ble at www.business-humanrights.org/media/documents/ruggie/ruggie-guiding-principles-21-
mar-2011.pdf).
UNIDO. 2011. Industrial Value Chain Diagnostics: An Integrated Tool. United Nations Industrial Development
Organization (UNIDO). Vienna.
Unilever. 2010. Unilever Sustainable Agriculture Code (available at www.sustainable-
living.unilever.com/wp-content/uploads/2010/12/SustainableAgrCode2010UL.pdf).
van der Ploeg, R.R., Ehlers, W. & Horn, R. 2006. Schwerlast auf dem Acker (in German). Spektrum der Wissen-
schaft, August 2006.
Vitousek PM, Aber JD, Howarth RW, Likens GE, Matson PA, Schindler DW, Schlesinger WH, Tilman D. 1997.
Human alteration of the global nitrogen cycle: sources and consequences. Ecol. Appl. 7: 737–750.
von Wirén-Lehr S. 2001. Sustainability in agriculture – an evaluation of principal goal-oriented concepts to close
the gap between theory and practice. Agriculture, Ecosystems and Environment 84: 115-129
Wackernagel M. & Rees W. 1997. Unser ökologischer Fussabdruck: Wie der Mensch Einfluss auf die Umwelt
nimmt (in German). Birkhäuser, Basel/Boston/Berlin.

105
Wal-Mart. unknown year. Wal-Mart Supplier Sustainability Assessment (available at
http://walmartstores.com/Sustainability/9292.aspx).
WBCSD. 2000. Eco-efficiency. Creating more value with less impact. World Business Council for Sustainable
Development, Geneva (available at
www.wbcsd.org/web/publications/eco_efficiency_creating_more_value.pdf).
WCED. 1987. Report of the World Commission on Environment and Development: Our common future (available
at www.un-documents.net/wced-ocf.htm).
WDC. 2007.Indicators, Balanced Regional development and the National Development Plan 2007-2013. West-
ern Development Commission, Republic of Ireland (available at
www.wdc.ie/wpcontent/uploads/reports_IndicatorsBRDandNDP2007-2013.pdf).
WEF. 2010. Realizing a New Vision for Agriculture. A roadmap for stakeholders. World Economic Forum (availa-
ble at www3.weforum.org/docs/IP/AM11/CO/WEF_AgricultureNewVision_Roadmap_2011.pdf).
WHO. 2007. Food safety and foodborne illness. World Health Organisation, Geneva (available at
www.who.int/mediacentre/factsheets/fs237/en).
WHO. 2009. Chemical risks in food. World Health Organisation, Geneva (available at
www.who.int/foodsafety/chem/general/en/index.html).
World Bank. 2011. World dataBank. World Development Indicators (WDI) & Global Development Finance
(GDF). World Bank, Washington D.C. (available at data-
bank.worldbank.org/ddp/home.do?Step=12&id=4&CNO=2).
World Soil Charter. 1981. (available at www.fao.org/docrep/T0389E/T0389E0b.htm).

106
Appendix A
Scope of approaches for measuring, communicating and improving sustainability
Name (alphabetic order) Steps of the value chain covered Sustainability dimensions covered Production Processing Retail Environment Economy Governance Social
4C Association, Code of Conduct (version 1.2) x x x x x Committee On Sustainability Assessment (COSA) x x x x x FLO-Cert Generic Fairtrade Standards (2011 versions) x x x x x x x GlobalG.A.P. control points and major musts (version 4.0) x x x x x Global Reporting Initiative (GRI) G3.1 Guidelines x x x x x x x Global Social Compliance Programme (GSCP) Reference Tools (2011 versions) x x x x x x IFOAM Basic standards for organic production and processing (2005 version) x x x x x International Labour Organisation, Core Conventions x x x x Life Cycle Assessment (ISO 14040, ISO 14044) x x x x OECD Environmental Indicators x x x x Response-Inducing Sustainability Evaluation (RISE, version 2.0) x x x x SAI Platform Sustainability Performance Assessment (SPA; April 2012 draft) x x (x)
87 (x)
Roundtable on Sustainable Biofuels, Impact assessment guidelines (version 2.0) x x x x x x SAM Sustainability Investing, Corporate sustainability assessment questionnaire x x x x x x x Sustainable Agriculture Network, Standards for Sustainable Agriculture (2010 version) x x x x x Unilever Sustainable Agriculture Code (2010 version) x x x x Wal-Mart Sustainability Index x x x x
Explanatory notes
Sustainability dimensions are interpreted in accordance with the SAFA thematic scope (for details, see part C of the Guidelines). “x” indicates that at least single, but not neces-
sarily all, aspects of this dimension are taken into account in the approach.
87
Farm financial stability and occupational health and safety are not yet considered in SPA (April 2012), but inclusion is intended for future versions.
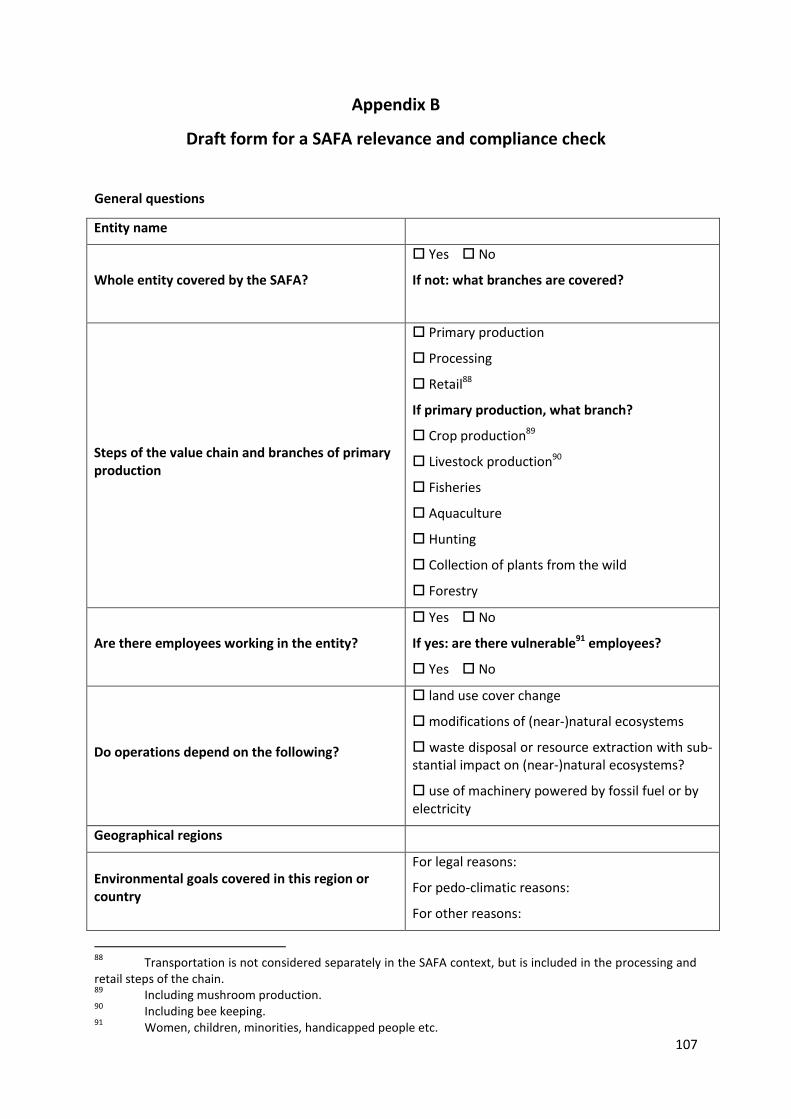
107
Appendix B
Draft form for a SAFA relevance and compliance check
General questions
Entity name
Whole entity covered by the SAFA?
Yes No
If not: what branches are covered?
Steps of the value chain and branches of primary production
Primary production
Processing
Retail88
If primary production, what branch?
Crop production89
Livestock production90
Fisheries
Aquaculture
Hunting
Collection of plants from the wild
Forestry
Are there employees working in the entity?
Yes No
If yes: are there vulnerable91 employees?
Yes No
Do operations depend on the following?
land use cover change
modifications of (near-)natural ecosystems
waste disposal or resource extraction with sub-stantial impact on (near-)natural ecosystems?
use of machinery powered by fossil fuel or by electricity
Geographical regions
Environmental goals covered in this region or country
For legal reasons:
For pedo-climatic reasons:
For other reasons:
88
Transportation is not considered separately in the SAFA context, but is included in the processing and retail steps of the chain. 89
Including mushroom production. 90
Including bee keeping. 91
Women, children, minorities, handicapped people etc.

108
Economic goals covered in this region or country For legal reasons:
For other reasons:
Social goals covered in this region or country For legal reasons:
For other reasons:
Governance goals covered in this region or coun-try
For legal reasons:
For other reasons:
Compliance with standards for better…
…environmental sustainability performance Name:
Sustainability goals covered (achieved level in brackets):
…economic sustainability performance Name:
Sustainability goals covered (achieved level in brackets):
…social sustainability performance Name:
Sustainability goals covered (achieved level in brackets):
…governance sustainability performance Name:
Sustainability goals covered (achieved level in brackets):

109
Appendix C
SAFA report template
Descriptive part
Statement of goals
Scope of the assessment
Description of the analysed entity
Sphere of influence: material, spatial and temporal system boundaries
Description and justification of cut-off criteria
Description and justification of allocation rules
Relevance and compliance check
Relevance check at entity level
Hot-spot analysis at regional level
Compliance check at entity level (e.g. compliance with voluntary sustainability standards)
Description and justification of sustainability theme and sub-theme omissions
Indicators selected
Description and justification of indicators (based on part C of the SAFA Guidelines)
Data sources
Internal data of the analysed entity
Ancillary data used for the assessment
Analytical part
Results
Interpretation
Sustainability deficits and potentials
Possible improvement measures
Limitations of the assessment
Critical review
Critical review of the assessment procedure
Critical review of the assessment results and interpretation