sustainability - ashrae indiaashraeindia.org/pdf/sustainability_jai.pdf · sustainability jai...
TRANSCRIPT

SUSTAINABILITY
Jai Vardhan YadavSustainability consultantAECOM India Pvt. ltd.
“Sustainability programme for the benefits and awareness of the students”G B Pant Polytechnic, Okhla New Delhi

Effectively, the provision of energy such that it meets the needs of the present withoutcompromising the ability of future generations to meet their own needs.
Dynamic harmony between equitable availability of energy-intensive goods andservices to all people and the preservation of the earth for future generations." And,"the solution will lie in finding sustainable energy sources and more efficient means ofconverting and utilizing energy."
– J. W. Tester

GREEN BUILDINGS…..

"A green building uses less energy, water and natural resources, creates lesswaste and is healthier for the people living inside compared to a standardbuilding”
– Indian Green Building Council (IGBC)
Conserves Energy
Saves Water
Uses Environmentally Sensitive Material
Provides Productive Indoor Environment
Generates Less Waste & Pollution
Patni ComputersPlatinum Rating
CII, HyderabadPlatinum Rating
Wipro Tech., Gurgaon
Platinum RatingITC, Gurgaon
Platinum RatingSpectral Services, Noida
Platinum Rating

GREEN BUILDING RATING SYSTEMS
Defines Building design parameters
Third Party validation
Recognizes achievement
Transform markets to eco-friendly designs
International benchmark of quality &
“greenness”
Marketability

8/21/20138/21/2013
Overview Sustainable Sites Energy & Atmosphere Indoor Env. QualityWater Efficiency Material & Resources
In India,
Green Building Movement has been started by
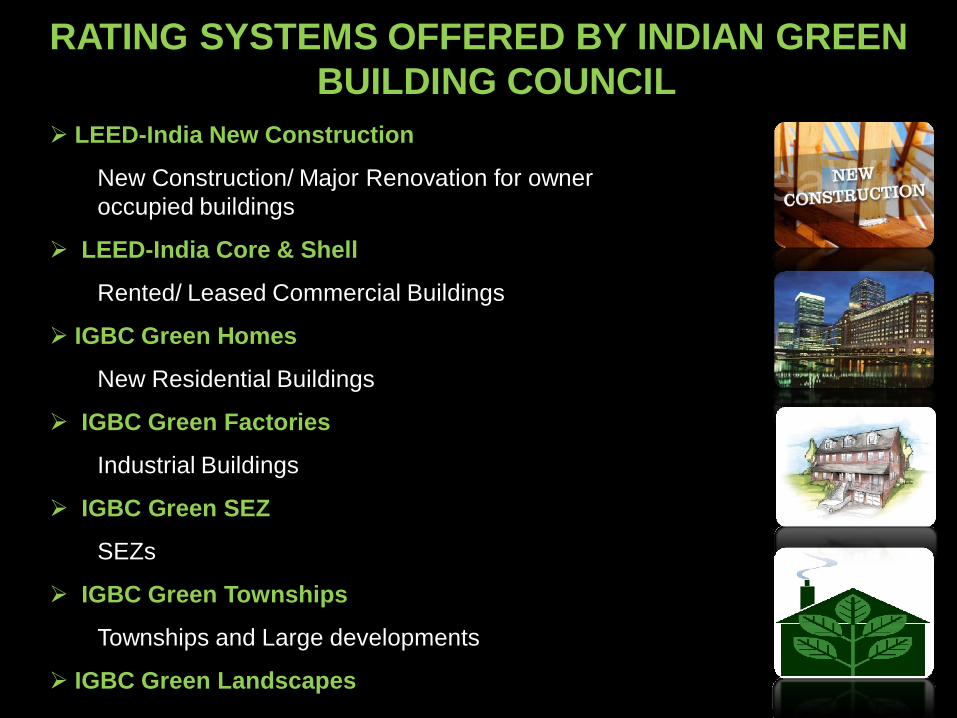
LEED-India New Construction
New Construction/ Major Renovation for owner occupied buildings
LEED-India Core & Shell
Rented/ Leased Commercial Buildings
IGBC Green Homes
New Residential Buildings
IGBC Green Factories
Industrial Buildings
IGBC Green SEZ
SEZs
IGBC Green Townships
Townships and Large developments
IGBC Green Landscapes
RATING SYSTEMS OFFERED BY INDIAN GREEN BUILDING COUNCIL
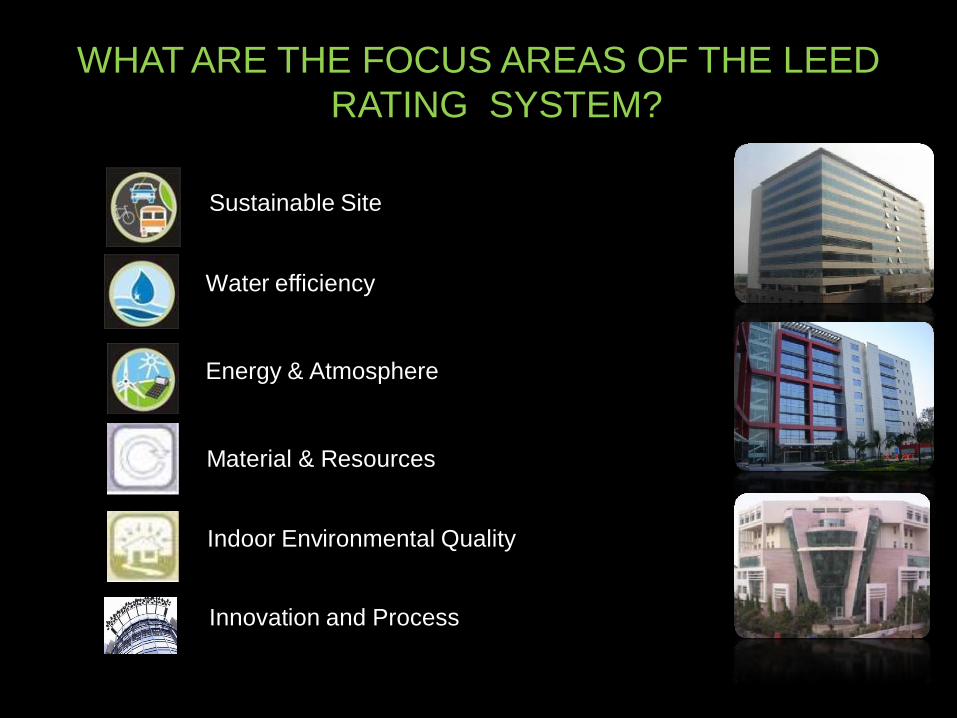
Water efficiency
Indoor Environmental Quality
Energy & Atmosphere
Material & Resources
WHAT ARE THE FOCUS AREAS OF THE LEED RATING SYSTEM?
Innovation and Process
Sustainable Site

Traditional Indian Buildings & Green Buildings…..
Common Features
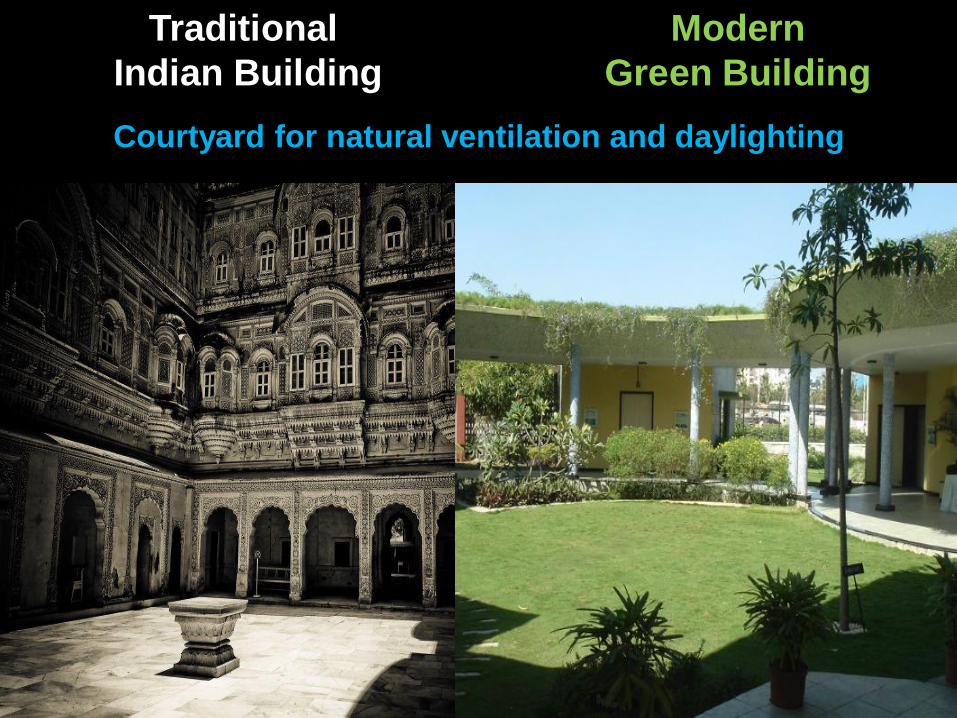
TraditionalIndian Building
Modern Green Building
Courtyard for natural ventilation and daylighting

TraditionalIndian Building
Modern Green Building
Well lit interiors with minimum openings

TraditionalIndian Building
Modern Green Building
Shading devices

TraditionalIndian Building
Modern Green Building
Jali for shading & natural ventilation

TraditionalIndian Building
Modern Green Building
Wind catchers for natural air conditioning

TraditionalIndian Building
Modern Green Building
Insulated roof

TraditionalIndian Building
Modern Green Building
Rainwater harvesting system

Weather data analysis
Natural ventilation analysis
Thermal comfort analysis
Day light analysis
Views analysis
Building thermal analysis
Building energy analysis
HOW TO START?
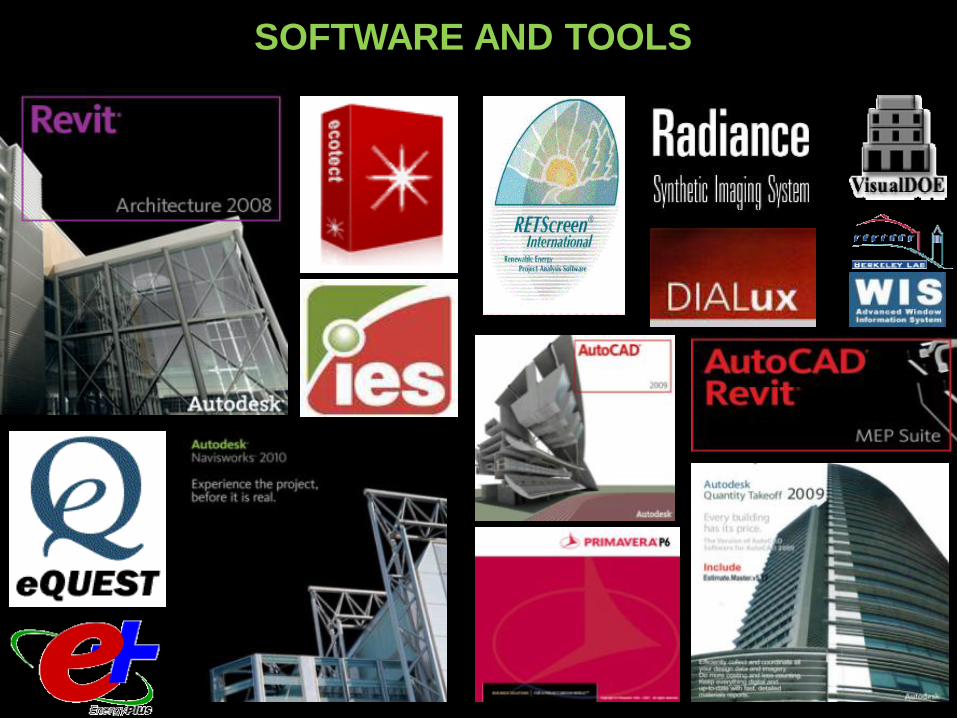
SOFTWARE AND TOOLS

-10
LEGENDTemperatureRel.Humidity
Direct SolarDiffuse Solar
Wind Speed Cloud Cover
WEATHER DATA ANALYSIS
Jan14th 28th
Feb14th 28th
Mar14th 28th
Apr14th 28th
May14th 28th
Jun14th 28th
Jul14th 28th
Aug14th 28th
Sep14th 28th
Oct14th 28th
Nov14th 28th
Dec14th 28th
1st January to 31st December
-10 -10
0 0
10 10
20 20
30 30
40 40
°C °CDRY BULB TEMPERATURE - ABU DHABI, ARE
Jan14th 28th
Feb14th 28th
Mar14th 28th
Apr14th 28th
May14th 28th
Jun14th 28th
Jul14th 28th
Aug14th 28th
Sep14th 28th
Oct14th 28th
Nov14th 28th
Dec14th 28th
1st January to 31st December
-10 -10
0 0
10 10
20 20
30 30
40 40
°C °CWET BULB TEMPERATURE - ABU DHABI, ARE
Jan14th 28th
Feb14th 28th
Mar14th 28th
Apr14th 28th
May14th 28th
Jun14th 28th
Jul14th 28th
Aug14th 28th
Sep14th 28th
Oct14th 28th
Nov14th 28th
Dec14th 28th
1st January to 31st DecemberRELATIVE HUMIDITY - ABU DHABI, ARE
0% 0%
20% 20%
40% 40%
60% 60%
80% 80%
100% 100%
Jan14th 28th
Feb14th 28th
Mar14th 28th
Apr14th 28th
May14th 28th
Jun14th 28th
Jul14th 28th
Aug14th 28th
Sep14th 28th
Oct14th 28th
Nov14th 28th
Dec14th 28th
1st January to 31st DecemberDIRECT SOLAR - ABU DHABI, ARE
0.00k 0.00k
0.20k 0.20k
0.40k 0.40k
0.60k 0.60k
0.80k 0.80k
1.00k 1.00k
W/m² W/m²
Jan14th 28th
Feb14th 28th
Mar14th 28th
Apr14th 28th
May14th 28th
Jun14th 28th
Jul14th 28th
Aug14th 28th
Sep14th 28th
Oct14th 28th
Nov14th 28th
Dec14th 28th
1st January to 31st DecemberDIFFUSE SOLAR - ABU DHABI, ARE
0.00k 0.00k
0.20k 0.20k
0.40k 0.40k
0.60k 0.60k
0.80k 0.80k
1.00k 1.00k
W/m² W/m²
Jan14th 28th
Feb14th 28th
Mar14th 28th
Apr14th 28th
May14th 28th
Jun14th 28th
Jul14th 28th
Aug14th 28th
Sep14th 28th
Oct14th 28th
Nov14th 28th
Dec14th 28th
1st January to 31st DecemberCLOUD COVER - ABU DHABI, ARE
0% 0%
20% 20%
40% 40%
60% 60%
80% 80%
100% 100%
Dry-Bulb Temp. Wet-Bulb Temp. Relative Humidity
Diffuse Solar Radiation Direct Solar Radiation Cloud CoverN
15°
30°
45°
60°
75°
90°
105°
120°
135°
150°
165°180°
195°
210°
225°
240°
255°
270°
285°
300°
315°
330°
345°
10°
20°
30°
40°
50°
60°
70°
80°
8910111213141516171st Jan
1st Feb
1st Mar
1st Apr
1st May
1st Jun 1st Jul
1st Aug
1st Sep
1st Oct
1st Nov
1st Dec
Solar GeometryWind Analysis

Wind rises below show that the predominant wind direction in the summer as well as winter months is West, South-West & North, North-East respectively.
ANNUAL WIND PROFILE STUDY
March - OctoberNovember - February
Prevailing winds around the yearHumidity Temperature

PSYCHOMETRIC CHARTPSYCHOMETRIC CHART
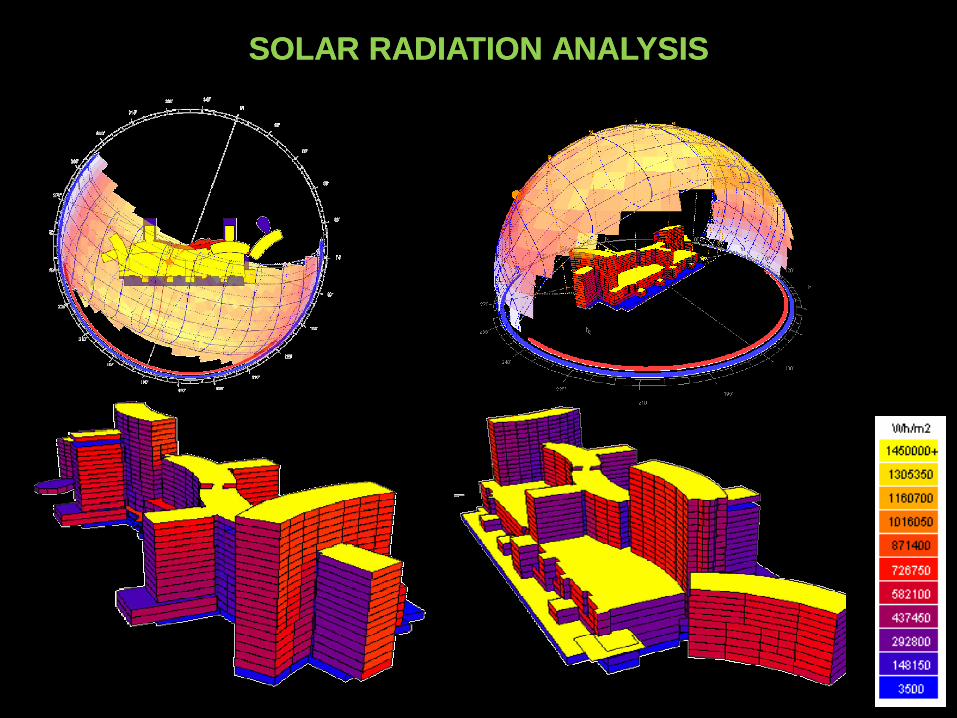
SOLAR RADIATION ANALYSISSOLAR RADIATION ANALYSIS

SOLAR SHADING ANALYSIS
07:00 AM 09:00 AM
11:00 AM 01:00 PM
03:00 AM 05:00 PM

SOLAR SHADING ANALYSIS
June December
After analyzing the solar path diagrams & temperature data for Delhi City, Sun Shadeshave been designed such that it will allow the winter sun to come in and block thesummer sun completely

VISUAL COMFORT & GLARE CONTROL ANALYSIS
With Proposed ShadingAs Designed
Outdoor courtyardHuman sensitivity rendering
Outdoor courtyard False color rendering
Indoor space Human sensitivity rendering
Indoor space False color rendering

DAYLIGHT & ENERGY ANALYSIS WITH WINDOW SIZES
305
310
315
320
325
AS IS W 80%
W 70%
W 60%
W 50%
W 40%
W 30%
W 20%
Ann
ual
(MW
h)Light Electricity
consumption
740
745
750
AS IS
Ann
ual
(MW
h)
HVAC Electricity consumption
3,930
3,935
3,940
3,945
3,950
AS IS W 80%
W 70%
W 60%
W 50%
W 40%
W 30%
W 20%
Ann
ual
(MW
h)
Total Electricity consumption
Case A Case BCase C
Case C 30% of As-IsCase B 60% of As-IsCase A As-Is
%
2.00+
1.80
1.60
1.40
1.20
1.00
0.80
0.60
0.40
0.20
-0.00
DF %
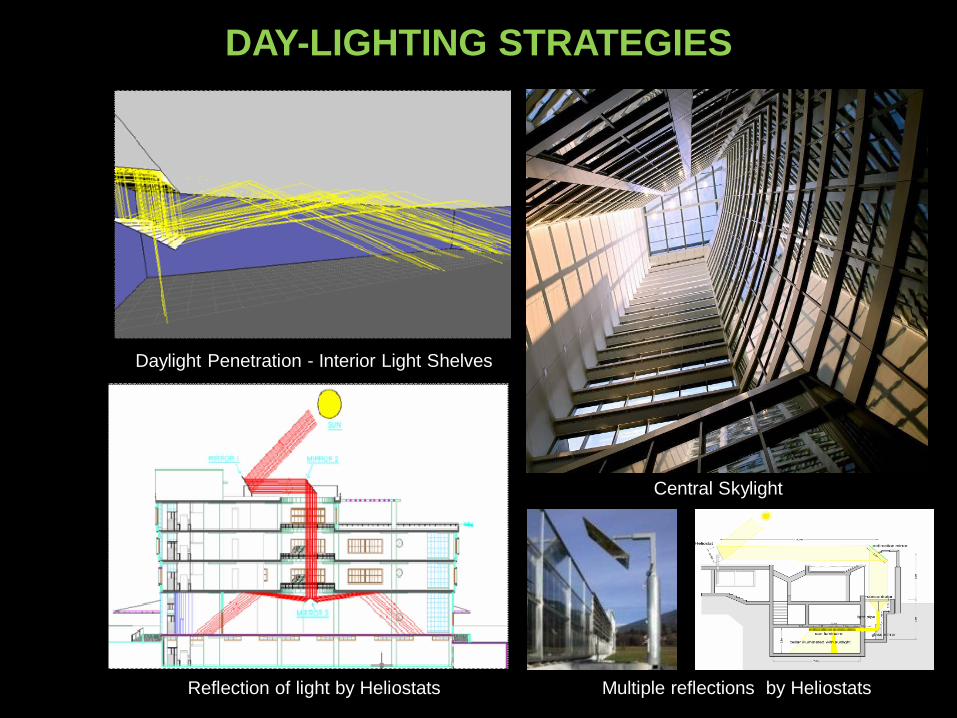
DAY-LIGHTING STRATEGIES
Central Skylight
Multiple reflections by Heliostats
Daylight Penetration - Interior Light Shelves
Reflection of light by Heliostats

NATURAL VENTILATION ANALYSIS
Plantation of mix of tall and medium sized deciduous and evergreen trees to create a negative pressure for wind flow on the southern side.
Introducing creepers and climbers on a vertical bamboo trails structure above human breathing zone and installing misters which can be switched on during summer time to provide evaporative cooling in the space.
Summer wind
Blocking of Summer Winds
On South side by Trees
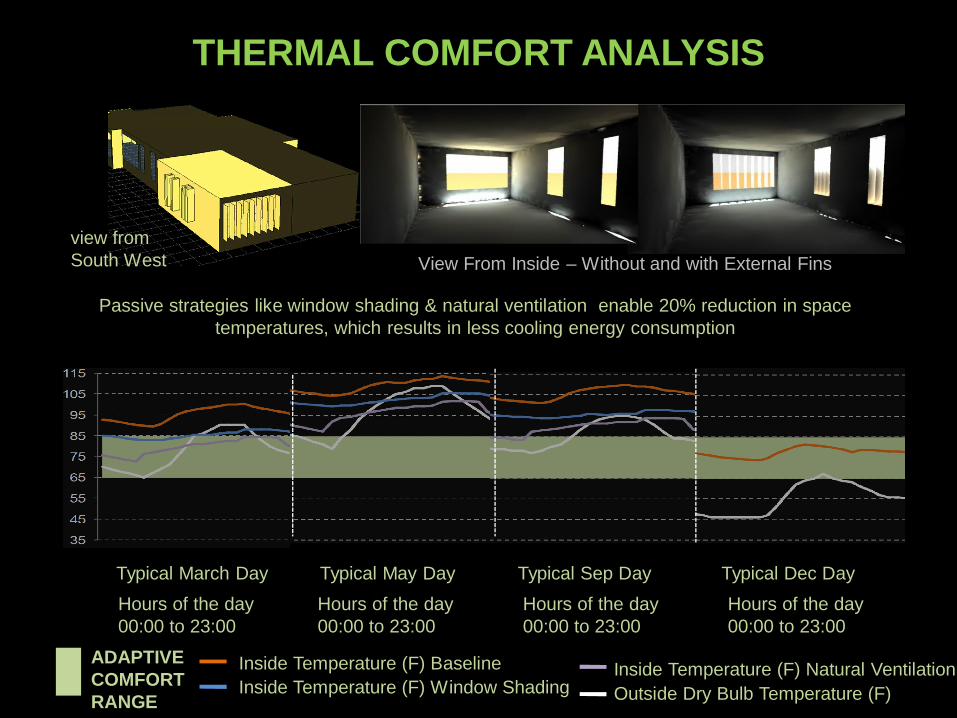
THERMAL COMFORT ANALYSIS
View From Inside – Without and with External Fins
view from south west
Typical March Day Typical May Day Typical Sep Day Typical Dec DayHours of the day 00:00 to 23:00
Hours of the day 00:00 to 23:00
Hours of the day 00:00 to 23:00
Hours of the day 00:00 to 23:00
Inside Temperature (F) BaselineInside Temperature (F) Window Shading
Inside Temperature (F) Natural VentilationOutside Dry Bulb Temperature (F)
ADAPTIVECOMFORTRANGE
view from South West
Passive strategies like window shading & natural ventilation enable 20% reduction in space temperatures, which results in less cooling energy consumption
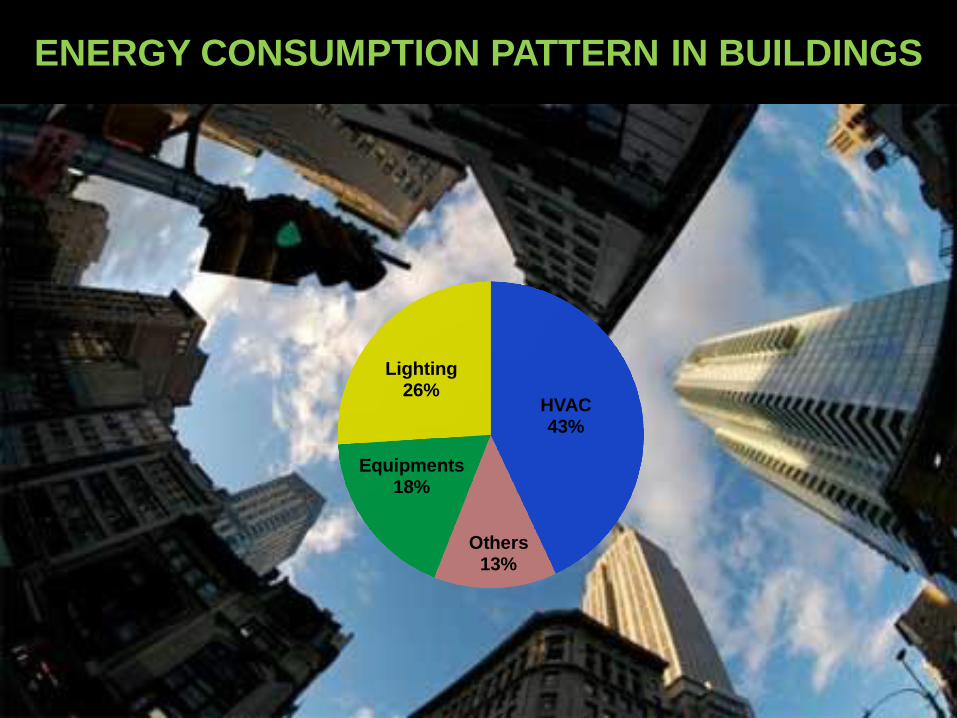
HVAC 43%
Others13%
Equipments18%
Lighting26%
ENERGY CONSUMPTION PATTERN IN BUILDINGS
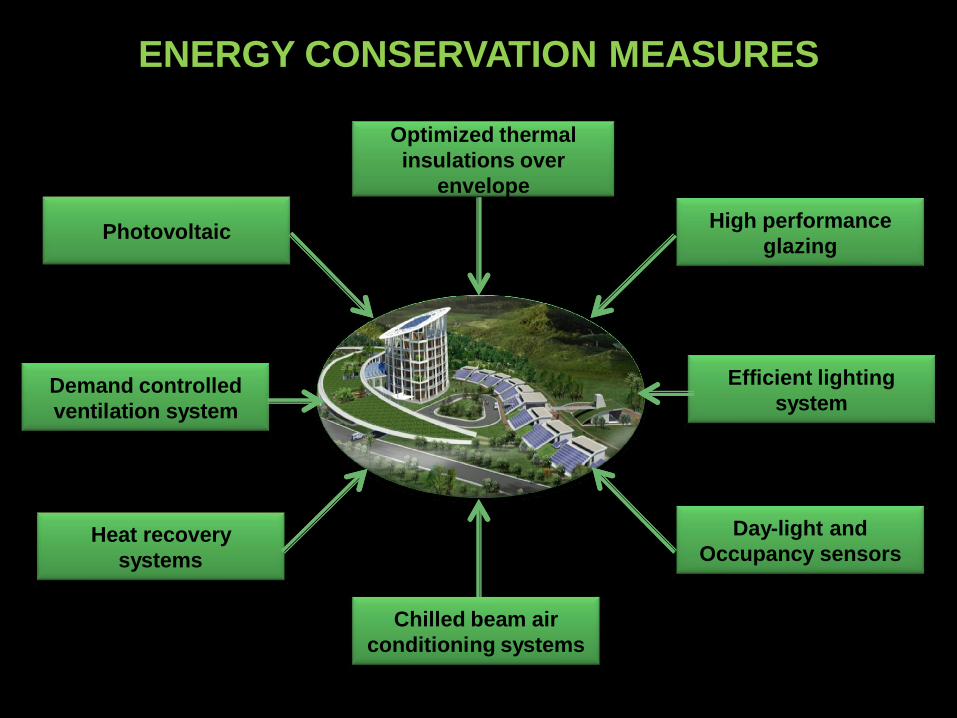
Optimized thermal insulations over
envelopeHigh performance
glazing
Efficient lightingsystem
Chilled beam air conditioning systems
Demand controlled ventilation system
Day-light and Occupancy sensors
Heat recovery systems
Photovoltaic
ENERGY CONSERVATION MEASURES
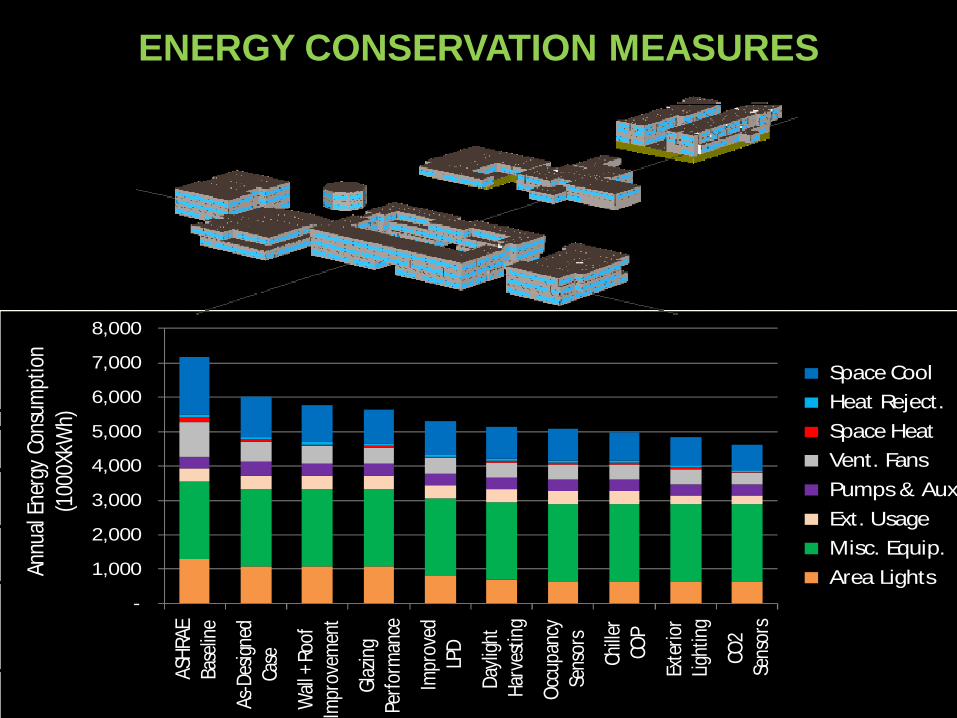
-
1,000
2,000
3,000
4,000
5,000
6,000
7,000
8,000
ASHR
AE
Base
line
As-D
esign
edCa
se
Wall
+ Ro
ofIm
prov
emen
t
Glaz
ingPe
rform
ance
Impr
oved
LPD
Dayli
ght
Harv
estin
g
Occu
panc
ySe
nsor
s
Chille
rCO
P
Exte
rior
Light
ing
CO2
Sens
ors
Annu
al En
ergy
Con
sum
ptio
n (1
000X
kWh)
Space CoolHeat Reject.Space HeatVent. FansPumps & Aux.Ext. UsageMisc. Equip.Area Lights
ENERGY CONSERVATION MEASURES

NON CONVENTIONAL ENERGY GENERATION TECHNIQUE
Urban Scale Small Wind Turbines Integrated on Building Roof
Solar PV Panels Proposed at the South facing Ground bump.
0
20
40
Jan Feb Mar Apr May Jun Jul Aug Sep Oct Nov DecAnnu
al c
onsu
mpt
ion
(MW
h)
Total HVAC consumption with and without Geothermal Cooling
Without Geothermal Geothermal

EXTERIOR LIGHTING SIMULATION
3D view of Calculux 3D view of Dialux
0 0.1
0.2
0.5
1.0
1.5
2.0
2 m Compound Wall
15 ft buffer area beyond site boundary
Exterior Light Fixture
External Light Levels in Lux

CASE STUDY

India’s FIRST NET ZERO ENERGY OFFICEbuildingBayer Initiative towards ‘Climate Protection’LEED – India NC rating system PLATINUMGREENEST building in India scoring a total 64LEED points out of possible 69
Project detailsSite Area = 2.1 acreBuilt Up Area = 9600 sqftNumber of Floors = G+1Estimated No. of Occupants = 50Window to Wall Ratio (WWR) = 30%
ECO COMMERCIAL BUILDING

ENERGY EFFICIENCY MEASURES
MINIMUM TARGET FOR NET-ZERO
GAP
TO
BRID
GE
REACHING NET ZERO
X 1000 KWH

Parameter Typical Orientation Roof Insulation
Elec. Load (kWh) 1,32716 1,31,123 1,27,274
Cooling Load (TR) 77 74 65
Carbon Emissions (Tns) 114 112 109
Orientation 1.2 % Savings
0
200
400
600
800
1,000
1,200
1 2 3 4 5 6 7 8 9 10 11 12 13
Cons
umpt
ion
(MW
h)
Roof Insulation 2.9 %
0
200
400
600
800
1,000
1,200
1 2 3 4 5 6 7 8 9 10 11 12 13Co
nsum
ptio
n (M
Wh)
Savings
Cumulative Savings 4.1%

Parameter Last ECM Wall Insulation Window Assembly
Elec. Load (kWh) 1,27,274 1,23,160 1,20,373
Cooling Load (TR) 65 58 49
Carbon Emissions (Tns) 109 105 103
Wall Insulation 3.1 % Savings
Window Assembly 2.9 %Savings
Insulated WallNorth East, South West, South East Facade:U-value-0.016 Btu/hr.ft2 FNorth West Facade:U-value-0.0393 Btu/hr.ft2 F
0
200
400
600
800
1,000
1,200
1 2 3 4 5 6 7 8 9 10 11 12 13
Cons
umpt
ion
(MW
h)0
200
400
600
800
1,000
1,200
1 2 3 4 5 6 7 8 9 10 11 12 13Co
nsum
ptio
n (M
Wh)
Cumulative Savings 9.3%
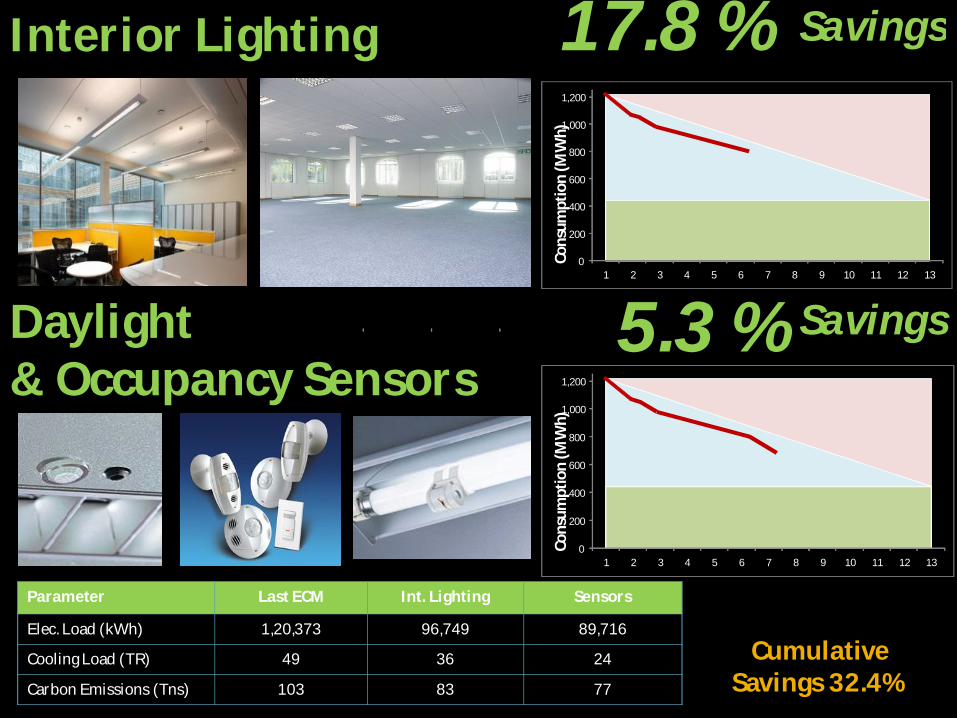
Parameter Last ECM Int. Lighting Sensors
Elec. Load (kWh) 1,20,373 96,749 89,716
Cooling Load (TR) 49 36 24
Carbon Emissions (Tns) 103 83 77
Interior Lighting 17.8 % Savings
Daylight & Occupancy Sensors
5.3 %Savings0
200
400
600
800
1,000
1,200
1 2 3 4 5 6 7 8 9 10 11 12 13
Cons
umpt
ion
(MW
h)0
200
400
600
800
1,000
1,200
1 2 3 4 5 6 7 8 9 10 11 12 13Co
nsum
ptio
n (M
Wh)
Cumulative Savings 32.4%
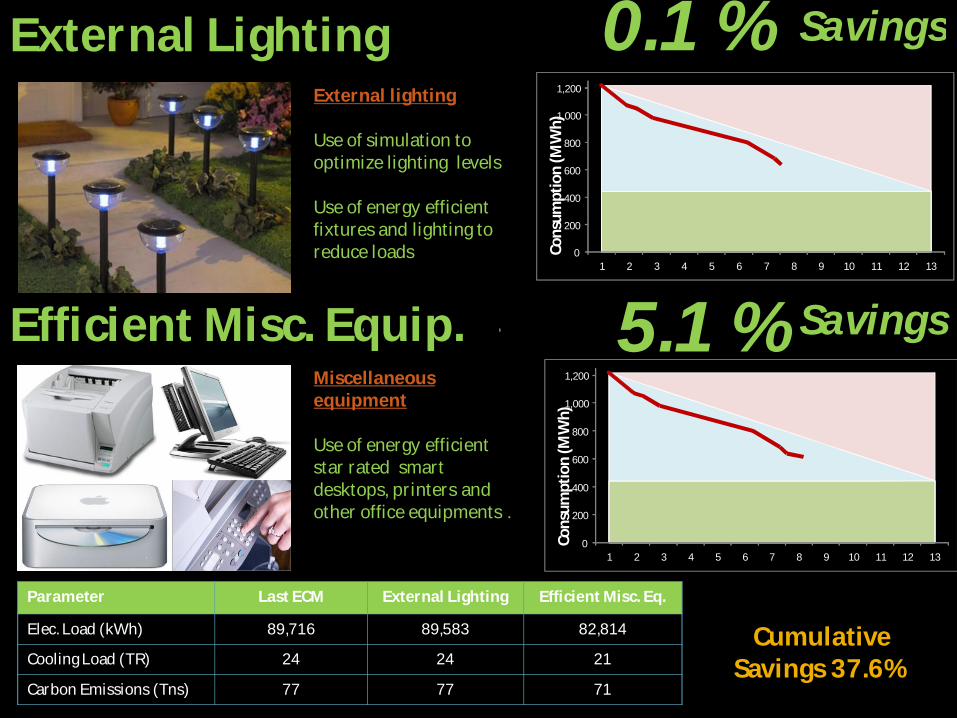
Parameter Last ECM External Lighting Efficient Misc. Eq.
Elec. Load (kWh) 89,716 89,583 82,814
Cooling Load (TR) 24 24 21
Carbon Emissions (Tns) 77 77 71
External Lighting 0.1 % Savings
Efficient Misc. Equip. 5.1 %Savings
External lighting
Use of simulation to optimize lighting levels
Use of energy efficient fixtures and lighting to reduce loads
Miscellaneous equipment
Use of energy efficient star rated smart desktops, printers and other office equipments .
0
200
400
600
800
1,000
1,200
1 2 3 4 5 6 7 8 9 10 11 12 13
Cons
umpt
ion
(MW
h)0
200
400
600
800
1,000
1,200
1 2 3 4 5 6 7 8 9 10 11 12 13Co
nsum
ptio
n (M
Wh)
Cumulative Savings 37.6%
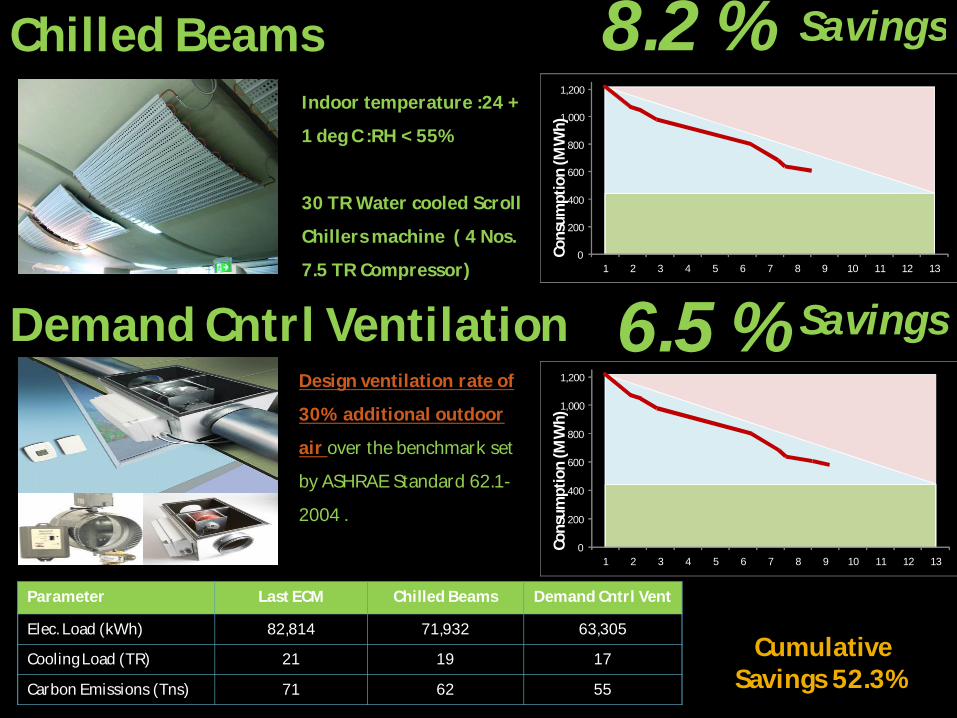
Parameter Last ECM Chilled Beams Demand Cntrl Vent
Elec. Load (kWh) 82,814 71,932 63,305
Cooling Load (TR) 21 19 17
Carbon Emissions (Tns) 71 62 55
Chilled Beams 8.2 % Savings
Demand Cntrl Ventilation 6.5 %Savings
Indoor temperature :24 +
1 deg C :RH < 55%
30 TR Water cooled Scroll
Chillers machine ( 4 Nos.
7.5 TR Compressor) 0
200
400
600
800
1,000
1,200
1 2 3 4 5 6 7 8 9 10 11 12 13
Cons
umpt
ion
(MW
h)
Design ventilation rate of
30% additional outdoor
air over the benchmark set
by ASHRAE Standard 62.1-
2004 . 0
200
400
600
800
1,000
1,200
1 2 3 4 5 6 7 8 9 10 11 12 13Co
nsum
ptio
n (M
Wh)
Cumulative Savings 52.3%

Parameter Last ECM Heat Recovery Efficient Chillers
Elec. Load (kWh) 63,305 61,712 55,077Cooling Load (TR) 17 16 16Carbon Emissions (Tns) 55 53 47
Heat Recovery 1.2 % Savings
Efficient Chiller 5.0 %Savings
Cumulative Savings 58.5%
0
200
400
600
800
1,000
1,200
1 2 3 4 5 6 7 8 9 10 11 12 13
Cons
umpt
ion
(MW
h)0
200
400
600
800
1,000
1,200
1 2 3 4 5 6 7 8 9 10 11 12 13C
onsu
mpt
ion
(MW
h)

Parameter Last ECM Efficient pumps Efficient Chillers
Elec. Load (kWh) 55,077 54,546 55,077Cooling Load (TR) 16 16 16Carbon Emissions (Tns) 47 46 47
Efficient Pumps 0.4 % Savings
Cumulative Savings 60%
0
200
400
600
800
1,000
1,200
1 2 3 4 5 6 7 8 9 10 11 12 13
Cons
umpt
ion
(MW
h)60% SAVINGS THROUGH
CONVENTIONAL & PASSIVE STRATEGIES
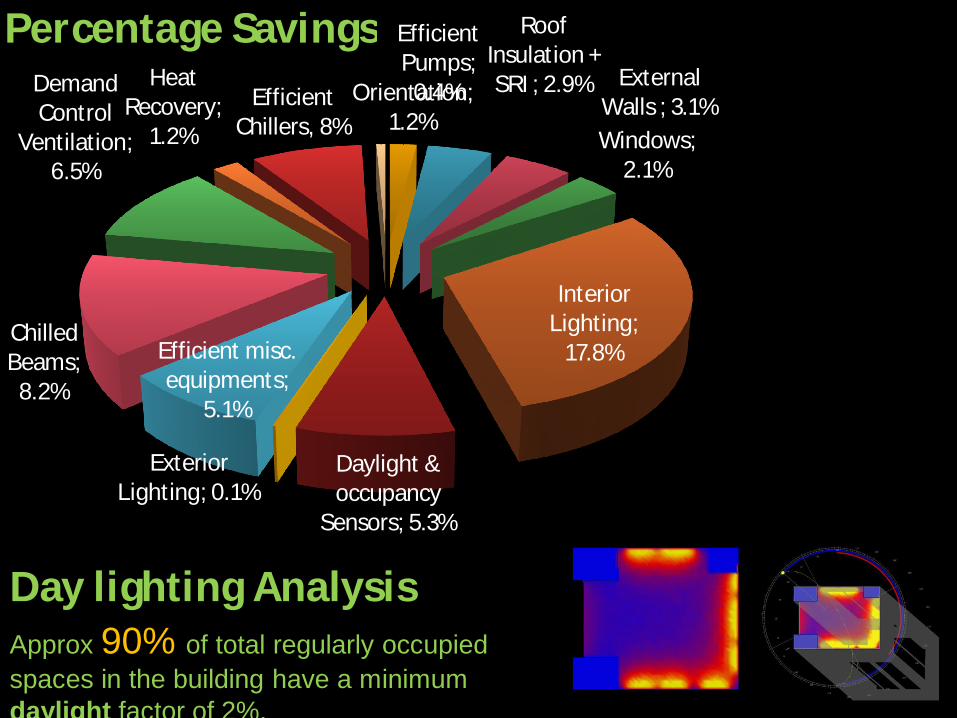
Orientation; 1.2%
Roof Insulation + SRI ; 2.9% External
Walls ; 3.1%Windows;
2.1%
Interior Lighting;
17.8%
Daylight & occupancy
Sensors; 5.3%
Exterior Lighting; 0.1%
Efficient misc. equipments;
5.1%
Chilled Beams;
8.2%
Demand Control
Ventilation;6.5%
Heat Recovery;
1.2%
Efficient Chillers, 8%
Efficient Pumps;
0.4%
Percentage Savings
Day lighting AnalysisApprox 90% of total regularly occupied spaces in the building have a minimum daylight factor of 2%.
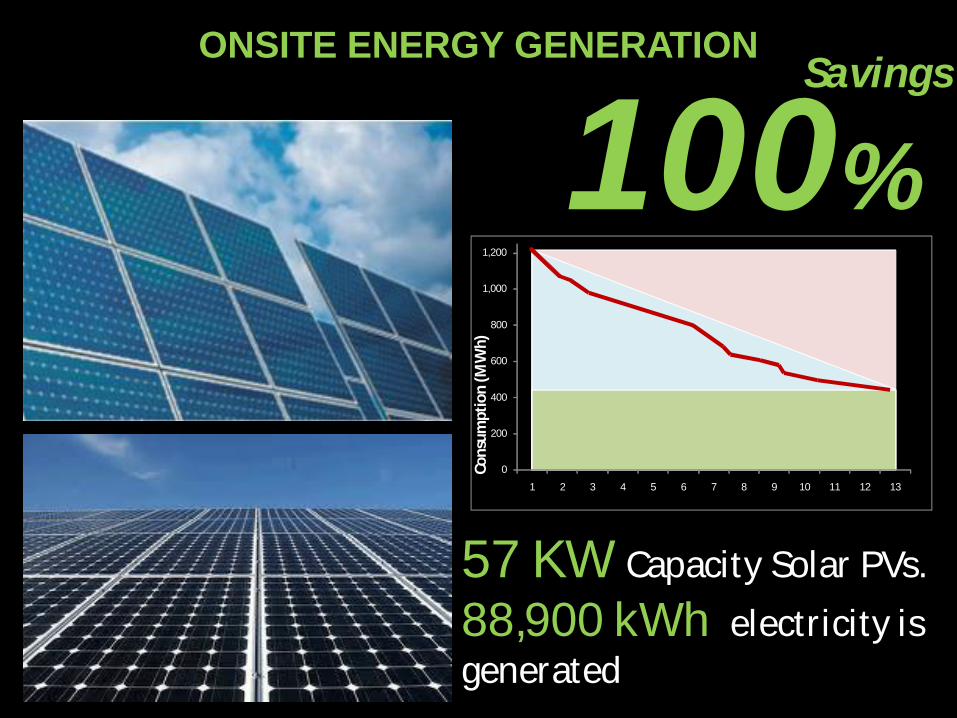
57 KW Capacity Solar PVs. 88,900 kWh electricity is generated
100%Savings
0
200
400
600
800
1,000
1,200
1 2 3 4 5 6 7 8 9 10 11 12 13Co
nsum
ptio
n (M
Wh)
ONSITE ENERGY GENERATION

ANNUAL NET POSITIVE ENERGY PERFORMANCE
Solar Energy
Consumed 63,910
Solar Energy
Generated72,023
Air Conditionin
g48045
Lighting 3227
Equipment 12638
Excess Solar Energy Generated - 8113
One Complete Year Energy production and Consumption Data (from January 11,2011 to January 10, 2012)

Jai Vardhan YadavSustainability consultantAECOM India Pvt. ltd.
THANK YOU