sustainability and freight transportation in north america
TRANSCRIPT
TEXAS TRANSPORTATION INSTITUTE THE TEXAS A&M UNIVERSITY SYSTEM
COLLEGE STATION, TEXAS
March 2010
Sustainability and Freight
Transportation in North America Foundation Paper

SUSTAINABILITY AND FREIGHT TRANSPORTATION IN NORTH AMERICA
FOUNDATION PAPER
Prepared for The Commission on Environmental Cooperation
by
Juan Carlos Villa
Program Manager, Economics, Trade, and Logistics Program
and
Annie Protopapas Associate Research Scientist, Multimodal Freight Transportation Programs
Texas Transportation Institute The Texas A&M University System
College Station, Texas
May 2010
i
TABLE OF CONTENTS Page
List of Figures ................................................................................................................................. ii List of Tables ................................................................................................................................. iii Introduction..................................................................................................................................... 1 Chapter 1. Freight Transportation and Greenhouse Gases in North America ............................... 3
1.1 International Freight Transportation ..................................................................................... 4 1.2 Intra-North American Freight Transportation ...................................................................... 7 1.3 Domestic Freight Transportation ........................................................................................ 12 1.4 Greenhouse Gases from Land-Based Freight Transportation............................................. 13 1.5 Aviation and Marine Emissions.......................................................................................... 18 1.6 Stakeholders and Roles ....................................................................................................... 20
Chapter 2. State-of-Practice in Measurement/Estimation of GHG Emissions from Freight Transportation ............................................................................................................................... 25
2.1 Direct GHG Emissions Methods/Models ........................................................................... 26 2.2 Lifecycle Assessment GHG Emissions Methods/Models .................................................. 33 2.3 Future Opportunities ........................................................................................................... 37
Chapter 3. Strategies to Mitigate GHG Emissions from Freight Transportation ......................... 41 3.1 Fuel Technologies............................................................................................................... 42 3.2 Vehicle Technologies.......................................................................................................... 49 3.3 System Optimization/Operational Efficiency ..................................................................... 53 3.4 Smart/Sustainable growth ................................................................................................... 62 3.5 Market-Based Mechanisms................................................................................................. 63
Chapter 4. Programs and Policies to Mitigate GHG Emissions from Freight Transportation ..... 69 4.1 North America .................................................................................................................... 70 4.2 United States ....................................................................................................................... 73 4.3 Canada................................................................................................................................. 82 4.4 Mexico ................................................................................................................................ 87 4.5 International ........................................................................................................................ 87
Chapter 5. Opportunities............................................................................................................... 93 5.1 Short-Medium Term Opportunities .................................................................................... 93 5.2 Medium-Long Term Opportunities..................................................................................... 95 5.3 Epilogue .............................................................................................................................. 97

ii
LIST OF FIGURES
Page
Figure 1. U.S. CO2 Emissions by Economic Sector and Fuel, 2007 & 2030. ................................ 3 Figure 2. World CO2 Emissions, 2006 & 2030. ............................................................................. 4 Figure 3. Top North American Maritime Container Ports.............................................................. 6 Figure 4. North American Container Port Traffic. ......................................................................... 7 Figure 5. U.S. Land Trade with Canada and Mexico. .................................................................... 8 Figure 6. U.S. Land Trade with Canada and Mexico by Mode. ..................................................... 9 Figure 7. 2008 U.S.-Canada and U.S.-Mexico Major Land Ports of Entry.................................. 10 Figure 8. North American Class I Railroad Network. .................................................................. 11 Figure 9. U.S. Transportation GHG Emissions by Transportation Mode, 2006. ......................... 15 Figure 10. U.S. Transportation GHG Emissions by Transportation Mode, 2000-2006. .............. 16 Figure 11. Canada Transportation GHG Emissions by Transportation Mode, 2006. 10 ............... 16 Figure 12. Canada Transportation GHG Emissions by Transportation Mode, 1990-2006.10....... 17 Figure 13. Mexico GHG Emissions by Transportation Mode, 2002. 11........................................ 18 Figure 14. Ton-Miles per Gallon of Fuel...................................................................................... 60 Figure 15. Tons of CO2 per Million Ton-Miles............................................................................ 61 Figure 16. North American Cap-and-Trade Regional Initiatives. ................................................ 72 Figure 17. U.S. State GHG Inventories. ....................................................................................... 78 Figure 18. U.S. State Climate Action Plans.................................................................................. 79 Figure 19. U.S. Regional GHG Initiatives.................................................................................... 80

iii
LIST OF TABLES
Page
Table 1. 2007 Domestic Freight Movement by Country. ............................................................. 12 Table 2. Transportation GHG Emissions in North America......................................................... 14 Table 3. The Transportation Lifecycle.......................................................................................... 34 Table 4. Summary of Truck and Rail GHG Mitigation Strategies. , ............................................. 66

1
INTRODUCTION
This study was carried out by the Texas Transportation Institute (TTI) on behalf of the Commission for Environmental Cooperation (CEC). This report is the “Foundation Paper” section of a larger report by the CEC under Article 13 “Towards Sustainable Freight Transportation in North America.” The objective of the Foundation Paper was to provide the basic facts and figures on the freight transportation system in North America, as they relate to greenhouse gases (GHG) emissions, and an overview of the related issues that exist or are expected to arise.
Transportation via all modes is one of the major contributors to greenhouse gases, responsible for 25% of the world’s GHG emissions.1 However, the proportion of GHG produced by the movement of freight is not well documented. The intent of this report is to provide basic facts and figures on the land-based freight transportation system in North America as it relates to GHG production, and an overview of the issues that exist or are expected to arise.
The report is organized in five chapters. Chapter 1 introduces and describes the freight transportation system in North America, analyzing its components and its associated GHG emission levels in each country. Chapter 2 presents the state of the practice in measuring and estimating GHGs from truck and rail transportation. Chapter 3 presents available truck and rail GHG mitigation strategies, while Chapter 4 presents programs and policies enacted worldwide to deploy the various strategies and mitigate GHGs in general. Chapter 5 presents a group of short- and long-term opportunity areas for action by the North American governments and associated recommendations for implementation.
1 Global Renewable Fuels Alliance. Copenhagen COP 15 must address GHGs in Transportation Fuels: Low carbon biofuels have a vital role to play. http://www.globalrfa.org/pr_110309.php. Accessed November 2009.


3
CHAPTER 1. FREIGHT TRANSPORTATION AND GREENHOUSE GASES IN NORTH AMERICA
The economy in North America requires a safe and reliable movement of goods
domestically (within each of the three countries, the United States, Canada, and Mexico), and internationally (between the three countries and with external trading partners). Modern supply chains require an efficient and cost-effective transportation of all kinds of products, from raw materials, such as coal and corn, to finished products, such as electronics and appliances. World economic growth has resulted in increasing freight flows that impose costs to shippers, consumers, and the environment. As demand for goods increases so do the GHG emissions from freight transportation.
Petroleum is forecasted to remain the main source for energy of the transportation sector in the next 20 to 25 years, with consumption increasing. Figure 1 shows CO2 emissions in the U.S., by economy sector and fuel in 2007 and projections for 2030. A similar picture is expected internationally.
Figure 1. U.S. CO2 Emissions by Economic Sector and Fuel, 2007 & 2030.2
Global CO2 emissions are projected to grow at a slower rate over the next 25 years in
parts of the world where fossil fuels are expected to be gradually replaced by alternative sources of energy. However, China is projected to have the highest growth rate, at 2.8% annually from 2006 to 2030, reflecting the country’s continued heavy reliance on fossil fuels, especially coal (Figure 2).
2 U.S Department of Energy, Energy Information Administration. International Energy Outlook 2009 with Projections to 2030. http://www.eia.doe.gov/oiaf/aeo/emission.html. Accessed December 2009.

4
Figure 2. World CO2 Emissions, 2006 & 2030.3
In order to analyze the freight transportation system and its impacts on GHGs, it is
important to understand that this system is a mixture of public and private infrastructure, private carriers and shippers, planning and regulatory agencies, and other stakeholders interacting at global, continental, national, regional, and local scales.
Freight transportation in North America could be divided in three different types of commodity movements: International, Intra North American, and Domestic (within each country). For this analysis, North American international trade is defined as freight movements to and from the three North American countries and the rest of the world via maritime movement.
1.1 INTERNATIONAL FREIGHT TRANSPORTATION
International trade outside North America is primarily handled by maritime ports that
send or receive goods to and from other parts of the. Some ports handle petroleum products and other fluids that account for a large part of the total cargo tonnage. However, those products usually are processed in the port and do not leave the terminal or if they do, they are transported by pipeline and not by truck or rail. Therefore, the impact of GHG emissions from transporting these commodities that remain in the port region is relatively small compared to those from
3 Energy Information Administration, U.S Department of Energy. International Energy Outlook 2009. http://www.eia.doe.gov/oiaf/ieo/. Accessed December 2009.

5
transporting these commodities in and out of the ports by land transportation modes (truck and rail).
Containerized cargo has increased substantially in the world and containers usually are transported to/from consumption/production centers to and from ports by truck or rail. In North America, the top 25 ports by volume that handle containerized merchandise include 3 Canadian ports, 4 Mexican ports, and 18 U.S. ports (Figure 3). North American container port traffic doubled between 1995 and 2008 or experienced close to a 6% average annual growth rate in the period (Figure 4).4
4 American Association of Ports Authorities (AAPA). Port Industry Statistics. http://www.aapa-ports.org/Industry/content.cfm?ItemNumber=900&navItemNumber=551. Accessed November 2009.

6
Figure 3. Top North American Maritime Container Ports.

7
Figure 4. North American Container Port Traffic.
Container traffic is concentrated in a relatively few ports in North America. Three ports
handled 40% of the total container traffic in North America in 2008: Los Angeles, Long Beach, and New York/New Jersey. Container traffic is higher on the North American west coast than the Atlantic and Gulf of Mexico, due to the large international trade with China (currently the U.S. number two trading partner), which is mainly moved in the transpacific lines. Container traffic is measured in TEUs. TEU stands for “Twenty-Foot Equivalent Unit,” a standard linear measurement used in quantifying container traffic flows. As examples, one 20-ft long container equals one TEU while one 40-ft container equals two TEUs.
Once container traffic or other cargo that does not stay at the port for processing, like petroleum arrives at West Coast ports in North America it moves by truck or rail to production or consumption centers. This concept is known as “land-bridge” and is the movement of cargo by water through a port, then shifting modes to surface transportation (e.g., truck, rail). The most common land-bridge in North America is the intermodal system from Far East Asia to the U.S. East Coast, where containers from the Far East are transferred to railways in West Coast Ports in Los Angeles, Long Beach, Vancouver, Prince Rupert, Lazaro Cardenas, or Manzanillo and transported overland to the consumption centers in the East Coast.
1.2 INTRA-NORTH AMERICAN FREIGHT TRANSPORTATION
Commodity movement between the three North American countries is concentrated in commodities that are traded between Canada and the U.S. and between Mexico and the U.S., as the amount of goods shipped between Mexico and Canada is relatively small. Canada is the

8
number one U.S. trading partner and Mexico is the third U.S. trading partner. Most of the intra-North American freight movements are performed by land modes (truck and rail), except for petroleum products that are shipped by ocean within the Gulf of Mexico. U.S. land trade with Canada and Mexico by value almost doubled between 1995 and 2008. U.S. land trade with Mexico grew faster (average annual rate of 8.9%) than U.S.-Canada trade (average annual rate of 4.2%) (Figure 5).5
Figure 5. U.S. Land Trade with Canada and Mexico.
(Billion $US)
Truck is the dominant mode for the movement of goods between the three North American counties, handling 80% of the total value of trade between the U.S. and both Mexico and Canada (Figure 6). 5
5 Bureau of Transportation Statistics, Research and Innovative Technology Administration, U.S. Department of Transportation. North American TransBorder Freight Data. http://www.bts.gov/programs/international/transborder/TBDR_QA.html. Accessed December 2009.

9
Figure 6. U.S. Land Trade with Canada and Mexico by Mode.
(Billion $US)
With over 75 commercial land ports of entry along the U.S.-Canadian border and 25
along the U.S.-Mexican border, cross-border trade in North America is concentrated in a relatively small number of land ports of entry. In 2008, approximately half of the total truck and rail traffic by value in North America was handled by three land ports of entry: Detroit/Windsor; Laredo/Nuevo Laredo; and Buffalo/Niagara Falls.6
At the U.S-Canadian border, more than three quarters of the surface trade is handled by only five land ports of entry: Detroit/Windsor, Port Huron/Sarnia, Buffalo/Niagara falls, Champlain/Lacolle, and Pembina/Emerson; while at the U.S.-Mexican border only four ports of entry handled about the same amount of the total land trade (77%): Laredo/Nuevo Laredo, El Paso/Ciudad Juarez, Otay Mesa/Tijuana. and Pharr/Reynosa (Figures 7).
6 Bureau of Transportation Statistics, Research and Innovative Technology Administration, U.S. Department of Transportation. America’s Freight Transportation Gateways. 2004. http://www.bts.gov/publications/americas_freight_transportation_gateways/. Accessed December 2009.
10
Source: Developed by TTI with information from the U.S. Department of Transportation, Research
and Innovative Technology Administration, TransBorder Freight Data.
Figure 7. 2008 U.S.-Canada and U.S.-Mexico Major Land Ports of Entry.
Congestion at land ports of entry is a major source of GHG emisions. The lack of an agreement between the U.S. and Mexico to allow commercial vehicles to circulate in these countries generates a large movement of drayage trucks along the U.S./Mexican border. Currently, the operation of Mexican motor carriers in the U.S. is confined to a narrow commercial zone that generally extends up to 20 miles beyond the border. Because of this, Mexican truck shipments into the U.S. are required to use a drayage or transfer tractor, that are usually of older than the long-haul trucks used in North America. Drayage trucks pick up northbound trailers on the Mexico side of the border and shuttle them into the U.S. commercial zone where they are transferred to a U.S. carrier that delivers them to the final destination. Security inspections and the concentration of truck movement in few ports of entry generate congestion and truck idling that affects local communities.
Growth in international trade at land or maritime ports required a more efficient transportation system. Deregulation of the land modes (trucking and rail) allowed private sector stakeholders to organize more efficiently in order to support the growth in demand. Motor carrier industry deregulation has led to mergers and consolidations, greater efficiencies in the use of labor and equipment and price reductions for shippers. These changes have brought about an increase in the number of interstate motor carriers.
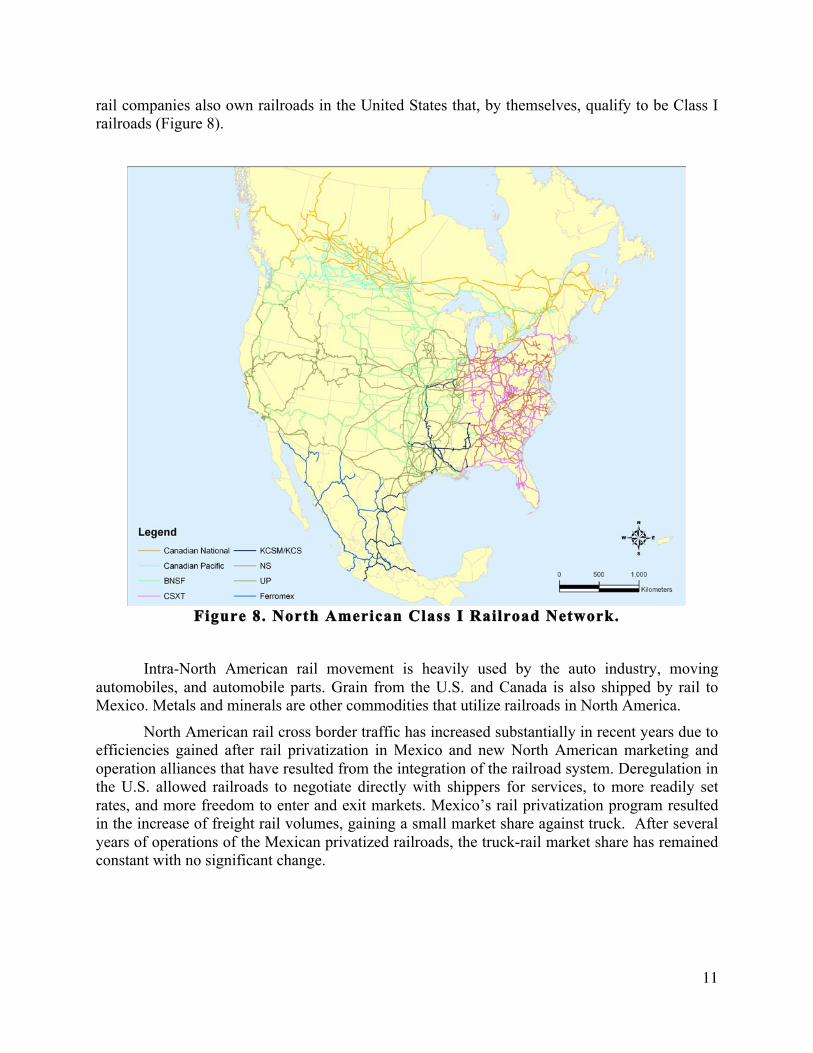
Class I Railroads are line haul freight railroads with 2008 operating revenue in excess of $401.4 million. There are seven Class I railroads in the U.S., and two Canadian and two Mexican railroads could be classified as Class I railroads if they were U.S. companies. The two Canadian

11
rail companies also own railroads in the United States that, by themselves, qualify to be Class I railroads (Figure 8).
Figure 8. North American Class I Railroad Network.
Intra-North American rail movement is heavily used by the auto industry, moving
automobiles, and automobile parts. Grain from the U.S. and Canada is also shipped by rail to Mexico. Metals and minerals are other commodities that utilize railroads in North America.
North American rail cross border traffic has increased substantially in recent years due to efficiencies gained after rail privatization in Mexico and new North American marketing and operation alliances that have resulted from the integration of the railroad system. Deregulation in the U.S. allowed railroads to negotiate directly with shippers for services, to more readily set rates, and more freedom to enter and exit markets. Mexico’s rail privatization program resulted in the increase of freight rail volumes, gaining a small market share against truck. After several years of operations of the Mexican privatized railroads, the truck-rail market share has remained constant with no significant change.

12
1.3 DOMESTIC FREIGHT TRANSPORTATION
Domestic freight transportation in each country is handled mainly by the truck and rail modes, with coastal shipping and inland waterways being also used in the U.S. and Canada. Trucks are used for long-haul freight movements, as well as for the delivery of goods to final destination, or what is known as the last-mile. Customer demand for more flexible, reliable, timely service have led to a growth in demand for smaller and more frequent shipments that severely impact the local roadway network. Smaller trucks are used to deliver more frequent shipments of small parcels, and these vehicles have to share roadway capacity with other vehicles, including passenger vehicles, exacerbating congestion in large metropolitan areas. Even though the last-mile movements have increased due to consumer changes and on-line shopping, in terms of ton-miles the contribution of freight transportation in urban areas is much less than the long-haul movement of freight, and the last-mile movement is usually done with more efficient vehicles than the long-haul heavy duty vehicles.
Railroads are used to ship larger or heavier commodities and products over long distances and domestically are used to ship natural resources (coal) and agricultural products (grains). Containerized merchandise that is handled at maritime ports is also usually moved by rail on long-distance hauls and then transferred to a truck at an intermodal terminal located close to urban area or production center.
The output of freight transportation in the network is measured and expressed in terms of ton-miles7 or ton-kilometers, and it reflects both the weight of the shipment and the distance it is hauled. Ton-miles reflect both the volume or weight shipped (tons) and the distance shipped (miles), providing a key measure of the overall demand for freight transportation services.
Ton-mile calculations in each country include commodities that are shipped to and from international ports of entry or maritime ports, as well as true domestic movements that originate and terminate within each country and have no international component. The U.S., with the largest economy of the three North American countries, handled 1,468 billion ton-miles by truck in 2007, with 85% of this total handled in the U.S., 6% in Canada, and 9% in Mexico. Rail movement figures are even higher with 1,611 billion ton-miles in the U.S., equivalent to 90% of the total, 193 billion in Canada (11%) and 12 billion in Mexico, or 1% (Table 1).8
Table 1. 2007 Domestic Freight Movement by Country.
(Billion metric ton-miles) Mode U.S. Canada Mexico
Truck 1,247 83 138 Rail 1,611 193 12
Source: North American Transportation Statistics Database, 2007 figures converted to ton-miles
7 The product of the distance that freight is hauled, measured in miles, and the weight of the cargo being hauled, measured in tons. Thus, moving one ton for one mile generates one ton-mile. 8 North American Transportation Statistics Database. http://nats.sct.gob.mx/nats/sys/themes.jsp?id=5&i=3. Accessed December 2009.
13
Ton-miles are used to calculate other measures of transportation system performance, such as energy efficiency. Ton-miles are converted to vehicle-miles based on the number of tons that each commercial vehicle type can haul on a single trip.
Currently the primary fuel of freight truck and rail is diesel—a petroleum product, which is a fossil fuel. GHGs are byproducts of combustion of fossil fuels, such as oil and coal, and there is a direct positive relationship between fossil fuel use and GHG production—the more the fuel that is burned, the more the GHGs that are produced.
The U.S. freight transportation sector is the most extensive among the three North American counties, hence generates the largest proportion of GHGs. However, the freight transportation system in North America is interconnected and serves shippers and receivers in all three countries.
1.4 GREENHOUSE GASES FROM LAND-BASED FREIGHT TRANSPORTATION
The primary fuel used by the truck and rail freight transportation modes is diesel. GHGs
emitted by transportation modes currently consist of 96% Carbon Dioxide (CO2) by volume; therefore it is the focus of this report in which the two terms are used interchangeably. The remaining GHGs are Methane (CH4), Nitrous Oxide (N2O), and Fluorinated Gases (HFCs) (which include hydrofluorocarbons (HFC), perfluorocarbons (PFC), and sulfur hexafluoride (SF6)).
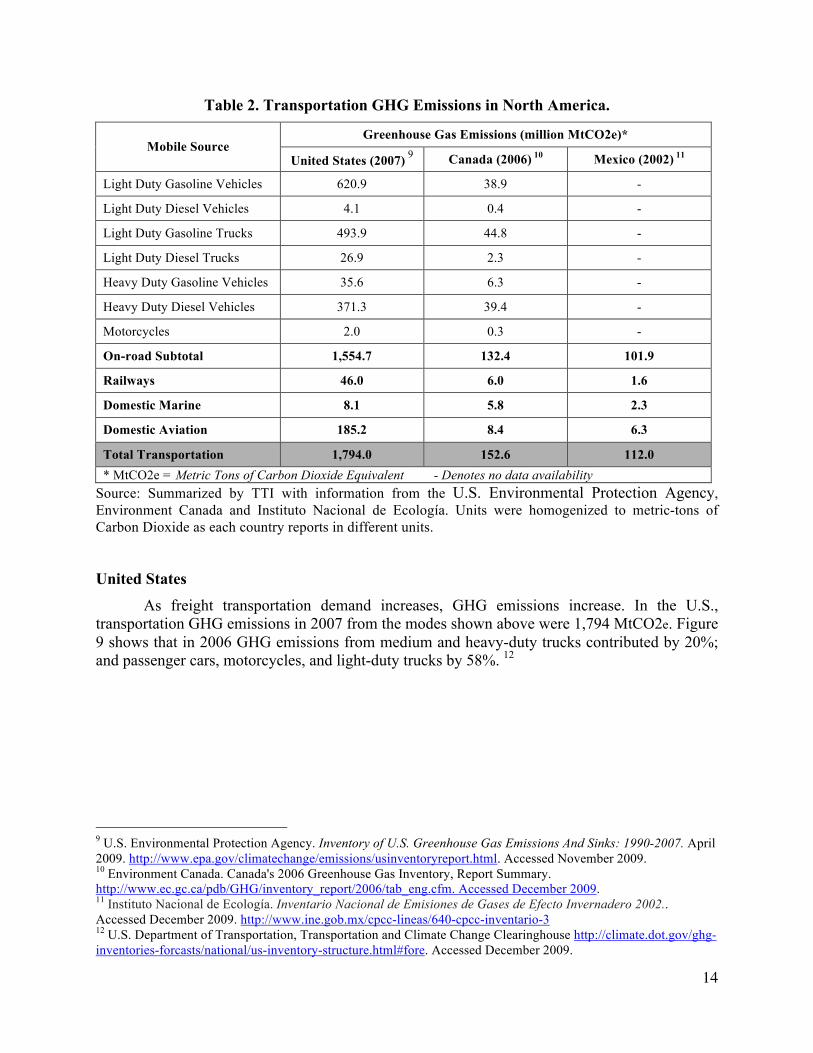
North America Table 2 presents the latest data on GHG emissions from transportation in the three North
American countries, as data availability allows, in order to enable an across-the-board comparison.

14
Table 2. Transportation GHG Emissions in North America.
Greenhouse Gas Emissions (million MtCO2e)* Mobile Source
United States (2007) 9 Canada (2006) 10 Mexico (2002) 11
Light Duty Gasoline Vehicles 620.9 38.9 -
Light Duty Diesel Vehicles 4.1 0.4 -
Light Duty Gasoline Trucks 493.9 44.8 -
Light Duty Diesel Trucks 26.9 2.3 -
Heavy Duty Gasoline Vehicles 35.6 6.3 -
Heavy Duty Diesel Vehicles 371.3 39.4 -
Motorcycles 2.0 0.3 -
On-road Subtotal 1,554.7 132.4 101.9
Railways 46.0 6.0 1.6
Domestic Marine 8.1 5.8 2.3
Domestic Aviation 185.2 8.4 6.3
Total Transportation 1,794.0 152.6 112.0 * MtCO2e = Metric Tons of Carbon Dioxide Equivalent - Denotes no data availability
Source: Summarized by TTI with information from the U.S. Environmental Protection Agency, Environment Canada and Instituto Nacional de Ecología. Units were homogenized to metric-tons of Carbon Dioxide as each country reports in different units.
United States
As freight transportation demand increases, GHG emissions increase. In the U.S., transportation GHG emissions in 2007 from the modes shown above were 1,794 MtCO2e. Figure 9 shows that in 2006 GHG emissions from medium and heavy-duty trucks contributed by 20%; and passenger cars, motorcycles, and light-duty trucks by 58%. 12
9 U.S. Environmental Protection Agency. Inventory of U.S. Greenhouse Gas Emissions And Sinks: 1990-2007. April 2009. http://www.epa.gov/climatechange/emissions/usinventoryreport.html. Accessed November 2009. 10 Environment Canada. Canada's 2006 Greenhouse Gas Inventory, Report Summary. http://www.ec.gc.ca/pdb/GHG/inventory_report/2006/tab_eng.cfm. Accessed December 2009. 11 Instituto Nacional de Ecología. Inventario Nacional de Emisiones de Gases de Efecto Invernadero 2002.. Accessed December 2009. http://www.ine.gob.mx/cpcc-lineas/640-cpcc-inventario-3 12 U.S. Department of Transportation, Transportation and Climate Change Clearinghouse http://climate.dot.gov/ghg-inventories-forcasts/national/us-inventory-structure.html#fore. Accessed December 2009.

15
Figure 9. U.S. Transportation GHG Emissions by Transportation Mode,
2006.
Emissions from freight trucks grew faster than any other transportation mode between 2000 and 2006 (Figure 10), while passenger cars and motorcycles emissions decreased between 2000 and 2006.13
13 U.S. Department of Transportation, Transportation and Climate Change Clearinghouse. Transportation’s Role in Climate Change. http://climate.dot.gov/about/transportations-role/overview.html. Accessed December 2009.

16
Figure 10. U.S. Transportation GHG Emissions by Transportation Mode, 2000-2006.
Canada Canada’s 2006 Emissions Inventory reported that GHG emissions from the transportation
modes shown above generated 152.6 MtCO2e. in 2006—or almost 12 times less than the U.S. in 2007.10
Figure 11 shows the Canadian transportation sector’s GHG emissions by mode in 2006. Figure 12 shows the trends in these emissions between 1990 and 2006. Trends are similar to the ones seen in the U.S.; while emissions from passenger cars and trucks have been decreasing, the contrary has been the case for emissions from freight trucks.
Figure 11. Canada Transportation GHG Emissions by Transportation Mode,
2006. 10

17
Figure 12. Canada Transportation GHG Emissions by Transportation Mode, 1990-2006.10
Mexico
Mexico’s National GHG Inventory 1990-2002 showed that GHG emissions for the transportation sector were 112 MtCO2e (18% of total national GHG emissions)—or approximately 16 times less than the U.S. in 2007. Cars and trucks contributed 91%, air transport by 6%, maritime by 2%, and rail by 1% (Figure 13).11 The country’s transportation emissions increased by 27% between 1990 and 2005 and now account for about 2% of the global transportation sector’s GHG emissions. Mexico set the goal of reducing GHG emissions to 50% below 2002 levels by 2050.14
14 The World Bank. Mexico: Seeking a Low-Carbon Growth Path. http://web.worldbank.org/WBSITE/EXTERNAL/NEWS/0,,contentMDK:22212269~pagePK:34370~piPK:34424~theSitePK:4607,00.html. Accessed December 2009.

18
Figure 13. Mexico GHG Emissions by Transportation Mode, 2002. 11
1.5 AVIATION AND MARINE EMISSIONS
The modal class breakdowns of the transportation sector GHGs show that aviation is the
largest source of non-road transportation GHGs in all three countries. By the same token, marine is generally shown to have an even lower level of contribution to the total transportation GHGs in each country. Demand for these modes, particularly aviation, has led to strong rates of growth, and GHG production, which are expected to continue due to lagging efficiency improvements and the absence of global, targeted regulation.
A range of near, medium, and long-term mitigation options are available to slow the growth of energy consumption and GHG emissions from aviation and marine. They are not unlike options for freight truck and rail. They include improvements in operational efficiency (e.g., advanced navigation and air traffic management systems and slower marine vessel speeds); and reducing the carbon intensity of the energy sources used by transitioning to alternative fuels and power sources. Reducing the demand for aviation and marine could achieve GHG reductions, but the challenge is that there are few suitable alternatives for the services provided by aviation and marine shipping.
Currently very little or no control over aircraft and maritime emissions by national, regional, or international environmental or modal agencies largely due to jurisdictional, geographic, and technical complexities. This is the case in North America and globally. However, a few countries, such as New Zealand, Australia, and the European Union have already taken steps to include aviation in their domestic GHG cap-and-trade programs.

19
Addressing GHG emissions from international aviation and marine shipping is especially challenging, because they are produced along routes where no single nation has regulatory authority. Internationally, unlike other sources of GHG emissions, the Kyoto Protocol to the United Nations Framework Convention on Climate Change (UNFCCC) specifically excludes international emissions from aviation and marine transport from developed countries’ national targets. Instead, the Protocol calls for limitations or reductions in emissions from these sectors to be achieved by working through the International Civil Aviation Organization (ICAO) and the International Maritime Organization (IMO). In response to this mandate, both organizations have initiated activities aimed at addressing emissions from their respective sectors, but thus far neither has reached agreement on substantive binding actions aimed at limiting GHG emissions, and many of the key issues remain unresolved. In response to the stalemate on this issue, some countries have proposed alternative options for addressing these emissions in future climate agreements. Meanwhile, the EU has taken a unilateral measure to include international aviation in its GHG emission trading system (i.e., by covering emissions from all flights either landing at or departing from airports within the European Union).
For GHG reductions from aviation and marine to be realized, significant international and domestic policy intervention is required. Developing an effective path forward that facilitates the adoption of meaningful policies remains both a challenge and an opportunity. 15
In GHG reporting, the aviation class includes GHGs from commercial, general aviation, and military aircraft. Commercial aircraft are the sources for the large majority of aviation GHGs, producing almost 75%. GHGs from military aircraft showed a 40% drop between 1990 and 2003 due to the speediness of fleet turnaround and incorporation of technological advances.16
GHGs from commercial aircraft declined substantially following the terrorist attacks of September 11, 2001. Generally though, passenger air travel rose much more rapidly than the level of GHG emissions, due to a higher number of occupied seats per plane and improved aircraft fuel efficiency. Consequently, GHG emissions per passenger-mile in the U.S. decreased 24% from 1990 to 2003, the largest improvement of any transportation mode.
In all three North American countries’ GHG Inventories, aircraft emissions are based on domestic travel only, and exclude international travel to and from domestic cities. GHGs associated with international travel are reported in the Inventories under categories such as “bunker fuel estimates” or “international aviation.” Commercial and military aircraft rely almost exclusively on jet fuel, while about one-quarter of the fuel used for general aviation is aviation gasoline. GHG emissions from aircraft in 2003 were 99% CO2.
Total aircraft emissions have risen due to increased air travel activity by both passengers and freight, but this has been offset to a large degree by the increased efficiency of aircraft and their operations. Between 1990 and 2003, passenger-miles traveled on domestic services increased by 48%; light-duty vehicle passenger-miles increased 31%. The increase in air travel would likely have been greater if not for the terrorist attacks of September 11, 2001.
15 McCollum, D., Gould, G., and Greene, D. Greenhouse Gas Emissions from Aviation and Marine Transportation: Mitigation Potential and Policies.Pew Center on Global Climate Change. December 2009. 16 U.S. Environmental Protection Agency. Greenhouse Gas Emissions from the U.S. Transportation Section: 1990-2003. March 2006. http://www.epa.gov/otaq/climate/420r06003summary.htm. Accessed November 2009.

20
Although air cargo accounted for less than 1% of total U.S. freight ton-miles in 2002, aviation was the fastest growing mode of freight transportation. Air ton-miles increased 63% from 1993 to 2002. The value of air freight shipments nearly doubled over the same period, increasing from $395 billion in 1993 to more than $770 billion in 2002, at which point it represented 7% of the total goods transported in the U.S. By comparison, freight truck ton-miles increased 24% from 1993 to 2002, with the value of their cargo increasing 45%. Based on the energy used per ton-mile, aviation is the most energy intensive mode of freight haulage. In 2001, the energy required to move a ton-mile of air cargo was 7.5 times greater than heavy-duty trucks, over 17 times that of ships, and 83 times greater than rail. Using an energy intensity metric based on the monetary value of goods moved (such as British Thermal Units (BTU)) per dollar value shipped), air cargo is closer to other modes. However, it is also important to note that almost all air cargo shipments begin and end their journey by truck, meaning that the growth in air freight has increased demand for truck and intermodal services at airports.
The energy intensity of passenger air travel has declined substantially, in part because of increased occupancy of aircraft. The average passenger load factor (percent of available seats that are occupied) on U.S. air operations increased from 60.4% in 1990 to 72.4% in 2002, continuing the trend of increasing passenger loads. As a result, aircraft passenger miles grew faster than aircraft miles traveled between 1990 and 2000 (49% versus 43%).
The reduced energy intensity of commercial aviation also reflects improvements in aircraft fuel efficiency. For new production aircraft, the fuel economy improvements have averaged 1 to 2% per year since the 1950s. These developments have been market-driven, as airlines have improved airframe and propulsion technology in order to reduce fuel costs. One measure of fuel efficiency is the number of aircraft seat-miles per gallon of fuel consumed. The measure, aircraft seat-miles, is calculated by multiplying the total air mileage traveled by the total number of seats available. Available aircraft seat-miles per gallon increased by about 15% between 1990 and 2003 (from 46 to 53 seat-miles per gallon), although about half of this gain occurred since 2001 as airlines reduced the number of flights. Nevertheless, the overall increases indicate the impact of longer-term improvements in aircraft fuel efficiency, as well as the retirement of older, less fuel-efficient aircraft. 1.6 STAKEHOLDERS AND ROLES
Freight transportation is a multifaceted world and naturally involves several stakeholders with diverse backgrounds and interests.
Public Sector
Government entities ensure reliable, safe, and secure freight transportation; provide, maintain, and manage public infrastructure; enact and enforce regulations; provide emergency response; engage in research and development; and promote socioeconomic well-being. These functions may vary in depth and breadth depending on the level of government and its jurisdictional or geographic boundaries.
• Federal level

21
o Transportation departments o Modal agencies (rail, truck, highway, maritime, etc.)
o Transportation safety agencies o Transportation security agencies
o Research agencies o Public information agencies
o Customs and Border Protection o Departments of Energy
o Departments of Defense o Occupational Safety Agencies
o Environmental Protection Agencies
• Regional, State, County, MPO, City, Local levels o Highway, railroad, passenger rail, and transportation agencies
o Seaport, airport authorities o Environmental protection agencies
o Elected officials o Chambers of Commerce
o Adjacent localities o Police departments
o Fire departments
Private Sector Private sector stakeholders include the freight service providers such as the owners and/or
operators of freight infrastructure and/or vehicular equipment (rolling stock); product shippers; product receivers; and intermediary freight services providers.
• Carriers: usually mode specific o Railroads
o Trucking Companies o Vessel, Barge Companies
• Shippers o Manufacturers/producers
o Retailers
22
o Service Providers o Individuals
• Receivers o Manufacturers
o Retailers o Service Providers
o Individuals • Terminal Operators
o Seaports o Ports of Entry
o Rail yards o Truck terminals
o Warehouse/Distribution Centers • Tertiary Entities
o Third Party Logistics companies (3PLs) o Customs Brokers/Freight Forwarders
Non-Governmental Organizations
These entities establish industry standards, provide member training, promote group interests, or conduct studies related to freight transportation.
• Modal Associations (railroads, truck carriers) • Corridor Associations
• Associations of Port Authorities • Retailers’ Associations
• Manufacturers’ Associations • Other shippers’ associations
• Intermodal Associations • Labor Unions
• Universities, research Agencies • Environmental Organizations
• Lobby Associations
General Public

23
The general public, whether at the group or at the individual level, must not be overlooked. There are plenty of examples where public opinion was ignored or delayed to be heard. Results can range from overhaul or abandonment of otherwise already planned projects to project implementation but with undesirable consequences. General public that resides near large transportation hubs, such as maritime ports of land ports of entry is an important stakeholder that needs to be taken into consideration during the planning process. The integration of urban planning and freight transportation should be incorporated in the overall transportation planning process, which usually takes into account passenger-vehicles movements. Public input and reliable information of freight transportation project impacts are a vital and mandatory element of the public planning process.
• Citizens’ groups • Individual citizens
Stakeholders that interact in the freight transportation sector have different objectives;
therefore it is difficult to implement strategies to reduce GHG. This sector, except for the air transportation, is highly deregulated and information is difficult to obtain from private-sector carriers that operate in a competitive environment. However, the goal of reducing GHG emissions could be a common objective that could unite all stakeholders that interact in the freight transportation environment.

25
CHAPTER 2. STATE-OF-PRACTICE IN MEASUREMENT/ESTIMATION OF GHG EMISSIONS FROM FREIGHT TRANSPORTATION
The fact is, what is not measured cannot be controlled. It is important to measure or estimate GHG emissions from the freight transportation sector in order to set attainment standards, assess attainment status, and develop alternative solutions accordingly. Research, academia, and government17,18 have developed, applied, or evaluated several methods, models, and ensuing tools that can be used to analyze the GHG implications of truck and rail freight transportation modes in highly technical and thorough contexts. International bodies, such as the International Standards Organization (ISO) or the GHG Protocol Initiative, and trade bodies, such as the International Air Transport Association (IATA), are working on standardizing methods for measuring GHG emissions.19 To allow comparability between different countries, sectors of the economy, and companies, such methods should be accurate, transparent, and as all-inclusive as possible. This discussion aims to present an overview of the state-of-practice in the estimation of direct and lifecycle GHG emissions from truck and rail freight transportation modes in North America. The purpose is to provide decision-makers with the basic background inherent to making informed decisions about policies to mitigate GHGs from truck and rail modes. At the same time the discussion aims to not overburden them with exhaustive, academic, or highly technical rhetoric.
Direct GHG emissions are defined as the GHGs emitted during vehicle operation and maintenance. They comprise one (usually the middle) stage in the entire lifecycle of emissions associated with the lifetime of transportation vehicles. This report primarily addresses direct GHG emissions, i.e., those stemming from energy that is used for operating vehicles. Transportation depends on array of additional processes, such as the manufacture of vehicles and extraction of crude oil. Nevertheless, they are still a part of the transportation lifecycle and can offer a broader perspective on the GHG impact of transportation.
In North America, the United States Environmental Protection Agency (USEPA or EPA) is the authority and leader in the wide-ranging field of air quality and its improvement. EPA data, methods, and procedures are typically instigated in the U.S. first and are then adopted firstly by Canada and secondly by Mexico, through technology transfer and knowledge exchange. Direct EPA and other government sources, as well as the draft final report of the National Cooperative Freight Research Program project Representing Freight in Air Quality and Greenhouse Gas Models, were the main sources consulted for the overview provided in this writing and are referenced at each main stage in the discussion.
Generally speaking, the EPA classifies anthropogenic (manmade) emissions into three broad categories, mobile, stationary (point), and area sources. Mobile source emissions are further disaggregated into on-road (e.g., cars, trucks, buses, and motorcycles) and nonroad
17 ICF Consulting. NCHRP 25-25(17): Assessment of Greenhouse Gas Analysis Techniques for Transportation Projects. American Association of State Highway and Transportation Officials (AASHTO). May 2006. 18 ICF International. NCFRP 16 Draft Report: Representing Freight in Air Quality and Greenhouse Gas Models. Transportation Research Board of the National Academies, Washington, D.C., 2009. 19 Supply Chain Management Institute & Price Waterhouse Coopers. How will supply chains evolve in an energy-constrained, low carbon world? Transportation & Logistics 2030, 2009. http://www.pwc.com/en_GX/gx/transportation-logistics/tl2030/tl2030-pub.jhtml. Accessed November 2009.
26
emission categories (e.g., agricultural, industrial, construction, residential, commercial, recreational equipment; as well as commercial aircraft, locomotive and marine vessel engines).
Mobile sources include transportation modes, which could be further sub-classified into on-road (e.g., trucks) or nonroad (e.g., rail). Transportation sources emit different gases that contribute to global warming, including carbon dioxide (CO2), methane (CH4), nitrous oxide (N2O), and fluorinated gases. Carbon dioxide is by far the most prevalent GHG emitted by transportation sources—95% in 2004, according to the EPA when measured in terms of global warming potential (CO2 equivalent emissions).20 The remainder of transportation GHG emissions consisted of: N2O, 2.2%; CH4, 0.1%; and fluorinated gases, 2.3%. Given the importance of CO2, it is usually appropriate and acceptable for transportation GHG analyses to focus solely on this gas.
Methods, models, and ensuing user tools that can estimate GHG emissions vary in their ability to address a range of different types of inputs and analyses, such as in the transportation sources they address, level of sophistication, scope (direct or lifecycle), geographical level (national, regional, state, or local) and so on. The primary limitation of these types of tools is that the user may either not have access to solid data inputs or may not understand the assumptions tied to the default data. Many of these methods, models, and tools were developed by the EPA, and several have common methodologies or build upon each other.
2.1 DIRECT GHG EMISSIONS METHODS/MODELS
2.1.1 Approaches
Methods and models that can calculate GHGs from transportation modes are based on one or a combination of two fundamental approaches, which can be described as “bottom-up” and “top-down.” Each can be further applied to any geographic level (national, regional, state, or local), as allowed by the input data.
• Bottom-up Approach – user-provided data, e.g., vehicle miles traveled (VMT) are combined
with developed emission factors, such as grams of CO2 per VMT, in order to arrive at emissions estimates for an on-road vehicle fleet, such as truck VMT in an urban area. This approach is currently only used for GHG estimation from trucks. The general logic followed is illustrated below:
Emissions (grams or tons) = Freight Activity (VMT) x Emission Factor (g/VMT) • Top-down Approach – fuel consumption by fuel type is allocated to each transportation
mode, and to sub-categories within each mode. This approach is currently used for GHG estimation from both truck and rail. The corresponding GHG emissions are calculated as a function of each fuel’s carbon content, shown here using CO2 (the prevailing GHG) as an example:
20 GHG emissions are typically reported in terms of CO2 equivalent to provide a common unit of measure. Other GHGs are converted into CO2 equivalent on the basis of their global warming potential (GWP).

27
CO2 emitted (grams or tons) = Fuel Combusted x Carbon Content Coefficient x Fraction Oxidized21 (100% as of 2006 per IPCC and EPA)
Different methods and models that calculate GHGs from truck and rail freight
transportation modes may utilize only one or a combination of these approaches. They may also be mode-specific. Some incorporate both elements of the bottom-up approach—measures of freight activity and emission factors—and output total emissions; while others extract emission factors only. Currently the typical geographical level of transportation GHG emissions analyses is the national, and in some instances the regional or state level.
2.1.2 Direct GHG Emission Methods/Models – Truck Freight Transportation The methods and models approved for use in the U.S. by the EPA are presented below.
Key characteristics, modal and geographical scope, data inputs and outputs, limitations, and typical uses are commented upon. They only address the truck freight mode, not rail.
MOBILE6 Model22
Developed by EPA’s Office of Transportation and Air Quality (OTAQ), MOBILE6 is the currently approved model that generates emission factors for on-road motor vehicles (passenger cars to heavy-duty trucks) for use in transportation analyses at the state, region, or project level, in grams/VMT. In addition to criteria pollutants, such as hydrocarbons (HC), carbon monoxide (CO), oxides of nitrogen (NOx), and particulate matter (PM), and mobile source air toxics (MSAT), the model generates CO2 (and other GHG) emission factors, which can be combined with VMT data to estimate CO2 emissions. The CO2 emission factors only account for vehicle type and model year; they do not account for impacts of vehicle operating conditions (e.g., travel speeds) on CO2 or expected changes in future vehicle fuel economy.
National Mobile Inventory Model (NMIM)22 EPA developed NMIM to integrate the input data requirements, model runtimes, and
post-processing requirements for MOBILE6 and NONROAD23 models into a single package. It is a free, desktop computer application to help the user develop estimates of current and future emission inventories for on-road motor vehicles and nonroad equipment. NMIM uses current versions of MOBILE6 and NONROAD to calculate emission inventories, based on multiple input scenarios that the user enters into the system. NMIM can be used to calculate national, individual state, or county inventories.
21 Fraction oxidized is taken as 100% as of 2006 per EPA and IPCC (Intergovernmental Panel on Climate Change). 22 U.S. Environmental Protection Agency. Transportation and Air Quality Modeling and Inventories. http://www.epa.gov/otaq/models.htm. Accessed November 2009. 23 The current version of the NONROAD model predicts emissions for all nonroad equipment categories with the exception of commercial marine, locomotive, and aircraft engines.
28
EMFAC200724 The California Air Resources Board (CARB) developed an Emissions Factor model
(EMFAC) as the California version of MOBILE6. The latest version was released in 2007. Using emission factors and vehicle activity inputs specific to the state, EMFAC develops emission estimates for on-road vehicles to be used in developing statewide or regional emission inventories, projections, and project level analyses. The CO2 emission rates vary by vehicle speed.
MOVES22 EPA’s OTAQ is developing the Motor Vehicle Emission Simulator (MOVES). This new
emission modeling system will estimate emissions for on-road and nonroad mobile sources, cover a broad range of pollutants, and allow multiple scale analysis, from fine-scale analysis to national inventory estimation. When fully implemented, MOVES will serve as the replacement for MOBILE6 and NONROAD for all official analyses associated with regulatory development, compliance with statutory requirements, and national/regional inventory projections. A draft version of MOVES is now available but it is not approved for use in State Implementation Plans (SIPs) or conformity determinations, but modelers are encouraged to use the model and provide comments to EPA. A final version of MOVES for car and truck emissions was planned for late 2009.
A note must be made here that MOBILE6 and EMFAC2007 are the two currently approved models for all official air quality analyses associated with regulatory development, compliance with statutory requirements, and national/regional inventory projections. MOVES2009 is the new EPA model that will eventually replace MOBILE6 when fully implemented. All three models can be applied to any geographic scale, freight as well as passenger modes (with varied limitations), and estimate emissions for all pollutants, always as permitted by the input data.
The main drivers of uncertainty associated with these methods and models (with respect to calculating all pollutants from trucks, not just GHGs) are:18
• Emission models like MOBILE6 and EMFAC rely on statewide or national default data and are ill-suited for project-level analyses if key local factors that have a significant impact on emissions (e.g., average speed, truck age distribution, VMT share by truck type) are not available. Additionally, these models do not consider road grade, actual vehicle weight, or aerodynamic characteristics of vehicles, all of which have a strong effect on engine power requirements and consequently, on emissions.
• The representation of local and regional factors (e.g., truck age distribution, mileage accumulation, VMT share by truck type) by national defaults is a source of substantial uncertainty. This issue is important because many agencies do not have access or resources to collect local data, and thus rely on national defaults to represent local and regional emissions. This is more of a problem with MOBILE6 than EMFAC2007 given that the latter includes data at the county level.
24 California Department of Transportation. EMFAC Software. http://www.dot.ca.gov/hq/env/air/pages/emfac.htm. Accessed November 2009.

29
• The incorporation of congestion effects on emissions is a complex issue and topic of much recent debate. MOBILE6 and EMFAC2007 are not well-suited to accurately incorporate such effects, since they rely on speed correction curves to differentiate emissions by average speed. Previous research has indicated that the use of average speed is not a good proxy for congestion levels. MOVES2009 will provide a platform to enable analyses that incorporate the effects of congestion on emissions through a binning approach.
• There are several concerns about estimating truck VMT from travel demand models or truck counts. First, the estimation of truck VMT generally does not consider enough truck categories to match the number of truck categories in emission models. Second, when used for forecasting truck VMT, travel demand models often do a poor job of representing the complex trip generation and trip distribution patterns of commercial vehicles. Third, the accuracy of average speed at the link level is questioned given that it is not measured directly but rather estimated from vehicle volume and road capacity. However, link-level speed data may become more precise in coming years with increased use of intelligent transportation systems (ITS) to monitor traffic performance along road segment. Finally, a high number of time periods is necessary to properly capture the speed variations throughout the day, which increases the computation requirements substantially.
• Many key parameters for emission analyses are based on the Vehicle Inventory and Use Survey, which characterizes the truck population in the U.S., e.g., truck age distribution and mileage accumulation. Because the last version of VIUS was published in 2002 (and the 2007 version was canceled), there are concerns about how outdated such parameters are (e.g., introduction of new diesel emission standards).
• In most emission analyses, the distribution of emissions throughout a day, week, month, or year is typically not available. The temporal distribution of emissions is an important input to air quality analyses because ambient temperature and humidity are key factors in air dispersion and in the formation of secondary pollutants.
• The ability of emission models to incorporate the effects of emission reduction strategies depend on the nature of the strategy. For those that affect VMT, such impacts can be clearly defined. The effects of strategies that affect truck fuel efficiency (e.g., aerodynamic devices) and emission factors (e.g., diesel particulate filters) need to be post-processed after the model runs. For those strategies that have an effect on congestion levels (e.g., incident management, congestion pricing), only modal emission models are able to capture such effects.
2.1.3 Direct GHG Emission Methods/Models – Truck and Rail Freight Transportation
EPA has addressed GHG emissions from rail as well as truck freight modes through the top-down approach. A bottom-up approach was then used for the truck mode due to the availability of data and the methods/models described above, to verify the results of the bottom-up approach for the freight truck mode.
30
U.S. Inventory of Greenhouse Gases25 EPA, in the U.S. Inventory of Greenhouse Gases (henceforth referred to as the U.S. GHG
Inventory) and its offspring publications,25,26 calculates emissions through a fuel-based analysis at a national level. The inventory allocates emissions to each transportation mode, and to sub-categories within each mode according to fuel consumption and fuel type, including heavy-duty trucks and rail. However, each iterative step in the allocation of national fuel consumption to individual modes and sub-classes within each invariably introduces an increased margin of error. Total GHG emissions are calculated as a function of each fuel’s carbon content. While the U.S. GHG Inventory does not disaggregate freight and non-freight emissions, it lists modal categories in sufficient detail to make such disaggregation possible, albeit while introducing uncertainties into the calculations.
State Inventory and Projection Tool (SIT-PT) The State Inventory Tool (SIT), developed by the EPA, is a Microsoft Excel-based tool
that uses methods from the Intergovernmental Panel on Climate Change (IPCC) and the U.S. GHG Inventory. The tool generates a top-down estimate of GHG emissions at the U.S. state level. Estimates include direct emissions only; they do not include emissions from indirect sources such as offsite waste disposal or electricity consumption. The state inventory guidance and tool contain methods and data that are specific to U.S. states and may not be appropriate for scales other than the state level or for countries other than the U.S. It requires inputs of transportation fuel consumption and VMT. The associated Projection Tool (PT) allows users to forecast GHG emissions through 2020 based on historical emissions and projections of future fuel consumption (reported by the U.S. Energy Information Administration27), population, and economic factors.
2.1.4 Direct GHG Emission Methods/Models – Rail Freight Transportation
The vast majority of rail activity in the U.S. is handled by freight railroads, so most methods to calculate rail emissions are specifically tailored to freight.18 Additionally, identifying freight and passenger traffic is relatively straight-forward because freight rail activity is reported separately from passenger rail activity. The only exception is the U.S. GHG Inventory, where diesel fuel consumption needs to be disaggregated between freight and passenger railroads.
Most rail emission methodologies combine fuel-based emission factors with measured or calculated fuel consumption to determine total emissions. However, as data availability varies over different geographic scales, different methodologies are required.
Independently of the geographic scale, rail operations are typically categorized in switch and line-haul due to different activity patterns and equipment configurations. Line-haul operations refer to the movement over long distances, generally with newer and more powerful 25 U.S. Environmental Protection Agency. Inventory of U.S. Greenhouse Gas Emissions And Sinks: 1990-2007. April 2009. http://www.epa.gov/climatechange/emissions/usinventoryreport.html. Accessed November 2009. 26 U.S. Environmental Protection Agency. Greenhouse Gas Emissions from the U.S. Transportation Section: 1990-2003. March 2006. http://www.epa.gov/otaq/climate/420r06003summary.htm. Accessed November 2009. 27 U.S. Energy Information Administration. http://tonto.eia.doe.gov/energyexplained/index.cfm?page=environment_about_ghg. Accessed November 2009.
31
locomotives than switch operations, and tend to idle less. Switch activities refer to the assembling and disassembling of trains at rail yards, sorting of rail cars, and delivery of empty rail cars to terminals. Switch operations involve short-distance movements, significant idling, and older equipment.
Most rail methodologies rely on fuel consumption data to determine emissions. Detailed fuel consumption data are typically considered sensitive information by railroads. However, nationwide aggregate fuel consumption data, which are based on 100% reporting for Class I railroads, are available from industry or government agencies (i.e., Association of American Railroads, Energy Information Administration, state agencies, private companies). When fuel consumption data are not available for the region of interest, it must be estimated either by apportioning fuel consumption from a larger geographic area (top-down) or by aggregating fuel consumption from individual rail movements (bottom-up). Both methods require measurements of rail activity.
Because the rail sector has comparatively fewer metrics of activity as compared to other modes, methods for calculating emissions tend to be overly-simplified or overly-complex, with the attendant uncertainties and inaccuracy. Streamlined or top-down methods determine emissions based on publicly-available data on fuel consumption at the state or national level, and apportion emissions to the state or county level using an available activity metric, such as traffic density or mileage of active track. Detailed or bottom-up methods calculate fuel consumption either by measuring freight movements or surveying individual railroad companies. Therefore, unlike truck emissions, the calculation of rail emissions does not typically rely on specific emission models.
Besides methods that calculate rail emissions at the national level (U.S. GHG Inventory and the National Emissions Inventory), there are other methods to estimate fuel consumption at a regional (and local) geographic scale by different rail parameters: • Line-haul Emissions by Traffic Density
• Line-haul Emissions by Active Track • Switch Emissions by Number of Switchers or Hours
• Line-haul/Switch Emissions by Employees
The main sources of uncertainty associated with the estimation of rail freight emissions of all pollutants, not just GHGs, through these methods are:
• Although Class I railroads are required by the Surface Transportation Board (STB) to report 100% of fuel consumption nationwide, there are concerns about published rail activity. First, there is a lack of published rail activity for a specific region, so local and regional analyses need to either collect data from local railroads (which is generally challenging) or apportion nationwide or statewide data to regions, which brings many methodological issues described later in this document. Second, the accuracy of county-level GTM data reported by railroads is largely questioned.
• Many local and regional emission analyses rely on a single measure of fuel consumption index (gross ton-miles per gallon) to convert traffic density to fuel consumed. This method is

32
inaccurate because it ignores key local factors such as terrain grade, equipment type (which influences aerodynamic coefficients, and payload to tare ratios), and possibly congestion.
• For those analyses that cannot rely on traffic density (because it is not reported by railroads), the use of active track or number of employees to apportion nationwide or statewide fuel consumption can result in emission estimates that are highly uncertain.
• The accurate calculation of switch emissions in rail yards requires high levels of data because the variation in activity levels per switcher and duty cycles can be substantial. As a result, analyses that rely on default parameters (e.g., average number of hours per switcher) can be highly uncertain.
2.1.5 Direct GHG Emission Methods/Models - Canada and Mexico As mentioned above, in North America, the EPA is the authority and leader in the wide-
ranging field of air quality and its improvement. In general EPA data, methods, and procedures are typically instigated in the U.S. first, and are then adopted firstly by Canada and secondly by Mexico through technology transfer and knowledge exchange. As a result, approaches, and methods/models are identical to the ones developed and used in the U.S. but adapted to utilize each country’s corresponding data such as fuel consumption, and reflect differences such as vehicle fleet characteristics.
Canada has developed the MOBILE6.2C model which is the Canadian version of MOBILE6.2, originally developed by EPA for the U.S., to output emissions factors specific to Canadian vehicles (the bottom-up approach).28 Canada also develops its own annual GHG Inventory per United Nations requirements in a similar approach as the one followed by EPA in the National GHG Inventory.29
A similar picture can be observed in Mexico. The MOBILE6-Mexico emission factor model was developed for use in estimating emissions from on-road mobile sources adapted from EPA’s MOBILE6.2 model using Mexican vehicle emissions test data collected in Mexico, as well as other Mexico specific information.30 Mexico also developed its National Emissions Inventory in 1999 for criteria pollutants and is in the process of updating it using 2005 data and its own 1990-2002 GHG Inventory, both with EPA assistance.31,32
28 Environment Canada. Clean Air Online. http://www.ec.gc.ca/cleanair-airpur/Home-WS8C3F7D55-1_En.htm Accessed November 2009. 29 Environment Canada. Canada's 2006 Greenhouse Gas Inventory. http://www.ec.gc.ca/pdb/GHG/inventory_report/2006/som-sum_eng.cfm#s1. Accessed November 2009. 30 Eastern Research Group, Inc. (ERG). MOBILE6-Mexico. Prepared for the Western Governors’ Association. Austin, Texas, June 2003. 31 U.S. Environmental Protection Agency. North American Emissions Inventories – Mexico. http://www.epa.gov/ttn/chief/net/mexico.html. Accessed November 2009. 32 Instituto Nacional de Ecología. National Greenhouse Gas Inventory 1990-2002 Report of Mexico Executive Summary. http://www.ine.gob.mx/descargas/cclimatico/mexico_nghgi_ex.pdf. Accessed November 2009.
33
2.2 LIFECYCLE ASSESSMENT GHG EMISSIONS METHODS/MODELS
Lifecycle assessment (LCA)33 is a ‘cradle-to-grave’ approach for assessing the potential environmental aspects associated with a product, process, or service. LCA enables the estimation of the cumulative environmental impacts resulting from all stages in the product lifecycle, e.g., raw material extraction, material transportation, and ultimate product disposal. LCA compiles an inventory of energy and material inputs and environmental releases (outputs), evaluates the potential environmental impacts, and interprets the results of the inventory and impact phases in relation to the objectives to support decision making. An LCA enables identification and quantification of environmental trade-offs of alternatives against factors such as cost and performance.
This report primarily addresses GHG emissions from energy that is used for operating vehicles. Transportation depends on array of additional processes, such as the manufacture of vehicles and extraction of crude oil. Within the U.S. GHG Inventory, these activities are accounted for in other economic sectors—most notably the industrial sector. Nevertheless, they are still a part of the transportation lifecycle and can offer a broader perspective on the GHG impact of transportation.
2.2.1 What is Lifecycle Assessment (LCA)? A full LCA of transportation takes into account all emissions associated with the
vehicles, fuel, infrastructure, and associated activities that make up the nation’s transportation system. Emissions occur during three lifecycle stages:
1. Upstream Emissions – Upstream emissions are those that occur before a product is used, including extraction of raw materials, processing, manufacturing, and assembly. Sources of upstream emissions include any fuel combustion associated with these processes, as well as “fugitive” emissions, such as venting and/or flaring of natural gas from oil wells or natural gas plants.
2. Direct Emissions – Direct emissions occur during the operation and maintenance of vehicles.
3. Downstream Emissions – Downstream emissions occur at the end of the lifecycle and are associated primarily with disposal. Sources of downstream emissions include fuel combustion used during disposal, collection of municipal solid waste, and landfills.
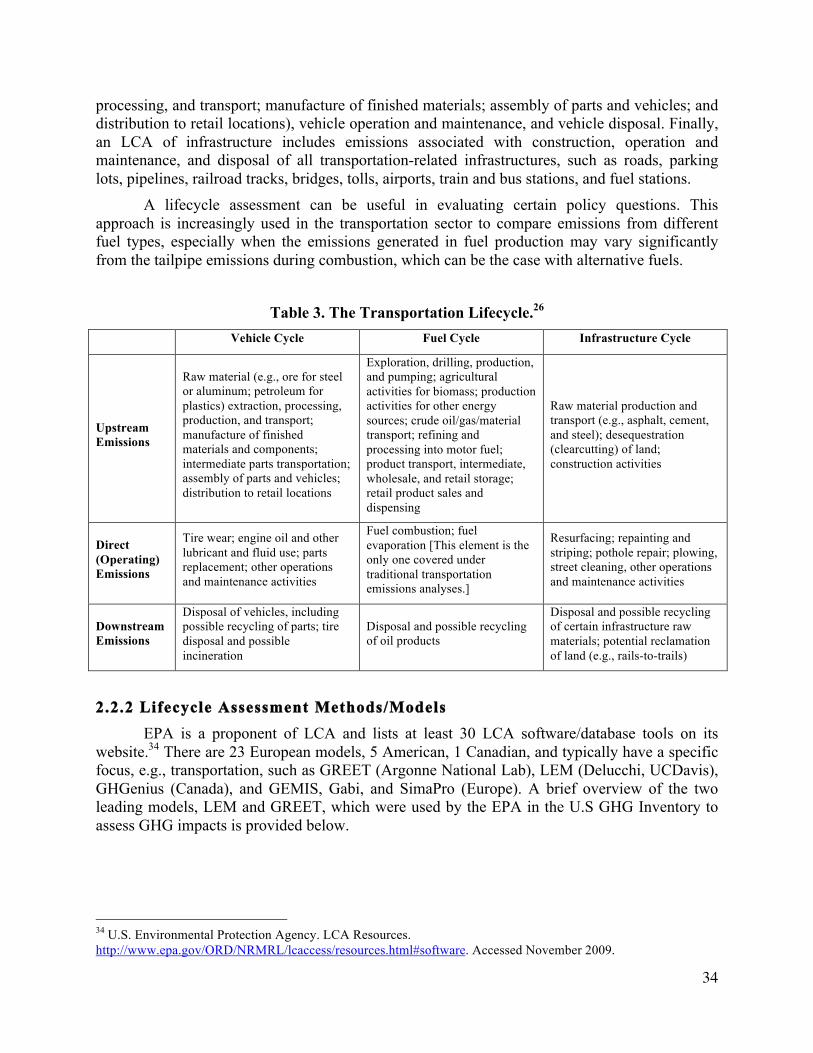
An LCA of transportation also should take into account emissions from three key components of transportation systems: fuels, vehicles, and infrastructure. Table 3 provides examples of sources of emissions at each stage of life for each component. Transportation fuel use is the focus of traditional analysis of transportation emissions. An LCA of transportation fuels, often referred to as a fuel cycle analysis, includes upstream emissions associated with drilling, exploration and production, crude oil transport, refining, fuel transport, storage, and product retail, as well as downstream disposal or recycling of oil products. An analysis of vehicle lifecycle emissions includes each stage of vehicle manufacturing (raw material extraction,
33 U.S. Environmental Protection Agency. Life Cycle Assessment: Principles and Practice. Report No. EPA/600/R-06/060. May 2006. http://www.epa.gov/ord/NRMRL/lcaccess/lca101.html. Accessed November 2009.

34
processing, and transport; manufacture of finished materials; assembly of parts and vehicles; and distribution to retail locations), vehicle operation and maintenance, and vehicle disposal. Finally, an LCA of infrastructure includes emissions associated with construction, operation and maintenance, and disposal of all transportation-related infrastructures, such as roads, parking lots, pipelines, railroad tracks, bridges, tolls, airports, train and bus stations, and fuel stations.
A lifecycle assessment can be useful in evaluating certain policy questions. This approach is increasingly used in the transportation sector to compare emissions from different fuel types, especially when the emissions generated in fuel production may vary significantly from the tailpipe emissions during combustion, which can be the case with alternative fuels.
Table 3. The Transportation Lifecycle.26 Vehicle Cycle Fuel Cycle Infrastructure Cycle
Upstream Emissions
Raw material (e.g., ore for steel or aluminum; petroleum for plastics) extraction, processing, production, and transport; manufacture of finished materials and components; intermediate parts transportation; assembly of parts and vehicles; distribution to retail locations
Exploration, drilling, production, and pumping; agricultural activities for biomass; production activities for other energy sources; crude oil/gas/material transport; refining and processing into motor fuel; product transport, intermediate, wholesale, and retail storage; retail product sales and dispensing
Raw material production and transport (e.g., asphalt, cement, and steel); desequestration (clearcutting) of land; construction activities
Direct (Operating) Emissions
Tire wear; engine oil and other lubricant and fluid use; parts replacement; other operations and maintenance activities
Fuel combustion; fuel evaporation [This element is the only one covered under traditional transportation emissions analyses.]
Resurfacing; repainting and striping; pothole repair; plowing, street cleaning, other operations and maintenance activities
Downstream Emissions
Disposal of vehicles, including possible recycling of parts; tire disposal and possible incineration
Disposal and possible recycling of oil products
Disposal and possible recycling of certain infrastructure raw materials; potential reclamation of land (e.g., rails-to-trails)
2.2.2 Lifecycle Assessment Methods/Models EPA is a proponent of LCA and lists at least 30 LCA software/database tools on its
website.34 There are 23 European models, 5 American, 1 Canadian, and typically have a specific focus, e.g., transportation, such as GREET (Argonne National Lab), LEM (Delucchi, UCDavis), GHGenius (Canada), and GEMIS, Gabi, and SimaPro (Europe). A brief overview of the two leading models, LEM and GREET, which were used by the EPA in the U.S GHG Inventory to assess GHG impacts is provided below.
34 U.S. Environmental Protection Agency. LCA Resources. http://www.epa.gov/ORD/NRMRL/lcaccess/resources.html#software. Accessed November 2009.

35
Lifecycle Emissions Model (LEM)35 The Lifecycle Emissions Model examines energy use, GHG emissions (CO2, CH4, N2O,
fluorinated gases), and criteria pollutant emissions associated with the full lifecycle of various transportation activities. This model examines the following components:
• Fuel cycle: raw material production (e.g., crude oil), raw material transport, fuel production, fuel distribution and storage, fuel dispensing, and end use
• Material lifecycle: raw material recovery (e.g., iron ore), vehicle manufacture, and transport of materials to end-users
• Vehicle lifecycle: assembly, operations and maintenance, secondary fuel cycle • Infrastructure lifecycle: energy use and materials production
Lifecycle emissions for a number of vehicle types are calculated, including passenger
cars, buses, and medium- and heavy-duty trucks. No estimates regarding other vehicle types (e.g., rail, air, marine) or any stage of infrastructure lifecycle emissions have been included, as those estimates in LEM are still considered rudimentary.
GHGs, Regulated Emissions, and Energy Use in Transportation (GREET) model36 GREET estimates energy use, GHG emissions (CO2, CH4, N2O), and criteria pollutant
emissions related to the fuel cycle of various vehicle and fuel combinations. The primary purpose of GREET is to evaluate the energy and emissions impacts associated with alternative fueled vehicles and advanced vehicle technologies in light-duty vehicles only, for the purpose of assessing near- and long-term transportation options. GREET examines more than 30 fuel-cycle pathways, and examines the following components: • Feedstock production
• Feedstock transportation • Feedstock storage
• Fuel production • Fuel transportation and distribution
• Fuel storage • Vehicle operation (refueling, fuel combustion/conversion, fuel evaporation, tire/brake wear)
35 Delucchi, M. Lifecycle Emissions Model (LEM). Institute of Transportation Studies, University of California, December 2003. 36 Greenhouse Gases, Regulated Emissions, and Energy Use in Transportation (GREET) 1.8c Model. Center for Transportation Research, Argonne National Laboratory, U.S. Department of Energy, Argonne, IL, March 2009. http://www.transportation.anl.gov/modeling_simulation/GREET/. Accessed November 2009.

36
The EPA’s MOVES model estimates energy consumption (for use in calculating CO2), N2O, and CH4 from on-road vehicles from 1999 to 2050, and accounts for the impacts of vehicle speeds, age, and stock on emissions. It also includes estimates of direct and upstream emissions, based on the GREET model. MOVES can be used to develop regional, statewide, and national GHG emissions estimates, and can be used to generate emissions factors for project-level analyses.
GHGenius37
Based on the LEM, Natural Resources Canada has developed the GHGenius model. It can analyze the lifecycle emissions of many pollutants associated with the production and use of traditional and alternative transportation fuels. GHGenius can forecast past, present, and future emissions through 2050 using historical data or correlations for changes over time in energy and process parameters. The geographical scope of GHGenius is Canada and its regions and provinces, the U.S., and Mexico. All steps in the lifecycle are considered in the model from raw material acquisition to end-use, such as:
• Feedstock production and recovery
• Fertilizer manufacture • Land use changes and cultivation associated with biomass derived fuels
• Production of oil and gas • Feedstock transport
• Fuel production from raw materials • Emissions displaced by co-products of alternative fuels
• Fuel storage and distribution at all stages • Fuel dispensing at the retail level
• Vehicle operation • Carbon in fuel from air
• Vehicle assembly and transport • Materials used in vehicle manufacture
The model can analyze emissions from conventional and alternative fueled internal
combustion engines for light duty vehicles, light duty battery powered electric vehicles, and light duty fuel cell vehicles. For heavy duty vehicles, both internal combustion engines and fuel cell powered trucks and transit buses can be modeled. In all more than 140 vehicle and fuel combinations are possible.
37 GHGenius. http://www.ghgenius.ca/. Accessed November 2009.

37
The results of the lifecycle analysis in the U.S. GHG Inventory illustrate that a number of impacts still need to be addressed to present a more comprehensive assessment of the transportation lifecycle. Some of these issues include: • Impacts Not Quantified: While this analysis assesses many of the GHG impacts of the
transportation lifecycle, a significant number of impacts were not quantified. These include fuel cycle emissions associated with alternative fuel vehicles (AFVs), and vehicle cycle emissions associated with non-road transport. The analysis also did not assess infrastructure lifecycle emissions or the land use impacts of transportation, such the removal of trees for highway construction, parking lots, airports, and many other types of infrastructure. Measuring the latter impacts is extremely challenging.
• Alternative Fuels and Vehicle Technologies: Resource limitations prevented analysis of these fuels and technologies. There is great variance in the lifecycle emissions from alternative fuels, and substantial work has been done by others to quantify these emissions. Although some of those fuels and vehicle technologies will likely be extremely important in the future, their collective use is presently small enough for their contributions to have a negligible effect on current lifecycle estimates. Future work should incorporate these fuels and technologies because of the critical role they play in forward-looking policy analyses.
• International Boundaries: Accounting for international boundaries could significantly increase total transportations sector estimates. In 2001, approximately 55% of the petroleum products consumed in the U.S. were derived from crude oil produced abroad. Supplemental tables may be developed in the future to represent upstream emissions occurring outside of the United States.
LCA is a relatively new field, and such analyses are typically time, resource, and data intensive. Data availability and accuracy can influence the results. Decision making cannot be based on LCAs alone. Most applications, e.g., GREET, currently focus on light duty vehicles. If they are able to assess freight movement, it is not clear how well they deal with energy waste at specific locations, such as congestion and idling at chokepoints (ports, intermodal yards, truck stops). The extent of their ability to evaluate GHG emissions from freight modes, especially reductions resulting from alternative scenarios, is still uncertain.
2.3 FUTURE OPPORTUNITIES
The major uncertainties, disadvantages, and shortcomings of each state-of-the-practice method/model to calculate GHG emissions from truck and rail freight transportation modes in North America were discussed in great detail in the previous section. Understanding of the root causes for the shortfalls, accompanied by concerted efforts to rectify them can pave the way toward improving the accuracy of the available methods/models, and perhaps give rise to new and better ones. It is evident that the fundamental reason for the uncertainty associated with current methods/models, is the uncertainty, and even unavailability, associated with the underlying data on which they base their functions on. Several detailed recommendations to improve the methods/models, and underlying parameters that support them, have been identified by recent research:18

38
General Recommendations • Assess required level of accuracy for emissions methods and models.
• Align the accuracy of methods and models with the required accuracy for applications of emissions information.
• Create and improve freight data architecture. • New models to capture freight activity.
National Level Recommendations
• Research more accurate methods to allocate petroleum consumption to the transportation sector.
• Develop more accurate accounting of transportation emissions associated with biofuel use. • Develop more accurate methods to allocate fuel consumption to individual vehicle types.
• Improve local data collection for NMIM. • Update the methodology for rail fuel use correction factors.
Heavy Duty Trucks
• Continue using independent techniques to test the accuracy of current emission models. • Data collection methods to calibrate emission models.
• Improve methods to generate truck trip generation data. • Develop model to capture local emissions.
• Refine methodologies for congestion estimation. • Increase application of ITS to measure emissions at the link level.
• Improve frequency of updates. • Reinstate VIUS.
• Broaden representation of Alternative Fuels. • Account for effects of Truck Classification Systems.
Rail
• Develop rail emission model. • Develop alternative methods for railroad fuel data reporting.
• Develop system to collect rail emissions data. • Compare methods to disaggregate fuel consumption data.
• Develop rail fuel consumption indexes.

39
• Examine accuracy of county-level GTM data reported by railroads. • Conduct extensive research on locomotive duty cycles.
• Develop more accurate methods to estimate switch emissions at rail yards. • Evaluate importance of temporal distribution of rail yard emissions.
• Develop more accurate methods to estimate emissions from Class II/III railroads.


41
CHAPTER 3. STRATEGIES TO MITIGATE GHG EMISSIONS FROM FREIGHT TRANSPORTATION
Reducing GHGs from freight transportation modes may be more difficult than for
passenger transportation modes or stationary modes due to several reasons: • Unlike passenger transportation modes, there is little or no discretionary freight movement.
A freight trip could not be postponed and most of the time is difficult to change transportation modes, once the trip has started. Economic viability directs freight movement to take place and on the basis of the most economically feasible manner possible.
• Economic impacts on freight transportation have substantial implications for the economy, global competitiveness, and public welfare.
• Vehicle fleet turnover occurs more slowly for freight vehicles, slowing down the potential to reduce GHGs by introducing new technologies.
• Due to economic competition, freight carriers already have significant incentive to minimize fuel costs (and thereby GHG emissions). Strategies involving low to medium levels of financial risk have been adopted, but the high, upfront capital cost of technologies is a deterrent to their wide-spread deployment because of real or perceived return-on-investment periods.
• Freight transportation VMT is expected to grow faster than passenger transportation VMT.
Despite these inherent difficulties, researchers and practitioners have come together to
address this growing problem of GHGs from freight transportation in a variety of ways. Several strategies that can mitigate GHG emissions from freight truck and rail transportation modes have been identified. These can generally be classified into five broad categories and are explained in detail in the following sections:
• Fuel Technologies, • Vehicle Technologies,
• System Optimization/Operational Efficiency, • Smart/Sustainable Growth, and
• Market-Based Mechanisms.
Figure 14 shows the first four strategy categories, due to the fact that market-based mechanisms are not currently used at any national level in North America; however, there is increasing evidence that they will be utilized in the future, much as they have under a few regional and state initiatives.
42
Figure 14. The GHG Emission Reduction Strategies Pyramid.38
3.1 FUEL TECHNOLOGIES
A positive step toward GHG mitigation would be to reduce dependence on highly polluting fossil fuels and consider alternatives that are less damaging to the environment. Owing to the fact that CO2 makes up such a large percentage (95%) of the total GHGs emitted by freight transportation modes, an effective mitigation strategy is to reduce CO2 production from the source by shifting to low carbon fuels. It has been recognized that the higher the carbon content of a fuel, the higher the CO2 emissions resulting from its combustion. The idea is to replace existing fuels with those that have the same thermal efficiency but lower carbon content. A wide variety of alternative fuels has been discovered to have the potential to replace fossil fuels, with varying degrees of success. The degrees of success where commercial freight transportation is concerned do not only vary, but they are also generally on the lower end of the scale. Alternative liquid fuels include biodiesel, ethanol, methanol, synthetic gasoline, and diesel made from natural gas, coal, or other feedstocks. Gaseous fuels include compressed natural gas (CNG), propane (Liquefied Petroleum Gas –LPG), dimethyl ether (a diesel substitute) and hydrogen (H2). Each fuel can be made from multiple sources, with a wide range of GHG emission consequences. In evaluating the effects of different fuels on GHG emissions, it is crucial to consider GHG emissions associated with fuel production and distribution in addition to vehicle tailpipe emissions, i.e., lifecycle emissions versus direct emissions only.
38 American Association of State Highway and Transportation Officials. Real Transportation Solutions for Greenhouse Gas Emissions Reductions. http://realsolutions.transportation.org/Pages/default.aspx. Accessed November 2009.

43
Biodiesel
Biodiesel is a renewable alternative fuel that is cleaner burning, in terms of CO2 but not necessarily in terms of other air pollutants such as NOx. It can be produced from a wide range of vegetable oils and animal fats and contains no petroleum, but can be blended at any level with petroleum diesel to create a biodiesel blend. With little or no modifications, it can be used in compression-ignition engines. A popular blend of biodiesel that also has commercial applications is the B20 biodiesel. It contains 20% pure biodiesel and 80% petroleum. Though the tailpipe emissions from B20 biodiesel are similar to its standard petroleum derived diesel counterpart, it promises a lower lifecycle carbon footprint. Results of lifecycle analyses to-date that promise to establish its viability are still debatable, as they depend on several assumptions. Also, biodiesel has a lower BTU output per unit than diesel. Raising the biodiesel content of a fuel comes with a total loss in power output that results in the use of more fuel to yield an equal amount of energy output.
Ethanol
Ethanol is a renewable alternative biofuel made from various plant materials. Ethanol can be blended with gasoline in varying quantities. Most spark-ignited gasoline-style engines will operate well with mixtures of 10% ethanol (E10). E85, a mixture of 85% ethanol and 15% unleaded gasoline, is an alternative fuel for use in flexible fuel vehicles (FFVs). The extent to which ethanol produced from corn (as is standard practice in the U.S.) can reduce overall GHG emissions has been the subject of extensive study and debate. Issues associated with its viability as a low carbon alternative include the heavy use of fossil fuels to produce heat during the conversion process, generating substantial greenhouse gas emissions (high energy requirements); heavy use of water during production; heavier use of insecticides, herbicides, and fertilizers than other crops; reallocation of agricultural land use to corn crop, which can create human and animal food crop shortages and high prices; deforestation to expand agricultural land available for corn; corn ethanol’s poor ability to be transported via pipeline hence requiring truck transportation; and so on. While corn-derived ethanol may be a short-term solution to the energy problem, it casts doubt on corn-based ethanol’s long-term viability and begs the need for a long-term solution, such as cellulosic ethanol. Fuels promising lower lifecycle GHGs can also greatly reduce overall transportation GHG emissions but lifecycle analyses that would prove their viability are still debatable and results should be stated with caution due to the several inherent assumptions they incorporate.
Biofuels like most alternative transportation fuels face barriers, both economic and infrastructural. Biofuels are not necessarily less expensive, but the processes for converting abundant agricultural feedstocks, such as corn and sugarcane, into ethanol are widely known and practiced. The GHG benefits of sugarcane conversion are substantial, compared to gasoline, but only about 10-20% for corn. Biofuels of the future, made from agricultural residue or cellulosic energy crops could have lifecycle GHG benefits of 90-100%.39 A 2008 UK study of low-carbon cars noted that, in the long term, carbon-free road transport fuel was the only way for Great
39 Lutsey, N. P., and D. Sperling. Transportation and Greenhouse Gas Mitigation. Climate Action 2007, United Nations Environmental Program, January 2008, pp. 191–194.

44
Britain to ‘decarbonize,’ essentially achieving an 80 to 90% reduction in emissions. It also cautions that while biofuels offer great benefits in the early and medium stages of our move to zero emissions, too much reliance on biofuels could put a great strain on the earth’s natural resources.40
Lower carbon fuels have been subsidized and mandated by various governments, including biofuel mandates in Europe and ethanol subsidies in the U.S. and Brazil. Brazil is one of the world’s leaders in renewable energy sources. In 2007, around 46% of the country’s total energy consumption came from renewable sources, over 85% of which from hydroelectric power.41 Currently, there is a renewable fuel standard in the U.S. that calls for 7.5 billion barrels of biofuel to be blended into the gasoline supply by 2012; and the U.S. government has called for a fivefold increase in this mandate to 35 billion barrels by 2017. To the extent that these targets are achieved, they will be met primarily by ethanol derived from corn-based feedstocks. These renewable fuel mandates are problematic both in that there may not be enough cropland to support the mandated ethanol supply without effecting food production, and in that corn-based ethanol delivers only marginal GHG reduction benefits over petroleum. Longer-term ethanol derived from cellulosic feedstocks may contribute to the type of integrated solution that is needed, but a viable cellulosic conversion technology may be a decade or more from producing fuel at scale.42
Propane (Liquefied Petroleum Gas-LPG)
Propane, also known as liquefied petroleum gas, is a byproduct of natural gas processing and crude oil refining. Currently, less than 2% of U.S. propane consumption is used for transportation. However, interest is growing due to its domestic availability, high energy density, and clean-burning qualities.
Natural Gas
Natural gas is a fossil fuel comprised mostly of methane and is cleaner burning than gasoline or diesel fuel. Natural gas must be stored in cylinders, usually located in the vehicle’s trunk, with serious payload and cargo volume reduction implications for freight trucks. Although the most common form is Compressed Natural Gas (CNG), it also comes in the less common liquid form known as Liquefied Natural Gas (LNG). Natural gas has the highest energy/carbon ratio of any fossil fuel, meaning that it produces less carbon dioxide per unit of energy than any hydrocarbon. Another benefit of Natural Gas Vehicles (NGV) is that traditional gasoline engines can be converted to run on natural gas. Natural gas offers an excellent alternative to gasoline-powered cars because it has been used successfully throughout the world especially for buses in congested environments. More than 7 million natural gas-powered vehicles are on the world’s roads according to the International Association of Natural Gas Vehicles. The U.S. alone has
40 HM Treasury. The King Review of Low-Carbon Cars. http://www.hm-treasury.gov.uk/king_review_index.htm. Accessed November 2009. 41 Schaeffer, R., A. Szklo, and A. Lucena. Energy Security in Brazil: Understanding the Impact of Climate Change on the Energy Sector. 2009. 42 Kromer, M. A. and J. B. Heywood. Electric Powertrains: Opportunities and Challenges in the U.S. Light-Duty Vehicle Fleet. Laboratory for Energy and the Environment, Massachusetts Institute of Technology, May 2007.

45
about 130,000 natural gas buses and with the needed infrastructure, hopefully they will have applications in the freight sector as well LNG is more popular in freight transportation, as it provides a much larger range for the same volume requirements. In British Columbia, Kenworth Trucks (a division of Paccar Inc.) is producing its Class 8 truck, which utilizes a Cummins engine retrofitted for use with LNG by Westport Innovations.43
Liquefied Natural Gas (LNG) as an alternative fuel for locomotives was demonstrated by the Burlington Northern Railroad Company (BN) from 1991 through 1996 in revenue coal train service.44 The emissions reduction for all criteria pollutants using natural gas fuel with the developed locomotive conversion system was 64%. CO2 emissions were nearly 12% lower than the equivalent diesel fueled locomotive engine as tested by the Southwest Research Institute.45 Natural gas has been demonstrated to provide equal horsepower in a railroad diesel locomotive engine.
Other Fossil Fuels and Geologic Sequestration
Oil shale, coal, and tar sands are gaining popularity. These next-generation fuels if used would have much higher GHG emissions than conventional petroleum, unless the carbon from such fuels was captured and stored underground. The environmental feasibility of using these fuels would go hand-in-hand with the advancement in technologies of carbon sequestration. This process of capturing the CO2 that would otherwise enter the atmosphere and storing it underground is a practice that is rapidly gaining acceptance as a mitigation strategy. In the transportation sector, it has the potential of reducing lifecycle GHGs emissions, mainly those emitted during fuel extraction and processing. While there are many different methods to sequester CO2, geologic sequestration (GS) is one such process where the CO2 is injected from a source through a well into the deep subsurface. With proper site selection and management, geologic sequestration could play a major role in reducing emissions of CO2.
The world’s first large aquifer storage project has been underway since 1996 in the North Sea in Norwegian territory at the Sleipner gas field 200 km offshore. There, a Norwegian oil company is producing natural gas that contains 90% combustible gases and 10% CO2. The maximum allowed concentration of CO2 in the European natural gas grid is about 2.5%, so the excess CO2 must be “stripped” prior to being sent to the grid. Normally, stripped CO2 is vented to the atmosphere, but Norway has imposed a tax on such CO2 emissions. The company has responded by injecting the stripped CO2 into a deep aquifer, and it has convinced the Norwegian government that the stripped CO2 will remain in the aquifer indefinitely. The Norwegian government is exempting the company from the tax.
43 Kentworth Truck Company. Kenworth To Produce Liquefied Natural Gas Vehicles - Westport Innovations To Supply LNG Fuel System. http://www.kenworth.com/6500_arc_pre_mor.asp?file=2255. Accessed March 2010. 44 Energy Conversions, Inc. EMD Natural Gas Engines. http://www.energyconversions.com/loco2.htm. Accessed November 2009. 45 Energy Conversions, Inc. Emissions and Natural Gas Locomotives (Table 1). http://www.energyconversions.com/locoemis.htm. Accessed November 2009.

46
Emulsified Diesel Emulsified diesel is a blended mixture of diesel fuel, water, and other additives that
reduces emissions of PM and NOx. Emulsified diesel can be used in any diesel engine, but the addition of water reduces the energy content of the fuel, so some reduction in power and fuel economy can be expected—a vital drawback for freight modes. Emulsified diesel has been certified by both EPA and the California Air Resources Board (CARB) for emission reductions. Expected NOx reductions are in the range of 17 to 20% and PM emission reductions range from 17 to 50%. Emulsified diesel typically increases VOC emissions.46
Hydrogen
Hydrogen (H2) is a domestically-produced, alternative fuel that can be used directly in internal combustion engines or to create electricity. However, it is only as renewable as the energy source used to produce it. If the hydrogen is produced from renewable electricity, or from the reforming of syngas made from biomass or landfills, than it would qualify as renewable. However, hydrogen from natural gas, or from coal generated electricity would hardly qualify as renewable.
A chemical reaction between oxygen and hydrogen produces the electric power, and when the transportation fuel is pure hydrogen, the only resulting emission is water vapor. Depending on the energy source that causes the chemical reaction, hydrogen can be a near emission-free transportation fuel. The GHG emissions from hydrogen production can be quite high if the hydrogen is produced from fossil fuels, unless the carbon dioxide from the hydrogen production is sequestered.47 Though not widely used today, currently government and industry research and development are investigating safe and economical hydrogen production and hydrogen vehicles. A major issue with hydrogen is large-scale production and distribution infrastructure, which is also an issue with electric power. An associated issue is possible redundancy of the vast, existing infrastructure (assuming widespread adoption of these alternative power sources), which for centuries has been based on petroleum fuels.
A company in Canada is developing and demonstrating (at General Motors and FedEx) the use of fuel cell power units in industrial vehicles. Here, hydrogen fuel cells replace industrial lead acid batteries and Internal Combustion Engines (ICE) in Class 3 fork-lift trucks. These hydrogen fueled fork-lift trucks will not only be superior in performance but will also lower harmful GHGs apart from other advantages. Fuel cell products have zero emissions and consequently significantly mitigate GHG emissions as well as harmful airborne contaminants.48
46 ICF Consulting. Assessing the Effects of Freight Movement on Air Quality at the National and Regional Level (Chapter 4). Federal Highway Administration, April 2005. http://www.fhwa.dot.gov/environment/freightaq/. Accessed November 2009. 47 Kahn Ribeiro S., S. Kobayashi, M. Beuthe, J. Gasca, D. Greene, D. S. Lee, Y. Muromachi, P. J. Newton, S. Plotkin, D. Sperling, R. Wit, P. J. Zhou. Transport and its infrastructure. In Climate Change 2007: Mitigation of Climate Change. United Kingdom and New York. http://www.ipcc.ch/publications_and_data/publications_ipcc_fourth_assessment_report_wg3_report_mitigation_of_climate_change.htm. Accessed November 2009. 48 Hydrogenics Corp. http://www.hydrogenics.com/. Accessed November 2009.

47
Electric/Hybrid Power Much greater GHG reductions are possible with electric drive propulsion technologies.
These include the increasingly popular hybrid gasoline-electric vehicles, which include plug-in-electric and battery-electric hybrid vehicles, and hydrogen powered fuel cell vehicles. Such technologies can double vehicle fuel efficiency under city driving conditions but can achieve much smaller results in long haul applications. The lifecycle GHG emissions, considering the potential to use low carbon electricity and hydrogen, can be reduced by at least 80%. However, these advanced technologies involve either large initial costs, for electricity and hydrogen storage, and/or have high development costs and uncertain learned-out costs. Because vehicle turnover is slow, especially freight vehicles, and it takes a long time to deploy a new energy distribution system, it will take a long time to realize potential reductions.39 The challenges associated with fully electrifying the freight sector make this a very unlikely candidate, at least in the near to mid-term, except in rail electrification. Hybrid vehicle technologies offer some potential for heavy vehicles, but fuel economy results vary depending on how vehicles are operated. Fuel cell vehicles are more likely to provide the necessary energy requirements of long haul trucks.
As fuel and engine costs rise, many companies are already working to improve fuel efficiency. For distribution vehicles operating on shorter, multi-drop trips, the potential of hybrid powertrains will soon be proved. Trials and adoption of diesel hybrid-electric medium-weight trucks (and other fuel efficiency improvements) are under way with environmentally aware larger shippers and carriers, such as UPS, FedEx, DHL, Coca-Cola, Wal-Mart, Celadon, Con-Way, and Schneider in the U.S., who are routine early adopters of emission reduction technologies and are often aided by third-party logistics providers (3PLs). Hybridization may cut distribution trucks’ and vans’ emissions by around 20% to 30%, as it has with cars in urban driving cycles. Research, development, and manufacture of fuel efficiency technologies is undertaken by private companies such as Eaton, Great Dane, and Peterbilt.
The multimodal operator DHL offers a green tariff service using alternative fuel vehicles and has set itself specific annual targets to improve utilization and thus reduce emissions per tonne/km. In the UK, Smith Electric Vehicles launched its first battery-electric delivery vehicles in December 2006, supplying a trial fleet to TNT Express UK (a package pickup and delivery company similar to UPS) for trials in Rotterdam in August 2008.49 While hybrids currently offer great paybacks, they are a bridge to the ultimate goal of near zero-emission vehicles, which would most likely run on electricity or natural gas. Hybrids use gasoline for power, but the engine also charges batteries for use when the engine is off. As we move toward totally electric cars, we are seeing hybrid-hybrids or ‘plug-in hybrids’ that can receive electric charging from outside the vehicle itself. In the U.S., utility companies in California and Florida have adopted hybrid refuse and utility trucks in their vehicle fleets.
Hybrid-electric power may soon offer fuel savings and emission reductions in a number of freight rail applications. For example, many freight railroads are currently experimenting with hybrid switcher locomotives, such as the “Green Goat” manufactured by RailPower Technologies Corporation. The Green Goat relies on battery power to run electric traction motors on the axles. The lead acid batteries are charged by a small onboard diesel-powered generator
49 Climate Change Corp. Special report: Technology to cut freight emissions. March 2008. http://www.climatechangecorp.com/content.asp?ContentID=5210. Accessed November 2009.

48
and microturbine. The reduced reliance on diesel fuel allows for a 30% reduction in fuel use and up to a 90% reduction in NOx emissions, compared to a conventional switcher locomotive.50
Electrification of railroads has been considered in the past to be a zero emission strategy. However, recent studies indicate the maximum reductions in all criteria pollutants would be no more than 88%.51 The use of hybrid locomotives (battery–generator/charger) is only practical for yard use because they are low speed and have restricted energy availability. The Genset locomotive is only acceptable for short haul use and yard switching. It has several engine-generator sets allowing the engine to operate at the highest efficiency levels while only producing the required operating power to move the train. The railroads placed initial orders for at least 250 of these low-emission switch locomotives systemwide by November 2007.50
Development of more fuel efficient vehicles, such as plug-in electric hybrids, has been promoted via policy decisions, such as stringent Corporate Average Fuel Economy (CAFE) standards. However, they do not apply to medium and heavy duty (commercial) trucks, only to passenger cars. Tax credit programs and “feebates” can encourage the purchase of more fuel efficient vehicles and are rather popular with the cost-savings driven freight transportation sector. Recent governmental programs have begun targeting freight trucks and rail, but there is a lot more to be accomplished. The EPA and CARB have freight initiatives and retrofit programs to accelerate introduction of cleaner technologies. However, the long-term benefits of fleet conversion will not be completely realized until 2030.52
Drawbacks53 related to wide adoption of alternative fuels in freight truck and rail transportation modes include the facts that fuel savings are already a strong driver for investing in highly efficient diesel engines. Thus, there is a smaller margin for emissions savings than in passenger cars. In addition, other fuels cannot match diesel’s energy efficiency. Only carbon-free fuels would generate significantly fewer GHG emissions than diesel. Further, the higher space or weight requirements for storage of alternative fuels can lead to loss of valuable payload and cargo space. In rail, locomotive diesel engines are even more fuel efficient than heavy-truck engines. Given the fact that electricity in the U.S. is primarily produced from fossil fuels, switching to electric locomotives might increase GHG emissions, unless the CO2 from electricity production was captured and sequestered. Perhaps the most promising (and long term) option for rail is hydrogen, but the necessary supporting infrastructure is required.
50 BNSF Railway Company, Union Pacific Railroad Company, The Association of American Railroads, and California Environmental Associates. An Evaluation of Natural Gas Fueled Locomotives. November 2007. http://www.arb.ca.gov/railyard/ryagreement/112807lngqa.pdf. Accessed November 2009. 51 Morrissey S., Wilbur Smith Associates. Multi-County Goods Movement Action Plan Update. In Minutes of Goods Movement Task Force Meeting, Southern California Association of Governments, February 2008. http://www.scag.ca.gov/goodsmove/pdf/2008/gmtf022008fullagn.pdf. Accessed November 2009. 52 Federal Highway Administration. Memorandum: Eligibility of Freight Projects and Diesel Engine Retrofit Programs. January 2003. http://www.fhwa.dot.gov/environment/cmaqpgs/retrom.htm. Accessed November 2009. 53 Greene, D. L. and A. Schafer. Reducing Greenhouse Gas Emissions from U.S. Transportation. Pew Center on Global Climate Change, May 2003. http://www.pewclimate.org/global-warming-in-depth/all_reports/reduce_ghg_from_transportation/. Accessed November 2009.

49
3.2 VEHICLE TECHNOLOGIES
GHG emissions associated with vehicles can be reduced by one or a combination of the
following types of measures: • Reducing the loads (weight, rolling and air resistance, and accessory loads) on the vehicle,
thus reducing the work needed to operate it; • Increasing the efficiency of converting the fuel energy to work, by improving drive train
efficiency and recapturing energy losses; and • Reducing emissions of non-CO2 GHGs from vehicle exhaust and climate controls.
The loads on the vehicle consist of the force needed to accelerate the vehicle, to
overcome inertia; vehicle weight when climbing slopes; the rolling resistance of the tires; aerodynamic forces; and accessory loads. In steady highway driving, which is relevant to heavy-duty trucks, aerodynamic forces dominate because these forces increase with the square of velocity; aerodynamic forces at 90 km/hr are four times the forces at 45 km/h. There are a range of measures to improve engine efficiency, which indirectly impacts the amount of GHGs emitted from the vehicle: increasing thermodynamic efficiency, reducing frictional losses, and reducing pumping losses (these losses are the energy needed to pump air and fuel into the cylinders and push out the exhaust). Each kind of measure can be addressed by a number of design, material, and technology changes. Also, some of the energy used to overcome inertia and accelerate the vehicle—normally lost as heat when vehicle speed is reduced, aerodynamic forces take effect, rolling resistance increases, and mechanical brakes are applied—may be recaptured as electrical energy if regenerative braking is available.
Reducing Tire Losses
Reducing tire loses is accomplished by improving tire tread design and materials that reduce their rolling resistance; by maintaining proper tire pressure either automatically or through routine manual checking by the driver; and by reducing tire weight, e.g., single wide tires, because tire losses are a linear function of vehicle weight.
Reducing Inertial Loads
Reducing inertial load is accomplished by reducing vehicle weight, with improved design and greater use of lightweight materials. A 10% reduction in total vehicle weight can improve fuel economy by 4–8%, depending on changes in vehicle size and whether or not the engine is downsized. There are several ways to reduce vehicle weight, including switching to high strength steels (HSS); replacing steel with lighter materials such as aluminum, magnesium, and plastics; and overall evolution of lighter design concepts and forming technologies. Lightweight tractors and trailers were incorporated by Kraft Foods in the U.S.

50
Aerodynamics Improvement Aerodynamics improvement involves reducing aerodynamic forces by changing the
shape of the tractor or trailer, smoothing vehicle surfaces, reducing the vehicle’s cross-section, controlling airflow under the vehicle, and other measures. Improvements have been made in the aerodynamic performance of vehicles—mainly passenger cars—over the past decade, but substantial additional improvements are possible. Addition of wind deflectors and trailer fairings in trucks has proven to reduce the drag forces experienced by the vehicles during high speeds, e.g., long-distance trucks, offering dramatic improvements in aerodynamic performance and fuel use gains. A complete package of aerodynamic improvements for a heavy-duty truck, might save about 12% of fuel when operating primarily on uncongested highways, at a cost of about US$5,000 in the near-term, with substantial cost reductions possible over time.
Mobile Air Conditioning (MAC) Systems Mobile Air Conditioning (MAC) systems measure to reduce the heating and cooling
needs of vehicle occupants, for example by changing window glass to reflect incoming solar radiation. MAC systems contribute to GHG emissions in two ways: by direct emissions from leakage of refrigerant and by indirect emissions from fuel consumption. The rapid switch from CFC-12 (GWP 8100) to HFC-134a (GWP 1300) has led to the decrease in the MtCO2e emissions from about 850 MtCO2e in 1990 to 609 MtCO2e in 2003,54 despite the continued growth of the MAC system fleet. Refrigerant emissions can be decreased by using new refrigerants with a much lower global warming potential (GWP), such as HFC-152a or CO2, restricting refrigerant sales to certified service professionals and better servicing and disposal practices. Since the energy consumption for MAC is estimated to be 2.5–7.5% of total vehicle energy consumption, a number of solutions have to be developed in order to limit the energy consumption of MAC, such as improvements of the design of the systems, including the control system and airflow management.47
Hybrid Hydraulic/Regenerative Braking Systems
Using a hydraulic pump, the system regenerates kinetic energy while the truck is braking. The energy is stored in a hydraulic accumulator to be reused later in the hydraulic operations of the vehicle. This system is more cost effective than hybrid electric solutions and is estimated to reduce fuel consumption by 20%. The demonstration will validate these performance targets by collecting data from five different trucks operating on waste collection routes. Refuse and utility trucks with a new hybrid hydraulic regenerative braking system are used in Florida and California.
Incremental/Emerging Improvements Incremental/emerging improvements include more efficient combustion, such as variable
valve systems, gasoline direct injection, cylinder deactivation, more efficient transmissions such
54 CFC: Chlorofluorocarbon; GWP: Global Warming Potential; HFC: Hydrofluorocarbon; MtCO2e: Metric tons of carbon dioxide equivalent (relative to GWP).

51
as 5- and 6-speed automatic, automated manual and continuously variable, and overall vehicle advances. GHG emissions rates can be reduced by 20-30% with these technologies in new vehicles. Most studies show that fuel savings from these improvements more than outweigh the increased vehicle cost, often by a large amount. Similar technology packages yield substantial GHG reductions and net positive benefits for commercial freight trucks as well.
A High Pressure Direct Injection (HPDI) fuel delivery system has been developed in Vancouver, Canada by Westport Innovations through funding from Sustainable Development Technology Canada (SDTC) that makes it possible to inject natural gas into a diesel engine’s combustion chamber. It will permit trucks and ultimately other commercial vehicles to run on natural gas—a cleaner fuel than diesel—with no loss of power. This technology solution leverages the prior investment in diesel technology by changing the fuel, not the engine. HPDI allows next-generation diesel engines to operate on lower carbon fuels such as natural gas, reducing emissions, and delivering valuable savings in fuel costs. The full benefits of this new technology were made known after testing under Canada’s busiest trucking conditions on Highway 401 between Toronto and Windsor.55 Other partners in the project include Cummins Inc., the world’s largest heavy-duty diesel engine manufacturer, Challenger Motor Freight, Enbridge Gas Distribution, Natural Resources Canada, and Transport Canada.56 Vehicular improvements are typically implemented (or ruled) by the four Rs: Retrofit, Repower, Replace and Repair/Rebuild.
Retrofit Retrofitting involves introducing an after-treatment device to remove emissions from the
engine exhaust or installing a natural gas fumigation system to transform the engine into a dual fuel engine. Retrofits can be very effective at reducing criteria pollutant emissions eliminating up to 90% of pollutants in some cases. Diesel pollution consists primarily of PM and NOx, and in this aspect these devices can cause substantial reductions in emissions. However, emissions control retrofit technologies can not reduce CO2 emissions, only the rest of the GHGs to an extent, since CO2 emissions only depend on the amount of fuel burned. Many of the effective after-treatment devices require use of ultra-low sulfur diesel (ULSD), which is now widely available, and which tends to have higher lifecycle GHG emissions. Some of the better known diesel retrofitting, after-treatment devices are Diesel Oxidation Catalysts (DOC), Diesel Particulate Filters (DPF), and Selective Catalytic Reduction (SCR) technology.
Repower
Repowering involves replacing an existing engine with a new engine. This strategy is most effective when the equipment has a longer life than the engine. Repowering enables the vehicle to comply with more stringent emission standards, often also improving fuel economy and lowering maintenance costs. Repowering can also include converting diesel-powered equipment (such as port cranes) to electrical power or alternative fuels.
55 http://www.tc.gc.ca/programs/environment/ecofreight/road/tools/casestudies/enbridge.htm. 56 Sustainable Development Technology Canada. Advancing Transportation - Westport Innovations. http://www.sdtc.ca/en/results/case_studies/case_study1.htm. Accessed November 2009.

52
Replacement Selectively replacing older freight equipment can sometimes be the most cost-effective
way to reduce the emissions of a fleet. In this way, older, higher polluting equipment is retired from service before it would otherwise be retired. Newer equipment that meets tighter emission standards is purchased to replace the retired equipment, sometimes in conjunction with retrofit devices or alternative fuels. These programs are sometimes called “scrappage” or “fleet renewal” programs. Such programs often include procedures to ensure that the retired equipment is destroyed in order to prevent resale and continued use. Fleet owners often benefit from improved fuel economy and performance, as well as lower maintenance costs.
Repair/Rebuild All freight equipment requires periodic maintenance. Routine maintenance and repairs
help ensure that engines operate at maximum performance and emission rates do not exceed the designed standard. Major maintenance intervals provide an opportunity to have the engine rebuilt using more modern, cleaner equipment that provides an immediate emission reduction benefit.46
The Freight Shuttle concept developed by the Texas Transportation Institute (TTI), consists of electrically powered vehicles propelled by linear induction motors that run on a specialized, derailment-proof guideway. These space-age appearing, unmanned vehicles would be able to transport containers from ports to terminals at highway speeds with the use of an automated control system. At the same time, the Freight Shuttle will allow for 100% inspections of containers by passing through a Homeland Security Scanning Station.57
A Swedish start-up engineering firm is developing a ‘Flexiwaggon’ that can accommodate heavy trucks or combinations of distribution trucks, driving on and off wherever trackside space allows, without the need for dedicated infrastructure. The truck has yet to come on the market.49
The Canadian Trucking Alliance has developed “enviro-trucks” (along with a fuel economy driver training and reward program) that have all the technological improvements to produce as few emissions as possible, right from aerodynamic design, auxiliary power unit, smog-free engine, gap free trailer unit, and low rolling resistance tires. The trucks are used by Bison Transport, a major Canadian carrier.58
Electric drive vehicles, powered by low carbon fuels made with biomass, wind, nuclear energy, or with fossil energy coupled with carbon capture and storage, could yield much greater GHG reductions than with vehicle efficiency improvements alone. Flexfuel vehicles are gaining popularity as more and more transport fuel choices become commercially available to the road user. Particularly in Brazil where there is large ethanol availability as an automotive fuel there has been a substantial increase in sales of Flexfuel vehicles (FFV). In 2006, Flexfuel vehicle sales in Brazil represented about 81% of the market share of light-duty vehicles. The use of FFVs facilitates the introduction of new fuels. One of the greatest advantages of FFVs is their 57 Texas Transportation Institute. Futuristic shuttle may transform freight transportation. http://tti.tamu.edu/publications/researcher/newsletter.htm?vol=43&issue=4&article=8&year=2007. Accessed November 2009. 58 Bison Transport. Greenest Truck on the Road. http://www.bisontransport.com/BisonWeb2007/sections/about/about-greenTruck.cfm. Accessed November 2009

53
flexibility to choose their fuel depending mainly on price. The disadvantage is that the engine cannot be optimized for the attributes of a single fuel, resulting in foregone efficiency and higher pollutant emissions. Ford designers have introduced a new supercharged v-10 engine with a tri-flex fueling system that allows users to enjoy a choice of three different fuels including gasoline, E85 ethanol, or hydrogen.
Mexico made a strong effort toward climate change in December 2008 when it announced it had set the goal of reducing GHG emissions to 50% below 2002 levels by 2050. According to its 1990-2002 GHG Inventory, transport is responsible for 18% of Mexico’s GHG emissions and is second only to energy generation as an emissions source.59 Mexico City shifted to efficient, low carbon bus rapid transit systems and light rail, retired old buses, and replaced them with lower carbon alternatives, such as hybrid vehicles. The funds are from a Clean Technology fund, supported by eight governments and managed by the World Bank.60
3.3 SYSTEM OPTIMIZATION/OPERATIONAL EFFICIENCY
System efficiency can be achieved through operational strategies that change the way
equipment is used, either within each modal system or across two or more modal systems. Strategies to promote system efficiency within each mode include reducing idling at origins, destinations, and intermediate points, through for example, electrification or auxiliary power units; restricting speed; improving driving practices; optimizing routing to reduce backtracking and empty miles; reducing shipment frequency; decentralizing supply chain origins; improving local distribution systems; decreasing non-revenue-producing payload such as excess packaging; increasing the use of longer/heavier trucks and longer trains; and increasing the use of double stacked trailers or containers on trains. Tools such as Intelligent Transportation Systems (ITS), advanced computerized dispatch, on-board real-time electronics, and Global Positioning Systems (GPS) can aid in the implementation of operational changes and optimization to achieve system efficiencies. Cross-sectional ways include promotion and advance of intermodalism, and diversion of activity from more energy intensive modes to less energy intensive modes. Water transportation has been shown to be the most energy efficient, followed by rail, with truck being the most energy intensive of the three modes.
3.3.1 Trucking Operational Strategies
Idling
The EPA estimates that idling long-haul trucks consume 960 million gallons of diesel fuel and emit 10.9 million tons of carbon dioxide (CO2), 180,000 tons of nitrogen oxides (NOx), and 5,000 tons of PM annually. Idling is most extensive when trucks are parked at truck stops or other roadside rest areas, often to allow the driver to sleep. Drivers tend to idle for extended 59 Instituto Nacional de Ecología. National Greenhouse Gas Inventory 1990-2002 Report of Mexico Executive Summary. http://www.ine.gob.mx/descargas/cclimatico/mexico_nghgi_ex.pdf. Accessed November 2009. 60 Office of Mexico-Japan Economic Partnership Agreement. Mexico: Seeking a Low-Carbon Growth Path. http://www.mexicotradeandinvestment.com/pdf/wb%20ctf.pdf. Accessed November 2009.
54
periods in order to heat or cool the cab, to run vehicle electrical appliances, to keep the engine warm during winters, or simply out of habit. Using a heavy-duty truck engine to provide temperature control or electricity is grossly inefficient and causes unnecessary fuel consumption and pollutant emissions. Avoiding unnecessary idling is a very effective way of reducing truck emissions.
A variety of technologies are available that provide cab heating, cooling, and/or electrical supply while consuming far less energy. These have been modified and adapted to locomotives in rail yards and ships in ports. They include:
• Stationary options such as an Auxiliary Power Unit (APU) mounted externally on the truck cab;
• Automatic engine idle systems start and stop the truck engine automatically to maintain a specified cab temperature or to maintain minimum battery voltage;
• Mobile options like Truck Stop “Shore Power” Electrification, which allows drivers to plug trucks into power outlets to run cab amenities; and
• Advanced Truck Stop Electrification, which provide heating, cooling, and other amenities via a console through the cab window.
Long idling of trucks can play a significant role in deteriorating local urban air quality especially in ozone nonattainment areas. Studies show that long-haul trucks are estimated to idle up to six hours per night and an average of 1460 to 1800 hours per year per truck.61 FHWA estimates that reducing all overnight idling by 50% would reduce NOx emissions by 156 tons per year in the Dallas-Fort Worth area and 524 tons per year in the Houston area. These reductions represent 0.3 and 0.8% of the on-road heavy-duty vehicle emission inventories in these regions, respectively. California has anti-idling regulations at truck stops.
Pick-up and Delivery Idling
While it is important to reduce idling, a better understanding of the reasons causing these expensive trucks to idle in the first place is called for. Truck drivers also idle for extended periods when waiting to pick up or drop off a shipment. The single biggest contributing factor appears to be delay caused by shippers and receivers. Shippers can improve scheduling with enhanced communications or logistics software. They can also provide climate-controlled comfort stations at docking facilities and, possibly, couple this with a no-idling policy.
To a large extent, truck idling at rail yards, warehouse/distribution centers, retail and commercial locations, and airports has been recognized and minimized as a significant source of productivity loss, as has been found by TTI. In general, the more valuable and time-critical the cargo, the less the operational productivity losses.
61 Frey, H.C., P-Y. Kuo, C. Villa. Effects of Idle Reduction Technologies on Real World Fuel Use and Exhaust Emissions of Idling Long-Haul Trucks. Environmental Science & Technology, Vol. 43, No. 17, 2009, pp. 6875–6881. http://pubs.acs.org/doi/abs/10.1021/es900186e. Accessed November 2009.

55
Congestion Often times, roadway congestion causes truck delay, idling, and excess emissions. While
trucks experience roadway congestion in every urban area, some of the most obvious congested locations are international borders, toll facilities, grade crossings, and port terminal gates.
At borders, lengthy immigration and security procedures can contribute to long delays for trucks. The Detroit border crossings, for example, handle more than 5 million commercial trucks per year. Backup times for trucks averaged almost 30 minutes in 2002 and exceeded one hour at busy times on many days. Greater use of electronic pre-clearance can help to streamline border operations and reduce congestion. Physical capacity expansion may also be needed at some border crossings. It is worthwhile to also note that while congestion causes excess emissions due to idling, effects of emissions directly due to congestion are sometimes unclear.
Speed Restrictions Many trucking companies have adopted a maximum speed policy for their drivers as a
way to save fuel expenses and to promote safety. State and local agencies have also considered highway speed reductions as a way to reduce emissions. For example, the Tennessee Department of Transportation recently agreed to reduce the truck speed limit in Shelby County to 55 mph as a way to help the region attain ozone standards.46 In Canada, Ontario and Quebec have established mandatory truck speed restrictions to a maximum of 105 kh/h through speed limiters. Inevitably though, “split speed zones” are accompanied by various safety concerns.
Ecodriving
Fuel economy can largely vary based on driving practices. In addition to limiting speed and idling time, drivers can improve fuel economy through their acceleration practices, gear shifting technique, route choice, use of accessories, and number of stops. Many agencies and organizations have set up driver training and certification programs, e.g., Smartway (U.S.), SmartDriver (Canada), and Freight Best Practice (U.K). An effective program also includes monitoring of driver performance after training and incentives for drivers who reduce fuel consumption. Data from electronic engine monitors can be used by trainers to review detailed operating patterns with drivers and benchmark performance over time. If properly designed and implemented, incentive programs have been found to be very effective at changing driver behavior.
Reducing Empty Mileage and Circuitous Routing
Trucks can also improve efficiency and reduce emissions by reducing empty mileage. When motor carriers cannot arrange for a return shipment, drivers may be forced to pull empty trailers. It is found that empty driving accounts for 20% of all mileage for long-haul trucks. Particularly for smaller trucking companies and regional operations, there are opportunities to reduce empty mileage through improved freight logistics, such as decentralization of supply chain origins and improved local distribution systems. Minimizing empty mileage, as well as other inefficient practices, such as circuitous routing or backtracking, results in greater fuel productivity (more ton-miles per gallon), which reduces emissions and, at the same time,
56
increases profits for trucking companies. Private and for-hire trucking industry were quick to respond to record fuel prices in the summer of 2008 by shifting Less Than Truckload (LTL) operations towards Truckload (TL). In the U.K., Haulage Freight Exchange62 is a company that provides online capability for finding empty trucks and arranging backloads. It claims 2,500 members, 10,000 vehicles, and 300,000 backloads shipped.
Increasing Capacity Allowing longer or heavier combination vehicles (LHCVs) can improve efficiency by
enabling the movement of more goods using fewer vehicles, thus reducing emissions and realizing economic benefits. Canada and Mexico abide by the 97,000 lb Gross Vehicle Weight Rating (GVWR). Some Canadian provinces allow trucks up to 135,000 lb. Most of the U.S. follows the 80,000 lb GVWR with the exception of some western states where LHCVs are restricted to truck-only lanes. Issues preventing their legal adoption nationally include safety and infrastructure impacts, as well as modal competition. The GVWR limit has been unchanged since 1991 when the railroads won the case for LHCV restrictions. The trucking industry is currently lobbying the U.S. Congress to streamline length and weight limits with those in the other two NAFTA countries. Abroad, Sweden and Finland allow 60 ton trucks versus the 40 ton limit in the rest of the EU. A capacity related strategy is reducing non-revenue-producing payload, such as excess packaging. Wal-Mart is the primary example of its deployment, which pledged its suppliers to reduce excess packaging in their products.
Advance Clearance
Significant delays and wasted fuel can be experienced by trucks queuing at weigh stations, and port or rail terminals. Advanced clearance systems via license plate recognition along truck freight corridors, such as I-75 in the U.S. from Miami to Detroit, have successfully alleviated the problem. An appointment system to alleviate congestion at terminal gates just prior to opening time has been considered at the Ports of Los Angeles and Long Beach, to complement the otherwise quite successful PiesPass peak pricing program.
3.3.2 Rail Operational Strategies
Idling
As with trucks, an effective operational strategy to reduce locomotive emissions is to reduce idling. Typically, idling in rail occurs along the line-haul, or at switch yards. Reasons could be to wait for trains to pass, to keep the engine warm in cold weather and keep accessories from freezing, or for no apparent operational reason at all. The EPA estimates that idling accounts for 60% of switch yard locomotive operating time and 12.5% of line-haul locomotive operating time.
62 Haulage Freight Exchange. http://www.haulageexchange.co.uk. Accessed November 2009.

57
In order to reduce idling time, fuel consumption, and pollutant emissions, an APU can be used to provide power when a locomotive is idling. The U.S.’s CSX and the Canadian International Road and Rail have formed a joint venture company called EcoTrans Technologies to manufacture and sell an APU that automatically shuts down the main locomotive engine while maintaining all vital main engine systems, such as climate control and heating engine fluids in cold weather. The device is powered by a small diesel engine and parallels all circulation systems on the locomotive. EcoTrans estimates that the APU can eliminate 90% of switcher idling time. The FHWA estimates that retrofitting 50% of the switcher locomotives in the Baltimore and Houston regions with APUs and reducing idling to the extent possible with these devices would reduce annual NOx emissions by 231 tons and 277 tons, respectively. These reductions represent 10% and 6% of the total annual freight railroad emissions in these regions, respectively.46
Locomotives can also be installed with automatic shut-down devices. These devices monitor the locomotive temperature and restart it as necessary to maintain minimum temperatures. Newer locomotives are also equipped with a low idle setting that reduces fuel use and emissions during extended idle periods. Replacing older switch yard locomotives with these newer units can help reduce the emissions associated with idling.
Speed Restrictions Trains can improve fuel efficiency and reduce emissions by operating at lower maximum
line-haul speeds. Railroads sometimes take this step on one or more lines in an effort to cope with higher fuel prices. For example, in 2001 BNSF experimented with operating eastbound intermodal trains between New Mexico and Chicago at a maximum speed of 60 miles per hour rather than 70. However, if railroads lower train speeds to the point where service is inadequate to shippers, they risk diverting traffic to trucks.
Congestion Freight rail emissions also can be reduced by improving line-haul efficiency and reducing
rail system congestion. As freight volumes continue to grow each year, rail systems are often subject to congestion and subsequent breakdowns. Due to the interconnected nature of the rail system, it is hard to identify causes of congestion and this can cause it to ripple throughout the U.S. Thus, rail congestion in Arizona or New Mexico can increase emissions in Los Angeles. Rail system congestion is also evident in a drop in average train speeds since 1992. Lower average train speeds generally indicate more idling and starts and stops en-route, which leads to higher emissions. The solutions to rail system congestion problems are complex, but clearly the railroad companies’ lack of investment capacity has contributed to a decline in net capital stock.
Reducing Empty Miles and Backtracking
Minimizing empty mileage, as well as other inefficient practices, such as backtracking, results in greater fuel productivity (more ton-miles per gallon), which reduces emissions and, at the same time, increases profits for railroad companies. This is especially important with rail transportation where unit trains routinely travel loaded one way from production to market and
58
are empty on the return trip. Examples include grain trains from the U.S. Midwest to the Port of New Orleans for export, or coal trains from Wyoming to power plants westwards or eastwards. In addition, the rail infrastructure network is rather fixed, and coupled with railroad agreements, prescribes following more circuitous routes from an origin to a destination, in contrast to possibly more direct ones.
Increasing Capacity Deregulation in the late 1970s allowed railroads the freedom to shift operational
practices and reach tremendous efficiencies. Two of the ways these were achieved was increasing train capacities, by “doublestacking” containers and trailers, i.e., placing one on top of another one on the same railcar, and utilizing longer trains. Inevitably, issues are associated with the latter such as increased time to go through a highway-rail crossing and exacerbation of roadway congestion, delay, and emissions, as well as safety.
3.3.3 Advanced Technologies and Logistics This class of strategies involves recently emergent tools that facilitate and enhance
success of the other strategies and so deserve to be mentioned distinctly. Advanced Computerized Vehicle Routing and Scheduling (CVRS) involve the application of computers, communications, navigational systems, and sensor technology to improve operational efficiency in surface transportation. When used effectively, Intelligent Transportation Systems (ITS) open the door to new ways of understanding, operating, expanding, refining, reconfiguring and using the transportation system. Over the past ten years, the public and private sectors have invested billions of dollars in ITS research, development, and initial deployment of the resulting products and services. The objective is to advance the safety, efficiency, and security of the surface transportation system, provide increased access to transportation services, and reduce fuel consumption and environmental impact. Through up-to-date traffic information and dynamic scheduling and rerouting, for example, the shortest route to destination can be traveled. The role of telematics and real-time navigation aids is expanding fast, optimizing road freight routes, and helping avoid congestion. But overloaded and outdated infrastructures remain a major impediment to freight flow.49
Obviously the rail system follows a more fixed route and applications may be more limited, but technological advances have played a major role in the productivity increases achieved by rail since deregulation in the late 1970s. In Canada, development and demonstration of the Electronic Container Transfer (ECT) technology as the low cost pallet solution for the Canadian consumer products industry is taking place. The ECT software and a multi-party trading system track and electronically reconcile pallet ownership to minimize transportation and handling costs while alleviating road traffic and reducing diesel engine pollution. This will be accomplished by virtually reconciling balances of pallets owing between multiple members. This opportunity also extends to other standard returnable assets such as cages, totes, plastic pallets, thermal covers, milk crates, and bread trays.63
63 Canadian Pallet Council. http://www.cpcpallet.com/index.cfm?fa=home.homepage. Accessed November 2009.

59
3.3.4 Freight Movement Optimization Coupled with complete transparency of the location of freight, better information on
system status will enable logistics managers to optimize the movement of goods, reroute and/or redirect shipments as needed, and reduce the overall costs of operating just-in-time systems. Businesses and consumers will enjoy a reduction in the cost of goods as a result of improvements in freight movement efficiency and economy. An integrated network of transportation information will add far greater reliability to the manufacturing and distribution processes that currently depend on “just-in-time” arrivals. The time it currently takes to apply for and receive credentials will be reduced, improving utilization of trucks and railroad cars. This will effectively increase the capacity and throughput of the system and at the same time mitigate GHG emissions. Shippers will be able to optimize their routing choices through access to better information on shipping characteristics, costs, and alternatives. This will encourage more effective competition among shipping modes.64
3.3.5 Intermodal Freight Transportation Intermodal freight transportation is the movement of freight using more than one mode of
travel where all parts of the transportation network are effectively connected and coordinated. An intermodal system includes both origins and destinations (for example, ports, railheads, and warehouses), as well as the links between them (such as roads or rail). Intermodalism describes an approach to planning, building, and operating the transportation system that emphasizes optimal use of transportation resources and connections between modes. In an intermodal transportation network, trains, trucks, ships, and aircraft are connected in a seamless system that is efficient and flexible, and meets the needs of consumers, carriers, and shippers.65
New intermodal partnerships among rail, truck, and ocean carriers offer enhanced mobility by shifting traffic from congested highways to the private sector rail or marine shipping network, and environmental benefits by employing the cleanest possible technologies that improve air quality. Investment in Southern California’s Alameda Corridor (depressed rail corridor) illustrates how improved freight flows through a local bottleneck affect destinations well beyond the metropolitan area and the State. The project reduced congestion on rail connections between the Ports of Los Angeles and Long Beach and the rest of the nation, as well as congestion on streets in the Los Angeles area that formerly crossed the railroad at grade.66 Improving intermodal transfer requires the existence and upkeep of infrastructure, which is provided by either or both the private and public sectors.
64 Intelligent Transportation Society of America. National Intelligent Transportation Systems Program Plan: A Ten-Year Vision. January 2002. http://www.itsa.org/itsa/files/pdf/National10YearPlanITSFull.pdf. Accessed November 2009. 65 Federal Highway Administration, Office of Freight Management and Operations. Freight Story 2008: Responses to the Freight Challenge. http://ops.fhwa.dot.gov/freight/freight_analysis/freight_story/responses.htm. Accessed November 2009. 66 Federal Highway Administration, Office of Freight Management and Operations. Freight Story 2008: Freight and Congestion. http://ops.fhwa.dot.gov/freight/freight_analysis/freight_story/congestion.htm#highway. Accessed November 2009.

60
3.3.6 Modal Shift
Water transportation has been proven to be the most energy efficient mode with the smallest carbon footprint, followed by rail, with trucking being the most energy intensive of the three. A recent study by TTI conducted for the U.S. Maritime Administration compared the three modes in terms of several public impacts: cargo capacity, traffic congestion, energy efficiency, air quality, safety, and infrastructure. It found that inland barge transportation is by far the most fuel efficient and thus produces far fewer emissions of CO2 for each ton of cargo moved compared to truck or rail. Comparing transport emissions per ton-mile (emissions generated while shipping one ton of cargo one mile), researchers calculated that transport by rail emits 39% more CO2, and transport by truck emits 371% more CO2 than transport by inland barge (Figures 14 and 15). Further, if the 274.4 billion ton-miles of activity on U.S. inland waterways in 2005 were shifted to rail or truck, rail transport would have generated 2.1 million additional tons of CO2 and truck transport would have generated 14.2 million additional tons of CO2. This was a conservative estimate as it assumed that truck and rail modes had the capacity to handle the additional cargo with no change in efficiency.67
Figure 14. Ton-Miles per Gallon of Fuel.67
67 Kruse, C. J., A. Protopapas, L. E. Olson, and D. H Bierling. A Modal Comparison of Freight Transportation Effects on the General Public. Prepared for the U.S. Maritime Administration and the National Waterways Foundation. Texas Transportation Institute, College Station, Texas. December 2007. Amended March 2009. http://www.marad.dot.gov/documents/Phase_II_Report_Final_121907.pdf. Accessed November 2009.

61
Figure 15. Tons of CO2 per Million Ton-Miles.67
Fuel efficiency will depend on what type of transportation service within each mode is being used. Recent studies by the International Energy Agency and the International Transportation Forum have concluded that rail is more energy efficient than marine across all uses. Natural Resources Canada’s Office of Energy Efficiency Trends Analysis also demonstrates that year-after-year (from 1990 to 2006) rail performs better than marine freight transportation in terms of GHG emissions.
A recent study for the Port of Seattle68 established the carbon footprint advantages of West Coast ports. It estimated the GHG emissions from containerships originating in the Asian ports of Shanghai, Hong Kong, and Singapore and traveling to the North American ports of Seattle, Prince Rupert, Los Angeles/Long Beach, Houston, Savannah, Norfolk, and New York/New Jersey, and progressing onward via Class I intermodal trains to the cities of Chicago, Columbus, and Memphis. The comparison showed that marine transportation emits about 1.5 to 2.25 less carbon dioxide equivalent emissions (CO2e) per TEU-km than rail transportation. This relationship favors shipping over rail transportation when travel distances are comparable.
Economic competitiveness of marine transportation is the major obstacle to modal shift initiatives both in the EU (“Motorways of the Sea”) and in the U.S. (“Marine Highways”). Other obstacles in the EU, which also apply to the related “Marco Polo” program that seeks to promote intermodalism, include jurisdictional boundaries between the member states, administrative and funding issues, and rail network capacity largely occupied by passenger rail. A recent national study by TTI identified similar obstacles with respect to the U.S. equivalent program. These
68 Herbert Engineering Corp. Carbon Footprint Study for the Asia to North America Intermodal Trade. Prepared for the Port of Seattle, May 2009. http://www.portseattle.org/downloads/seaport/Carbon_Footprint_Study_20090501.pdf. Accessed November 2009.

62
include service/marketing issues, operating cost issues, infrastructure and equipment issues, government/regulatory issues, operational constraints, and vessel-related issues.69
While Volkswagen had opened a rail terminal in its manufacturing plant Dordon, England, to cut thousands of cross-European truck trips, in 2008 the company abandoned plans to ship parts to the plant from Germany by rail, finding that shipments by truck were both quicker and cheaper. Average rail freight speeds across Europe are said to be slower than ocean shipping speeds thanks to infrastructure constraints.49
Achieving large-scale modal shifts in transportation activity to more efficient modes has proven difficult. For example, although there are large differences in the energy intensities of freight modes, little effort has been expended trying to shift freight traffic from truck to rail or rail to water in order to reduce energy use and GHG emissions. Attempts to do so would run against increasing requirements for speed and reliability of increasingly service oriented economies. In addition, because different modes offer different services in terms of cost, speed, and performance, the differences in energy intensity are greatly reduced when one compares modes based on equivalent levels of service.53 The degree to which modal shift can be effected depends on several factors, such as shipment distance, commodity characteristics and value, as well as the geographical characteristics of the origins and destinations as many are unreachable by any other mode than truck. Another major consideration is the inbuilt systems that support just-in-time supply management practices; shifting modes would require fundamental changes in these practices that would involve significant capital costs not to mention risks in meeting delivery targets.
3.4 SMART/SUSTAINABLE GROWTH
Activity reduction refers to direct or indirect reduction in vehicles miles traveled, hence GHGs. Reducing overall congestion along a route or in an area through, for example, integrated transportation planning that better accounts for commercial/industrial land uses and freight movements can achieve overall GHG reductions from all transportation modes, freight, and passenger. Including externalities, such as emissions, noise, and infrastructure impacts, in transportation plans can help better evaluate their true costs and benefits. This class of mitigation strategies presents major future opportunities and, at the same time challenges, to the public sector to most actively spearhead freight GHG reductions by redirecting overall focus toward “sustainable” transportation planning or “smart growth.” It has been established that although increases in infrastructure capacity may decrease GHGs in the short term due to alleviation of road congestion, they actually may increase them in the long term due to induced travel as urban sprawl is encouraged (“build it and they will come”) and effectiveness of transit-oriented design is reduced.
While several specific initiatives have been undertaken to bring about reduction of GHGs from the freight sector through activity reduction, there has been a lack of a U.S. program, or in this case a NAFTA program, that integrates all the different aspects together under a common umbrella and at the planning stage. In other words, there is a need for NAFTA countries and 69 Kruse, C. J. and N. Hutson. NCFRP 17: North American Marine Highways.TRB, National Research Council, Washington, D.C., September 2009.

63
internationally to incorporate freight movement more concertedly in their transportation planning agendas.
3.5 MARKET-BASED MECHANISMS
Market-based mechanisms that limit GHG emissions can be divided into two types:
quantity control (e.g., cap-and-trade) and price control (e.g., carbon tax or fee). To some extent, a carbon tax and a cap-and-trade program would produce similar effects: both are estimated to increase the price of fossil fuels, which would ultimately be borne by consumers, particularly households. The main disadvantage with carbon tax is that it would yield uncertain emissions control, while cap-and-trade would lead to uncertain pricing. More than the instrument itself, that leads to the question of the rate of carbon tax and the amount of emissions to be capped. Some argue that the potential for irreversible climate change impacts necessitates the emissions certainty that is only available with a quantity-based instrument (i.e., cap-and-trade).70
The costs of reducing emissions would depend on several factors: the growth of emissions in the absence of policy changes; the types of policies used to restrict emissions; the magnitude of the reductions achieved by those policies; the extent to which producers and consumers could moderate emission-intensive activities without reducing their material well-being; and the policies pursued by other countries.71 Experts generally conclude that market-based approaches would reduce emissions to a specified level at significantly lower cost than conventional regulation. Currently, emissions control is heavily subsidized by the public sector. Imposing a price or limit on emissions will offset the costs of emissions abatement by the private sector, such as costly technologies. Whereas conventional regulatory approaches impose specific requirements that may not be the least costly means of reducing emissions, market-based approaches would provide much more latitude for firms and households to determine the most cost-effective means of accomplishing that goal. It is unarguable that emissions costs will have an effect on the economy and GDP, but there exists uncertainty as to the extent and pattern of distribution of those costs among the various strata of individuals, households, and companies. It is also believed inevitable that external costs, including emissions costs, will be factored in the price of transportation, both due to government intervention and due to consumer demand, thereby reflecting its “true” cost. Emissions costs are expected to supersede energy price considerations when making business decisions, leading to more regionalization and localization. Supply chains will still be global in nature, but changes in their design and operation will be inevitable in order to retain competitiveness.
The simplest pricing scheme is thought to be the increase in the prices of fossil fuels and other goods and services tied to GHG emissions. Such a market-based policy would induce firms and households to change their practices in the short run, by driving less, adjusting thermostats, planning trees, and switching fuels in the power sector. In the long run they could respond by buying more fuel efficient vehicles and equipment, building more energy efficient buildings in denser neighborhoods, and building power plants that use less (or no) fossil fuel or CO2 capture 70 Congressional Research Service. Carbon Tax and Greenhouse Gas Control: Options and Considerations for Congress. February 2009. http://assets.opencrs.com/rpts/R40242_20090223.pdf. Accessed November 2009. 71 Congressional Budget Office. The Costs of Reducing Greenhouse-Gas Emissions. November 2009. http://www.cbo.gov/ftpdocs/104xx/doc10458/11-23-GHG_Emissions_Brief.pdf. Accessed November 2009.

64
and sequestration. Currently, gasoline prices in the EU are 4-5 times what they are in the U.S. due to much higher taxation.
At present the market based mechanisms in existence worldwide, target stationary sources, which are the largest GHG emitters, such as power plants and factories. Mobile sources and much less freight transportation ones have yet to reach that level of attention. The largest and most established mechanism worldwide is the EU’s Emission Trading Scheme (EU ETS) and it is a multi-national, GHG emissions trading scheme created in 2005—before the Kyoto Protocol. Other countries such as Australia, New Zealand, and the U.S. have passed the legislation (for stationary sources again) but have yet to implement it. In the U.S., the American Clean Energy and Security Act, a cap-and-trade bill, was passed in June 2009. In September 2009, EPA issued the Mandatory Reporting of Greenhouse Gases Rule officially to come into effect in January 2010. Under the rule, suppliers of fossil fuels or industrial GHGs, manufacturers of vehicles and engines, and facilities that emit 25,000 metric tons or more per year of GHG emissions are required to submit annual reports to EPA.72 The Act progressively directs toward adding GHGs to the list of criteria pollutants. State/regional initiatives such as the Regional Greenhouse Gas Initiative (RGGI) had already established their own mandatory GHG emission reduction programs.73 In Canada, the Government announced the introduction of mandatory reporting of GHG emissions by the largest industrial GHG emitters in March 2004.74 The government is also working with its neighbors to develop and implement a North America-wide cap-and-trade system for GHGs. Mexico made a strong effort toward climate change in December 2008, when it announced it had set the goal of reducing GHG emissions to 50% below 2002 levels by 2050. Mexico’s GHG program “Programa GEI Mexico” was developed, which is a voluntary national program of accounting and reporting of GHGs by the industrial sector and also a program of generation of emission reduction projects.75
A major front related to the U.S. cap-and-trade legislation involves trucking industry fears that the Act will impose significant costs while doing little to curb carbon emissions. While truckers are nominally not covered by the legislation because trucking has been deemed to be a nondiscretionary user of fuel, truckers do fear that such a cap-and-trade arrangement will result in higher costs for diesel fuel. Several energy producing groups expressed opposition to EPA’s announcement. The America Petroleum Institute, which represents oil companies, said the EPA rules will be “inefficient and excessively costly.” The National Petrochemical and Refiners Association said the proposed new rules are based on “selective science.”76
Currently, external costs from transportation are imposed on others but not the shipper, carrier, or receiver. These are costs for emissions, noise, and infrastructure impacts and are not included in the true cost of transportation that would directly influence demand and GHG emissions. Including externalities in transportation cost would help reduce energy use and GHG 72 Environmental Protection Agency. Final Mandatory Reporting of Greenhouse Gases Rule. http://epa.gov/climatechange/emissions/ghgrulemaking.html. Accessed November 2009. 73 Pew Center on Global Climate Change. Regional Greenhouse Gas Initiative (RGGI). http://www.pewclimate.org/what_s_being_done/in_the_states/rggi/. Accessed November 2009. 74 Environment Canada. Facility GHG Reporting. http://www.ec.gc.ca/pdb/ghg/facility_e.cfm. Accessed November 2009. 75 Programa GEI Mexico. http://www.geimexico.org/english.html. Accessed November 2009. 76 Light & Medium Truck. EPA Moves to Curb Carbon Dioxide. December 2009. http://www.lmtruck.com/articles/lmtbase.aspx?storyid=635&utm_source=lmt&utm_medium=newsletter&utm_campaign=newsletter. Accessed December 2009.
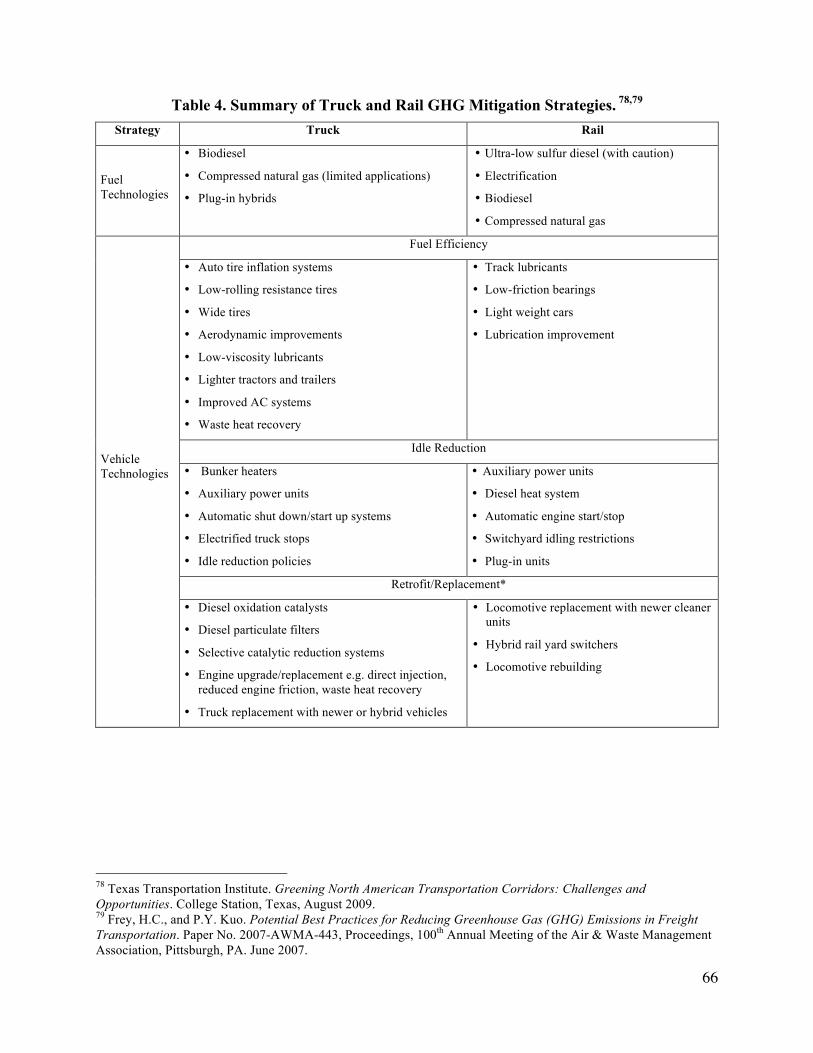
65
emissions. Currently only about half of just the infrastructure costs are paid for by the users through motor fuel taxes. The federal fuel tax in the U.S. has not increased since 1993, and increasing financial shortfalls are faced regarding infrastructure investment. Ironically enough, increasing fuel efficiencies are curbing fuel usage, hence fuel tax proceeds, adding to the problem. The short-term solution considered by the federal government is increase of federal fuel taxes. The long-term solution considered is shift towards a VMT-based tax. If the external costs of transportation were added up and incorporated into a per-mile traveled or a per-gallon of fuel price, it would be an improvement over the current system. Another long-term option would be fuel charging according to its carbon content. Pricing emissions will offset costs for emissions abatement. Associated issues include uncertainty of the monetary value to be placed, uncertainty of user response, and threat of continued dwindling of motor fuel tax proceeds.
In the absence of direct emissions pricing schemes that include costs of externalities, indirect mechanisms through which GHGs are indirectly priced and regulated, include congestion pricing as a travel demand management tool. Other indirect pricing systems, which have already been discussed include the cost of technologies and strategies to reduce fuel use and GHG emissions. The city of London’s pricing program reduced average delays by 30% and increased average speeds by 37%, while bus delays fell by 50%. Singapore’s pricing program reduced traffic by 13% during peak hours and resulted in a 20% increase in average road speed. A similar pricing program in Stockholm caused 25% reduction in traffic, an 8% increase in public transit ridership, and public identification of congestion as a “major problem” dropped from 50% to 25%.77
U.S. states are expressing frustration at the lack of a federal program and are viewing their own policies as a way to pressure the federal government to craft a unified policy response, as California’s tailpipe emission standards of the 1960s are widely held to have been instrumental in bringing about national automobile emissions standards. California has developed a renewable portfolio standard (RPS), which specifies a minimum level of power generation from low or zero-carbon sources to place mandatory obligations in the electricity sector. California’s plan is to produce 20% of its electricity from renewables by 2017. Other voluntary pledges and reduction efforts include those of New Jersey’s comprehensive plan to reduce GHGs by 3.5% over a 15-year period, a plan similar to New York’s, which involves voluntary reporting of emissions. Regional GHG initiatives were developed, which include U.S. states and Canadian provinces. Minnesota and Montana have mandatory percent ethanol content in the gasoline sold within the state, as has Ontario and other provinces in Canada. Minnesota provided financial support for 361 projects designed, at least in part, to increase carbon sequestration. Table 4 shows selected strategies for reduction of GHG emissions from truck and rail freight transportation modes.
77 Federal Highway Administration, Tolling and Pricing Program. Lessons Learned From International Experience in Congestion Pricing. August 2008. http://www.ops.fhwa.dot.gov/publications/fhwahop08047/listcont.htm. Accessed November 2009.

66
Table 4. Summary of Truck and Rail GHG Mitigation Strategies. 78,79
Strategy Truck Rail
Fuel Technologies
• Biodiesel
• Compressed natural gas (limited applications)
• Plug-in hybrids
• Ultra-low sulfur diesel (with caution)
• Electrification
• Biodiesel
• Compressed natural gas
Fuel Efficiency
• Auto tire inflation systems
• Low-rolling resistance tires
• Wide tires
• Aerodynamic improvements
• Low-viscosity lubricants
• Lighter tractors and trailers
• Improved AC systems
• Waste heat recovery
• Track lubricants
• Low-friction bearings
• Light weight cars
• Lubrication improvement
Idle Reduction
• Bunker heaters
• Auxiliary power units
• Automatic shut down/start up systems
• Electrified truck stops
• Idle reduction policies
• Auxiliary power units
• Diesel heat system
• Automatic engine start/stop
• Switchyard idling restrictions
• Plug-in units
Retrofit/Replacement*
Vehicle Technologies
• Diesel oxidation catalysts
• Diesel particulate filters
• Selective catalytic reduction systems
• Engine upgrade/replacement e.g. direct injection, reduced engine friction, waste heat recovery
• Truck replacement with newer or hybrid vehicles
• Locomotive replacement with newer cleaner units
• Hybrid rail yard switchers
• Locomotive rebuilding
78 Texas Transportation Institute. Greening North American Transportation Corridors: Challenges and Opportunities. College Station, Texas, August 2009. 79 Frey, H.C., and P.Y. Kuo. Potential Best Practices for Reducing Greenhouse Gas (GHG) Emissions in Freight Transportation. Paper No. 2007-AWMA-443, Proceedings, 100th Annual Meeting of the Air & Waste Management Association, Pittsburgh, PA. June 2007.

67
Table 4. Summary of Truck and Rail GHG Mitigation Strategies. 80,81, Cont. Strategy Truck Rail
System Optimization / Operational Efficiency
• Pick-up & delivery idling reduction measures
• Congestion mitigation measures
• Speed restrictions
• Arterial signal synchronization
• Grade crossing separation
• Driver ecodriving education
• Reduced empty mileage & circuitous routes
• Reduced excess packaging
• Reduced shipment frequency
• Longer/Heavier Combination Trucks
• Advance clearance
• Advanced technology and logistics
• Movement optimization
• Decentralization of supply chains
• Improved local distribution
• Intermodalism
• Mode shift to water or rail
• Port access improvements
• Switchyard idling reduction measures
• Rail congestion mitigation measures
• Line-haul speed restrictions
• Reduced empty mileage
• Longer & double stacked trains
• Train clearance improvement
• Elimination of circuitous routes
• Advanced technology and logistics
• Movement optimization
• Intermodalism
• Mode shift to water (with caution)
• Port access improvements
Smart/ Sustainable Growth
• Smart/sustainable growth through improved and integrated transportation planning that accounts better for freight movements
Market-Based Mechanisms (Future)
• Emissions controls, e.g., cap-and-trade
• Emissions pricing, e.g., carbon tax
Pricing emissions will offset cost of abatement and achieve emissions reductions
*Emission control retrofit devices can only reduce non-CO2 GHG emissions
80 Texas Transportation Institute. Greening North American Transportation Corridors: Challenges and Opportunities. College Station, Texas, August 2009. 81 Frey, H.C., and P.Y. Kuo. Potential Best Practices for Reducing Greenhouse Gas (GHG) Emissions in Freight Transportation. Paper No. 2007-AWMA-443, Proceedings, 100th Annual Meeting of the Air & Waste Management Association, Pittsburgh, PA. June 2007.


69
CHAPTER 4. PROGRAMS AND POLICIES TO MITIGATE GHG EMISSIONS FROM FREIGHT TRANSPORTATION
Experts generally expect that, in the absence of policy changes to reduce domestic GHG
emissions, they will grow substantially in the next few decades, totaling roughly 330 billion Metric Tons (MT) CO2e between now and 2050.82 There are three approaches to an emissions reduction mission: regulation, enticement, and market-based. Economists generally agree that traditional command-and-control approaches (regulation) alone are unlikely to mandate the least expensive ways of restricting emissions and therefore are likely to achieve any given reduction in emissions at greater cost than in combination with market-based approaches such as taxes or cap-and-trade systems. Imposing a price or limit on emissions will offset the costs of emissions abatement, such as costly technologies. Emission reduction approaches are promulgated by national or multinational policies, usually commencing at the enticement stage and gradually progressing to the regulatory stage. All three approaches are often drivers for technology development, and technology development, in turn, can expand possibilities for further emissions reductions, a relationship that can be described as ‘part-and-parcel.’ Regulation could serve as complementary to a pricing mechanism (e.g., cap-and-trade or tax) and programs could support the implementation of regulations to ease implementation, reduce costs to the regulated industry (and to consumers ultimately), and address emissions beyond the reach of the regulations themselves.
The concept of “sustainable transportation” or “smart growth” is gaining importance as more countries around the world acknowledge its importance and introduce environmental perspectives into their national transportation plans or agendas. The comprehensive study of existing GHG mitigation strategies for transportation, which preceded this discussion, revealed that while leaps and bounds have been made in the technological front, primarily spearheaded by the private sector, there seems to a be a lack of adequate infrastructure and strong governmental push to put these technologies into commercial use. These are symptoms of the principal issue that there is a lack of central price and policy signals that can drive innovation, development, and deployment of technology and facilitate behavioral change, particularly by consumers. The discussion to follow found that while there are several initiatives that address GHGs from stationary sources and transportation in broad contexts, only a handful of those initiatives cater to the specific needs of the freight sector. Furthermore, programs targeting freight truck and rail GHG emissions tend to originate at the national level and be disseminated to lower government levels on project bases, most likely due to the heavy public investment requirements. Thus the national initiatives in North America presented here physically exist at lower jurisdictional and geographic levels. Nevertheless selected sub-national programs with general GHG emissions reduction efforts are discussed in order to paint as thorough a picture as possible, and help identify possible avenues for the future.
It is becoming increasingly clearer that what North America needs is an integrated, concerted policy system to decrease GHG emissions from a variety of sources and jurisdictional or geographic levels, accompanied by related implementation plans to make the necessary technologies available to all three countries through a mutual and rigorous transfer program.
82 Congressional Budget Office. The Costs of Reducing Greenhouse-Gas Emissions. November 2009. http://www.cbo.gov/ftpdocs/104xx/doc10458/11-23-GHG_Emissions_Brief.pdf. Accessed November 2009.

70
4.1 NORTH AMERICA
The U.S. and Canada83 signed an Air Quality Agreement in 1991, which facilitated several joint border air quality projects and studies as well as technology transfer and exchange. The U.S. and Mexico84 cooperated in Mexico’s 1999 National Emissions Inventory and its 2005 update (currently underway), as well as its National GHG Inventory 1990-2002.85 Technology transfer and exchange were greatly facilitated through and on account of these works. In both the U.S. and Canada mandatory reporting of GHGs at a national level has recently been promulgated but only applies to large stationary emitters such as power plants and factories.
In the U.S., the EPA is responsible for preparing the U.S. Inventory of Greenhouse Gases where national fuel consumption is allocated to individual sectors of the economy, one of which is transportation. These are then further allocated to individual modes, including freight truck and rail.25 The American Clean Energy and Security Act, a cap-and-trade bill, was passed in June 2009. In September 2009, EPA issued the Mandatory Reporting of Greenhouse Gases Rule officially to come into effect in January 2010.86 Under the rule, suppliers of fossil fuels or industrial GHGs, manufacturers of vehicles and engines, and facilities that emit 25,000 MtCO2e or more per year of GHG emissions are required to submit annual reports to EPA. The Act progressively directs towards adding GHGs to the list of criteria pollutants.
As a signatory to the United Nations Framework Convention on Climate Change (UNFCCC), Canada is obliged to submit an inventory of its GHG emissions on an annual basis.87 Environment Canada through its Greenhouse Gas Division was designated by the Canadian Environmental Protection Act of 1999 as responsible for preparing Canada's official national inventory, in consultation with a range of stakeholders. Emissions and removals are grouped into six sectors: energy; industrial processes; solvent and other product use; agriculture; land use, land-use change and forestry; and waste. In March, 2004, the Government of Canada announced the introduction of mandatory reporting of GHG emissions by the largest industrial GHG emitters. All facilities that emit the equivalent of 100,000 tonnes (100kt) or more of GHGs (in MtCO2e) per year are required to submit a report.88 Canada is working with its neighbors to develop and implement a North America-wide cap-and-trade system for GHGs.
Mexico made a strong effort toward climate change in December 2008, when it announced it had set the goal of reducing GHG emissions to 50% below 2002 levels by 2050. Transport is thought to be responsible for 18% of Mexico’s GHG emissions and is second only to energy generation as an emissions source. Mexico’s GHG program, “Programa GEI Mexico”
83 U.S. Environmental Protection Agency. U.S.-Canada Air Quality Agreement. http://www.epa.gov/airmarkets/progsregs/usca/index.htm. Accessed November 2009. 84 U.S. Environmental Protection Agency, Technology Transfer Network. North American Emissions Inventories – Mexico. http://www.epa.gov/ttn/chief/net/mexico.html. Accessed November 2009. 85 National Greenhouse Gas Inventory 1990-2002 Report of Mexico Executive Summary. http://www.ine.gob.mx/descargas/cclimatico/mexico_nghgi_ex.pdf. Accessed November 2009. 86 Environmental Protection Agency. Final Mandatory Reporting of Greenhouse Gases Rule. http://epa.gov/climatechange/emissions/ghgrulemaking.html. Accessed November 2009. 87 Environment Canada. Canada’s GHG Inventory. http://www.ec.gc.ca/pdb/ghg/inventory_e.cfm. Accessed November 2009. 88 Environment Canada. Facility GHG Reporting. http://www.ec.gc.ca/pdb/ghg/facility_e.cfm. Accessed November 2009.
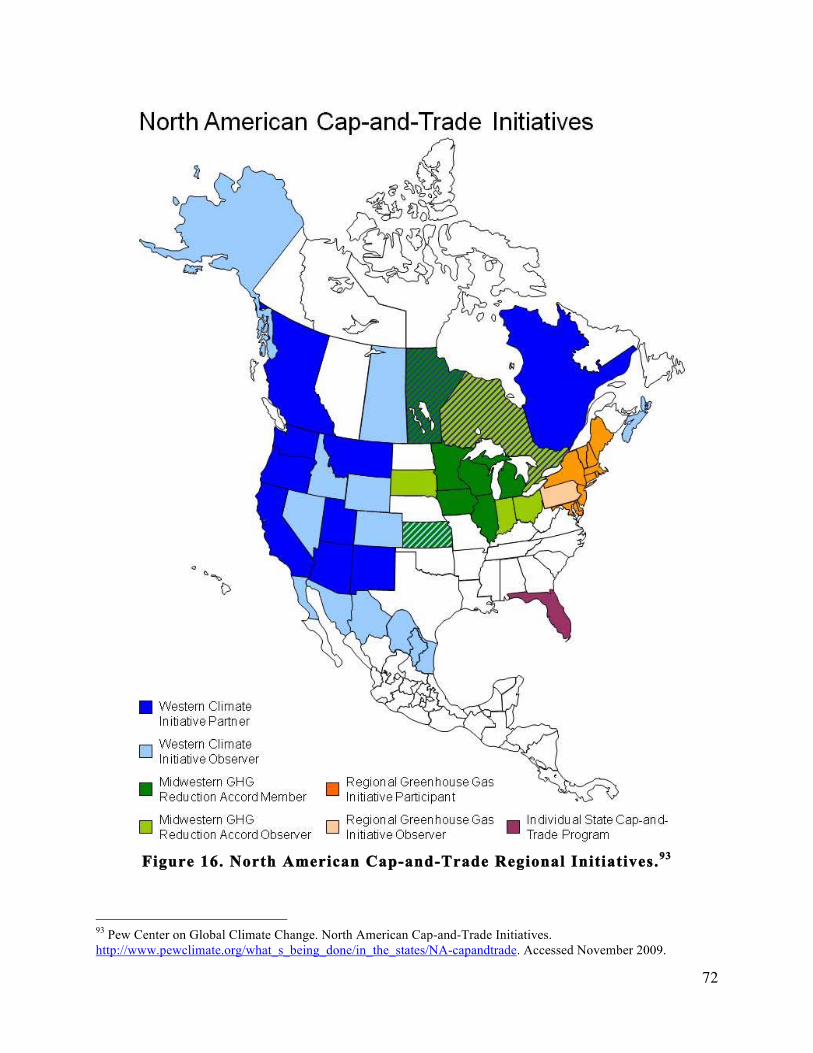
71
is a voluntary GHG accounting and reporting program and was made permanent in 2006 after a 2-year pilot test.122 Several occasions of technical collaboration with the EPA have taken place. Mexico developed its National Emissions Inventory89 in 1999 for criteria pollutants and is in the process of updating it using 2005 data, as well as the 1990-2002 National GHG Inventory,85 both with EPA assistance. The MOBILE6-Mexico emission factor model was developed for use in estimating emissions from on-road mobile sources adapted from EPA’s MOBILE6.2 model using Mexican vehicle emissions test data collected in Mexico, as well as other Mexico specific information.90
Two regional initiatives cross U.S.-Canada boundaries. The Western Climate Initiative (WCI) was established in February 2007 by five western U.S. states in a joint effort to reduce GHG emissions and address climate change. The WCI has since grown to include seven U.S. states and four Canadian provinces that have jointly set a regional GHG emissions target of 15% below 2005 levels by 2020. The WCI is planning to implement a regional cap-and-trade program that will begin in 2012 and initially cover emissions of six GHGs produced by electricity generators and large industrial sources. In 2015, the program will expand to include emissions of these gases from the combustion of transportation fuels as well as residential, commercial, and small industrial fuels not previously covered. When fully implemented, the WCI cap-and-trade program will have the broadest coverage of any GHG cap-and-trade program proposed to date.91
The Midwestern Greenhouse Gas Reduction Accord (MGGRA) was established in November 2007 by Illinois, Iowa, Kansas, Michigan, Minnesota, and Wisconsin, as well as the premier of Manitoba. Under the Accord, members agree to establish regional GHG reduction targets, including a long-term target of 60 to 80% below current emissions levels, and develop a multi-sector cap-and-trade system to help meet the targets. Participants will also establish a GHG emissions reductions tracking system and implement other policies, such as low carbon fuel standards, to aid in reducing emissions. Member jurisdictions are expected to finalize a cap-and-trade program design in 2009 and begin program implementation in 2010.92 Figure 16 shows the cap-and-trade initiatives in North America by region.
89 U.S. Environmental Protection Agency. North American Emissions Inventories – Mexico. http://www.epa.gov/ttn/chief/net/mexico.html. Accessed November 2009. 90 Eastern Research Group, Inc. (ERG). MOBILE6-Mexico. Prepared for the Western Governors’ Association. Austin, Texas, June 2003. 91 Pew Center on Global Climate Change. Western Climate Initiative. http://www.pewclimate.org/WesternClimateInitiative. Accessed November 2009. 92 Pew Center on Global Climate Change. Regional Initiatives. http://www.pewclimate.org/what_s_being_done/in_the_states/regional_initiatives.cfm#midwest. Accessed November 2009.

72
Figure 16. North American Cap-and-Trade Regional Initiatives.93
93 Pew Center on Global Climate Change. North American Cap-and-Trade Initiatives. http://www.pewclimate.org/what_s_being_done/in_the_states/NA-capandtrade. Accessed November 2009.

73
Regional initiatives have been created in the absence of national and bi-national policy. They have significantly inherent weaknesses in driving the needed technological and cultural changes; industries will not be willing to put themselves at competitive disadvantage if their neighbors are not subject to as stringent emission controls. Thus ultimately regional initiatives are limited in the absence of a national and bi-national approach.
Empty Miles94 In early December 2009, The Voluntary Interindustry Commerce Solutions (VICS)
Association, and the nonprofit supply chain organizations GS1 Canada, and GS1 US, launched a North American solution to optimize truck transportation by reducing the number of trailers traveling without loads throughout the continent. The Empty Miles Service matches a company’s trailers that are returning empty with potential loads that can be collected and delivered along the return route. A pilot program using real world data was successfully conducted. Program participants, include several of North America’s largest retailers, consumer goods suppliers, and transportation carriers, e.g., Macy’s has found the Empty Miles Service easy to use, simple to operate, and powerful in terms of results. A calculator to measure direct financial benefits, including benefits of reduced CO2 emissions was developed. Other features include easy to use and convenient web access, a secure collaborative environment between shippers and carriers, user authentication, and real-time searching for available lanes. Participation costs $1,600 per year for VICS members and $1,850 per year for non-members.
4.2 UNITED STATES
4.2.1 National
SmartWay Transport Partnership95
In 2004, the EPA launched SmartWay programs to foster partnership among government, business, and consumers to protect the environment, reduce fuel consumption, and improve air quality. Business partners include shippers, truck and rail carriers, logistics companies, and truck stops. In a nutshell, program benefits to the private sector include cost savings, business-to-business advantage, environment achievement, and public and peer recognition.
SmartWay Shippers commit to improving their environmental scores over three years, first by using the Freight Logistics Environmental and Energy Tracking (FLEET) Performance Model for Shippers to quantify their current environmental performance level. Secondly, they commit to ship at least 50% of their goods using SmartWay Transport Carriers. Thirdly, they can further improve their environmental performance by adopting EPA’s recommended shipper strategies, which include no-idling policies at docks; evaluating and modifying business practices
94 Voluntary Interdisciplinary Commerce Solutions. VICS Empty Miles. https://www.emptymiles.org/. Accessed November 2009. 95 U.S. Environmental Protection Agency. SmartWay. http://www.epa.gov/smartway/. Accessed November 2009.

74
at distribution centers and warehouses; and using a combination of truck and locomotive transport to ship goods.
SmartWay Truck or Rail Carriers include for-hire truck fleets, truck owner-operators, private truck fleets, and rail companies. They commit by first filling out the Freight Logistics Environmental and Energy Tracking (FLEET) Performance Model to quantify the environmental performance of their operations. They agree to set and strive for attainment of environmental and fuel efficiency goals within three years by improving their freight carrying operations, i.e., reducing fuel and maintenance costs. EPA provides technical assistance to help carriers quantify emissions, and recommended carrier strategies to help them reduce fuel consumption. The company can finally be promoted by the EPA through national and regional events, articles, and awards; as well as be allowed to use the SmartWay logo to further their position as a leader in environmental achievement.
SmartWay Logistics Companies include Third Party Logistics Providers (3PLs), Fourth Party Logistics Providers (4PLs), Logistics Companies, Transportation Intermediaries (asset or non-asset based), and Freight Brokers. The Logistics Companies join the SmartWay Transport Partnership for three years to show that they are committed to promoting greater energy efficiency and air quality within the freight transport sector, by assisting their carriers in making better choices for their businesses and the environment, e.g., participating in the SmartWay Transport Partnership, enabling their shipper clients to move more of their freight with SmartWay Transport Carrier Partners, where feasible, and improve their transportation footprint. EPA supports their efforts by providing outreach materials, program and technical training, and networking opportunities.
SmartWay Truck Stop/Plaza Partners include private truck stops/plazas, private truck company terminals, port authorities with parking spaces, public rest areas, and distribution centers with parking spaces. They commit to providing electrified parking places for truck drivers to rest comfortably without idling, thereby saving fuel and money, protecting their health, and supporting the environment and the energy security goals of our country. They also commit to promoting the SmartWay Partnership to their customers and the public. EPA supports their efforts through recognition, outreach, and training materials; improvement of public image; and permitted use of the SmartWay Transport Partner brand.
National Clean Diesel Campaign (NCDC)96
The NCDC was created by the Diesel Emissions Reduction Act (DERA) and funded $300 million in 2009 through the American Recovery and Reinvestment Act (ARRA) on top of its already existing annual appropriations. NCDC consists of four components under which funding is provided to reduce emissions from existing diesel engines through various strategies, including encouraging existing fleets to adopt cleaner technologies.
The first of the four program components, the National Clean Diesel Funding Assistance Program, provides funding to reduce emissions from existing diesel engines through a variety of strategies, including add-on emission control retrofit technologies; idle reduction technologies; cleaner fuel use; engine repowers; engine upgrades; and/or vehicle or equipment replacement; 96 U.S. Environmental Protection Agency. National Clean Diesel Campaign. http://www.epa.gov/otaq/diesel/index.htm. Accessed November 2009.

75
and the creation of innovative finance programs to fund diesel emissions reduction projects. Under this grant program, funding is restricted to the use of EPA and California Air Resources Board (CARB) verified and certified diesel emission reduction technologies. Eligible entities are U.S. regional, state, local, tribal or port agencies (including municipalities, MPOs, cities, counties, and school districts) with jurisdiction over transportation or air quality. Eligible fleets include buses, medium or heavy duty trucks, marine engines, locomotives, and non-road engines or vehicles used in construction, handling of cargo (e.g., port or airport), agriculture, mining, or energy production.
The State Clean Diesel Grant Program allocates funds to states to use toward grant and loan programs for clean diesel projects that use retrofit technologies that are EPA or CARB-certified/verified, idle reduction technologies that are EPA-verified, EPA approved emerging technologies, and programs for early replacement and repowering of engines with certified ones. The National Clean Diesel Emerging Technologies Program aims to advance new cutting edge technologies to reduce diesel emissions from the existing fleet. EPA is providing funding assistance to the above eligible entities to deploy diesel emission reduction technologies which are approved but not yet verified or certified by EPA or CARB.
The SmartWay Clean Diesel Finance Program joins the forces of both EPA programs and uses cooperative agreements to establish innovative finance programs for buyers of eligible diesel vehicles and equipment. Innovative finance projects include those where the loan recipient receives a unique financial incentive (i.e., higher than regular market rates) for the purchase of eligible vehicles or equipment. Particular emphasis is on establishing low cost loan programs for the retrofit of used pre-2007 highway vehicles and new or used pieces of nonroad equipment with EPA or CARB verified emission control technologies.
Congestion Mitigation and Air Quality (CMAQ) Improvement Program97 CMAQ is jointly administered by the Federal Highway Administration (FHWA) and
Federal Transit Administration (FTA). Currently funded by SAFETEA-LU, states, MPOs and transport agencies can invest in surface transportation projects that result in better air quality and reduced congestion. Freight GHG emissions reductions related eligible projects include alternative fuels, diesel retrofits, anti-idling facilities and truck stop electrification, and general freight projects. Several intermodal projects have been successfully completed under this program. In one such project, the Columbia Slough Intermodal Expansion Bridge in Portland, Oregon, was constructed for railroads to directly access a deep-water port facility, eliminating truck trips. The estimated truck emissions reductions were 52 kg/day VOC, 241 kg/day CO, and 364 kg/day NOx. In New York, the Red Hook Container barge was purchased to ship freight containers via the Hudson River rather than on highways, removing 54,000 trucks trips from New York and New Jersey streets annually. The estimated emissions reductions were 12 kg/day VOC, 48 kg/day CO, and 53 kg/day NOx.
97 Federal Highway Administration. Congestion Mitigation and Air Quality (CMAQ) Improvement Program. http://www.fhwa.dot.gov/environment/cmaqpgs/. Accessed November 2009.

76
21st Century Truck Partnership98 This program of the U.S. Department of Energy’s (DOE) has a vision of developing a
freight and passenger transport system that is least polluting and that reduces dependence on foreign oil. It aims to do so by investing and focusing on higher-risk research and development of energy-saving fuel and vehicle technologies for heavy duty trucks. Several high profile companies engaged in truck engine, chassis, and emissions control technologies are on the list of partners, e.g., Cummins, Caterpillar, Eaton, Freightliner, Daimler Chrysler, and Volvo; as well as several related government agencies and national research laboratories, e.g., Argonne, Los Alamos, NASA, and Oak Ridge.
America’s Marine Highway Program99 The program aims to expand the use of America’s Marine Highways. The four primary
components of its framework are: • Marine Highway Corridors: Designating corridors will integrate the Marine Highway into the
surface transportation system and encourage the development of multi-jurisdictional coalitions to focus public and private efforts and investment.
• Marine Highway Project Designation: Designating Marine Highway projects is aimed at mitigating landside congestion by starting new or expanding existing services to provide the greatest benefit to the public in terms of congestion relief, improved air quality, reduced energy consumption, and other factors. Designated projects will receive direct support from the Department of Transportation.
• Incentives, Impediments, and Solutions: The Maritime Administration, in partnership with public and private entities, will identify potential incentives and seek solutions to impediments to encourage utilization of the Marine Highway and incorporate it, including ferries, in multi-state, state, and regional transportation planning.
• Research: The Department of Transportation, working with the EPA, will conduct research to support America’s Marine Highway, within the limitations of available resources. Research would include environmental and transportation benefits, technology, vessel design, and solutions to impediments.
Unfortunately the program has not progressed as originally hoped. The main obstacle is economic competitiveness concerns related to waterways and subsequent unwillingness of shippers to divert. Other obstacles include service and marketing issues, operating cost, infrastructure and equipment issues, government and regulatory issues, operational constraints, and vessel-related issues.100
98 U.S. Department of Energy, Vehicle Technologies Program. 21st Century Truck. http://www1.eere.energy.gov/vehiclesandfuels/about/partnerships/21centurytruck/index.html. Accessed November 2009. 99 U.S. Department of Transportation, Maritime Administration. America’s Marine Highway Program. http://www.marad.dot.gov/ships_shipping_landing_page/mhi_home/mhi_home.htm. Accessed November 2009. 100 Kruse, C. J. and N. Hutson. NCFRP 17: North American Marine Highways. TRB, National Research Council, Washington, D.C., September 2009.

77
4.2.2 State/Regional and Local Government
State/Regional GHG Mitigation Actions101 States are developing a variety of initiatives to reduce GHG emissions. EPA provides
maps summarizing individual states’ activities across a range of climate change policy areas and identifies best practices among those. State policies include:
• Planning and Measurement (advisory boards, GHG inventories to lead to development of action plans),
• Targets and Caps (statewide), • GHG Reporting (electricity related, mandatory),
• Power Sector specific (CO2 offsets, GHG performance standards, advanced coal technologies, cap-and-trade), and
• Transportation Sector specific (GHG auto standards and low carbon fuel standards).
EPA supports state efforts to develop GHG inventories by providing inventory guidance, tools and technical assistance. As of March 2008, 44 states and Puerto Rico have completed inventories. States use their inventories to understand their emissions sources, develop State Climate Change Action Plans, and implement policies and programs to reduce GHG emissions. The inventories present annual emissions of GHGs by sector (e.g., energy, agriculture, waste), by source (e.g., transportation emissions, manure management) and by gas (e.g., carbon dioxide, methane). The methods on which the inventories are based generally estimate GHG emissions as a function of (a) activity data (e.g., coal consumption, cement production, fertilizer consumption, etc.) and (b) activity- and gas-specific emission factors. EPA has been instrumental in developing methods for state GHG inventories that are consistent with those used for the U.S. national inventory, and with the Intergovernmental Panel on Climate Change (IPCC) Guidelines. EPA’s online state inventory summaries reflect inventory estimates supplied by the states, which may be significantly different from what would be calculated using EPA tools and guidance and noted as such.
The Regional Greenhouse Gas Initiative (RGGI) does not cross national boundaries and is the first mandatory U.S. cap-and-trade program for carbon dioxide. It was established in December 2005 by the governors of seven Northeastern and Mid-Atlantic states: Connecticut, Delaware, Maine, New Hampshire, New Jersey, New York, and Vermont. RGGI sets a cap on emissions of carbon dioxide from power plants, and allows sources to trade emissions allowances. The program will begin by capping emissions at current levels in 2009, and then reducing emissions 10% by 2018. Massachusetts and Rhode Island both joined RGGI in early 2007, and Maryland joined in April 2007.102
101 U.S. Environmental Protection Agency. Climate Change – State and Local Governments. http://epa.gov/climatechange/wycd/stateandlocalgov/index.html. Accessed November 2009. 102 Pew Center on Global Climate Change. Regional Greenhouse Gas Initiative (RGGI). http://www.pewclimate.org/what_s_being_done/in_the_states/rggi/. Accessed November 2009.

78
Two regional initiatives cross U.S.-Canada boundaries. The Western Climate Initiative (WCI) was established in February 2007 by five western states in a joint effort to reduce GHG emissions and address climate change. The WCI has since grown to include seven U.S. states and four Canadian provinces that have jointly set a regional GHG emissions target of 15% below 2005 levels by 2020. The WCI is planning to implement a regional cap-and-trade program that will begin in 2012 and initially cover emissions of six GHGs produced by electricity generators and large industrial sources. In 2015 the program will expand to include emissions of these gases from the combustion of transportation fuels as well as residential, commercial, and small industrial fuels not previously covered. When fully implemented, the WCI cap-and-trade program will have the broadest coverage of any GHG cap-and- trade program proposed to date.91
The Midwestern Greenhouse Gas Reduction Accord (MGGRA) was established in November 2007 by Illinois, Iowa, Kansas, Michigan, Minnesota, and Wisconsin, as well as the premier of Manitoba. Under the Accord, members agree to establish regional GHG reduction targets, including a long-term target of 60 to 80% below current emissions levels, and develop a multi-sector cap-and-trade system to help meet the targets. Participants will also establish a GHG emissions reductions tracking system and implement other policies, such as low carbon fuel standards, to aid in reducing emissions. Member jurisdictions are expected to finalize a cap-and-trade program design in 2009 and begin program implementation in 2010.92 Figures 17 and 18, respectively, show U.S. states with GHG Inventories and Climate Action Plans in place. Figure 19 shows regional GHG initiatives among U.S. states.
Figure 17. U.S. State GHG Inventories.103
103 U.S. Environmental Protection Agency. State and Local Climate and Energy Program. http://www.epa.gov/statelocalclimate/state/tracking/state-planning-and-incentive-structures.html#a02.Accessed March 2010.

79
Figure 18. U.S. State Climate Action Plans. 103

80
Figure 19. U.S. Regional GHG Initiatives.104
Local GHG Mitigation Actions
EPA provides technical assistance, tools, and resources and guidance to help local governments reduce GHG emissions while saving money, creating jobs, promoting sustainable growth, and reducing air pollution. The EPA website presents best practice examples and provides training and other resources to local governments in the following areas:
• Energy Efficiency (municipal operations, affordable housing, schools, energy efficient purchasing, water and wastewater utilities, residential, commercial and industrial buildings);
• Energy Supply (green power procurement, on-site renewable energy, combined heat and power, landfill gas to energy);
104 Pew Center on Global Climate Change. Regional Initiatives. http://www.pewclimate.org/what_s_being_done/in_the_states/regional_initiatives.cfm. Accessed November 2009.

81
• Transportation and Air Quality (SmartWay, NCDC, Green Vehicle Guide, EPA’s Office of Transportation and Air Quality links);
• Urban Planning and Design (smart growth, urban heat island reduction); • Waste Management Strategies to Reduce Energy Use (waste prevention, recycling, and
buying recycled materials, appliance disposal program); and • Cross-Cutting Programs and Resources (lead by example guide or best practices).
PierPASS105
The Ports of Southern California (San Pedro Bay Ports, i.e., Los Angeles and Long Beach) launched an off-peak cargo program in 2005 that provides an incentive for cargo owners to move cargo at night and on weekends, in order to reduce truck traffic and pollution during peak daytime traffic hours and to alleviate port congestion. Since July 2005, all marine terminals in the Ports have offered offpeak shifts on nights (after 6 pm) and weekends. As part of the program, a Traffic Mitigation Fee (currently set at $50 per container) is required for cargo movement through the ports during peak daytime hours, with certain exceptions. PierPass shifted almost a third of the peak period container pickups to off-peak time, reducing truck idling, congestion, and emissions inside the ports and in the vicinity. Congestion has been observed at the gates just prior to the offpeak period opening time at 6 p.m., but there are plans to mitigate it through advance appointment systems. A serious obstacle to extending offpeak and weekend hours is labor union issues. Several other ports nationally are considering similar container/truck pricing programs, e.g., the Port of Oakland, several of which have been put on hold until after economic recovery.
Clean Truck Programs at Ports106,107
The Ports of Southern California (San Pedro Bay Ports, i.e., Los Angeles and Long Beach) also launched clean truck programs that aim to reduce truck-related emissions by 80% by 2012. According to port authorities, the programs have currently cut around 70% of emissions since their introduction in 2008, and removed more than 2,000 polluting trucks, with more than 5,500 clean trucks in operation today. Under this program, all trucks not meeting 2007 Federal Clean Truck Emission Standards will be gradually phased out and eventually banned from the ports. On January 1, 2010, all pre-1994 trucks will be banned from the ports as well as 1994-2003 trucks that have not been retrofitted with (costly) diesel particulate filters (DPFs). By 2012, all trucks not meeting the 2007 emissions standards will be banned from the ports. Typically, a new truck costs more than $100,000, while a DPF costs around $20,000. This program is part of the Clean Air Action plan that targets major air polluting sources in the two ports: trucks, trains, ships, cargo handling units, and harbor craft. The Ports do subsidize new heavy duty drayage trucks (“Clean Trucks”) and DPFs, but funding has been found to be limited.
105 PierPASS. http://www.pierpass.org/Default.htm. Accessed November 2009. 106 Port of Los Angeles, Clean Truck Program. http://www.portoflosangeles.org/CTP/idx_ctp.asp. Accessed November 2009. 107 Port of Long Beach, Clean Trucks. http://www.polb.com/environment/cleantrucks/default.asp. Accessed November 2009.

82
4.3 CANADA 4.3.1 National
ecoTRANSPORT and Fleetsmart108 FleetSmart is the Canadian sibling of EPA’s SmartWay program. It is a component of the
ecoTRANSPORT umbrella program (launched by the Government of Canada in 2007) and run by Natural Resources Canada (NRCAN) under the name ecoENERGY for Fleets. Its purpose is to introduce heavy-duty truck fleets to energy-efficient practices that can reduce fuel consumption and emissions. A memorandum of understanding was signed in 2005 to foster cooperation between EPA and NRCAN in the efforts to offer tools, resources, and guidance to fleet owners on how energy-efficient vehicles and business practices can reduce fleet operating costs, improve productivity, and increase competitiveness. FleetSmart aims to keep fleet vehicle owners and managers abreast with the latest developments in fleet and fuel management and keep them fully aware of the fuel efficiency benefits of new and developing technologies. Its SmartDriver component offers training in energy efficient vehicle operating techniques drivers of heavy trucks and buses. Other heavy-duty truck and bus related initiatives include fuel management workshops that teach companies how to improve their fuel efficiency and reduce GHG emissions that contribute to climate change; and funding to heavy-duty truck owners for retrofitting their rigs with EPA-certified emissions control devices—a program similar to the U.S.’s NCDC.109
ecoFREIGHT110 Another branch of the ecoTRANSPORT umbrella program, ecoFREIGHT is run by
Transport Canada. This program aims to reduce the effects of freight transportation on human health and the environment by promoting environmentally sound technologies and best practices in industry and consists of six initiatives: • The Freight Technology Demonstration Fund program provides contribution funding on a
competitive basis for cost-shared technology demonstration projects with the Canadian freight industry. The program consists of testing underutilized freight transportation technologies in real world conditions. This program reduces some significant barriers to the widespread adoption of emissions-reducing technologies, including the cost to industry of technology trials, the risk to their financial bottom line in a highly competitive industry, concern about the impacts of new technologies on costly equipment and capital, the lack of an established track record for new technologies, and the lack of independent and ‘real world’ information on technology options.
108 Natural Resources Canada. Welcome to FleetSmart. http://fleetsmart.nrcan.gc.ca/index.cfm?. Accessed November 2009. 109 Natural Resources Canada, Office of Energy Efficiency. Grants and Incentives. http://oee.nrcan.gc.ca/corporate/incentives.cfm?attr=16. Accessed November 2009. 110 Transport Canada, Environmental Programs. ecoFREIGHT. http://www.tc.gc.ca/programs/environment/ecofreight/about/menu.htm. Accessed November 2009.
83
• The Freight Technology Incentives program also provides funding on a competitive basis for the purchase and installation of cost-effective emission-reducing technologies and equipment, to deliver strategic support for uptake of proven technologies throughout the freight system. The main activity of the Freight Technology Incentives program is to fund and monitor technology purchased and installed by the industry. Incentives are required to significantly move new and underutilized technologies toward wide-spread adoption, even where other barriers are addressed, as the initial cost premiums of such technologies are prohibitive to many companies throughout the freight system and in all modes.
• The Marine Shore Power Program funds pilot projects implemented by the marine industry to demonstrate the use of shore-based power for marine vessels in Canadian ports. The aim is to reduce air pollution from idling ship engines in some of Canada’s largest urban centers.
• The National Harmonization Initiative for the Trucking Industry identifies regulatory barriers and solutions in collaboration with provinces and territories, so that the Canadian trucking industry can embrace emissions-reducing technologies.
• The ecoFREIGHT Partnerships program builds and maintains partnerships within the transportation sector (carriers and/or shippers and freight forwarders) to reduce emissions from freight transportation through fast and flexible voluntary actions that can support the regulatory framework.
• The ecoENERGY for fleets program (as described in the previous section) reduces fuel use and emissions in commercial and institutional fleets via training, sharing of best practices, anti-idling campaigns, technical analysis to look for potential improvements and other technology opportunities.
The collaboration between the federal government and freight industry has led to the establishment of voluntary agreements with some of the freight industry associations, including the aviation and rail sectors. These agreements include emission reduction targets, action plans to achieve those targets, and reporting on progress. Actions taken under this agreement between the Railway Association of Canada, Transport Canada, and Environment Canada are expected to reduce air pollutants from the railway industry and improve railway fuel efficiency, which reduces GHG emissions.
In 2007, the Government of Canada and the Railway Association of Canada signed a Memorandum of Understanding (MOU) identifying commitments of the Canadian railway companies to voluntarily reduce GHG and criteria air contaminant emissions. The agreement includes 2010 efficiency-based GHG emission targets, fleet renewal strategies for 2006 to 2015, and other measures and actions to further reduce emissions. The industry has made demonstrated progress toward its emissions targets, with initiatives including locomotive fleet changes, anti-idling devices, acquisition of higher capacity freight cars, and improvements to operational practices. The industry reports on its progress in its Annual Reports on Locomotive Emissions Monitoring Program. The Government of Canada is currently developing new regulations to limit railway emissions, under the Railway Safety Act, to take effect in 2011. These regulations will create a national framework that works in tandem with rail emissions regulations currently enforced by the USEPA.
84
Sustainable Development Technology Canada (SDTC)111 SDTC is a nonprofit foundation that funds a number of transportation-related projects,
including those related to freight movement, through collaborations with the public and private sector, i.e., industry, academia, non-governmental organizations (NGOs), the financial community and all levels of government. They support clean technology solutions like replacing refuse trucks running on diesel with technologically superior engines fueled by LNG. Their focus is bridging the gap between technology research and commercialization by facilitating the critical stage of development and demonstration (or real-world testing). Their $550M SD Tech Fund® is aimed at supporting the late-stage development and pre-commercial demonstration of clean technology solutions: products and processes that contribute to clean air, clean water, and clean land that address climate change and improve the productivity and the global competitiveness of the Canadian industry. The $500 million NextGen Biofuels Fund® supports the establishment of first-of-kind large demonstration-scale facilities for the production of next-generation renewable fuels.
One successful case study involves the High Pressure Direct Injection (HPDI) fuel delivery system developed by Westport Innovations of Vancouver, which is currently under real-world testing on the busy Highway 401 between Toronto and Windsor. Other partners in the project include Cummins Inc., the world’s largest heavy-duty diesel engine manufacturer, Challenger Motor Freight, Enbridge Gas Distribution, Natural Resources Canada, and Transport Canada. A very recent collaboration with the Canadian Pallet Council (CPC) to the tune of $1.25M in funding involves the development and demonstration of the Electronic Container Transfer (ECT) technology, in tune with CPC’s pallet exchange system as the low cost pallet solution for the Canadian consumer products industry.112
National Policy Framework for Strategic Gateways and Trade Corridors113 Canada has developed a National Policy Framework for Strategic Gateways and Trade
Corridors and has been developing individual Gateway Strategies, including the Asia-Pacific Gateway and Corridor Initiative that was announced in October 2006, as well as the Ontario-Quebec Continental Gateway and Trade Corridor and the Atlantic Gateway, which are still under development. These strategies will serve as frameworks for long-term planning and strategic investment, optimization of existing transportation infrastructure, better integration of major transportation systems, environmental protection, and enhancing transportation security.
Gateways and Border Crossings Fund (GBCF)114
The $2.1 billion Gateways and Border Crossings Fund (GBCF) is a merit-based program to fund transportation infrastructure and other related initiatives to develop Canada’s strategic gateways, trade corridors, and border crossings and to better integrate the national transportation
111 Sustainable Development Canada. http://www.sdtc.ca/en/. Accessed November 2009. 112 Canadian Pallet Council. http://www.cpcpallet.com/index.cfm?fa=home.homepage. Accessed November 2009. 113 Government of Canada. National Policy Framework for Strategic Gateways and Trade Corridors. http://www.canadasgateways.gc.ca/NationalPolicyFramework/nationalpolicy.html. Accessed November 2009. 114 Infrastructure Canada. Gateways and Border Crossings Fund. http://www.buildingcanada-chantierscanada.gc.ca/funprog-progfin/target-viser/gbcf-fpepf/gbcf-fpepf-eng.html. Accessed November 2009.
85
system. Key objectives of the GBCF are enhanced transportation system efficiency, reliability and integration, and innovative technology applications designed to improve and maximize the capacity of the existing system, eliminate bottlenecks, and optimize the use of all transportation modes. The outcomes of GBCF investments (e.g., intermodal connections, shortline railways, and short sea shipping) include mitigating congestion and minimizing environmental impacts of transportation such as reduced emissions of air pollutants and GHGs, and negative land-use impacts.
4.3.2 Provincial Canada’s provinces and territories have been collaborating on efforts to reduce energy
consumption within the freight transportation sector, and released a collaborative Guide for Purchasing Aerodynamics for Heavy-Duty Tractors and Trailers in 2009.
Québec has the best per capita GHG emission balance sheet in Canada, largely attributable to the fact that over 97% of the electrical energy produced in Québec is of hydroelectric or eolian (wind) origin.115 Nonetheless, road transportation alone causes 85.9% of all transportation sector emissions and 32.1% of total GHG emissions. The Ministère des Transports (MTQ) is taking action both by implementing measures to reduce GHG emissions and adapting to the impacts of climate change on transportation. Efforts to reduce GHG emissions include programs and actions geared to energy efficiency, development and use of public and alternative transit, development of intermodal transportation, support for technological innovation, and raising the awareness of its partners and the population at large. In addition to supporting numerous projects, particularly in the vehicle and replacement fuel sectors, the MTQ has implemented a series of short-, medium- and long-term measures aimed at automobile transportation, public transit, and transport of goods (coastal and inland shipping, shift to rail transport and perfecting of technologies intended to improve energy performance, including truck refrigeration systems).
The MTQ took also action by implementing measures to reduce or avoid GHG emissions and by adapting to the impacts of climate change on transportation. Based upon the 2006-2012 climate change action plan116 called Québec and Climate Change – A Challenge for the Future (QCCCF), the MTQ created two programs: the Assistance Program Aiming to Reduce or Avoid Greenhouse Gas Emissions and Government Assistance Program for Improving Energy Efficiency in Freight Transportation. The Assistance Program Aiming to Reduce or Avoid Greenhouse Gas Emissions is based on Action 8 of the QCCCF. It was created in 2008 and has a budget of $60 million for 5 years. Its goal is to reduced or avoid 80,000 tons of GHG on a yearly basis at the end. The Government Assistance Program for Improving Energy Efficiency in Freight Transportation is based on Action 9 of the QCCCF. It was created in 2009 and has a budget of $45 million, including $18 million for rail and marine modes to be spent until 2013. Its goal is to reduce the GHG emissions by 75,000 tons at the end. By 2010-2011, the MTQ plans to
115 Transports Québec. Energy Efficiency. http://www.mtq.gouv.qc.ca/portal/page/portal/ministere_en/ministere/developpement_durable/efficacite. Accessed November 2009. 116 Ministère du Développement durable, de l'Environnement et des Parcs. Quebec 2006–2012 Climate Change Action Plan. http://www.mddep.gouv.qc.ca/changements/plan_action/index-mesures-en.htm. Accessed March 2010.

86
allocate $21 million to its Modal Integration Assistance Program.117 Most of this amount (80%) will go to rail and marine infrastructures and to pilot projects, in order to foster:
• the integration and more streamlined use of transportation modes and systems, • the maintenance and development of an adequate and competitive infrastructure network
that meets shippers’ needs, • the short-term development of marine and rail transportation activities, and
• the promotion of rail and marine transportation modes. Under this program, industry initiatives speak volumes about the potential economic,
environmental, and social advantages of integrating transportation modes. Since 2005, two companies have turned to marine transportation, sending part of their production by barge and ship. In this way, each year they remove more than 30,000 trucks from circulation, reducing GHG emissions by 39,000 tons. In addition, their projects help improve traffic flow, and by the same token, road safety.
The MTQ offers financial support to research centers and universities for projects involving, for example, the design and evaluation of electric and hybrid vehicles, biofuels, energy efficiency, and reduction of vehicle fuel consumption.118 Research and innovation initiatives are committed to research and development, information monitoring, technology transfer, and maintenance of expertise. Field-implemented projects include real-time information via urban traffic management centers in Montreal and Québec.
In Ontario, the government is encouraging companies to switch to greener commercial vehicles and technologies to reduce GHG emissions. Through the Green Commercial Vehicle Program—a four-year, $15-million initiative—Ontario provides grants to companies for purchasing alternative fuelled medium-duty vehicles or retrofitting heavy-duty vehicles with anti-idling technology. To date the program has received more than 1,500 applications from about 200 Ontario companies.119
Ontario has also launched a $425K program to develop mandatory speed limiters for all large trucks operating in the province. A speed limiter is an electronic device within a truck engine that caps the truck’s top speed at a maximum of 105 km/h. Mandatory speed limiter requirements are now in place.120
117 Transports Québec. Modal Integration Assistance Program. http://www.mtq.gouv.qc.ca/portal/page/portal/ministere_en/ministere/programmes_aide/transport_ferroviaire/integration_modale. Accessed November 2009. 118 Transports Québec. Technological Innovation. http://www.mtq.gouv.qc.ca/portal/page/portal/ministere_en/ministere/developpement_durable/innovation_technologique. Accessed November 2009. 119 Ontario Ministry of Transportation. Green Commercial Vehicle Program. http://www.mto.gov.on.ca/english/trucks/programs/grants-trucks/index.shtml. Accessed March 2010. 120 Ontario Ministry of Transportation. Mandatory Truck Speed Limiters. http://www.mto.gov.on.ca/english/trucks/trucklimits.shtml. Accessed March 2010.

87
4.4 MEXICO
Mexico is becoming increasingly active in the GHG abatement field, starting with stationary sources and passenger transportation. The country made a strong effort toward climate change in December 2008, when it announced it had set the goal of reducing GHG emissions to 50% below 2002 levels by 2050. Transport is thought to be responsible for 18% of Mexico’s GHG emissions and is second only to energy generation as an emissions source.85
Mexico City Bus Rapid Transit Mexico City shifted to efficient, low carbon bus rapid transit systems and light rail,
retired old buses, and replaced them with lower carbon alternatives, such as hybrid vehicles. The new bus rapid transit corridor was opened in Mexico City in 2005 and continuously expanded. The system uses new, clean, quiet buses and dedicated lanes. Similar transit systems in other Mexican cities are now in the works. The bus system is complemented by a subway system, bike lanes, and time restrictions on car circulation. The funds came from a Clean Technology fund, supported by eight governments and managed by the World Bank.121
Programa GEI Mexico122
Mexico’s GHG program, “Programa GEI Mexico,” is a voluntary GHG accounting and reporting program with approximately 30 participating companies such as the entire cement, petroleum, and beer brewing sectors, as well as a significant portion of its steel sector. Participants make a voluntary commitment to conduct and publicly report a corporate GHG inventory, and the program is now expanding to include the accounting for GHG reduction projects. Participation in the Mexico GHG Program is open to any private- or public-sector organization with operations in Mexico and is free of cost. Participants receive training, calculation tools, and technical assistance for preparing corporate GHG inventories, identifying GHG reduction opportunities, and participating in GHG markets. It was made permanent in 2006, after a successful 2-year pilot test.
4.5 INTERNATIONAL
United Kingdom: Freight Best Practice123
Launched by the Department for Transport (DfT), Freight Best Practice UK offers a host of online resources including free guides, software, and seminars to help freight operators improve the efficiency of their fleet. Links to current research and case studies of programs adopted by UK companies are also made available. The website acts as a gateway for 121 Office of Mexico-Japan Economic Partnership Agreement. Mexico: Seeking a Low-Carbon Growth Path. http://www.mexicotradeandinvestment.com/pdf/wb%20ctf.pdf. Accessed November 2009. 122 Programa GEI Mexico. Accessed November 2009. 123 Department for Transport. Freight Best Practice. http://www.freightbestpractice.org.uk/. Accessed November 2009.

88
information on saving fuel, developing skills, equipment and systems, operational efficiency, and performance management. The resources are very dynamic, offering a series of actionable recommendations and evaluative strategies to determine the potential of best practice implementation for freight transport professionals. It is similar to EPA’s SmartWay but more comprehensive with more specific hands-on, step-by-step guidance to fleet owners and operators.
United Kingdom: Freight Facilities Grants124
Distances in Britain are typically too short to make freight rail truly competitive with truck transportation. Furthermore, as an island, Great Britain has many coastal population centers but a developed, uptodate navigable inland waterway system that can accommodate large vessels. For this reason, it has devoted its efforts in developing short sea shipping to coastal services capable of operating in open seas. Freight facilities grants (FFGs) offer cash incentives for businesses to take freight off congested roads and move it on to rail or water. They help companies pay operating costs of waterway transportation for up to three years and cover up to 50% of the total cost. Since the aim of the program is to increase the benefits of reduced pollution and congestion through waterway usage, the government bases the amount of project funding offered on the value of the environmental benefit and the financial appraisal. To simplify the process of determining the environmental benefit, the government provides an online calculator that estimates the reduction in roadway miles that will result from an initiative. Projects providing a greater reduction in road miles receive higher levels of funding.125
European Union: Marco Polo II126 and Motorways of the Sea (MoS)127 Marco Polo II (reauthorized in September 2009) is the EU’s funding program for
intermodal projects and projects that shift freight transport from road to short sea shipping, rail, and inland waterways, improving the environmental performance of freight transport by having fewer trucks on the road and thus less congestion, less pollution, and more reliable and efficient transport of goods. The Marco Polo Program features three types of action: first, modal shift actions focusing on shifting as much cargo as possible under current market conditions; second, catalyst actions, which should change the way nonroad freight transport is conducted in the EU; and third, common learning actions, which should enhance knowledge in the freight logistics sector and foster advanced methods and procedures of cooperation in the freight market.
The “Motorways of the Sea” concept aims at introducing new intermodal maritime-based logistics chains in Europe and bringing about a structural change in the transport organization. These chains will be more sustainable and commercially more efficient than road-only transport. 124 Department for Transport. Freight Facilities Grants. http://www.dft.gov.uk/pgr/freight/grants. Accessed November 2009. 125 Kruse C. J., C. A. Morgan, and N. Hutson. Potential Policies and Incentives to Encourage Movement of Containerized Freight on Texas Inland Waterways. Texas Transportation Institute, College Station, Texas. March 2009. http://ttinet.tamu.edu/library/catalog/product_details.asp?book_id=32577. Accessed November 2009. 126 European Commission Energy & Transport. Marco Polo. http://ec.europa.eu/transport/marcopolo/home/home_en.htm. Accessed November 2009. 127 European Commission. Motorways of the Sea. http://ec.europa.eu/transport/maritime/motorways_sea/motorways_sea_en.htm. Accessed November 2009.
89
Motorways of the Sea hopes to improve access to markets throughout Europe and bring relief to the over-stretched road system. For this purpose, fuller use is to be made not only of the maritime transport resources but also of the potential in rail and inland waterway, as part of an integrated transportation chain. Four corridors were designated as Motorways of the Sea: in the Baltic, and in western, southeast, and southwest Europe.
The European efforts have succeeded in achieving a better modal balance only in certain short sea shipping routes among certain well-established markets, e.g., the Baltic, and container hub-and-spoke ports traditionally served by inland barging, e.g., Rotterdam and Antwerp. Although the concept is in its early stages and has not yet been sufficient to create a paradigm shift in modal choice, the initiatives are yet far from the original goal of displacing trucking as the dominant mode for trans-European movements. Reasons include jurisdictional boundaries between the member states, administrative and funding issues, rail network capacity largely occupied by passenger rail, and simply unwillingness of shippers to divert.
European Union: Emission Trading System (EU ETS)128 The largest and most established cap-and-trade program worldwide is the EU’s Emission
Trading Scheme (EU ETS). It is a multi-national, GHG emissions trading scheme created in 2005—before the Kyoto Protocol—and is the centerpiece of European climate change policy. The ETS currently covers more than 10,000 installations with a net heat excess of 20 MW in the energy and industrial sectors that are collectively responsible for close to half of the EU’s emissions of CO2 and 40% of its total GHG emissions. Under the EU ETS, large emitters of carbon dioxide within the EU must monitor and annually report their CO2 emissions, and they are obliged every year to return an amount of emission allowances to the government that is equivalent to their CO2 emissions in that year. An initial allocation on a plant-by-plant basis is made, and then an operator may purchase EU allowances from others (installations, traders, the government). If an installation has received more free allowances than it needs, it may sell them to anybody. The EU ETS has recently been extended to the airline industry as well, but these changes will not take place until 2012.
Switzerland: Climate Cent129
In 2005, Switzerland’s Federal Council announced that the country’s commitment to the Kyoto Protocol would be met through a combination of measures involving CO2 fees on combustibles and motor fuels. The charge was voluntarily agreed to by the oil industry and revenue will fund investments to reduce CO2 emissions and to purchase tradable CO2 certificates from abroad. Two thirds of the money will be invested in abatement measures in transportation, building, and combined heat and power sectors. European fuel prices in general are about 4–5 times what they are in the U.S. due to high taxation.
128 Europa. Emission Trading System (EU ETS). http://ec.europa.eu/environment/climat/emission/index_en.htm. Accessed November 2009. 129 Swiss Federal Office of Energy. Climate Cent. http://www.bfe.admin.ch/energie/00572/00575/index.html?lang=en. Accessed November 2009.

90
Australia: Alternative Fuels Conversion Program (AFCP)130 The Alternative Fuels Conversion Program (AFCP) took place between 2000 and 2008
and was designed to assist operators of commercial fleet vehicles undertaking trials to demonstrate the commercial viability of alternative fuels (CNG, LPG) or hybrid diesel/electric; manufacturers of vehicles designed to operate on alternative fuels or hybrid diesel/electric; and manufacturers of engine modification kits to enable engines to operate on alternative fuels. The emphasis of the program was changed slightly in 2002 to supporting major commercial fleet operators to trial selected alternatively-fuelled or hybrid diesel/electric engines in order to assess their commercial viability and environmental performance in heavy vehicles.
Australia: Carbon Pollution Reduction Scheme (CPRS)131 Australia (and New Zealand) has passed cap-and-trade legislation, called the Carbon
Pollution Reduction Scheme (CPRS), slated to begin in 2011—a case similar to the U.S.’s. The country aims to meet its National Emissions Target of reducing emissions by as much as 25% below 2000 levels by 2020. The CPRS will target the 10,000 largest emitters in the country (over 25,000 MtCO2e per per year). Industrial processes, electricity generation, oil/gas production, transportation, and waste are the targets. The legislation is still fresh off the drawing board at present and the mechanisms to be used for emissions measurement and enforcement are not yet well clarified.
Japan: Heavy-Duty Truck Fuel Efficiency Standards132 Japan established new fuel efficiency standards for heavy duty freight vehicles using light
oil as fuel of a gross weight over 3.5 tons. Based on the benchmarking approach of the “Top Runner Programme,” which requires current best in class performance to become the average performance level by a target date, manufacturers are required to improve the fuel economy of heavy duty vehicles by 2015. In practice, this means an average improvement of fuel efficiency from 6.32 km/liter in 2002 to 7.09 km/liter in 2015. Japan also introduced tax intensives for new or retrofitted vehicles that meet both fuel economy and low emission standards.
Brazil: National Plan on Climate Change133
Brazil, where over 77% of electricity in 2007 was produced via hydroelectric power, has identified two challenges through its National Plan: the difficult task of significantly reducing emissions from land use change and the requirement of continuously increasing efficiency in the use of the country’s natural resources. The way these challenges are dealt with will be based on 130 Australian Government, Department of the Environment, Water Heritage, and the Arts. Alternative Fuels Conversion Program. http://www.environment.gov.au/settlements/transport/afcp/index.html. Accessed November 2009. 131 Australian Government, Department of Climate Change. Carbon Pollution Reduction Scheme. http://www.climatechange.gov.au/government/initiatives/cprs.aspx. Accessed November 2009. 132 International Energy Agency. Energy Efficiency Policies and Measures. http://www.iea.org/textbase/pm/?mode=pm&id=3983&action=detail. Accessed November 2009. 133 Government of Brazil. National Plan on Climate Change. December 2008. http://www.mma.gov.br/estruturas/208/_arquivos/national_plan_208.pdf. Accessed November 2009.

91
the coordinated, linked, continuous, and synergic efforts for which the National Climate Change Plan was designed. The Plan defines actions and measures aimed at mitigation and adaptation to climate change. It has the following specific objectives: • Stimulate efficiency increase in a constant search for better practices in the economic sectors.
• Keep the high share of renewable energy in the electric matrix, preserving the important position Brazil has always held in the international scenario.
• Encourage the sustainable increase in the share of biofuels in the national transport matrix and also work toward the structuring of an international market of sustainable biofuels.
• Seek for sustained reduction deforestation rates, in all Brazilian biomass, in order to reach zero illegal deforestation.
• Eliminate the net loss of forest coverage in Brazil by 2015. • Strengthen inter-sector actions concerned with the reduction of the vulnerabilities of
populations. • Identify environmental impacts resulting from climate change and stimulate scientific
research that can trace out a strategy that can minimize the socio-economic costs of the country’s adaptation.

93
CHAPTER 5. OPPORTUNITIES
This report presented a snapshot of the rail and truck freight transportation system in North America and examined how policies, regulations, incentives, and other measures can contribute toward enhancing the environmental sustainability, in particular the GHG emissions, of the freight transportation system in the region.
The findings of the assessment led to the identification of several areas presenting opportunities for action by the three nations to mitigate GHG emissions from freight truck and rail transportation in North America. The results of the gap analysis include: the areas with identified opportunities and the associated recommendations to help guide future actions. The areas of opportunities were classified into two time periods: short-medium term payoff (in the next 10-15 years) and medium-long term payoff (in the next 15-30 years).
Freight transportation is demand driven and tightly linked to economic growth. Despite
the current economic downturn, the economy of the three North American countries is expected to continue to grow. Vehicle-miles of travel for trucks will increase faster than VMT for passenger vehicles. Rail ton-miles will increase and seriously impact the capacity of the rail network. As freight GHGs are directly related to the amount of fuel that is burned by trucks and rail locomotives, GHGs will grow alongside freight transportation. Therefore the only way to prevent GHG emissions from increasing at the same or even higher rate is to reduce the energy requirements of freight transportation while still moving the same amount of goods. This effort will require a multifaceted approach to all fronts: fuels, technologies, operational efficiency, smart growth, and market-based mechanisms.
5.1 SHORT-MEDIUM TERM OPPORTUNITIES
Opportunity 1: More Rigorous Public Investment
Freight truck and rail transportation are profit-driven private enterprises. After driver costs, fuel costs comprise the second largest cost category for heavy-duty truck operators. As a result, transportation operators already have strong financial incentives to invest in new fuel saving technologies and strategies. Large operators are more likely to be able to afford the high initial cost of new technologies or strategies and realize fuel savings that offset it, but this is not necessarily the case with small operators. Small operators need stronger financial incentives from the public sector to be able to afford emissions saving technologies. In addition, there already is strong competition for the existing government grants.
Recommendation
Ultimate Goal: Reduce the energy intensity of the freight system in North America.

94
The recent economic crisis has forced small truck operators out of the market and selling of their rigs. With economic recovery, reentry of these small operators to the market is likely. This presents rich opportunities for the public sector to target resources strategically, albeit with the necessary levels of financial incentives. Targeting large operators first can help speed up GHG reductions, fleet turnover, and cost reduction of new technologies, which will permit their adoption by smaller operators.
Opportunity 2: Freight-Specific GHG Regulation
Freight transportation’s diesel engines and other improvements are already considerably
fuel efficient, but there always is room for improvement. However, the relative lack of regulation of freight emissions has led to innovation lagging behind that related to light-duty (passenger) vehicle emissions. Freight GHG emissions control efforts have been limited to voluntary programs and private initiatives.
Recommendation
Emissions regulations specifically targeting freight transportation are needed, to complement voluntary programs and private investment. The potential for emissions reductions can be exponentially increased in this manner.
Opportunity 3: Dynamic Cooperation with the Private Sector
Fuel savings concerns of freight operators have given rise to a whole new industry sector that also invests heavily in the research, development, demonstration, and commercialization of fuel and emissions saving technologies. The public sector through various voluntary programs involving financial incentives or subsidies is already seeking to promote the use of these energy and emissions saving technologies and create “win-win” situations. However, there seems to be less than optimal collaboration among the public sector, the technology R&D sector, and the end-user sector (operators). The public sector is often viewed as a hindrance to private enterprise if it instigates extensive regulation.
Recommendation
The public sector on a unified North American front should intensify cooperation and collaboration efforts with the R&D and end-user industries, such as Public-Private Partnerships (PPPs). The three governments in a unified front have the power to act as a trilateral catalyst to more rigorously promote fuel and emissions saving technologies throughout the transportation system of the continent. The similarities among carrier operations in each country can facilitate system wide applications and effect economies of scale, thereby helping offset the high cost associated with emissions control.
95
Opportunity 4: Improvement in Technology Transfer and Technical Expertise
Technology transfer and exchange among North American countries is already taking place. Methods to measure/estimate GHGs from freight transportation modes and their underlying data requirements are common across the board, as they were primarily developed by the USEPA.
The primary limitation of GHG emissions measurement/estimation methods is that the
user may either not have access to solid data inputs or may not understand the assumptions tied to the default data, especially in lifecycle analyses. There seems to be an imbalance among the technical expertise and knowledge skills among the three countries. These are required in order to develop the critical input data with confidence, and carry out the methods themselves in order to reach GHG estimates that are as accurate and precise as possible.
Recommendation A more meticulous and organized effort involving technology transfer and knowledge
exchange needs to take place among the three North American countries so that GHG measurement/estimation methods (including lifecycle and transboundary analyses), the underlying data, and the expertise or best practices to develop or carry them out are all standardized and disseminated. This will raise and equalize the level of confidence in the accuracy and precision of the results across the continent. GHG emissions from freight transportation modes, alternative fuels, vehicle classes, and sub-classes will then be able to be compared on an equal and detailed basis. In turn, GHG emissions from each one will be able to be targeted more efficiently and appropriately.
5.2 MEDIUM-LONG TERM OPPORTUNITIES
Opportunity 5: Development of Alternative Energy Sources
In the next 15 to 30 years, more new technologies are likely to be introduced
commercially and transportation fleet turnover will occur. Significant growth in the use of alternative energy sources is foreseen, although drastic changes such as widespread use of hydrogen and electric are unlikely. The transition from conventional petroleum to alternative energy sources will be gradual but more widespread.
In the short term, i.e., the next 10 to 15 years, petroleum-based liquid fuels are projected
to continue their dominance. Any new developments are unlikely to emerge, be proven viable, and deployed commercially. Technologies that are now being proven will be the ones to be increasingly phased in.

96
Recommendation Advancing research and development of alternative fuels in addition to technologies is
critical to achieving major GHG emissions reductions from freight transportation but requires focused and persistent governmental support to high monetary levels. The governments of North America should commit conscientiously and in unity to the longer-term, higher risk investment required in the search for viable sources of energy for freight transportation. In the meantime, mandates for blending low-carbon content fuels with petroleum ones are considered the most productive fuel-related mitigation measure.
Opportunity 6: Emissions/Carbon Pricing
Good News
Further out on the horizon, emissions pricing schemes tailored to freight transportation modes are likely to emerge. Pricing emissions will gradually offset the cost of emissions abatement. Hence it can be regarded as the path of least cost to the public sector. Factoring transportation’s true costs in the price will more realistically help evaluate costs and benefits of public and private sector decisions. Careful planning and management will rise in importance. Minimization of energy consumption will become a more important criterion in supply chains than cost efficiencies and speed. New ways of doing business while minimizing energy use will arise in an effort to retain competitiveness. Transportation costs will increase and force regionalization and localization of supply chains. Supply chains will continue to be global in nature but they will become more “sustainable,” not only due to government intervention but also due to consumer demand.
Bad News At present, even emissions pricing schemes for the major culprits of GHG emissions
(stationary sources) are at the baby-step level in North America and receive precedence over mobile sources due to their greater contribution to overall GHG emissions. Factoring the external costs, such as emissions, in the price of transportation will inevitably raise product prices and their importance in consumer and business decisions. Rising oil prices will take second place to costs of externalities once they are factored in. Emissions reductions will present a greater challenge than energy supply.
Recommendation
The governments of North America should exercise care in crafting a viable and effective carbon pricing plan for freight transportation in North America. Undue burden to commerce should be avoided to the degree possible otherwise serious ramifications with a chain reaction effect throughout the economy are a strong possibility. Without a price on carbon, other actions (e.g., regulations and programs) will be significantly limited in impact.

97
5.3 EPILOGUE
Energy markets on their own cannot be expected to adequately limit GHG emissions therefore government intervention is critical. No single policy is sufficient. A healthy combination of policies (subsidies, regulation, and pricing) is the most promising approach toward mitigating GHG emissions from freight transportation. Government can shape the world’s energy and emissions future. Greenhouse gases have no borders; therefore their mitigation should have no borders either. The three North American countries should unite in order to protect the environment and improve the quality of life in the region. Freight transportation is vital to the economy of every country and could become the link that finally unites the trading block toward a common ultimate goal.