sustain program asset management strategy - …. rights of way... · sustain program asset...
TRANSCRIPT

Rights-of-Way Sustain Program
Asset Management Strategy
Ron Burnett, Access Roads Program Manager Steve Goff, Real Property Services Program Manager
Chuck Sheppard, Vegetation Management Program Manager October 2012
B O N N E V I L L E P O W E R A D M I N I S T R A T I O N
Transmission ROW Strategy
Revised October 2012 2 2
Executive Summary for Updated Strategy
What equipment and facilities are covered?
What performance objectives, measures and targets should be set?
What is the health of the assets?
What risks must be managed?
What strategies should we undertake?
What will it cost?
Program Accomplishments FY10-11
Transmission ROW Strategy
Revised October 2012
Rights of Way (ROW) Asset Management Strategy – Covers corridors that contain transmission lines, the access roads established for
the maintenance of transmission lines, and communications sites.
Assets included in 266,600 acres of BPA maintained ROW corridors – 295 corridors, 423 transmission lines, and 368 communication sites. – 11,858 miles of access roads, including roads, bridges, culverts, trails and gates. – ~ 80,000 tracts of easement for the corridors and access roads.
Three components are included in the strategy that enable BPA to safely
access, construct, operate and maintain its transmission facilities. – Control Vegetation. – Maintain and improve access roads. – Acquire and manage land rights.
3
Executive Summary for Update

Transmission ROW Strategy
Revised October 2012 4
Executive Summary (Cont.)
Control Vegetation – This program was developed to ensure regulatory compliance with FERC, NERC, and WECC guidelines for managing vegetation and to avoid costly fines resulting from unplanned outages.
The vegetation management strategy is an expense program that involves
an ongoing effort to clear and maintain land within transmission corridors through the implementation of integrated vegetation management (IVM) practices. There is also a capital component to address vegetation mitigation (orchard buy back) included in the strategy. The objective is to ensure that vegetation growth does not impede access to towers and potential of trees does not present the risk of arcing from energized lines.
Transmission ROW Strategy
Revised October 2012 5
Executive Summary (Cont.)
Access Roads (AR) – This program was developed to support: – Wood Pole Lines Strategy – Sustain Steel Lines Strategy – AR ‘stand alone’ upgrades:
• To meet regulatory and environmental compliance • To address transportation system deterioration throughout the transmission system.
The primary strategy for AR is to complete all necessary construction work
prior to line work associated with wood poles and steel lines as well as to move from a reactive to a systematic approach to AR project identification. This strategy is a critical component of the sustain programs because it ensures safe access, in compliance with environmental regulations, is provided throughout the entire transmission system.
Transmission ROW Strategy
Revised October 2012 6
Executive Summary (Cont.)
Acquire and Manage Land Rights (LR) – This program was developed to support:
– Wood Pole Lines Strategy – Sustain Steel Lines Strategy – AR ‘stand alone’ upgrades:
• To meet regulatory and environmental compliance • To address transportation system deterioration throughout the transmission system.
– Tribal renewals – Orchard buy back program
The primary strategy for LR is to complete all necessary land acquisition work a minimum of 1 year in advance of AR construction associated with wood poles and steel lines as well as stand alone projects. This strategy is a critical component of the sustain programs because it ensures that legal access is provided throughout the entire transmission system.
The Orchard buy back program keeps our rights-of-way clear of vegetation and compliant with WECC/NERC regulations.
Transmission ROW Strategy
Revised October 2012
Executive Summary (Cont.)
Lessons Learned – Wood Pole and Steel Line Sustain Programs had approved Business Cases prior
to the ROW Business Case approval. The ramp up of work associated with Wood and Steel Sustain created a challenge in implementing the strategy to ‘get ahead’ of the Sustain Programs by acquiring land rights and upgrading the Access Roads a year in advance of other programs’ project work. This ramp up is visually displayed in the Appendix, Slide 57, Historical Spend.
– We didn’t adequately address the amount of time it will take to ramp up the ROW
Program to accommodate the higher level of funding identified in the original ROW Business Case.
Next Steps
– Develop even closer coordination with Wood Pole and Steel Line Sustain Programs by way of monthly or quarterly program updates to ensure that schedules are getting more closely synchronized.
– Develop more effective strategies for scoping and estimating projects that will
allow for accelerated project development.
7

Transmission ROW Strategy
Revised October 2012 8 8
Executive Summary for Updated Strategy
What equipment and facilities are covered?
What performance objectives, measures and targets should be set?
What is the health of the assets?
What risks must be managed?
What strategies should we undertake?
What will it cost?
Program Accomplishments FY10-11

Transmission ROW Strategy
Revised October 2012 9 9
What this strategy covers
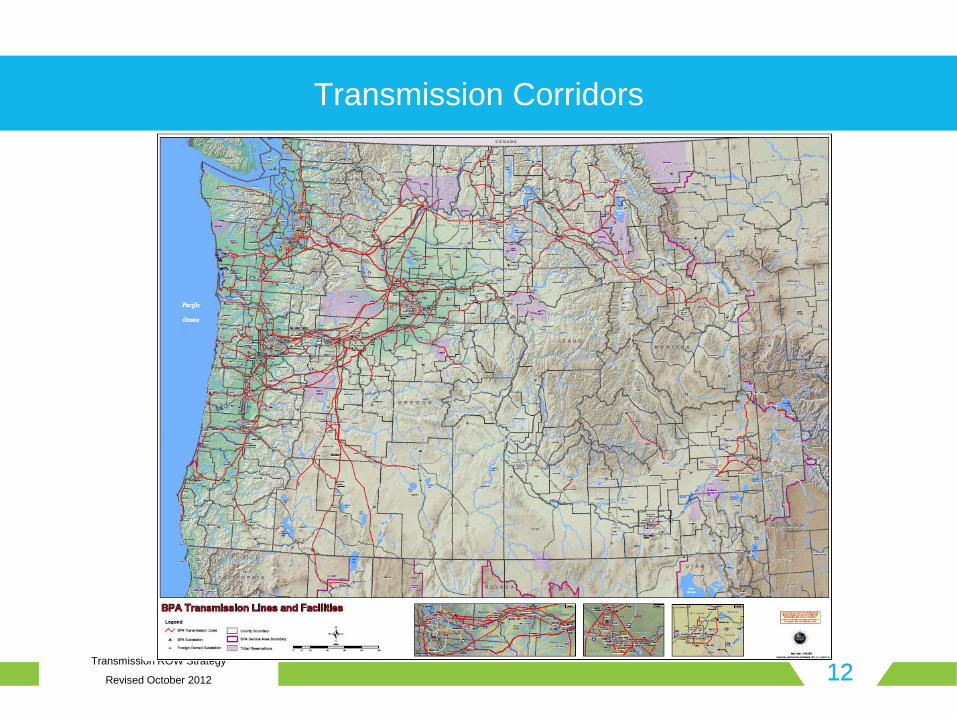
Rights of Way (ROWs) are comprised of corridors that contain transmission lines and the access roads established for the maintenance of transmission lines. An additional element that is covered is access roads to communications sites. Working with federal, state, and local agencies, private land owners, and other interested parties, BPA maintains 266,600 acres of transmission line corridor rights of way, encompassing: • 295 corridors, 423 transmission lines, and 368 communication sites
• 11,838 miles of access roads, including roads, bridges, culverts, trails and gates
• ~80,000 tracts of easement for the corridors and access roads
This strategy covers maintenance work to control vegetation: maintenance work and improvements to roads; and acquisitions and perfecting of easement rights to enable BPA to access and manage existing transmission facilities This strategy does not cover the clearing of vegetation, building of roads, or acquiring of land or easement rights to support construction of new lines and facilities. These activities are instead covered by individual expansion-related projects

Transmission ROW Strategy
Revised October 2012 10 10
What this strategy covers
Three program components To enable BPA to safely access, construct, operate and maintain its transmission facilities
1. Control vegetation – BPA inspects and observes vegetation on all 266,600 acres of transmission line corridors – Approximately 52 percent (144,500 acres) require cyclical vegetation control while 48 percent (122,100) do
not because they are managed for agricultural purposes – Vegetation is also managed at the substation and communication sites
2. Maintain and improve access roads – Access roads service the corridors and communication sites
3. Acquire and manage land rights – Types of rights include perpetual easements (vegetation, access), term easements (vegetation, access), fee
properties, special use permits, and revocable permits – 30% (80,761) of Transmission ROW acres have vegetation agreements (comprised of 22% agriculture; 53%
landscaping; 17% tree orchards and Christmas trees; 8% individual tree agreements)
– The annual number of land management cases is up to 3,030 of which approximately 570 are closed annually

Transmission ROW Strategy
Revised October 2012 11 11
Situation Assessment
Historically, the agency approach to ROW management has been to react to events rather than apply a proactive, planned life-cycle cost and risk proactive approach.
Costs to maintain the ROW are primarily expense activities focused on vegetation clearing and maintaining existing access roads.
The 2008 vegetation-caused line outage resulted in remedial work costing over $20 million.
Access roads have had minimal budgets that do not allow for adequate maintenance and improvements. Historically, some but not all emergency repairs are able to be completed at critical locations. An Access Roads Work Request System (ARWRS) has been developed and is being used to identify and prioritize access roads projects throughout the transmission system.
Encroachments are an ongoing issue that have been managed on a reactive basis.
The Access Road Maintenance System (ARMS) data indicates that formal easements are lacking in many locations, these will need to be reviewed to determine which need to be acquired.
Environmental mitigation has been required to address impacts that could have been avoided with design adjustments to ROW management activities (i.e., changes in vegetation management prescriptions). The often urgent, reactive nature of ROW activities these past 2-3 years has left little planning time.
To address the current situation, a more strategic, centrally coordinated approach to managing ROW corridors is needed to support data-driven and risk-informed decision-making.
Transmission ROW Strategy
Revised October 2012 12 12
Transmission Corridors

Transmission ROW Strategy
Revised October 2012 13 13
Sample Access Road

Transmission ROW Strategy
Revised October 2012 14 14
Sample Easements Parcel Map
Transmission ROW Strategy
Revised October 2012 15 15
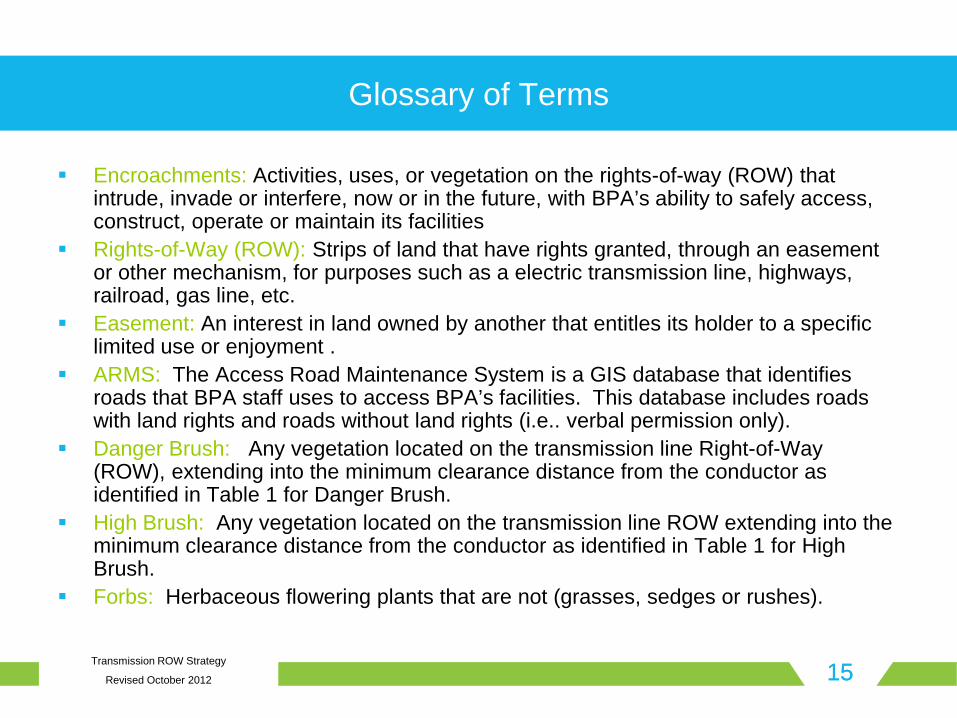
Glossary of Terms
Encroachments: Activities, uses, or vegetation on the rights-of-way (ROW) that intrude, invade or interfere, now or in the future, with BPA’s ability to safely access, construct, operate or maintain its facilities
Rights-of-Way (ROW): Strips of land that have rights granted, through an easement or other mechanism, for purposes such as a electric transmission line, highways, railroad, gas line, etc.
Easement: An interest in land owned by another that entitles its holder to a specific limited use or enjoyment .
ARMS: The Access Road Maintenance System is a GIS database that identifies roads that BPA staff uses to access BPA’s facilities. This database includes roads with land rights and roads without land rights (i.e.. verbal permission only).
Danger Brush: Any vegetation located on the transmission line Right-of-Way (ROW), extending into the minimum clearance distance from the conductor as identified in Table 1 for Danger Brush.
High Brush: Any vegetation located on the transmission line ROW extending into the minimum clearance distance from the conductor as identified in Table 1 for High Brush.
Forbs: Herbaceous flowering plants that are not (grasses, sedges or rushes).
Transmission ROW Strategy
Revised October 2012 16 16
Executive Summary for Updated Strategy
What equipment and facilities are covered?
What performance objectives, measures and targets should be set?
What is the health of the assets?
What risks must be managed?
What strategies should we undertake?
What will it cost?
Program Accomplishments FY10-11
Transmission ROW Strategy
Revised October 2012 17 17
Performance Objectives and Targets
Reliability objectives To enable BPA to access, construct, operate and maintain its transmission facilities
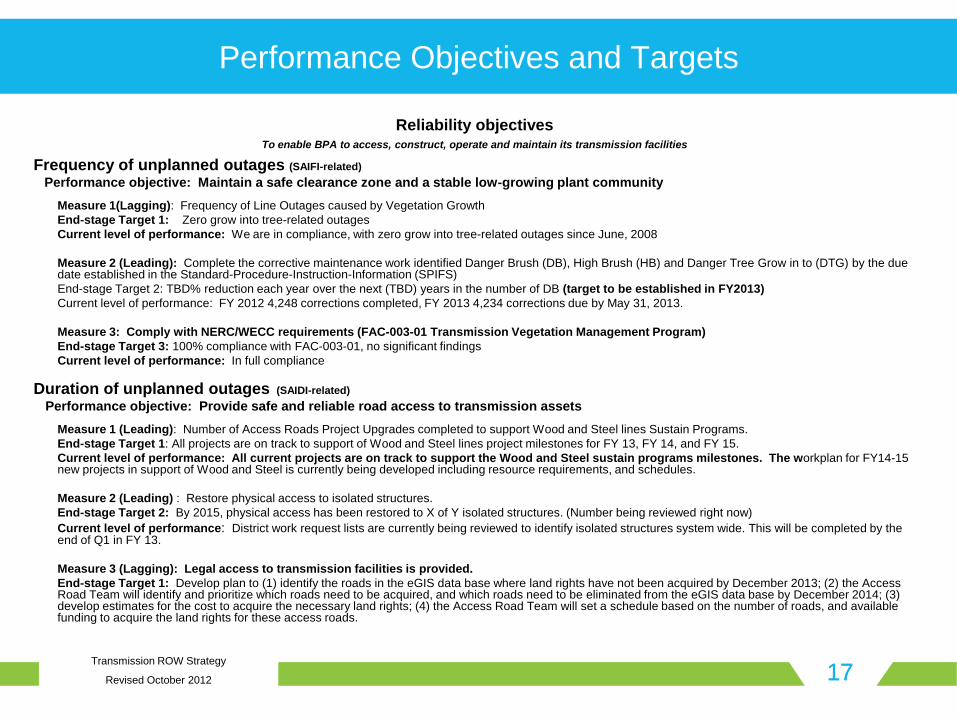
Frequency of unplanned outages (SAIFI-related) Performance objective: Maintain a safe clearance zone and a stable low-growing plant community
Measure 1(Lagging): Frequency of Line Outages caused by Vegetation Growth End-stage Target 1: Zero grow into tree-related outages Current level of performance: We are in compliance, with zero grow into tree-related outages since June, 2008 Measure 2 (Leading): Complete the corrective maintenance work identified Danger Brush (DB), High Brush (HB) and Danger Tree Grow in to (DTG) by the due date established in the Standard-Procedure-Instruction-Information (SPIFS) End-stage Target 2: TBD% reduction each year over the next (TBD) years in the number of DB (target to be established in FY2013) Current level of performance: FY 2012 4,248 corrections completed, FY 2013 4,234 corrections due by May 31, 2013. Measure 3: Comply with NERC/WECC requirements (FAC-003-01 Transmission Vegetation Management Program) End-stage Target 3: 100% compliance with FAC-003-01, no significant findings Current level of performance: In full compliance
Duration of unplanned outages (SAIDI-related) Performance objective: Provide safe and reliable road access to transmission assets
Measure 1 (Leading): Number of Access Roads Project Upgrades completed to support Wood and Steel lines Sustain Programs. End-stage Target 1: All projects are on track to support of Wood and Steel lines project milestones for FY 13, FY 14, and FY 15. Current level of performance: All current projects are on track to support the Wood and Steel sustain programs milestones. The workplan for FY14-15 new projects in support of Wood and Steel is currently being developed including resource requirements, and schedules. Measure 2 (Leading) : Restore physical access to isolated structures. End-stage Target 2: By 2015, physical access has been restored to X of Y isolated structures. (Number being reviewed right now) Current level of performance: District work request lists are currently being reviewed to identify isolated structures system wide. This will be completed by the end of Q1 in FY 13.
Measure 3 (Lagging): Legal access to transmission facilities is provided. End-stage Target 1: Develop plan to (1) identify the roads in the eGIS data base where land rights have not been acquired by December 2013; (2) the Access Road Team will identify and prioritize which roads need to be acquired, and which roads need to be eliminated from the eGIS data base by December 2014; (3) develop estimates for the cost to acquire the necessary land rights; (4) the Access Road Team will set a schedule based on the number of roads, and available funding to acquire the land rights for these access roads.

Transmission ROW Strategy
Revised October 2012 18 18
Performance Objectives and Targets (cont’d) Environmental compliance objective (Compliance with Federal Regulations and Environmental Impact Statement) Performance objective: Maintain transmission corridors and access roads in accordance with KEP/Federal
environmental standards and Final Environmental Impact Statement DOE/EIS-0285 Measure: Number of Access-related Environmental Compliance projects completed End-Stage Target: By Q4 of 2015, complete X of Y identified Environmental Compliance projects Current level of performance: District work requests are currently being reviewed system-wide to identify and
prioritize access roads that are out of compliance with environmental regulations. Identification and prioritization to be complete by Q3 in FY 2013.
Safety objective (Lost-time accidents and fatalities - activities performed safely)
Performance Objective: BPA transmission corridors and access roads are maintained and operated in a way that limits risk to health and safety of employees working on the lines.
Measure (Lagging): Frequency of lost-time accidents due to unsafe access. End-Stage Target: Lost-time accident frequency rate ≤ 1.5 per 100,000 hours worked, no fatalities occur to BPA employees or contract
employees working on BPA facilities as a result of unsafe access. Current Status: Target is met. There have been no lost time accidents as a result of unsafe access.

Transmission ROW Strategy
Revised October 2012 19 19
Performance Objectives and Targets (cont’d)
Stakeholder/Land Owner and Land Management Objective (Compatible Uses of ROWs)
Performance Objective: Ensure that rights-of-way are maintained so that all uses are safe and do not present an
interference with BPA's activities: Developed a rating system to address the priority of mitigating encroachments in June 2011. Rate existing
encroachments by November 2012 and mitigate accordingly Real Property Services will work with Public Affairs to develop an Outreach Program, including schedules and
target audiences by March 2012, to educate the public on compatible use of BPA's rights-of-way Follow the Vegetation Mitigation Procedures for both short and long term mitigation of the 129 orchards that
have been identified by the NRS's as incompatible with BPA's Vegetation Clearance Standards For vacant and underutilized rights-of-way, Real Property Services will work with the Supervisor for the Natural
Resource Specialists and the Constituent Account Executives to develop a plan, including identification of specific right-of-way corridors and schedules, to survey and/or mark the edge of the rights-of-way
Measure 1: Number of the encroachments per rating End-stage Target 1: 100% of the highest rated encroachments have action taken towards mitigation. Targets for
lower priorities will be identified by November 2012 Current level of performance: Currently in the process of defining the ratings, then will be applied to the cases
Transmission ROW Strategy
Revised October 2012 20
Performance Objectives and Targets (cont’d)
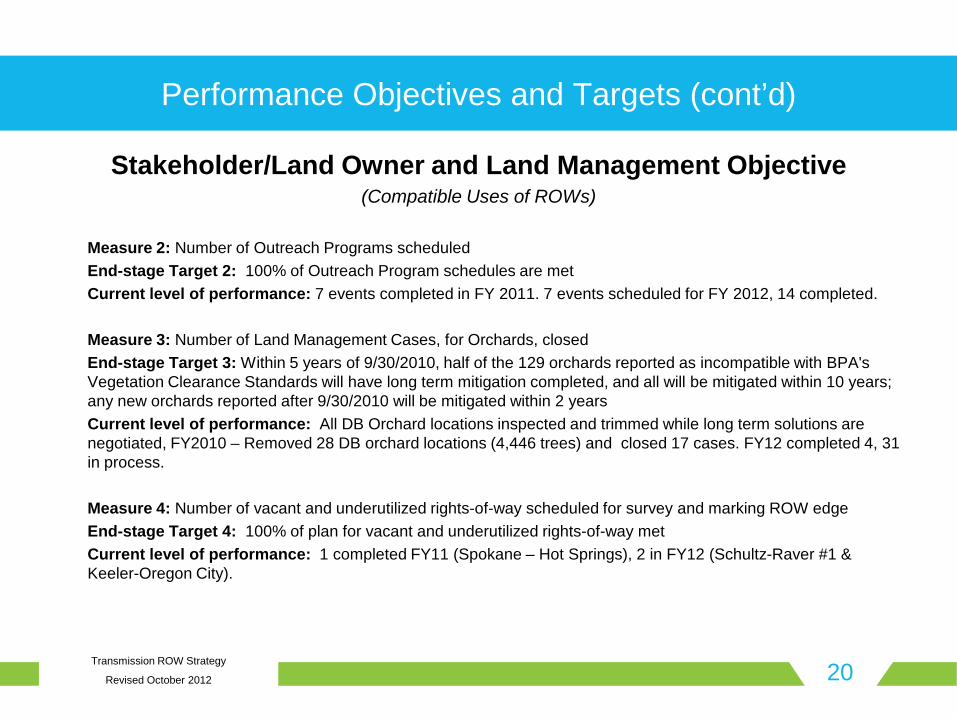
Stakeholder/Land Owner and Land Management Objective (Compatible Uses of ROWs)
Measure 2: Number of Outreach Programs scheduled End-stage Target 2: 100% of Outreach Program schedules are met Current level of performance: 7 events completed in FY 2011. 7 events scheduled for FY 2012, 14 completed. Measure 3: Number of Land Management Cases, for Orchards, closed End-stage Target 3: Within 5 years of 9/30/2010, half of the 129 orchards reported as incompatible with BPA's Vegetation Clearance Standards will have long term mitigation completed, and all will be mitigated within 10 years; any new orchards reported after 9/30/2010 will be mitigated within 2 years Current level of performance: All DB Orchard locations inspected and trimmed while long term solutions are negotiated, FY2010 – Removed 28 DB orchard locations (4,446 trees) and closed 17 cases. FY12 completed 4, 31 in process. Measure 4: Number of vacant and underutilized rights-of-way scheduled for survey and marking ROW edge End-stage Target 4: 100% of plan for vacant and underutilized rights-of-way met Current level of performance: 1 completed FY11 (Spokane – Hot Springs), 2 in FY12 (Schultz-Raver #1 & Keeler-Oregon City).

Transmission ROW Strategy
Revised October 2012 21 21
Executive Summary for Updated Strategy
What equipment and facilities are covered?
What performance objectives, measures and targets should be set?
What is the health of the assets?
What risks must be managed?
What strategies should we undertake?
What will it cost?
Program Accomplishments FY10-11

Transmission ROW Strategy
Revised October 2012 22 22
Vegetation Management Condition Assessment
295 corridors Currently – On average, the breakdown of Low
Growing Plant Community stages per corridor is: – 9% of the corridor is in Stage 1 – 14% of the corridor is in Stage 2 – 23% of the corridor is in Stage 3 – 64% of the corridor is in Stage 4
~55% of the corridor acres require cyclical, preventive vegetation maintenance to ensure achievement of clearance standards
Conditions are markedly improved. Three (3) years ago, the breakdown of Low Growing Plant Community stages per corridor was:
– 20% of the corridor is in Stage 1 – 40% of the corridor is in Stage 2 – 20% of the corridor is in Stage 3 – 20% of the corridor is in Stage 4
Calculate stage based on stem density, height, and type of vegetation Stage 1: Correction action needed
– 0-24% desirable forbs and grasses Stage 2: Continuing removal
– 25-49% desirable forbs and grasses Stage 3: Continuing removal
– 50-75% desirable forbs and grasses Stage 4: Minimum maintenance (prevention)
– 76-100% desirable forbs and grasses
Assessment based on the experience and judgment of the Natural Resource Specialist (NRS)
Transmission ROW Strategy
Revised October 2012 23 23
Historical Vegetation Management Expenses
In response to a transmission line vegetation-related outage in 2008 and self report to WECC, expenses related to vegetation management have ramped up dramatically for remedial work
Vegetation management funding levels for prior years were determined to be inadequate to keep up with annual vegetation growth within and along the rights-of-way
Costs for service contracts are expected to continue to be higher during the transition from corridors with many danger brush and high brush reports to corridors cleared of brush issues and maintained with low growing plant communities
Transmission ROW Strategy
Revised October 2012 24 24
Historical NERC/WECC Reportable Vegetation-Related Outages
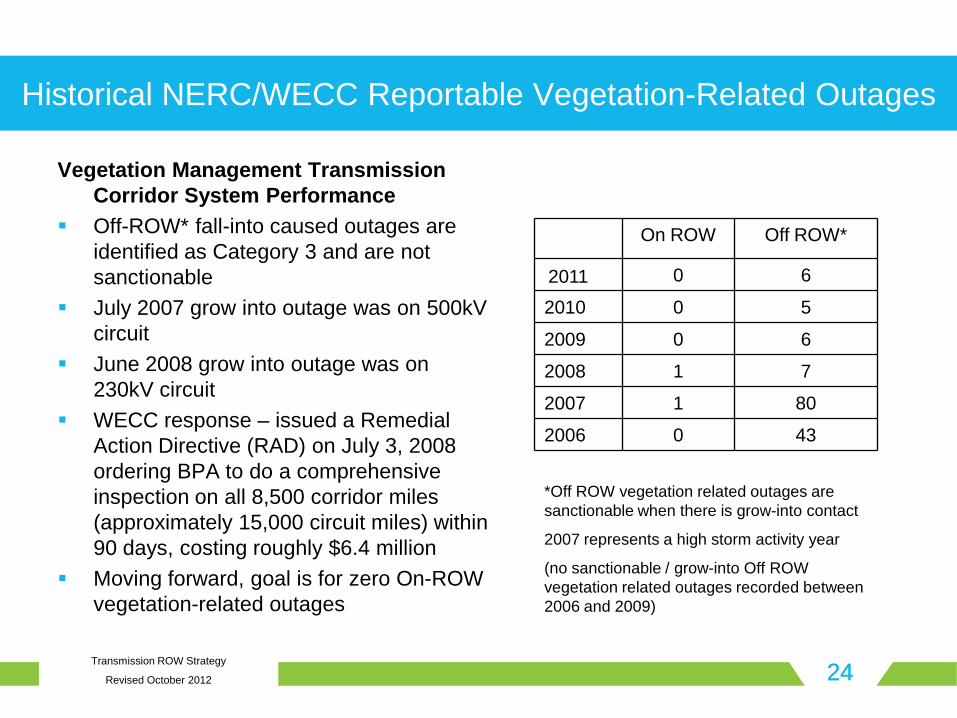
Vegetation Management Transmission Corridor System Performance
Off-ROW* fall-into caused outages are identified as Category 3 and are not sanctionable
July 2007 grow into outage was on 500kV circuit
June 2008 grow into outage was on 230kV circuit
WECC response – issued a Remedial Action Directive (RAD) on July 3, 2008 ordering BPA to do a comprehensive inspection on all 8,500 corridor miles (approximately 15,000 circuit miles) within 90 days, costing roughly $6.4 million
Moving forward, goal is for zero On-ROW vegetation-related outages
On ROW Off ROW*
2011 0 6
2010 0 5
2009 0 6
2008 1 7
2007 1 80
2006 0 43
*Off ROW vegetation related outages are sanctionable when there is grow-into contact
2007 represents a high storm activity year
(no sanctionable / grow-into Off ROW vegetation related outages recorded between 2006 and 2009)

Transmission ROW Strategy
Revised October 2012 25 25
Planned Outage History for Vegetation Management
Downward trend for planned outages and hold orders to support vegetation maintenance work
Implies that the vegetation height and distance from the lines is more actively managed than in previous years
Target is to reduce Planned Outages (percentage to be determined)

Transmission ROW Strategy
Revised October 2012 26 26
Access Road Condition Assessment
Assets include roads (11,858 miles), culverts (9062), gates (17,459), bridges (334), and stream fords (1329)
Condition information is captured during working patrols and line maintenance activities; the data is stored in TLM Apps and input in the ARWRS (Access Road Work Request System). Conversion of these data to TAS/EGIS to be determined as part of the TAS project plan.
Condition assessment information is reasonably complete. A comprehensive reassessment and update to the data is needed to support proactive planning.
An Access Roads Work Request System (ARWRS) has been developed by TF for District Maintenance crews and is being used to identify and prioritize access roads projects system
Condition varies greatly across our system depending on terrain, weather, public access, etc.: – Ninety percent of the roads are adequate for access to patrol transmission lines with light duty
vehicles, but 50% of the access road system requires minor to major capital improvement to support the heavy equipment that may be needed for line repair, replacement, and other construction work
– As of August 2010, 867 road segments had been identified with road failures rendering the road impassable. Because the ARMS program has been retired, no updated condition information is available other than reports from working patrols. Portions of the data were migrated to eGIS in FY 2012.
Access roads easement rights fall into two categories: formal, documented rights vs. informal, undocumented rights.
– Undocumented rights present potential access issues – Unknown number of undocumented rights
Transmission ROW Strategy
Revised October 2012 27 27
Access Roads Maintenance Expenses
Maintenance of access roads has historically not been a priority because of competing, more urgent expense work needed on the ROWs. This has resulted in completion of only emergency repair work. Roads not selected for emergency repairs continue to deteriorate
Expense activities include emergency repairs caused by slides, surface rocking, gate repairs, cleaning out, repairing and replacing culverts and working patrols documenting access road conditions
Backlog of work is un-funded, and has been increasing at a rate of ~ $400K per year since 2002
Stable predictable funding level required ~ $3.5M per year in 2012 $’s

Transmission ROW Strategy
Revised October 2012 28 28
Land Management and Land Rights
ARMS: The Access Road Management System mapped all roads used by BPA, including acquired roads and roads where use is by verbal agreement only and the data was migrated to eGIS in 2011. Resources need to be dedicated to responding to "Access Road Work Requests" submitted by the districts for those roads with verbal agreements only, so that they can be reviewed to determine whether land rights should be acquired. Then the acquisitions need to be prioritized and scheduled for acquisition over a reasonable period. TER is currently developing a plan to address the backlog of acquisition work.
Trends indicate that Land Management Cases (encroachments and land use applications) have increased
in number by 48% over the last 4 years – The increase of 48% is primarily attributable to land use applications. Landowners and developers
recognize the benefit of potentially using the ROW to promote development on and off the ROW, especially where land availability is limited, and BPA's ongoing outreach programs may be successful in encouraging coordination with BPA prior to initiating any activities.
– Adding supplemental labor support over the last couple of years has helped to increase the number of Land Management Cases closed per year
– The backlog of cases continues to grow since staff cannot keep up with the increased workload To date the Natural Resource Specialists have identified 129 orchards that are not in compliance with
BPA's vegetation clearance standards. – Adding resources for a 5 year period will increase the number of orchards mitigated and reduce the backlog.
If the vegetation is regularly cleared in BPA's rights-of-ways, then the number of new non-compliance orchards is expected to be limited. The Vegetation Mitigation Process will result in a Mitigation Action Plan which could result in:
1. Entering into a new Vegetation Agreement or modifying an existing Vegetation Agreement (reducing height and/or changing species), and the Land Management Case would remain active
2. Raising towers, and entering into a new Vegetation Agreement or modifying an existing Agreement, and the Land Management case would remain active
3. BPA purchasing the right to control vegetation within the rights-of-way and removing the vegetation, or any combination of the three actions, and the Land Management Case would be closed.

Transmission ROW Strategy
Revised October 2012 29 29
Land Management and Land Rights
BPA has promoted collaborative relationships and trustworthy stewardship with
landowners. Statistics show that the percentage of parcels condemned have decreased over time. BPA strives to use condemnation as a last resort, and to ensure that all reasonable efforts have been made towards successful negotiations between the parties.
Time Regular Acquisitions Condemnations Total Parcels % Condemations1937-1962 89,074 9,962 99,036 10.06%
1963-1988 25,377 2,225 27,602 8.06%
1989-current 3,170 49 3,219 1.52%
TOTAL 117,621 12,236 129,857 9.42%
Transmission ROW Strategy
Revised October 2012 30 30
Executive Summary for Updated Strategy
What equipment and facilities are covered?
What performance objectives, measures and targets should be set?
What is the health of the assets?
What risks must be managed?
What strategies should we undertake?
What will it cost?
Program Accomplishments FY10-11
Transmission ROW Strategy
Revised October 2012 31 31
Risk Assessment and Analysis
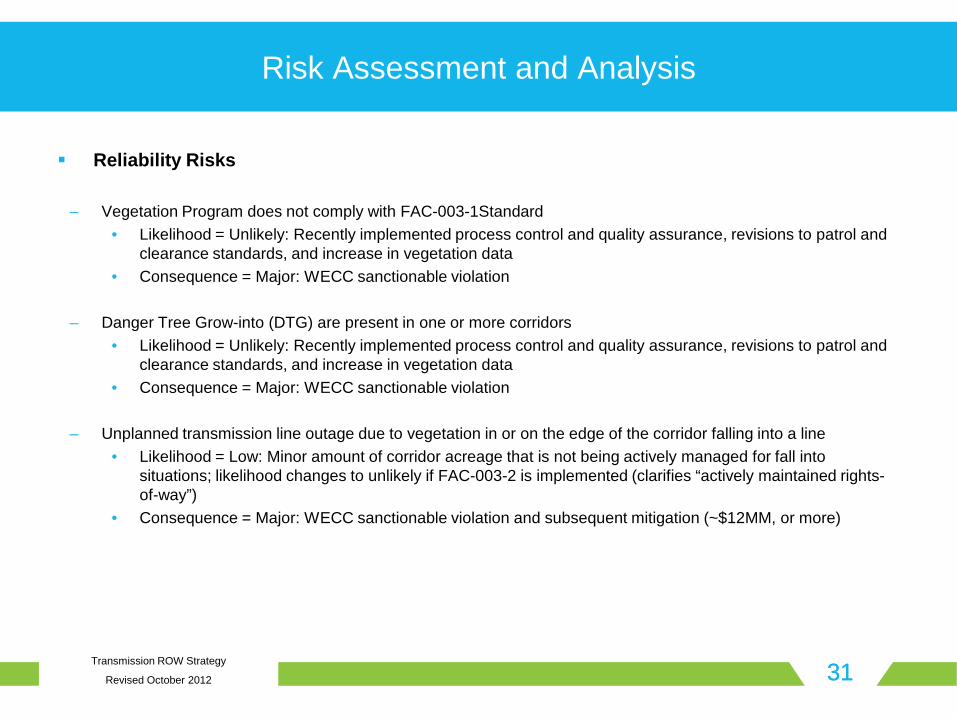
Reliability Risks
– Vegetation Program does not comply with FAC-003-1Standard • Likelihood = Unlikely: Recently implemented process control and quality assurance, revisions to patrol and
clearance standards, and increase in vegetation data • Consequence = Major: WECC sanctionable violation
– Danger Tree Grow-into (DTG) are present in one or more corridors • Likelihood = Unlikely: Recently implemented process control and quality assurance, revisions to patrol and
clearance standards, and increase in vegetation data • Consequence = Major: WECC sanctionable violation
– Unplanned transmission line outage due to vegetation in or on the edge of the corridor falling into a line • Likelihood = Low: Minor amount of corridor acreage that is not being actively managed for fall into
situations; likelihood changes to unlikely if FAC-003-2 is implemented (clarifies “actively maintained rights-of-way”)
• Consequence = Major: WECC sanctionable violation and subsequent mitigation (~$12MM, or more)

Transmission ROW Strategy
Revised October 2012 32 32
Reliability Risks (continued) Insufficient resources to complete all necessary vegetation corrections and planned maintenance
– Likelihood = Unlikely: On Rights-of-Way vegetation management activities are a high priority to fund and staff – Consequence = Major: Violation of TVMP (Transmission Vegetation Management Plan), WECC violation, possible outage, possible
accrual of deferred maintenance, potential safety hazard to the public and BPA staff
Cannot access most important transmission lines (Category 1 and 2) and structures that have roads leading to them – due to physical conditions of the roads
– Likelihood = Certain: Will happen ~ every other year depending on storm conditions and intensity – Consequence = Ranges: From no consequences to reliability, to longer duration of outage (if outage occurs)
Cannot access most important transmission lines (Category 1 and 2) and structures that have roads leading to
them – Land rights issues (land rights not acquired for access road, handshake agreement revoked by land owner)
– Likelihood = Unlikely – Consequence = Minor: For short term emergencies will use unsecured land rights; long-term would condemn; standard construction – may
prolong schedule – Culvert failure
– Likelihood = Certain: ~6 reported failures every year (road washout or road is impassible) – Consequence = Moderate: Environmental issues such as siltation of stream
– Bridge failure – Likelihood: Certain – 3-4 Issues every year (bridge no longer meets load carrying standard) – Consequence = Ranges: Inability to access the rights-of-way, may delay maintenance work projects and/or responding to outages
Risk Assessment and Analysis
Transmission ROW Strategy
Revised October 2012 33 33
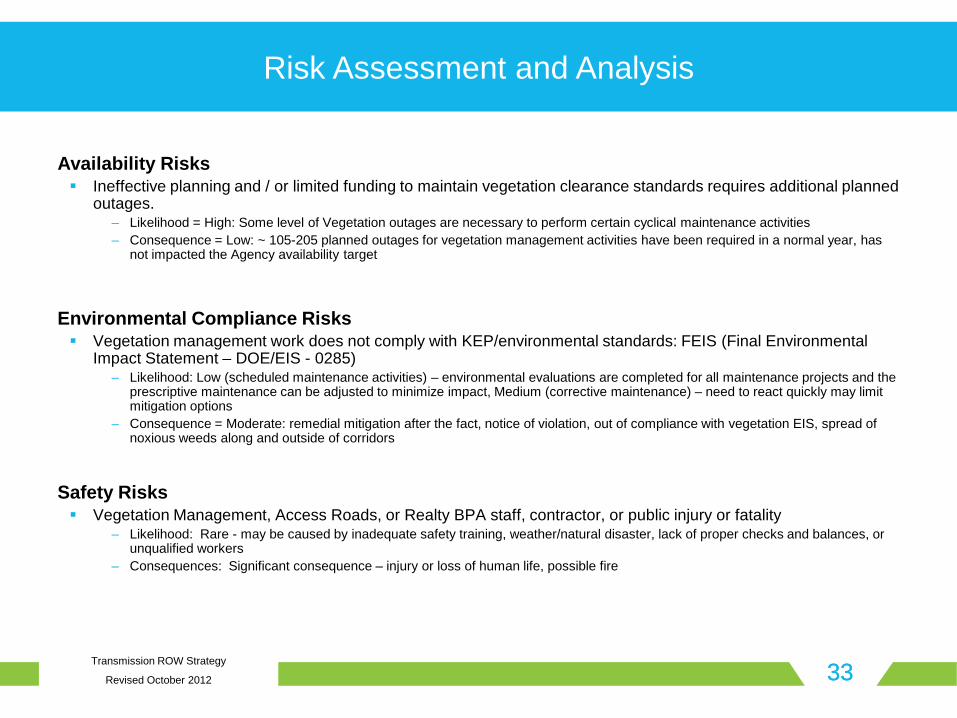
Availability Risks Ineffective planning and / or limited funding to maintain vegetation clearance standards requires additional planned
outages. – Likelihood = High: Some level of Vegetation outages are necessary to perform certain cyclical maintenance activities – Consequence = Low: ~ 105-205 planned outages for vegetation management activities have been required in a normal year, has
not impacted the Agency availability target Environmental Compliance Risks Vegetation management work does not comply with KEP/environmental standards: FEIS (Final Environmental
Impact Statement – DOE/EIS - 0285) – Likelihood: Low (scheduled maintenance activities) – environmental evaluations are completed for all maintenance projects and the
prescriptive maintenance can be adjusted to minimize impact, Medium (corrective maintenance) – need to react quickly may limit mitigation options
– Consequence = Moderate: remedial mitigation after the fact, notice of violation, out of compliance with vegetation EIS, spread of noxious weeds along and outside of corridors
Safety Risks Vegetation Management, Access Roads, or Realty BPA staff, contractor, or public injury or fatality
– Likelihood: Rare - may be caused by inadequate safety training, weather/natural disaster, lack of proper checks and balances, or unqualified workers
– Consequences: Significant consequence – injury or loss of human life, possible fire
Risk Assessment and Analysis
Transmission ROW Strategy
Revised October 2012 34 34
Risk Map – Current State (FY 2012)
A corridor assessment must be completed on the 295 corridors in order to complete a comprehensive risk assessment and risk map
Currently there is no comprehensive data set Dependencies:
Implementation of Vegetation Management system that stores corridor profile and health data
– COTS (commercial off the shelf) or in-house solution – Will require capturing corridor health data through patrols and LiDAR
Easement data resides in LIS (Land Information System) and Application Extender Tract ID can be associated with a corridor
Transmission ROW Strategy
Revised October 2012 35 35
Executive Summary for Updated Strategy
What equipment and facilities are covered?
What performance objectives, measures and targets should be set?
What is the health of the assets?
What risks must be managed?
What strategies should we undertake?
What will it cost?
Program Accomplishments FY10-11
Transmission ROW Strategy
Revised October 2012 36 36
Strategy Alternatives – Vegetation Management
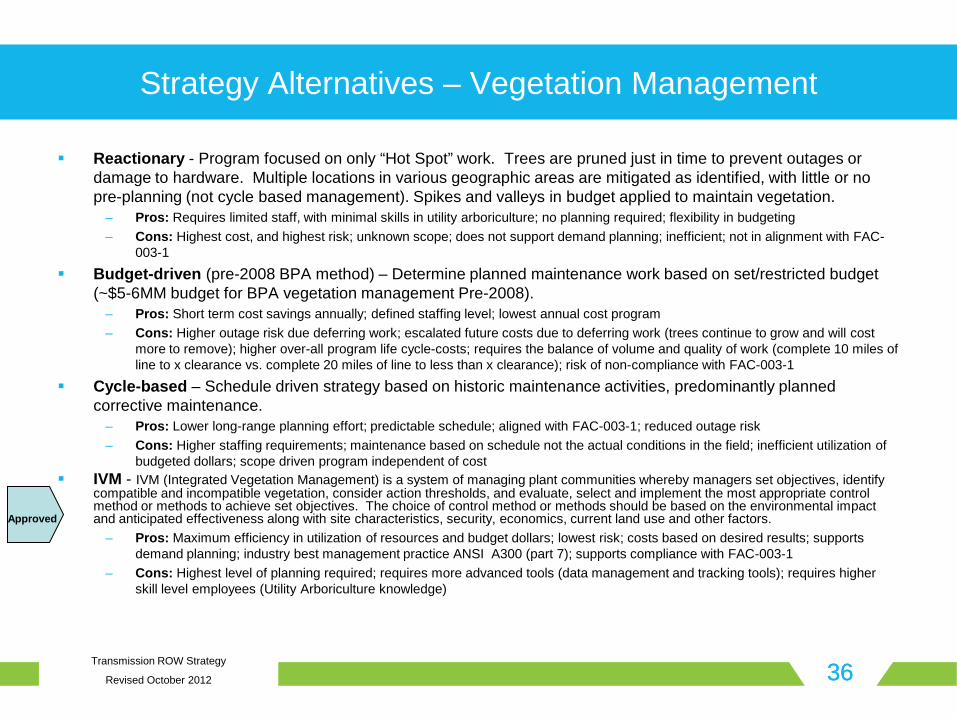
Reactionary - Program focused on only “Hot Spot” work. Trees are pruned just in time to prevent outages or damage to hardware. Multiple locations in various geographic areas are mitigated as identified, with little or no pre-planning (not cycle based management). Spikes and valleys in budget applied to maintain vegetation.
– Pros: Requires limited staff, with minimal skills in utility arboriculture; no planning required; flexibility in budgeting – Cons: Highest cost, and highest risk; unknown scope; does not support demand planning; inefficient; not in alignment with FAC-
003-1
Budget-driven (pre-2008 BPA method) – Determine planned maintenance work based on set/restricted budget (~$5-6MM budget for BPA vegetation management Pre-2008).
– Pros: Short term cost savings annually; defined staffing level; lowest annual cost program – Cons: Higher outage risk due deferring work; escalated future costs due to deferring work (trees continue to grow and will cost
more to remove); higher over-all program life cycle-costs; requires the balance of volume and quality of work (complete 10 miles of line to x clearance vs. complete 20 miles of line to less than x clearance); risk of non-compliance with FAC-003-1
Cycle-based – Schedule driven strategy based on historic maintenance activities, predominantly planned corrective maintenance.
– Pros: Lower long-range planning effort; predictable schedule; aligned with FAC-003-1; reduced outage risk – Cons: Higher staffing requirements; maintenance based on schedule not the actual conditions in the field; inefficient utilization of
budgeted dollars; scope driven program independent of cost IVM - IVM (Integrated Vegetation Management) is a system of managing plant communities whereby managers set objectives, identify
compatible and incompatible vegetation, consider action thresholds, and evaluate, select and implement the most appropriate control method or methods to achieve set objectives. The choice of control method or methods should be based on the environmental impact and anticipated effectiveness along with site characteristics, security, economics, current land use and other factors.
– Pros: Maximum efficiency in utilization of resources and budget dollars; lowest risk; costs based on desired results; supports demand planning; industry best management practice ANSI A300 (part 7); supports compliance with FAC-003-1
– Cons: Highest level of planning required; requires more advanced tools (data management and tracking tools); requires higher skill level employees (Utility Arboriculture knowledge)
Approved

Transmission ROW Strategy
Revised October 2012 37 37
Components of Integrated Vegetation Management (IVM) System
Understanding the pest and ecosystem dynamics Setting management objectives and tolerance levels Compiling treatment options Accounting for economic and ecological effects of treatments Site – specific implementation of treatments Adaptive management and monitoring
Transmission ROW Strategy
Revised October 2012 38 38
IVM Implementation Outline
Define Business requirements (completed 08/15/10) Define the changes in business practices Identify the skills required to implement Continue to seek IT capital funding for Vegetation Management System
– Prior request was not prioritized within the IT capital program for implementation TF has funded a business analyst to examine program requirements, gaps
and perform an examination of off the shelf software
Transmission ROW Strategy
Revised October 2012 39 39
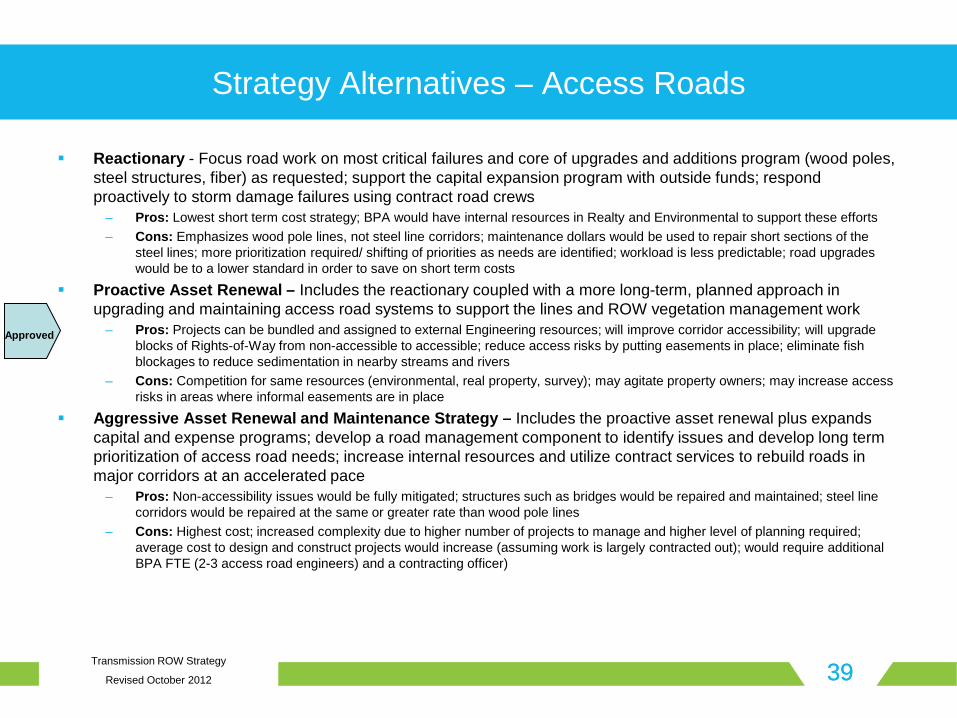
Strategy Alternatives – Access Roads
Reactionary - Focus road work on most critical failures and core of upgrades and additions program (wood poles, steel structures, fiber) as requested; support the capital expansion program with outside funds; respond proactively to storm damage failures using contract road crews
– Pros: Lowest short term cost strategy; BPA would have internal resources in Realty and Environmental to support these efforts – Cons: Emphasizes wood pole lines, not steel line corridors; maintenance dollars would be used to repair short sections of the
steel lines; more prioritization required/ shifting of priorities as needs are identified; workload is less predictable; road upgrades would be to a lower standard in order to save on short term costs
Proactive Asset Renewal – Includes the reactionary coupled with a more long-term, planned approach in upgrading and maintaining access road systems to support the lines and ROW vegetation management work
– Pros: Projects can be bundled and assigned to external Engineering resources; will improve corridor accessibility; will upgrade blocks of Rights-of-Way from non-accessible to accessible; reduce access risks by putting easements in place; eliminate fish blockages to reduce sedimentation in nearby streams and rivers
– Cons: Competition for same resources (environmental, real property, survey); may agitate property owners; may increase access risks in areas where informal easements are in place
Aggressive Asset Renewal and Maintenance Strategy – Includes the proactive asset renewal plus expands capital and expense programs; develop a road management component to identify issues and develop long term prioritization of access road needs; increase internal resources and utilize contract services to rebuild roads in major corridors at an accelerated pace
– Pros: Non-accessibility issues would be fully mitigated; structures such as bridges would be repaired and maintained; steel line corridors would be repaired at the same or greater rate than wood pole lines
– Cons: Highest cost; increased complexity due to higher number of projects to manage and higher level of planning required; average cost to design and construct projects would increase (assuming work is largely contracted out); would require additional BPA FTE (2-3 access road engineers) and a contracting officer)
Approved
Transmission ROW Strategy
Revised October 2012 40 40
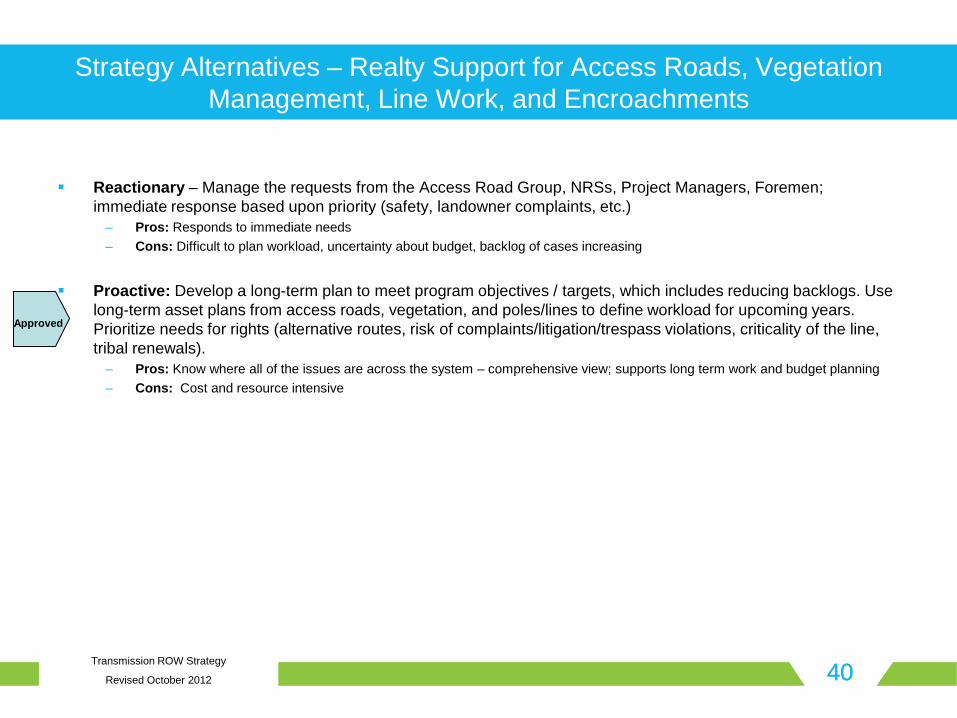
Strategy Alternatives – Realty Support for Access Roads, Vegetation Management, Line Work, and Encroachments
Reactionary – Manage the requests from the Access Road Group, NRSs, Project Managers, Foremen; immediate response based upon priority (safety, landowner complaints, etc.)
– Pros: Responds to immediate needs – Cons: Difficult to plan workload, uncertainty about budget, backlog of cases increasing
Proactive: Develop a long-term plan to meet program objectives / targets, which includes reducing backlogs. Use
long-term asset plans from access roads, vegetation, and poles/lines to define workload for upcoming years. Prioritize needs for rights (alternative routes, risk of complaints/litigation/trespass violations, criticality of the line, tribal renewals).
– Pros: Know where all of the issues are across the system – comprehensive view; supports long term work and budget planning – Cons: Cost and resource intensive
Approved
Transmission ROW Strategy
Revised October 2012 41 41
Integrated ROW Strategy - Linking the Strategies
Synchronized planning and scheduling of ROW work schedules with long-range plans for tribal renewals, line projects, vegetation management cycles, and access roads projects
Strategy components – Vegetation Management – Integrated Vegetation Management – Access Roads – Proactive Asset Renewal – Realty – Proactive
• Support IVM strategy for vegetation management and proactive strategy for Access Roads
Software solutions are required to manage data
Budgets need to be aligned with proposed strategies The wood and steel programs along with the non-vegetation management portion of ROW are
scheduled to be taken through the economic value modeling process in 2013 to identify and evaluate strategy alternatives that incorporate the integration of the three programs.

Transmission ROW Strategy
Revised October 2012 42 42
Executive Summary for Updated Strategy
What equipment and facilities are covered?
What performance objectives, measures and targets should be set?
What is the health of the assets?
What risks must be managed?
What strategies should we undertake?
What will it cost?
Program Accomplishments FY10-11

Transmission ROW Strategy
Revised October 2012 43 43
What Will It Cost?
Increase the VM program to integrate new data management tool
Move Access Roads program from emergency repairs to programmatic scheduled maintenance
Increase the Realty expense to accelerate the resolution of existing non-compliant orchards and tree agreements
– Negotiation costs BFTE – Costs Associated with buying back rights
Resource constraints on Lands based on the acceleration of line rebuild projects impacts routine
work
Increased pressure from WA Department of Natural Resources to subsidize maintenance costs (to State standards) on BPA use of roads on WA state lands (595 miles)
Transmission ROW Strategy
Revised October 2012 44 44
Highlights of differences between IPR and ROW Proactive Asset Management Strategy
Vegetation Management (TFBV) service contracts being reduced over time due to . . . – Conversion of corridors to low growing plant communities that require less costly maintenance
• Moving from reclamation activities (Heavy equipment mowing, and tree removal) to a targeted herbicide application represents a 82% reduction in costs
• Significant reduction in the amount of corrective maintenance required
– Process efficiencies gained by transitioning from a highly reactive approach to predominantly planned, preventive maintenance
Low growing plant communities reduce the time required to complete working patrols – Easier to access and observe conditions – Reduced number of items (Danger Brush / High Brush) to report
Staffing levels right-sized – Reduced reclamation work scope, maintenance project size, and corrective maintenance will drive the
reduced need for NRS Staff – Currently budgeted at 17 BFTE, future projection 14 BFTE

Transmission ROW Strategy
Revised October 2012 45 45
Final IPR Forecast – Capital as of July 2012
Understanding that changes can occur in the timing of projects for various reasons, Transmission Services is committed to managing to the annual capital budget and total 10 year forecast while still meeting the objectives of the asset management strategy.
The forecasts support wood and steel sustain programs as identified in the respective line sustain strategy in the years they are needed.
System Replacement Sustain
Strategy FY 12
3rd
Q EOY FY 13
SOY FY 14 FY 15 FY 16 FY 17 FY 18 FY 19 FY 20 FY 21 Total LR -Tribal Renewals Node 5671 $1,144 $1,261 $3,900 $5,100 $0 $0 $0 $0 $0 $0 $11,405
LR - Veg Mitigation Node 5672 $1,008 $582 $500 $500 $500 $500 $500 $500 $500 $500 $5,590
LR - Access Roads Node 5673 $2,871 $5,819 $4,308 $4,396 $2,850 $2,850 $500 $500 $500 $500 $25,094 Sub-total $5,023 7,662 8,708 9,996 3,350 3,350 1,000 1,000 1,000 1,000 $42,089
ROW - Access Roads for Sustain $14,698 $12,706 $11,116 $10,900 $10,100 $10,935 $7,679 $7,679 $7,679 $7,679 $101,171
ROW - Access Roads $1,186 $2,242 $3,447 $2,670 $3,475 $2,648 $2,648 $2,648 $2,648 $2,648 $26,260 Sub-total $15,884 $14,948 $14,563 $13,570 $13,575 $13,583 $10,327 $10,327 $10,327 $10,327 $127,431
Total $20,907 $22,610 $23,271 $23,566 $16,925 $16,933 $11,327 $11,327 $11,327 $11,327 $169,520

Transmission ROW Strategy
Revised October 2012 46 46
Capital Cost Estimates -Assumptions
Access roads capital required for services reflects the growth of the external design and construction contract program
Out year projections are 4 construction projects per year Out year projections are 4-6 design projects per year Increased construction services costs for inspection in the wood pole replacements program is
anticipated Supplemental labor costs are for CFTE and inspection services No additional BFTE needed to support additional Access Roads Expense work FY15 forward - annual overtime for capital work will have a maximum cap assigned Capital estimate includes approximately $2M each year for environmental support for upgrades
and the wood and steel programs. These costs are currently being incurred by the ROW program. It is expected these costs will increase as the identification of work associated with environmental compliance becomes better known.
Capital for Access Road construction and easements is driven by the level of construction activities within the Steel and Wood Line sustain programs expected over the next 5 years.

Transmission ROW Strategy
Revised October 2012 47 47
Expense Cost Estimates for Recommended Strategies
FY 2012 FY 2013 FY 2014 FY 20154-Year Total FY 2016 FY 2017 FY 2018 FY 2019
8-Year Total
Rights of Way Maintnenance 8.1 8.4 8.4 8.6 33.5 8.8 8.9 9.1 9.1 69.4 Vegetation Management 16.6 16.8 17.1 17.5 68.0 17.8 18.1 18.4 18.6 140.9
Current rate period Next rate period
-
2.0
4.0
6.0
8.0
10.0
12.0
14.0
16.0
18.0
20.0
FY 2012
FY 2013
FY 2014
FY 2015
FY 2016
FY 2017
FY 2018
FY 2019
Rights of Way Maintnenance
Vegetation Management
Transmission ROW Strategy
Revised October 2012 48 48
Executive Summary for Updated Strategy
What equipment and facilities are covered?
What performance objectives, measures and targets should be set?
What is the health of the assets?
What risks must be managed?
What strategies should we undertake?
What will it cost?
Program Accomplishments FY10-11

Transmission ROW Strategy
Revised October 2012 49
ICSS Scope Progress Update FY10 Capital Program Accomplishments
FY10 Program Work Planned Work Accomplished
Explanation for Variance
• LR Tribal Renewals
• LR Veg Management
• LR Access Roads
• Access Roads
Flathead and Warm Springs Start up of program; planned for 10 buybacks Plan was supporting Access road group Scheduled to complete 11 ongoing AR projects in support of Wood, Steel, and AR Upgrades.
100% completed We accomplished 3 buybacks our first year. All work was accomplished Completed 11 AR projects in support of Wood, Steel, and AR Upgrades
n/a The buybacks were substantially under-estimated in terms of dollars and man power to accomplish. n/a Minor variation in actual project costs.
Rights-of-Way Plan vs. Actuals, FY 10 ( $000s) FY 10 Plan FY 10 Actuals
LR Tribal Renewals $18,677 $18,677 LR Veg Mitigation $234 $228 LR Access Roads $760 $760 Access Roads $9,283 $9,900
Total Capital Plan $28,954 $29,565

Transmission ROW Strategy
Revised October 2012 50
ICSS Scope Progress Update FY11 Capital Program Accomplishments
FY11 Program Work Planned Work Accomplished
Explanation for Variance
• LR Tribal Renewals
• LR Veg Management
• LR Access Roads
• Access Roads (AR)
Renewals for Flathead and Muckelshoot 12 planned buybacks 38 planned roads to acquire Scheduled to complete 20 ongoing AR projects in Support of Wood, Steel, and AR Upgrades.
Flathead was accomplished 9 buybacks accomplished 70 % was accomplished Completed 19 AR projects in Support of Wood, Steel, and AR Upgrades.
Discussion on Muckelshoot ROW renewal on tribal lands continue 2 deferred for condemnation 30% unaccomplished due to resources Bandon Rogue project contract spent less in FY 11 and remainder was moved into FY 12.
Rights-of-Way Plan vs. Actuals, FY11 ( $000s)FY 11 Plan FY 11 Actuals
LR Tribal Renewals $2,263 $1,577
LR Veg Mitigation $1,156 $1,027
LR AccessRoads $3,540 $2,958
Access Roads $13,094 $12,114
Total Capital Plan $20,053 $17,676

Transmission ROW Strategy
Revised October 2012
APPENDIX

Transmission ROW Strategy
Revised October 2012 52
Summary of Historical ROW Capital Spend
$ 17,676,448 $ 29,537,516 $ 22,205,941 $ 2,732,469 $ 2,534,047 $ 1,995,605 ActualsFY Total
$ 20,052,679 $ 28,953,877 $ 21,606,974 $ 3,036,871 $ 983,299 $ 3,002,218 FundingFY Total
$ 36,005,673 $ 12,113,916 $ 9,872,674 $ 7,679,355 $ 2,249,217 $ 2,312,305 $ 1,778,206 Actuals
$ 35,564,852 $ 13,093,521 $ 9,283,096 $ 7,080,388 $ 2,553,618 $ 761,557 $ 2,792,672 Funding0005193 - Access Roads
$ 4,159,116 $ 2,958,037 $ 760,036 $ 106,367 $ 102,879 $ 77,013 $ 154,784 Actuals
$ 4,741,111 $ 3,540,002 $ 760,066 $ 106,367 $ 102,879 $ 77,013 $ 154,784 Funding0005673 - LR Access Roads
$ 1,255,056 $ 1,027,470 $ 227,586 Actuals
$ 1,390,000 $ 1,156,073 $ 233,927 Funding0005672 - LR Veg Mitigation
$ 35,416,965 $ 1,577,025 $ 18,677,220 $ 14,420,219 $ 380,373 $ 144,729 $ 217,399 Actuals
$ 35,939,955 $ 2,263,083 $ 18,676,788 $ 14,420,219 $ 380,374 $ 144,729 $ 54,762 Funding0005671 - LR Tribal Renewals
TOTAL201120102009200820072006Node
Note: 2006 – 2009 dollars are not shown for 0005672 because there was not a program under the existing tree structure for those years. Land rights in support of vegetation mitigation were funded out of nodes 1060 and 1061 in the old tree structure and charges are lumped together with other project costs.

Transmission ROW Strategy
Revised October 2012 53 53
Access Roads Historical Capital Expenditures (FY01-FY11)
Sustain program approved July, 2008
Access Road Historical Capital Expenditures (FY01-FY11)
$0
$1,000,000
$2,000,000
$3,000,000
$4,000,000
$5,000,000
$6,000,000
$7,000,000
$8,000,000
$9,000,000
$10,000,000
2001 2002 2003 2004 2005 2006 2007 2008 2009 2010
PAR Funding
Actuals
2011
$11,000,000
$12,000,000
$13,000,000

Transmission ROW Strategy
Revised October 2012 54 54
Historical Vegetation Management Expenses
$22.1
$28.5
$14.6
$28.4
$34.60
0
5
10
15
20
25
30
35
40
2007 2008 2009 2010 2011
Fiscal Year
Millio
ns $
Contract Vegetation Management Internal Vegetation Management
2007 2008 2009 2010 2011
Contract Vegetation Management $5.9 $12.2 $21.6 $17.7 $11.4
Internal Vegetation Management $8.7 $16.2 $13.0 $10.8 $10.7
Total Veg. Expense $14.6 $28.4 $34.6 $28.5 $22.1
Transmission ROW Strategy
Revised October 2012 55 55
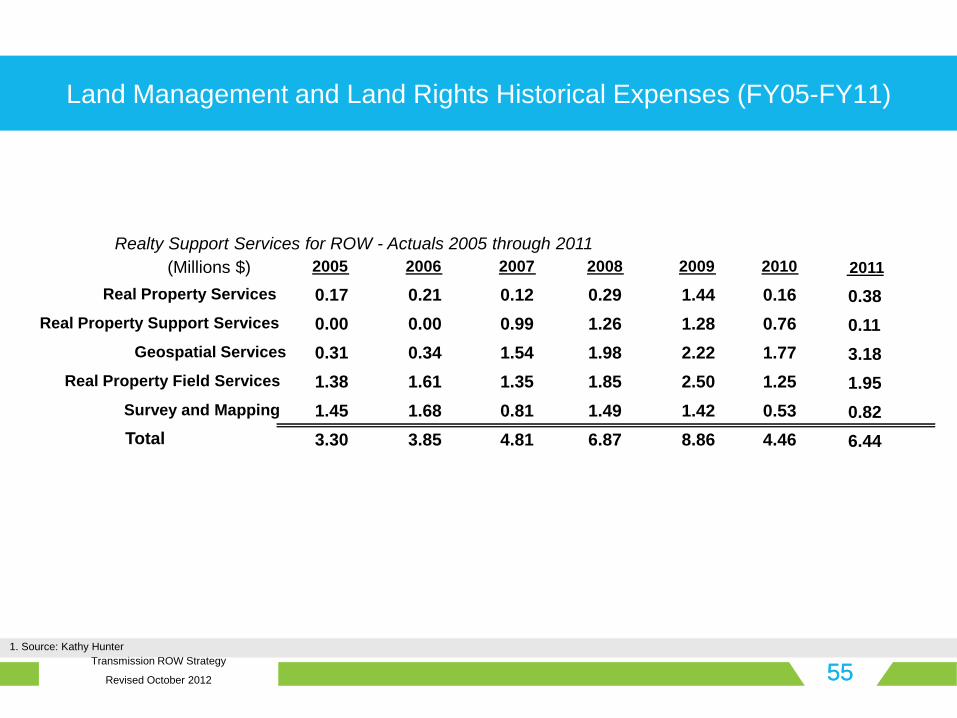
Land Management and Land Rights Historical Expenses (FY05-FY11)
1. Source: Kathy Hunter
Realty Support Services for ROW - Actuals 2005 through 2011
(Millions $)
0.17 0.21 0.12 0.29 1.44 0.16
0.00 0.00 0.99 1.26 1.28 0.76
0.31 0.34 1.54 1.98 2.22 1.77
1.38 1.61 1.35 1.85 2.50 1.25
1.45 1.68 0.81 1.49 1.42 0.53
3.30 3.85 4.81 6.87 8.86 4.46
1000000
Real Property Support Services
Total
Geospatial Services
Real Property Field Services
Survey and Mapping
2009 2010 2005 2006 2007 2008
Real Property Services 0.38
0.11
3.18
1.95
0.82
6.44
2011