suspended sediments in a macrotidal estuary: comparison and use...
TRANSCRIPT

OCEANOLOGICA ACTA · VOL. 23 – N° 3
Suspended sediments in a macrotidalestuary: comparison and use of different sensorsMichel LUNVEN *, Patrick GENTIEN
Ifremer, Centre de Brest, DEL/EC/PP, BP 70, 29280 Plouzane, France
Received 20 July 1999; revised 18 September 1999; accepted 18 September 1999
Abstract – Measurements made using an in situ particle-sizer (PSA) were compared to those of an opticalbackscatter sensor (OBS) in a macrotidal estuary. Both estimate the total volume of particles. After comparisonwith dry weight of suspended matter sampled in the study area, the different measurements were converted intodry weight. In three different kinetic energy regimes, times series were coherent for most of the observations.Discrepancies of suspended sediment concentrations estimated by both sensors appeared under specific hydrody-namic conditions: they were related to occurrences of definite particle populations. Overestimations andunderestimations of measurements by the instruments depend on the optical principles of the sensors (backscat-ter and diffraction). Flocs appearing at low tide with low currents are detected by the PSA and not detected bythe OBS which is more sensitive to finer particles and re-suspension of sedimentary particles from the bed,induced by high current velocities during flood tide. © 2000 Ifremer/CNRS/IRD/Editions scientifiques etmedicales Elsevier SAS
aggregates / suspended particulate matter / particle size
Resume – Matieres en suspension dans un estuaire a fort marnage : comparaison de differents capteurs. Desmesures acquises dans un estuaire a fort marnage par un analyseur de taille de particules in situ (PSA) ont etecomparees aux mesures obtenues par un capteur de charge particulaire par retrodiffusion (OBS). Tout commece dernier, le PSA estime le volume total de particules. Apres comparaison des donnees acquises avec desmesures de poids secs de matieres en suspension sur des prelevements echantillonnes dans la zone d’etude, lesseries temporelles issues des capteurs ont ete converties en series de poids secs. Pour trois coefficients de marnagedifferents, les resultats sont coherents pour la plupart des observations. Des ecarts de mesure de matieres ensuspension calcules par les deux capteurs apparaissent dans des conditions hydrodynamiques specifiques et sontrelies a l’apparition de populations de particules precises. Les surestimations ou sous-estimations par les deuxinstruments dependent des principes optiques des capteurs (retrodiffusion et diffraction). Les agregats, apparais-sant a basse mer par courants faible, sont detecte par le PSA et invisibles a l’OBS qui est plus sensible a certainesparticules plus fines et aux remises en suspension de particules sedimentaires du fond, generees par les fortscourants de maree montante. © 2000 Ifremer/CNRS/IRD/Editions scientifiques et medicales Elsevier SAS
agregats / matieres en suspension / taille de particule
1. INTRODUCTION
Understanding sedimentary transport in estuarine en-vironments requires in situ acquisition of time seriesof particles quantities. Numerous methods and in-
struments have been developed to quantify suspendedparticulate matter in seawater. Among them, sensorssuch as the OBS [6] or transmissometers are wellknown and often used in hydrodynamic studies. Theygive satisfactory and reliable results in most cases.
However, in many cases, a quantitative study is notsufficient: it is recognized that the nature of the* Correpondence and reprints : [email protected]
245© 2000 Ifremer/CNRS/IRD/Editions scientifiques et medicales Elsevier SAS
PII: S0399-1784 (00 )00126-2/FLA

M. LUNVEN, P. GENTIEN / Oceanologica Acta 23 (2000) 245–260
Figure 1. Elorn estuary and mooring locations ().
particles varies according to the physical (current,salinity), and chemical (organic matter) environment.In estuarine waters, aggregates, consisting of organicand inorganic components, can be observed accord-ing to specific conditions [2, 7, 19, 22] or locatedwithin thin layers in the water column [25].
These large-size particles offer to bacteria a growingsubstrate. They also have an important role in thetransport of hydrophobic contaminants. Such sus-pended particles aggregated into flocs, are very fragileand are often broken when sampled with a Niskinbottle [15]. Thus, it is very difficult to obtain repre-sentative granulometric measurements from samplesanalysed after collection.
In marine studies, investigation on particle sizes re-quires the use of sensors able to measure directly thein situ granulometric distribution [1, 2, 14]. Based onthe principle of diffraction, those instruments investi-gate size spectra of particles without modifying theirstructures.
Recently, technological advances in photography andvideomicroscopy have significantly improved ourability to study sedimentary transport and particlesinvestigations in seawater. These techniques allow insitu visualization of the particles. Several scientificgroups have already successfully applied these tech-
niques in marine or coastal environments [8, 17, 18].Digitalizations and data-processing treatment of theimages obtained in the field allow a qualitative andquantitative evaluation of the particles. It is oftenessential to build a mechanical unit for slowing downthe particles in order to obtain a good surface estima-tion [12, 23]. However, these techniques are not easilyapplicable to the detection of particles smaller than20 mm diameter.
The development of new techniques has also led toproblems of calibration and intercomparison. Eismaet al. [11] compared in the Elbe river, eight differentmethods for quantification of suspended particles.Their results showed that the response of the sensorswas dependent on the characteristics (size, density,shape) of the particles. Laboratory studies showedthe limits and the inaccuracies of the OBS for somecategories of particles. For calibrated glass grains, aninverse relationship was found between OBS mea-surement and the size of the grains [5]. Gibbs andWolanski [16] have shown an underestimation of150 % by OBS due to flocs. For OBS, interferencesmay also be due to biological material in coastalwaters [21]. Conversely, the diffraction method seemsto be very sensitive to the presence of large sizeparticles found in the stratified water column ofcoastal areas [14].
246

M. LUNVEN, P. GENTIEN / Oceanologica Acta 23 (2000) 245–260
The present study describes in situ experiments show-ing measurement discrepancies between two sensors,OBS (backscatterance method) and the CILAS parti-cle size analyser (diffraction method) [14]. Threetime-series of granulometry and suspended sedimentconcentration have been acquired in three differentkinetic energy regimes and total suspended sedimentconcentration estimated by optical backscatter sensorare compared to the results from the IFREMER-CILAS particle-size analyser.
2. MATERIALS AND METHODS
Experiments were conducted in the mid channel ofElorn river (Bay of Brest) which is oriented NE–SW(figure 1). Tidal range in this estuary is 7.4 m duringspring tides and 2.3 m during neap tides. Tide ispurely semi-diurnal. The drainage basin is 403 km2
and its averaged annual flow is 5.7 m3·s−1. In thisestuary, sediments are of alluvial origin and aremainly composed of quartz, mica, chlorite, kaoliniteand illite. A large mud flat is located on the northbank of the river.
Size distribution of particles was measured by PSA[14]. Particles were analysed in a measurement cell, of30 mm light pathlength. The radial dispersion ofenergy is measured by a 17-photosensor board whichgives the relative abundance of 30 size classes (upperdiameter limits: 0.7, 0.9, 1, 1.4, 1.7, 2, 2.6, 3.2, 4, 5, 6,8, 10, 12, 15, 18, 23, 30, 36, 45, 56, 70, 90, 110, 135,165, 210, 260, 320 and 400 mm). A detector in theoptical axis gives a measurement of the laser beamtransmission which can be related to particle load.From the total energy scattered in the angular sector,it is possible to compute an estimation of the totalvolume of particles. Calibrations with unimodal pop-ulations of calibrated beads have already been real-ized [14]. A good relationship was found between thetotal load criterion estimated by the PSA and thetotal volume of the particles present.
The PSA has a 48 h autonomy. Data, acquired at 15s rate, are stored in a Save Random Access Memorywith a total capacity of 8 MegaBytes allowing thestorage of 190 000 particle-size measurements. PSAwas placed at 0.5 m from the bottom. Additionalsensors were also placed at 0.5 m from the bottom: aSeacat probe (Sea-Bird Electronics) provided syn-
chronous measurements of temperature, salinity,pressure and OBS, and an electromagnetic current-meter (InterOcean S4) was moored at 10 m distancefrom the PSA and the SEACAT probe.
Sensors acquired data during 24-h periods duringdifferent tidal regimes. During spring 1994, 3 time-series were acquired:
13–14 April 1994: mean tidal range; 5 566measurements
27–28 April 1994: high tidal range (spring tide); 5 636measurements
2–3 June 1994: low tidal range (neap tide); 6 052measurements
For sensors calibration and microscopic observa-tions, water samples were taken near the mooringstation with a horizontal Niskin sampling bottle,automatically closed at 0.5 m above the bottom.Samples were filtered on GF/F filters pre-combustedat 450 °C (2 h), pre-weighted and dried at 60 °C for24 h.
3. RESULTS
Time-series (figures 2–4) were synchronised againsttidal hour for improving data visualisation and inter-pretation. Large variations can be detected especiallyduring high kinetic energy periods occurring duringspring tide (figure 4). During neap tides (figure 2), thelow energy induced very small variations in salinitybetween high and low tide into the bottom layer:vertical mixing was very limited. By contrast, duringspring tide, due to increased vertical mixing, lowsalinities were observed in the bottom waters. A tidalasymmetry was observed with higher current speedsinto the bottom layer at flood tide.
3.1. Measurement validation
Before any analysis, the data obtained from the parti-cle size analyzer were validated. The computed grainsize distributions are reliable when the transmissionmeasurements are greater than 40 % [3, 14]. Forlower values, particle load is too high and the calcu-lated size distributions are skewed. Thus, some mea-surements obtained during the high tidal range werenot taken into account in the analysis.
247

M. LUNVEN, P. GENTIEN / Oceanologica Acta 23 (2000) 245–260
Figure 2. Time-series for a neap tide (tidal coefficient 45): (a) Water height, (b) Current speed at 0.5 m above bottom, (c) Cumulativevolume of particles for 4 size classes fB10, 10BfB70, 70BfB210 and f\210 mm) (d) OBS, (e) salinity. (a.u. units are arbitrary unitsrelative to each sensor).
248

M. LUNVEN, P. GENTIEN / Oceanologica Acta 23 (2000) 245–260
Figure 3. Average tidal coefficient time-series (80) (Same legend as figure 2).
249

M. LUNVEN, P. GENTIEN / Oceanologica Acta 23 (2000) 245–260
Figure 4. Spring tide time-series (Same legend as figure 2).
250

M. LUNVEN, P. GENTIEN / Oceanologica Acta 23 (2000) 245–260
Figure 5. Suspended sediment concentrations and OBS estimates.
Figure 6. Suspended sediment concentrations and PSA estimates.
First data examination was made by grouping differ-ent size classes of particles. All data were gatheredinto four empirical classes: particles smaller than10 mm because of their low settling rate, particlesbetween 10 and 70 mm (silt), the largest particles wereseparated into two classes (above and below 210 mm)because of their different behaviours and occurrences.
3.2. Sensors calibration
Sensors were calibrated against the dry weights of 60samples taken during data acquisition at regular timeintervals (15 or 30 min depending on the time-series).
The following correlations between suspended sedi-ment concentration (S.S.C.) and sensors data wereestablished (figures 5 and 6) for the two methods:
for the diffraction-sensor (PSA)
S.S.C. (mg·L−1)
= (5.03* PSA)
−1.42 (corr. coeff: 0.89−N samples: 60)
for the backscatter-sensor (OBS)
S.S.C. (mg·L−1)
= (0.122* OBS)
−1.47 (corr. coeff: 0.87−N samples: 60)
These equations have been applied to the 3 time-series of acquired data in order to obtain calculatedsediment concentration in mg·L−1, for both sensors.Figure 7 represents a superposition of estimated dryweights time-series for the mean tidal range. Thesedry weight calibrations are simply indicative sincebottle and sensor sampling are not related to thesame scale. However, for ease of discussion, the twosensors are compared later from their results ex-pressed in terms of equivalent dry weight.
3.3. Differences in calculated particle quantities
From the calculated dry weight series, it is possible toestablish the differences in estimations by OBS minusestimations by PSA (D=SSCOBS−SSCPSA) ex-pressed in equivalent dry weight.
The results of the calculated differences are presentedin figure 8 for each tidal range. The correspondingwater depths are also drawn on the graphs. Theresponses of both sensors are in accordance. Despitesome differences in response, the two sensors givecoherent results, the histogram of D (not shown) issymmetric and centred at –0.8 mg·L−1 equivalent,80 % of the 16 200 measurements are comprised inthe range 95 mg·L−1. This range is used as theoperational significance level of the bias between thetwo sensors.
251

M. LUNVEN, P. GENTIEN / Oceanologica Acta 23 (2000) 245–260
Figure 7. Comparison of OBS and PSA time-series at medium energy tide.
However, at times, either negative or positive differ-ences occur:1. Neap tide (figure 8a): OBS never over-estimates
relatively to the PSA, but significant over-esti-mations by PSA appear throughout the cycle,especially around low tide.
2. Medium tidal range (figure 8b). For these series,the calculated differences are either positive ornegative. OBS measures more particles thanPSA during flood. PSA estimates more particlesthan OBS around the end of ebb tide.
3. Spring tide (figure 8c). The measurement cycleobtained at high tidal range, shows significantdifferences between the sensors: OBS giveshigher measurements than PSA at the end offlood tide. As for the low tidal range, PSA de-tects more volume of particles than OBS aroundlow tide.
Generally, the OBS over-estimation of particle con-centration increases with the tidal energy. Theseover-estimations always occur at the end of theflood. On the other hand, over-estimations by PSAcompared to OBS occur mainly around ebb tide.Over-estimations by PSA do not seem to be relatedto high tidal energy.
3.4. Particle quantities estimation and grain sizedistribution relationship
The differences in measurement by the instrumentsoccur under special conditions related to the hydro-dynamics and the hydrology of the estuary. Theycould be related to specific particle populations inthe estuary.
Analysis of the grain-size distribution time-series re-vealed that differences in total quantity estimationswere related to size classes histograms measured byPSA.
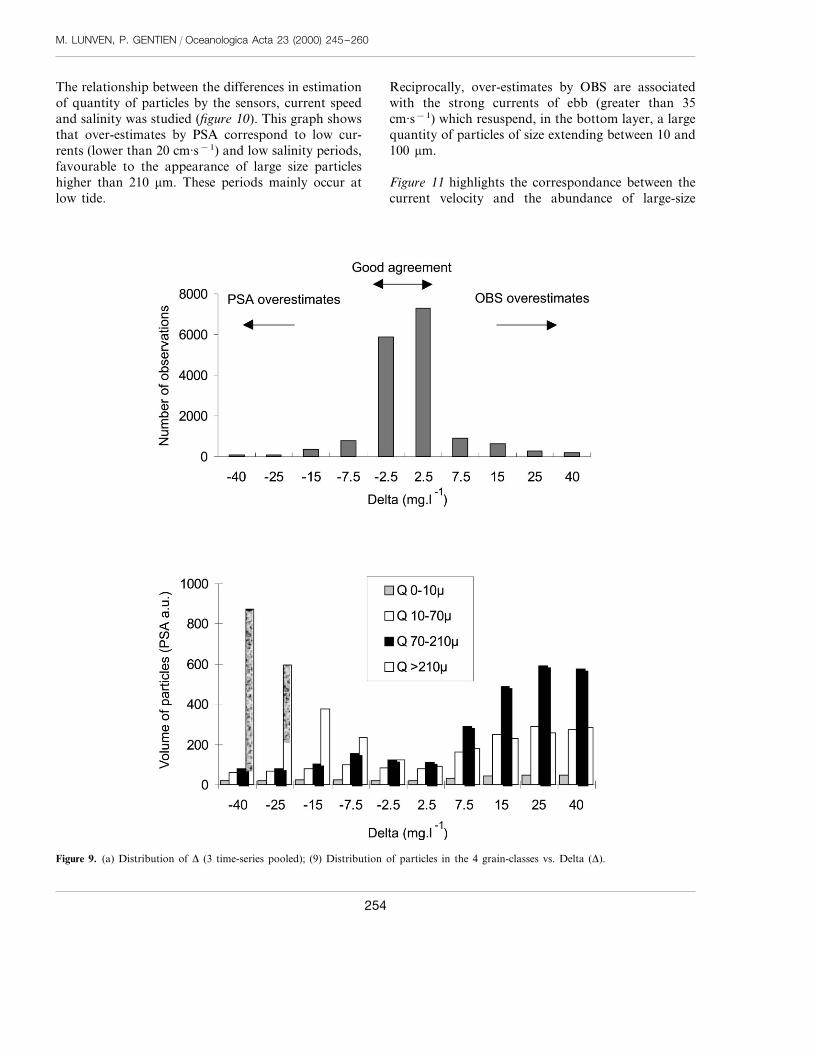
All measurements from the three time-series consid-ered together, dry weight differences (D) wereclassified into 10 classes (figure 9a). Negative valuesof D correspond to an overestimation of PSA rela-tively to OBS and conversely, the positive valuesresult from an overestimation of OBS sensor.
This graph highlights a good coherence between thetwo sensors, since the majority of the observations(80 %) gives a D comprised between 95 mg·L−1.However, large positive or negative differences mayoccur.
An analysis of particle-size distributions allows usto classify D as a function of the average contribu-
252

M. LUNVEN, P. GENTIEN / Oceanologica Acta 23 (2000) 245–260
Figure 8. (D=SSCOBS−SSCPSA) time-series and water height (lower line): (a) neap tide; (b) average tidal range; (c) spring tide.(Measurements of D in the shaded area are not significantly different from 0 at 80 % confidence.)
tions of the four main size classes definedabove (figure 9b). The relative contribution ofthe 4 particle classes shows a smooth evolut-ion from negative to positive D. Maximum over-estimation by PSA corresponds to a high abun-dance of particles larger than 210 mm. Over-esti-mates by OBS are related to an increase in thequantity of the particles ranging between 10 and210 mm.
3.5. Relationship between sensor differences,quantities of particles by classes, current speed andsalinity
The occurrences of good or bad agreement between thetwo sensors vary according to the tidal kinetic energy.The discrepancies therefore, seem to be related to thestrength of the marine currents generated in theestuary.
253
M. LUNVEN, P. GENTIEN / Oceanologica Acta 23 (2000) 245–260
The relationship between the differences in estimationof quantity of particles by the sensors, current speedand salinity was studied (figure 10). This graph showsthat over-estimates by PSA correspond to low cur-rents (lower than 20 cm·s−1) and low salinity periods,favourable to the appearance of large size particleshigher than 210 mm. These periods mainly occur atlow tide.
Reciprocally, over-estimates by OBS are associatedwith the strong currents of ebb (greater than 35cm·s−1) which resuspend, in the bottom layer, a largequantity of particles of size extending between 10 and100 mm.
Figure 11 highlights the correspondance between thecurrent velocity and the abundance of large-size
Figure 9. (a) Distribution of D (3 time-series pooled); (9) Distribution of particles in the 4 grain-classes vs. Delta (D).
254

M. LUNVEN, P. GENTIEN / Oceanologica Acta 23 (2000) 245–260
Figure 10. Plot of current speed (0.5 m above sediment) andsalinity vs. delta (D).
particles under neap tide conditions. A current speedthreshold (20 cm·s−1) can then be defined. Below thisvalue, a strong abundance of particles of size higherthan 210 mm can be observed.
Inversely, for the spring tide time-series (figure 12),particles in the range size between 70 and 210 mmbecome abundant above a speed threshold of20 cm·s−1.
Figure 13 confirms the relationship between the currentvelocities and the differences in the estimation ofsuspended particulate matter by the sensors, for thethree time-series. This graph presents a velocitythreshold of 20 cm·s−1. Below this value, the PSAover-estimates the values of quantity of particles com-pared to the OBS. For higher values, the OBS is moresensitive than the PSA to the types of the particlespresent in the estuary.
Figure 11. Volume of large particles above 210 mm vs. current speed (neap tide).
255

M. LUNVEN, P. GENTIEN / Oceanologica Acta 23 (2000) 245–260
Figure 12. Volume of particles between 70 and 210 mm vs. current speed (spring tide).
4. DISCUSSION
Microscopic observations were performed from sam-ples taken under various tidal conditions. A corre-sponding sample to the period of over-estimation bythe OBS (figure 14a) was composed of sedimentaryparticles of small size (50–100 mm) with a largeabundance of refractive particles. These particles areprimarily micas: particles of high density re-sus-pended from the bed by strong currents. They have ahigh specularity, and thus, their abundance will bewell measured by a sensor based on the principle ofretrodiffusion like the OBS.
In the same way, microscopic observations were car-ried out on samples corresponding to periods ofover-estimation by PSA (figure 14b). Morphometricmeasurements reveal the presence of organic aggre-
gates of size ranging between 300 and 1000 mm.Gibbs and Wolanski [16] reported on the limitationsof the backscattering sensors for translucent and notvery refractive particles such as large flocs. PSA, onthe other hand, is particularly sensitive to this type ofparticles. From our measurements, it appears that thefavourable tidal times for the formation of organicaggregates are low current and low salinity periodswhich occur in the estuary around ebb tide. In theElbe estuary, Pfeiffer [20], using a video system,reported that after ebb slack tide the number of thevisible flocs increases. Using a video camera devel-oped by the Netherlands Institute for Sea Research inthe Elbe estuary, Eisma and Kalf [10] also detectedthe presence of large flocs in the bottom layer at slacktide in Elbe estuary. All the material is then concen-trated in flocs with nearly clear water in between,
256

M. LUNVEN, P. GENTIEN / Oceanologica Acta 23 (2000) 245–260
resulting in the low turbidity and low weight. Thoseflocs are made of organic matter associated withmineral particles. They contain a high percentage ofwater. Thus they have a very low density. Individualfloc data obtained with the in situ video cameraINSSEV in the Elbe river show that the density of theparticles is inversely proportional to their volume[13]. In our study, calculated dry weights of samplescontaining large amounts of aggregates are thereforeoverestimated. One solution to this problem could bethe use of two calibration curves, one for smallelementary particles and one for aggregates. Howeversampling for aggregates is difficult to realize.
Processes of aggregations and disaggregations of par-ticles have been studied for several years. Our resultsare in agreement with the studies of Eisma [7, 9] and
experiments of Burban et al. [4] which showed thatthe average size of the flocculates decreased when thecurrent velocity and the salinity increased. In ourcase, during high tidal energy periods, mixing gener-ated by the flood currents causes the re-suspension ofsedimentary particles from the bed. Low salinity fa-vours flocculation but high current velocities breakup large aggregates (Van Leussen, [24]). These au-thors demonstrated a relationship between abun-dance and size of macroflocs and the variations in theKolmogorov microscale.
In this study, we showed that large aggregates, in thebottom layer, disappear above a threshold of20 cm·s−1 (0.5 m above sediment) probably in rela-tion to the reduction in size of the smallest eddiesallowed by the Kolmogorov microscale.
Figure 13. Scatter plot of D vs. current speed (all data pooled).
257

M. LUNVEN, P. GENTIEN / Oceanologica Acta 23 (2000) 245–260
Figure 14. (a) sample collected during high current speed period; (b) organic aggregates sampled at low tide.
5. CONCLUSIONS
Generally, OBS and PSA gave comparable results.The differences in particle quantities appeared underconditions related to the hydrodynamics and the
hydrology of the estuary. The OBS was particularlysensitive to some small sedimentary particles, whilethe PSA was sensitive to organic aggregates notdetected by the OBS. This is due to the differentoptical principles. It is difficult to select the best
258

M. LUNVEN, P. GENTIEN / Oceanologica Acta 23 (2000) 245–260
probe according to the most realistic results. Qualityand volume of particles have a great influence on thesensors’ responses. This study shows that both instru-ments are complementary. The difference in sus-pended sediment concentrations estimated by OBSand PSA can be considered as a new parameterrelated to the types of suspended particles. Thisparameter allows the detection of the periods ofresuspension of sedimentary particles from the bed bythe currents and the detection of the flocculationperiods. Tides and hydrodynamic conditions have animportant effect on particle behaviour.
Results show that the observed discrepancies occur inspecific hydrodynamic conditions. Differences ob-served are due to the optical principles of the instru-ments which are more or less sensitive to the size, thestructure, the shape and the composition of the parti-cles. Microscopic observations in water samplesconfirmed the relationship between the sensitivity dif-ferences of the sensors and the observed particles.The association of two different measurement meth-ods (backscatterance and diffraction) offers an obvi-ous benefit in estuarine field studies.
Further studies on covariances of the different size-classes could provide information on relationships ofparticles within a given size range with the hydro-dynamical conditions, and therefore, on their densi-ties and their types. These parameters are essential inview of modelling realistic particle behaviour [4, 24].
Acknowledgements
This study was funded by IFREMER. The authors thank MsM.-M. Danielou who performed the image analyses, Mr E. Le Galland Ms A. Youenou for their contribution to the field work.
REFERENCES
[1] Agrawal Y.C., Pottsmith H.C., Autonomous long-term insitu particle sizing using a new laser diffraction instrument,Proc. Oceans 89 (3) (1989) 1575–1580.
[2] Bale A.J., Morris A.W., In situ measurements of particlesize in estuarine waters, Estuar. Coast. Shelf Sci. 24 (1987)253–263.
[3] Bale A.J., In situ laser optical particle sizing, J. Sea Res. 36(1/2) (1996) 31–36.
[4] Burban P.Y., Lick W., Lick J., The flocculation of fine-grained sediments in estuarine waters, J. Geophys. Res. 94(1989) 8323–8330.
[5] Conner C.S., De Visser A.M., A laboratory investigation ofparticle size effects on an optical backscatterrance sensor,Mar. Geol. 108 (1992) 151–159.
[6] Downing J.P., Sternberg R.W., Lister C.R.B., New in-strumentation for the investigation of sediment suspens-ion in the shallow environment, Mar. Geol. 42 (1981) 19–34.
[7] Eisma D., Flocculation and de-flocculation of suspen-ded matter in estuaries, Neth. J. Sea Res. 20 (1986) 183–199.
[8] Eisma D., Schuhmacher T., Boekel H., Van HeerwaardenJ., Franken H., Lann M., Vaars A., Eijgenraam F., Kalf J.,A camera and image analysis system for in situ observationof flocs in natural waters, Neth. J. Sea Res. 27 (1990) 43–56.
[9] Eisma D., Li A., Changes in suspended-matter floc size dur-ing the tidal cycle in the Dollard estuary, Neth. J. Sea Res.31 (2) (1993) 107–117.
[10] Eisma D., Kalf J., In situ particle size measurements withthe NIOZ in situ camera system, J. Sea Res. 36 (1/2) (1996)49–53.
[11] Eisma D., Bale A.J., Dearnaley M.P., Fennesy M.J., VanLeussen W., Maldiney M.A., Pfeiffer A., Wells J.T., Inter-comparison of in situ suspended matter (floc) size measure-ments, J. Sea Res. 36 (1/2) (1996) 3–14.
[12] Fennessy M.J., Dyer K.R., Huntley D.A., INSSEV, an in-strument to measure the size and settling velocity of flocs insitu, Mar. Geol. 117 (1994) 107–117.
[13] Fennessy M.J., Dyer K.R., INSSEV: floc population charac-teristics measured with INSSEV during the Elbe Estuaryintercalibration experiment, J. Sea Res. 36 (1/2) (1996) 55–62.
[14] Gentien P., Lunven M., Lehaıtre M., Duvent J.L., In situdepth profiling of particles, Deep-Sea Res. 42 (1995) 1297–1312.
[15] Gibbs R.J., Floc breakage by pumps, J. Sediment. Petrol.51 (1981) 670–672.
[16] Gibbs J.R., Wolanski E., The effects of flocs on opticalbackscattering measurements of suspended material concen-tration, Mar. Geol. 107 (1992) 289–291.
[17] Gorsky G., Aldorf C., Kage M., Picheral M., Garcia Y.,Favole J., Vertical distribution of suspended aggregates de-termined by a new underwater video profiler, Ann. Instit.Oceanogr. Paris 68 (1992) 275–280.
[18] Honjo S., Doherty K.W., Agrawal Y.C., Asper V.L., Directoptical assessment of large amorphous aggregates (marinesnow) in the deep sea ocean, Deep-Sea Res. A 31 (1984)61–76.
[19] Kranck K., Flocculation of suspended sediment in the sea,Nature 246 (1973) 348–350.
259

M. LUNVEN, P. GENTIEN / Oceanologica Acta 23 (2000) 245–260
[20] Pfeiffer A., In situ measurements of flocculated suspendedmatter with a video multi sensor system, J. Sea Res. 36(1/2) (1996) 115–118.
[21] Schoellhamer D.H., Biological interference of opticalbackscatterance sensors in Tampa Bay, Florida, Mar. Geol.110 (1993) 303–313.
[22] Trent J.D., Shanks A.L., Silver M.W., In situ and labora-tory measurements on macroscopic aggregates in MontereyBay, California, Limnol. Oceanogr. 23 (1978) 626–635.
[23] Van Leussen W., Cornelisse J., The underwater video sys-tem VIS, J. Sea Res. 36 (1/2) (1996) 77–81.
[24] Van Leussen W., The Kolmogorov microscale as a limitingvalue for the floc sizes of suspended fine-grained sedimentsin estuaries, in: Burt N., Parker R., Watts J. (Eds.), Cohe-sive Sediments, Wiley, New York, 1997, pp. 45–73.
[25] Vilivic D., Legovic T., Zutic V., Vertical distribution ofphytoplankton in a stratified estuary, Aquat. Sci. 51 (1989)31–46.
.
260