surveyoverview - formsite · pdf filethe epp utilizes an array of survey data. ... i use...
TRANSCRIPT
Survey Overview
Our EPP utilizes several collection sources for survey data. The
majority of our survey data comes from the university’s Office of Institutional
Research and Planning (OIRP). OIRP administers a series of surveys to
students, alumni, faculty, and staff. OIRP develops items, administers
surveys, analyzes data, and provides specific data analysis for our EPP
programs. In addition, our EPP works with OIRP to review and administer
EPP-‐specific inserts included in university-‐wide surveys to gather
information regarding our candidates. Finally, our EPP collects survey data
on current candidates, EPP completers currently working in K-‐12 schools,
alumni, and administrators/stakeholders.
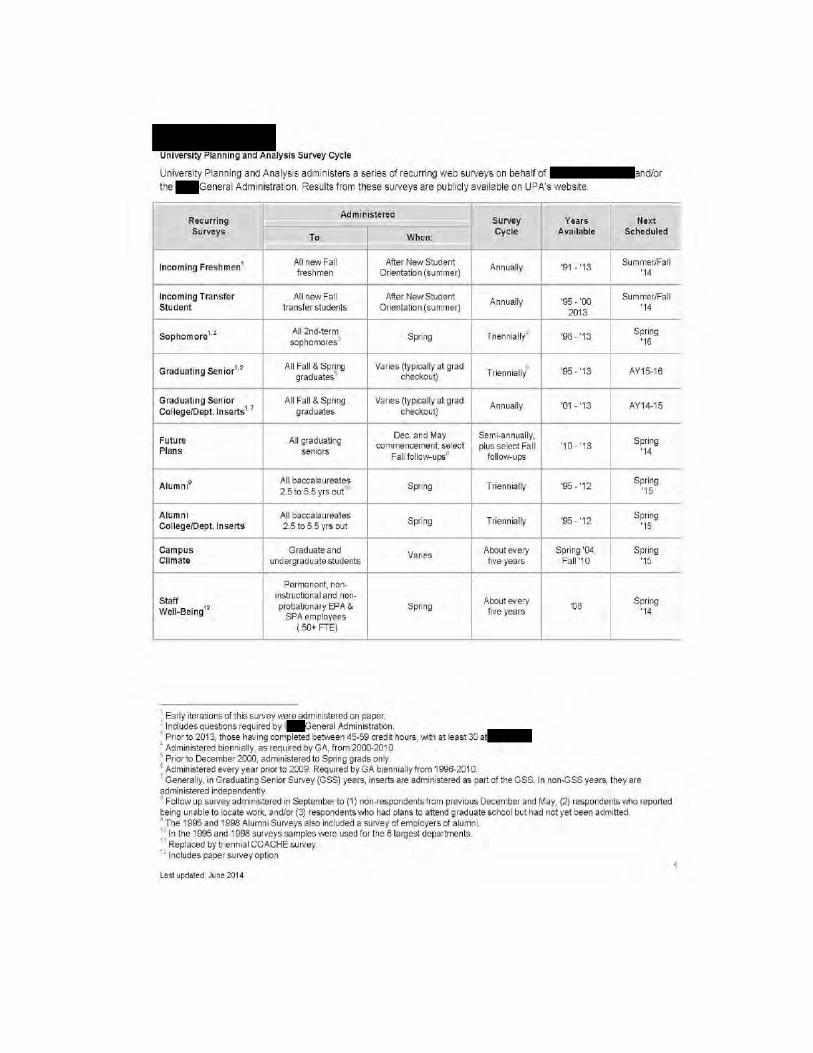
The following tables represent all the surveys that both OIRP and our
EPP conduct and administration cycles for each.

inform the design and implementation of courses and curricula in our EPP.
Preliminary data analysis is completed in OIRP. Data files and summaries are
provided to the Office of Knowledge Management & Assessment (KMA). The
KMA office further analyzes data and triangulates specific items to other
survey data, as well as to specific standards. Data reports are provided to
program coordinators and EPP administration through the Snapshot tab in
SAGE. Program coordinators utilize appropriate survey data in their annual
report and can reference and attach any program data that was collected
over the course of the year. See Program Snapshot Evidence.
In addition to surveys conducted by OIRP, our EPP conducts surveys
with our completers and educational partners. See Clinical Practice evidence,
PSI-‐BT evidence.
Cooperating Teachers are surveyed to provide feedback to early field
placement candidates. Results are included in a candidate’s SAGE account
under the DISPOSITIONS tab.


OIRP follows up with non-‐responders multiple times over the administration
cycle to maximize participation.
The past few years have seen a large increase in surveys for various
purposes on campus. In order to ensure high response rates and maintain
survey quality, the university created a Survey Advisory Committee (SAC).
The primary purpose of SAC is to provide recommendations on policies and
practices to govern surveys of members of the campus community
(i.e., students, faculty, staff, administrators, and alumni), and to implement
approved practices. SAC was created in response to the growing perception
that the number of surveys being administered on campus has escalated in
recent years. The increasing number of surveys has in all likelihood come at
some financial cost to as more units devote resources to survey
activities. In addition, over-‐surveying has likely contributed to survey fatigue
among members of our campus community, leading to declining response
rates and, ultimately, less robust data to use in our accreditation, assessment,
program evaluation, and other similar necessary activities. The goal of the
committee is to develop mechanisms for promoting efficiency in survey
activities on campus. Such efficiencies could prove cost-‐effective for
, and better enable units to collect the high quality data they need from
our faculty, staff, students, and alumni. Specifically, SAC seeks to minimize
survey burden and costs to our campus community, and to make sure, to the
fullest extent possible, that the surveys that are administered are
methodologically sound. The ultimate objective is to enable the University,
its various units, and scholars to collect and benefit from high-‐quality, useful
survey data in the most efficient and cost-‐effective manner possible.
The Office of Knowledge Management and the Office of Professional
Education analyze all survey data and highlight strengths and weaknesses.
In addition, clusters of items relating the state, national, and EPP standards
are summarized from each survey so programs may see how
candidates/completers are evaluated on a broader element. For example,
our EPP provided survey results on technology, assessment, diversity, and
overall program quality. A sample of these reports are attached. All survey
summaries are available for onsite review.
Our survey data support evidence-‐driven planning and assessment
throughout the University, and are used by administrators, academic and
non-‐academic offices, colleges and departments, C-‐General
Administration, and the media.
Assessment Survey Data
The EPP utilizes an array of survey data. Each survey report is reviewed and disaggregated for
programs. The following excerpts relate to preparing our candidates to be assessment literate.
The data shared with programs and EPP administrators as a benchmark of progress in our
continuous improvement cycle. A sample of complete survey reports are available in the Survey
Evidence. All complete survey reports are available onsite for the CAEP reviewers.
Survey data are provided on candidates knowledge about Assessment while on campus
(Graduating Senior Survey), How prepared they felt after graduation (PSI), and how our
candidates were rated in the field compared to others EPP prepared candidates ( GA Recent
Grad Survey). All survey data is provided to programs and EPP administrators in the Snapshot
tab of SAGE.
Continuous Improvement: EPP completers who were surveyed feel prepared to use a variety of
assessment methods and student data to make decisions about teaching. These completers feel
less prepared in seeking resources to support professional development. These results are not
unexpected as these completers were completers of the core assessment courses, but were not
enrolled in the Professional Growth program. At this time our EPP has chosen not to make any
additional changes, we expect to see improvement in the seeking of additional resources as
candidates begin to fulfill their PGU obligation.
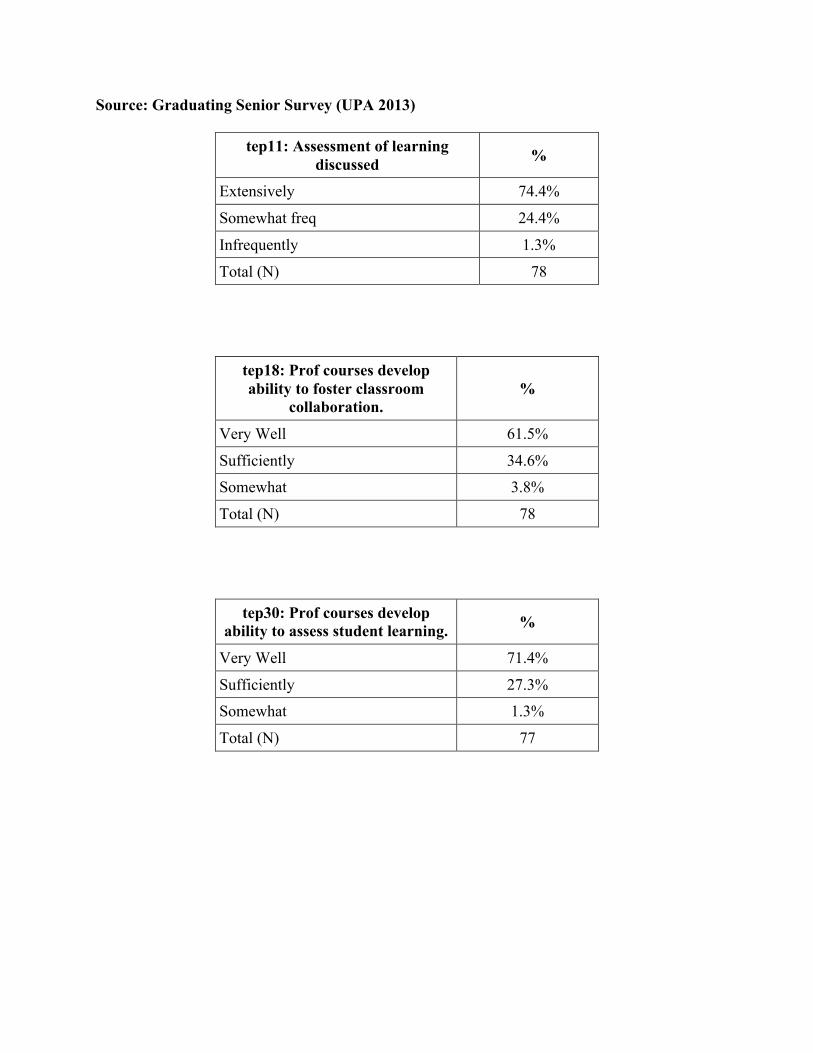
Source: Graduating Senior Survey (UPA 2013)
tep11: Assessment of learning discussed %
Extensively 74.4%
Somewhat freq 24.4%
Infrequently 1.3%
Total (N) 78
tep18: Prof courses develop ability to foster classroom
collaboration.%
Very Well 61.5%
Sufficiently 34.6%
Somewhat 3.8%
Total (N) 78
tep30: Prof courses develop ability to assess student learning. %
Very Well 71.4%
Sufficiently 27.3%
Somewhat 1.3%
Total (N) 77

Source: PSI-BT
Evaluation This is my current experience in my school:
This is my current experience in my school:
This is my current experience in my school:
2012 Administration (n=73) 2013 Administration (n=100) 2014 Administration (n=92)
Mean Standard Deviation Mean Standard Deviation Mean Standard Deviation
Item Number Item
42 I informally assess each student on a daily basis.
4.61 1.21 4.71 1.09 4.70 1.02
43 I formally assess each student on a weekly basis.
4.77 1.01 4.57 1.17 4.68 1.15
44
If I teach to the Standards, my students will be adequately prepared for high stakes tests.
4.22 1.23 4.24 1.35 3.80 1.57

45
Preparation for high stakes testing significantly decreases the amount of material I am able to cover with students.
2.73 1.41 2.48 1.36 2.80 1.38
46 I feel pressured by high stakes testing. 2.75 1.57 2.18 1.41 2.47 1.49
47
I use my state's academic standards to create classroom assessments.
4.85 1.17 4.93 1.09 4.66 1.12
48
I am able to write quality unit/chapter tests for my students.
4.79 1.05 4.97 0.94 4.97 0.95
49
I am able to effectively create classroom assessments other than classroom tests.
5.08 0.78 5.00 1.19 5.05 0.93
50
I use a variety of measures to assess my students.
5.08 0.88 5.05 1.04 5.03 0.75

51
I use formative assessment in my classroom.
5.18 0.79 5.18 0.68 5.25 0.57
52
I use summative assessment in my classroom.
5.15 0.83 5.24 0.67 5.25 0.60
53
I use data from high stakes testing to inform my instruction.
4.10 1.45 4.23 1.54 4.36 1.27
54 I understand the data from high stakes testing.
4.59 1.16 4.65 1.25 4.54 1.13
55
High stakes testing pressures me to cover a lot of material in a short amount of time.
4.72 1.37 4.67 1.38 4.80 1.33
56
I can explain to parents what high stakes testing data tells them.
4.23 1.35 4.38 1.31 4.30 1.28

57 I have time to interpret my students' test data. 3.75 1.29 3.59 1.44 3.40 1.48
58
High stakes testing holds me accountable for the material I teach in class.
4.18 1.42 3.91 1.56 3.86 1.62
59
The material I am expected to cover for high stakes testing is basic information.
3.65 1.33 3.20 1.40 3.38 1.45
Preparation This is my current experience in my
school: This is my current experience in my
school: This is my current experience in my
school:
2012 Administration (n= 71) 2013 Administration (n=100) 2014 Administration (n=92)
Mean Standard Deviation Mean Standard Deviation Mean Standard Deviation
Item Number Item
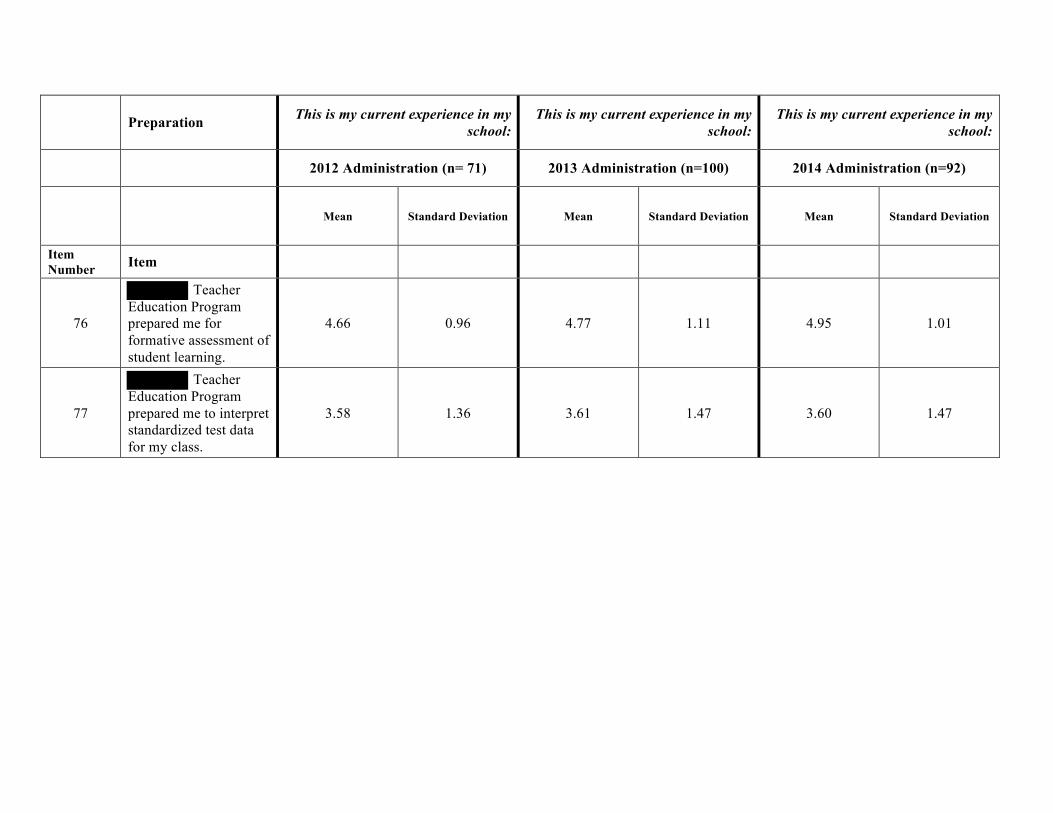
76
Teacher Education Program prepared me for formative assessment of student learning.
4.66 0.96 4.77 1.11 4.95 1.01
77
Teacher Education Program prepared me to interpret standardized test data for my class.
3.58 1.36 3.61 1.47 3.60 1.47

Source: Assessment PD sessions offered and enrollment
Course Number Title
EPP Parameters Enrollment
PD 110
edTPA: Saturday Work Session
Field Experience, Assessment 6
PD 111
edTPA: Saturday Work Session Task 1
Field Experience, Assessment 15
PD 111
edTPA: Saturday Work Session Task 1
Field Experience, Assessment 1
PD 112
edTPA: Task Two Digging Deeper into the Rubrics and Peer Editing
Field Experience, Assessment 7
PD 601
Teacher Evaluation, Effectiveness, and Value-Added
Collaboration, Assessment 50

Diversity Survey Data
The EPP utilizes an array of survey data. Each survey report is reviewed and disaggregated for
programs. The following excerpts relate to preparing our candidates to work with and meet the
needs of a diverse population. The data shared with programs and EPP administrators as a
benchmark of progress in our continuous improvement cycle. A sample of complete survey
reports is available in the Survey Evidence. All complete survey reports are available onsite for
the CAEP reviewers.
Surveys data are provided on candidates feelings about Diversity while on campus
(Graduating Senior Survey), How prepared they felt after graduation (PSI), and how our
candidates were rated in the field compared to others EPP prepared candidates GA Recent
Grad Survey). All survey data is provided to programs and EPP administrators in the Snapshot
tab of SAGE.
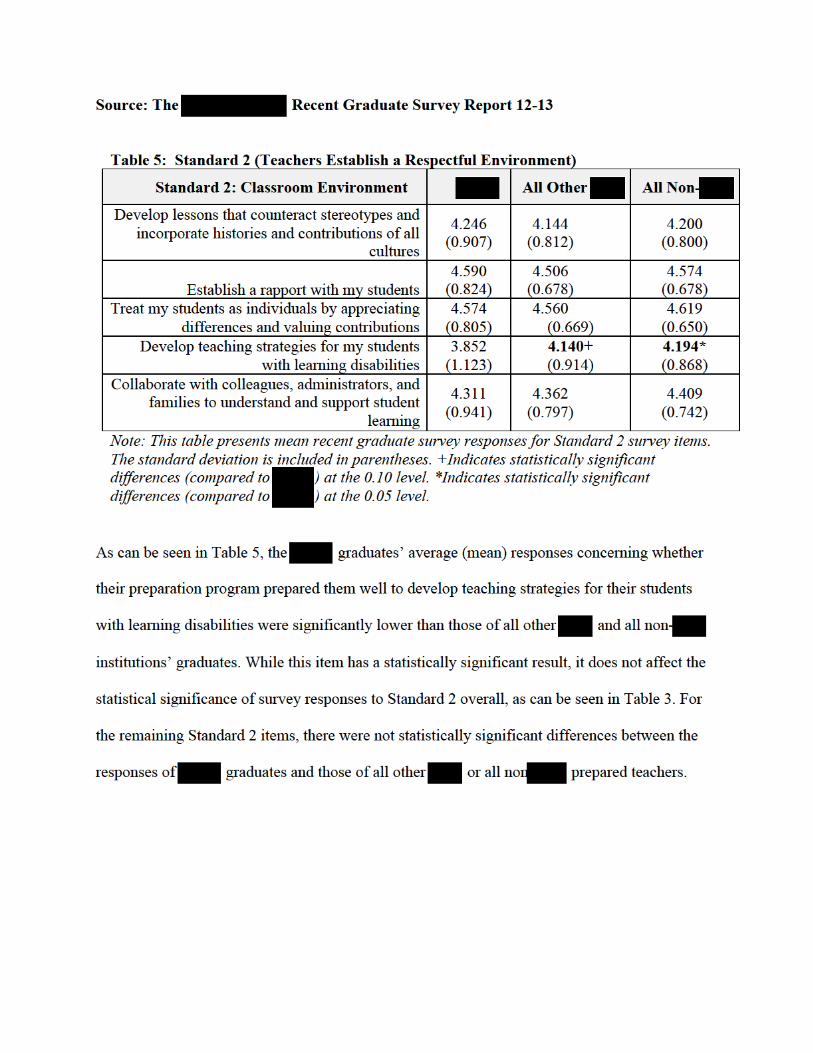
Continuous Improvement: In general our EPP graduates rate their preparation for creating a
respectful environment and working with diverse students very well. Where completers feel they
need additional support is in the areas of working with students with special needs and working
with parents. To address these concerns our EPP developed PGU offerings as well as a session at
our Beginning Teacher Institute.

Source: Graduating Senior Survey (UPA 2013)
tep24: Prof courses develop ability to establish equity in
classroom %
Very Well 64.1%
Sufficiently 32.1%
Somewhat 3.8%
Total (N) 78
tep25: Prof courses develop ability to engage students in
learning %
Very Well 66.7%
Sufficiently 28.2%
Somewhat 3.8%
Not at all 1.3%
Total (N) 78
tep26: Prof courses develop ability to work w/ colleagues %
Very Well 70.5%
Sufficiently 24.4%
Somewhat 5.1%
Total (N) 78
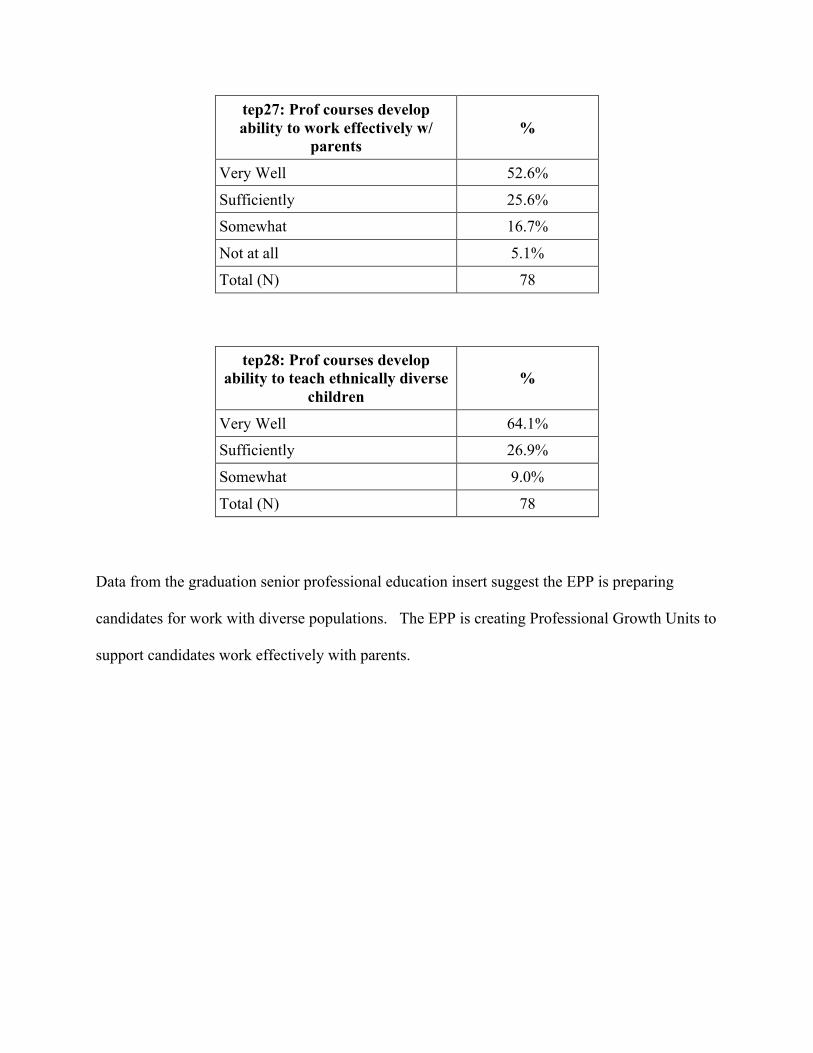
tep27: Prof courses develop ability to work effectively w/
parents %
Very Well 52.6%
Sufficiently 25.6%
Somewhat 16.7%
Not at all 5.1%
Total (N) 78
tep28: Prof courses develop ability to teach ethnically diverse
children %
Very Well 64.1%
Sufficiently 26.9%
Somewhat 9.0%
Total (N) 78 Data from the graduation senior professional education insert suggest the EPP is preparing
candidates for work with diverse populations. The EPP is creating Professional Growth Units to
support candidates work effectively with parents.

Source: PSI-BT
Student Success This is my current experience in my school:
This is my current experience in my school:
This is my current experience in my school:
2012 Administration (n=73) 2013 Administration (n=100) 2014 Administration (n=92)
Mean Standard Deviation Mean Standard Deviation Mean Standard Deviation
Item Number Item
25
I am able to successfully teach students with a variety of ability levels.
4.75 0.86 4.95 0.91 4.72 0.95
26 I am able to motivate all students. 4.05 1.36 4.13 1.05 4.24 1.16
27
I am able to use a variety of teaching strategies to provide my students with instruction that is effective for them.
4.97 0.82 5.03 0.78 5.11 0.79
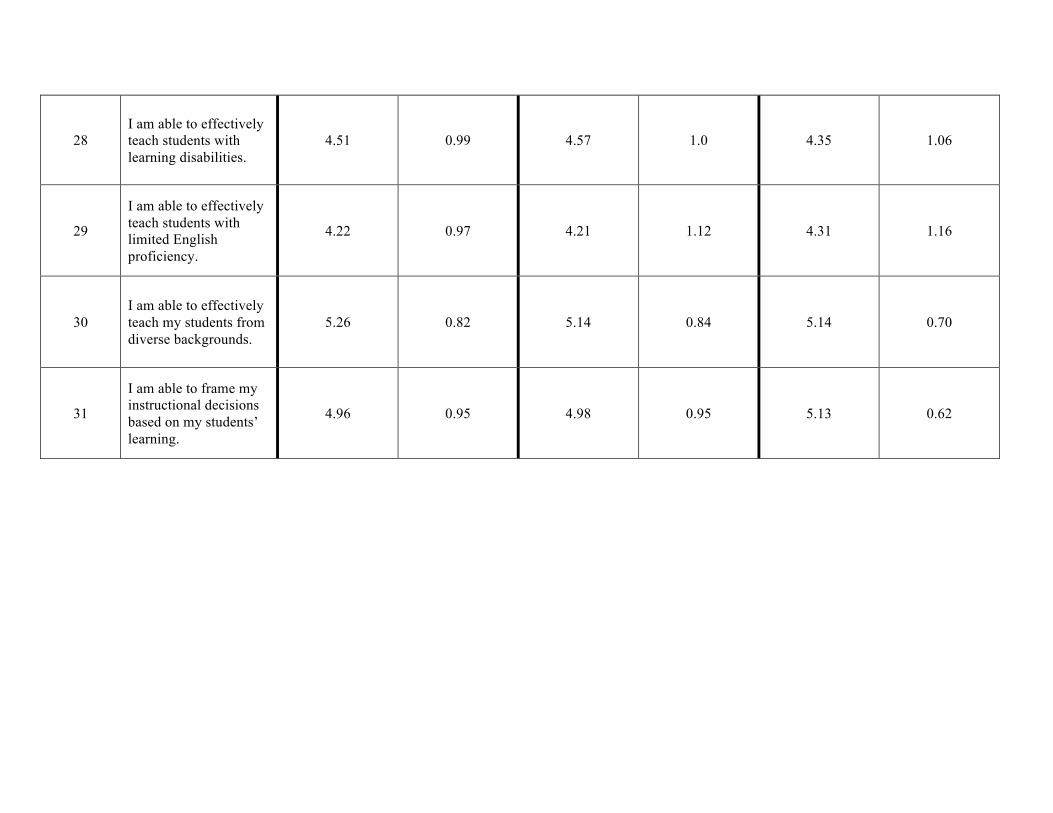
28 I am able to effectively teach students with learning disabilities.
4.51 0.99 4.57 1.0 4.35 1.06
29
I am able to effectively teach students with limited English proficiency.
4.22 0.97 4.21 1.12 4.31 1.16
30 I am able to effectively teach my students from diverse backgrounds.
5.26 0.82 5.14 0.84 5.14 0.70
31
I am able to frame my instructional decisions based on my students’ learning.
4.96 0.95 4.98 0.95 5.13 0.62

Preparation This is my current experience in my
school: This is my current experience in my
school: This is my current experience in my
school:
2012 Administration (n= 71) 2013 Administration (n=100) 2014 Administration (n=92)
Mean Standard Deviation Mean Standard Deviation Mean Standard Deviation
Item Number Item
70
Teacher Education Program prepared me for effectively instructing learners.
5.00 0.71 4.90 1.01 4.90 1.12
71
Teacher Education Program prepared me for teaching students with special learning needs.
4.14 1.31 3.94 1.38 3.89 1.29
72
Teacher Education Program prepared me for teaching students who are English as Second Language learners.
3.31 1.19 3.29 1.46 3.31 1.46

Source: Diversity PD sessions Offered and enrollment
Course Number Title EPP Parameter Enrollment
PD 501
Hoodies in the Classroom: An Examination of Racial Profiling in the Trayvon Martin Case and Implications for Education
Diversity 30
PD 502
"What it Look Like": Culturally Responsive Teaching in Public Schools
Diversity 35
PD 503
Cross-Cultural Conversation Series: Supporting Latino Students and Families in the Schools
Diversity 23
PD 504
Friday Forum - Poverty and Educational Attainment: Conceptualizing the Power of Teachers and School Leaders
Diversity 16
PD 505 What I wish my teacher had said/done... Diversity 24
PD 506 Colorism & Its Impact on Student Achievement Diversity 21
PD 507 BaFaBafa Diversity 6
PD 508 Friday Forum - Playing Indian Diversity 24
PD 509
Moving Beyond the Classroom - Becoming a Multicultural Educator: A Call to Action
Diversity 5
Technology Survey Data
The EPP utilizes an array of survey data. Each survey report is reviewed and disaggregated for
programs. The following excerpts relate preparing our candidates to work with and utilize
technology. The data shared with programs and EPP administrators as a benchmark of progress
in our continuous improvement cycle. A sample of complete survey reports is available in the
Survey Evidence. All complete survey reports are available onsite for the CAEP reviewers.
Surveys data are provided on candidates feelings about Technology support and usage while on
campus (Graduating Senior Survey), How prepared they felt after graduation (PSI), and
how our candidates were rated in the field compared to others EPP prepared candidates (
GA Recent Grad Survey). All survey data is provided to programs and EPP administrators in the
Snapshot tab of SAGE.
Continuous Improvement: Historically, an area of strength for our EPP is the incorporation of
technology. Our 1:1 environment, integration of technology in coursework, and additional PGU
technology offerings leave or candidates well-prepared for their work as teachers. This is borne
out in the findings of our completer surveys as our candidates fell well prepared to facilitate
instruction and use technology. As a result, our EPP will not make specific changes, but will
continue to evaluate our uses of technology and work to remain on the leading-edge of
instructional technological applications.

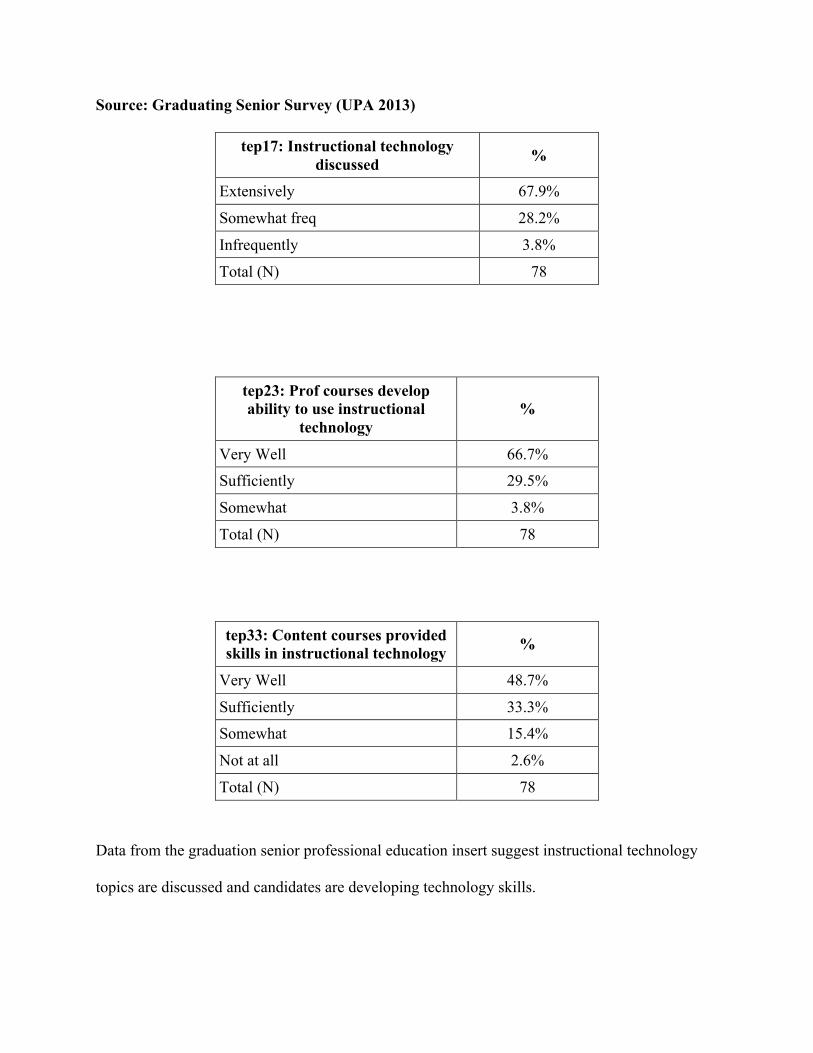
Source: Graduating Senior Survey (UPA 2013)
tep17: Instructional technology discussed %
Extensively 67.9%
Somewhat freq 28.2%
Infrequently 3.8%
Total (N) 78
tep23: Prof courses develop ability to use instructional
technology %
Very Well 66.7%
Sufficiently 29.5%
Somewhat 3.8%
Total (N) 78
tep33: Content courses provided skills in instructional technology %
Very Well 48.7%
Sufficiently 33.3%
Somewhat 15.4%
Not at all 2.6%
Total (N) 78
Data from the graduation senior professional education insert suggest instructional technology
topics are discussed and candidates are developing technology skills.

Source: Perceptions of Success Inventory for Beginning Teacher (2012-2014)
Instructional Resources
This is my current experience in my school:
This is my current experience in my school:
This is my current experience in my school:
2012 Administration (n=73) 2013 Administration (n=100) 2014 Administration (n=92)
Mean Standard Deviation Mean Standard Deviation Mean Standard Deviation
Item Number Item
35
I have been provided with the instructional technology I need to teach effectively.
4.58 1.32 4.82 1.31 4.54 1.36

Preparation This is my current experience in my
school: This is my current experience in my
school: This is my current experience in my
school:
2012 Administration (n= 71) 2013 Administration (n=100) 2014 Administration (n=92)
Mean Standard Deviation Mean Standard Deviation Mean Standard Deviation
Item Number Item
78
Teacher Education Program prepared me for using instructional technology in my classroom.
4.65 1.27 4.95 1.24 4.94 1.16

Source: Technology PD sessions Offered and enrollment
Course Number Title EPP
Parameters Enrollment
PD 301 Digital Leadership Conference
Technology 7
PD 302 Smartboards Technology 30
PD 303 What can you do with an iPad?
Technology 49
PD 304 Video Games in the Classroom
Technology 21
PD 305 EdCAMP Elon Technology 2

Quality Preparation Survey Data
The EPP utilizes an array of survey data. Each survey report is reviewed and disaggregated for
programs. The following excerpts relate to candidates quality preparation. The data shared with
programs and EPP administrators as a benchmark of progress in our continuous improvement
cycle. A sample of complete survey reports is available in the Survey Evidence. All complete
survey reports are available onsite for the CAEP reviewers.
Survey data are provided on candidates reflection on the quality of their preparation while on
campus (Graduating Senior Survey), How prepared they felt after graduation (PSI), and
how our candidates were rated in the field compared to others EPP prepared candidates (
GA Recent Grad Survey). All survey data is provided to programs and EPP administrators in the
Snapshot tab of SAGE.
Continuous Improvement: In general our EPP graduates feel well prepared for their work as
teachers. At this time our EPP has not identified this as an area of need and has chosen to focus
on other items.


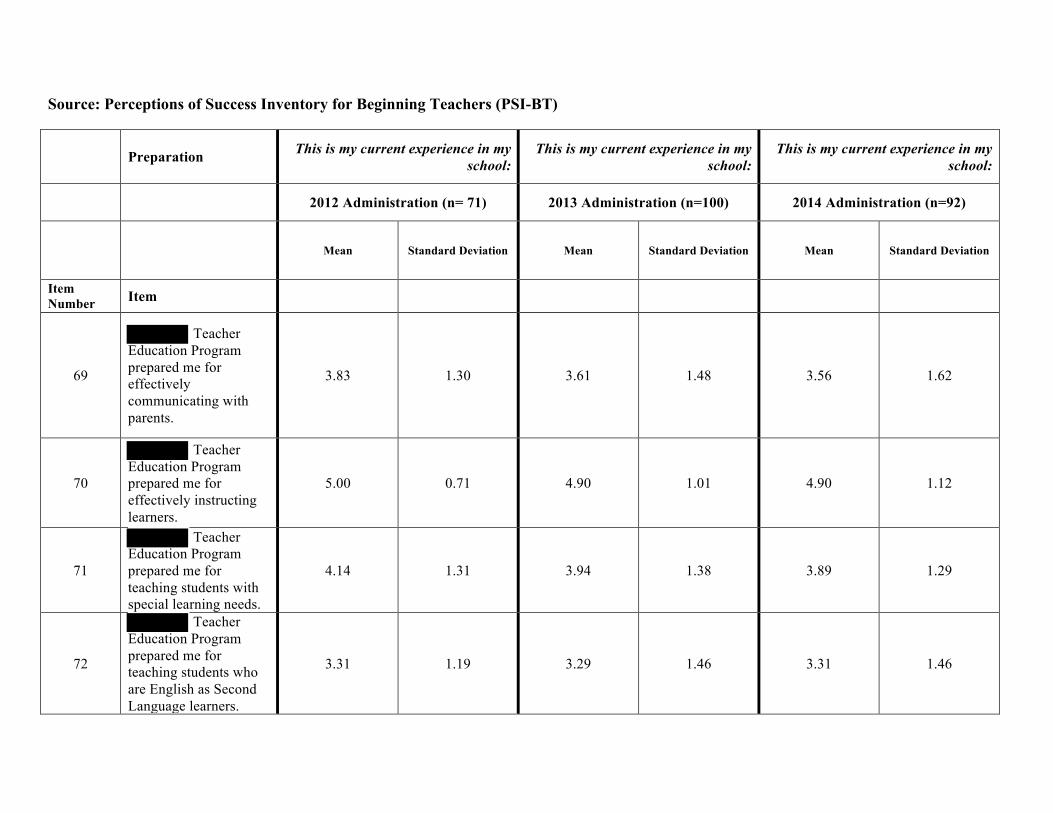
Source: Perceptions of Success Inventory for Beginning Teachers (PSI-BT)
Preparation This is my current experience in my
school: This is my current experience in my
school: This is my current experience in my
school:
2012 Administration (n= 71) 2013 Administration (n=100) 2014 Administration (n=92)
Mean Standard Deviation Mean Standard Deviation Mean Standard Deviation
Item Number Item
69
Teacher Education Program prepared me for effectively communicating with parents.
3.83 1.30 3.61 1.48 3.56 1.62
70
Teacher Education Program prepared me for effectively instructing learners.
5.00 0.71 4.90 1.01 4.90 1.12
71
Teacher Education Program prepared me for teaching students with special learning needs.
4.14 1.31 3.94 1.38 3.89 1.29
72
Teacher Education Program prepared me for teaching students who are English as Second Language learners.
3.31 1.19 3.29 1.46 3.31 1.46
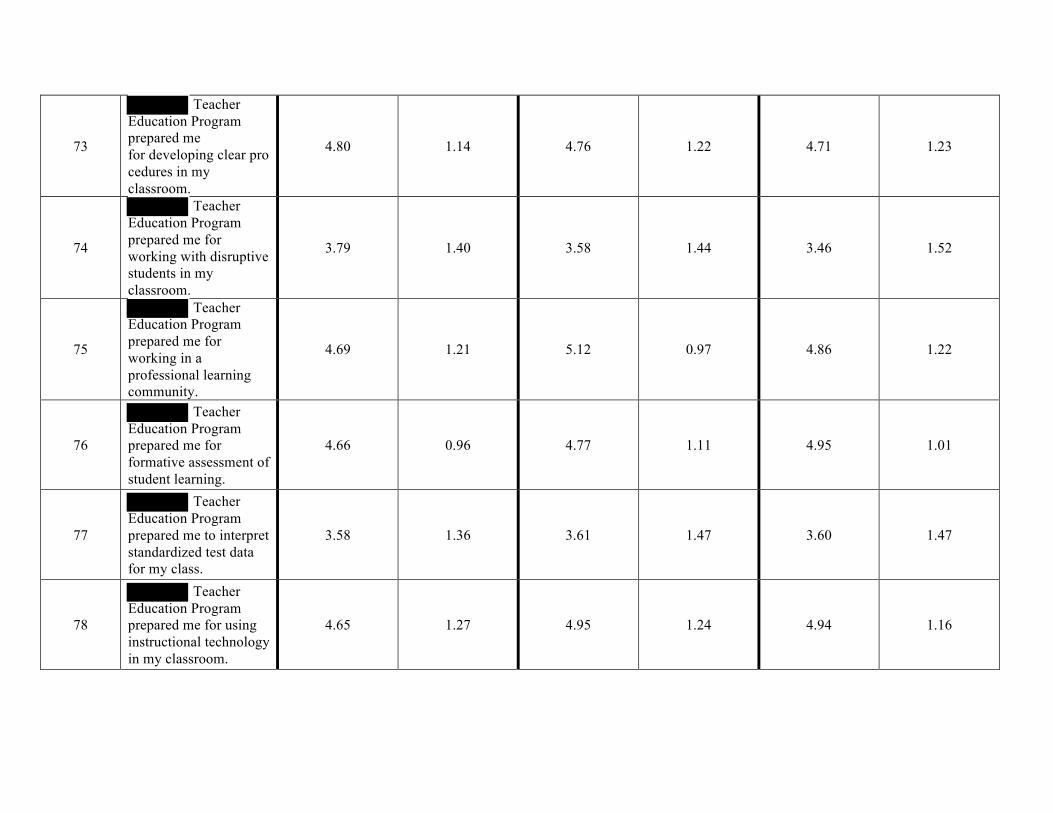
73
Teacher Education Program prepared me for developing clear procedures in my classroom.
4.80 1.14 4.76 1.22 4.71 1.23
74
Teacher Education Program prepared me for working with disruptive students in my classroom.
3.79 1.40 3.58 1.44 3.46 1.52
75
Teacher Education Program prepared me for working in a professional learning community.
4.69 1.21 5.12 0.97 4.86 1.22
76
Teacher Education Program prepared me for formative assessment of student learning.
4.66 0.96 4.77 1.11 4.95 1.01
77
Teacher Education Program prepared me to interpret standardized test data for my class.
3.58 1.36 3.61 1.47 3.60 1.47
78
Teacher Education Program prepared me for using instructional technology in my classroom.
4.65 1.27 4.95 1.24 4.94 1.16