surveyof consumerexpect ations … reserve bank of new york ... sce housing survey – 2018 andreas...
TRANSCRIPT
SURVEY OF CONSUMER EXPECTATIONS
Housing Survey – 2018
Federal Reserve Bank of New York
Andreas Fuster & Andrew Haughwout with Nima Dahir & Mike Neubauer
April 2018
Federal Reserve Bank of New York Andreas Fuster & Andrew Haughwout with Nima Dahir & Mike NeubauerSCE Housing Survey – 2018 1 / 99March 2018 1/99

Outline
1 Technical Notes & Demographic Characteristics (3-11)
2 Zip Code Home Price Expectations (12-22)
3 General Questions for Both Owners and Renters (23-41)
4 Homeowner Section (42-82)Questions for All Homeowners (41-56)Questions for Homeowners with Debt (57-81)
5 Renter Questions (83-99)
Federal Reserve Bank of New York Andreas Fuster & Andrew Haughwout with Nima Dahir & Mike NeubauerSCE Housing Survey – 2018 2 / 99March 2018 2/99

Technical Notes
1 Household heads in the SCE panel were invited to participate inthe internet-based housing survey during February 2018.
2 Of 1474 eligible respondents, 1145 (77.7%) participated in thesurvey, of whom 855 (74.7%) were current homeowners.
3 Only selected questions are presented.4 The general layout of each slide is such that we show the question
wording, the summary statistics for that question, and therelevant sub-sample to whom the question was directed.
5 All continuous outcomes reported in the chart packet arewinsorized at the top/bottom 2.5%, unless otherwise specified.“Bounded” questions such as those asking for a “percent chance”are not winsorized, since only responses ranging from 0 to 100were accepted by the online survey.
Federal Reserve Bank of New York Andreas Fuster & Andrew Haughwout with Nima Dahir & Mike NeubauerSCE Housing Survey – 2018 3 / 99March 2018 3/99

Technical Notes (continued)
6 All statistics shown are weighted to be representative of the USpopulation of household heads in terms of income, education, age,and region.
7 Note that the SCE Housing Survey results that were published in2014 and 2015 (e.g. here) were unweighted.
Federal Reserve Bank of New York Andreas Fuster & Andrew Haughwout with Nima Dahir & Mike NeubauerSCE Housing Survey – 2018 4 / 99March 2018 4/99

Findings from Earlier WavesSee the following hyperlinks:
Chart packets:I 2017I 2016I 2015I 2014
Blog Posts:I Just Released: 2017 SCE Housing Survey Finds Increased
Optimism about Home Price Growth (2017)I Just Released: 2016 SCE Housing Survey Shows Modest Decline in
Home Price Expectations (2016)I How Sensitive Is Housing Demand to Down Payment Requirements
and Mortgage Rates? (2015)I Just Released: 2015 SCE Housing Survey Shows Households
Optimistic about Housing Market (2015)I Why Aren’t More Renters Becoming Homeowners? (2014)I Introducing the SCE Housing Survey (2014)
Federal Reserve Bank of New York Andreas Fuster & Andrew Haughwout with Nima Dahir & Mike NeubauerSCE Housing Survey – 2018 5 / 99March 2018 5/99

Demographic Characteristics
Federal Reserve Bank of New York Andreas Fuster & Andrew Haughwout with Nima Dahir & Mike NeubauerSCE Housing Survey – 2018 6 / 99March 2018 6/99

DemographicsFull Sample Renters Owners
Observations 1145 290 855Weighted Fraction of Sample (%) 26.3 73.7
Age 51.2 45.1 53.3(15.2) (15.4) (14.6)
Male 49.6 33.9 55.2Retired 25.1 14.5 28.9Married or Living with Partner 64.5 43.4 72.0Education: College Degree or Higher 34.0 29.0 35.8White 83.3 72.3 87.2Region: Midwest 22.4 18.9 23.6Region: Northeast 17.6 18.2 17.4Region: South 38.8 41.9 37.7Region: West 21.2 21.0 21.3Tenure in Town/City, Years 21.5 15.1 23.8
(18.2) (16.1) (18.4)Unemployed 2.3 4.1 1.6Have You Ever Owned a Home? 35.5 35.5Own home that is not primary residence 12.1 1.6 15.8Has been foreclosed on before 5.2 8.7 3.9
Note: Mean reported for continuous outcomes; standard dev. in parentheses.Federal Reserve Bank of New York Andreas Fuster & Andrew Haughwout with Nima Dahir & Mike NeubauerSCE Housing Survey – 2018 7 / 99
March 2018 7/99

Household IncomeWhich category represents the total combined pre-tax income of all members of yourhousehold (including you) during the past 12 months?Please include money from all jobs, net income from business, farm or rent,pensions, interest on savings or bonds, dividends, social security income,unemployment benefits, Food Stamps, workers compensation or disability benefits,child support, alimony, scholarships, fellowships, grants, inheritances and gifts, andany other money income received by members of your household who are 15 years ofage or older. Full Sample Renters Owners
Pct Pct Pct<$10k 5.2 12.5 2.6$10k-20k 7.4 14.1 5.0$20k-30k 12.0 18.8 9.5$30k-40k 11.1 14.3 10.0$40k-50k 8.6 9.6 8.3$50k-60k 7.5 5.9 8.0$60k-75k 9.4 7.2 10.2$75k-100k 13.4 7.3 15.5$100k-150k 13.3 7.2 15.5$150k-200k 6.0 1.4 7.7$200k+ 6.0 1.7 7.6N 1134 287 847
Note: Question asked in Monthly SCE.Federal Reserve Bank of New York Andreas Fuster & Andrew Haughwout with Nima Dahir & Mike NeubauerSCE Housing Survey – 2018 8 / 99
March 2018 8/99

Credit Score
What would you say is your credit score?
Full Sample Renters OwnersPct Pct Pct
< 620 12.0 30.9 5.2620-679 9.5 18.7 6.2680-719 12.1 11.2 12.5720-760 18.5 12.2 20.8> 760 37.5 14.1 45.9Don’t Know 10.4 12.9 9.5N 1144 290 854
Federal Reserve Bank of New York Andreas Fuster & Andrew Haughwout with Nima Dahir & Mike NeubauerSCE Housing Survey – 2018 9 / 99March 2018 9/99

Liquid SavingsIf you added up all the money in the following accounts that you andyour family members have invested in, which category represents howmuch they would amount to?
Checking or savings accountsMoney market fundsCDs (Certificates of Deposit)Government/Municipal Bonds or Treasury BillsStocks or bonds in publicly held corporations, stock or bond mutualfunds, or investment trusts
Full Sample Renters OwnersPct Pct Pct
< $2,000 26.6 51.7 17.5$2,000 - $10,000 18.2 19.5 17.7$10,000 - $50,000 20.2 14.7 22.2$50,000 - $250,000 20.4 11.6 23.6> $250,000 14.6 2.5 19.0N 1127 288 839
Federal Reserve Bank of New York Andreas Fuster & Andrew Haughwout with Nima Dahir & Mike NeubauerSCE Housing Survey – 2018 10 / 99March 2018 10/99

Non-Housing DebtWhich category represents your current total outstanding debt,excluding all housing debt (such as mortgage debt, and home equityloans and lines of credit)? This would, for example, includeoutstanding carried-over balances on credit cards (including retailcards), student loans, auto loans, and other personal loans.
Full Sample Renters OwnersPct Pct Pct
Less than $500 22.7 17.1 24.8$500 to $999 3.3 4.9 2.7$1,000 to $1,999 4.8 4.0 5.1$2,000 to $4,999 9.9 14.8 8.1$5,000 to $9,999 11.1 9.4 11.7$10,000 to $19,999 13.6 12.5 14.0$20,000 to $29,999 11.1 12.8 10.5$30,000 to $49,999 8.8 9.2 8.7$50,000 to $99,999 9.9 10.0 9.9$100,000 or more 4.6 5.3 4.4N 1139 289 850
Federal Reserve Bank of New York Andreas Fuster & Andrew Haughwout with Nima Dahir & Mike NeubauerSCE Housing Survey – 2018 11 / 99March 2018 11/99

Zip Code Home Price Expectations
Federal Reserve Bank of New York Andreas Fuster & Andrew Haughwout with Nima Dahir & Mike NeubauerSCE Housing Survey – 2018 12 / 99March 2018 12/99
Estimate of Current Price for Typical Home in Zip
Consider a typical home (house/apartment) in your zip code. What isyour best guess of the value of such a home as of today?(By value, we mean how much that typical home would approximatelysell for today.)
Summary PercentileMean 259422.0 25% 125000.0
Std. Dev. 209224.5 50% 200000.075% 300000.0
N 1145
Federal Reserve Bank of New York Andreas Fuster & Andrew Haughwout with Nima Dahir & Mike NeubauerSCE Housing Survey – 2018 13 / 99March 2018 13/99
Past Perceived Home Price Change
You indicated that you estimate the current value of a typical home inyour zip code to be X dollars (see previous question). Now, think abouthow the value of such a home has changed over time. What do youthink the average value of such a home was one and five years ago?
PercentileMean Std. Dev. 25% 50% 75% N
Past Perceived Change, 1yr 5.6 7.9 0.0 3.4 7.7 1143Past Perceived Change, 5yrs 4.1 4.2 1.8 3.7 5.9 1142
Note: Values are percent change, annualized (100 = 100%). T Year annual percent changeconstructed as(Estimate of Current Price for Typical Home in Zip
Past Perceived Home Price, T Years Ago
)(1/T)− 1
See previous slide for more information on “Estimate of Current Price for Typical Homein Zip.”
Federal Reserve Bank of New York Andreas Fuster & Andrew Haughwout with Nima Dahir & Mike NeubauerSCE Housing Survey – 2018 14 / 99March 2018 14/99

Past Perceived Home Price Changes for Zip Code vs.Realized HPIComparison to realized values of CoreLogic HPI*:
PercentileMean Std. Dev. 25% 50% 75% N
Past Perceived Change, 1yr 5.6 7.9 0.0 3.4 7.7 1143Past Perceived Change, 5yr 4.1 4.2 1.8 3.7 5.9 1142
Realized HPI Change, 1yr 5.5 4.1 3.3 5.5 8.0 1145Realized HPI Change, 5yr 5.4 3.0 3.4 5.1 7.5 1145
Note: Values are percent change, annualized (100 = 100%). HPI T year annual percentchange constructed as ( CoreLogic HPI Today
CoreLogic HPI, T Years Ago
)(1/T)− 1
See previous slide for more information on annualized past perceived home price changes.
*HPI values at the one- and five-year horizons are matched, in decreasing order ofpreference, to a respondent’s zip code, county, and state HPI. A zip or county HPI matchexists for approximately 92% of the sample.
Federal Reserve Bank of New York Andreas Fuster & Andrew Haughwout with Nima Dahir & Mike NeubauerSCE Housing Survey – 2018 15 / 99March 2018 15/99

Expected Future Annual Price Changes in ZipYou estimated the current value of a typical home in your zip code tobe X dollars (see earlier question). Now, we would like you to thinkabout the future value of such a home.What do you think the average value of a home in your zip will be oneand five years from today?
PercentileMean Std. Dev. 25% 50% 75% N
Exp. Future Change in Zip, 1yr 4.6 6.3 0.4 3.3 6.7 1142Exp. Future Change in Zip, 5yrs 3.0 3.4 1.3 2.4 4.6 1142
Note: Values are percent change, annualized (100 = 100%). T Year annual percent changeconstructed as(Exp. Future Home Price in Zip, T Years From Today
Estimate of Current Price for Typical Home in Zip
)(1/T)− 1
See previous slide for more information on “Estimate of Current Price for Typical Homein Zip.”
Federal Reserve Bank of New York Andreas Fuster & Andrew Haughwout with Nima Dahir & Mike NeubauerSCE Housing Survey – 2018 16 / 99March 2018 16/99

Uncertainty about Future Home Prices, One-YearHorizonYou estimated the current value of a typical home in your zip code tobe V dollars (see question). What do you think is the percent chancethat the value of such a home one year from today will be less than $X,between $X and $V , between $V and $Y , or more than $Y ?X = 0.95 × (Estimate of Current Price for Typical Home in Zip)V = 1.00 × (Estimate of Current Price for Typical Home in Zip)Y = 1.10 × (Estimate of Current Price for Typical Home in Zip)
PercentileMean Std. Dev. 25% 50% 75% N
< X 10.1 15.1 0.0 5.0 11.0 1143Between X and V 27.6 25.1 10.0 20.0 40.0 1143Between V and Y 48.5 30.1 25.0 50.0 75.0 1143
> Y 13.7 18.2 0.0 10.0 20.0 1143
Note: Values are in percent (100 = 100%). See previous slide for more information on“Estimate of Current Price for Typical Home in Zip.”
Federal Reserve Bank of New York Andreas Fuster & Andrew Haughwout with Nima Dahir & Mike NeubauerSCE Housing Survey – 2018 17 / 99March 2018 17/99
Uncertainty about Future Home Prices, Five-YearHorizonWhat do you think is the percent chance that the value of such a homefive years from today will be less than $X, between $X and $V , between$V and $Y , or more than $Y ?
X = 0.9 × (Estimate of Current Price for Typical Home in Zip)V = 1.0 × (Estimate of Current Price for Typical Home in Zip)Y = 1.2 × (Estimate of Current Price for Typical Home in Zip)
PercentileMean Std. Dev. 25% 50% 75% N
< X 8.3 15.4 0.0 2.0 10.0 1144Between X and V 18.6 20.7 0.0 10.0 25.0 1144Between V and Y 51.4 30.1 25.0 50.0 75.0 1144
> Y 21.6 25.5 0.0 10.0 30.0 1144
Note: Values are in percent (100 = 100%). See previous slide for more information on“Estimate of Current Price for Typical Home in Zip.”
Federal Reserve Bank of New York Andreas Fuster & Andrew Haughwout with Nima Dahir & Mike NeubauerSCE Housing Survey – 2018 18 / 99March 2018 18/99

Rents: Current Levels and Expected ChangesIf this typical home in your zip code could be rented, what do you thinkthe average monthly rent of such a home (excluding utilities) would betoday, one year from today, and five years from today?Perceived Current Rent
Summary PercentileMean 1441.7 25% 850.0
Std. Dev. 818.3 50% 1200.075% 1800.0
N 1143
Expected Future ChangesPercentile
Mean Std. Dev. 25% 50% 75% NExp. Average Monthly Rent in 1yr 7.3 6.8 2.0 6.3 10.0 1142
Exp. Average Monthly Rent in 5yrs 4.3 3.1 2.6 4.0 5.9 1142
Note: Values in “Expected Future Changes” table are percent change, annualized (100 =100%). T Year annual percent change constructed as(Expected Average Monthly Rent, T Years from Today
Estimate of Average Monthly Rent, Today
)(1/T)− 1
Federal Reserve Bank of New York Andreas Fuster & Andrew Haughwout with Nima Dahir & Mike NeubauerSCE Housing Survey – 2018 19 / 99March 2018 19/99

Current and Expected Price-to-Rent EstimatesRatio of estimated price to estimated yearly rental price for averagehome in zip:
PercentileMean Std. Dev. 25% 50% 75% N
Today 14.7 6.3 10.4 13.8 17.8 11421 Year from Now 14.4 6.5 10.2 13.2 17.4 1140
5 Years from Now 13.8 6.6 9.7 12.8 16.7 1140
Note: Ratio constructed using Estimate of Current Price for Typical Home in Zip,Expected Future Home Prices in Zip, and Estimate and Expectations ofMonthly Rent as follows
Ratio today:
Estimate of Current Price for Typical Home in Zip12 × Estimate of Current Average Monthly Rent in Zip
Ratio T years from Now
Expected Future Home Price in Zip, T Years from Now12 × Expected Future Average Monthly Rent in Zip, T Years from Now
Federal Reserve Bank of New York Andreas Fuster & Andrew Haughwout with Nima Dahir & Mike NeubauerSCE Housing Survey – 2018 20 / 99March 2018 20/99

Investment Value of Homes in Zip
If someone had a large sum of money that they wanted to invest, wouldyou say that relative to other possible financial investments, buyingproperty in your zip code today is
PercentVery good investment 23.6
Somewhat good investment 41.2Neither good nor bad as an investment 24.7
Somewhat bad investment 8.7Very bad investment 1.9
N 1145
Federal Reserve Bank of New York Andreas Fuster & Andrew Haughwout with Nima Dahir & Mike NeubauerSCE Housing Survey – 2018 21 / 99March 2018 21/99

Investment Value, Now vs. Future
Do you think that buying property in your zip code is a betterinvestment idea today than it will be a year from today?
PercentMuch Better 11.9
Somewhat Better 29.9Neutral 51.8
Somewhat Worse 5.4Much Worse 1.0
N 1144
Federal Reserve Bank of New York Andreas Fuster & Andrew Haughwout with Nima Dahir & Mike NeubauerSCE Housing Survey – 2018 22 / 99March 2018 22/99
General Questions for BothOwners and Renters
Federal Reserve Bank of New York Andreas Fuster & Andrew Haughwout with Nima Dahir & Mike NeubauerSCE Housing Survey – 2018 23 / 99March 2018 23/99

Future Moving Plans
3yr Moving Probability: We would now like you to think about yourfuture moving plans. What is the percent chance that over the next 3years you will move to a different primary residence?1yr Moving Probability: And looking at the more immediate future,what is the percent chance that over the next 12 months you will moveto a different primary residence?
PercentileMean Std. Dev. 25% 50% 75% N
1yr Moving Probability* 17.0 27.9 0.0 2.0 20.0 11453yr Moving Probability 29.1 34.0 0.0 10.0 50.0 1145
Note: “1yr Moving Probability” is only asked if “3yr Moving Probability” ≥ 5%.
*For those who answer < 5% for “3yr Moving Probability,” the probability at the 1 yearhorizon is imputed by setting the 1 year value equal to the 3 year probability.
Federal Reserve Bank of New York Andreas Fuster & Andrew Haughwout with Nima Dahir & Mike NeubauerSCE Housing Survey – 2018 24 / 99March 2018 24/99
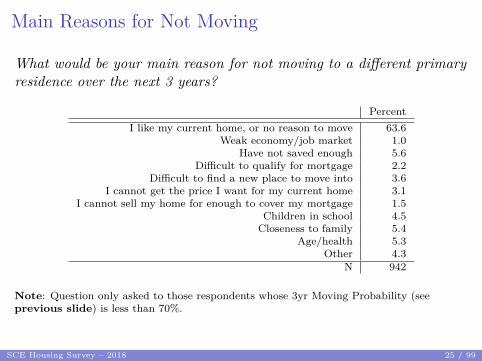
Main Reasons for Not Moving
What would be your main reason for not moving to a different primaryresidence over the next 3 years?
PercentI like my current home, or no reason to move 63.6
Weak economy/job market 1.0Have not saved enough 5.6
Difficult to qualify for mortgage 2.2Difficult to find a new place to move into 3.6
I cannot get the price I want for my current home 3.1I cannot sell my home for enough to cover my mortgage 1.5
Children in school 4.5Closeness to family 5.4
Age/health 5.3Other 4.3
N 942
Note: Question only asked to those respondents whose 3yr Moving Probability (seeprevious slide) is less than 70%.
Federal Reserve Bank of New York Andreas Fuster & Andrew Haughwout with Nima Dahir & Mike NeubauerSCE Housing Survey – 2018 25 / 99March 2018 25/99
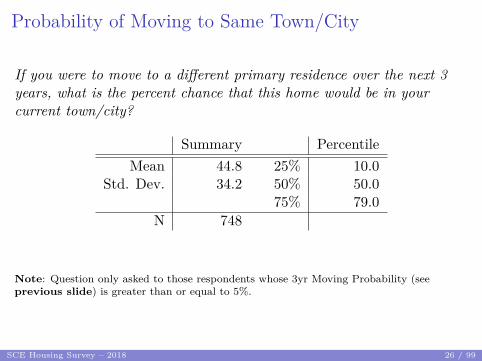
Probability of Moving to Same Town/City
If you were to move to a different primary residence over the next 3years, what is the percent chance that this home would be in yourcurrent town/city?
Summary PercentileMean 44.8 25% 10.0
Std. Dev. 34.2 50% 50.075% 79.0
N 748
Note: Question only asked to those respondents whose 3yr Moving Probability (seeprevious slide) is greater than or equal to 5%.
Federal Reserve Bank of New York Andreas Fuster & Andrew Haughwout with Nima Dahir & Mike NeubauerSCE Housing Survey – 2018 26 / 99March 2018 26/99

Probability of Buying Given Move
And if you were to move to a different primary residence over the next3 years, what is the percent chance that you would buy (as opposed torent) your new home?
Summary PercentileMean 63.7 25% 39.0
Std. Dev. 34.3 50% 75.075% 99.0
N 748
Note: Question only asked to those respondents whose 3yr Moving Probability (seeprevious slide) is greater than or equal to 5%.
Federal Reserve Bank of New York Andreas Fuster & Andrew Haughwout with Nima Dahir & Mike NeubauerSCE Housing Survey – 2018 27 / 99March 2018 27/99

Main Reasons for Renting over BuyingWhich of the following are reasons you would rent and not purchase ahome if you were to move over the next three years?
PctI don’t make enough money 47.1I don’t have enough money saved up, or I have too much debt 48.7My credit is not good enough 37.9I am worried about my or my spouse’s job security 8.3I am concerned housing prices might fall 8.0It is more affordable to rent than buy 27.7I don’t want to tie my money up in a house 17.4I don’t want to, or can’t be tied-down to a certain area 19.8I don’t want the upkeep of ownership 37.4I can live in a better neighborhood or in a nicer home by renting 15.1Would likely not stay in the new home very long 13.1Age/health reasons 27.6Other 5.9N 332
Note: Respondents could select multiple reasons.
Question only asked to those respondents whose 3yr Moving Probability is greater thanor equal to 5%, and whose Probability of Buying Given Move is less than 70%.
Federal Reserve Bank of New York Andreas Fuster & Andrew Haughwout with Nima Dahir & Mike NeubauerSCE Housing Survey – 2018 28 / 99March 2018 28/99
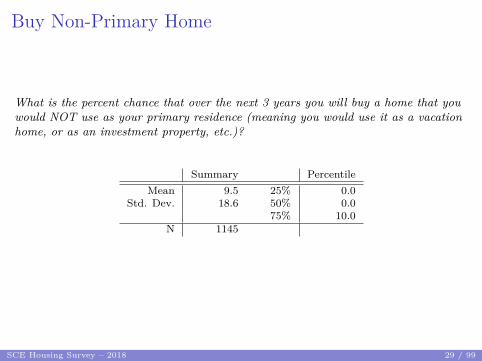
Buy Non-Primary Home
What is the percent chance that over the next 3 years you will buy a home that youwould NOT use as your primary residence (meaning you would use it as a vacationhome, or as an investment property, etc.)?
Summary PercentileMean 9.5 25% 0.0
Std. Dev. 18.6 50% 0.075% 10.0
N 1145
Federal Reserve Bank of New York Andreas Fuster & Andrew Haughwout with Nima Dahir & Mike NeubauerSCE Housing Survey – 2018 29 / 99March 2018 29/99

Use for Second Home
If you were to buy such a home over the next 3 years, what would youmost likely use it as?
PercentVacation/Second home 42.8
Investment Property 40.2Residence for Family Member 12.1
Other 4.9N 561
Note: This question is only asked to those respondents who answer Prob. Buy NewNon-Primary 3yr with a probability greater than 0.
Federal Reserve Bank of New York Andreas Fuster & Andrew Haughwout with Nima Dahir & Mike NeubauerSCE Housing Survey – 2018 30 / 99March 2018 30/99

Mortgage Rate EstimatesItems in table and corresponding question:
Current Self Rate Estimate: Assume that you applied for a30-year fixed-rate mortgage today. What mortgage rate do youthink you would qualify for?Current Average Rate Estimate: What do you think theaverage interest rate (for all borrowers) on a new 30-yearfixed-rate mortgage is as of today?
PercentileMean Std. Dev. 25% 50% 75% N
Exp. Self Rate 4.8 3.1 3.5 4.0 5.0 956Exp. National Rate 5.1 3.0 4.0 4.3 5.0 960
Note: 227 respondents selected “Would not qualify at any rate.” These respondents arenot included in the statistics on this slide, or the next two slides (here and here).
Freddie Mac Primary Mortgage Market Survey rate (link) was between 4.22 and 4.44 %over the time period the survey was fielded (Feb. 01 - 28).
Federal Reserve Bank of New York Andreas Fuster & Andrew Haughwout with Nima Dahir & Mike NeubauerSCE Housing Survey – 2018 31 / 99March 2018 31/99

Mortgage Rate Expectations
What do you think the average interest rate on a 30-year fixed-ratemortgage will be: one year from today and three years from today?
PercentileMean Std. Dev. 25% 50% 75% N
Exp. Mortgage Rate Change, 1yr 0.38 0.81 0.00 0.25 0.75 958Exp. Mortgage Rate Change, 3yr 1.3 1.8 0.3 1.0 2.0 958
Note: Expected rate change computed as
(Expected Average Rate in T years) − (Current Average Rate Estimate)
For more information on “Current Average Rate Estimate”, see previous slide.
Federal Reserve Bank of New York Andreas Fuster & Andrew Haughwout with Nima Dahir & Mike NeubauerSCE Housing Survey – 2018 32 / 99March 2018 32/99

Uncertainty about Future Mortgage Rates, 1yrWhat do you think is the percent chance that one year from todayaverage interest rate on a 30-year fixed-rate mortgage will be
< X%, where X = (Current Ave. Rate Estimate) − 1%.Between X% and V %, where V = (Current Ave. Rate Estimate).Between V % and Y %, whereY = (Current Ave. Rate Estimate) + 2%.> Y % .
PercentileMean Std. Dev. 25% 50% 75% N
Lower by at least 1 percentage point 7.3 13.3 0.0 0.0 10.0 959Between -1 and 0 percentage points 37.3 27.3 19.0 35.0 50.0 959
Between 0 and +2 percentage points 44.8 28.3 25.0 45.0 60.0 959Higher by 2 percentage points or more 10.6 16.0 0.0 5.0 15.0 959
Note: Values are in percent (100 = 100%). See previous slides for Current Ave. RateEstimate and Expected Ave. Rate in T Years
Federal Reserve Bank of New York Andreas Fuster & Andrew Haughwout with Nima Dahir & Mike NeubauerSCE Housing Survey – 2018 33 / 99March 2018 33/99

Rate Type RecommendationIf a friend of yours sought your advice about taking out a fixed-ratemortgage or an adjustable-rate mortgage today, would you recommenda fixed-rate mortgage or an adjustable-rate mortgage?
(An adjustable-rate mortgage is one where the interest rate of themortgage can change over the life of the loan, depending on marketinterest rates.)
PercentDefinitely Fixed Rate 63.2
Likely Fixed Rate 21.2Make No Recommendation 14.9
Likely Adjustable 0.7Definitely Adjustable 0.1
N 1145
Federal Reserve Bank of New York Andreas Fuster & Andrew Haughwout with Nima Dahir & Mike NeubauerSCE Housing Survey – 2018 34 / 99March 2018 34/99

Credit ConditionsCurrent Credit Conditions: Compared to 12 months ago, do youthink it is generally harder or easier these days for people to obtain amortgage?
Expected Credit Conditions: Looking ahead, do you think that 12months (and 3 years) from now it will generally be harder or easier forpeople to obtain a mortgage than it is currently?
1yr ago 1yr hence 3yrs hencePct Pct Pct
Much Harder 5.0 4.0 5.1Somewhat Harder 23.4 27.0 31.5Equally Easy/Hard 53.2 51.5 42.2Somewhat Easier 17.2 16.1 19.4Much Easier 1.2 1.4 1.8N 1145 1145 1145
Federal Reserve Bank of New York Andreas Fuster & Andrew Haughwout with Nima Dahir & Mike NeubauerSCE Housing Survey – 2018 35 / 99March 2018 35/99

Expected Economic Conditions
Do you think that 12 months from now (and 3 years from now)economic conditions in your town/city will be better or worse than theyare currently?
12 Months from Now 3yrs From NowPct Pct
Much worse 1.2 2.4Somewhat worse 17.3 22.3Unchanged 37.7 22.6Somewhat better 39.7 46.3Much better 4.0 6.4N 1145 1145
Federal Reserve Bank of New York Andreas Fuster & Andrew Haughwout with Nima Dahir & Mike NeubauerSCE Housing Survey – 2018 36 / 99March 2018 36/99

Perceived Underwater Status, Own Zip
Please indicate your best guess as to what percentage of all homeownerswith a mortgage in your zip code owe more on their home than what itis worth now?
Summary PercentileMean 25.6 25% 10.0
Std. Dev. 21.8 50% 20.075% 40.0
N 1144
Note: Values in percent (100 = 100%)
Federal Reserve Bank of New York Andreas Fuster & Andrew Haughwout with Nima Dahir & Mike NeubauerSCE Housing Survey – 2018 37 / 99March 2018 37/99

Foreclosure History
Have you ever entered foreclosure on a home you owned (or currentlyown)?
PercentNo 92.5Yes 7.5
N 817
Note: Question asked to current owners and renters who indicate that they have previouslyowned a home.
Federal Reserve Bank of New York Andreas Fuster & Andrew Haughwout with Nima Dahir & Mike NeubauerSCE Housing Survey – 2018 38 / 99March 2018 38/99

Reasons for ForeclosureWhich of the following were factors in your home being foreclosed?
PctHealth issues/medical bills 10.4A disability 1.6Job loss/unemployment 46.8Reduction in income 41.2Death of a spouse 2.4Separation or divorce 20.8Increase in monthly mortgage payment due 27.6Decline in home value 28.1Other 20.1N 62
Note: Respondents could select multiple reasons.
Question only asked to those respondents who have entered foreclosure on a home they ownor have owned.
Federal Reserve Bank of New York Andreas Fuster & Andrew Haughwout with Nima Dahir & Mike NeubauerSCE Housing Survey – 2018 39 / 99March 2018 39/99

Short Sale History
Have you ever sold a home you owned in a short sale?
A short sale is where the seller of a home arranges with their mortgagelender to accept a price that’s less than the amount they owe on theproperty. As part of this arrangement, the lender typically agrees toforgive the rest of the loan.
PercentNo 96.5Yes 3.5
N 818
Federal Reserve Bank of New York Andreas Fuster & Andrew Haughwout with Nima Dahir & Mike NeubauerSCE Housing Survey – 2018 40 / 99March 2018 40/99

Reasons for Short SaleWhich of the following were factors in your home being short sold?
PctHealth issues/medical bills 13.4A disability 15.6Job loss/unemployment 38.6Reduction in income 29.1Death of a spouse 0.0Separation or divorce 16.1Increase in monthly mortgage payment due 3.4Decline in home value 36.1Other 34.2N 25
Respondents could select multiple reasons.
Note: Question only asked to those respondents who have sold a home they owned in shortsale.
Federal Reserve Bank of New York Andreas Fuster & Andrew Haughwout with Nima Dahir & Mike NeubauerSCE Housing Survey – 2018 41 / 99March 2018 41/99

Homeowner Section
Federal Reserve Bank of New York Andreas Fuster & Andrew Haughwout with Nima Dahir & Mike NeubauerSCE Housing Survey – 2018 42 / 99March 2018 42/99

Purchase Year
What year did you buy your current primary residence?
Summary PercentileMean 2002 25% 1997
Std. Dev. 14 50% 200575% 2013
N 854
Federal Reserve Bank of New York Andreas Fuster & Andrew Haughwout with Nima Dahir & Mike NeubauerSCE Housing Survey – 2018 43 / 99March 2018 43/99

Expected Tenure in Residence
When you moved to your primary residence, how long did you expect tostay in this home?
Percent< 2yrs 0.42-3 yrs 2.14-5 yrs 6.26-7 yrs 3.6
8-10 yrs 6.4> 10 yrs 44.2
No specific time frame 37.2N 855
Federal Reserve Bank of New York Andreas Fuster & Andrew Haughwout with Nima Dahir & Mike NeubauerSCE Housing Survey – 2018 44 / 99March 2018 44/99

Expected Future Tenure in Residence
How many more years do you expect to stay in this home as of today?
Percent< 2yrs 8.52-3 yrs 8.94-5 yrs 11.26-7 yrs 6.3
8-10 yrs 10.8> 10 yrs 54.3
N 855
Federal Reserve Bank of New York Andreas Fuster & Andrew Haughwout with Nima Dahir & Mike NeubauerSCE Housing Survey – 2018 45 / 99March 2018 45/99

Purchase Price
What did you pay for this home?
Summary PercentileMean 179738.7 25% 69000.0
Std. Dev. 152175.2 50% 140000.075% 250000.0
N 840
Federal Reserve Bank of New York Andreas Fuster & Andrew Haughwout with Nima Dahir & Mike NeubauerSCE Housing Survey – 2018 46 / 99March 2018 46/99

Down PaymentHow much was your down payment?
PercentileMean Std. Dev. 25% 50% 75% N
Down Payment Amount 31629 47431 3000 10000 40000 707
As a fraction of the purchase price:
PercentileMean Std. Dev. 25% 50% 75% N
Down Payment Fraction 0.14 0.15 0.03 0.10 0.20 708
Note: 151 respondents (10.15% of homeowners) selected “I/we did not take out amortgage.” Down payment fraction constructed using Down Payment amount andPurchase Price (see previous slide):
Down Payment AmountPurchase Price
Federal Reserve Bank of New York Andreas Fuster & Andrew Haughwout with Nima Dahir & Mike NeubauerSCE Housing Survey – 2018 47 / 99March 2018 47/99

Current Home Price Estimate
What do you think your home would sell for today?
Summary PercentileMean 258470.1 25% 120000.0
Std. Dev. 200934.3 50% 205000.075% 335000.0
N 854
Federal Reserve Bank of New York Andreas Fuster & Andrew Haughwout with Nima Dahir & Mike NeubauerSCE Housing Survey – 2018 48 / 99March 2018 48/99

Perceived Annual Change in Home Price Since Purchase
Perceived percent annual home price change since purchase:
Summary PercentileMean 3.5 25% 0.9
Std. Dev. 4.4 50% 2.575% 4.5
N 831
Note: Values are percent change, annualized (100 = 100%). Values constructed usingPurchase Year, Purchase Price, and Current Home Price Estimate:(Current Home Price Estimate
Purchase Price
) 1(2018−Purchase Year)
− 1
Federal Reserve Bank of New York Andreas Fuster & Andrew Haughwout with Nima Dahir & Mike NeubauerSCE Housing Survey – 2018 49 / 99March 2018 49/99

Expected Future Annual Price Changes for Own HomePlease think about the current and future value of your home, under theassumption that you don’t make any investments in your home otherthan regular maintenance/repairs. What do you think your home wouldsell for one year from today and five years from today?
PercentileMean Std. Dev. 25% 50% 75% N
Exp. Future Annual Price Change, 1yr 3.0 3.9 0.0 2.1 4.8 853Exp. Future Annual Price Change, 5yrs 2.1 2.3 0.9 1.8 3.1 853
Note: Values are percent change, annualized (100 = 100%). T Year annual percent changeconstructed as(Exp. Future Own Home Price, T Years From Today
Current Home Price Estimate
)(1/T)− 1
See previous slide for more information on “Current Home Price Estimate.”
Federal Reserve Bank of New York Andreas Fuster & Andrew Haughwout with Nima Dahir & Mike NeubauerSCE Housing Survey – 2018 50 / 99March 2018 50/99

Chance of Selling
What is the percent chance that you will put your primary residence upfor sale in the next 12 months?
Summary PercentileMean 11.6 25% 0.0
Std. Dev. 22.2 50% 2.075% 10.0
N 855
Federal Reserve Bank of New York Andreas Fuster & Andrew Haughwout with Nima Dahir & Mike NeubauerSCE Housing Survey – 2018 51 / 99March 2018 51/99
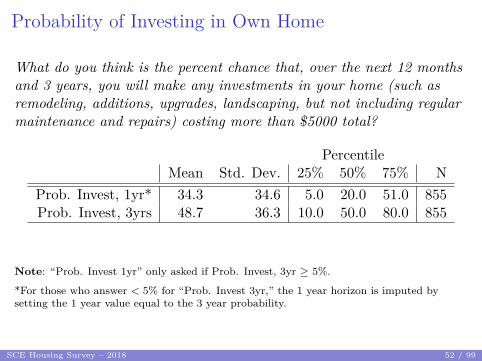
Probability of Investing in Own Home
What do you think is the percent chance that, over the next 12 monthsand 3 years, you will make any investments in your home (such asremodeling, additions, upgrades, landscaping, but not including regularmaintenance and repairs) costing more than $5000 total?
PercentileMean Std. Dev. 25% 50% 75% N
Prob. Invest, 1yr* 34.3 34.6 5.0 20.0 51.0 855Prob. Invest, 3yrs 48.7 36.3 10.0 50.0 80.0 855
Note: “Prob. Invest 1yr” only asked if Prob. Invest, 3yr ≥ 5%.
*For those who answer < 5% for “Prob. Invest 3yr,” the 1 year horizon is imputed bysetting the 1 year value equal to the 3 year probability.
Federal Reserve Bank of New York Andreas Fuster & Andrew Haughwout with Nima Dahir & Mike NeubauerSCE Housing Survey – 2018 52 / 99March 2018 52/99
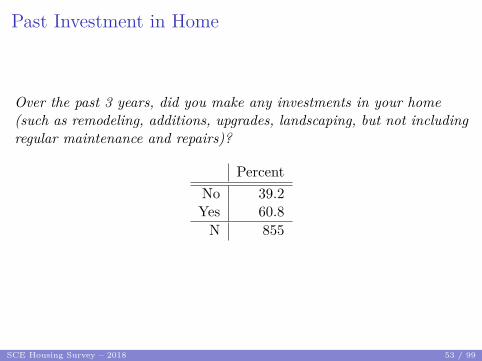
Past Investment in Home
Over the past 3 years, did you make any investments in your home(such as remodeling, additions, upgrades, landscaping, but not includingregular maintenance and repairs)?
PercentNo 39.2Yes 60.8
N 855
Federal Reserve Bank of New York Andreas Fuster & Andrew Haughwout with Nima Dahir & Mike NeubauerSCE Housing Survey – 2018 53 / 99March 2018 53/99

Size of Investment in Home
Approximately how much did you spend on investments in your home(not including regular maintenance and repairs) over the past 3 years?
Summary PercentileMean 16066.5 25% 3800.0
Std. Dev. 20712.6 50% 8000.075% 20000.0
N 538
Note: Question only asked to those who have invested in the past 3 years (see previousslide).
Federal Reserve Bank of New York Andreas Fuster & Andrew Haughwout with Nima Dahir & Mike NeubauerSCE Housing Survey – 2018 54 / 99March 2018 54/99

Outstanding Loans
Do you (or your spouse/partner) have any outstanding loans againstthe value of your home, including all mortgages, home equity loans andhome equity lines of credit?
PercentYes, mortgage(s) only 51.0
Yes, HELOC only 6.1Yes, both mortgage(s) and HELOC 6.4
No 36.5N 854
Note: Question asked to all respondents who own their primary residence.
Federal Reserve Bank of New York Andreas Fuster & Andrew Haughwout with Nima Dahir & Mike NeubauerSCE Housing Survey – 2018 55 / 99March 2018 55/99

Probability of an Additional Loan
What is the percent chance that over the next 12 months, you willapply for an additional loan on your primary residence?
Summary PercentileMean 4.3 25% 0.0
Std. Dev. 11.8 50% 0.075% 2.0
N 854
Note: Question asked to all respondents who own their primary residence, including thosewho currently have no outstanding loans against their home.
Federal Reserve Bank of New York Andreas Fuster & Andrew Haughwout with Nima Dahir & Mike NeubauerSCE Housing Survey – 2018 56 / 99March 2018 56/99
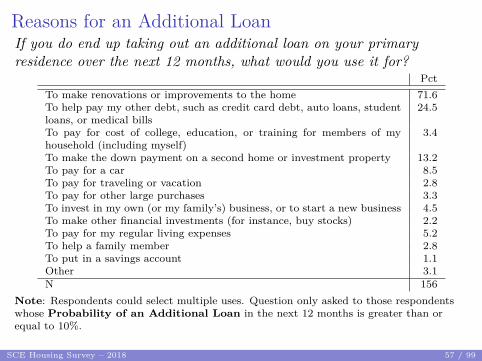
Reasons for an Additional LoanIf you do end up taking out an additional loan on your primaryresidence over the next 12 months, what would you use it for?
PctTo make renovations or improvements to the home 71.6To help pay my other debt, such as credit card debt, auto loans, studentloans, or medical bills
24.5
To pay for cost of college, education, or training for members of myhousehold (including myself)
3.4
To make the down payment on a second home or investment property 13.2To pay for a car 8.5To pay for traveling or vacation 2.8To pay for other large purchases 3.3To invest in my own (or my family’s) business, or to start a new business 4.5To make other financial investments (for instance, buy stocks) 2.2To pay for my regular living expenses 5.2To help a family member 2.8To put in a savings account 1.1Other 3.1N 156
Note: Respondents could select multiple uses. Question only asked to those respondentswhose Probability of an Additional Loan in the next 12 months is greater than orequal to 10%.
Federal Reserve Bank of New York Andreas Fuster & Andrew Haughwout with Nima Dahir & Mike NeubauerSCE Housing Survey – 2018 57 / 99March 2018 57/99

Questions for Homeowners with Debt
Federal Reserve Bank of New York Andreas Fuster & Andrew Haughwout with Nima Dahir & Mike NeubauerSCE Housing Survey – 2018 58 / 99March 2018 58/99

Total Outstanding Home Loan Balances
Approximately, what is the total amount of outstanding loans againstyour primary residence as of today, including all mortgages and homeequity loans?
Summary PercentileMean 148059.8 25% 58000.0
Std. Dev. 121014.9 50% 121000.075% 200000.0
N 557
Note: Question only asked to those homeowners who have outstanding loans (seeprevious slide).
Federal Reserve Bank of New York Andreas Fuster & Andrew Haughwout with Nima Dahir & Mike NeubauerSCE Housing Survey – 2018 59 / 99March 2018 59/99

Perceived Equity in HomeLoan to Value (LTV):
Summary PercentileMean 55.0 25% 38.1
Std. Dev. 25.9 50% 57.175% 75.6
N 554
Note: Values are in percentages (100 = 100%). Constructed using Total OutstandingHome Loan Balances and Current Home Price Estimate:
LTV = 100 ×( Outstanding Loan Balances
Current Home Price Estimate
)A total of 12.0 respondents indicate that they have negative equity (that is, LTV>100).
The table above excludes the 296.0 respondents who own their home but indicate that theyhave no outstanding home loans.
Federal Reserve Bank of New York Andreas Fuster & Andrew Haughwout with Nima Dahir & Mike NeubauerSCE Housing Survey – 2018 60 / 99March 2018 60/99
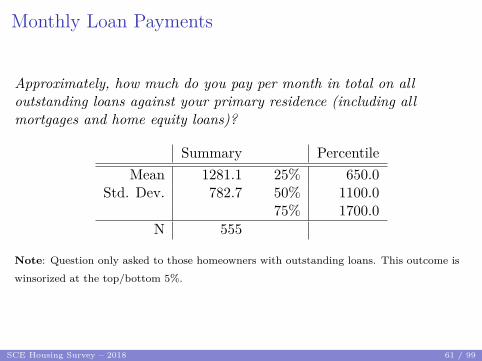
Monthly Loan Payments
Approximately, how much do you pay per month in total on alloutstanding loans against your primary residence (including allmortgages and home equity loans)?
Summary PercentileMean 1281.1 25% 650.0
Std. Dev. 782.7 50% 1100.075% 1700.0
N 555
Note: Question only asked to those homeowners with outstanding loans. This outcome iswinsorized at the top/bottom 5%.
Federal Reserve Bank of New York Andreas Fuster & Andrew Haughwout with Nima Dahir & Mike NeubauerSCE Housing Survey – 2018 61 / 99March 2018 61/99

Loan Payments as a Fraction of Household IncomeAnnual loan payments as a percent of annual household income:
Summary PercentileMean 19.2 25% 10.8
Std. Dev. 12.8 50% 15.175% 24.0
N 553
Note: Question only asked to those homeowners with outstanding loans. Values in percent(100 = 100%), constructed using Monthly Loan Payments and annual HouseholdIncome
100 ×12 × Monthly Loan Payments
Household IncomeTo get a continuous measure of household income, we take the midpoint of householdincome intervals (see previous question). For the highest interval, we set the continuousmeasure equal to the lower bound.
This outcome is winsorized at the top/bottom 5%.
Federal Reserve Bank of New York Andreas Fuster & Andrew Haughwout with Nima Dahir & Mike NeubauerSCE Housing Survey – 2018 62 / 99March 2018 62/99

History of Missed Payments
During the past 12 months, did you miss two or more payments on anyoutstanding loans against your primary residence (including allmortgages and home equity loans)?
PercentNo 97.7Yes 2.3
N 558
Note: Question only asked to those homeowners with outstanding loans.
Federal Reserve Bank of New York Andreas Fuster & Andrew Haughwout with Nima Dahir & Mike NeubauerSCE Housing Survey – 2018 63 / 99March 2018 63/99

Reasons for Missing PaymentsWhich of the following are reasons you missed two or more paymentson loans against your home?
PctHealth issues or medical bills 13.5A disability 5.5Job loss or unemployment 27.0Reduction in income 62.0Death of a spouse 0.0Separation or divorce 30.8Increase in monthly mortgage payment due 14.3Decline in home value 0.0Accidentally forgot to pay 4.8To get lender to modify loan 3.0Other 26.2N 13
Note: Respondents could select multiple reasons.Federal Reserve Bank of New York Andreas Fuster & Andrew Haughwout with Nima Dahir & Mike NeubauerSCE Housing Survey – 2018 64 / 99
March 2018 64/99
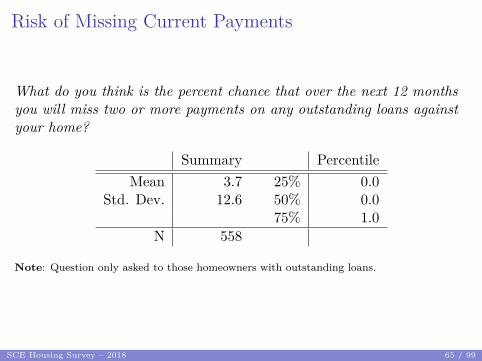
Risk of Missing Current Payments
What do you think is the percent chance that over the next 12 monthsyou will miss two or more payments on any outstanding loans againstyour home?
Summary PercentileMean 3.7 25% 0.0
Std. Dev. 12.6 50% 0.075% 1.0
N 558
Note: Question only asked to those homeowners with outstanding loans.
Federal Reserve Bank of New York Andreas Fuster & Andrew Haughwout with Nima Dahir & Mike NeubauerSCE Housing Survey – 2018 65 / 99March 2018 65/99
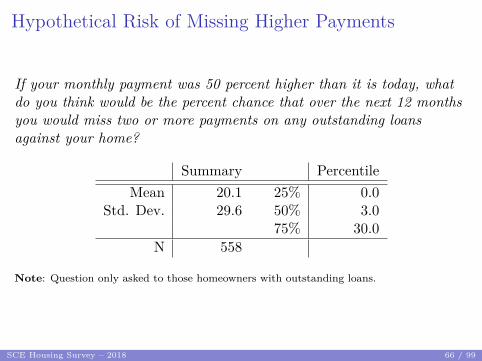
Hypothetical Risk of Missing Higher Payments
If your monthly payment was 50 percent higher than it is today, whatdo you think would be the percent chance that over the next 12 monthsyou would miss two or more payments on any outstanding loansagainst your home?
Summary PercentileMean 20.1 25% 0.0
Std. Dev. 29.6 50% 3.075% 30.0
N 558
Note: Question only asked to those homeowners with outstanding loans.
Federal Reserve Bank of New York Andreas Fuster & Andrew Haughwout with Nima Dahir & Mike NeubauerSCE Housing Survey – 2018 66 / 99March 2018 66/99

Consideration of Stopping Payments
You mentioned that the total amount of outstanding loans against yourprimary residence as of today is $X (from previous question), whileyou think the house would sell for $Y (from previous question).That is, you owe more on the home than you think it could sell for.Over the past 12 months, have you considered no longer making yourmonthly payments on loans against your home?
PercentNo, absolutely not 86.5
Yes, considered but did not stop 5.7Yes, actually did stop 0.0
N 12
Note: Question only asked of those respondents who indicate that they have negativeequity (see previous slide).
Federal Reserve Bank of New York Andreas Fuster & Andrew Haughwout with Nima Dahir & Mike NeubauerSCE Housing Survey – 2018 67 / 99March 2018 67/99

Reasons for Stopping Payments
Why did you not stop making your mortgage payments?
PctI like my home and don’t want to lose it 77.6The lender can come after my other belongings if I stop making payments 16.8House prices will recover and my home will eventually be worth morethan the debt on the home
10.9
Not making payments will negatively affect my credit score 19.1The cost of having to move to a different home is too high if I stop makingpayments
25.2
I think it is morally wrong to stop making payments 15.5Not making payments will negatively affect the community 0.0Other 16.4N 11
Note: Respondents could select multiple reasons. Question only asked if respondent didnot stop making payments (see previous slide).
Federal Reserve Bank of New York Andreas Fuster & Andrew Haughwout with Nima Dahir & Mike NeubauerSCE Housing Survey – 2018 68 / 99March 2018 68/99

Chance of Future Foreclosure
What is the percent chance that over the next 12 months you will faceforeclosure or lose your home through a repossession?
Summary PercentileMean 2.1 25% 0.0
Std. Dev. 7.6 50% 0.075% 1.0
N 558
Note: Question only asked to those respondents with outstanding loans.
Federal Reserve Bank of New York Andreas Fuster & Andrew Haughwout with Nima Dahir & Mike NeubauerSCE Housing Survey – 2018 69 / 99March 2018 69/99

Type of Mortgage Rate
In the next few questions, we will ask you about the mortgage on yourprimary residence. If you have more than one mortgage on yourprimary residence, please consider the one with the largest balancewhen answering these questions.
Is the interest rate of your mortgage adjustable/floating (meaning itcan change over the life of the loan) or fixed?
PercentAdjustable/Floating 7.1
Fixed 92.9N 502
Note: Question only asked to those respondents who currently have a mortgage.
Federal Reserve Bank of New York Andreas Fuster & Andrew Haughwout with Nima Dahir & Mike NeubauerSCE Housing Survey – 2018 70 / 99March 2018 70/99

Current Mortgage Rate
And what is the current interest rate on your mortgage?
Summary PercentileMean 4.2 25% 3.5
Std. Dev. 1.1 50% 3.975% 4.5
N 510
Note: Values in percent (100 = 100%). Question only asked to those respondents whocurrently have a mortgage.
Federal Reserve Bank of New York Andreas Fuster & Andrew Haughwout with Nima Dahir & Mike NeubauerSCE Housing Survey – 2018 71 / 99March 2018 71/99
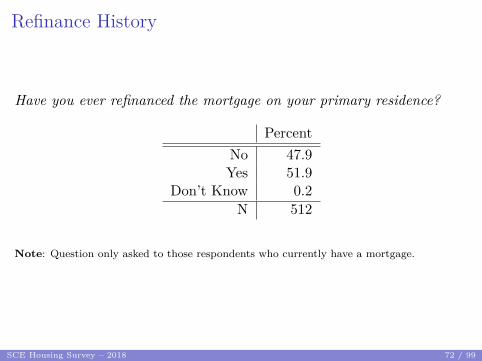
Refinance History
Have you ever refinanced the mortgage on your primary residence?
PercentNo 47.9Yes 51.9
Don’t Know 0.2N 512
Note: Question only asked to those respondents who currently have a mortgage.
Federal Reserve Bank of New York Andreas Fuster & Andrew Haughwout with Nima Dahir & Mike NeubauerSCE Housing Survey – 2018 72 / 99March 2018 72/99
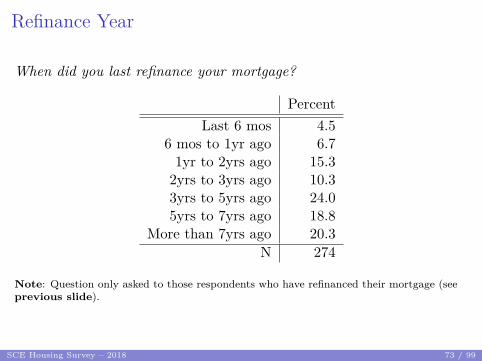
Refinance Year
When did you last refinance your mortgage?
PercentLast 6 mos 4.5
6 mos to 1yr ago 6.71yr to 2yrs ago 15.3
2yrs to 3yrs ago 10.33yrs to 5yrs ago 24.05yrs to 7yrs ago 18.8
More than 7yrs ago 20.3N 274
Note: Question only asked to those respondents who have refinanced their mortgage (seeprevious slide).
Federal Reserve Bank of New York Andreas Fuster & Andrew Haughwout with Nima Dahir & Mike NeubauerSCE Housing Survey – 2018 73 / 99March 2018 73/99
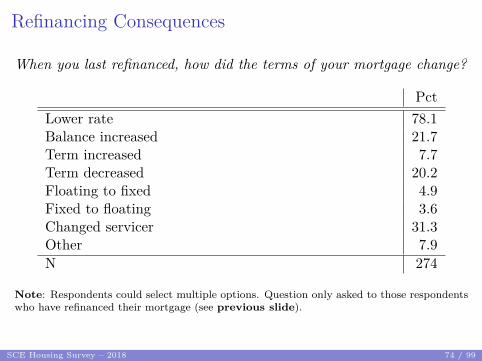
Refinancing Consequences
When you last refinanced, how did the terms of your mortgage change?
PctLower rate 78.1Balance increased 21.7Term increased 7.7Term decreased 20.2Floating to fixed 4.9Fixed to floating 3.6Changed servicer 31.3Other 7.9N 274
Note: Respondents could select multiple options. Question only asked to those respondentswho have refinanced their mortgage (see previous slide).
Federal Reserve Bank of New York Andreas Fuster & Andrew Haughwout with Nima Dahir & Mike NeubauerSCE Housing Survey – 2018 74 / 99March 2018 74/99

Use for ProceedsYou indicated that you increased the balance on your mortgage whenyou last refinanced. What did you use this money for?
PctUse toward the down payment on some other home 1.1To pay for refinancing fees and other fees 12.2To make renovations or improvements to the home 49.5To help pay my other debt, such as credit card debt, auto loans, studentloans, or medical bills
58.1
To pay for college, education, or training for members of my household(including myself)
2.7
To make the down payment on a second home or investment property 2.7To pay for a car or other large purchases 3.5To pay for traveling or vacation 1.8To invest in my own (or my family’s) business, or to start a new business 1.5To make other financial investments (for instance, buy stocks) 1.0To pay for my regular living expenses 2.7To help a family member 2.0Put it into my savings 4.9Other 7.8N 54
Note: Question only asked to those respondents who increased the balance of theirmortgage (see previous slide).
Federal Reserve Bank of New York Andreas Fuster & Andrew Haughwout with Nima Dahir & Mike NeubauerSCE Housing Survey – 2018 75 / 99March 2018 75/99

Monthly Payment Change Upon RefinanceAs a result of refinancing your mortgage, how did your requiredmonthly payment change?
PercentIncreased 24.9
Unchanged 14.9Decreased 54.7
Don’t Know 5.5N 274
By approximately how much did your monthly payment change?
Summary PercentileMean -83.2 25% -200.0
Std. Dev. 226.0 50% -80.075% 35.0
N 259
Note: Question only asked to those respondents who refinanced their mortgage.The table of monthly payment changes includes those respondents whose monthly paymentdid not change, in which case the change is recorded as $0.
Federal Reserve Bank of New York Andreas Fuster & Andrew Haughwout with Nima Dahir & Mike NeubauerSCE Housing Survey – 2018 76 / 99March 2018 76/99

Use for Savings Upon Refinance
What did you do with the $X (see previous question) you no longer hadto spend on your monthly mortgage payment after the refinancing?
PctPaid down some of the balance of my mortgage 13.2Paid down other debt (e.g. on credit cards, auto loans, student loans, ormedical bills)
36.8
Used it to finance a large purchase (e.g. a car) 2.5Used it to make renovations or improvements to the home 10.0Used it to pay for other expenses 30.4Used it to purchase financial assets (e.g. stocks) 2.2Other 5.8Nothing / put it into my savings 21.4N 160
Note: Question only asked to those respondents whose monthly mortgage paymentdecreased upon refinancing (see previous slide).
Federal Reserve Bank of New York Andreas Fuster & Andrew Haughwout with Nima Dahir & Mike NeubauerSCE Housing Survey – 2018 77 / 99March 2018 77/99
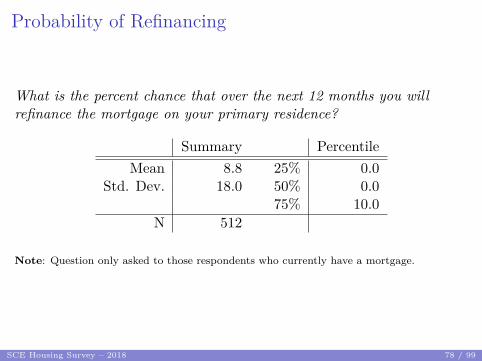
Probability of Refinancing
What is the percent chance that over the next 12 months you willrefinance the mortgage on your primary residence?
Summary PercentileMean 8.8 25% 0.0
Std. Dev. 18.0 50% 0.075% 10.0
N 512
Note: Question only asked to those respondents who currently have a mortgage.
Federal Reserve Bank of New York Andreas Fuster & Andrew Haughwout with Nima Dahir & Mike NeubauerSCE Housing Survey – 2018 78 / 99March 2018 78/99

Reasons for RefinancingIf you do end up refinancing over the next 12 months, what would beyour reasons for doing so?
PctLower the interest rate on my mortgage, and thus my monthly payment 78.8Increase the balance on my mortgage (cash out some of the equity in myhome)
9.2
Pay off part of the balance on my mortgage 15.3Reduce the term of my mortgage (for instance, change from a 30-year toa 15-year mortgage)
30.7
Increase the term of my mortgage (for instance, change from a 15-yearto a 30-year mortgage)
2.0
Change from an adjustable/floating rate mortgage to a fixed-rate mort-gage
3.1
Change from a fixed-rate mortgage to an adjustable/floating rate mort-gage
0.0
Change my mortgage servicer 11.1Combine multiple liens into a single mortgage 5.5Consolidate non-mortgage debt 9.9Other 7.5N 149
Note: Question only asked to those respondents whose Probability of Refinancing inthe next 12 months is greater than 10%.
Federal Reserve Bank of New York Andreas Fuster & Andrew Haughwout with Nima Dahir & Mike NeubauerSCE Housing Survey – 2018 79 / 99March 2018 79/99
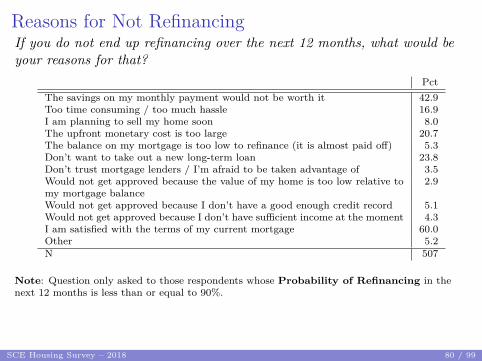
Reasons for Not RefinancingIf you do not end up refinancing over the next 12 months, what would beyour reasons for that?
PctThe savings on my monthly payment would not be worth it 42.9Too time consuming / too much hassle 16.9I am planning to sell my home soon 8.0The upfront monetary cost is too large 20.7The balance on my mortgage is too low to refinance (it is almost paid off) 5.3Don’t want to take out a new long-term loan 23.8Don’t trust mortgage lenders / I’m afraid to be taken advantage of 3.5Would not get approved because the value of my home is too low relative tomy mortgage balance
2.9
Would not get approved because I don’t have a good enough credit record 5.1Would not get approved because I don’t have sufficient income at the moment 4.3I am satisfied with the terms of my current mortgage 60.0Other 5.2N 507
Note: Question only asked to those respondents whose Probability of Refinancing in thenext 12 months is less than or equal to 90%.
Federal Reserve Bank of New York Andreas Fuster & Andrew Haughwout with Nima Dahir & Mike NeubauerSCE Housing Survey – 2018 80 / 99March 2018 80/99

HELOC Balances
Approximately, how much of the total amount of outstanding loansagainst your primary residence is in the form of home equityloans/lines of credit?
Summary PercentileMean 46478.3 25% 10000.0
Std. Dev. 78129.3 50% 24000.075% 43000.0
N 108
Federal Reserve Bank of New York Andreas Fuster & Andrew Haughwout with Nima Dahir & Mike NeubauerSCE Housing Survey – 2018 81 / 99March 2018 81/99

HELOC UsesYou indicated that you have home equity loans/lines of credit on yourhome. What did you use these for?
PctUse toward the down payment on the home 3.8To make renovations or improvements to the home 56.2To help pay my other debt, such as credit card debt, auto loans, studentloans, or medical bills
36.5
To pay for college, education, or training for members of my household(includng myself)
5.5
To make the down payment on a second home or investment property 4.3To pay for a car or other large purchase(s) 15.1To pay for traveling or vacation 2.7To invest in my own (or my family’s) business, or to start a new business 3.7To make other financial investments (for instance, buy stocks) 1.5To pay for my regular living expenses 7.0To help a family member 7.2Other 11.0Have not used it, or put into my savings 3.7N 109
Federal Reserve Bank of New York Andreas Fuster & Andrew Haughwout with Nima Dahir & Mike NeubauerSCE Housing Survey – 2018 82 / 99March 2018 82/99
Renter Questions
Federal Reserve Bank of New York Andreas Fuster & Andrew Haughwout with Nima Dahir & Mike NeubauerSCE Housing Survey – 2018 83 / 99March 2018 83/99

Beginning of Lease
In what year did you start renting your current primary residence?
Summary PercentileMean 2012 25% 2010
Std. Dev. 6 50% 201575% 2017
N 289
Federal Reserve Bank of New York Andreas Fuster & Andrew Haughwout with Nima Dahir & Mike NeubauerSCE Housing Survey – 2018 84 / 99March 2018 84/99

Expected Tenure in Residence
When you moved to your primary residence, how long did you expect tostay in this home?
Percent< 1yr 4.3
1-2 yrs 20.32-3 yrs 15.44-5 yrs 11.66-7 yrs 4.1
8-10 yrs 2.6> 10 yrs 7.6
No specific time frame 34.1N 290
Federal Reserve Bank of New York Andreas Fuster & Andrew Haughwout with Nima Dahir & Mike NeubauerSCE Housing Survey – 2018 85 / 99March 2018 85/99

Current Monthly Rent
How much is the total monthly rent for your home (regardless ofwhether you pay the whole amount yourself or you split it with others)?
Summary PercentileMean 1037.0 25% 600.0
Std. Dev. 639.6 50% 835.075% 1260.0
N 289
Note: This outcome is winsorized at the top/bottom 5%.
Federal Reserve Bank of New York Andreas Fuster & Andrew Haughwout with Nima Dahir & Mike NeubauerSCE Housing Survey – 2018 86 / 99March 2018 86/99

Annual Rent as a Fraction of Household IncomeAnnual monthly rent payments as a percent of annual householdincome:
Summary PercentileMean 43.6 25% 19.6
Std. Dev. 35.0 50% 27.675% 55.2
N 287
Note: Values in percent (100 = 100%), constructed using Current Monthly Rent* andannual Household Income
100 ×12 × Current Monthly Rent
Household IncomeTo get a continuous measure of household income, we take the midpoint of householdincome intervals. For the highest interval, we set the continuous measure equal to thelower bound.
This outcome is winsorized at the top/bottom 5%.
*Ratio likely biased upwards as “Current Monthly Rent” (see previous slide) correspondsto the total rent for the unit, regardless of whether payments are split with roommates orother non-family members living in the unit.Federal Reserve Bank of New York Andreas Fuster & Andrew Haughwout with Nima Dahir & Mike NeubauerSCE Housing Survey – 2018 87 / 99
March 2018 87/99

Monthly Rent at Move-In
How much was your monthly rent when you first moved to this home?
Summary PercentileMean 1073.9 25% 625.0
Std. Dev. 819.6 50% 800.075% 1200.0
N 123
Note: This outcome is winsorized at the top/bottom 5%.
Federal Reserve Bank of New York Andreas Fuster & Andrew Haughwout with Nima Dahir & Mike NeubauerSCE Housing Survey – 2018 88 / 99March 2018 88/99

Change in Rent Since Move-InEstimated annualized rent increases for primary residence sincemove-in:
Summary PercentileMean 1.6 25% 0.0
Std. Dev. 1.6 50% 1.375% 2.4
N 120
Note: Values are percent change, annualized (100 = 100%). Values constructed usingCurrent Monthly Rent, Monthly Rent at Move-In, and Beginning of Lease:( Current Monthly Rent
Monthly Rent at Move-In
) 12018−Beginning of Lease
− 1
This outcome is winsorized at the top/bottom 5%.
Federal Reserve Bank of New York Andreas Fuster & Andrew Haughwout with Nima Dahir & Mike NeubauerSCE Housing Survey – 2018 89 / 99March 2018 89/99

Expected Future Rent Change
What do you think the rent for the home you are currently in will beone year and five years from today?
PercentileMean Std. Dev. 25% 50% 75% N
Exp. Annual Rent Change, 1yr 6.0 11.0 0.0 2.3 7.0 284Exp. Annual Rent Change, 5yrs 3.7 5.3 1.0 2.4 5.5 284
Note: Values are percent change, annualized (100 = 100%). T Year annual percent changeconstructed with Current Monthly Rent as follows:(Exp. Future Monthly Rent, T Years From Today
Current Monthly Rent
)(1/T)− 1
Federal Reserve Bank of New York Andreas Fuster & Andrew Haughwout with Nima Dahir & Mike NeubauerSCE Housing Survey – 2018 90 / 99March 2018 90/99
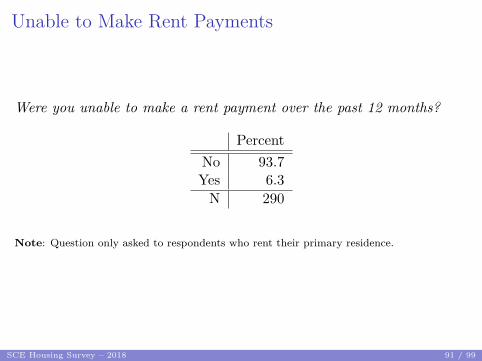
Unable to Make Rent Payments
Were you unable to make a rent payment over the past 12 months?
PercentNo 93.7Yes 6.3
N 290
Note: Question only asked to respondents who rent their primary residence.
Federal Reserve Bank of New York Andreas Fuster & Andrew Haughwout with Nima Dahir & Mike NeubauerSCE Housing Survey – 2018 91 / 99March 2018 91/99

Reasons for Missed PaymentsWhich of the following are reasons you were unable to make a rentpayment?
PctHealth issues/medical bills 62.2A disability 11.7Job loss/unemployment 31.7Reduction in income 27.6Death of a spouse 0.0Separation or divorce 8.2Increase in rent 13.9Accidentally forgot to pay 3.1Other 4.1N 14
Note: Question only asked to those respondents who have missed a rent payment (seeprevious slide).
Federal Reserve Bank of New York Andreas Fuster & Andrew Haughwout with Nima Dahir & Mike NeubauerSCE Housing Survey – 2018 92 / 99March 2018 92/99

Chance of Missing Payments
What do you think is the percent chance that over the next 12 monthsyou will be unable to make a rent payment?
Summary PercentileMean 11.6 25% 0.0
Std. Dev. 21.5 50% 2.075% 10.0
N 289
Note: Question only asked to respondents who rent their primary residence.
Federal Reserve Bank of New York Andreas Fuster & Andrew Haughwout with Nima Dahir & Mike NeubauerSCE Housing Survey – 2018 93 / 99March 2018 93/99

Ease of Obtaining Financing
If you wanted to buy a home today, do you think it would be easy ordifficult for you to obtain a home mortgage?
PercentVery easy 4.6
Somewhat easy 12.3Neither 15.2
Somewhat difficult 32.2Very difficult 35.7
N 290
Note: Question only asked to respondents who rent their primary residence.
Federal Reserve Bank of New York Andreas Fuster & Andrew Haughwout with Nima Dahir & Mike NeubauerSCE Housing Survey – 2018 94 / 99March 2018 94/99

Home Ownership Among Renters
Have you ever owned a home?
PercentNo 64.5Yes 35.5
N 290
If yes, do you still own that home?
PercentNo 95.4Yes 4.6
N 109
Federal Reserve Bank of New York Andreas Fuster & Andrew Haughwout with Nima Dahir & Mike NeubauerSCE Housing Survey – 2018 95 / 99March 2018 95/99
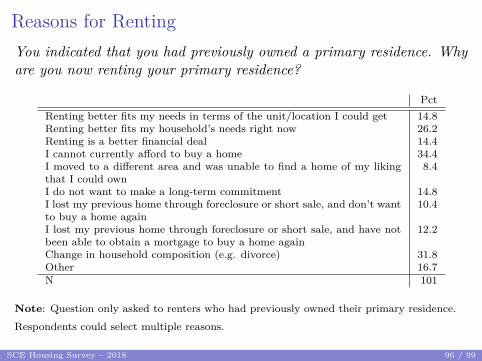
Reasons for RentingYou indicated that you had previously owned a primary residence. Whyare you now renting your primary residence?
PctRenting better fits my needs in terms of the unit/location I could get 14.8Renting better fits my household’s needs right now 26.2Renting is a better financial deal 14.4I cannot currently afford to buy a home 34.4I moved to a different area and was unable to find a home of my likingthat I could own
8.4
I do not want to make a long-term commitment 14.8I lost my previous home through foreclosure or short sale, and don’t wantto buy a home again
10.4
I lost my previous home through foreclosure or short sale, and have notbeen able to obtain a mortgage to buy a home again
12.2
Change in household composition (e.g. divorce) 31.8Other 16.7N 101
Note: Question only asked to renters who had previously owned their primary residence.Respondents could select multiple reasons.
Federal Reserve Bank of New York Andreas Fuster & Andrew Haughwout with Nima Dahir & Mike NeubauerSCE Housing Survey – 2018 96 / 99March 2018 96/99

Preferences for Owning Over Renting
Assuming you had the financial resources to do so, would you like toown instead of rent your primary residence?
(By primary residence, we mean the place where you usually live.)
PercentStrongly prefer owning 42.2
Prefer owning 24.4Indifferent renting/owning 13.4
Prefer renting 13.4Strongly prefer renting 6.7
N 290
Federal Reserve Bank of New York Andreas Fuster & Andrew Haughwout with Nima Dahir & Mike NeubauerSCE Housing Survey – 2018 97 / 99March 2018 97/99

Chance of Owning in the Future
What do you think is the percent chance that you will own a primaryresidence at some point in the future?
Summary PercentileMean 49.0 25% 10.0
Std. Dev. 37.9 50% 50.075% 87.0
N 290
Federal Reserve Bank of New York Andreas Fuster & Andrew Haughwout with Nima Dahir & Mike NeubauerSCE Housing Survey – 2018 98 / 99March 2018 98/99
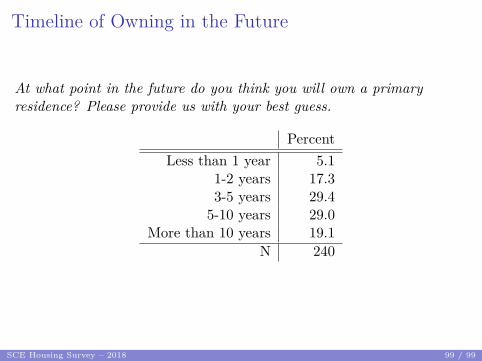
Timeline of Owning in the Future
At what point in the future do you think you will own a primaryresidence? Please provide us with your best guess.
PercentLess than 1 year 5.1
1-2 years 17.33-5 years 29.4
5-10 years 29.0More than 10 years 19.1
N 240
Federal Reserve Bank of New York Andreas Fuster & Andrew Haughwout with Nima Dahir & Mike NeubauerSCE Housing Survey – 2018 99 / 99March 2018 99/99